Article

Moving Bed Biofilm Reactor Performance on Saline Produced Water (Upstream Oil & Gas) at Very Low Hydraulic Retention Time

by
Matthieu Jacob
,
Bertrand Segues
,
Marie-Claire Lot
,
El hadji Ibrahima Ndiaye
*,
Cecilia Sambusiti
,
Patrick Baldoni-Andrey
and
Frédéric Perie
TotalEnergies, PERL–Pôle d’Etudes et de Recherche de Lacq, Pôle Economique 2, BP 47–RD 817, 64170 Lacq, France
*
Author to whom correspondence should be addressed.
Waste 2023, 1(1), 295-312; https://doi.org/10.3390/waste1010020
Submission received: 10 October 2022 / Revised: 2 December 2022 / Accepted: 12 December 2022 / Published: 10 February 2023

Abstract

:
This paper presents the results obtained on an oil and gas field terminal in Gabon during a continuous 8-month long operation involving the move of a pre-industrial bed biofilm bioreactor pilot for treating highly saline produced water (100 g/L). After several months of efficient acclimation of the biofilm carriers, more than 90% of the biological oxygen demand, 50% of total organic carbon and 35% of the chemical oxygen demand were removed during 1 h of residence time at a maximum organic loading rate of 12 kgCOD.m−3.day−1, making it a highly promising solution for offshore produced water treatment. These values reached more than 95%, 80% and 60% of BOD, TOC and COD removal, respectively, for 12 h residence time. In addition to the significant removal efficiency of the pilot, it is also important to highlight the robustness of the process. The presence of an acclimated biofilm properly attached to the carriers strongly reduced biomass washing during anomalous phases in comparison to a conventional activated sludge configuration. This technology favorably follows the three key pillars for implementing offshore technologies: high removal performance, robustness and low footprint.

1. Introduction

When crude oil is extracted from reservoirs, water is co-produced. This water is called produced water (PW) and has two main origins: (i) formation water that was naturally in equilibrium with oil, gas and rock inside the reservoir before extraction, and (ii) injected water, which is often seawater or reinjected produced water, required for sweeping oil and maintaining the pressure high enough for oil production. The PW flowrate increases during the production until it is no longer economical to operate the field [1,2]. Globally, it corresponds today to a ratio of 5 volumes of PW per volume of oil [3], which is equivalent to 435 million barrels of water per day (70 Mm3.day−1). When feasible, PW is reinjected into the oil production reservoir. It is considered as the most environmentally friendly solution since it reduces the need for new water, thereby decreasing freshwater or seawater consumption and limiting environmental impact (no potential contamination of surface water). Unfortunately, this is not always possible due to injectivity issues. Consequently, the two main PW management challenges are to develop PW treatment solutions that make it possible to: (i) reinject the PW or (ii) discharge it into surface water bodies in compliance with current regulations and in anticipation of more stringent regulations [4,5]. This paper focuses on the second challenge—discharging produced water without harming the environment.
There are many different PW receiving environments: rivers, lakes, estuaries, coastal waters, lagoons, offshore open sea, etc. Onshore discharge regulations are usually highly protective and therefore constraining for operators. They are regulated locally by the country and can therefore vary from one country to another, notably as regards the parameters but also the maximum discharge specifications [6]. For example, the Water Framework Directive 2013/39/EU sets environmental quality standards for 45 priority substances (including 21 substances to be banned). The case is different for offshore discharges that are governed most of the time by regional sea conventions such as OSPAR (to be ratified by the relevant countries). Up until the last few years, only dispersed hydrocarbons were targeted, with discharge specifications ranging from 15 up to 40 mg/L [7]. PW also contains heavy metals, aromatic hydrocarbons, alkylphenols, process additives (wax, corrosion and hydrate inhibitors, biocides, demulsifiers, etc.) that are not targeted by current offshore regulations, as described in [8]. This is changing little by little with more constraining regulations concerning these substances, but also with the obligation to take into consideration the total effluent toxicity as recommended by the OSPAR commission (2013) [9]. This proposed risk-based approach is a method for prioritizing mitigation actions on those substances that pose the greatest risk to the environment, including not only naturally occurring substances but also man-made synthetic substances (process additives) and also taking into account the entire effluent assessment (WEA) approach.
Conventional produced water treatments consist of settling tanks, flotation and/or hydrocyclones which in most cases meet the specifications for discharge into the sea [2,10], especially those concerning dispersed hydrocarbons (10–40 mg/L depending on the regions). Removing dissolved compounds from PW is very challenging for the following reasons: (i) PW is often very saline (from several mg/L up to 300 g/L TDS), which interferes with biological oxidation processes, thereby decreasing biomass respiration rates or causing bio-flocs settling issues [11,12,13]; (ii) oil fields are characterized by relatively high PW flowrates and high organic loads making discontinuous processes, such as adsorption, inappropriate; (iii) offshore installations require compact units and therefore need to intensify reactions in order to meet specifications at acceptable costs; and (iv) PW is made of a wide variety of substances (naturally occurring or additives) that require treatment with a very wide-action spectrum.
Baldoni-Andrey et al. (2006) studied the performance of a sequencing batch reactor (SBR) and a trickling filter on a produced water containing more than 200 g/L TDS [14]. They observed that biological degradation was possible. Microorganisms can acclimate in such conditions, but the resulting hydraulic retention time was very high (20 h), making it inappropriate for offshore installations. This is why moving bed biofilm reactors are often preferred over other types of bioreactors. Dong et al. (2011) studied the impact on MBBR of HRT reduction from 36 h to 10, on three different types of biocarriers using low-salinity PW (5 g/L TDS) [15]. They observed that the reduction of HRT decreased the performance of COD removal from 5 to up to 20%, depending on the biocarriers tested. In a long-term test on a real produced water containing 30 g/L of salts and well-acclimatized biocarriers, Pedenaud et al. (2018) observed that more than 60% of the COD was removed after 30 min of residence and then reached 80% after 4 h. Toxicity tests also showed an 85% reduction, making it a highly promising solution for offshore installations. The acclimation of biomass appears to be a key parameter for better performance at low residence time and/or at high saline conditions, which is also highlighted by many authors [1,11,12,16]
In order to qualify this process at low HRT and higher feed salinity, an 8-month test was conducted on an oil terminal in Western Africa using an MBBR pilot unit treating 0.25–4 m−3.h−1 of PW with almost 100 g/L of TDS.

2. Materials and Methods

2.1. Produced Water Characterization

The study took place on an oil terminal located in western Africa. This terminal collects most of the crude oils from the production sites. During its storage before export, water (produced with the crude) accumulates at the bottom of the storage tanks. It is pumped out from the tanks, treated in API separators (American Petroleum Institute standard large rectangular sedimentation separators) and polished through two long residence time buffer basins (a total 6–12 h residence time depending on the feed flowrate) before being discharged into the sea (Atlantic Ocean). The pilot feed water was pumped through one of these buffer basins.

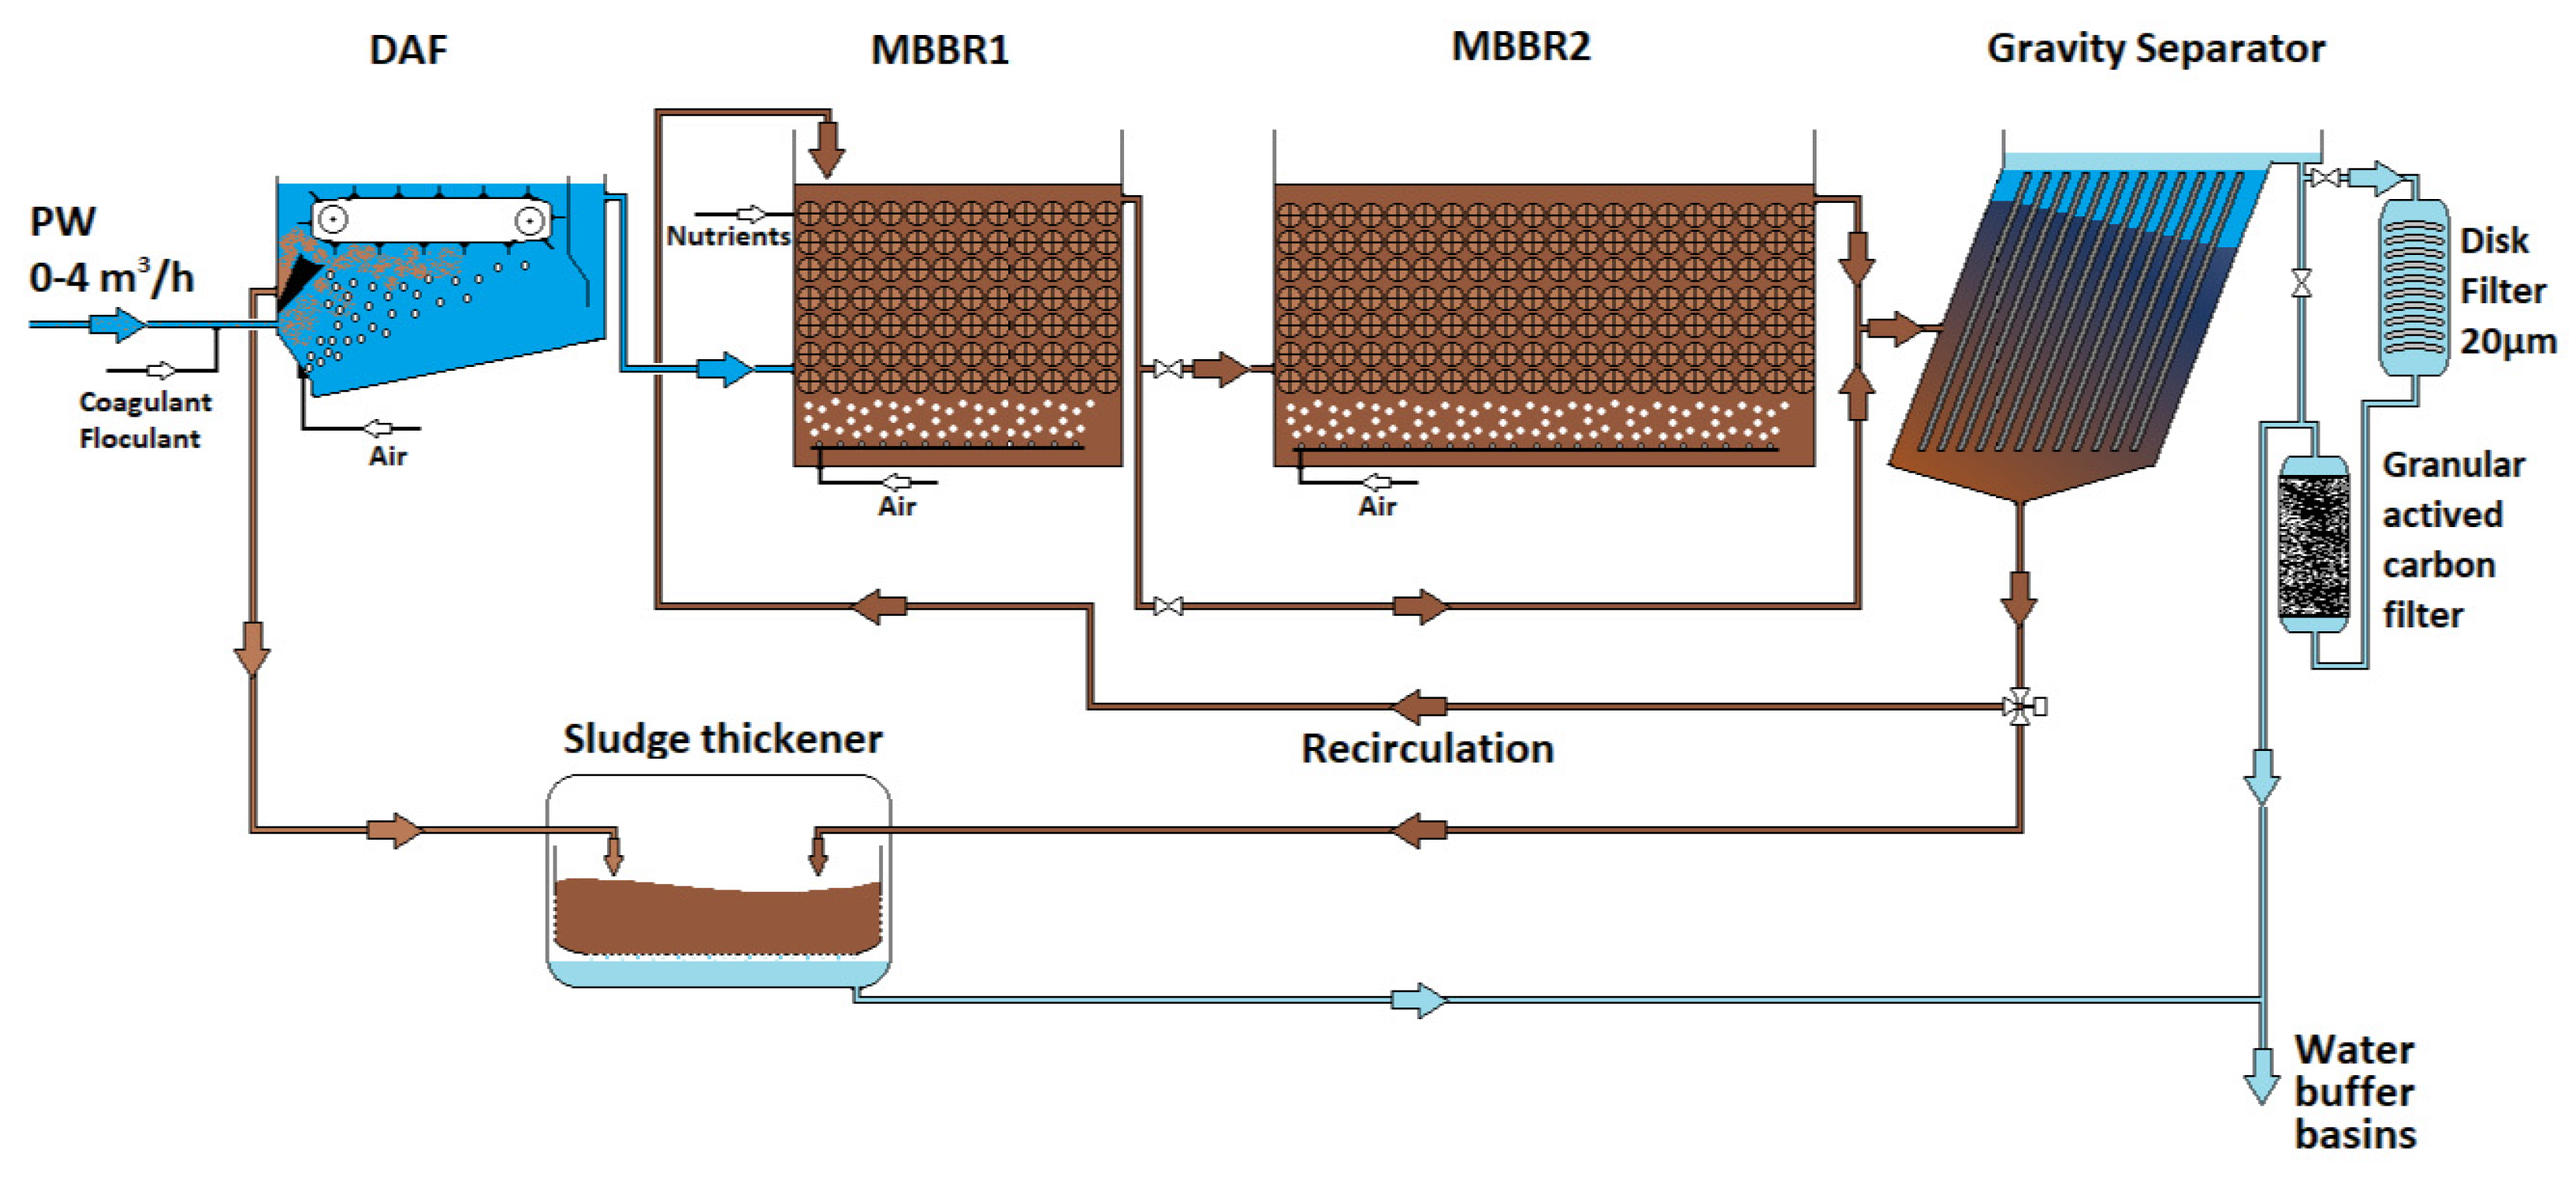
2.2. Pilot Unit Description

As described above, the produced water was pumped from the north basin (downstream of the API separator) to the pilot unit. The pilot unit was composed of four containers. As shown in the block flow diagram (Figure 1), a maximum PW flow of 4 m3.h−1 fed a 2.5 m3 dissolved air floatation unit (DAF). The main role of this first step is to remove dispersed hydrocarbons and total suspended solids (dispersed phases). This stage was only for safety as the dispersed phase was removed by the site water treatment in the API and then through the long residence time buffer basins. The objective was to achieve a maximum of 20 mg/L of dispersed oil entering the downstream biotreatment step. To do so, 6 m3.h−1 air were injected into the DAFas required for the floating dispersed phase but also for pre-oxygenation of the water before entering the second process step: the moving bed biofilm bioreactor. A coagulant (Baker, Tretolite RBW85138) and an anionic, medium-charge density, high molecular-weight, polymeric flocculant (Suez, Betz Dearborn AE 1128) were used (depending on the experimental design).
The outlet of the floatation unit fed the moving bed biofilm bioreactor (MBBR). The MBBR was composed of two bioreactors of different volumes (575 and 2670 L) capable of operating over a large spectrum of hydraulic retention times, from 30 min up to 12 h. Phosphoric acid was injected to compensate for the phosphorus deficiency at the inlet, as mentioned above, with a target value of 8 mgP/L in the MBBR feed. Air was also injected at flowrates ranging from 150 to up to 400 m3.h−1 to keep dissolved oxygen in the reactor within the range of 2 to 6 mgO2/L. Kaldness® K1 biocarriers were introduced into the two bioreactors at an apparent volume ratio of 40% (v/v). The role of these biocarriers was to promote the development of biofilms. The biocarriers remain trapped inside the bioreactors using a grid on the collector to allow only the water phase to pass through. This water phase comprises essentially water, but also bioflocs composed of microorganisms that developed outside of the biocarriers or on biocarriers and released when the biofilm layer grew. Bioflocs can also contain metals and various types of organic and inorganic matter. They are separated in the gravity separator (2400 L) located downstream the MBBRs. This separator contains plates that increase separation performance. A vibrating system is triggered frequently to shake the plates and cause the particles to fall to the bottom of the separator. Part of the sedimented sludge is recirculated to the MBBR and another part is sent to a sludge thickener for external treatment. The recirculating ratio depends on the experimental design and can vary from 0% to 200% of the MBBR feed flowrate.
Downstream of the MBBR and gravity sludge separator, the treated water is either discharged or is directed to 20 µm disk filters (AMIAD) in series with a granular activated carbon filter (GAC, carbsorb 40, Chemviron, Belgium).

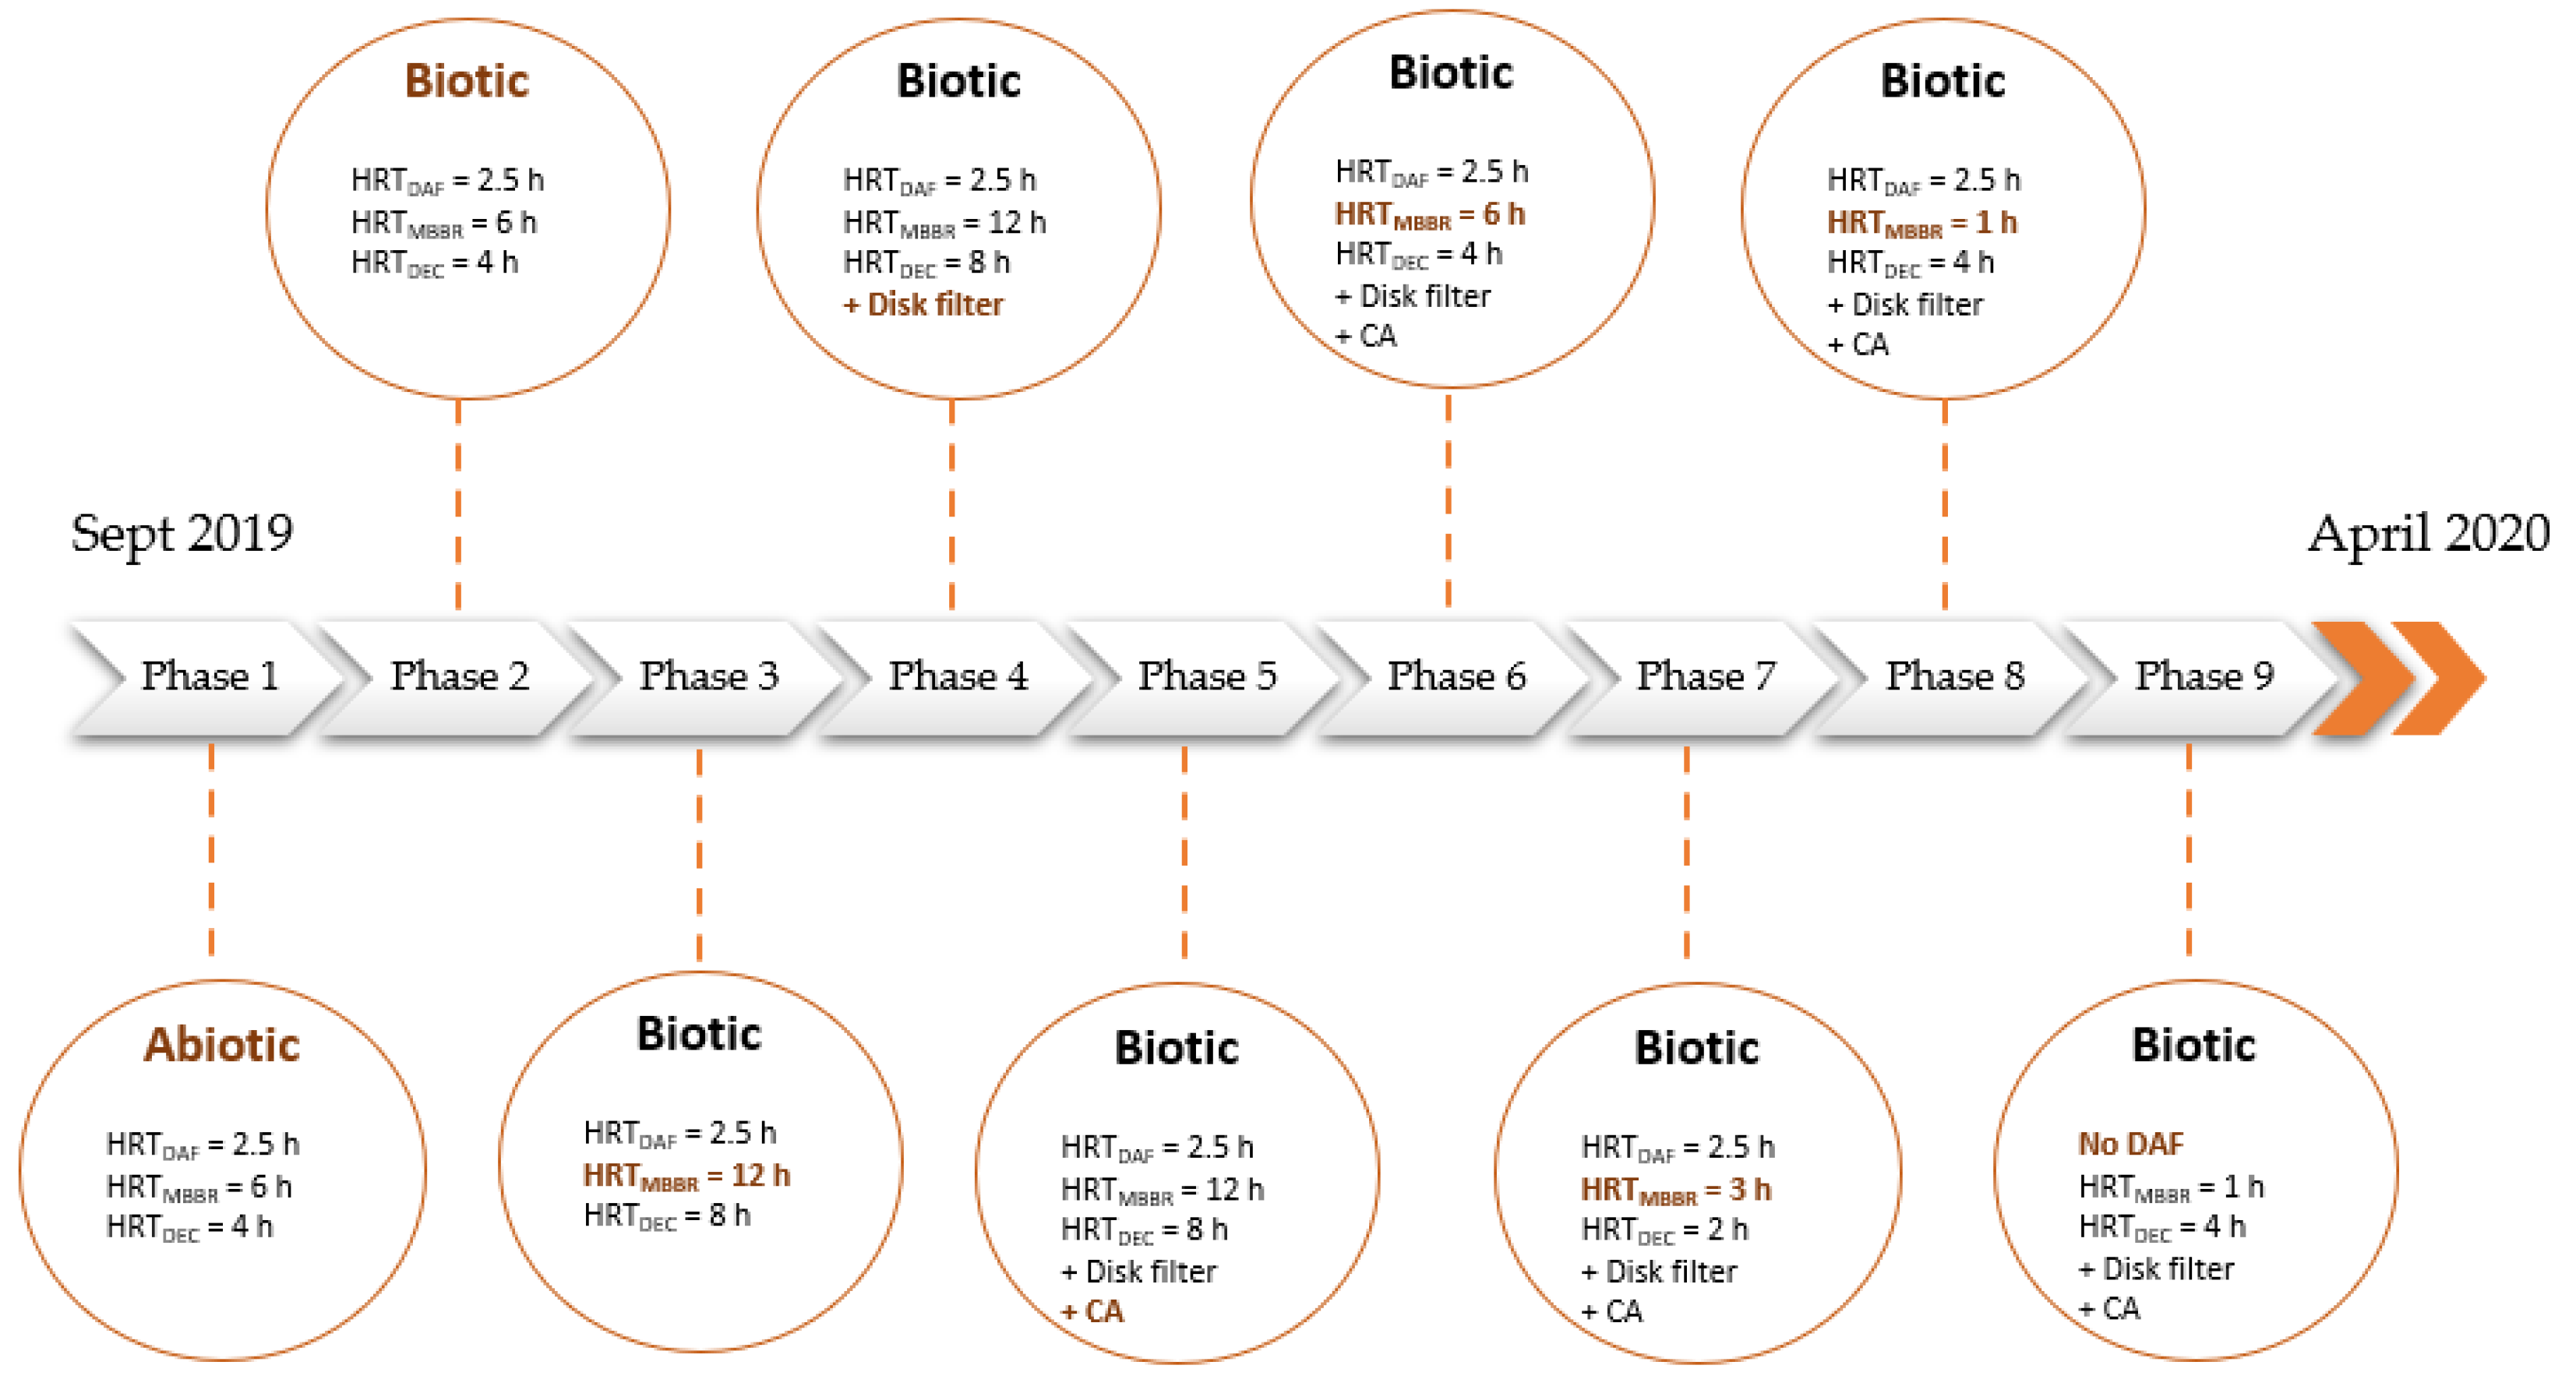
2.3. Experimental Set-Up

Figure 2 summarizes the main operating parameters selected during the nine test phases. The abiotic phase (phase 1) consisted of testing the pilot without an acclimated microbial inoculum. The main variable operating parameter for the eight other phases was the MBBR hydraulic retention time (HRT).

2.4. Analytical Methods

Many parameters were analyzed at the inlet and outlet of each process step to study their removal performance. Some of these parameters were analyzed directly onsite. When the analyses could not be done easily onsite using micro-methods and multiparameter probes, the samples were sent to certified external labs (Eurofins in France). Table 1 below summarizes the list of analyses.
In addition to this “substance by substance” approach, an evaluation of the entire effluent toxicity was also conducted on the inlet and outlet samples using standardized ecotoxicity tests:
-
Acute toxicity test “Microtox®” (NF EN ISO 11348-3). This test is based on the determination of the inhibition of the bioluminescence emitted by a marine bacterium called Vibrio fischeri. It allows for the determination of the sample concentration that inhibits 50% of the bacterial luminescence after 5, 15 or 30 min of exposure. It was selected due to its high sensitivity compared to other bioassays (Abbas et al., 2018) [17].
-
Acute toxicity test with marine copepods (ISO 14669). This test aims to determine the sample concentration that kills 50% of the population of Artemia salina after 24 h and 48 h.
Two replicates were done for each test. Positive and negative controls were also conducted to ensure good-quality results.

3. Results

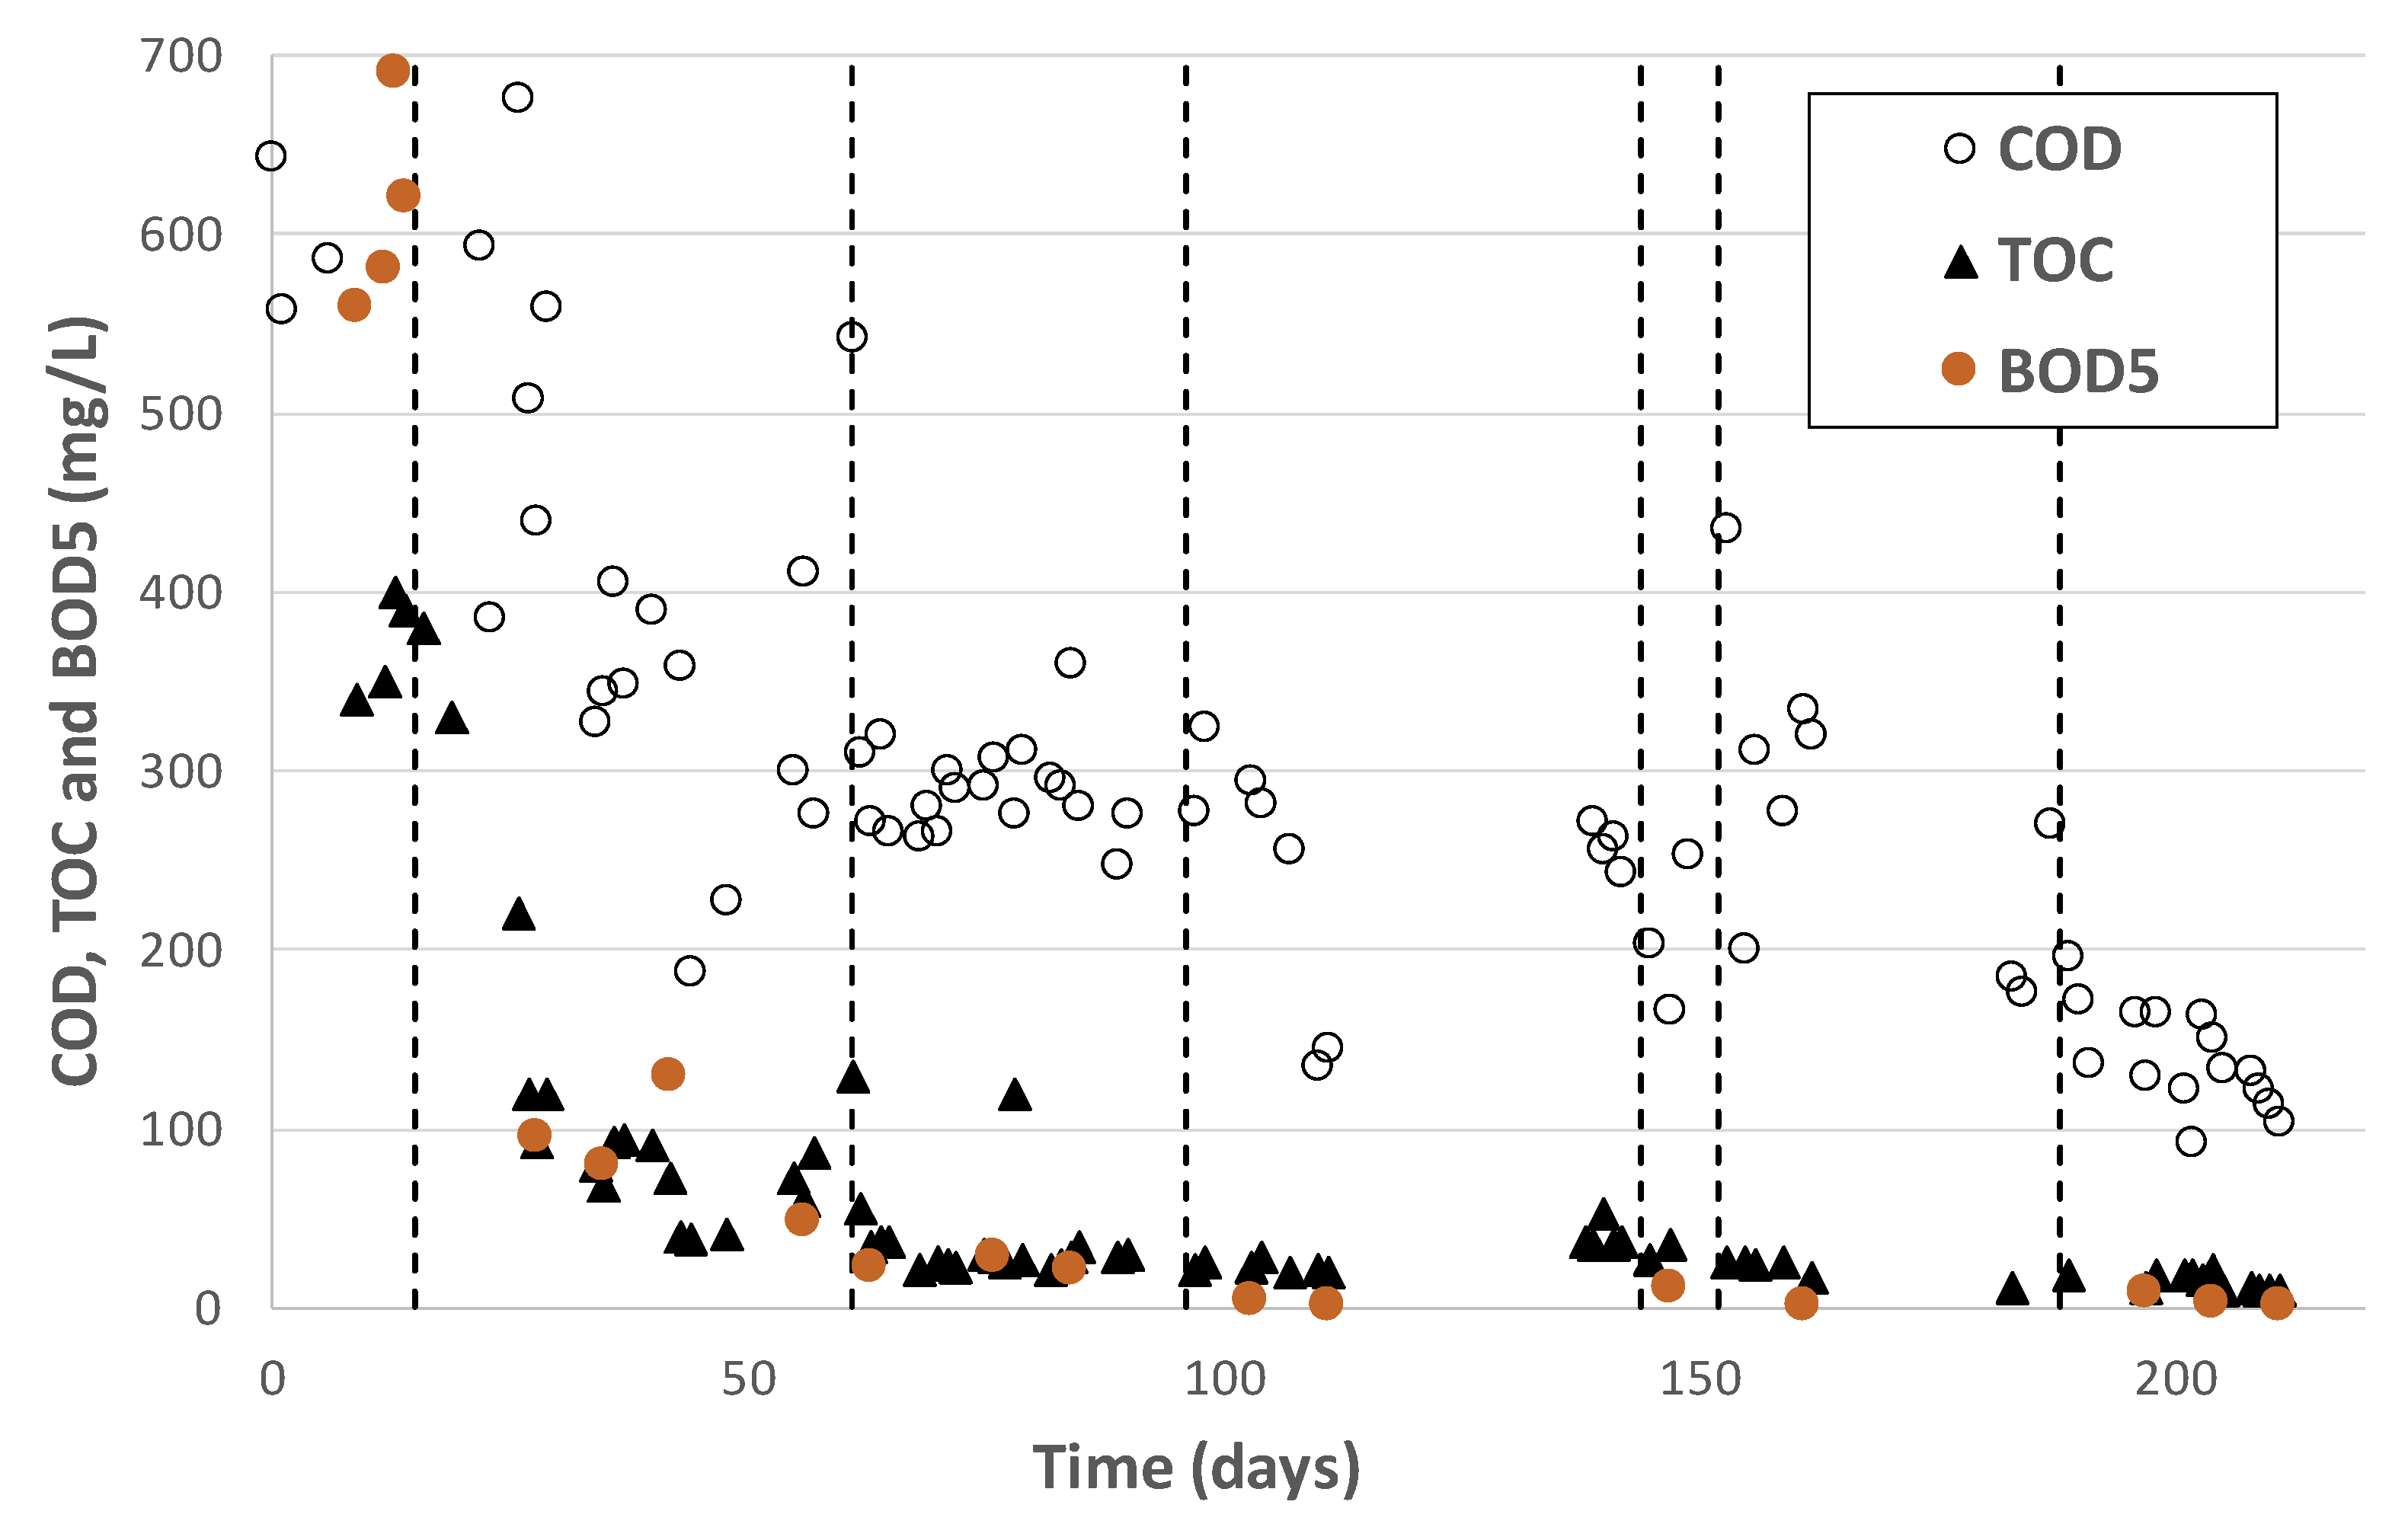
3.1. Characterization of Feed Water

Before starting the project, an analytical campaign was undertaken in 2018 with the collection of 12 produced water samples taken over a one-month period. Figure 3, Figure 4 and Figure 5 and Table 2 below present the composition of produced water sampled at the discharge point. Total hydrocarbons were below 15 mg/L as stipulated in the local specification on discharge. As for the other measured organic substances, BTEX were present at concentrations of a few hundred µg/L, phenols were around 3 mg/L and PAHs were below 30 µg/L. As for metals, most of the analyzed metals were below 30 µg/L, except for zinc, which was close to 1 mg/L, and iron, which was up to 30 mg/L.
Global parameters such as the Chemical Oxygen Demand (COD), Total Organic Carbon (TOC), Biological Oxygen Demand (BOD), nitrogen and phosphorus are very important for anticipating bioreactor performance. BOD represented around 40–60% of COD, meaning that there was still 40–60% of the COD that could be considered “non-biodegradable” by the non-acclimated biomass after five days of biodegradation. Considering the commonly accepted COD/N/P ratio of 100/5/1 w/w respectively, it is also evident that it will be necessary to add a source of phosphorus (lower than 1 mg/L) to prevent nutrient limitation.
As shown on Figure 6 below, feed salinity and COD concentrations decreased continuously during pilot operation. These two indicators varied comparably, probably due to a dilution effect from another water source at low COD and low salinity concentrations (condensation water, rain, freshwater for oil skimming).

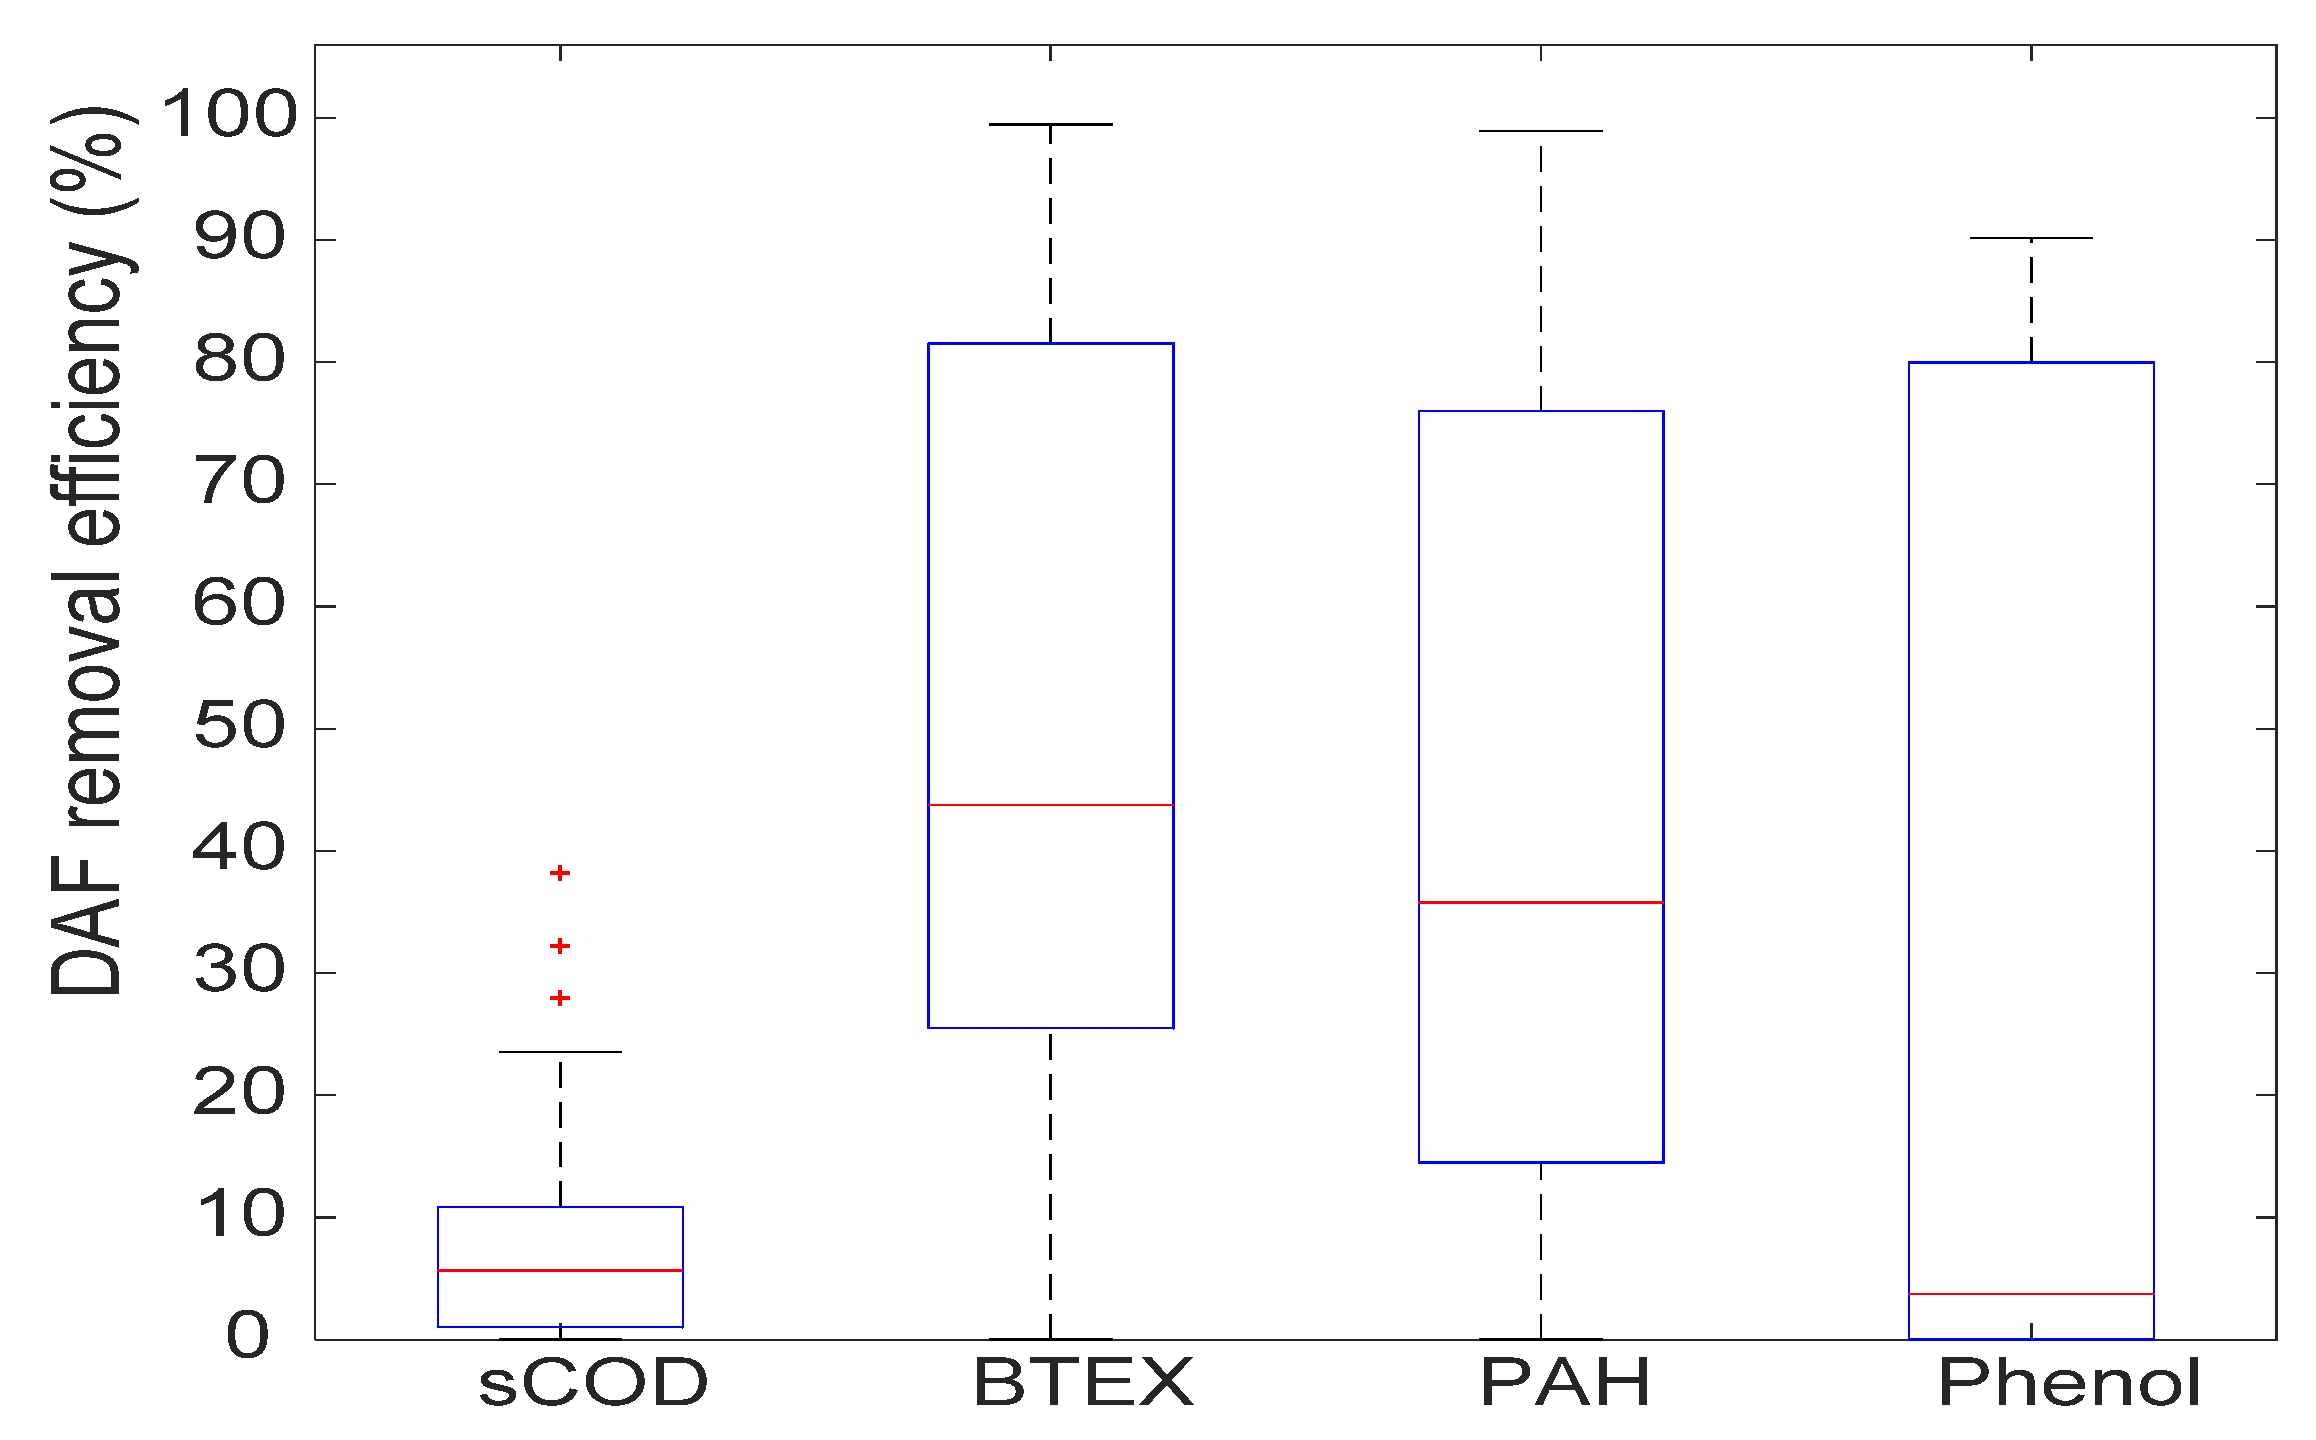
3.2. Performance of the Dissolved Air Flotation (DAF) Unit

As mentioned above, the DAF was installed for two reasons: (i) to guarantee the dispersed hydrocarbon specification of 20 mg/L at the inlet, preserving the microbial biomass inside the reactor; and (ii) to guarantee a preoxygenation step of the feed water. Figure 7 presents the concentrations of dispersed hydrocarbon at the inlet (EDAF) and the outlet (SDAF) of the DAF unit. It can be seen that most of the time the inlet concentration meets the specifications for entering the MBBR. When the concentration was occasionally higher at the inlet, the DAF treatment was sufficient to guarantee the 20 mg/L specification at the outlet (SDAF).
It is well known that volatile organic substances, constituting part of the soluble COD, can be removed by stripping [18]. The figure below shows the removal of soluble COD, BTEX, PAH and Phenol by DAF during the entire pilot operation period. It can be seen that a very low portion (mostly below 20%) of the soluble COD was removed by DAF, meaning that soluble COD in PW was essentially a non-volatile organic carbon. BTEX, PAH and Phenol are randomly removed by DAF due to either multiple uncertainties related to the analyses on such substances (sampling, long transport and analytical method) or to variations in the feed composition and the pilot unit operating parameters.
In conclusion, Figure 8 shows that the DAF was efficient for protecting the bioreactor against the dispersed hydrocarbon, but it was insufficient for ensuring an extensive removal of the soluble COD (most of the time < 10%) even though it is partly composed of substances considered as volatile (i.e., BTEX).

3.3. Moving Bed Biofilm Bioreactor (MBBR) and Polishing Treatment Performance

3.3.1. Acclimation of Biocarriers and Their Impact on Bioreactor Performance

Acclimation is often done with an inoculum from a domestic or industrial wastewater plant. The first challenge for this pilot was to acclimate the biocarriers with high saline produced water in a geographical area without any access to domestic or industrial wastewater treatment plants and therefore without any possibility to inoculate bioreactors with a fresh microbial consortium. The idea was to take anoxic sediments directly onsite at the bottom of the buffer basins, taking advantage of the fact that all these microorganisms were already acclimated to PW salinity and dissolved substances. Once in contact with oxygen, it was believed that the microorganisms with a metabolism that could adapt to aerobic conditions would grow favorably in comparison to those that were strictly anoxic. A 1.4 m3 volume of Kaldness® K1 biocarriers were introduced into two tanks (1 m3) together with 100 L of microbial sediments. The tanks were filled with produced water. They were then aerated and fed with real saline produced water with an average hydraulic retention time of 72 h. The target was initially to perform the acclimation for 3 months, but it actually lasted 8 months due to the delayed reception and commissioning of the pilot unit.
Figure 9 shows the results obtained on the pilot unit during the first few weeks of testing. From day 1 to day 15, the MBBR ran without any carriers or inoculum (i.e., abiotic phase). It can be considered that during this period the only microorganisms (if any) came from the produced water itself. Except for the absence of biomass, the MBBR was operated with air and during an HRT of 6 h. It can be seen that soluble COD removal was very low, ranging from 0 up to 10%. After the colonized biocarriers were introduced inside the bioreactor (day 15), COD removal remained constant at a very low value until nutrients were injected. As soon as the nutrients were injected (day 18), the removal rate increased sharply, reaching up to 60% of COD removal. It took approximately 40 days to get a nearly stable performance of around 60% of COD removal. The results showed that acclimation using anoxic sediments worked very well. The biocarriers were well colonized and ready to be implanted in the MBBR.
Table 3 shows the impact of introducing acclimated biocarriers on the removal of some dissolved substances. Firstly, BTEX and PAHs exhibited a high removal efficiency during the abiotic phase, probably due to stripping inside the MBBR (it has been shown in previous sections that COD was not removed by the DAF), which is not the case for Phenol (5% removal). At this stage it is not possible to conclude on the contribution of stripping or biodegradation in the removal of each substance when acclimated biocarriers are present. We can only confirm that biodegradation is the main mechanism explaining the removal of phenol.

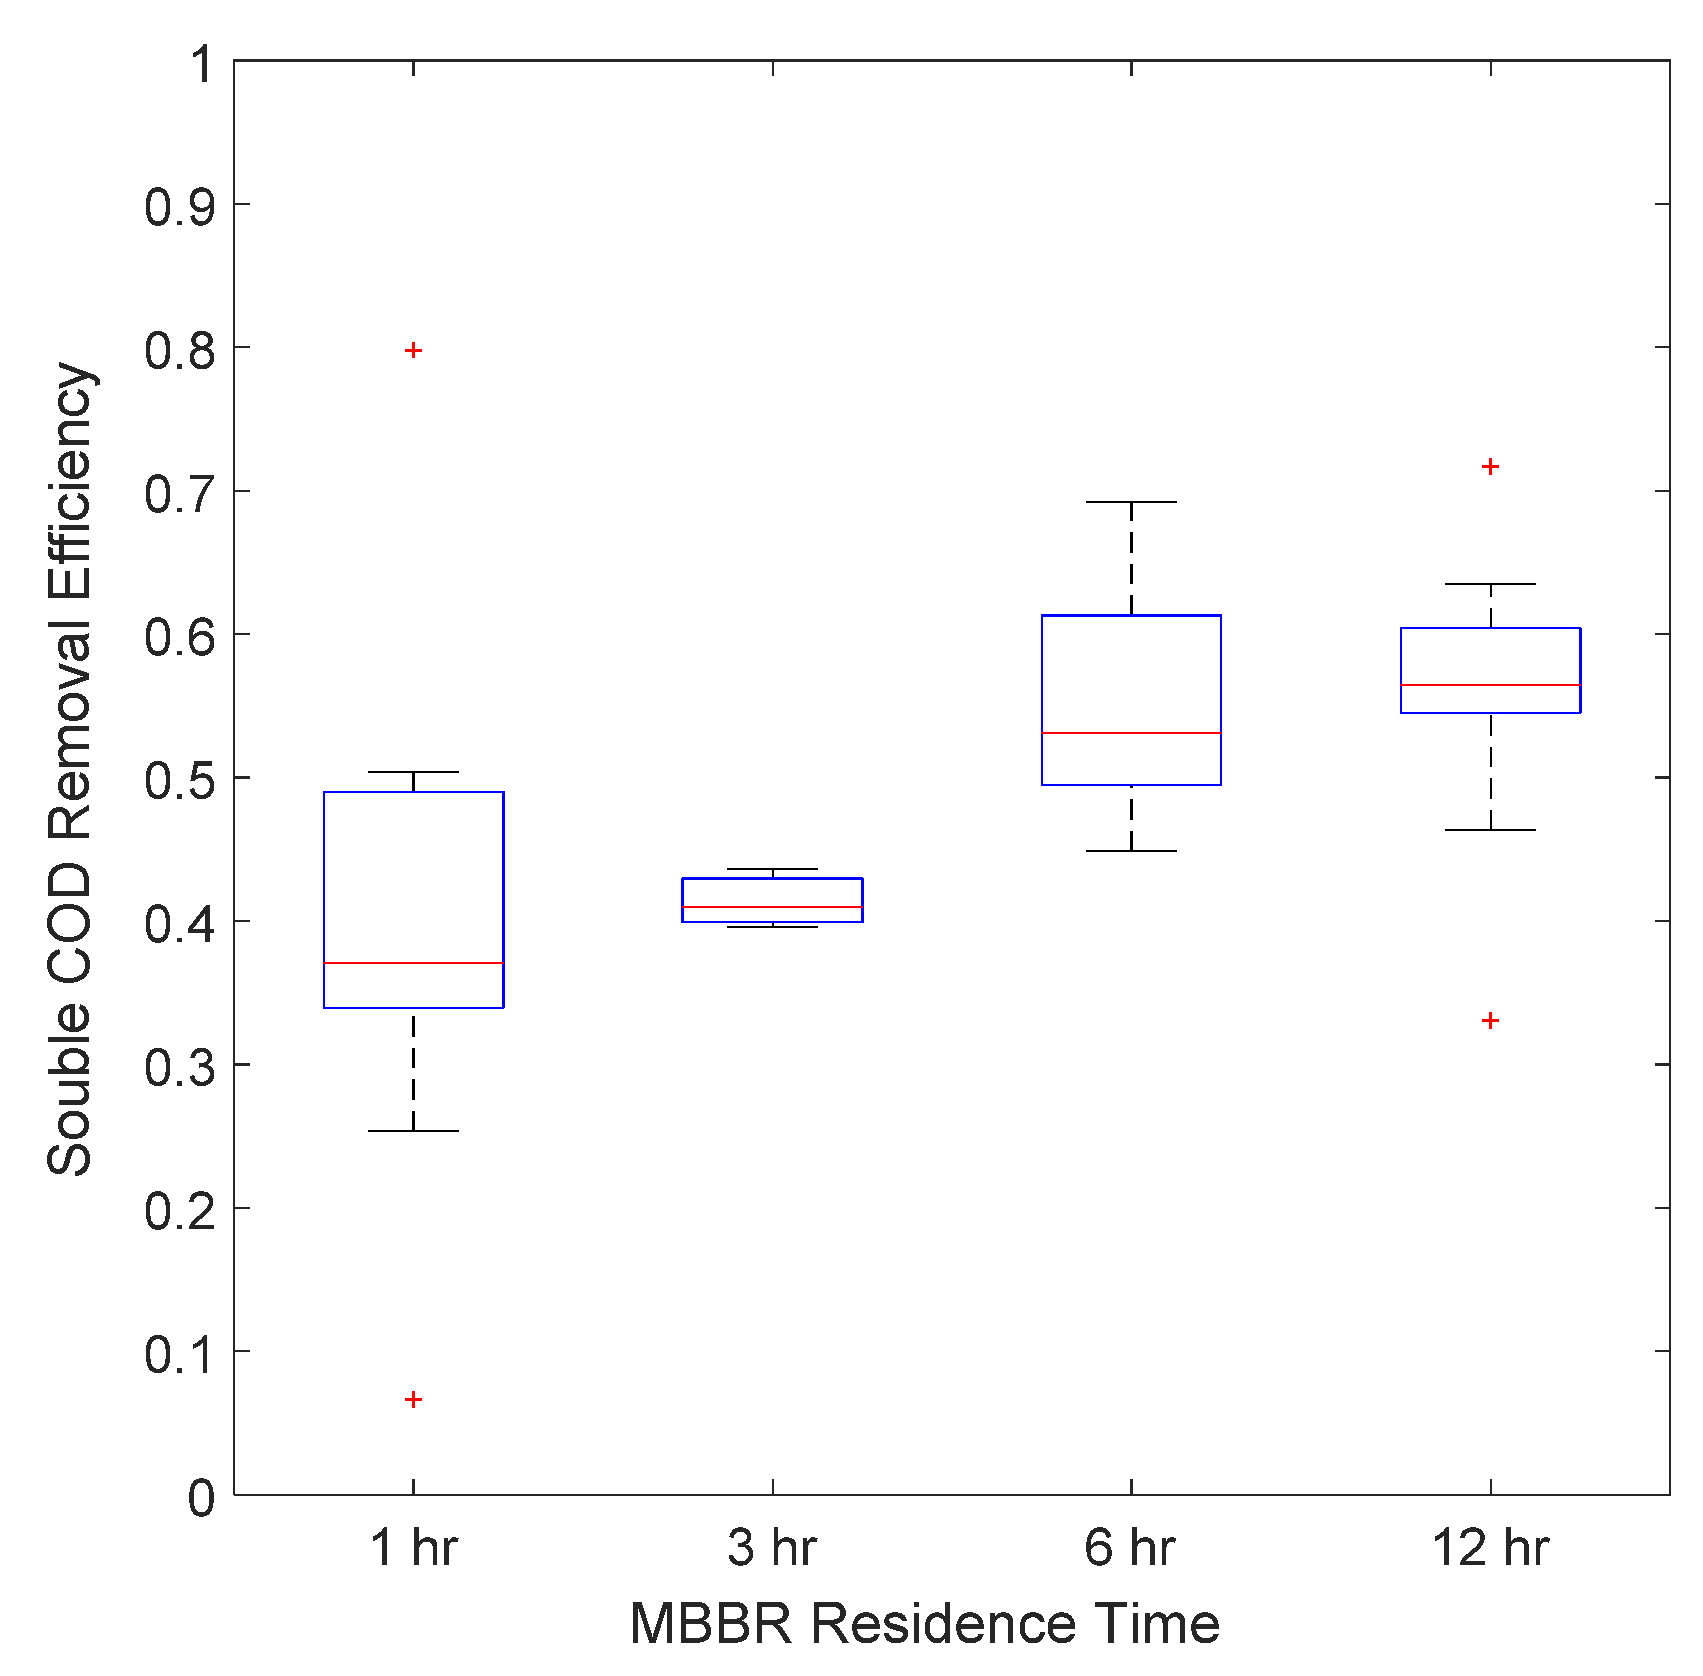
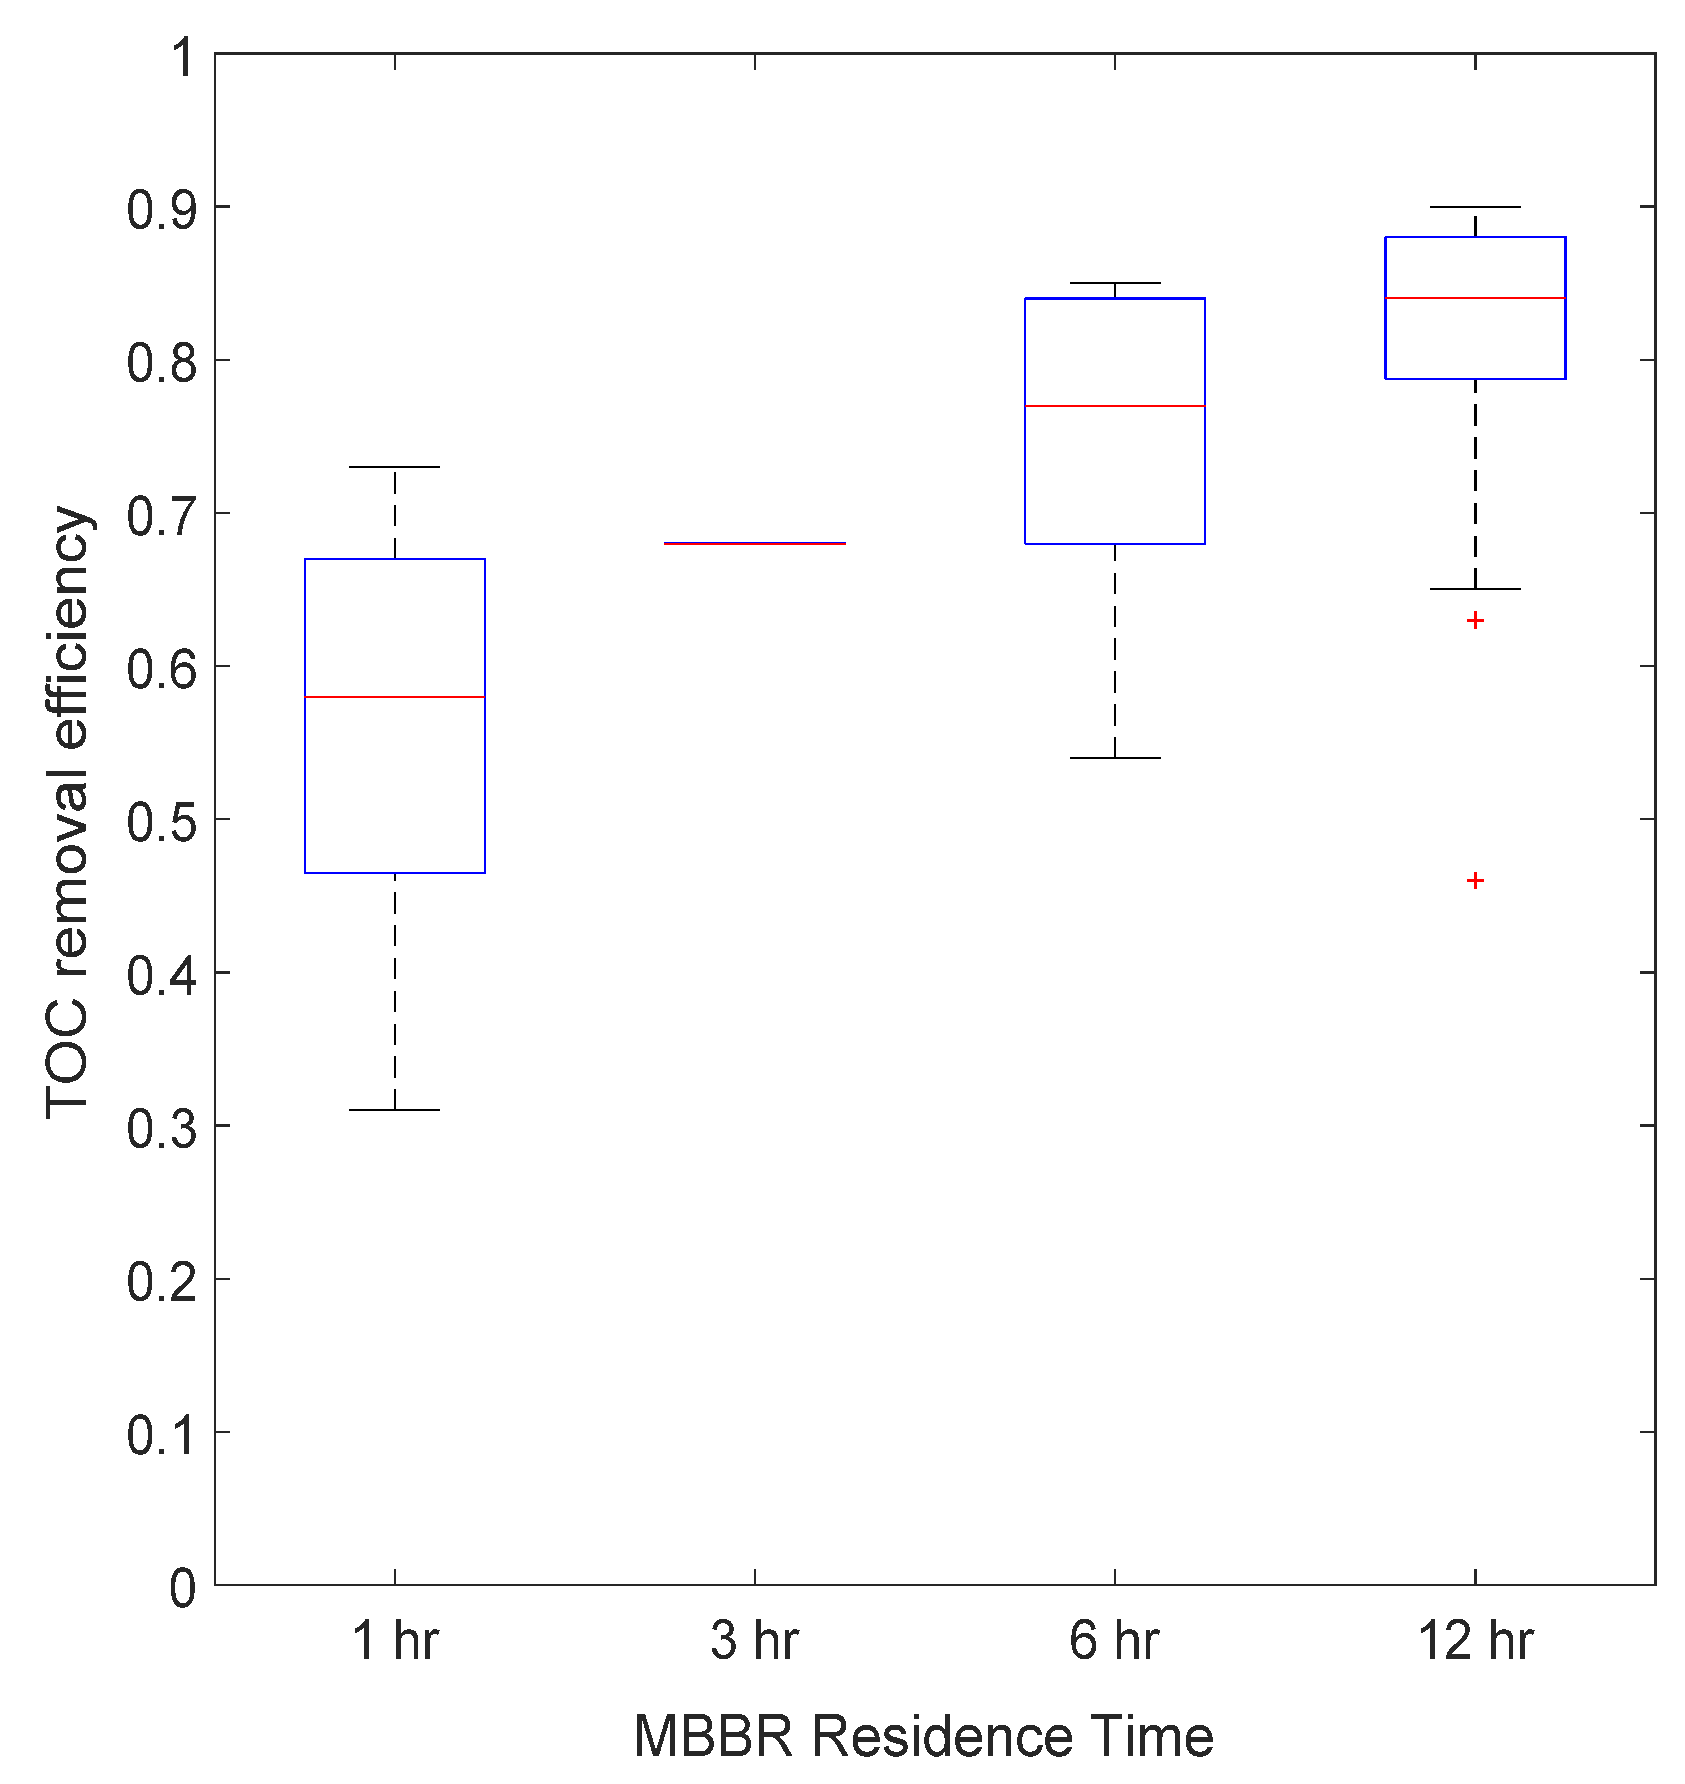
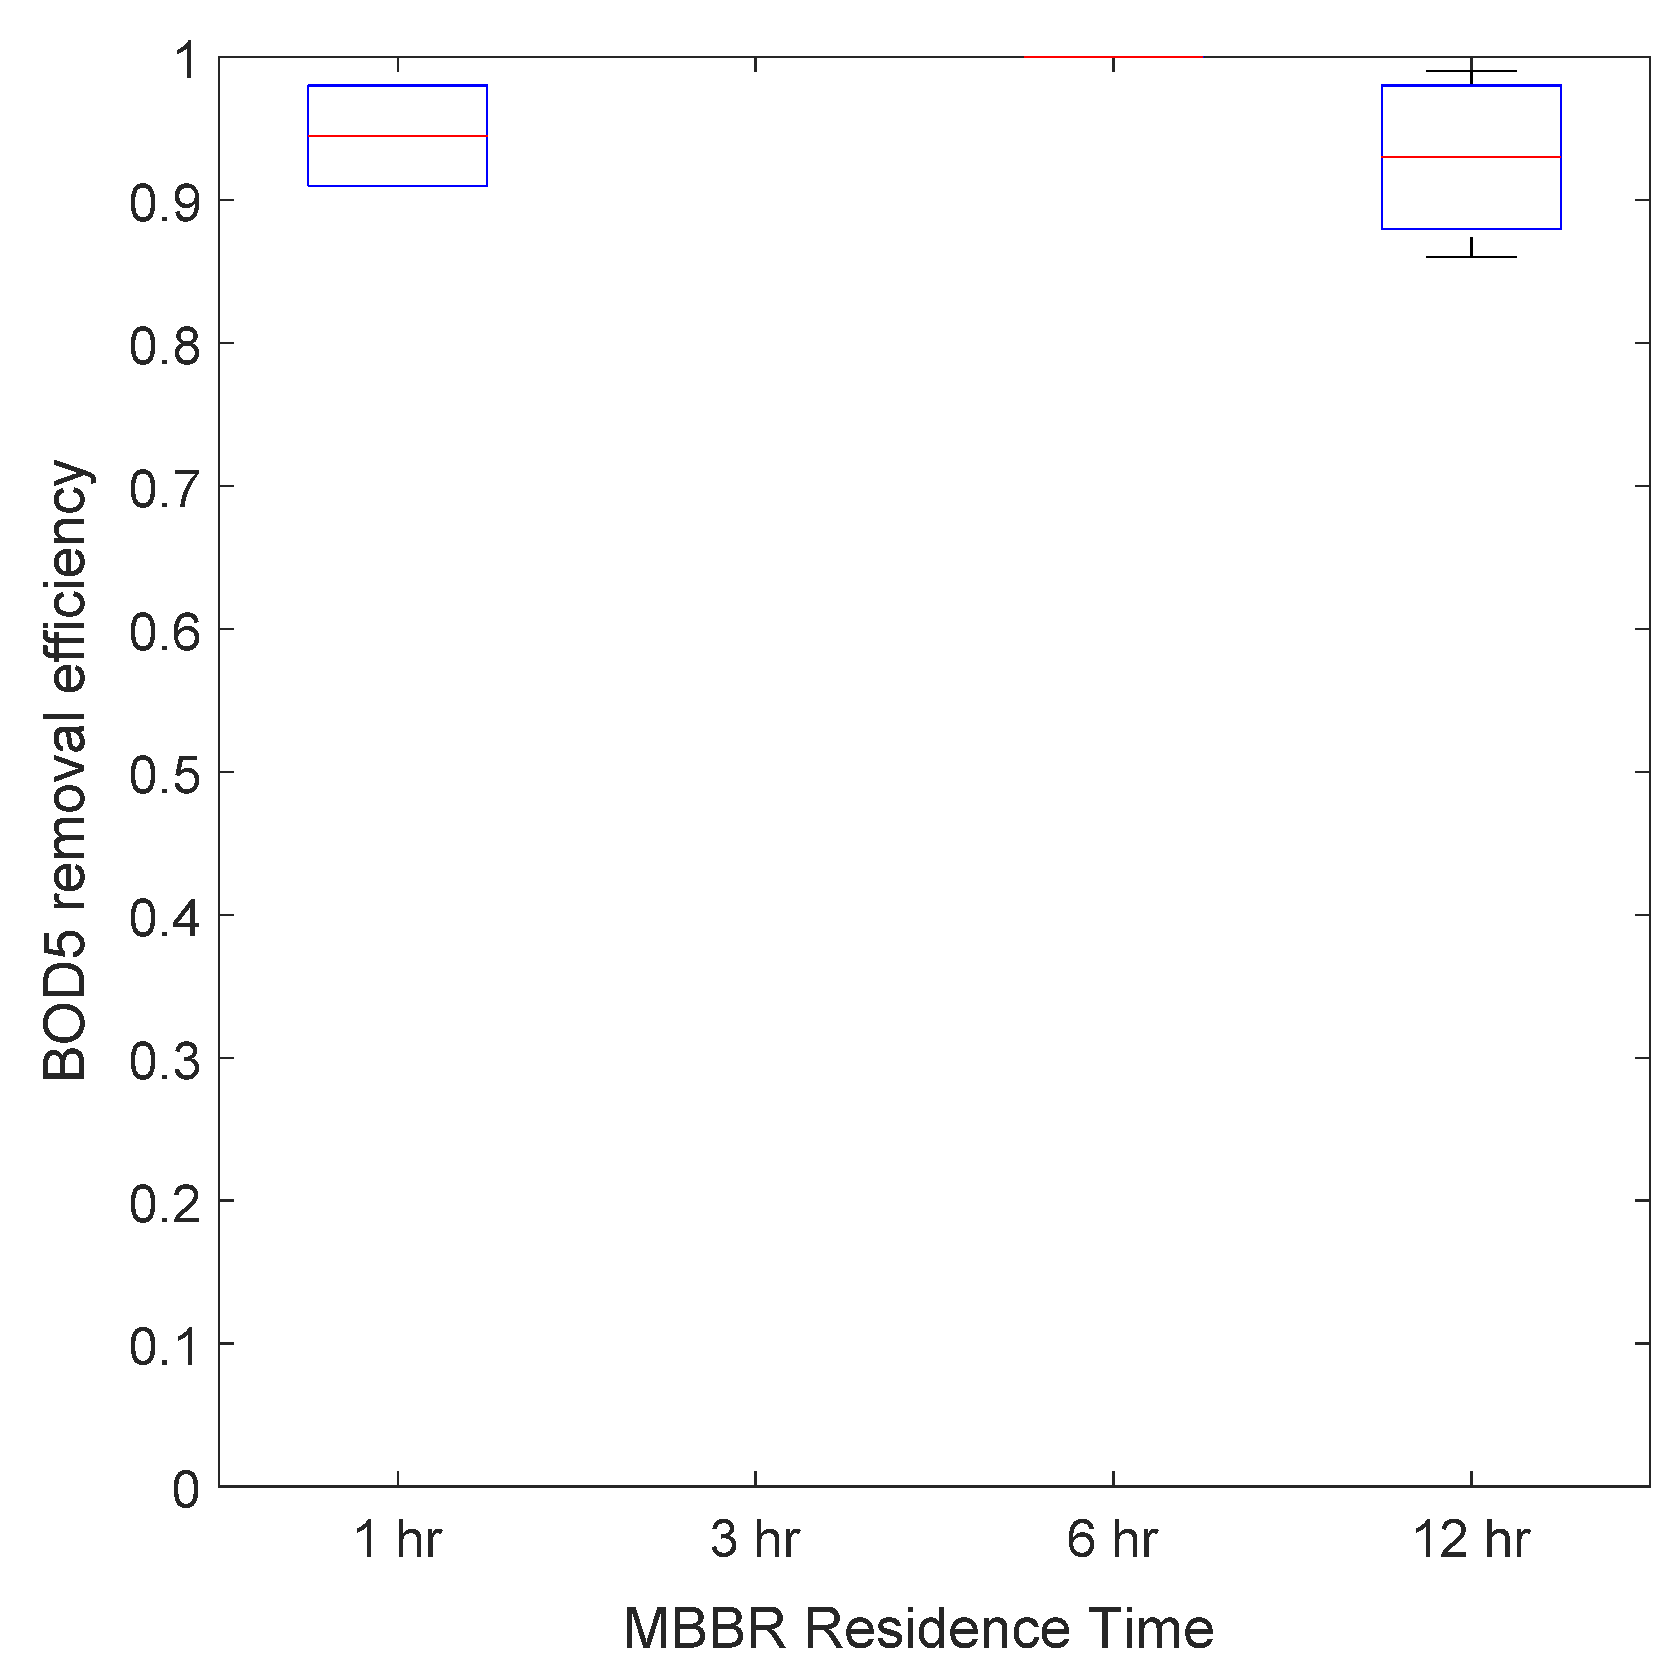
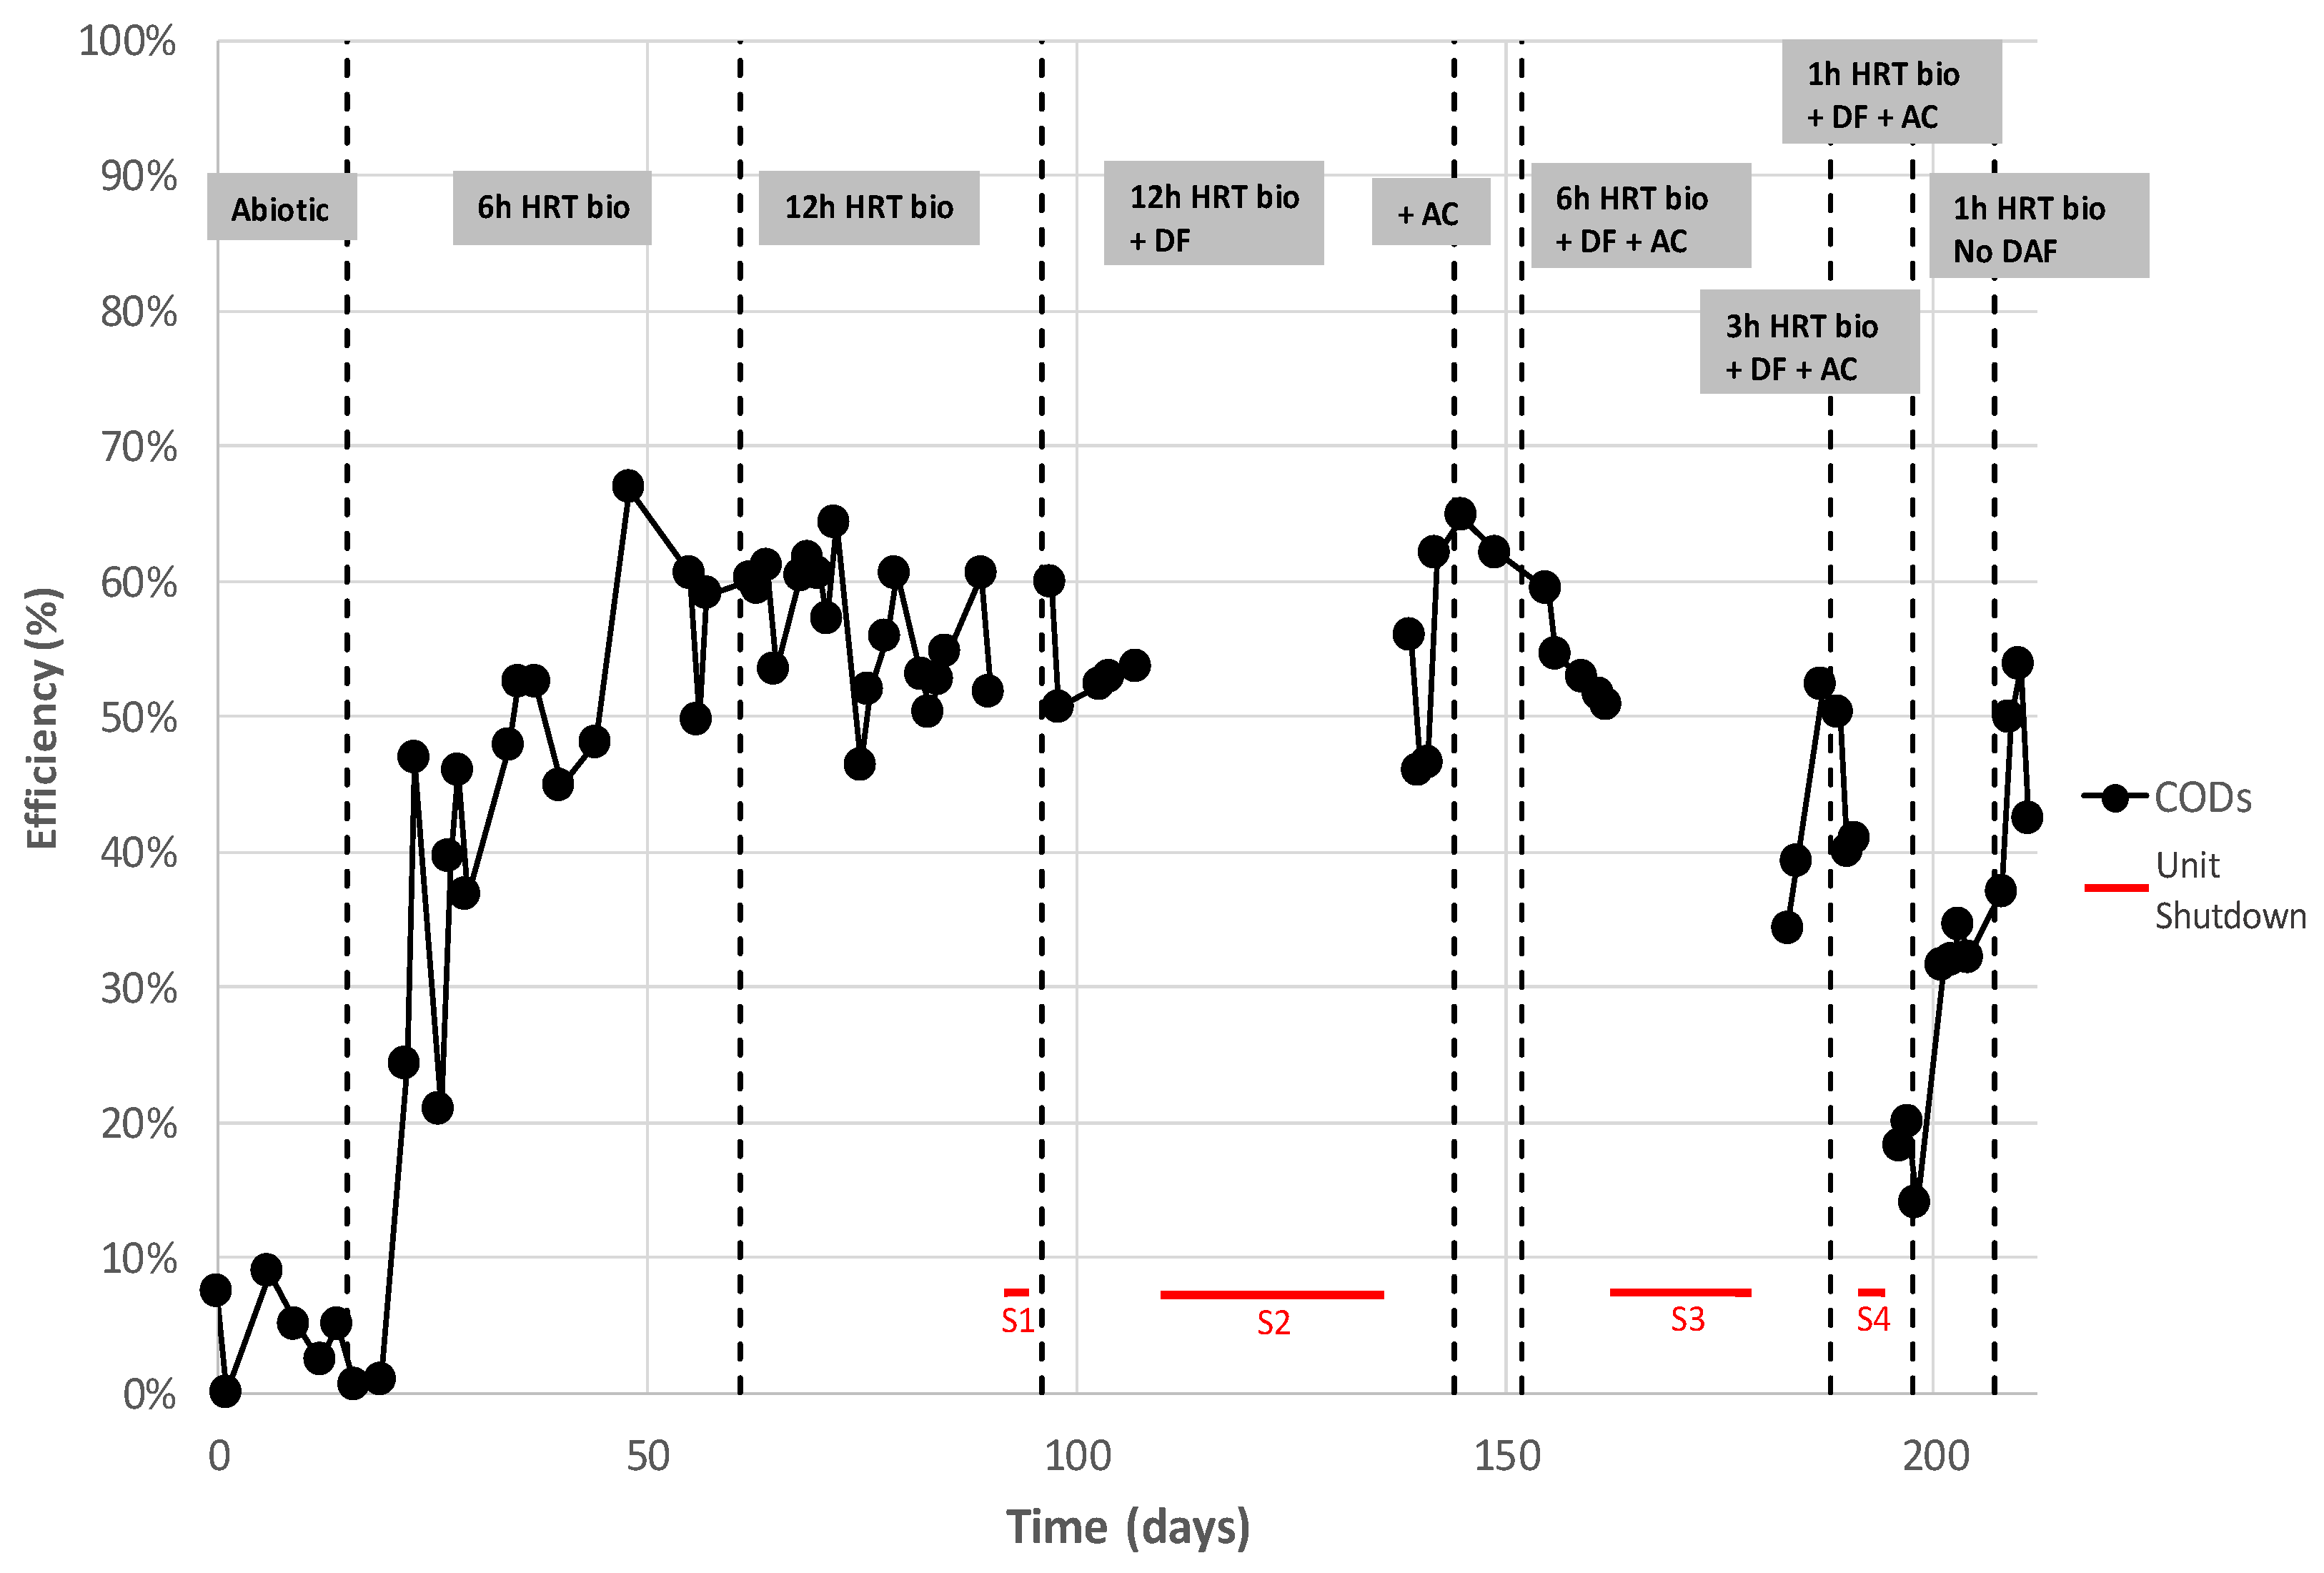
3.3.2. MBBR Performance as a Function of Residence Time

The bioreactor was operated at four different residence times: 12, 6, 3 and 1 h. Figure 10, Figure 11 and Figure 12 present the average MBBR and its sludge gravity separator performance for three main parameters (soluble COD, TOC and BOD5) as a function of residence time. It can be seen that (i) the higher the residence time, the better was the performance, (ii) the biodegradable fraction (BOD5) was almost totally removed even at a low residence time of 1 h, highlighting that micro-organisms were very active and therefore very well acclimated to this complex hypersaline water, (ii) TOC was removed up to 60% at a low HRT and up to 85% at a 12 h HRT, and (iii) soluble COD followed the same trend as TOC but with 20% lower efficiency, which gave a maximum removal rate of 60% at 12 h HRT.
Figure 13 shows the process performance in terms of soluble COD as a function of residence time. Interestingly, the following figure shows the ability of MBBR to rapidly recover its performance after 4 main pilot shutdowns.
Firstly, shut-down events S1, S2 and S3 did not significantly affect the bioreactor performance, even when they lasted more than 3 weeks (including 10 days without any aeration). The micro-organisms were inhibited but could be reactivated very quickly as soon as they were aerated and fed with produced water. S4 more significantly affected the bioreactor, probably because the HRT was reduced drastically during the same period. It took approximately 10 days to reacclimate, with a 1 h residence time, with very promising results at the end.
Finally, Figure 14 gives the concentration at the outlet of the bioreactor and the gravity separator for the 4 main global organic indicators. The other organic and inorganic micropollutants are described in another section.
Very low residual BOD was observed, always below 30 mg/L once the MBBR was acclimated. Residual TOC was also low, often below 30 mg/L. Despite the very interesting removal efficiency, residual COD was still higher than the 125 mg/L target except during the very last days due to a low inlet concentration of around 250 mg/L. A dedicated pretreatment, probably a pre-oxidation step, would be required to reach a higher COD removal efficiency [19].

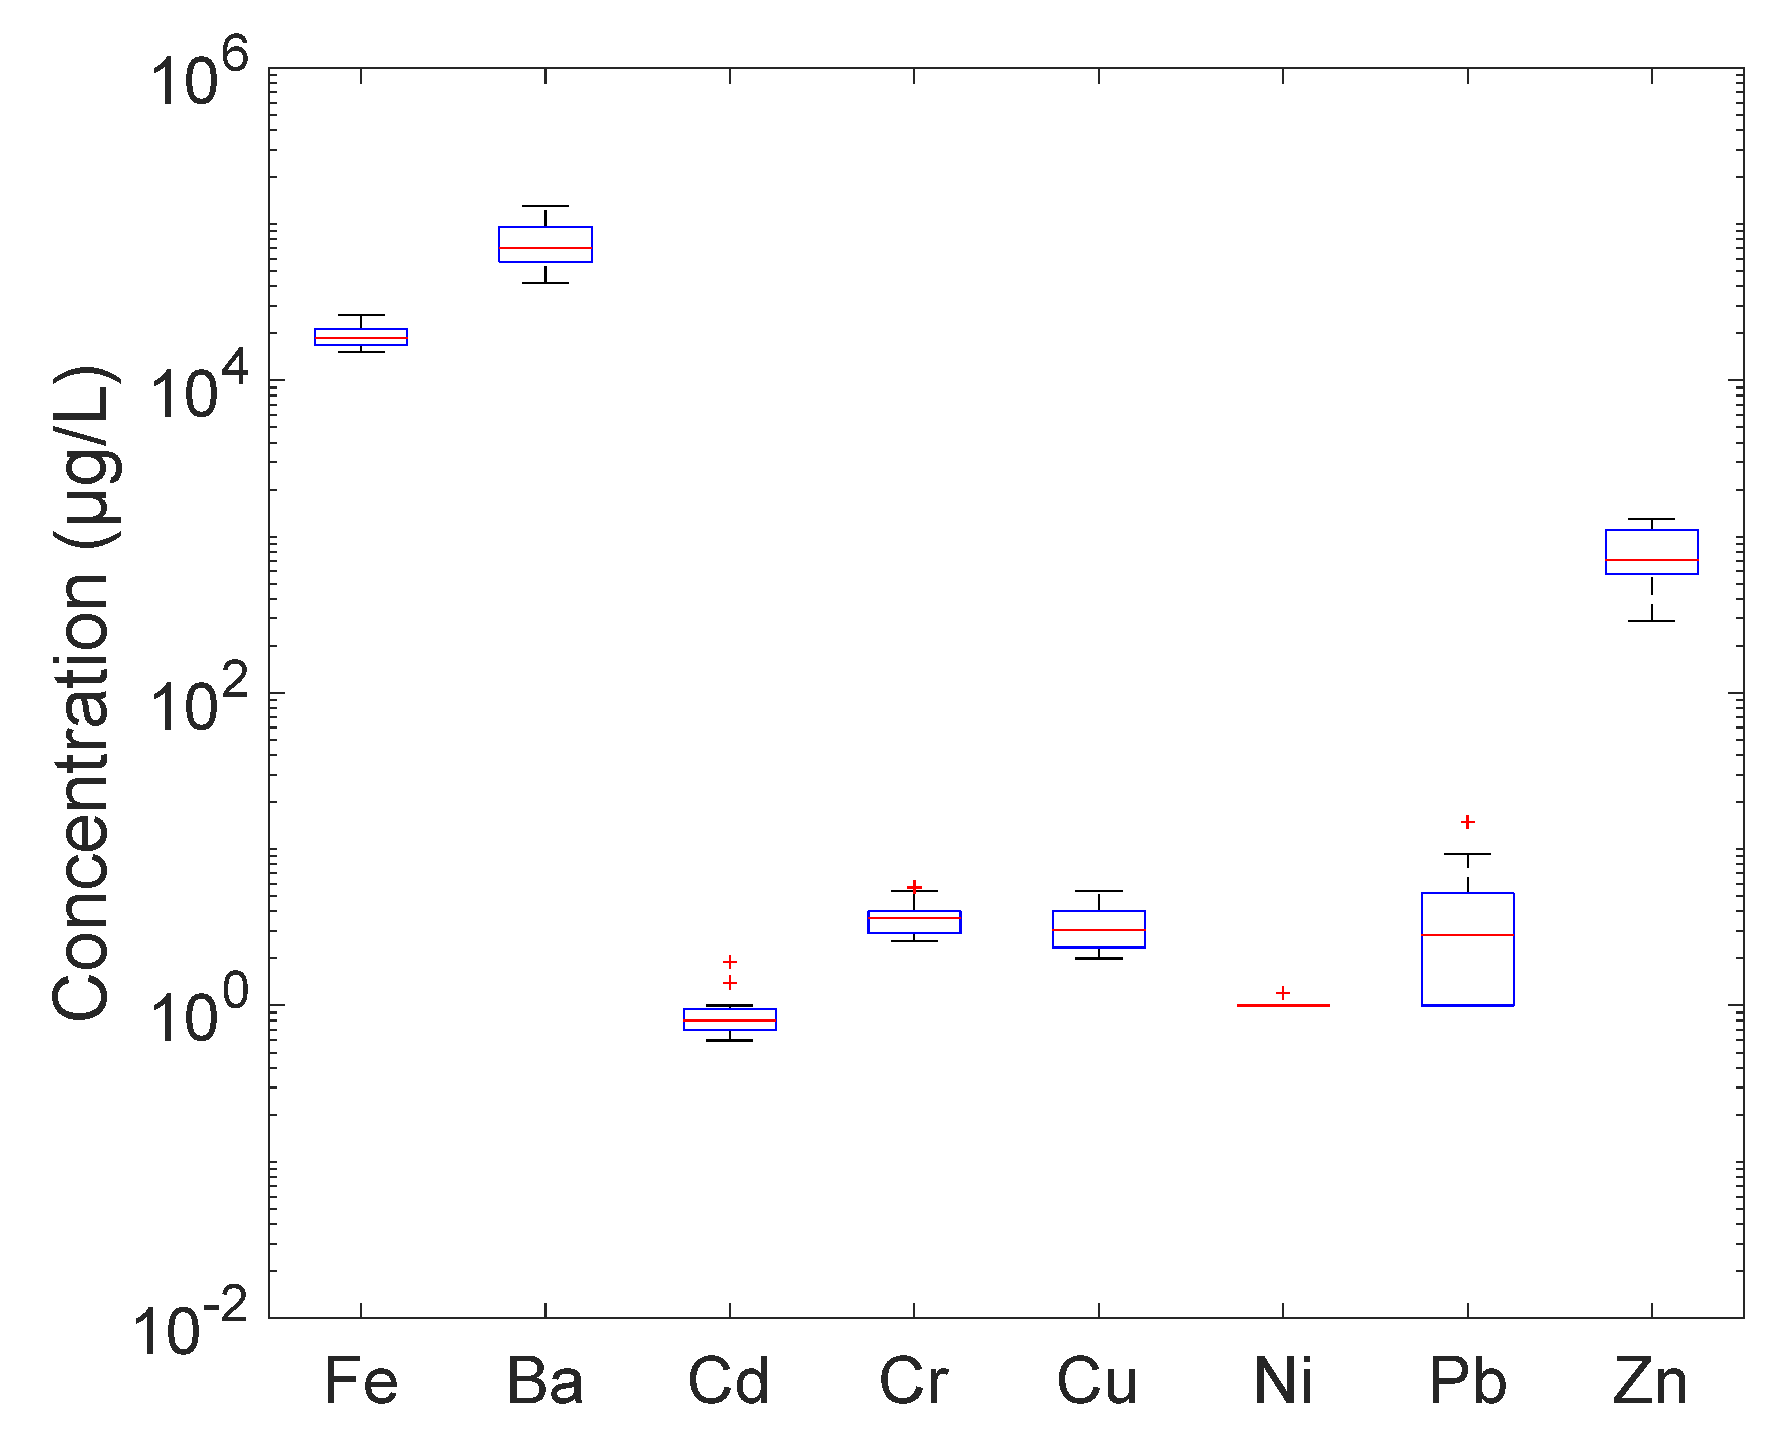
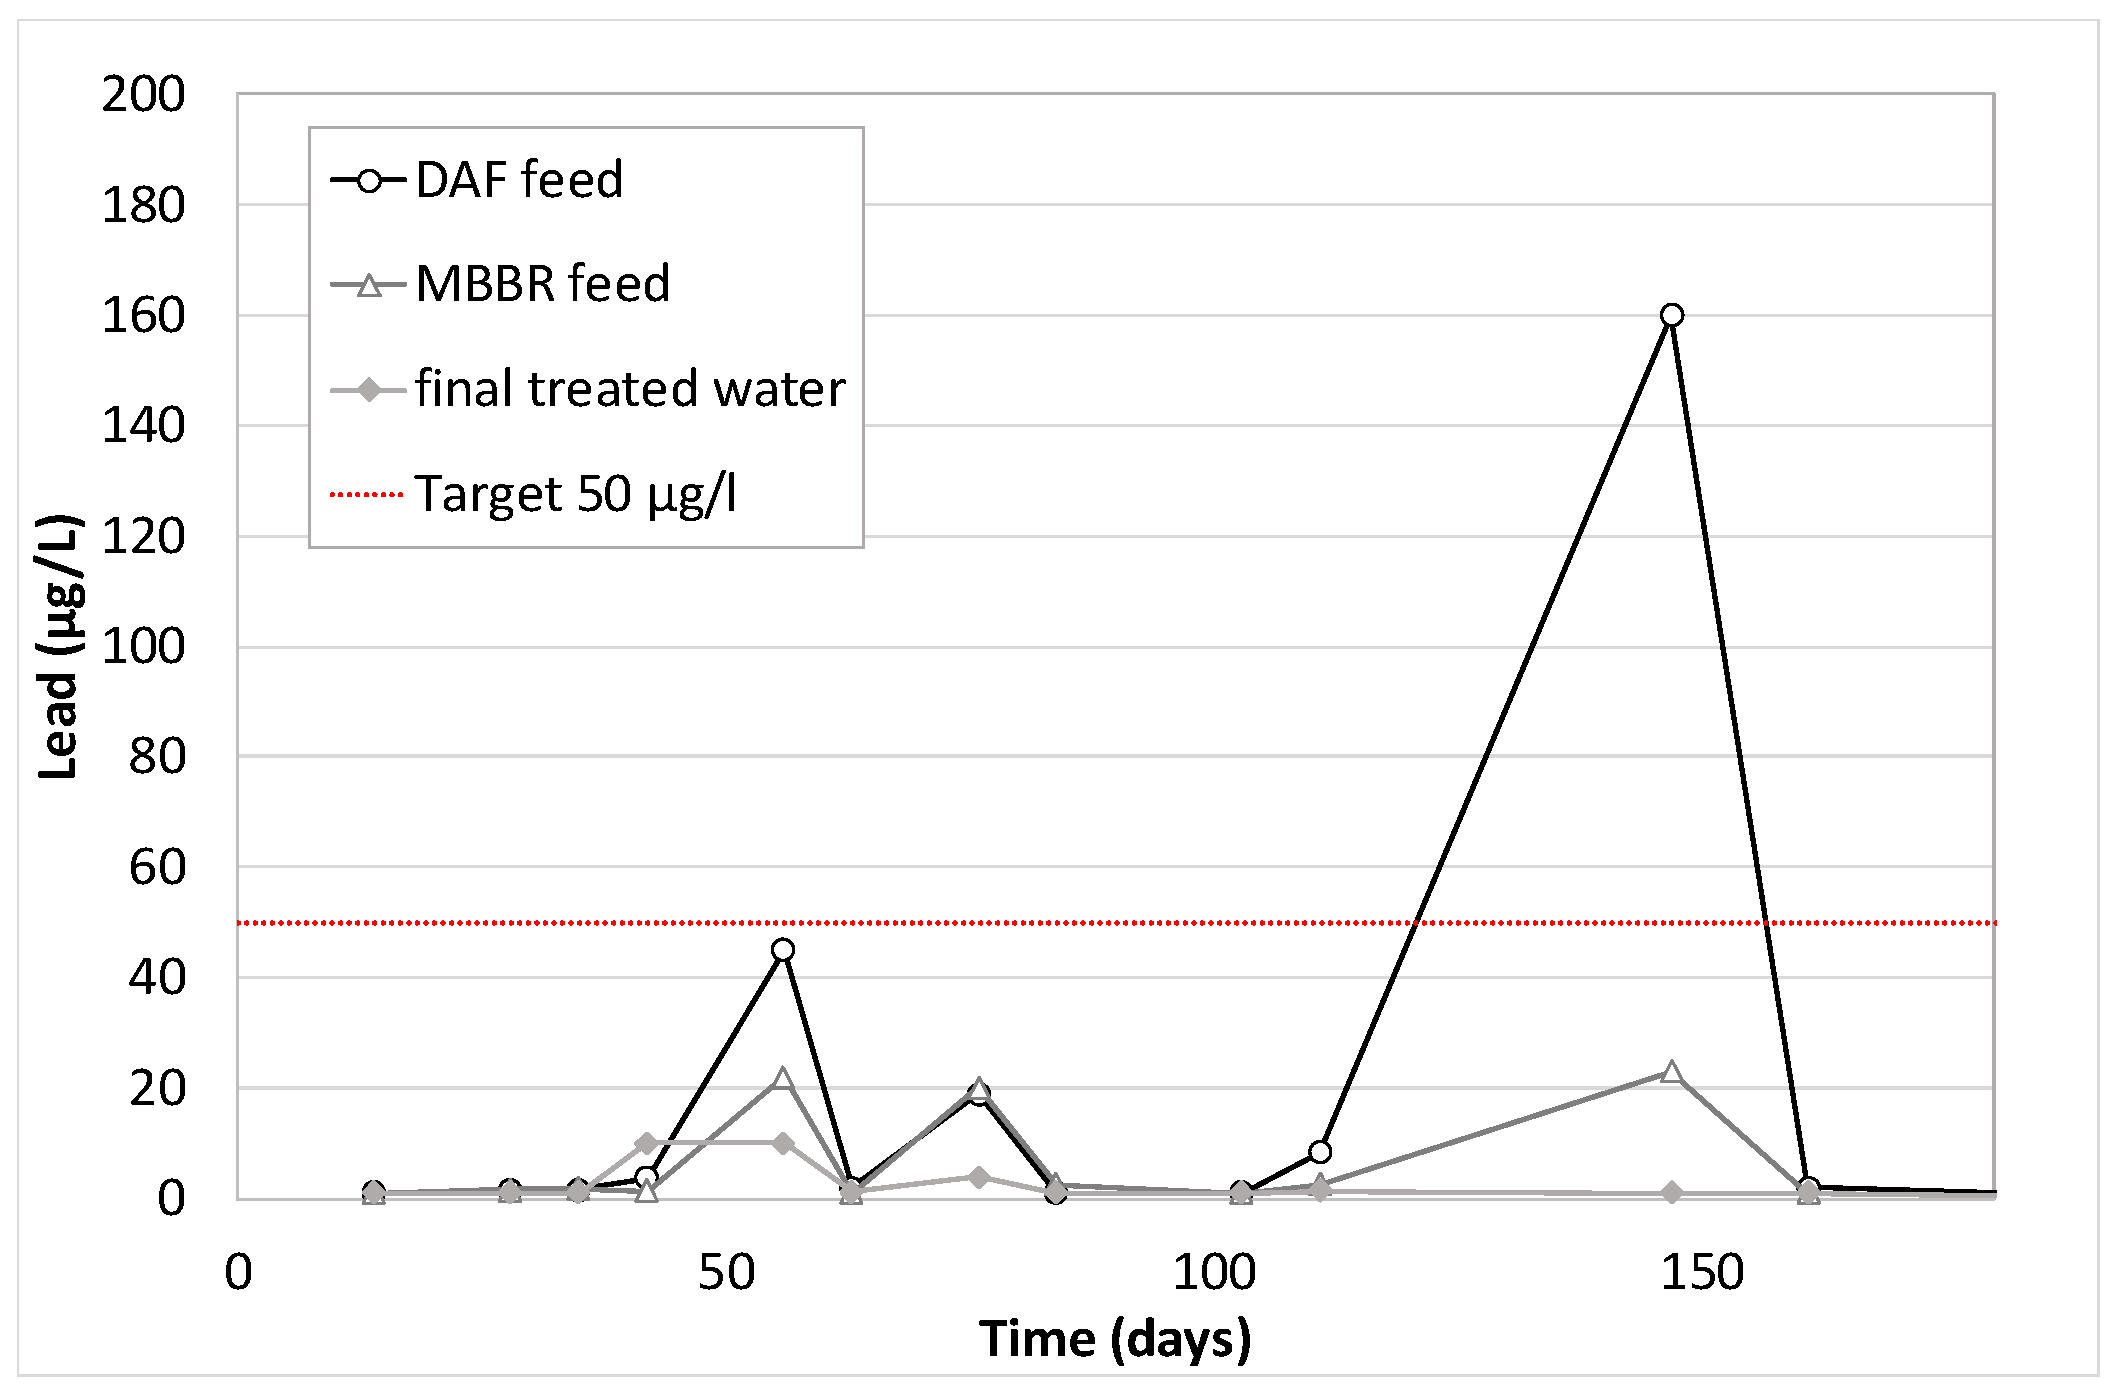
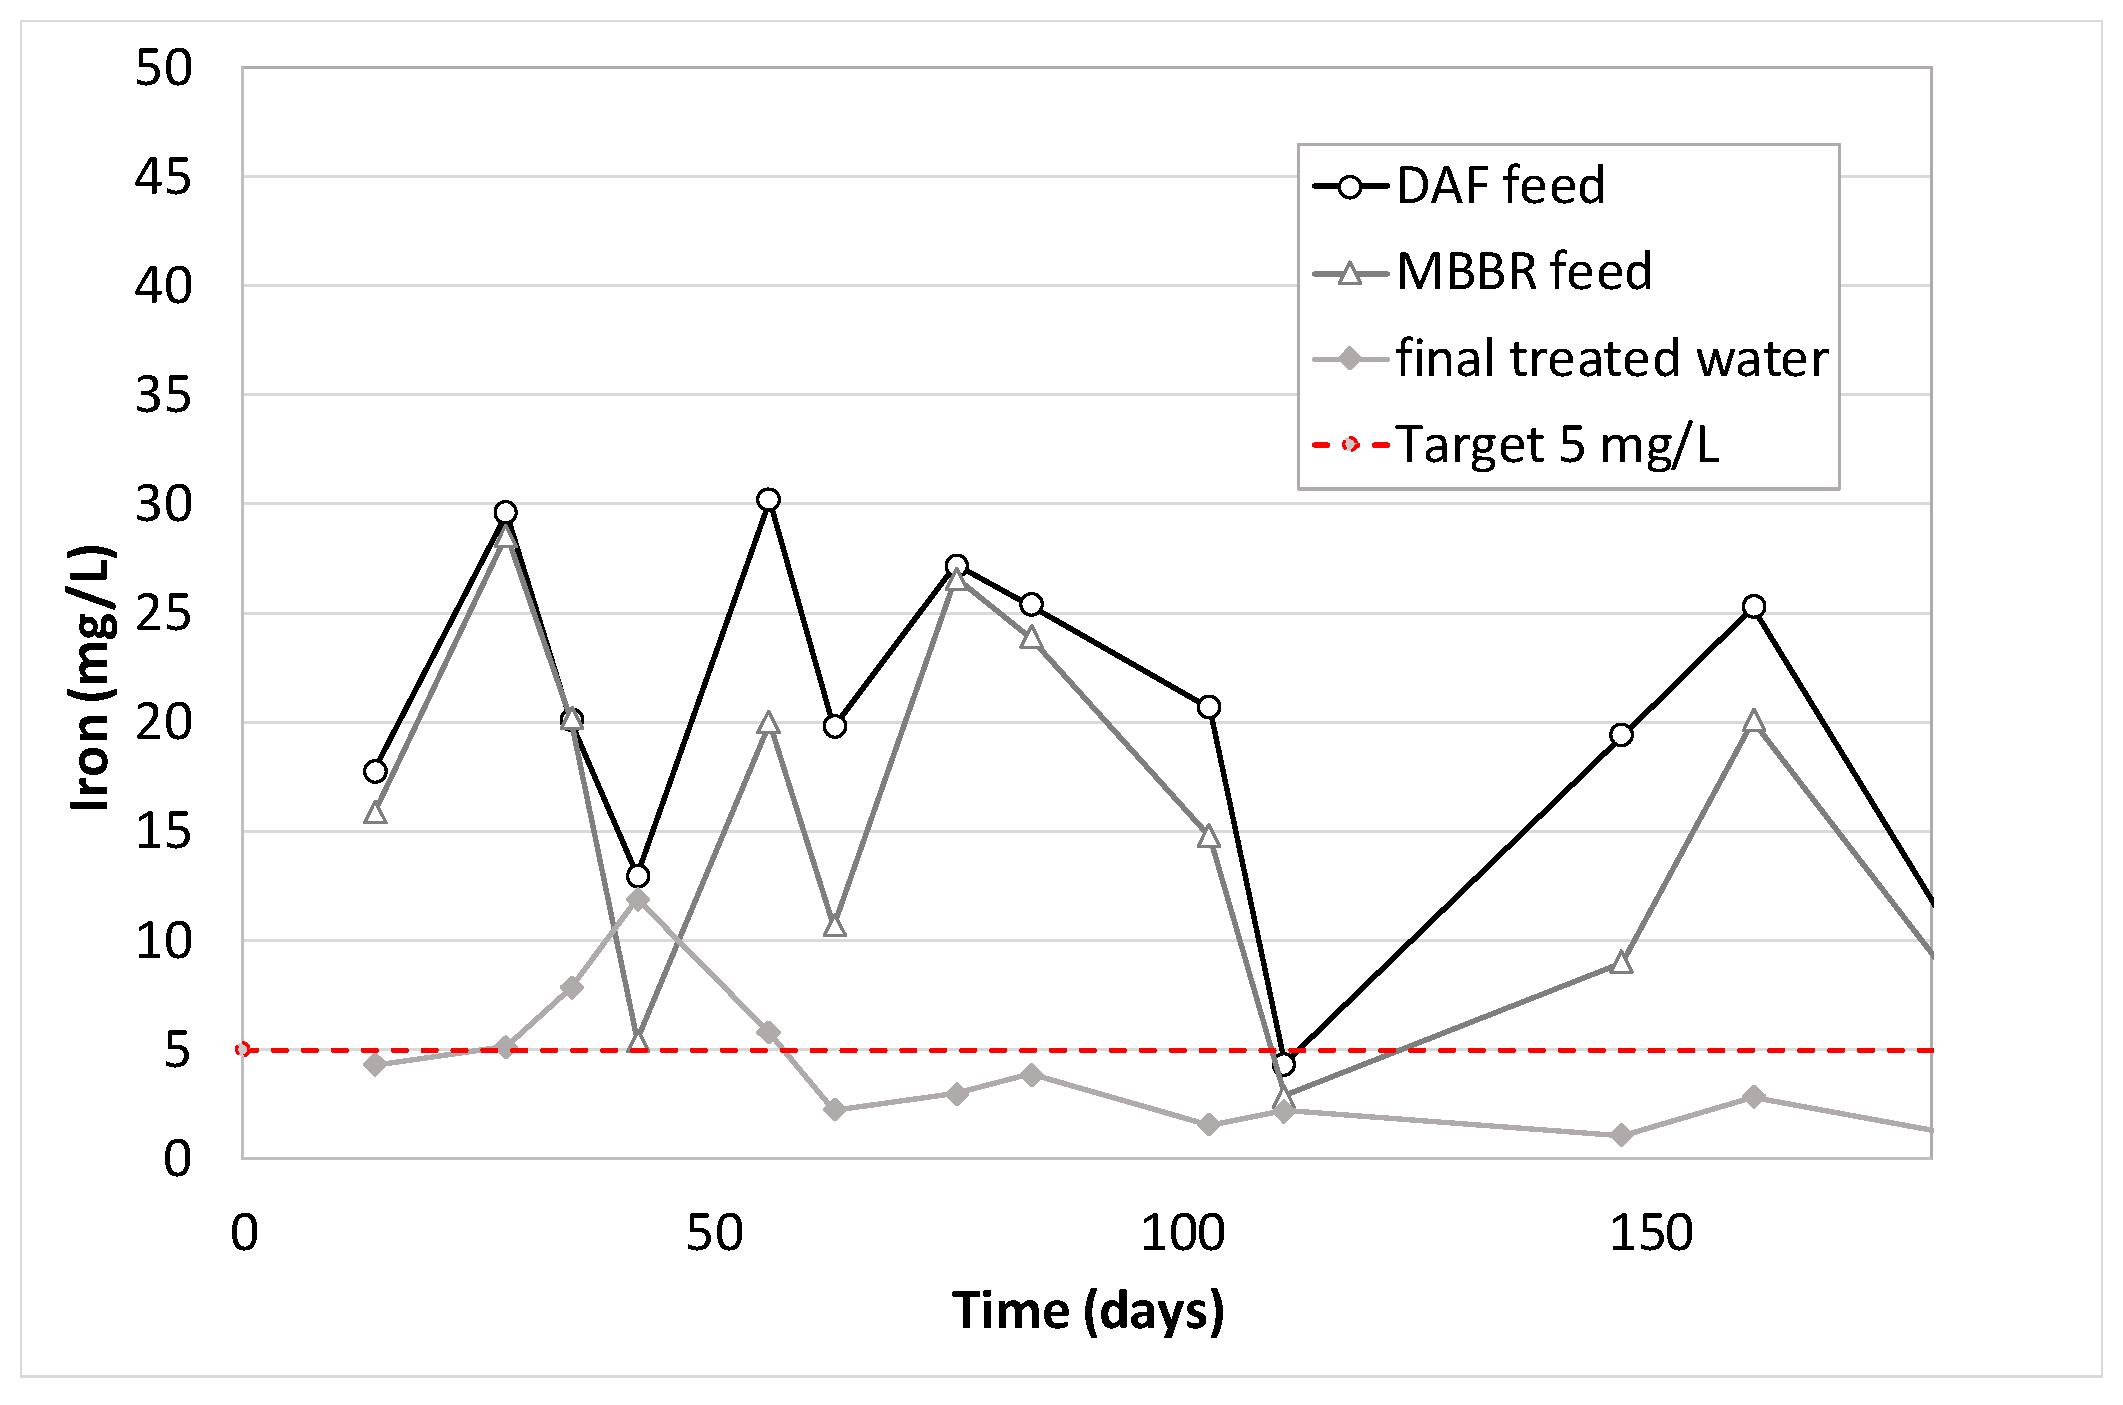
3.3.3. The Impact on Metals as They Go through the BIOMEM Pilot Unit

A few metals were analyzed weekly during the operation of the pilot unit: Barium, Arsenic, Cadmium, Chromium & Hexavalent Chromium, Mercury, Nickel, Zinc, Lead, Copper, Iron, Aluminum and Vanadium. Among all these substances, only Barium (Figure 15), Zinc (Figure 16), Lead (Figure 17), Iron (Figure 18) and Aluminum (Figure 19) were present in quantifiable amounts. The figures below show the evolution of their concentration versus time.
As for Zinc, Aluminum, Lead and Iron, high discrepancies on the analytical results are observed. Generally, it can be concluded that their removal is not 100% guaranteed, but the final treated water often contains low values compared to the feed. It is due either to precipitation (with oxygen from air), coagulation and floatation in the DAF (which is very obvious for lead on Figure 17) or to co-adsorption on the biological flocs in the MBBR. The combination of the two effects gave average removal efficiencies of 73% for Aluminum, 87% for lead, 67% for Zinc and 81% for Iron (similar to that obtained in an MBR study [20]).

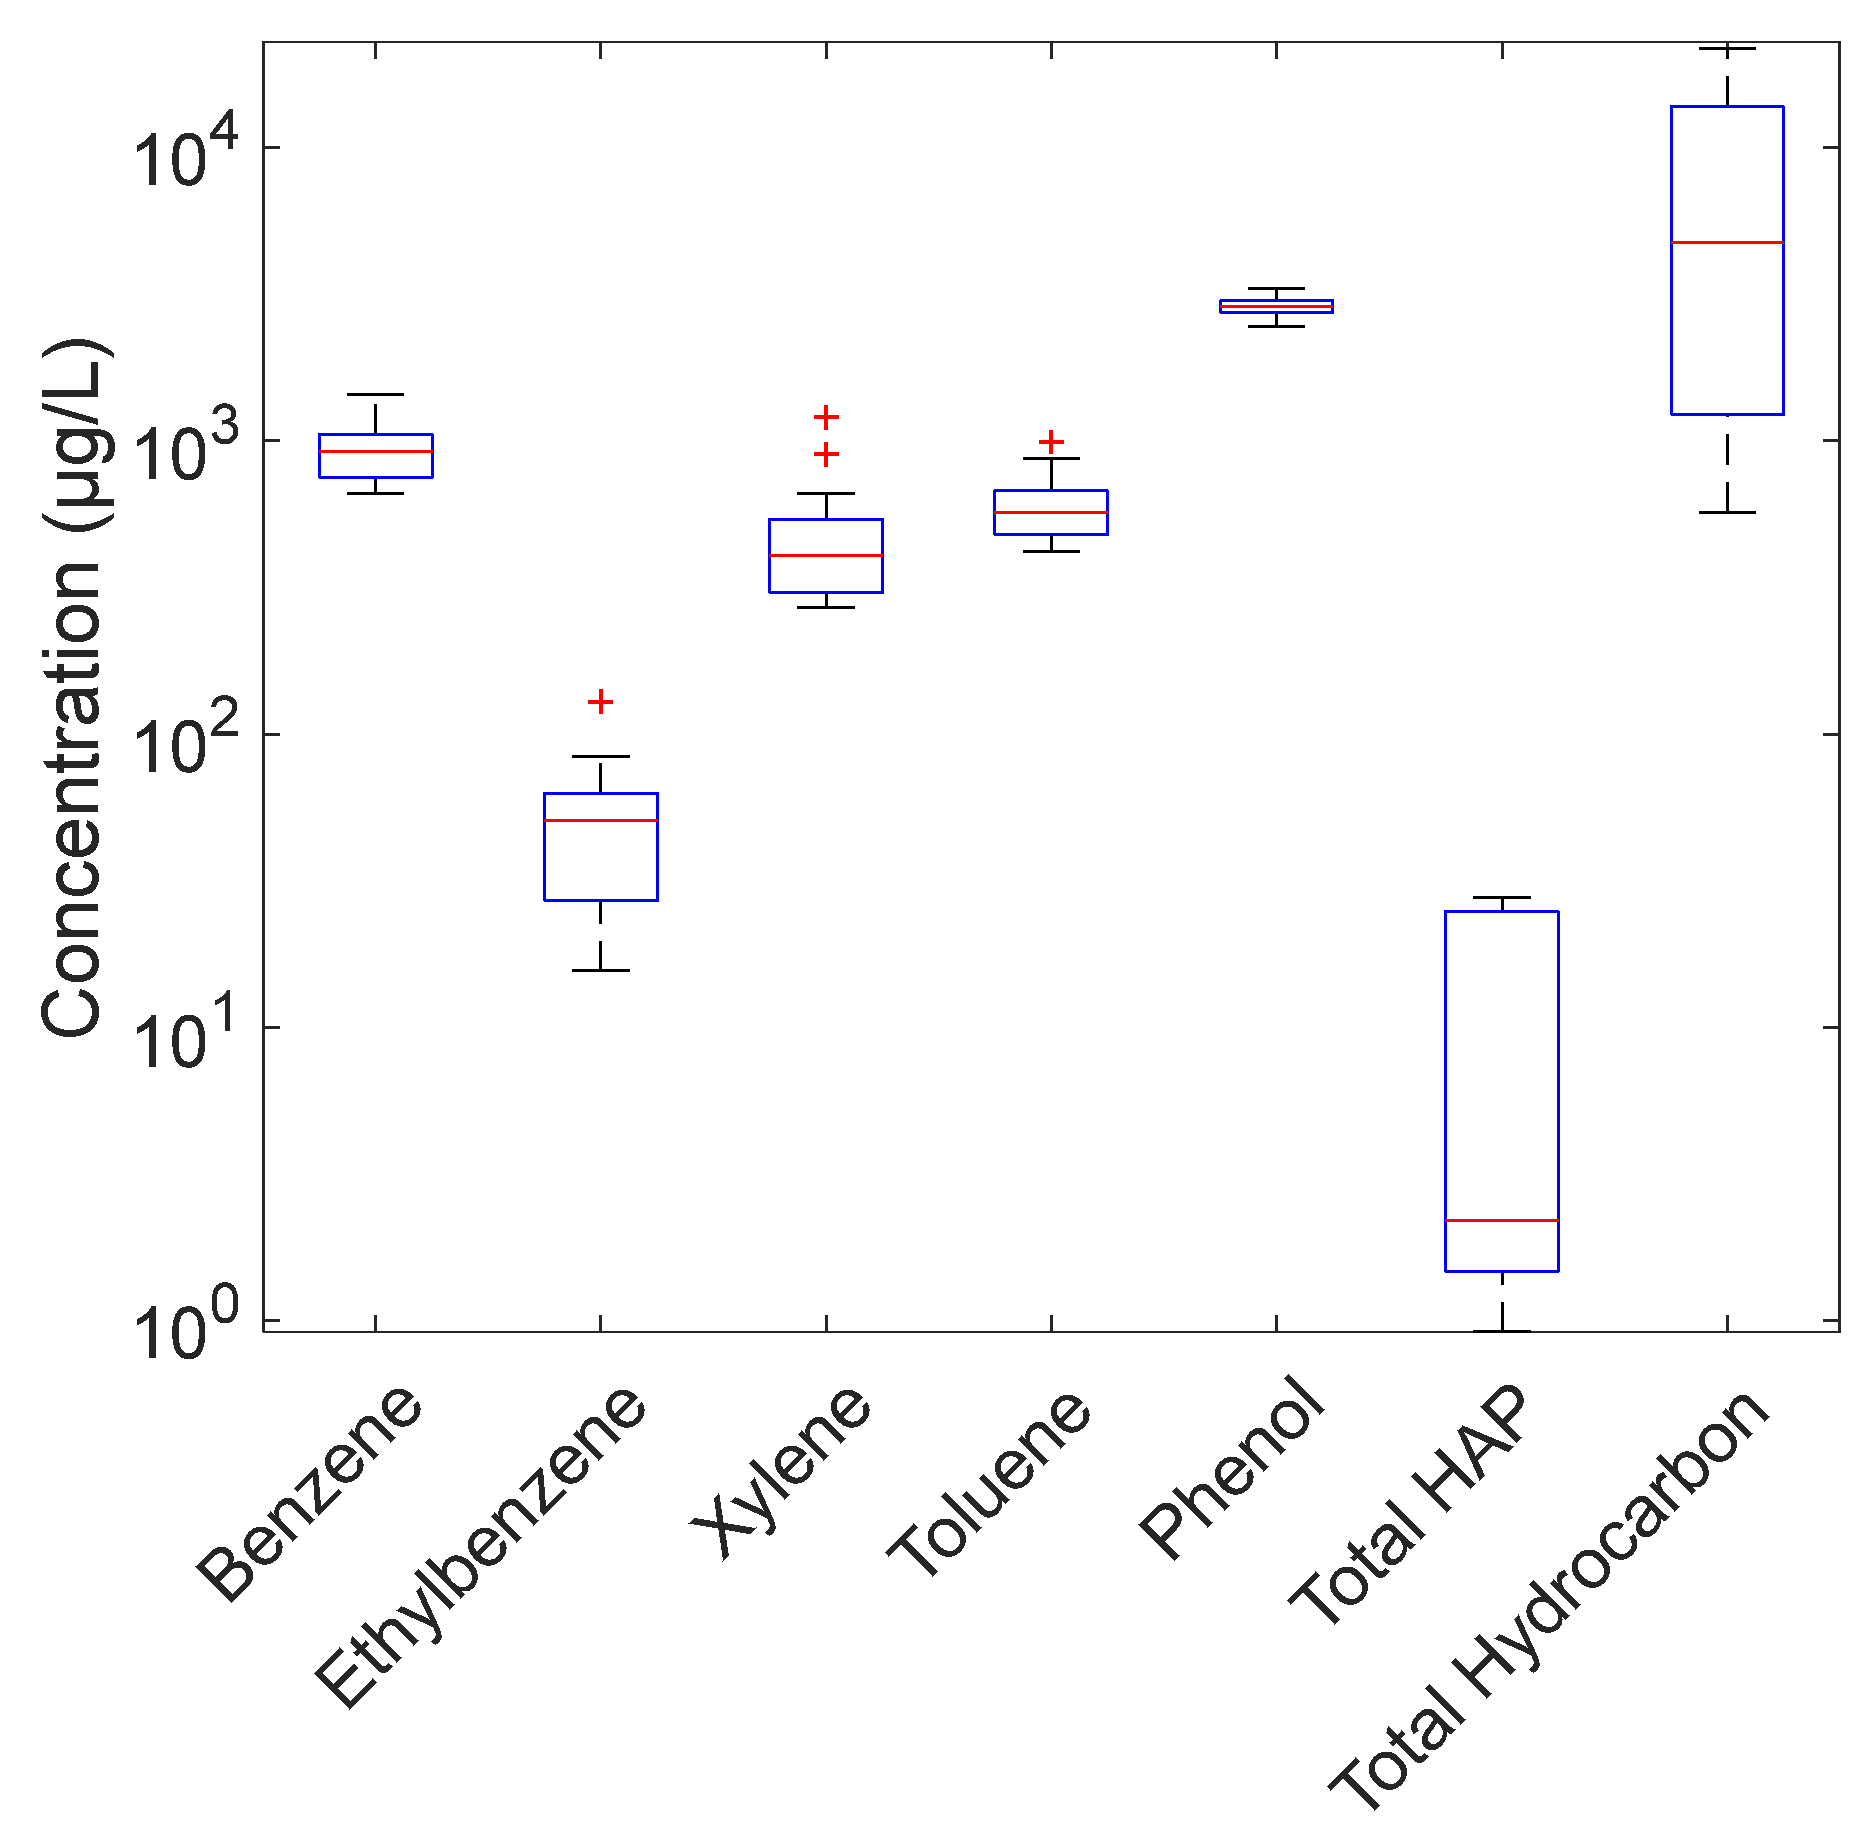
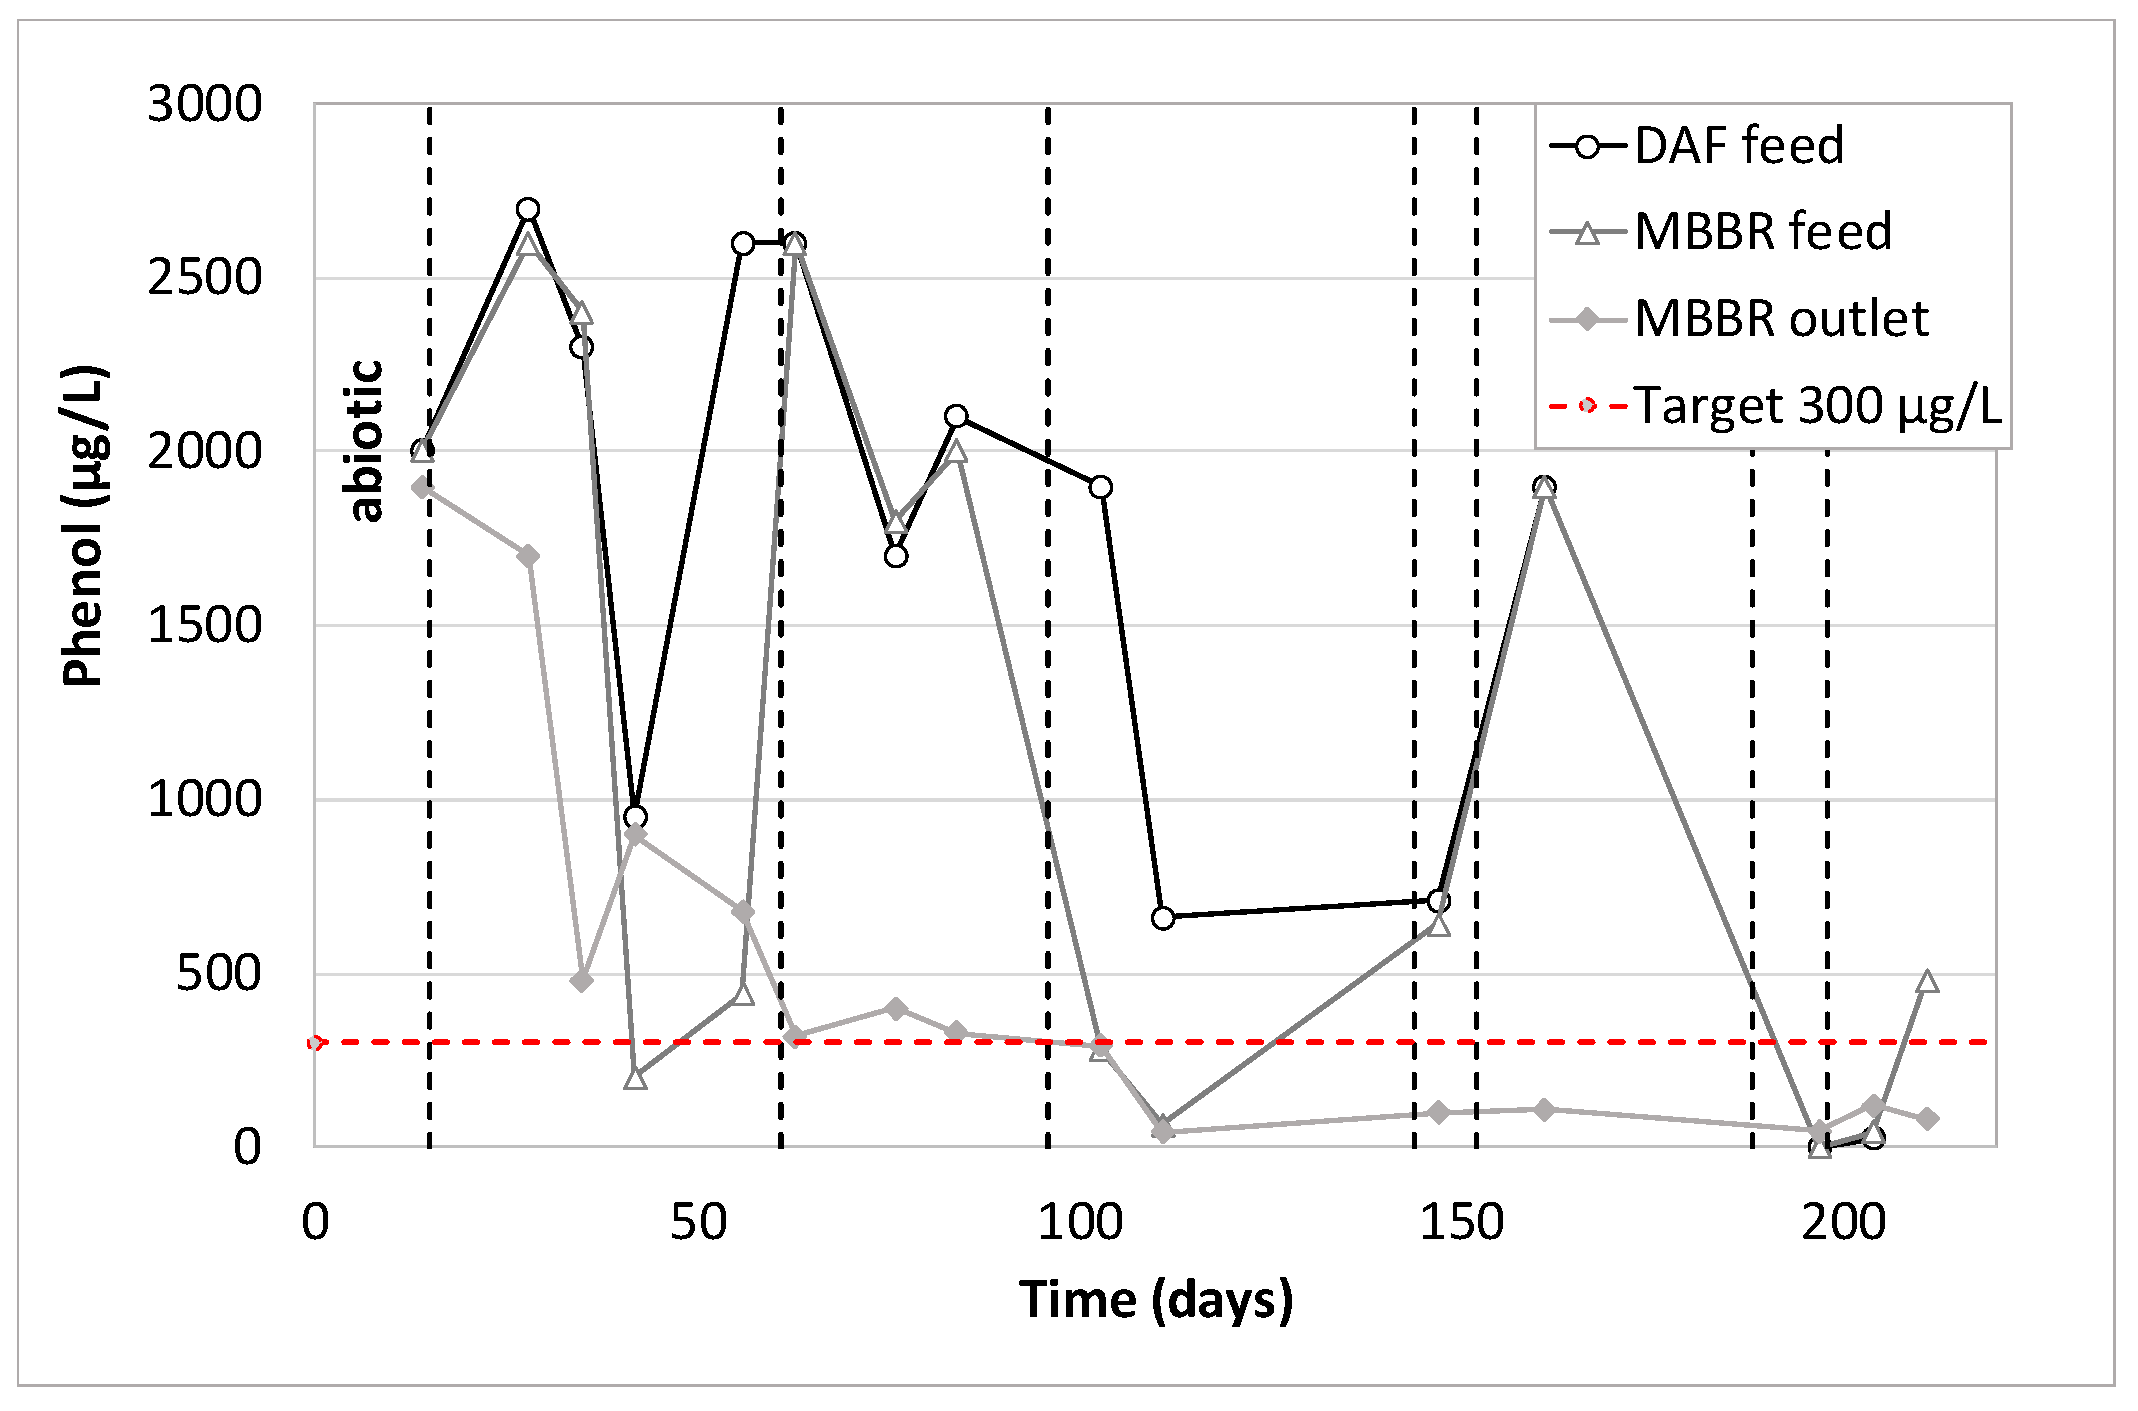
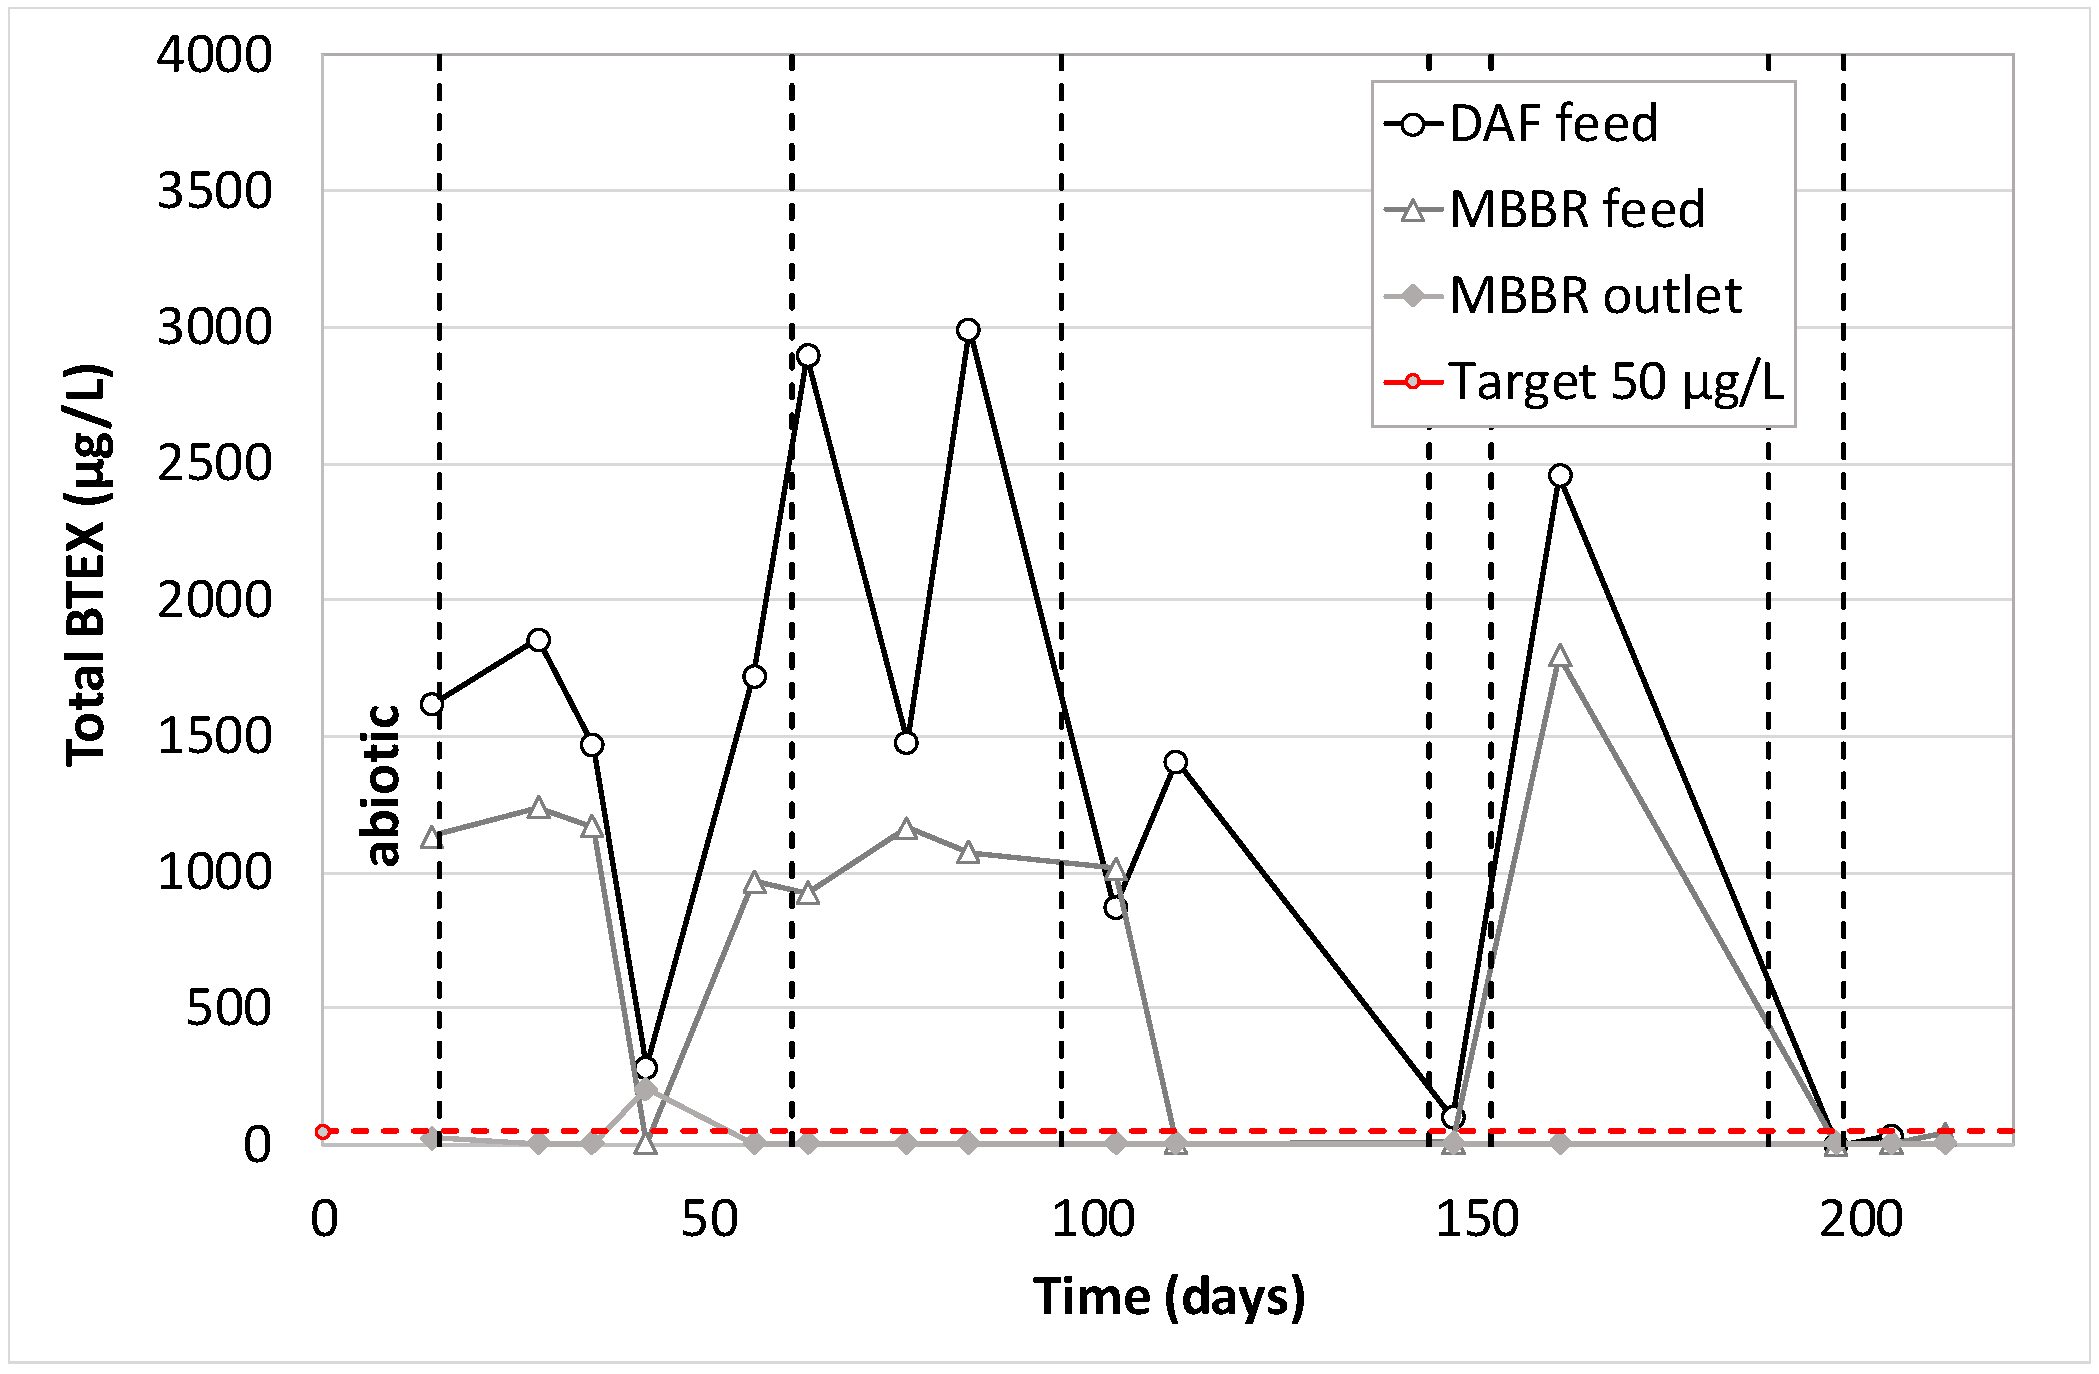
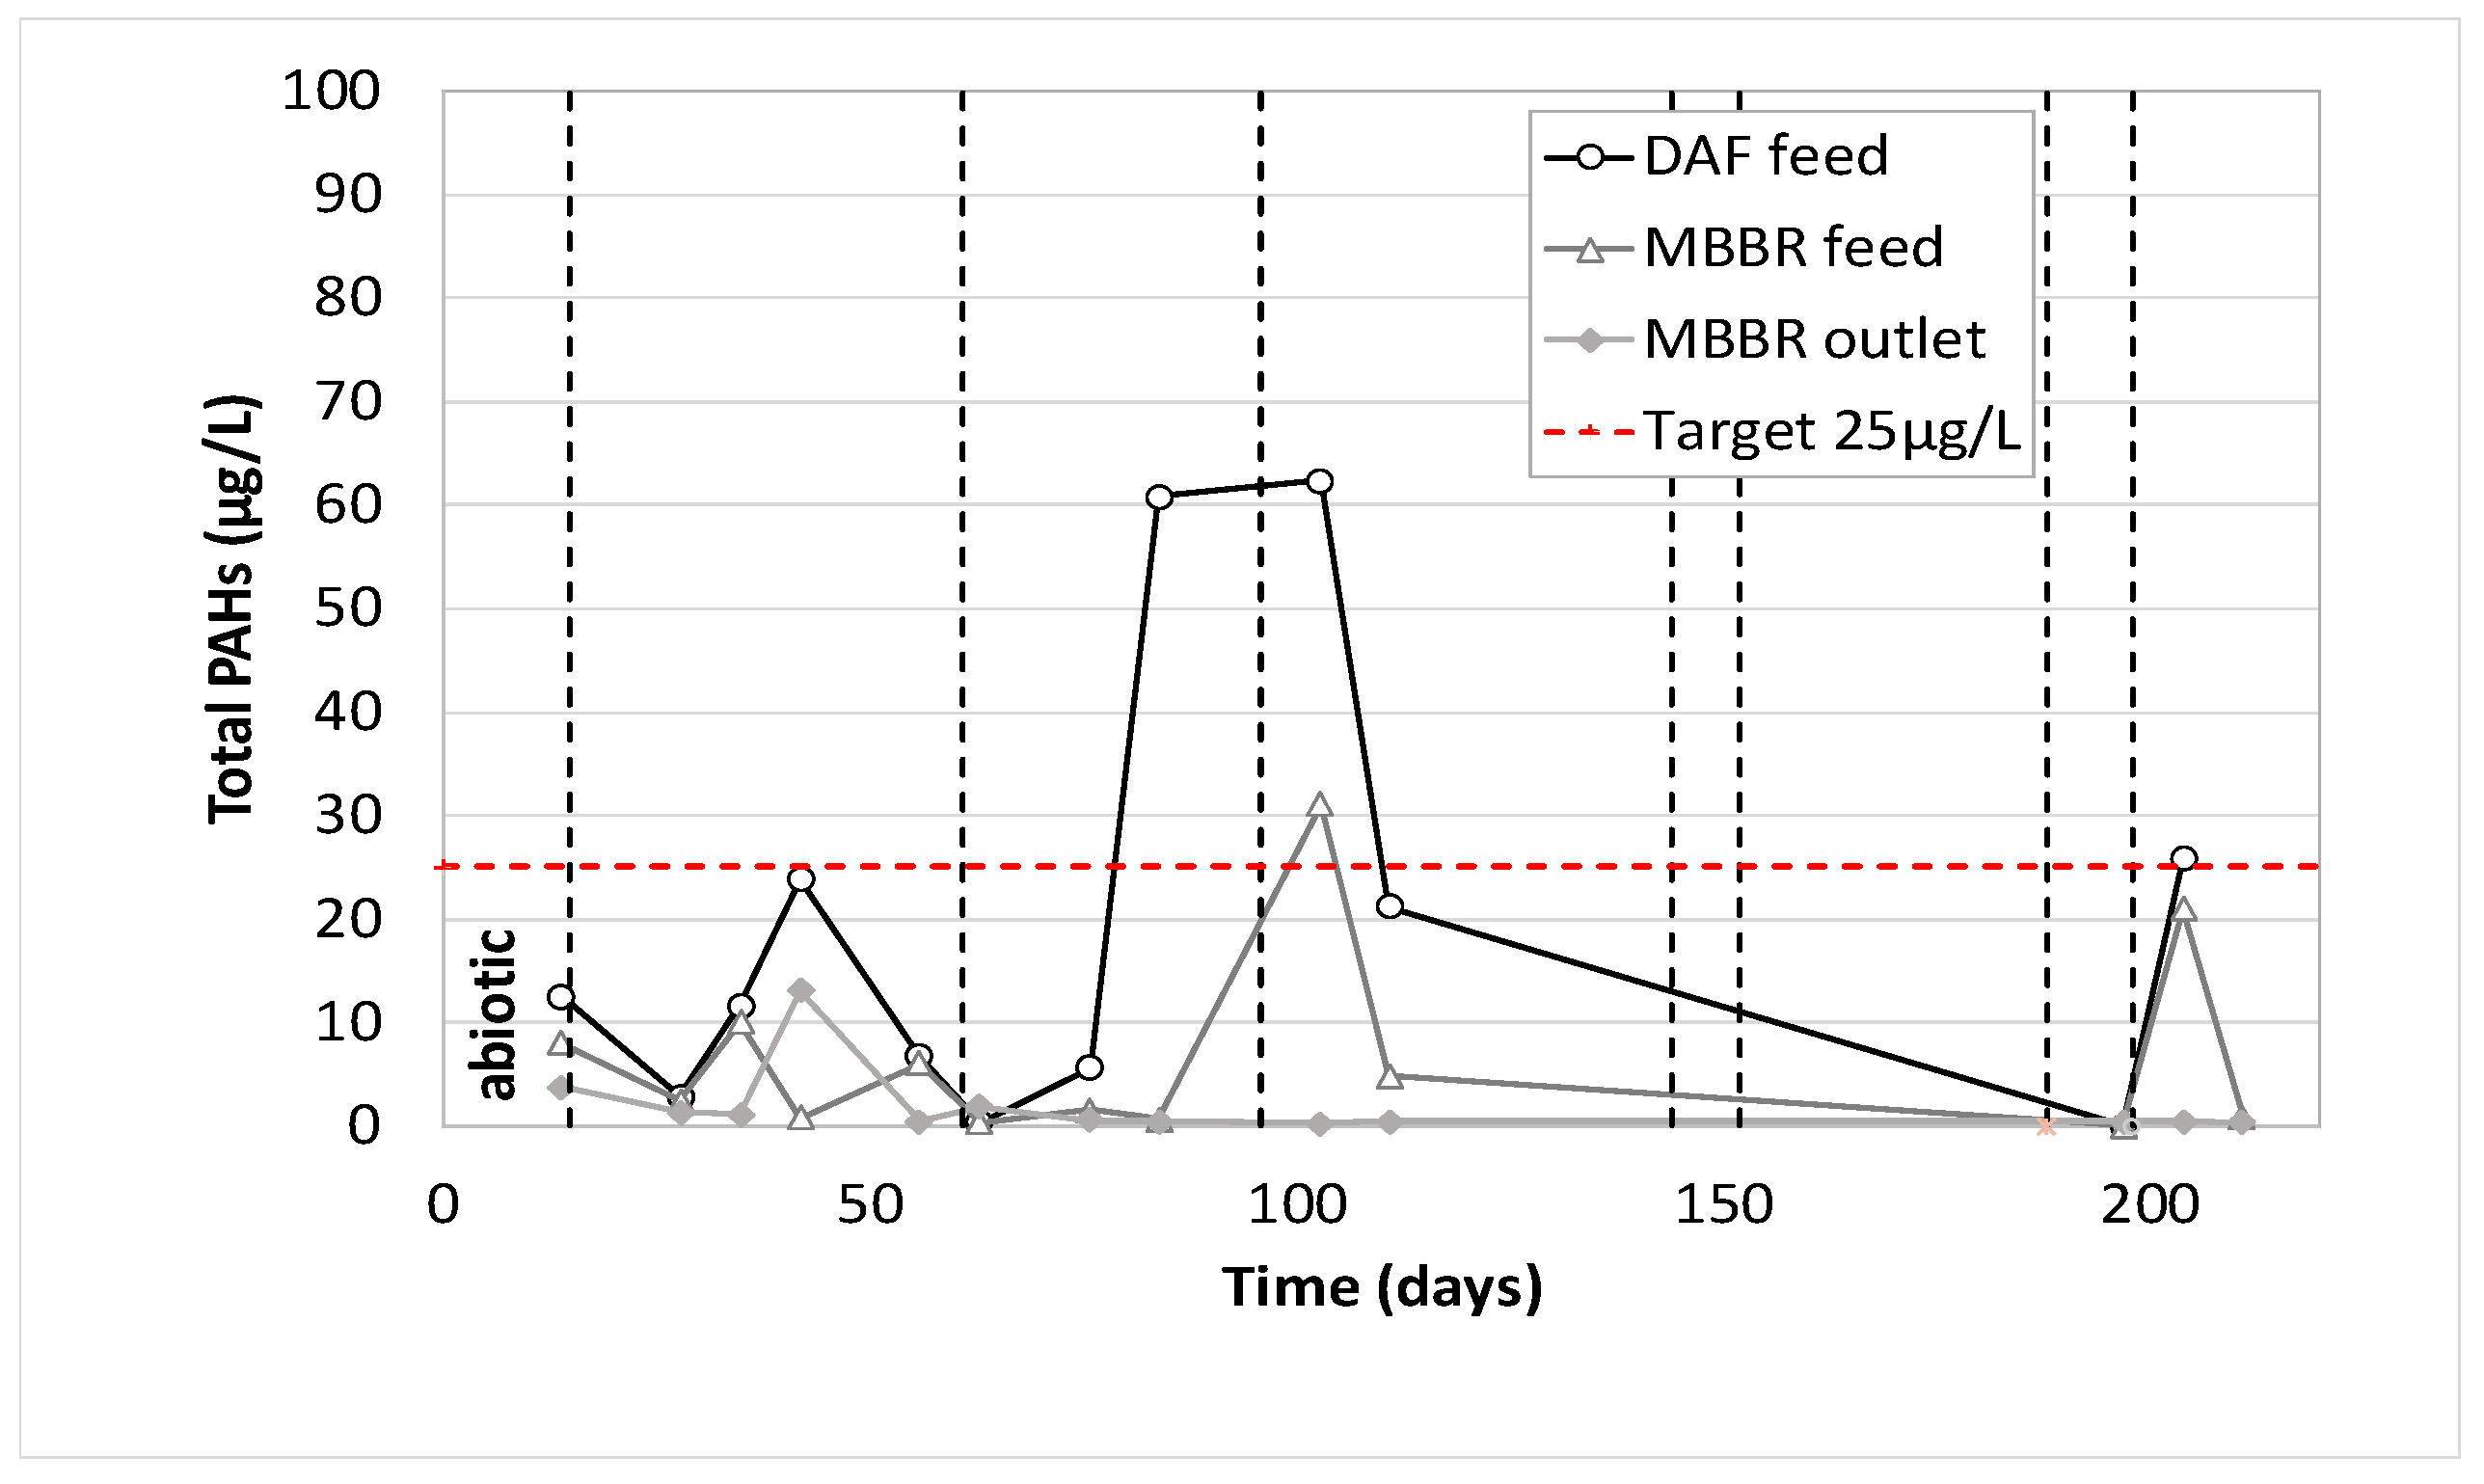
3.3.4. The Impact on Organic Micropollutants as They Go through the BIOMEM Pilot Unit

Figure 20, Figure 21 and Figure 22 present the concentration of three main families of organic micropollutants (phenol, PAHs and BTEX) at three different pilot locations (DAF feed, MBBR feed and MBBR outlet).
As mentioned previously, the first analytical data (day 14) corresponds to the operation of the biological MBBR during abiotic conditions. It can be seen that phenols were not removed by either DAF or MBBR. PAHs were partially removed by DAF and MBBR when BTEX were totally removed by the combination of these two processes. As expected, the operation during biotic conditions gave the same results for BTEX. They were totally removed, whatever the pilot operating conditions, with an average BTEX concentration in the treated water lower than the quantification limit (7.5 µg/L), for an average of 1370 µg/L at the pilot inlet. As for phenols, the action of acclimated biofilm was evident since the pilot reached an average removal efficiency of 66%, and often above 80% when the pilot was well stabilized. As for PAHs, the combined action of DAF and MBBR allow us to reach PAHs concentration very often below 1 µg/L for feed concentration ranging from 2 up to 60 µg/L.

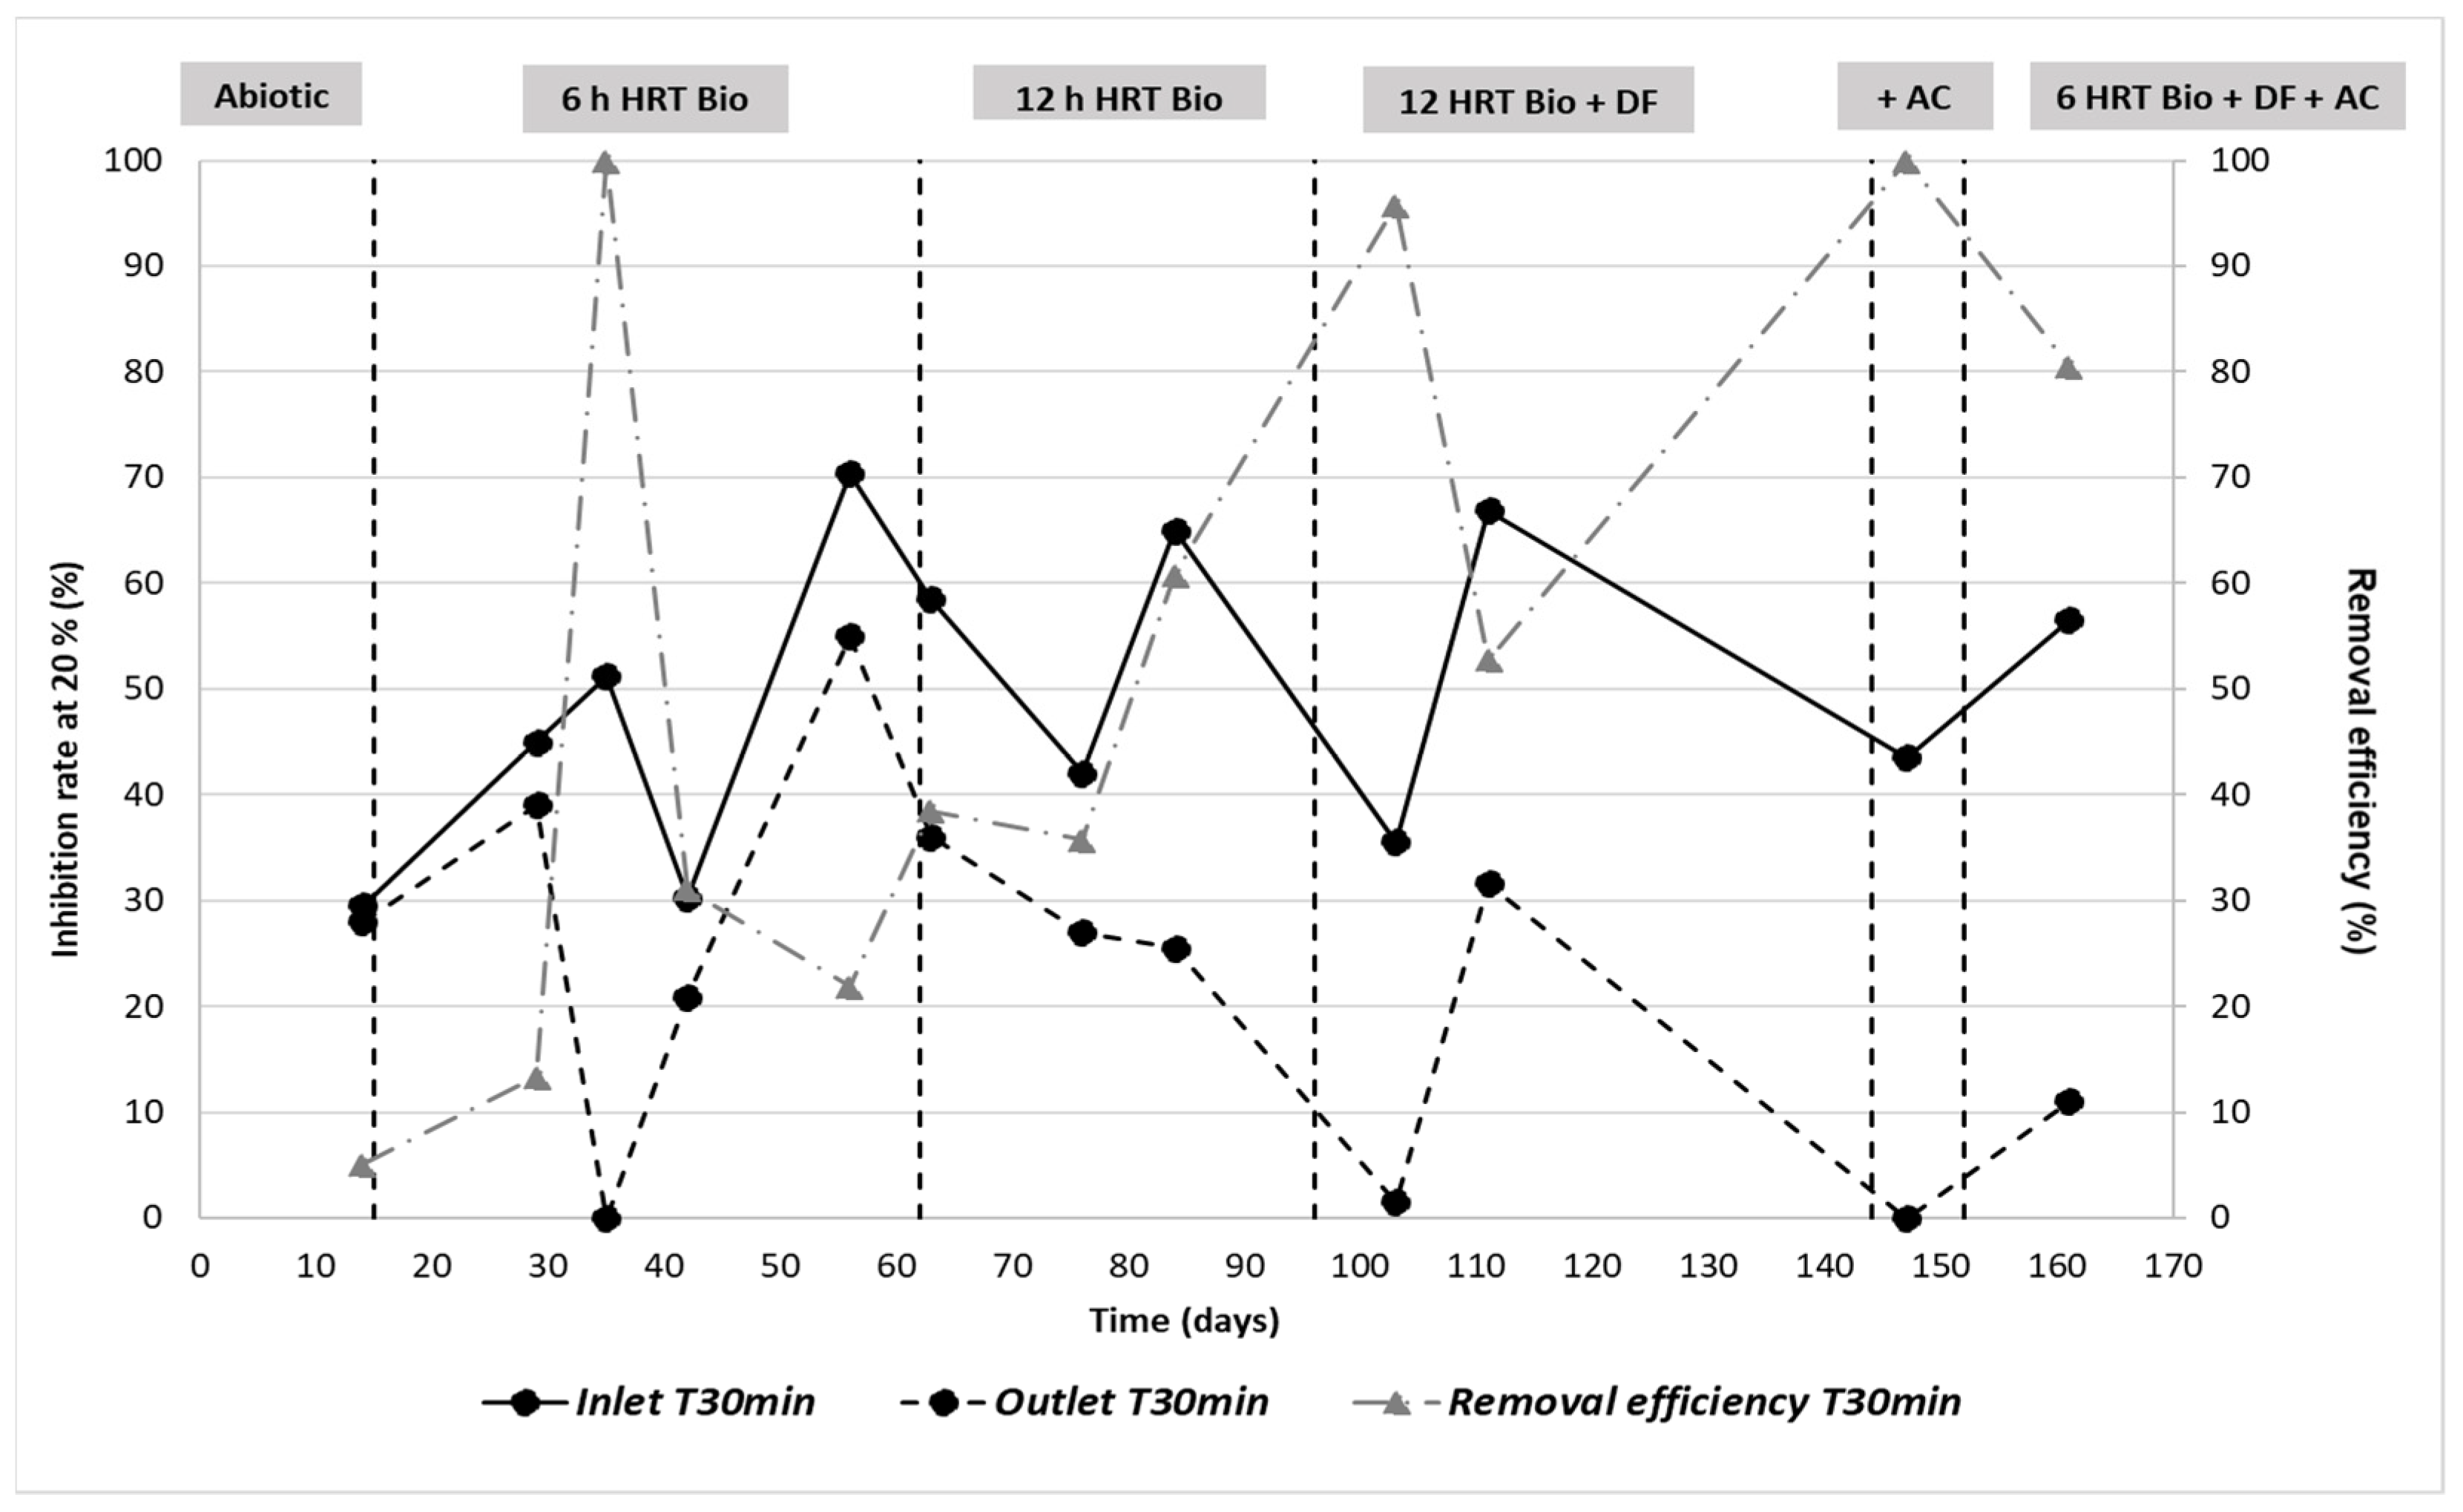
3.3.5. Impact of the BIOMEM Unit on Toxicity Reduction

Due to high salinity, the samples were diluted by a factor 5 in order to stay within the salinity tolerance limits of bacteria. This was not the case for Artemia salina because of its wide salinity tolerance range (Vanhaecke 1984).
Figure 23 shows results obtained on bacteria. The inlet inhibition rates vary from 30% up to 70%. This could be explained by the variation in the substance concentrations over time (hydrocarbons, PAHs, phenols, BTEX, metals, in particular zinc, lead and iron). The toxicity peaks (day 56, 84 and 111, see Figure 23) correspond to the highest concentrations of phenols, BTEX, and PAHs (respectively Figure 20, Figure 21 and Figure 22). However, they diverge from the highest metal concentrations (see Figure 17, Figure 18 and Figure 19) that are generally observed at 150 days. Another hypothesis would tend to attribute the observed toxicity to other families of substances that were not analyzed during that pilot trial, such as process additives, for example.
The outlet toxicity is generally lower than at the inlet. The removal efficiency increases over time and appears to be very high (>95%) at 35, 103 and 147 days. This seems consistent with the experimental design applied and with the observed reduction of COD. Effectively, the higher the hydraulic retention time in the MBBR and the longer the acclimation phase, the greater the toxicity reduction. Nevertheless, some exceptions are observed, such as the decrease in the removal efficiency observed in phase 6 (161d), which could be explained by the decrease in the retention time (HRT from 12 h to 6 h) and the increase in the OLR (Organic Loading Rate). Furthermore, the decrease in removal efficiency observed at 111 days can be explained by the increase in toxicity at the inlet. In fact, although the toxicity drop between inlet and outlet is similar at 103 and 111 days (a difference of 34.5% and 35.3%, respectively), the reduction is greater at 103 days because the outlet toxicity tends towards zero (inhibition rate of 1.5%). Moreover, the 100% decrease observed at 35 days (phase 2) could be explained by the decrease in substance concentration (in particular PAHs, zinc, iron and COD).
Finally, none of the samples showed any toxicity on artemia (EC50 > 90%). Thus, bacteria seem to be more sensitive to the content of the produced water than artemia.

4. Conclusions

This paper presented the results obtained during the treatment of a highly saline water (100 g/L) from a field, using a moving bed bioreactor (MBBR) over 8 months of continuous operation.
After a few months of efficient acclimation of the biofilm carriers, using a buffer basin sedimented sludge inoculum (used on anoxic saline produced water), the results demonstrated that it was possible to run the MBBR pilot on such highly saline complex waters at reasonable residence times, thereby making it a suitable solution for offshore applications. More than 90% of the biological oxygen demand, 50% of total organic carbon and 35% of the chemical oxygen demand were removed at 1 h residence at a maximum organic loading rate of 12 kgCOD.m−3.day−1. These values reached more than 95%, 80% and 60%, respectively, after 12 h residence time. In terms of dissolved substances removal, the metals (mainly Zinc, Iron, Aluminum and Lead) are significantly removed through the flotator (precipitation with oxygen) and the bioreactor (co-adsorption on the biological flocs), reaching removal efficiencies of between 65 and 80%. For organic dissolved substances, BTEX were removed mainly by stripping in the DAF and MBBR. PAHs were partly removed by DAF and then polished in the MBBR. As for phenols, the stripping efficiency in the DAF was very low, so those compounds were mainly removed by biological reaction in the MBBR.
Finally, more than the removal efficiency, it is important to highlight the robustness of such a process. The presence of acclimated biofilm properly attached to biofilm carriers prevents the washing of biomass during anomalous phases (peak of pollution, shutdowns, etc). During the 8 months of operation, we often faced variations in the feed composition, many shutdowns with sometimes more than 10 days without any possibility of aerating the bioreactor. Whatever the conditions, the MBBR restarted very efficiently and was able to deliver water with less than 30 mg/L TOC and BOD in less than 3 days of recovery, which would never have been possible with conventional activated sludge.
High removal performance, robustness and low footprint are key for offshore applications. The results of this study show that such a biological solution could be applied for treating very complex produced waters offshore, at a quality level far higher than what is commonly achieved today and at far lower costs than with competitive technologies (such as activated carbon, macroporous polymer extraction and oxidation).

Author Contributions

M.J.: validation, investigation, conceptualization, writing and review—original draft; B.S.: methodology, analysis and operation, M.-C.L.: supervision, analysis and investigation, C.S.: supervision, investigation and review; E.h.I.N.: investigation and writing—review & editing; P.B.-A.: validation, investigation, conceptualization and review; F.P.: financial support, validation, supervision and review. All authors have read and agreed to the published version of the manuscript.

Funding

This work is incorporated in the PW management project funded by TotalEnergies R&D program.

Institutional Review Board Statement

Not applicable.

Informed Consent Statement

Not applicable.

Data Availability Statement

All the data are described in Figures and Tables.

Acknowledgments

This work is incorporated in the PW management project funded by TotalEnergies R&D program, which we thank for their support along with the operating site (in Gabon).

Conflicts of Interest

The authors declare that they have no conflict of interest.

List of Abbreviations

CODChemical Oxygen Demand
BODBiological Oxygen Demand
TOCTotal Organic Carbon
PWProduced Water
OSPAROslo PARis Convention
WEAWhole Effluent Assessment
TDSTotal Dissolved Solids
TSSTotal Suspended Solids
SBRSequencing Batch Reactor
HRTHydraulic Retention Time
MBBRMoving Bed Biofilm Reactor
BTEXBenzene, Toluene, EthylBenzene, Xylene
PAHsPolycyclic Aromatic Hydrocarbons
APIAmerican Petroleum Institute (design rules)
DAFDissolved Air Floatation
GACGranular Activated Carbon

References

  1. Fakhru’l-Razi, A.; Pendashteh, A.; Abdullah, L.C.; Biak, D.R.A.; Madaeni, S.S.; Abidin, Z.Z. Review of technologies for oil and gas produced water treatment. J. Hazard. Mater. 2009, 170, 530–551. [Google Scholar] [CrossRef] [PubMed]
  2. Nasiri, M.; Jafari, I.; Parniankhoy, B. Oil and gas produced water management: A review of treatment technologies, challenges and opportunities. Chem. Eng. Commun. 2017, 204, 990–1005. [Google Scholar] [CrossRef]
  3. Global Water Intelligence GWI. Global Produced Water Volumes. 2020. Available online: https://www.producedwatersociety.com/resources/chart-data (accessed on 1 January 2020).
  4. Pedenaud, P.; Baldoni-Andrey, P.; Breton, A.; Segues, B.; Demangel, A.; Jacob, M. Improving Produced Water Quality Discharge into the Sea by Using Hungry Bacteria. In Proceedings of the SPE International Health, Safety & Environment Conference, Abu Dhabi, United Arab Emirates, 16 April 2018; Society of Petroleum Engineers: Abu Dhabi, United Arab Emirates, 2018. [Google Scholar] [CrossRef]
  5. Pedenaud, P.; Evans, W.; Heng, S.; Bigeonneau, D. Ceramic Membrane and Core Pilot Results for Produced Water Management. In Proceedings of the Offshore Technolgy Conference, Rio de Janeiro, Brazil, 14–17 June 2011. [Google Scholar] [CrossRef]
  6. Garland, E.; Prunier, A. Aqueous discharges from E&P installations: Current technical and regulatory challenges from an operator’s point of view. In Proceedings of the SPE Annual Technical Conference and Exhibition, San Antonio, TX, USA, 24–27 September 2006. [Google Scholar] [CrossRef]
  7. Ghafoori, S.; Omar, M.; Koutahzadeh, N.; Zendehboudi, S.; Malhas, R.N.; Mohamed, M.; Al-Zubaidi, S.; Redha, K.; Baraki, F.; Mehrvar, M. New advancements, challenges, and future needs on treatment of oilfield produced water: A state-of-the-art review. Sep. Purif. Technol. 2022, 289, 120652. [Google Scholar] [CrossRef]
  8. Lusinier, N.; Seyssiecq, I.; Sambusiti, C.; Jacob, M.; Lesage, N.; Roche, N. Biological Treatments of Oilfield Produced Water: A Comprehensive Review. Soc. Pet. Eng. J. 2019, 24, 2135–2147. [Google Scholar] [CrossRef]
  9. OSPAR Commission. Risk-Based Approach to the Management of Produced Water Discharges from Offshore Installations. 2013. Available online: https://www.ospar.org/site/assets/files/1880/ospar_factsheet_rba_2013.pdf (accessed on 1 January 2013).
  10. Dores, R.; Hussain, A.; Katebah, M.; Adham, S.S. Using advanced water treatment technologies to treat produced water from the petroleum industry. In Proceedings of the SPE International Health, Safety & Environment Conference, Perth, Australia, 11–13 September 2012. [Google Scholar]
  11. Lefebvre, O.; Moletta, R. Treatment of organic pollution in industrial saline wastewater: A litterature review. Water Res. 2006, 40, 3671–3682. [Google Scholar] [CrossRef] [PubMed]
  12. Pendashteh, A.R.; Abdullah, L.C.; Fakhru’l-Razi, A.; Madaeni, S.S.; Zainal Abidin, Z.; Awang Biak, D.R. Evaluation of membrane bioreactor for hypersaline oily wastewater treatment. Process Saf. Environ. Prot. 2011, 90, 45–55. [Google Scholar] [CrossRef]
  13. Sun, C.; Leiknes, T.; Weitzenböck, J.; Thorstensen, B. Salinity effect on a biofilm-MBR process for shipboard wastewater treatment. Sep. Purif. Technol. 2010, 72, 380–387. [Google Scholar] [CrossRef]
  14. Baldoni-Andrey, P.; Pedenaud, P.; Dehaene, P.-L.; Segues, B. Impact of high salinity of produced water on the technical feasibility of biotreatment for e & p on shore applications. In Proceedings of the SPE International Health, Safety & Environment Conference, Abu Dhabi, United Arab Emirates, 2–4 April 2006. [Google Scholar] [CrossRef]
  15. Dong, Z.; Lu, M.; Huang, W.; Xu, X. Treatment of oilfield wastewater in miving bed biofilm reactors using a novel suspended ceramic biocarrier. J. Hazard. Mater. 2011, 196, 123–130. [Google Scholar] [CrossRef] [PubMed]
  16. Sharghi, E.A.; Bonakdarpour, B. The study of organic removal efficiency and halophilic bacterial mixed liquor characteristics in a membrane bioreactor treating hypersaline produced water at varying organic loading rates. Bioresour. Technol. 2013, 149, 486–495. [Google Scholar] [CrossRef] [PubMed]
  17. Abbas, M.; Adil, M.; Ehtisham-ul-Haque, S.; Munir, B.; Yameen, M.; Ghaffar, A.; Abbas Shar, G.; Tahir, M.A.; Iqbal, M. Vibrio fischeri bioluminescence inhibition assay for ecotoxicity assessment: A review. Sci. Total Environ. 2018, 626, 1295–1309. [Google Scholar] [CrossRef] [PubMed]
  18. Mozo, I.; Lesage, G.; Yin, J.; Bessiere, Y.; Barna, L.; Sperandio, M. Dynamic modeling of biodegradation and volatilization of hazardous aromatic substances in aerobic bioreactor. Water Res. 2012, 46, 5327–5342. [Google Scholar] [CrossRef] [PubMed]
  19. He, H.; Ma, H.; Liu, L. Combined photocatalytic pre-oxidation reactor and sequencing batch bioreactor for advanced treatment of industrial wastewater. J. Water Process Eng. 2020, 36, 101259. [Google Scholar] [CrossRef]
  20. Sambusiti, C.; Saadouni, M.; Gauchou, V.; Segues, B.; Leca, M.A.; Baldoni-Andrey, P.; Jacob, M. Influence of HRT reduction in pilot scale flat sheet submerged membrane bioreactor (sMBR) performances for Oil&Gas wastewater treatment. J. Membr. Sci. 2019, 594, 117459. [Google Scholar]
Figure 1. BIOMEM pilot block flow diagram.
Waste 01 00020 g001
Figure 2. Experimental set-up.
Waste 01 00020 g002
Figure 3. Produced water composition_Total and dissolved hydrocarbon concentrations.
Waste 01 00020 g003
Figure 4. Produced water composition_Total and dissolved hydrocarbon concentrations.
Waste 01 00020 g004
Figure 5. Produced water composition_Global parameters.
Waste 01 00020 g005
Figure 6. Feed salinity and soluble COD variation during the entire test period.
Waste 01 00020 g006
Figure 7. Dispersed hydrocarbon removal efficiency by DAF.EDAF (DAF inlet), SDAF (DAF outlet), MBBR (Moving Bed Bioreactor), HRT (Hydraulic Retention time), DF (Disk Filter), AC (Activated Carbon Filter).
Waste 01 00020 g007
Figure 8. COD, BTEX, PAH and Phenol removal by DAF (8-month average).
Waste 01 00020 g008
Figure 9. Soluble COD removal during the abiotic phase and after introduction of acclimated biocarriers.
Waste 01 00020 g009
Figure 10. Average Soluble COD removal efficiency versus MBBR residence time.
Waste 01 00020 g010
Figure 11. Average TOC removal efficiency versus MBBR residence time.
Waste 01 00020 g011
Figure 12. Average BOD5 removal efficiency versus MBBR residence time.
Waste 01 00020 g012
Figure 13. Soluble COD removal during the entire pilot operation phases.
Waste 01 00020 g013
Figure 14. Residual soluble COD, TOC and DBO5 downstream MBBR and gravity separator.
Waste 01 00020 g014
Figure 15. Barium concentration along the pilot unit versus time of operation.
Waste 01 00020 g015
Figure 16. Zinc concentration along the pilot unit versus time of operation.
Waste 01 00020 g016
Figure 17. Lead concentration along the pilot unit versus time of operation.
Waste 01 00020 g017
Figure 18. Iron concentration along the pilot unit versus time of operation.
Waste 01 00020 g018
Figure 19. Aluminum concentration along the pilot unit versus time of operation.
Waste 01 00020 g019
Figure 20. Phenols concentration along the pilot unit versus time of operation.
Waste 01 00020 g020
Figure 21. Total BTEX concentration along the pilot unit versus time of operation.
Waste 01 00020 g021
Figure 22. Total PAH concentration along the pilot unit versus time of operation.
Waste 01 00020 g022
Figure 23. Inhibition rate and removal efficiency at 30 min measured by Microtox over time and phases.
Waste 01 00020 g023
Table 1. List of analyses performed (onsite and external).
ParametersMethod
Onsite analyses
Dispersed HydrocarbonInternal method CR EXP 006
Ammonium NH4Micromethod
Nitrate NO3Micromethod
Chemical Oxygen Demand (soluble and total)Micromethod
Total Suspended SolidsFilter + oven 105 °C
Conductivity & SalinityMultiparameter probe
pHMultiparameter probe
TemperatureMultiparameter probe
ReDox potentialMultiparameter probe
Phenol Micromethod
External analyses
Inorganics
Orthophosphate
Ca, Mg, FeNF EN ISO 11885
V, As, Al, Ba, Cd, Cu, Cr, Ni; Plomb (Pb); Zinc (Zn)NF EN ISO 17294-2
Mercure (Hg)Méthode Interne selon NF EN ISO 17852
Chrome VINF T 90-043
NH4, NTK, NO2, NO3External lab internal method
PO4External lab internal method
Sulfates (SO4)NF ISO 15923-1
FluoruresNF T 90-004
ChlorideNF ISO 15923-1
SalinityExternal lab internal method
Organics
Total Hydrocarbon (C10-C40)NF EN ISO 9377-2
Total Organic Carbon (TOC)NF EN 1484
Biochemical Oxygen Demand (BOD5)NF EN 1899-1
PhenolNF EN ISO 14402
4-n-nonylphénolExternal lab internal method
PAHs (16 substances)
BTEX
External lab internal method
Table 2. Produced water physico-chemical characteristics.
ParametersMean ValueStandard Deviation
pH6.50.1
Conductivity (mS/cm)1488
Salinity (g/kg water)976
Chloride (g/L)573
Temperature (°C)29.51
Table 3. Role of acclimated biocarriers on BTEX, PAHs and phenol removal rate.
ParametersAbiotic Phase Removal
(DAF + MBBR + Separator)
Removal after Injection of Acclimated Biocarriers
(DAF + MBBR + Separator)
DAF Inlet
(µg/L)
MBBR + Separator Outlet
(µg/L)
Removal Rate
(%)
DAF Inlet
(µg/L)
MBBR + Separator Outlet
(µg/L)
Removal Rate
(%)
BTEX16162898.316457.599.6
PAHs13.0469.39.11.187.9
Phenol200019005.0223081663.4
Disclaimer/Publisher’s Note: The statements, opinions and data contained in all publications are solely those of the individual author(s) and contributor(s) and not of MDPI and/or the editor(s). MDPI and/or the editor(s) disclaim responsibility for any injury to people or property resulting from any ideas, methods, instructions or products referred to in the content.

