1. Introduction
Electrical and electronic equipment (EEE) is experiencing rapid growth due to the continuous commercialization of new products and with ever-improving performance characteristics. As a result, a device becomes obsolete in a relatively short time; therefore, an increasing amount of waste electrical and electronic equipment (WEEE) is generated each year.
The integral component of any electronic equipment is the printed circuit board (PCB), as it electrically connects and mechanically supports the other electronic components. Depending on the type and application of PCBs, their composition varies. One of the most used types of PCBs is FR-4 PCBs, boards made with FR4 material. FR stands for fire retardant, which is a glass fiber epoxy laminate.
In general, PCBs consist of about 28% metals and 23% plastics [
1]; the remaining percentage comprises ceramic and glassy materials. In FR-4 PCBs, about 90% is Tetrabromobisphenol A (TBBPA) [
2]. The plastic materials in PCBs are mainly composed of polymers C-H-O such as polyethylene, polypropylene, polyesters, polycarbonates, phenol, formaldehyde, and others. The rest of the plastics are halogenated and nitrogen-containing polymers [
1]. Waste printed circuit boards (WPCBs) are considered the most valuable components of WEEE (waste electrical and electronic equipment), even though they constitute only 3 percent of it [
3]. The concentration of precious metals, particularly Au, Ag, Pd, and Pt, is much higher than their primary resources, making waste PCBs an economically attractive "urban mineral" for recycling. According to a rough estimate, the main metals contained in the electronic boards are Cu (∼16%), Sn (∼4%), Fe (∼3%), Ni (∼2%), and Zn (∼1%) [
4]. In addition, precious metals, such as Au (∼0.039%), Ag (∼0.156%), and Pd (∼0.009%), used as contact materials or plating layers for their electrical conductivity and chemical stability, are ten times more abundant in WPCBs than in natural minerals [
4].
Recycling PCBs has two main objectives: to reduce the pollution associated with the improper disposal of this waste and to recover the metals. Due to a large amount of electronic waste accumulated, these have become valuable sources of materials. The recovery of metals is essential to avoid contamination of the environment. Efforts have been made to develop environmentally friendly processes using mechanical pre-treatment combined with hydrometallurgical techniques [
5]. Hydrometallurgical processes require solvents for the dissolution or leaching of metals and subsequent recovery from solutions. The most used chemicals for the leaching (the process of extracting a soluble component from a solid by a solvent) of metals are nitric acid and hydrochloric acid, cyanide, halide, thiourea, and thiosulfate [
6,
7]. Material recovery and separation processes create waste streams that require further management [
8]. Recovery of base metals has an impact on process economics because of the larger amount available in PCBs. In addition, base metal recovery also ensures the enrichment of precious metals in the solid residue, which facilitates their subsequent extraction by leaching [
1]. The solutions are then subjected to separation and purification procedures, such as the precipitation of impurities, solvent extraction, adsorption, and ion exchange to isolate and concentrate the metals of interest. Next, the solutions are treated by electrorefining, chemical reduction, or crystallization processes to recover the metals [
9].
Valorization by modern hydrometallurgical processes of WPCBs provides high recovery yields of precious and base metals [
7,
8]. However, the metals in the electronic boards are covered by a chemical coating consisting mainly of organic compounds. This fraction complicates the recovery of the metals because the chemical coating inhibits the contact between the leaching agent and the metal [
10]. The release of metals wrapped within the non-metallic coating is essential prior to hydrometallurgical treatment to achieve a high metal recovery, rapid treatment, reduced consumption of leachate, and reduced effluent production. The release of metals is achieved through the cumulative application of shredding, crushing into powder, and appropriate metal–nonmetal separation techniques. Including pre-processing methods greatly increases the economics of the entire recycling process [
11].
A major problem with physical separation processes is the significant loss of precious metals. These losses include the insufficient release of metals due to their intimate association with plastics, the generation of fines during size reduction, and the inefficiency of separation processes to recover metals from fine fractions. Therefore, it is necessary to find an alternative process to remove chemical coatings from PCBs without the loss of metals [
10].
Thermal processes (incineration, pyrolysis, and gasification) are one of the most promising ways to transform complex e-waste into useful products. The purpose of thermal treatment of e-waste is to remove organic components (e.g., plastics) while leaving the nonvolatile mineral and metallic phases in their original forms so that they can be recovered later. The elimination of the plastic coating allows for better exposure of the metals to be leached with a consequent increase in extraction yields. In the hydrometallurgical processes developed in [
7,
8], it has been seen that this pre-treatment leads to an increase in gold extraction yields of about 15-25%, reaching an overall yield of more than 90%. This improvement is allowed without increasing chemicals or leaching time. In addition, the gaseous, liquid, or solid products after cleaning can be used for energy recovery [
12]. This paper uses an Aspen Plus simulation of the pyrolysis of printed circuit boards. The main objective is to build a model to understand the thermodynamic behavior of this type of operation on such a complex material to estimate the composition and flow rate of pyrolysis gas and oil. In addition, the present work has as a further objective to analyze the influence on the products of some characteristics or variations of the process (such as the presence of steam and pyrolysis temperature).
2. Materials and Methods
A model of the pyrolysis of PCBs was created using the ASPEN PLUS v10 process simulator. ASPEN PLUS is one of the most used commercial process simulators in chemical engineering. Being a pre-packaged program used a lot for professional purposes, it contains most of the traditional equipment that can be found in a chemical plant. However, it is possible to extend the commercial simulation toolbox by FORTRAN or EXCEL codes or even by importing user-defined Aspen Custom Modeler (ACM) models, in order to describe and overcome gaps in the ASPEN PLUS model library and to enable the whole flowsheet simulation within one simulation tool [
13].
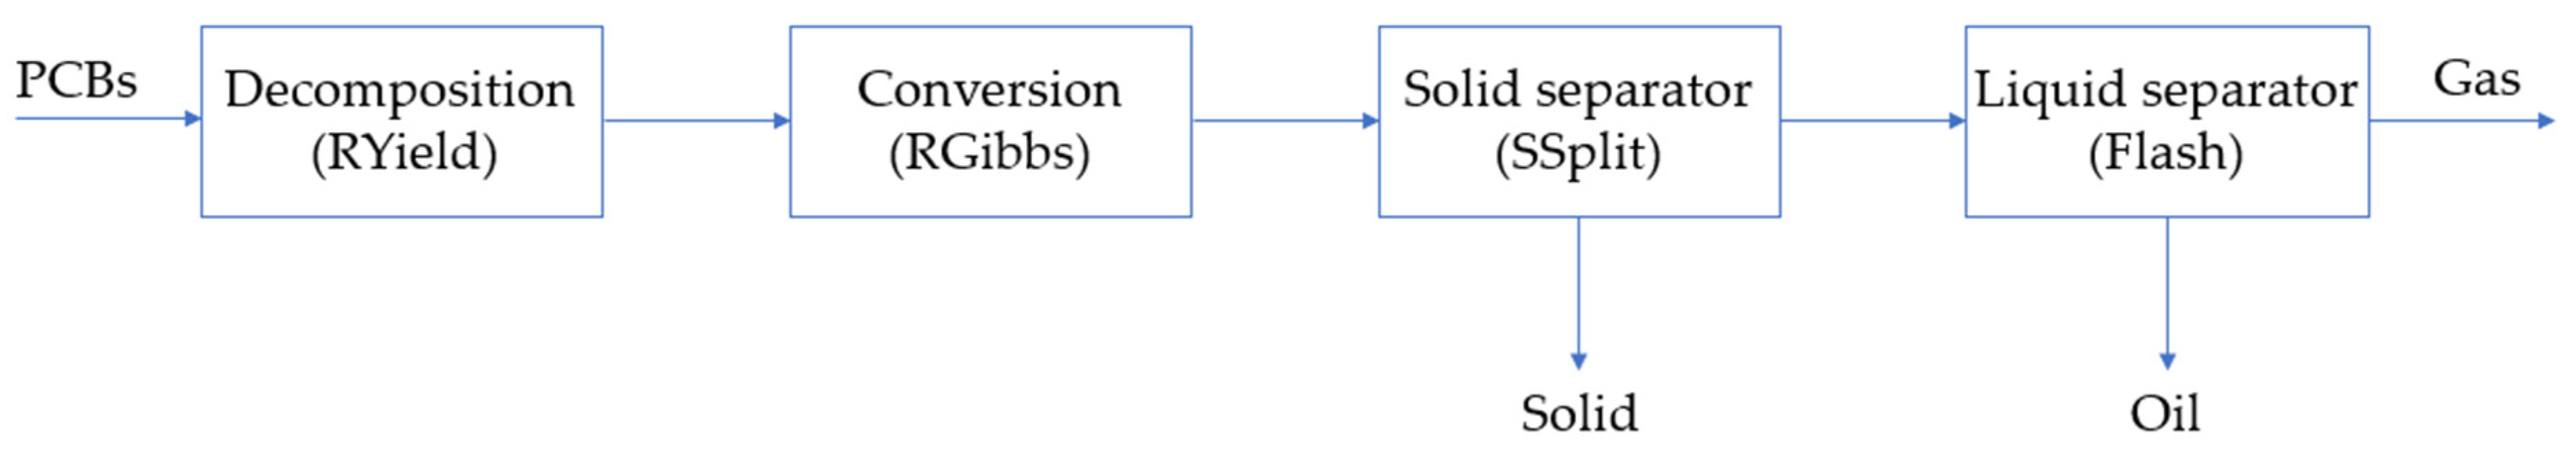
Even in the case of pyrolysis, ASPEN PLUS does not contain a pre-designed model and it was necessary to use a combination of different blocks present, as described in
Figure 1. Furthermore, it was necessary to implement the model through a FORTRAN code.
Below are the assumptions made for the development of the model:
The pyrolysis simulation model prepared with ASPEN PLUS is a stationary and isothermal model that uses the sequential modular calculation technique;
Uniformity of temperature and pressure in the reactor;
It was considered that the particle size distribution (PSD) has no effect on conversion;
The model was validated with experimental data published in the literature [
14].
2.1. Component Specification
In the software, MIXCINC has been set as the global flow class of the simulation. It is used when both conventional and unconventional solids are present, and the particle size distribution (PSD) of the material is not available. Indeed, it is a general hypothesis that PSD does not significantly affect the pyrolysis process [
15].
The unconventional components are not present in the ASPEN PLUS database and are modeled through proximate analysis and ultimate analysis. Enthalpy and density are the only properties calculated for unconventional components and are made from empirical correlations. The specific property methods for enthalpy and density are chosen for this simulation are the HCOALGEN method and the DCOALIGT method; both are based on proximate and ultimate analysis.
PCBs are considered unconventional solids as they are not present in the ASPEN database. Both analyses necessary for their definition, present in the literature [
14], are reported in
Table 1.
In addition to the PCBs, ash was also included in the simulator as an unconventional solid. In this case, a proximate and ultimate 100% ash was assumed.
Regarding the decomposition products, bisphenol A (C15H16O2) was considered the main component of the organic fraction of PCBs. The choice of bisphenol A is due to the lack of thermodynamic data in ASPEN PLUS relating to the most appropriate TBBPA (one of the components most present in the brominated epoxy resin of FR4 PCBs). Bisphenol A, described in Aspen by sufficient thermodynamic data, is interactive in the RGIBBS reactor. The use of bisphenol A is undoubtedly a simplifying hypothesis that does not take into account the presence of bromine (the formation of HBr in syngas has been neglected).
Conventional components added in the simulation as possible products of pyrolysis include some aromatic compounds, alkanes up to pentane (C1-C5), alkenes, and other organic components (shown in
Table 2).
Other components are hydrogen, nitrogen gas, oxygen, water, hydrogen chloride, hydrogen sulfide, carbon monoxide, carbon dioxide, and carbon.
The property method selected for the simulation is the one based on the Peng–Robinson equation of state with Boston–Mathias (PR-BM) modifications [
15].
2.2. Modeling of the Pyrolysis Reactor
The simulation modeled the pyrolysis reactor by a combination of two blocks: RYIELD and RGIBBS reactors. The first allows the material previously defined as unconventional to be converted into the various conventional products which compose it. The second allows estimating the pyrolysis products at the thermodynamic equilibrium by minimizing the Gibbs free energy. In this way, it is possible to pass from an input flow characterized only by ultimate and proximate analysis to the composition at equilibrium as a function of the specific thermodynamic conditions (temperature and pressure of the Gibbs reactor). With this approach, knowledge of the different chemical reactions occurring in the process is not required (stoichiometric approach).
In RYIELD, it is necessary to insert the conversion of the unconventional power supply in each of the different conventional components that compose it. For this purpose, the CALCULATOR block has been inserted. Thanks to this ASPEN PLUS block, it is possible to implement the calculation code using Fortran programming language and calculate the composition of the output current to the RYIELD reactor. Given the simplification of having bisphenol A as the only conventional component of the organic fraction, it is impossible to establish a reaction that leads from the unconventional raw material to the conventional one, respecting the proximate and ultimate analysis. To overcome this simplification problem, other reaction products are added, which can then disappear later based on the thermodynamic equilibrium of the RGIBBS reactor.
In the case of materials with known compositions, this problem is not created, and it is possible to proceed by converting the non-conventional material into the correct percentage of conventional components.
2.3. Description of the Simulation
It was decided to carry out the pyrolysis simulation on a flow rate of 100 kg/h of PCBs. This quantity is fed to the RYIELD reactor at room temperature and atmospheric pressure. Thanks to the CALCULATOR block, the conversion of PCBs into ash, water, and bisphenol A takes place inside the reactor. Within this block, a material balance of the elements was performed starting from the brute formula obtained through ultimate analysis. In this way, it was found that about 21% by mass of PCBs is made up of bisphenol A. The compounds coming out of RYIELD enter the RGIBBS block, where they are converted into different pyrolysis products based on the minimization of Gibbs free energy.
In this case, it is necessary to have a reasonably clear idea of the possible pyrolysis products, as adding a single component could change the entire thermodynamic equilibrium.
The temperature and pressure for the two reactors simulating the pyrolysis process were specified at 873 K and atmospheric pressure, respectively [
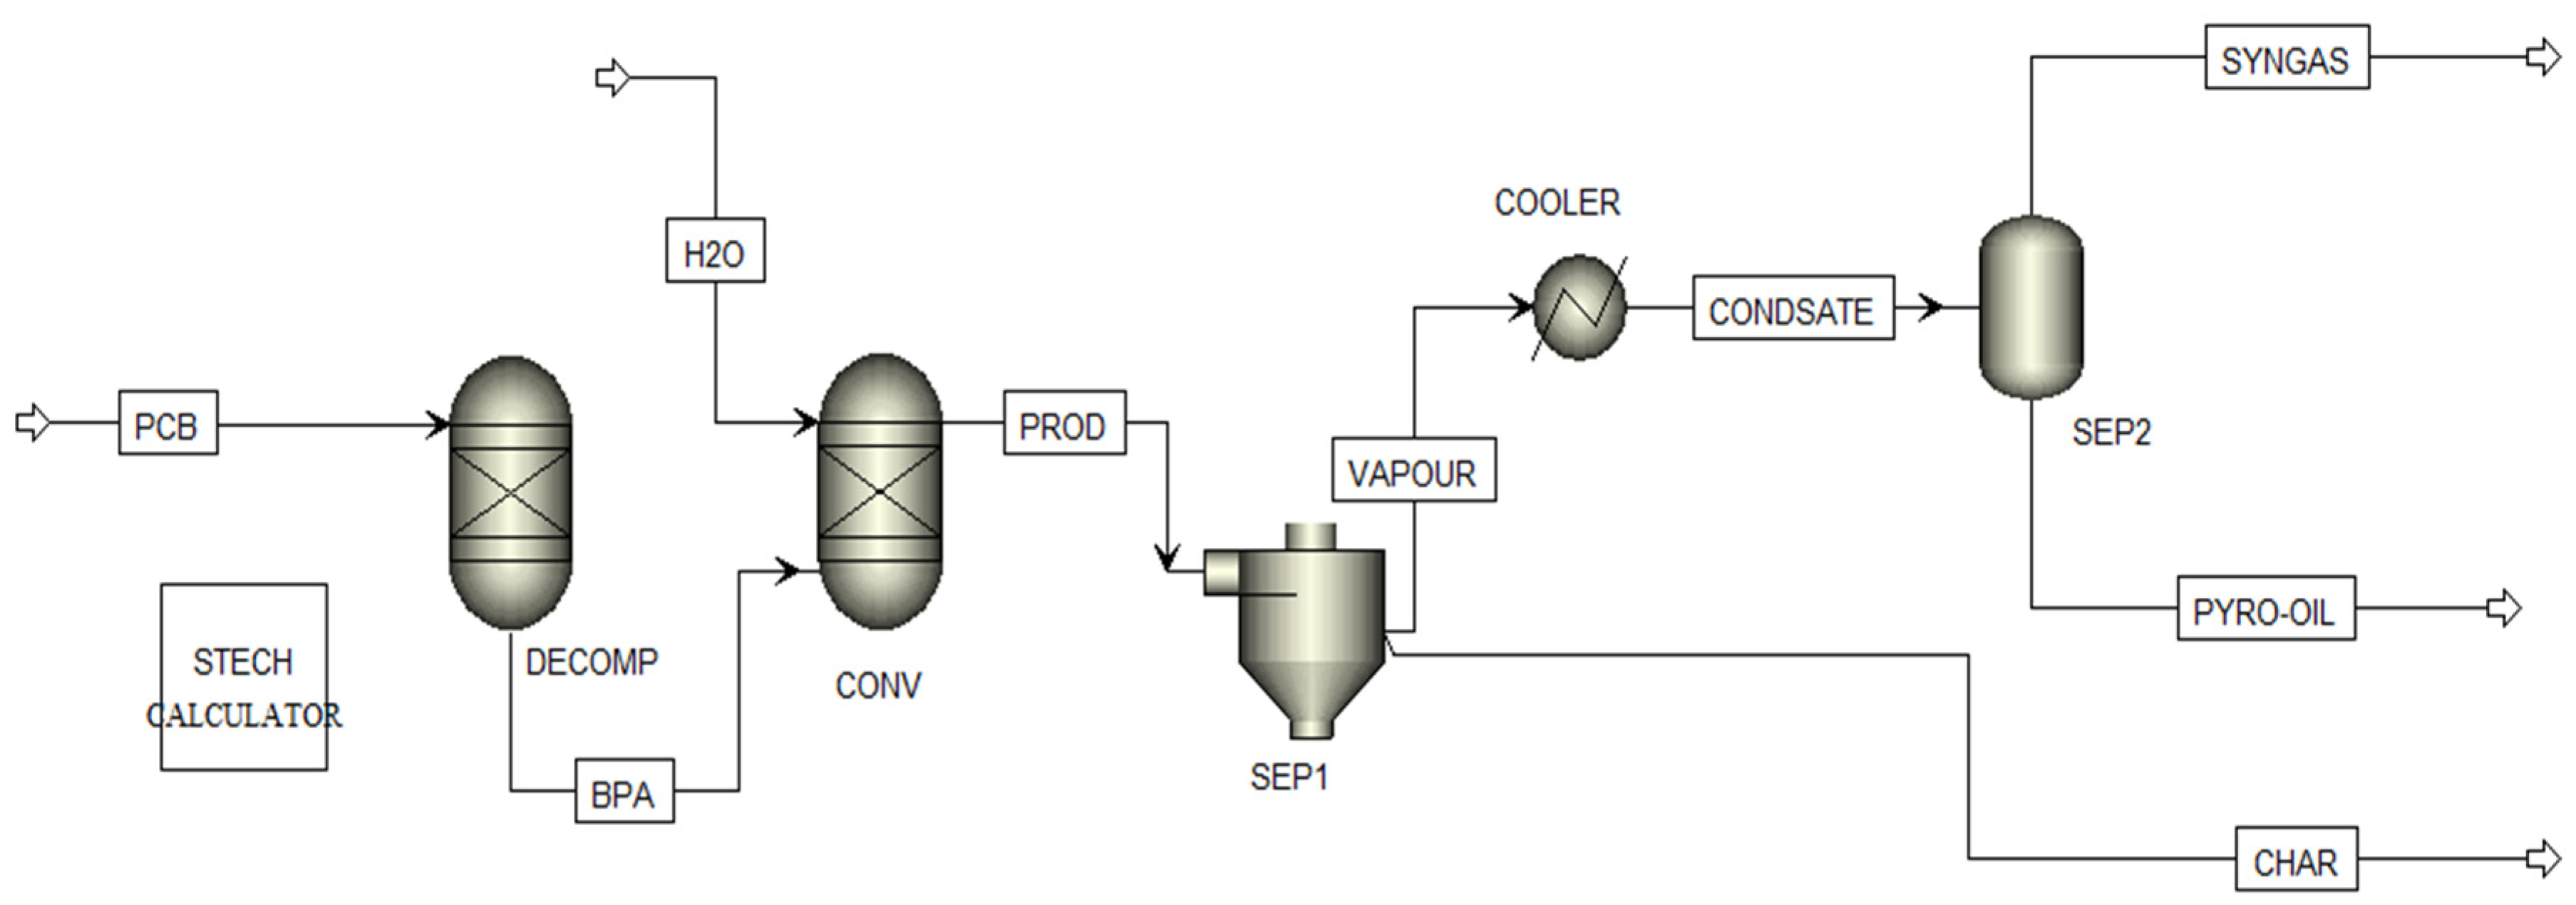
14]. Following the pyrolysis process, three devices were inserted to separate the three phases produced. In
Figure 2, it is possible to see the flowsheet of the model created. In the diagram, there is a flow of steam fed to the RGIBBS reactor as we want to compare, with the proposed model, the efficiency of pyrolysis with that of steam gasification. For the pyrolysis analysis, the steam flow rate was set at 0 kg/h.
2.4. Sensitivity Analysis
Through the ASPEN PLUS function called Sensitivity, an in-depth analysis was conducted on the effect of some parameters on the efficiency of the process. The Sensitivity analysis is simply the measurement of one or more process variables, as input variables vary. With this instrument, we want to analyze the quantity of converted organic fraction and the quality of the syngas produced, as the pyrolysis temperature varies. In addition, the effect due to the possible presence of steam (steam gasification) on the parameters described above was also analyzed.
Since the conversion of the organic fraction (χ) is not one of the output variables that ASPEN PLUS allows to insert in the Sensitivity function, it was necessary to implement this tool with a short Fortran code, as seen by Equation (1):
where
is the mass flow rate of the inlet organic fraction and
is the mass flow rate of the outgoing organic fraction. Both ranges can be used as input variables of the sensitivity analysis.
3. Results and Discussions
3.1. Validation of the Model
The results obtained from the model created were compared with the experimental results proposed in the literature by Evangelopoulos et al. [
14]. In their work, Evangelopoulos et al. investigated the influence of agents present in the reaction atmosphere, such as vapor or nitrogen, for the pyrolysis of PCBs. Since the values reported by Evangelopoulos et al. were used in the proximate and ultimate analyses, we expect the model results to be close to those obtained in their work. A comparison was made between the results obtained for pyrolysis (inert environment with nitrogen) and those obtained in steam gasification (in the presence of steam [
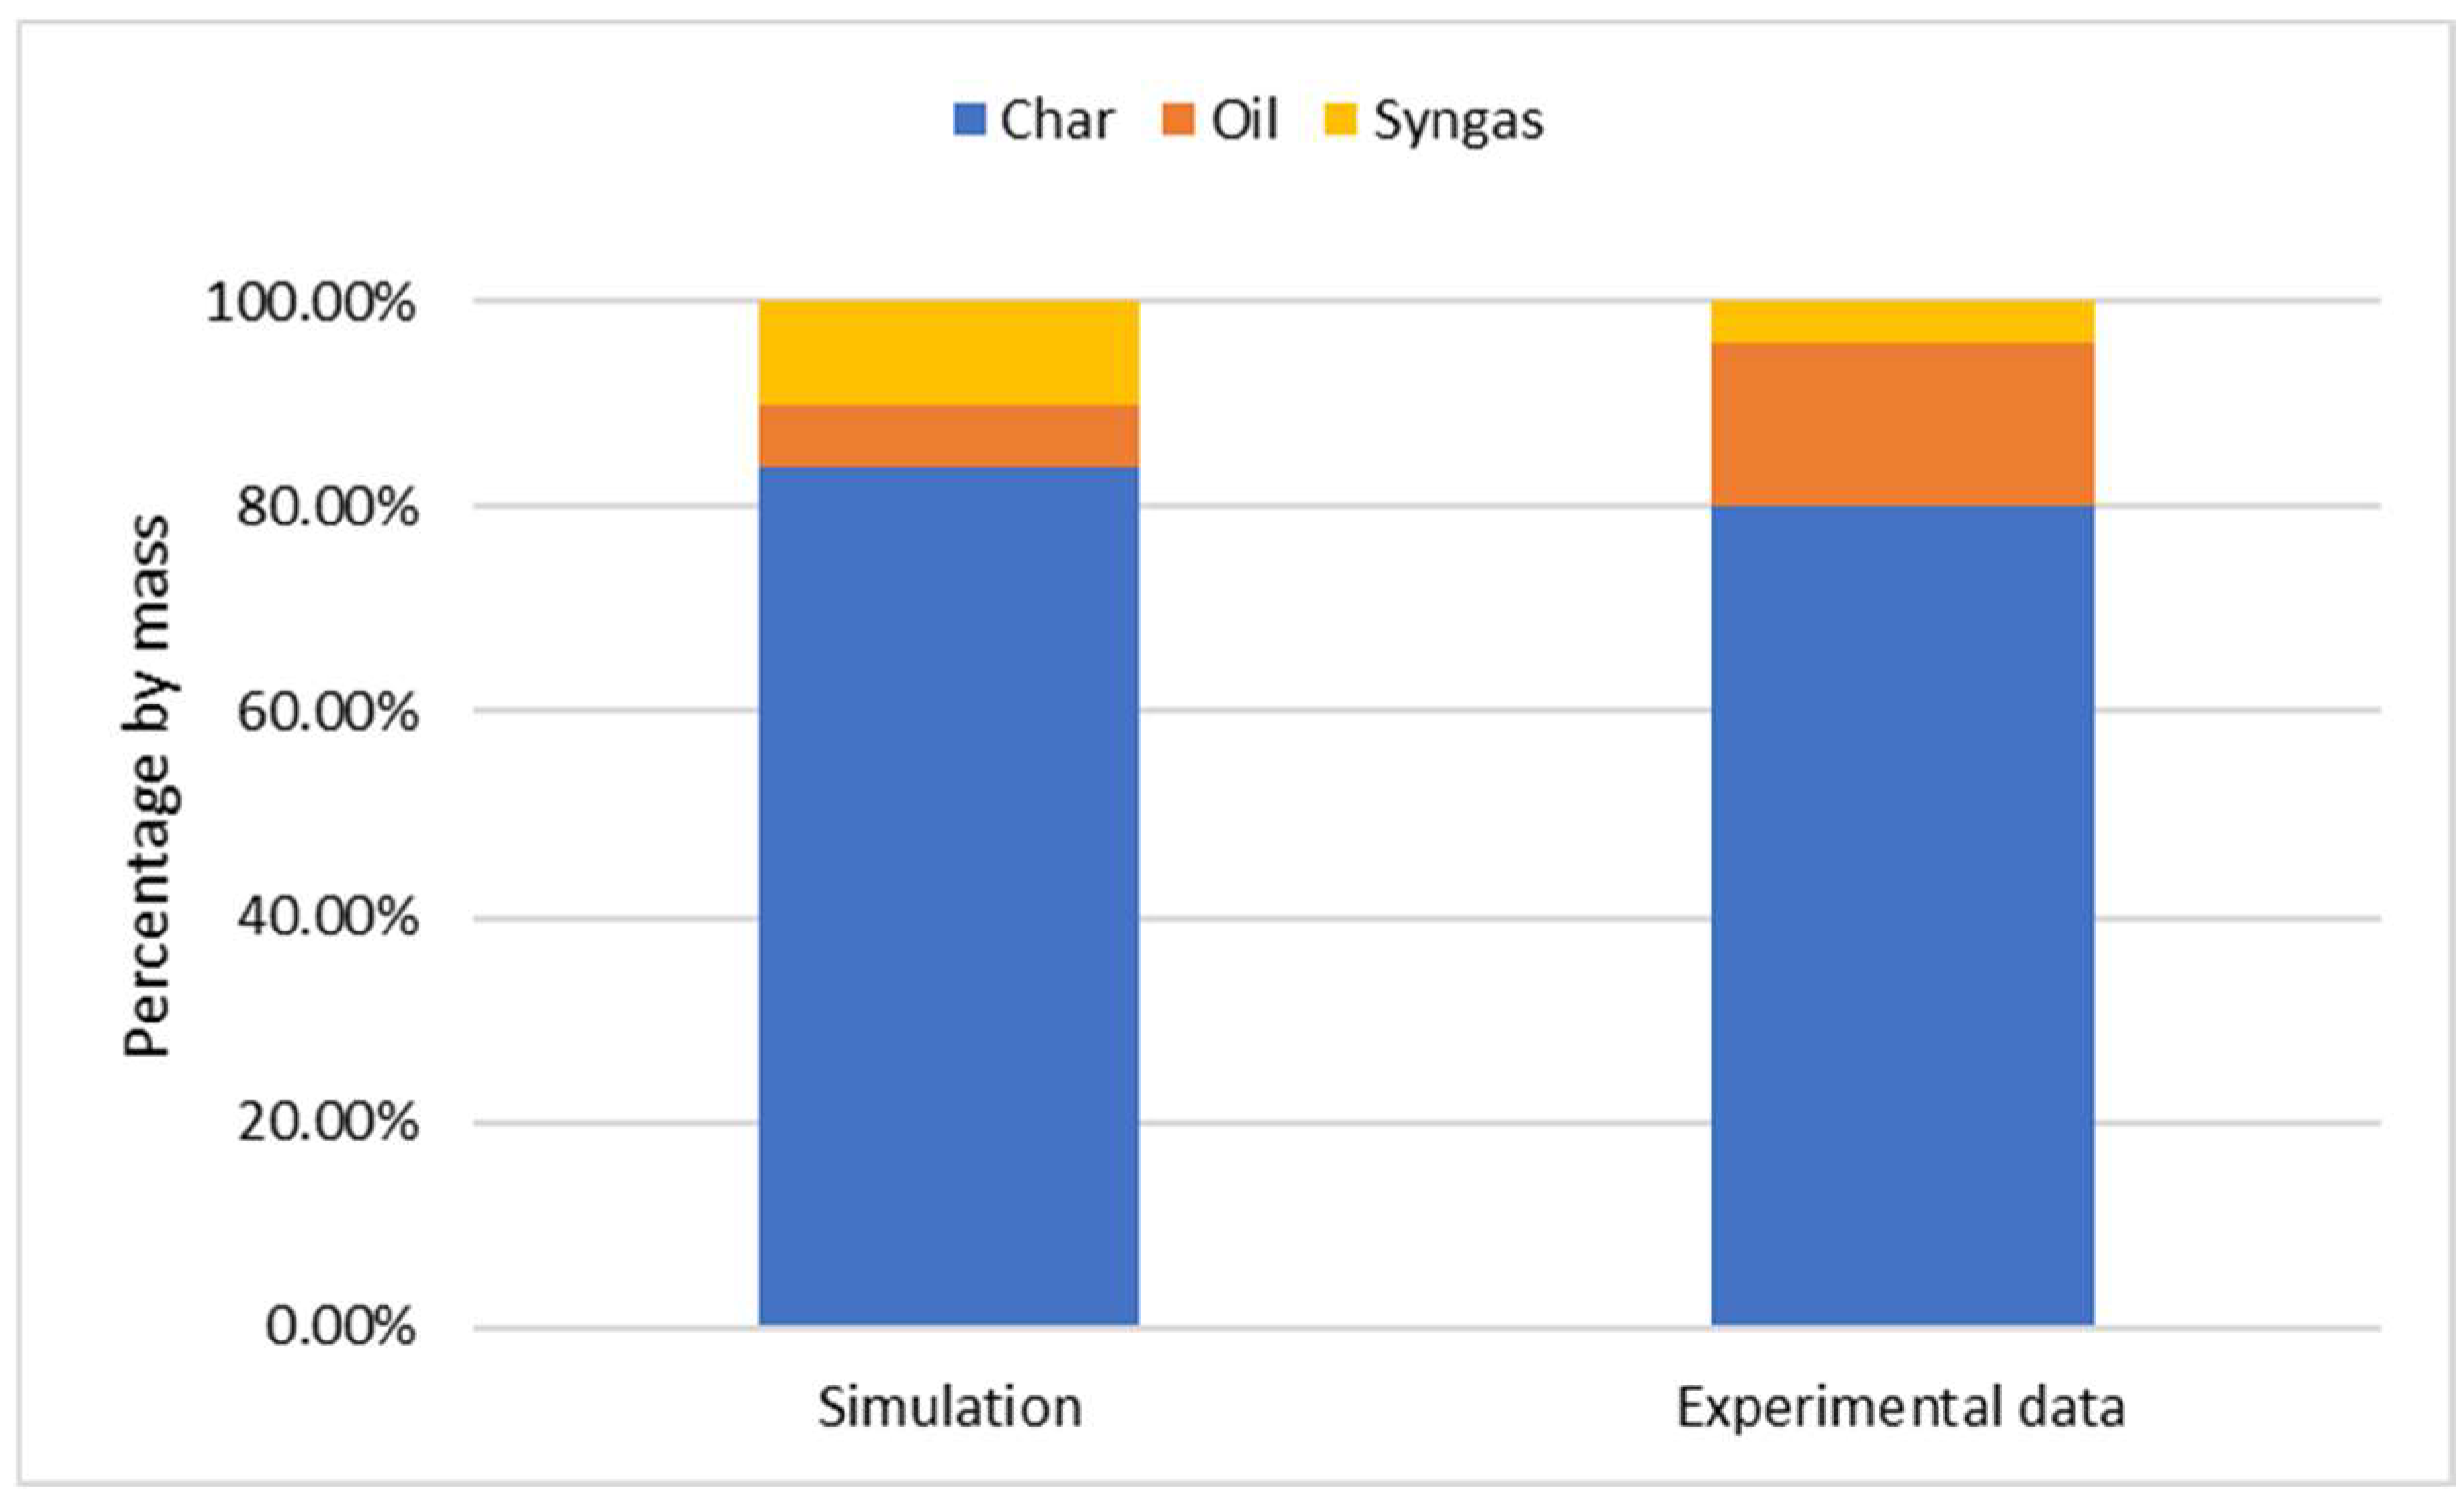
14]). Regarding the first case, about 85 wt% of the solid residue products were obtained. The remainder is divided between syngas and pyrolysis oil; in particular, 10 kg/h of syngas and 5 kg/h of oil were produced.
Figure 3 shows the comparison made. The model describes quite precisely the results obtained experimentally. A slight difference is due to a higher amount of residual solid predicted by the simulation with a consequent decrease in the fluid phase. The most important difference is due to the composition of the fluid phase, as more syngas is obtained from the simulation than experimentally (with a consequent decrease in the pyro-oil simulation). This aspect is undoubtedly due to the choice of organic components considered possible pyrolysis products. It would be necessary to insert numerous other complex compounds (verifying sufficient thermodynamic data in Aspen) to have a more precise model. Since we are primarily interested in removing the organic phase from the PCBs with subsequent energy valorization of the entire fluid phase, the model’s accuracy is acceptable.
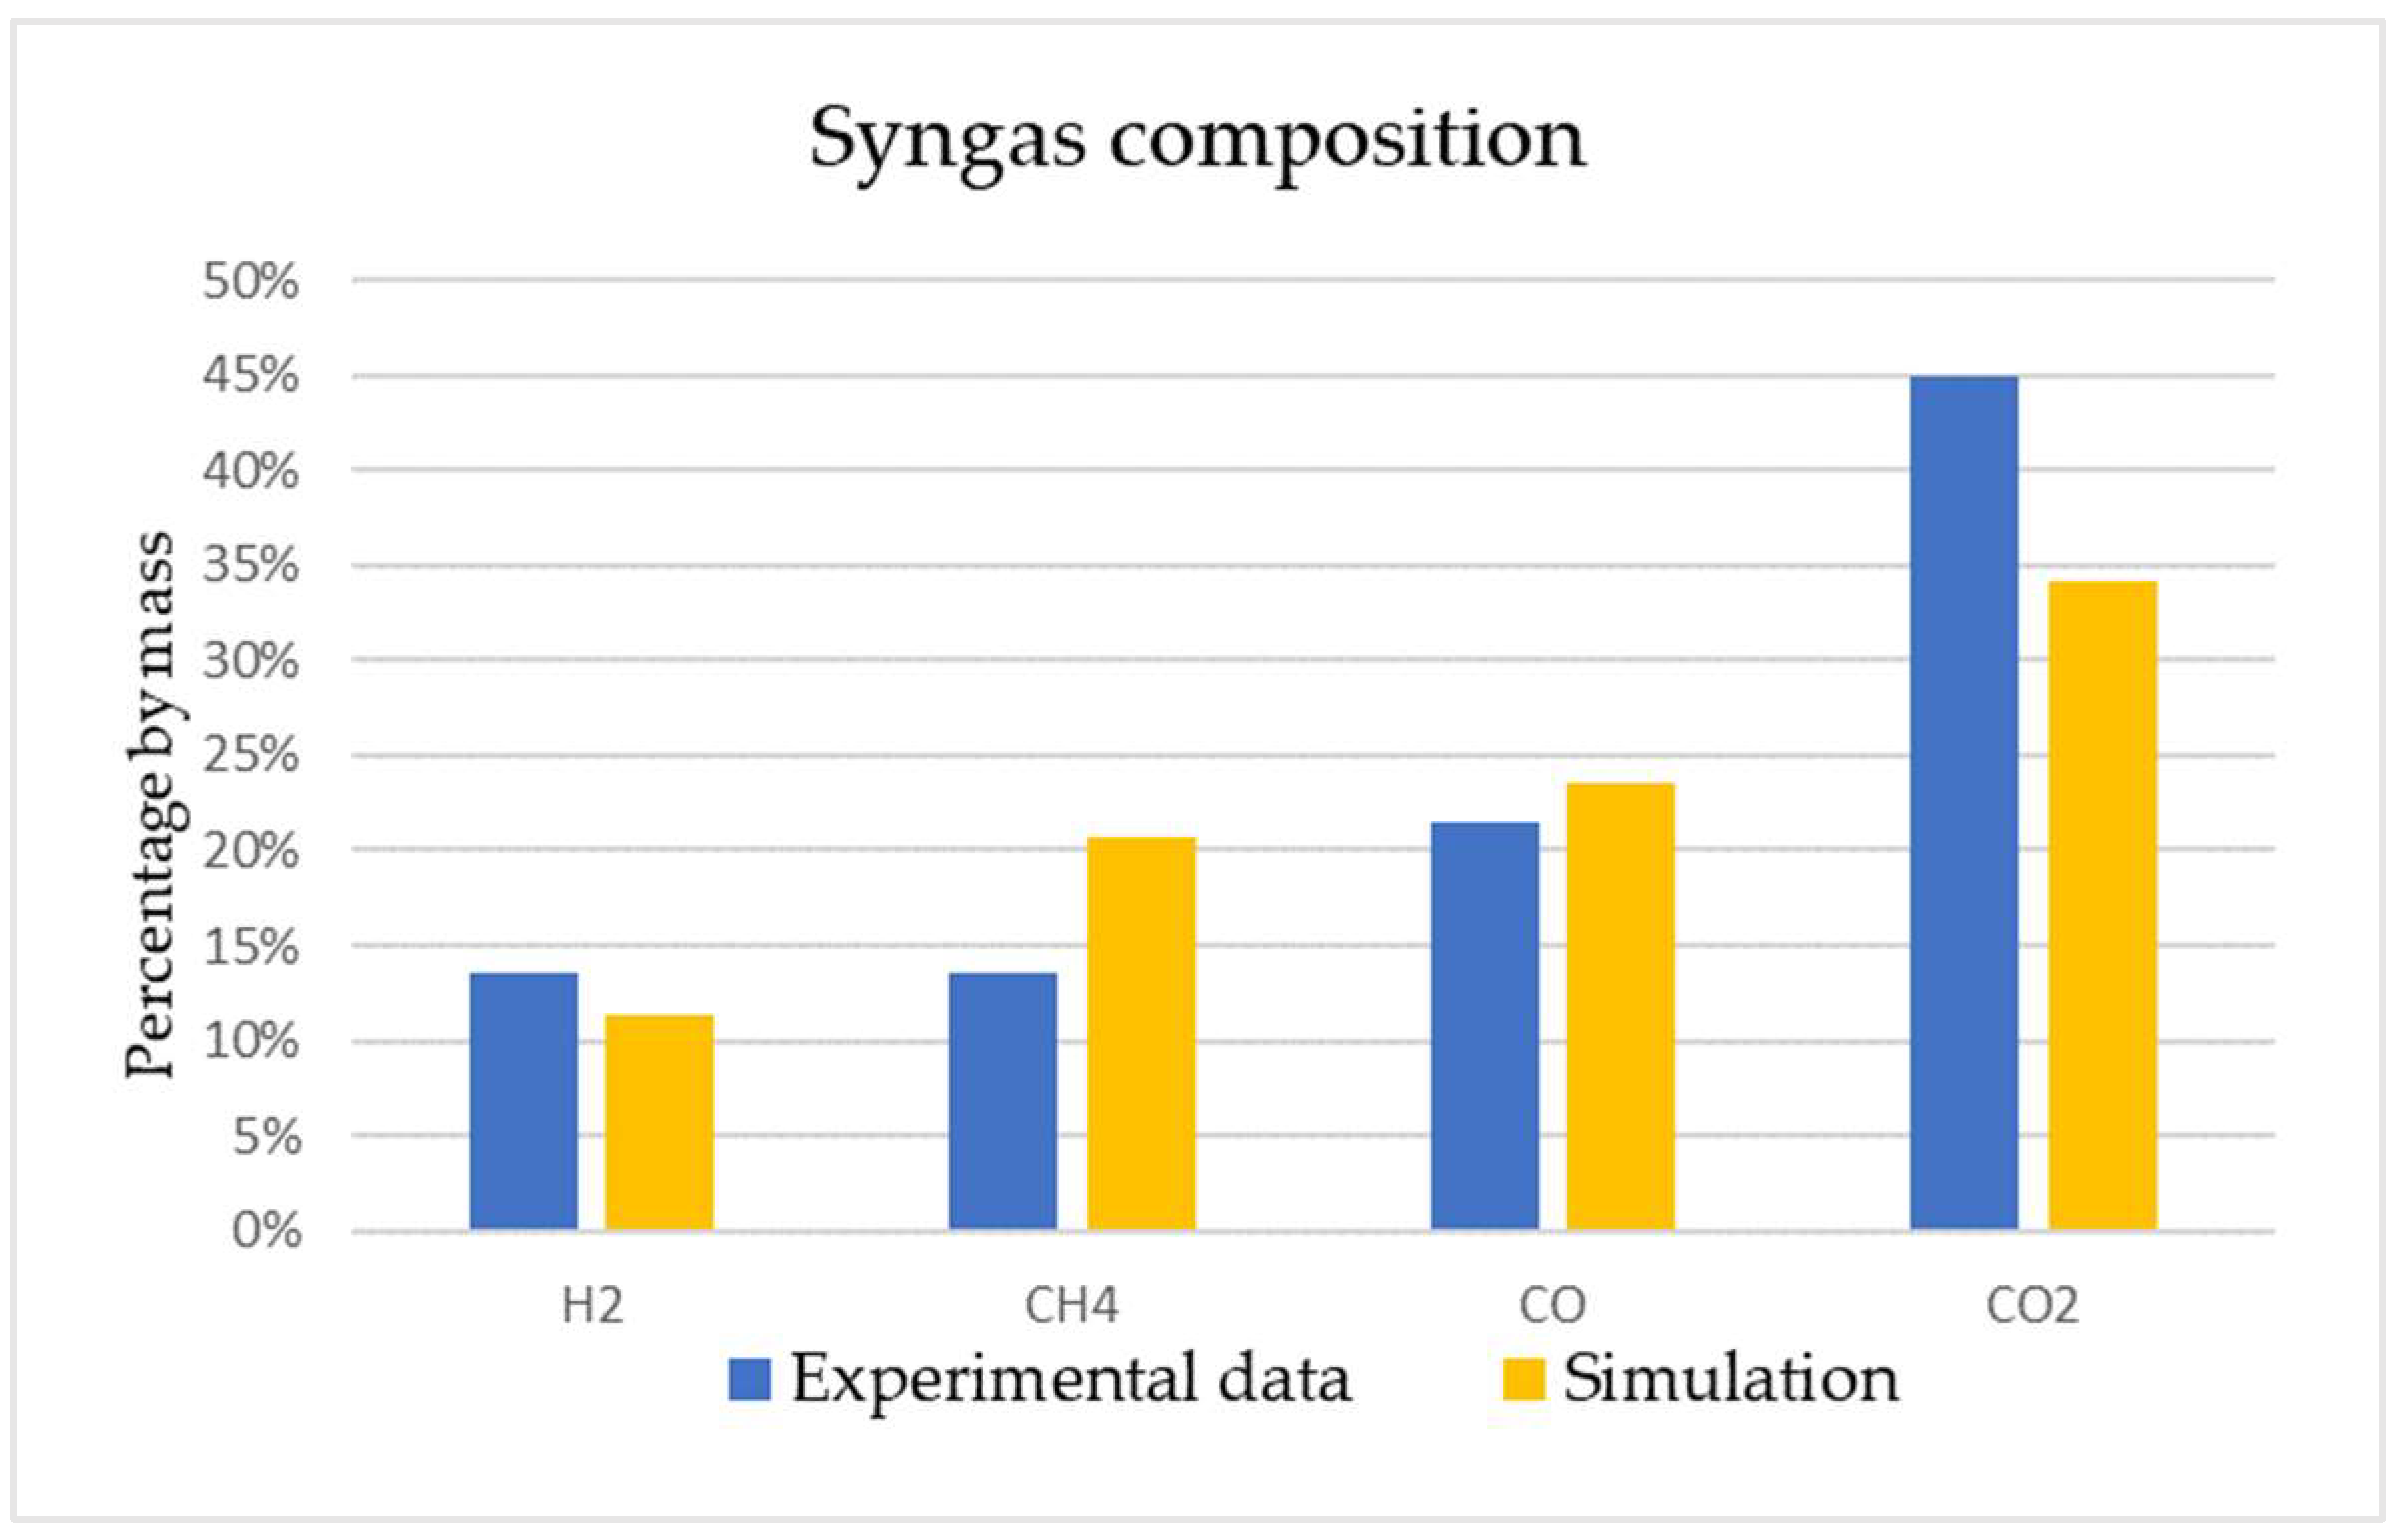
Furthermore, the syngas composition was also compared with the experimental results, as can be seen in
Figure 4.
As can be seen in the graph, the data on the composition obtained in the simulation are very close to the experimental ones. The substantial difference lies in methane and carbon dioxide composition. In the simulation, a greater amount of CH4 and a smaller amount of CO2 were obtained. For H2 and CO, comparable values to the experimental results were obtained.
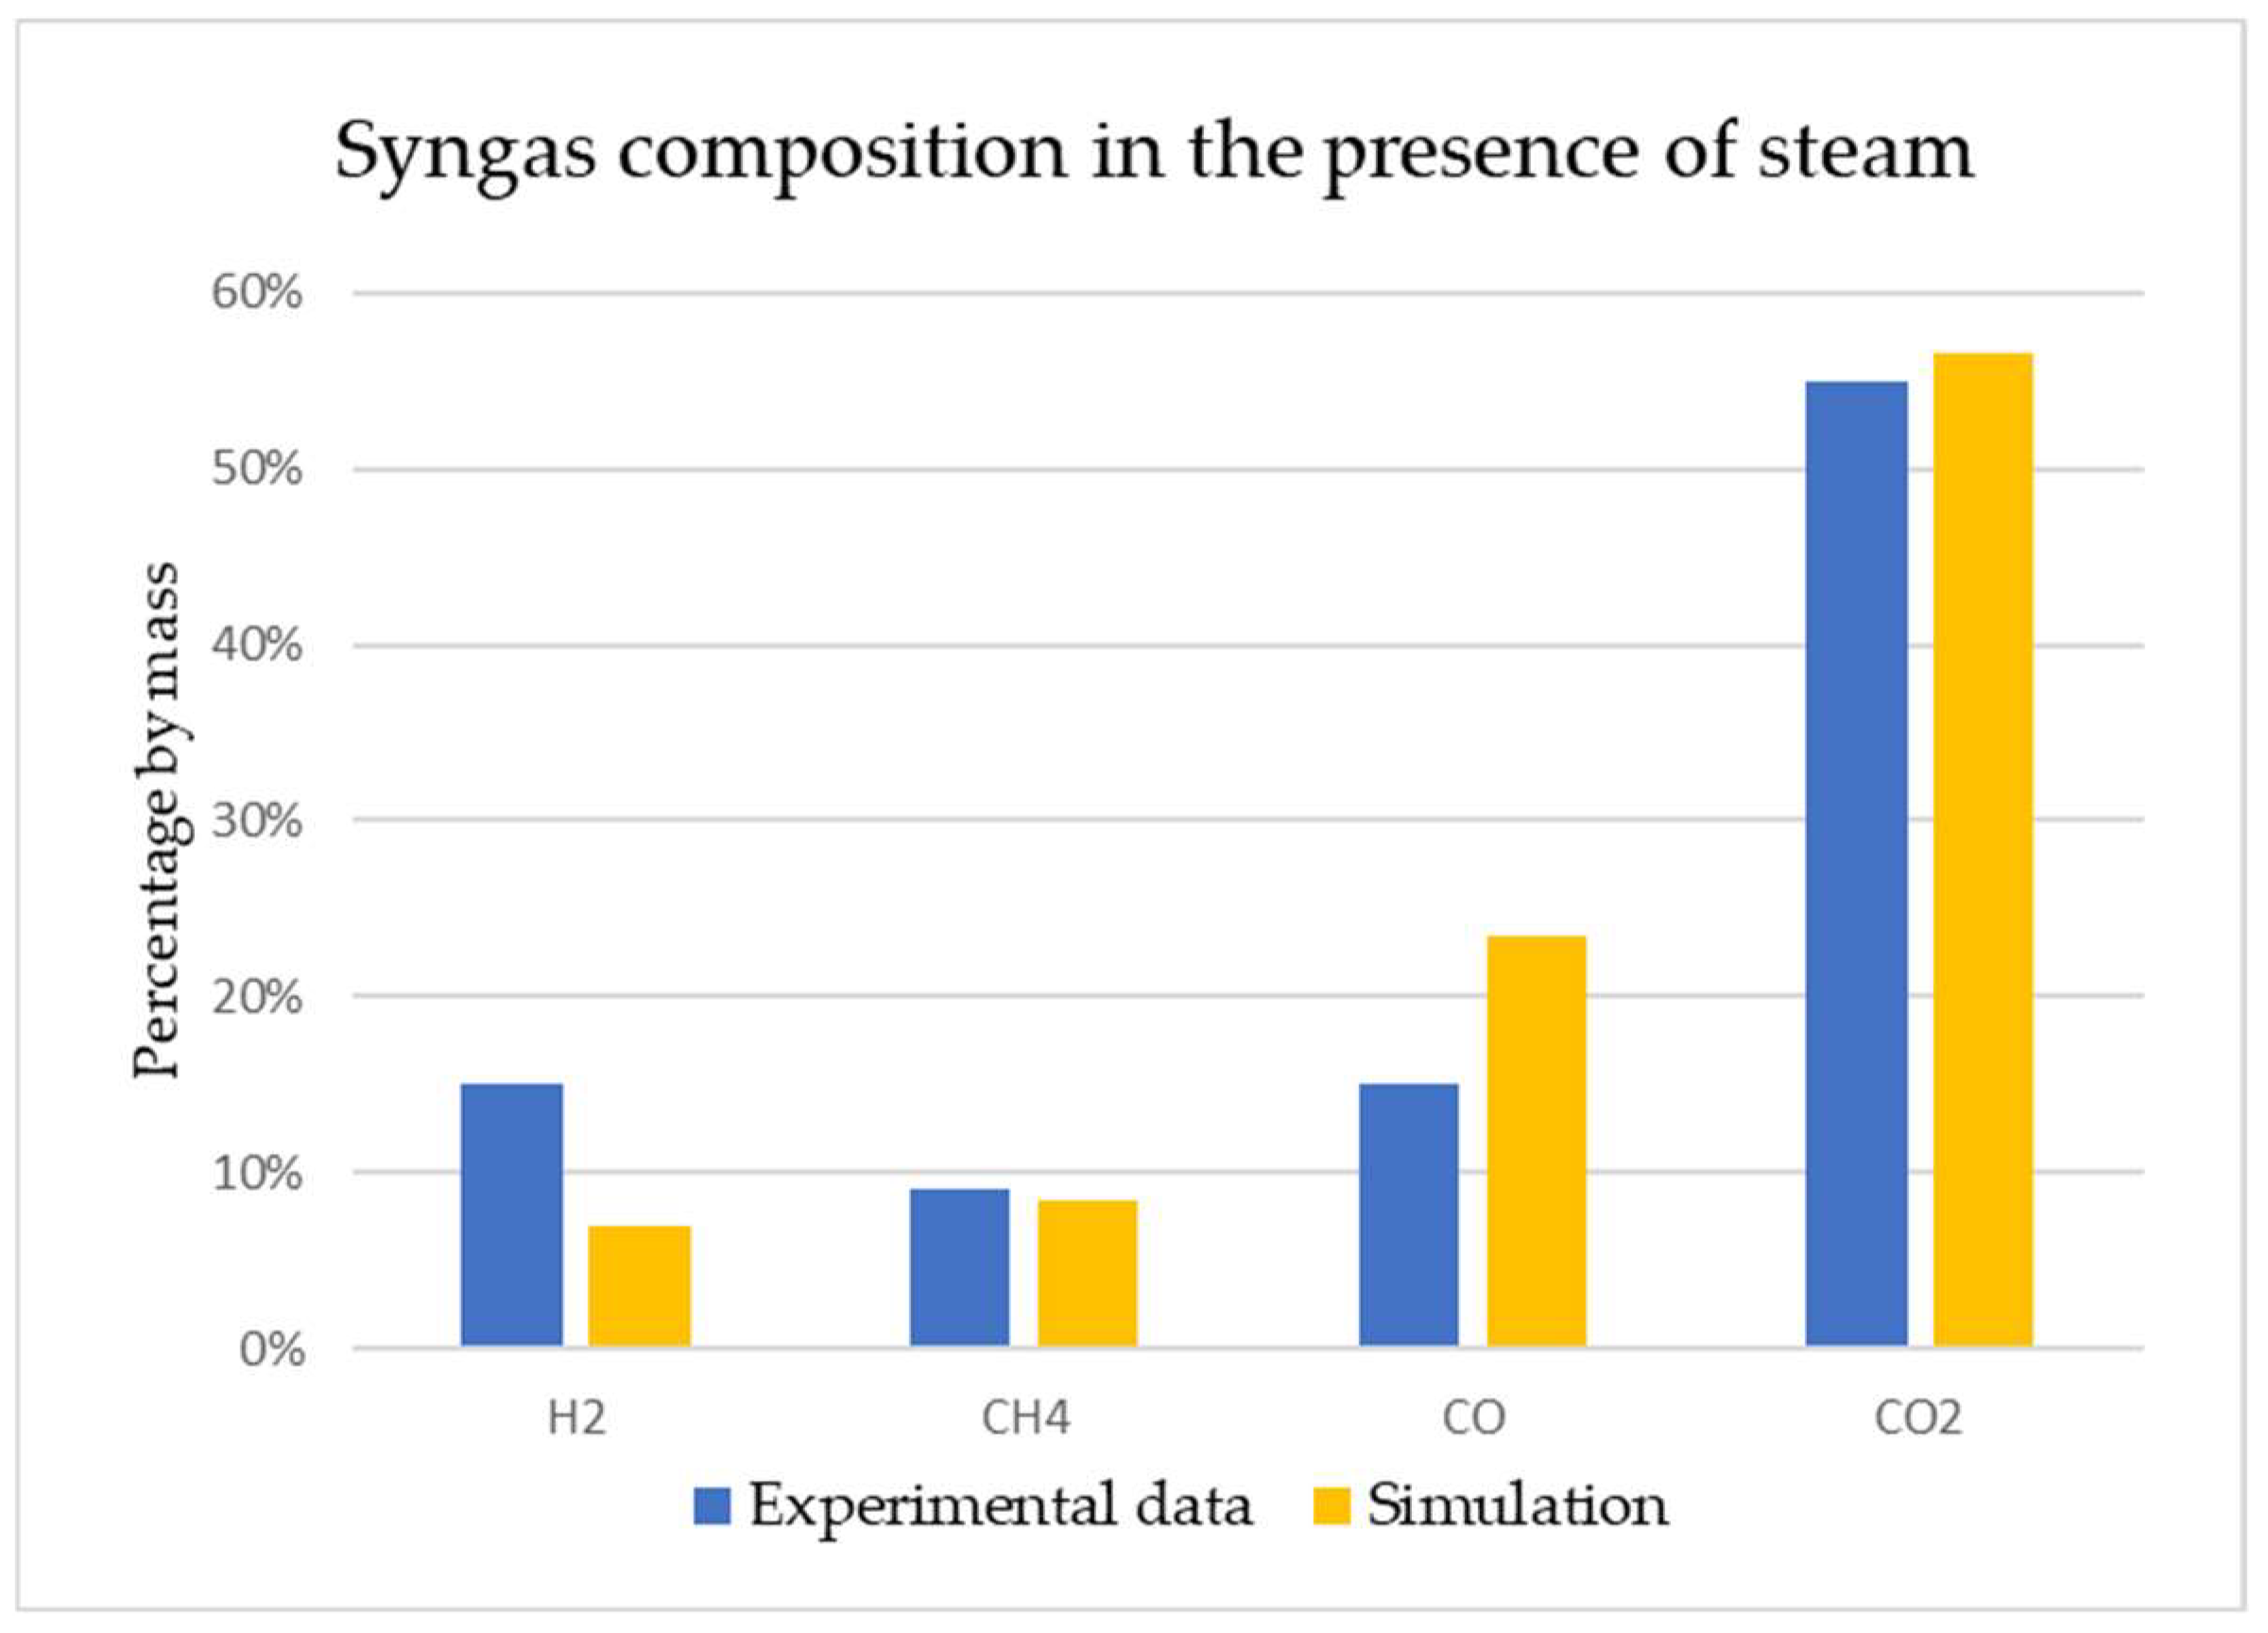
The composition of the syngas was evaluated by adding steam at 393 K and atmospheric pressure inside the RGIBBS reactor to analyze the model’s versatility. The results obtained are reported in
Figure 5.
In this case, the difference from the experimental data occurs in the composition of hydrogen and carbon monoxide. Less hydrogen and more carbon monoxide were obtained than that obtained by Evangelopoulos et al. The presence of the steam resulted in a significant increase in CO2 as an effect of the water gas shift reaction. However, the simulation also did not accurately predict the slight increase in hydrogen produced.
Regarding the liquid phase, it is not possible to have an adequate characterization for the simplification due to the use of bisphenol A. All the simulations carried out predicted a pyrolysis oil consisting almost exclusively of water, with traces of the various compounds organic compounds present and solubilized gases. This drawback, which turns out to be the weak point of the model, begins to be negligible for temperatures higher than about 873 K since, experimentally, a very significant decrease in the quantity of oil produced is witnessed.
3.2. Process Optimization
The sensitivity analysis studied the effect of the temperature and the amount of steam introduced into the RGIBBS reactor on the conversion of the organic fraction initially present in the PCBs. In addition, the effect on the flow rate and composition of the syngas was also evaluated.
Figure 6 shows the effect of temperature on the various products of pyrolysis in the absence of steam.
The solid phase is affected very little by the increase in temperature. Instead, a significant effect of the variation of this parameter is had on the composition of the fluid phase. In fact, as the temperature increases, the amount of oil present decreases and the amount of syngas increases, taking into account that the model slightly overestimates the amount of syngas compared to the experimental data.
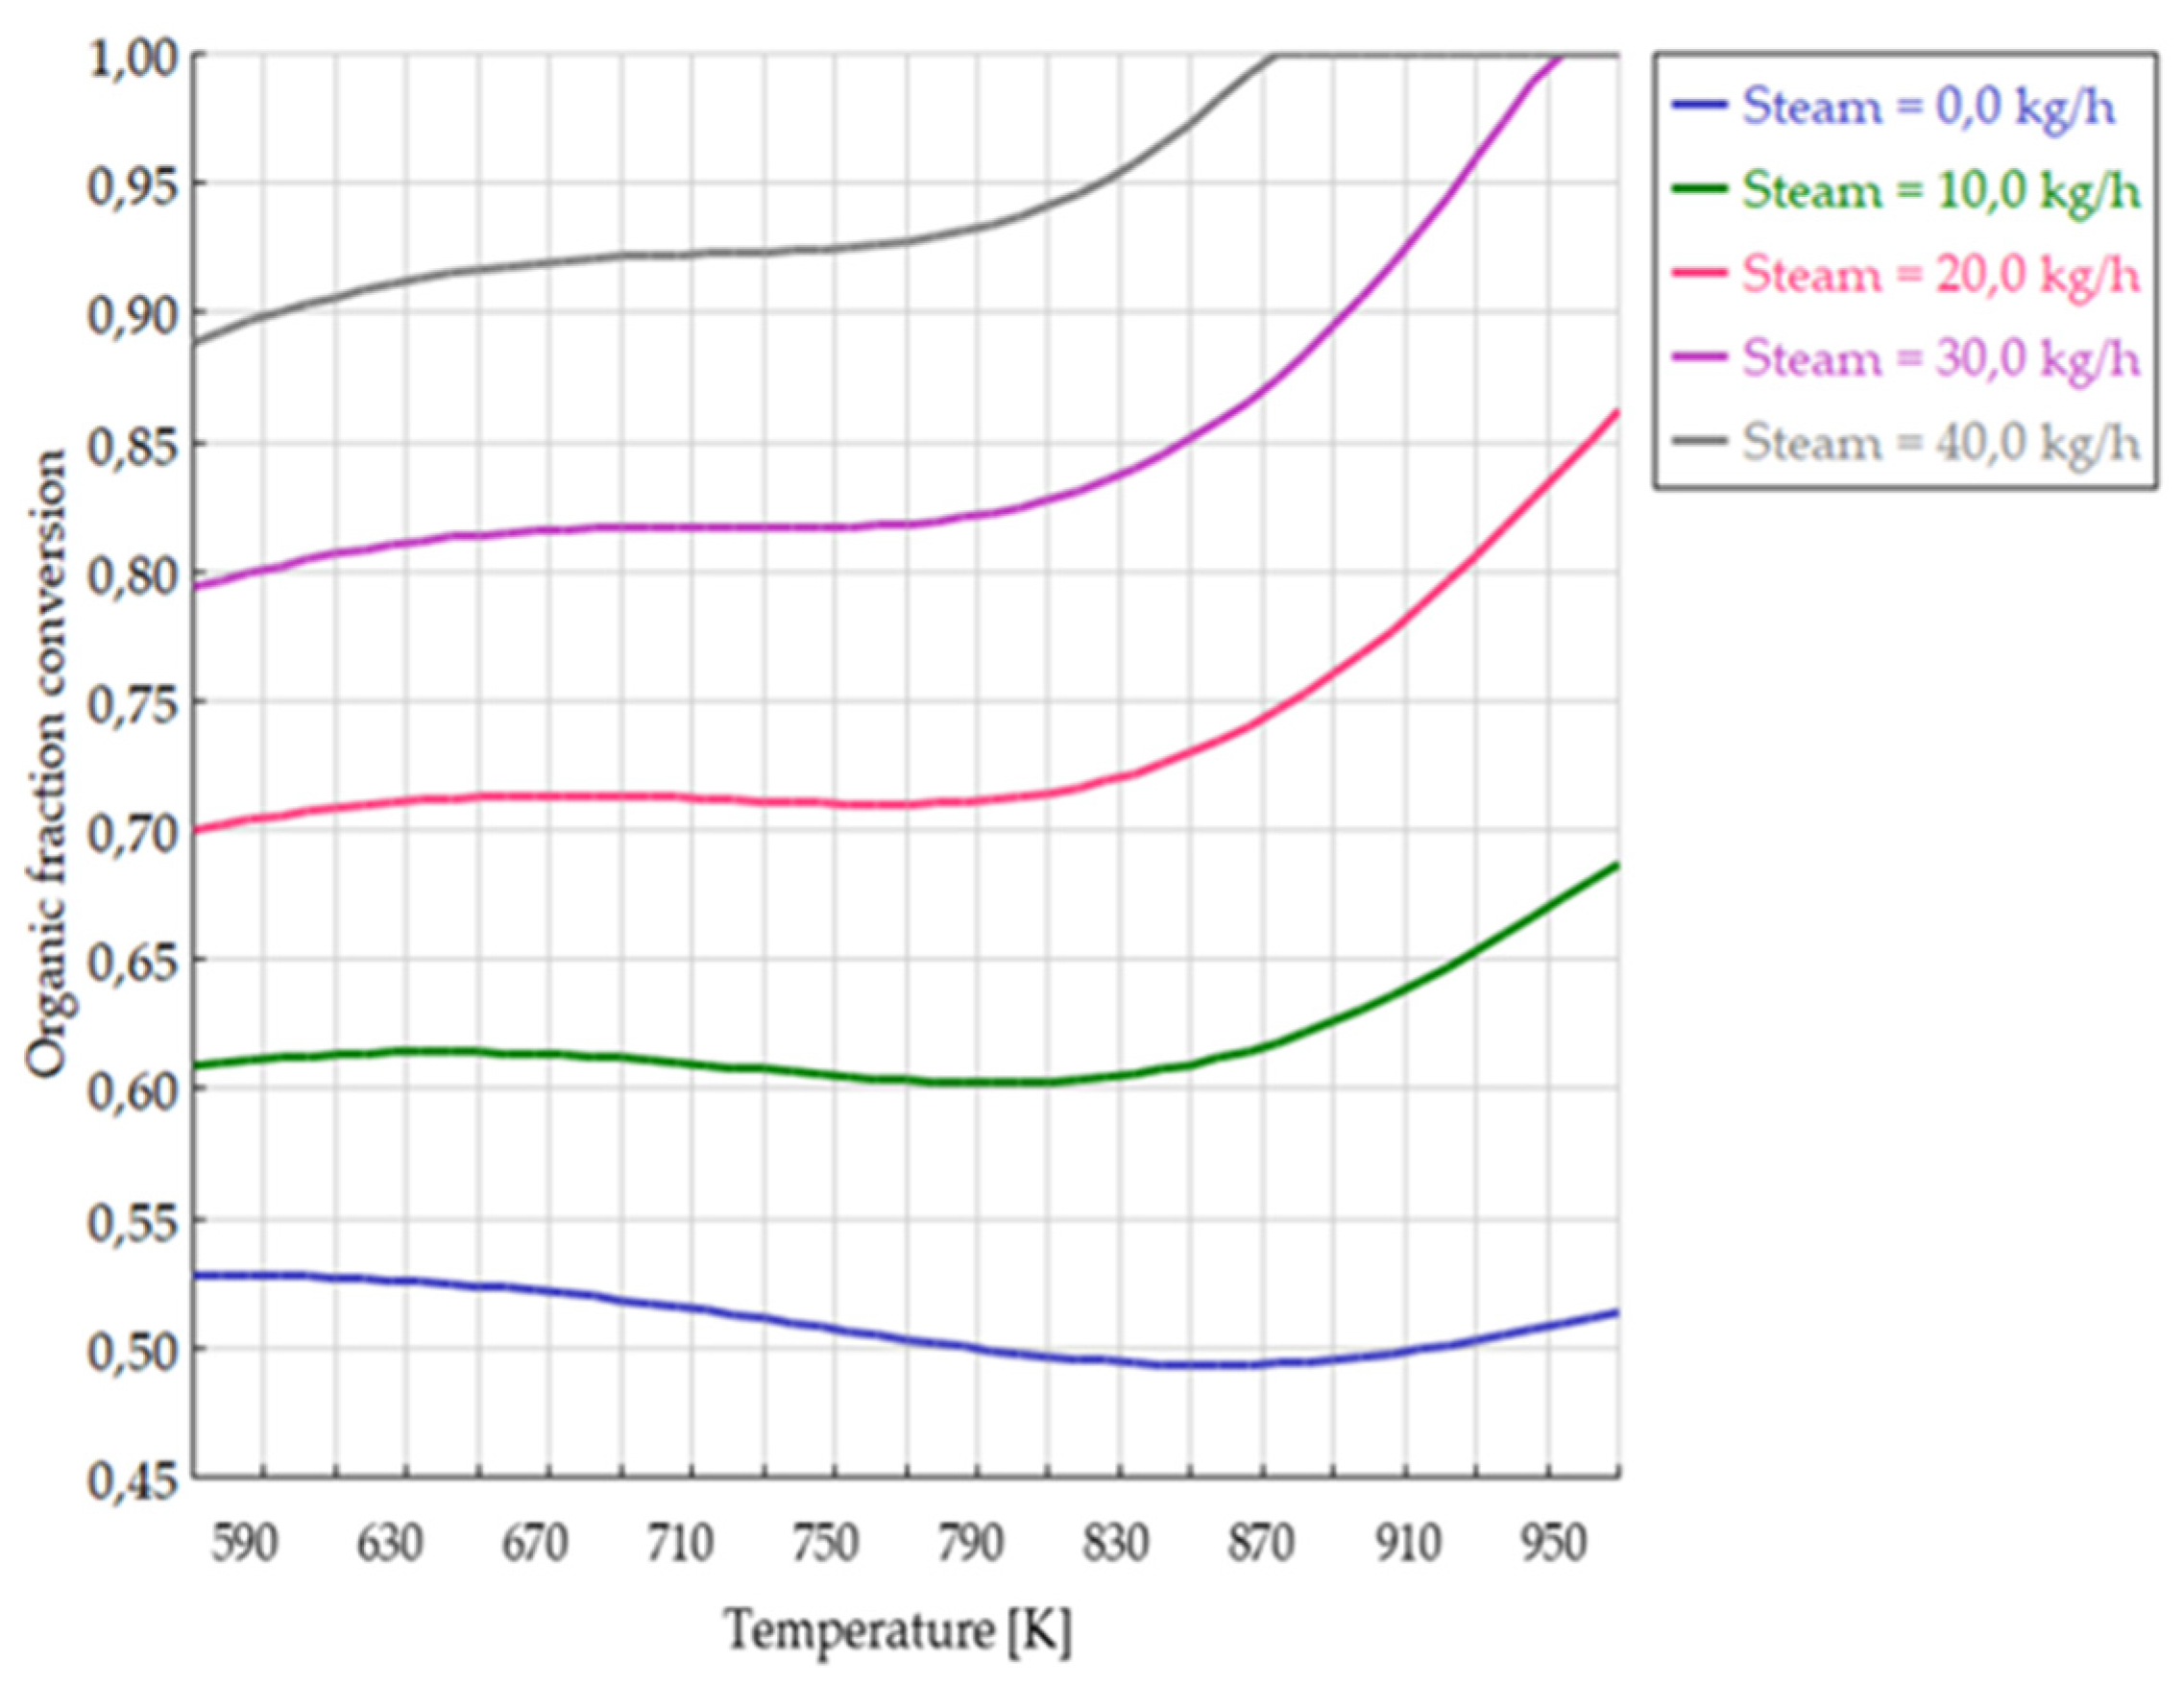
Figure 7 shows the effect of the reaction temperature on the conversion of the organic fraction for different vapor flow rates. It can be seen how with increasing temperature, there is generally an increase in conversion (except in the cases with low quantity of steam, where there are minima of around 823 K). It can be seen that the presence of the minimum is mainly due to the effect of temperature on the conversion. Indeed, with increasing steam, the minimum tends to disappear, hidden by the very positive effect of steam on conversion.
Increasing the steam flow leads to an increase in conversion. In particular, it can be seen how the complete conversion of the organic fraction takes place at lower temperatures for higher steam flow rates (for example, for 40 kg/h of steam, there is a complete conversion for temperatures higher than 873 K). The residual solid product of steam gasification not only has a reduced quantity of organic fraction, which would hinder the subsequent leaching phase, but this gasified material "opens" its interior, facilitating hydrometallurgical processing [
12].
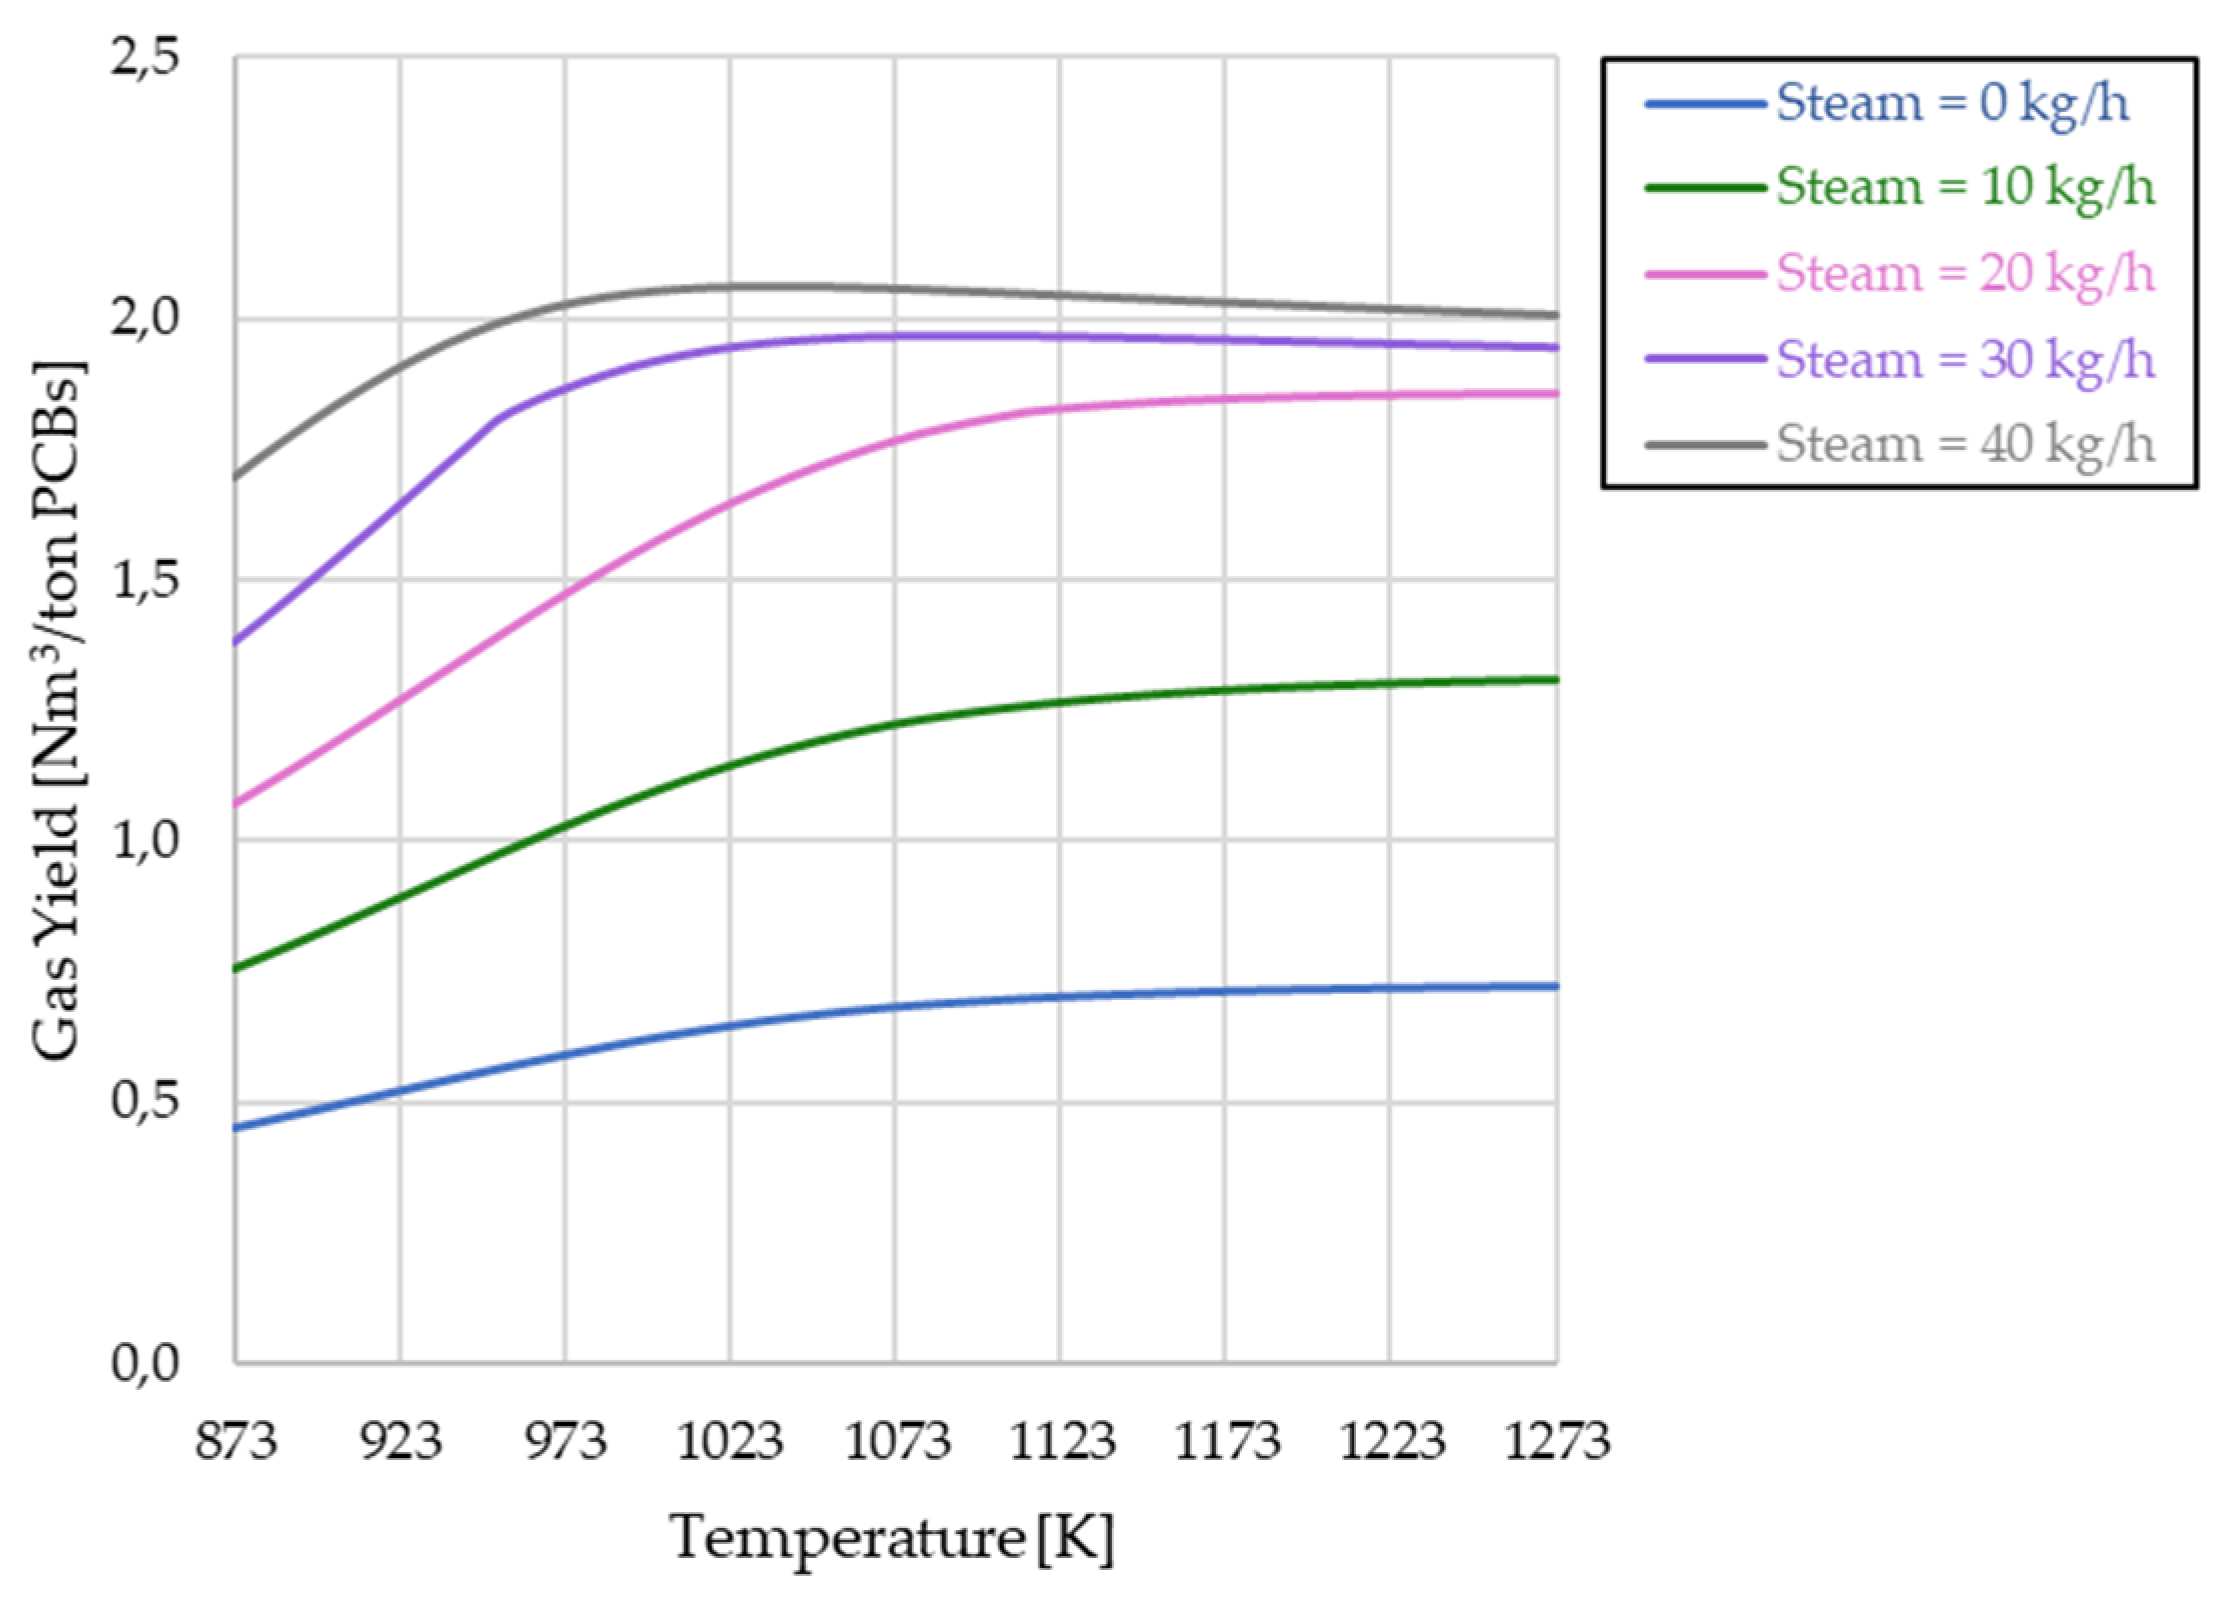
The model was also used to evaluate the effect of temperature and quantity of steam on the syngas yield for a typical temperature range of gasification processes. The results of this sensitivity analysis are reported in
Figure 8. It can be seen how the gas yield increases as the temperature and the steam/carbon ratio increase. If the temperature increases, the thermal energy that breaks down the feedstock into its component gases increases, leading to a higher gas yield. Similarly, as the steam-to-carbon ratio increases, the amount of steam available to react with the carbon in the feedstock increases, leading to a higher gas yield. However, it is important to note that if the amount of steam is increased, an optimum temperature for gasification begins to appear since increasing these parameters beyond certain levels can lead to a decrease in gas yield due to the formation of unwanted by-products.
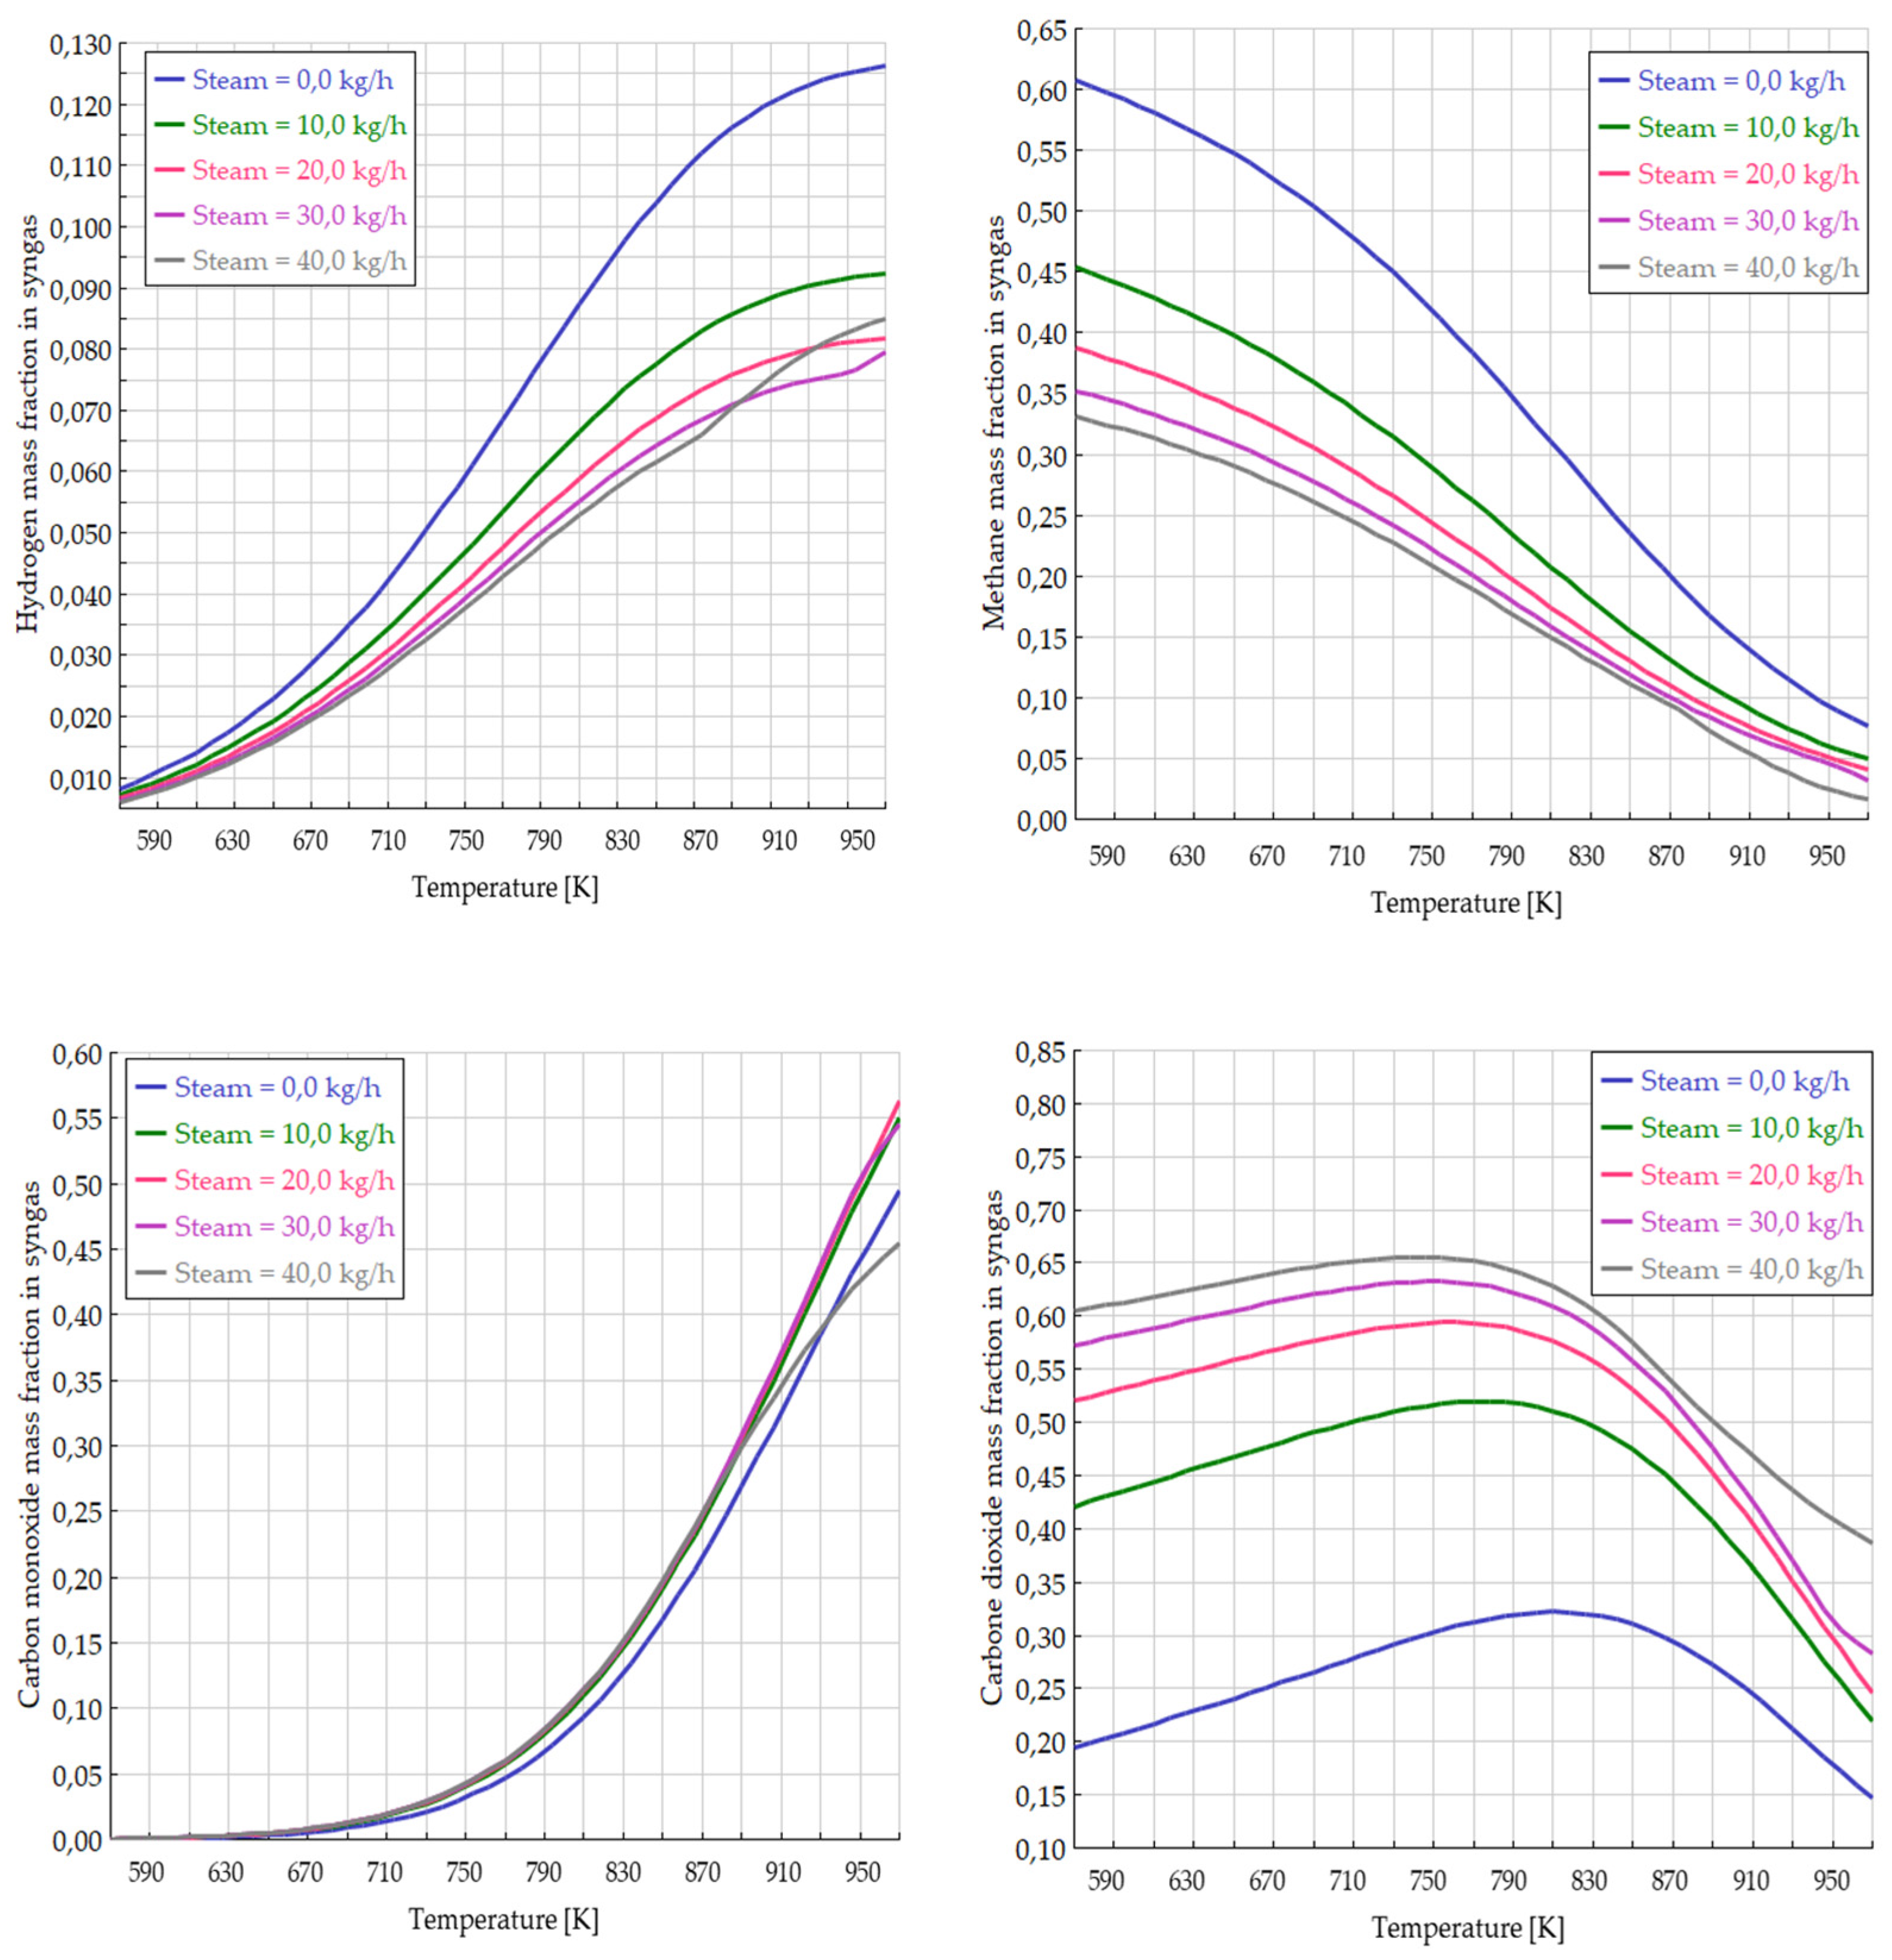
The results of the sensitivity analysis in terms of syngas composition are shown in
Figure 9. In the temperature range analyzed and with the steam flow rates from 0 to 40 kg/h, hydrogen tends to decrease initially with the increase in the steam flow. However, if the sensitivity analysis range is extended to higher quantities of steam (a steam-feedmass ratio greater than 0.5), a reversal of the trend is observed. In this case, the concentration of CO and H
2 have a trend that slowly increases when the steam-feed mass ratio increases. This result can be explained by more steam reforming reactions of CO and H
2 taking place because of increased steam quantity. At temperatures above 873 K, CH
4 slightly improves with increasing steam flow rate as opposed to CO
2, which has the opposite behavior. The increase in temperature leads to an increase in H
2 and CO, and a decrease in the trend of CH
4 and CO
2.
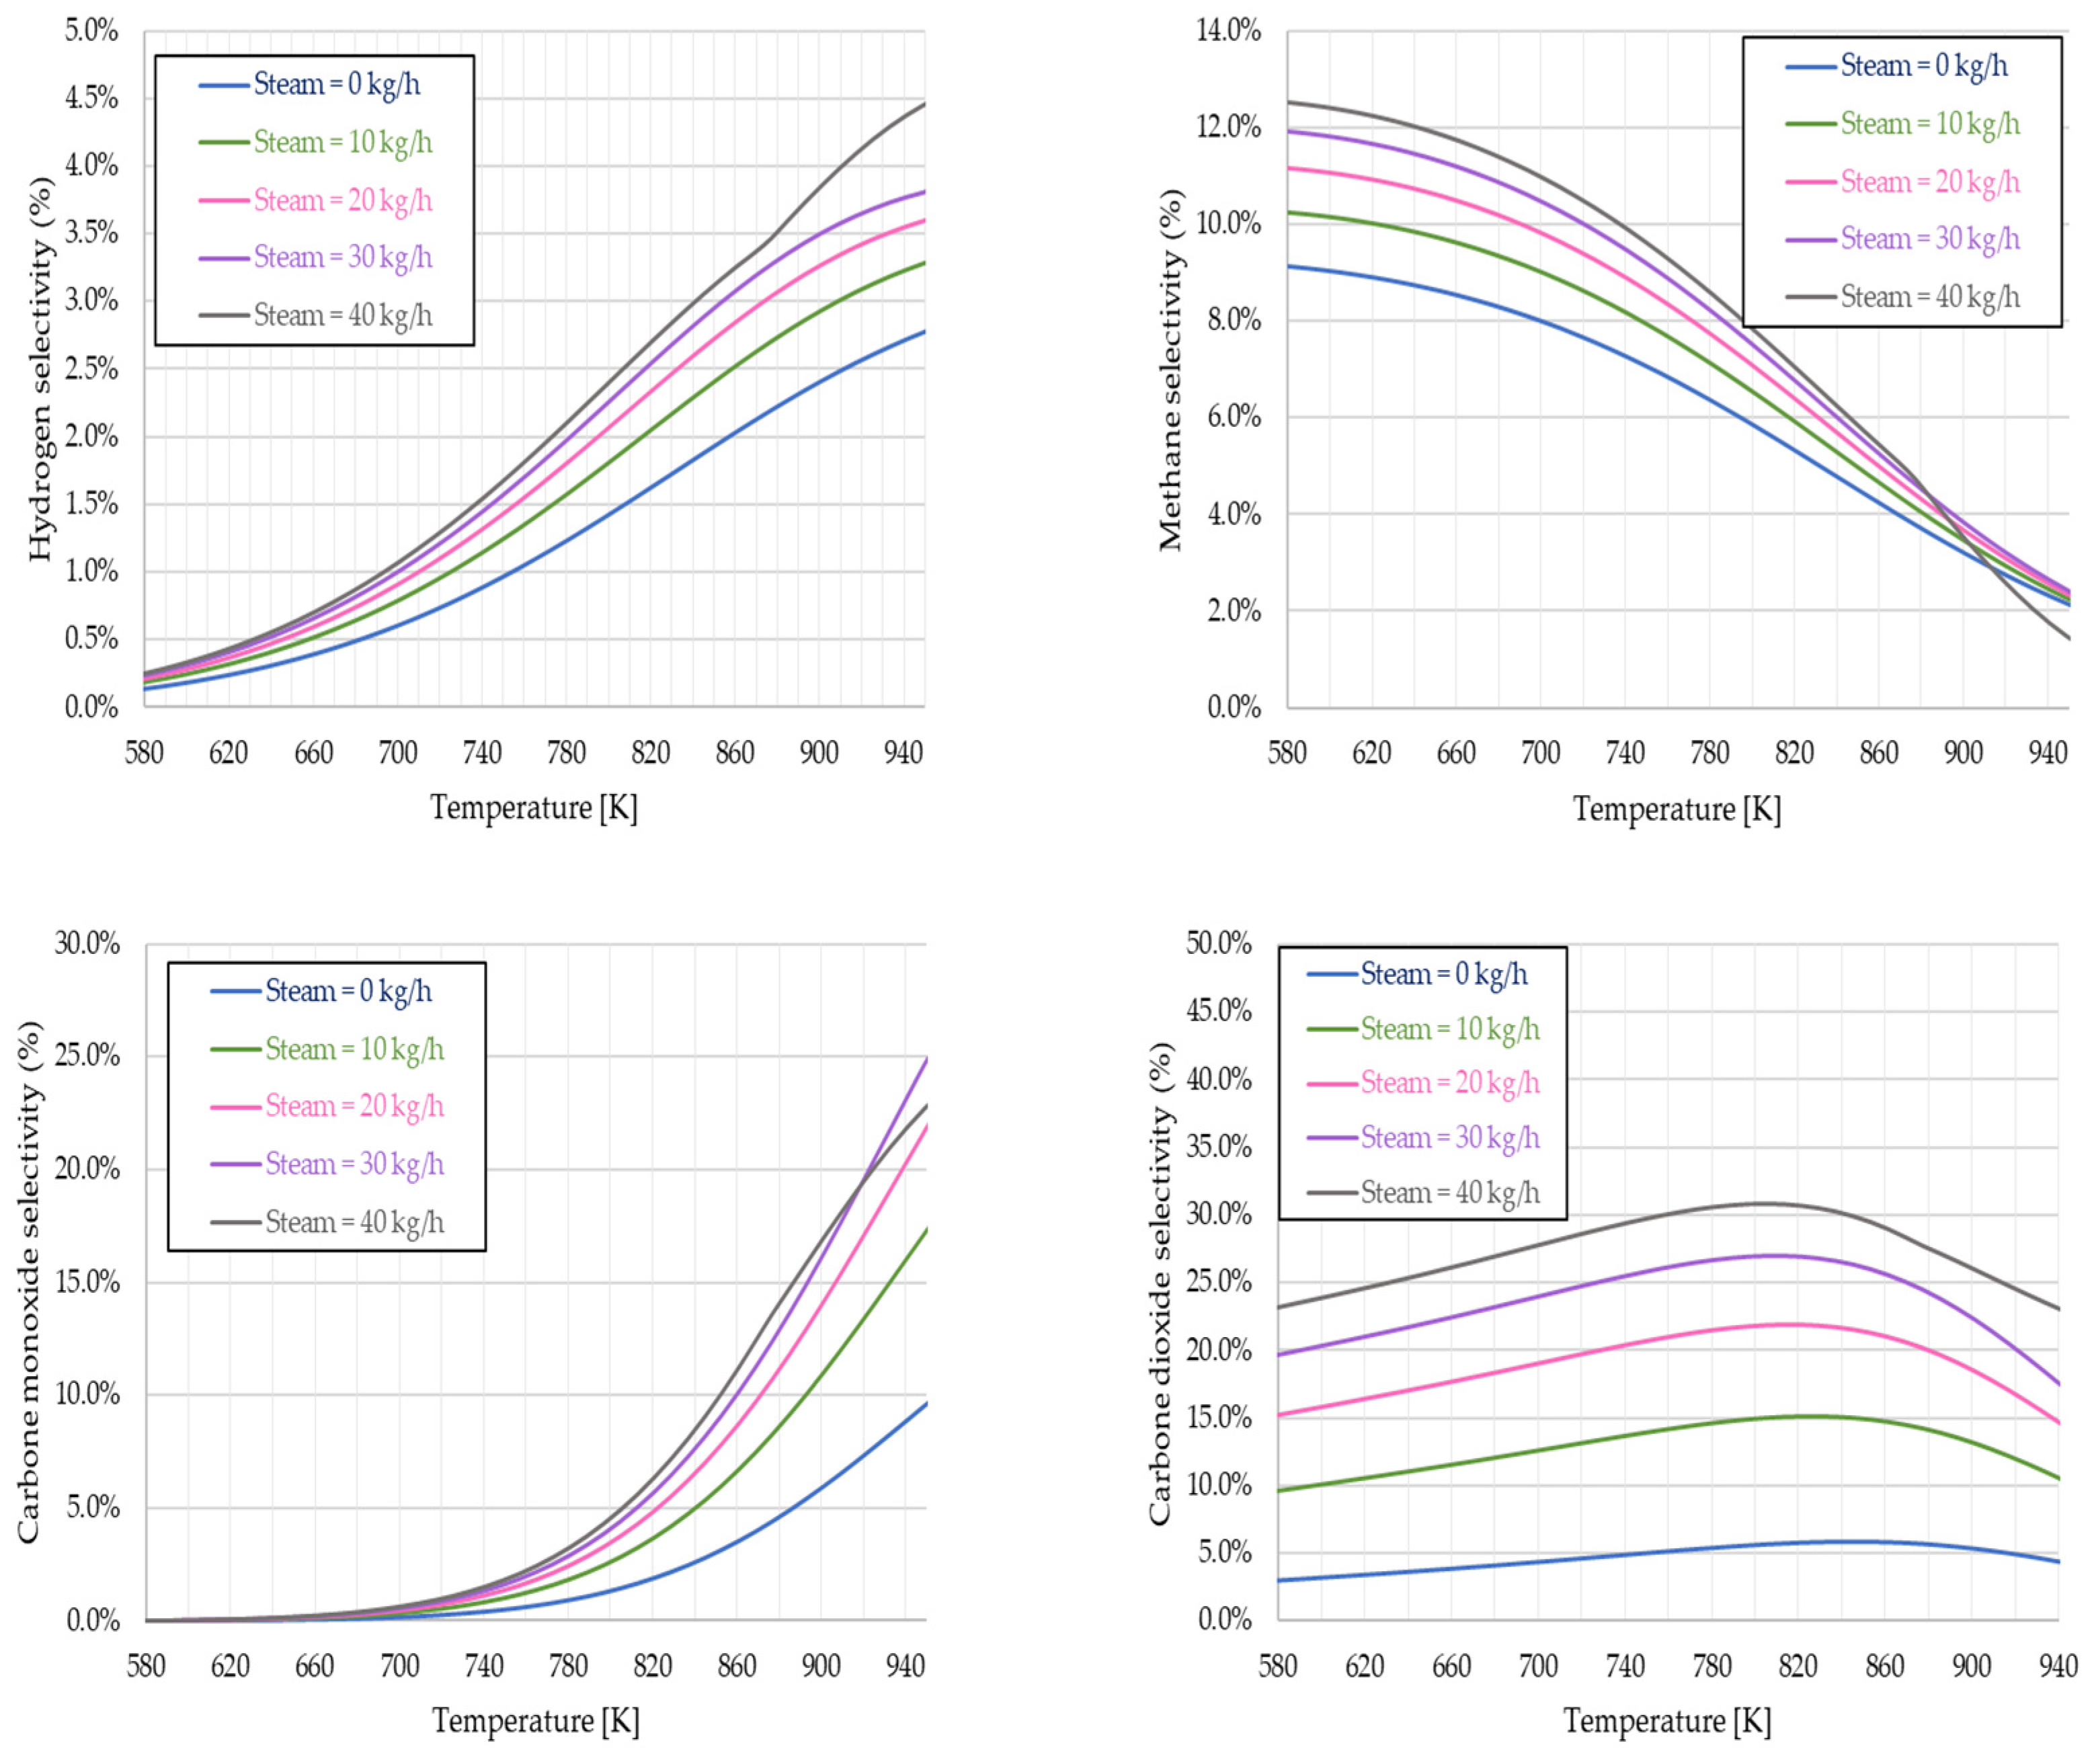
The results of the sensitivity analysis in terms of component selectivity are shown in
Figure 10. Hydrogen selectivity tends to increase with the increase in temperature and steam flow. The selectivity of methane tends to decrease with the increase in temperature and, for high temperatures, it also decreases with the increase in steam. CO behavior is very similar to H
2, as also seen for the composition of syngas if it remains below temperatures of about 900 K and below 40 kg/h of steam. Finally, it can be seen that the selectivity of CO
2 has a maximum of around 820 K and increases as the amount of steam increases, certainly due to the effect of the water–gas shift reaction.
4. Conclusions
The process simulation with ASPEN PLUS to describe and study the thermodynamic behavior of the pyrolysis of electronic boards has proved to be very reliable as a predictive model. The results obtained through simulation accurately reflect those found in the literature. However, the model can be further improved by adding other organic compounds as possible pyrolysis products.
The simplifying hypothesis of using bisphenol A as a reference component for the organic fraction of PCBs proved correct, given the results obtained.
Thanks to the developed model, it was possible to carry out a sensitivity analysis aimed at the optimal configuration and the best process conditions to remove the greatest possible quantity of organic fraction present in PCBs without numerous experimental tests. Introducing steam into the Gibbs reactor or increasing the pyrolysis temperature has improved the conversion. Based on the sensitivity analysis, it has been seen that an excellent efficiency of the organic fraction from the boards is obtained if one operates with a 0.4 mass ratio between steam and feed at a reaction temperature of about 873 K.
The simulation made it possible to estimate syngas’ characteristics, such as the flow rate, composition, and selectivity.
Therefore, pyrolysis represents a technologically feasible solution as a pre-treatment for enhancing printed cards with enormous scope for optimization. This technology allows for the removal of the organic fraction, which would hinder a possible leaching step for the recovery of metals from the solid matrix, and the enhancement of the organic fraction by converting it into syngas. A model such as the one presented in this work allows for optimizing numerous aspects without needing to conduct complicated and expensive tests.


