

A Detailed Database of the Chemical Properties and Methane Potential of Biomasses Covering a Large Range of Common Agricultural Biogas Plant Feedstocks
Abstract
:1. Introduction

| Reference | Data Access | Sample Description | N. (Total Number) | ISR | Min BMP | Mean BMP (Nm3 CH4/t VS) | Max BMP |
|---|---|---|---|---|---|---|---|
| [14] | Yes | 30 organic substrates, including 2 raw manures, 9 food residues, 5 invasive aquatic plants, and 6 other organic wastes | 22 | 1 | 122 | 341 | 649 |
| [20] | Yes | Reed canary grasses | 14 | 0.8 | 283 | 348 | 417 |
| [21] | Yes | 11 crops | 41 | 2 | 177 | 311 | 401 |
| [22] | Yes | 4 grasses and 2 legume species | 61 | 2 | 265 | 338 | 422 |
| [5] | Yes | Biomasses from first-, second-, and third-generation: 6 cereal crops, 3 oilseed rapes, 7 root crops, 5 grass silages, 2 baled silages, 8 other grass substrates, 7 dairy slurries, 4 other agricultural wastes, 4 milk processing wastes, 4 abattoir wastes, 7 miscellaneous wastes, 10 domestic and commercial food wastes, 3 alternative waste substrates, and 12 seaweeds | 83 | 2 | 99 | 328 | 805 |
| [23] | Yes | 20 sludge samples | 20 | 2–2.5 | 58 | 181 | 318 |
| [17] | Yes 51/57 | 18 plants, 12 grasses, 5 bushes, 16 trees, 4 cereals, and 1 straw | 57 | 3 | 104 | 219 | 479 |
| [15] | Yes | 5 energy crops, 8 lignocellulosic biomasses, 7 herbaceous and vegetable by-products, 7 fruit by-products, 6 livestock effluents, and 18 food by-products | 50 | 2 | 71 | 325 | 729 |
| This study | Yes | 46 energy crops and silages, 5 slurries, 31 manures, 17 cereal and agro-industrial residues, and 32 lignocellulosic biomasses | 131 | 3 | 63 | 283 | 551 |
| [24] | Yes Appendix * | 3 animal manures, 3 crop straws, 5 food and green wastes, 2 processing organic wastes, 1 energy grass, and 2 lignocellulosic biomasses | 16 | 2 | 49 | 317 | 811 |
| [18] | Yes Appendix * | 48 maize genotypes selected for diverse maturity and biomass production | 204 | - | 295 | 329 | 355 |
| [16] | Yes Appendix * | 17 Miscanthus, 16 switch grasses, 36 spelt straws, 37 fiber sorghums, 369 tall fescues, 21 immature ryes, and 73 fiber corns | 569 (588) | 2 | 147 | 389 | 589 |
| [19] | Yes Appendix * | 405 silages from 43 crop species | 43 | 2 | 143 | 304 | 425 |
| [25] | No | 68 municipal solid wastes, 7 MSW mix, 9 raw substrates, and 18 lignocellulosic wastes | 20 (102) | 0.5 | 87 | 257 | 226 |
| [26] | No | 95 meadow grasses | 95 | - | 51 | 288 | 406 |
| [27] | No | 57 agro-industrial biomasses, 1 macroalgae, 20 biowastes, 4 energy crops, 11 fatty wastes, 14 meat wastes, 2 co-digestion mixtures, 66 WWTP, 42 plants and vegetables, 18 agro-industrial sludges, 30 sewage sludge WWTP, and 31 municipal solid wastes | 296 | 2–5 | 0 | 291 | 1344 |
| [28] | No | 33 energy crops, 15 lawn grasses, 19 hedge trimmings, and 21 wild plants | 88 | 3 | 104 | 251 | 502 |
| [29] | No | 23 anaerobic sludges, 30 standard compounds, 50 household wastes, 10 agriculture wastes, 19 sewage sludges, and 6 lipid-rich wastes | 138 | 2 | 39 | 361 | 943 |
| [30] | No | 48% agricultural residues, 29% animal beading wastes, 6% AD feedstock, AD digestates, lipid wastes, algae, MSW, and agro-industrial wastes | 289 | 2.8 | 56 | 287 | 879 |
| [6] | No | 12 lignocellulosic biomasses | 12 | 2 | 155 | 225 | 300 |
2. Materials and Methods
2.1. Sampling
2.2. Elemental Composition and Fiber Analysis
2.3. Biochemical Methane Potential Measurement (BMPexp)
3. Results
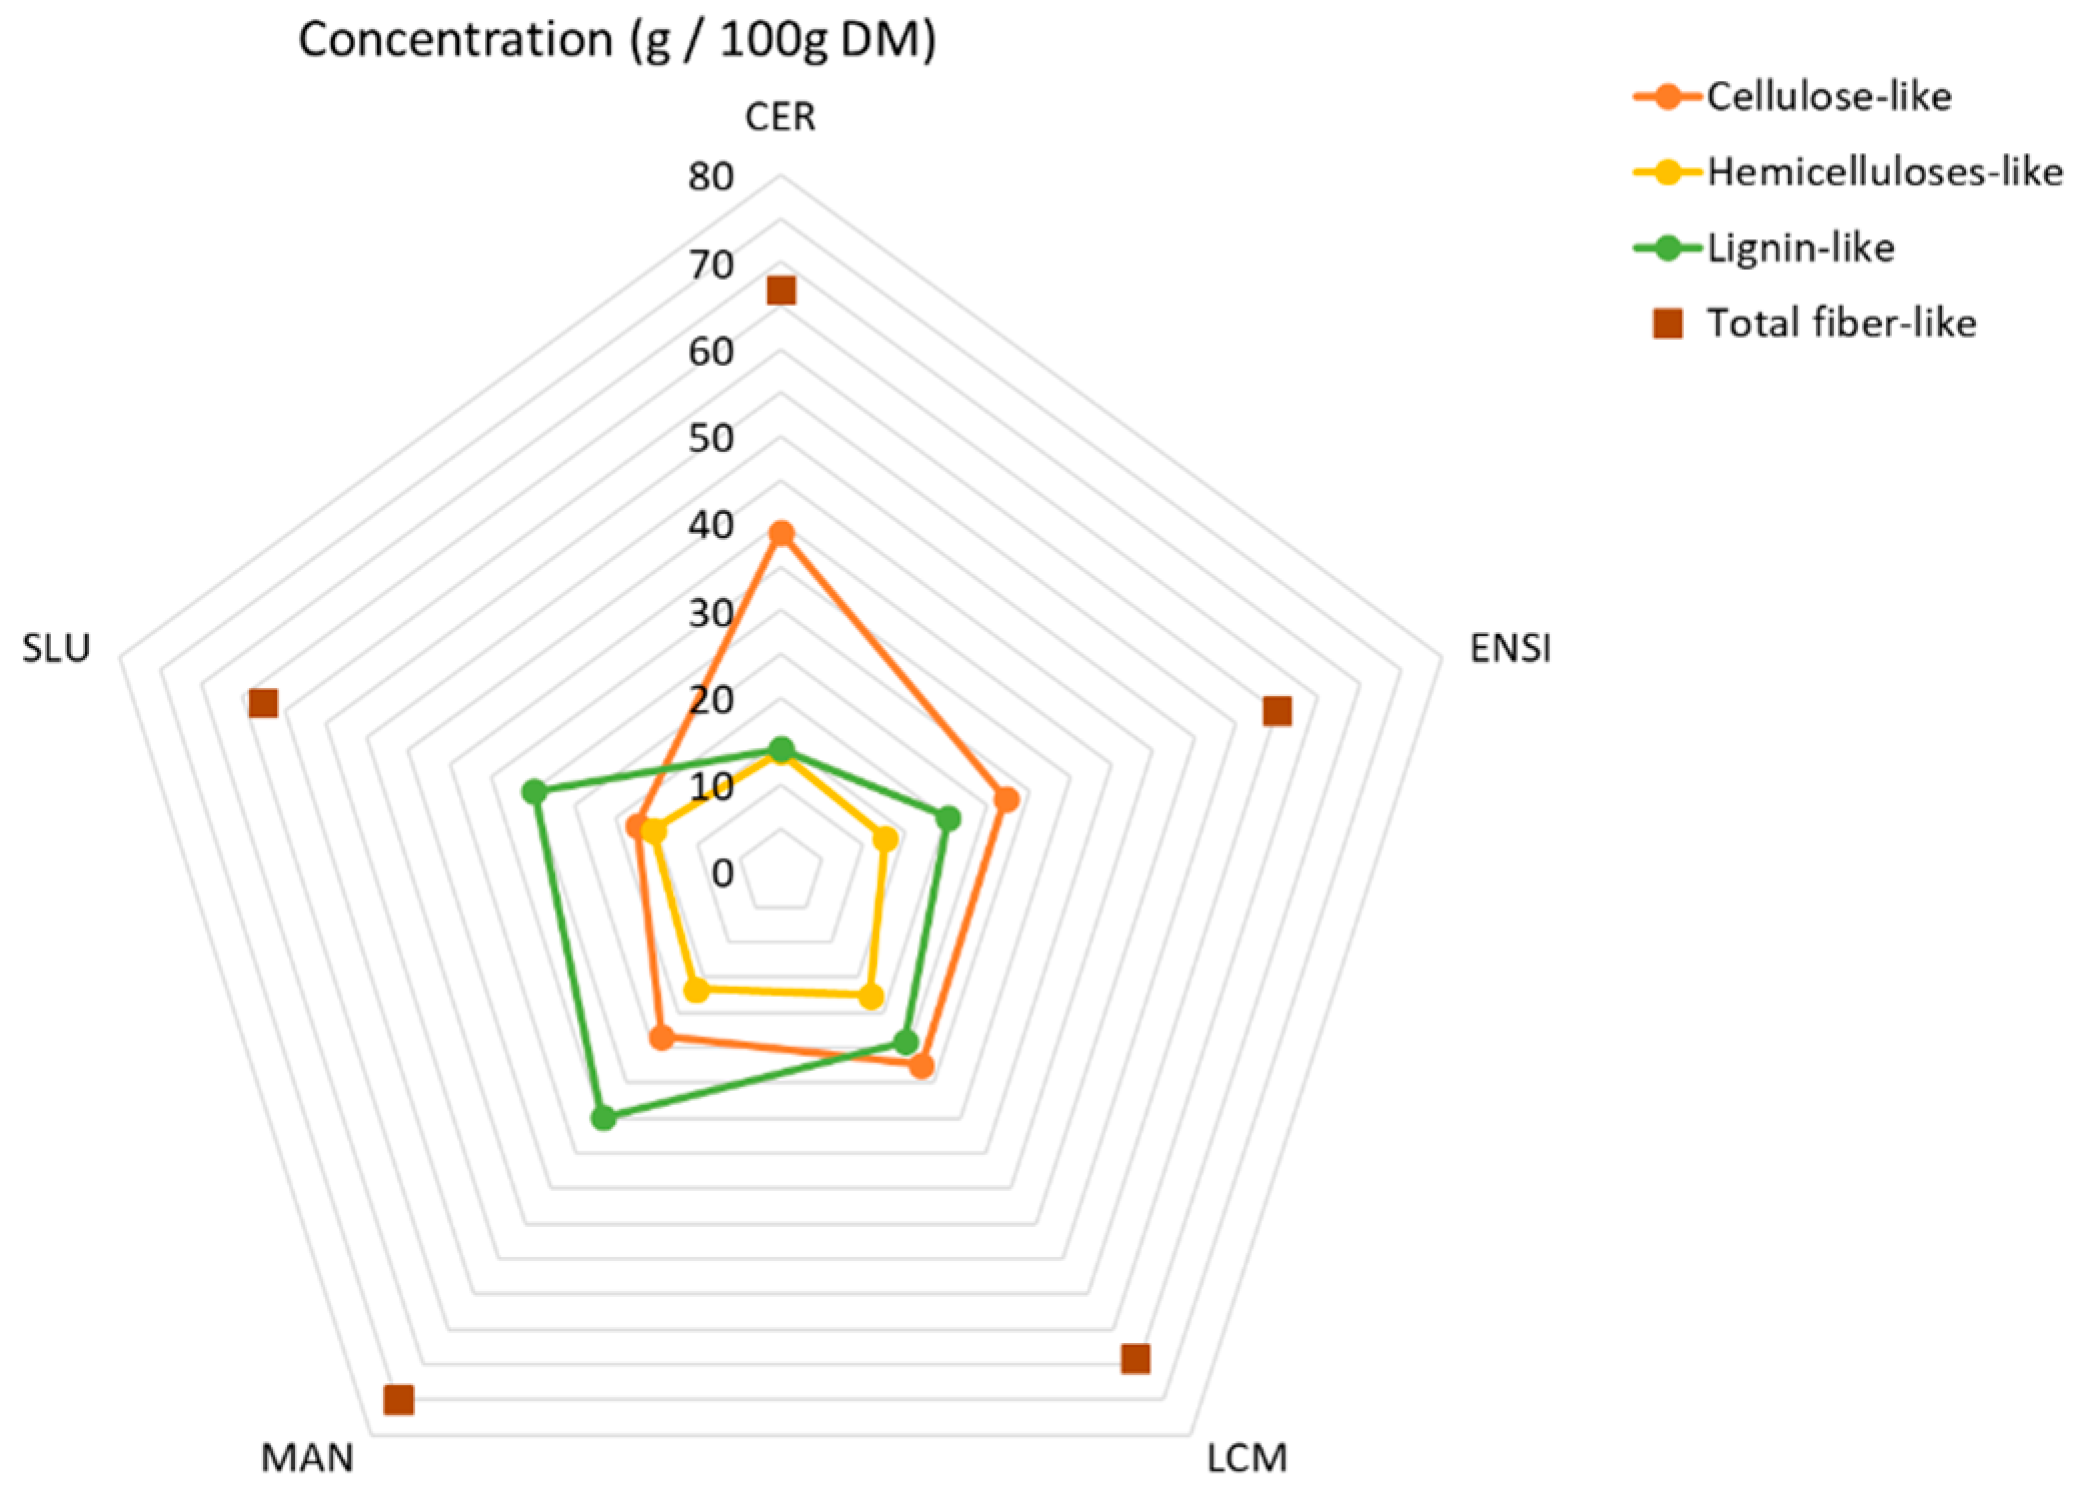
3.1. Chemical Composition of the Various Biomasses
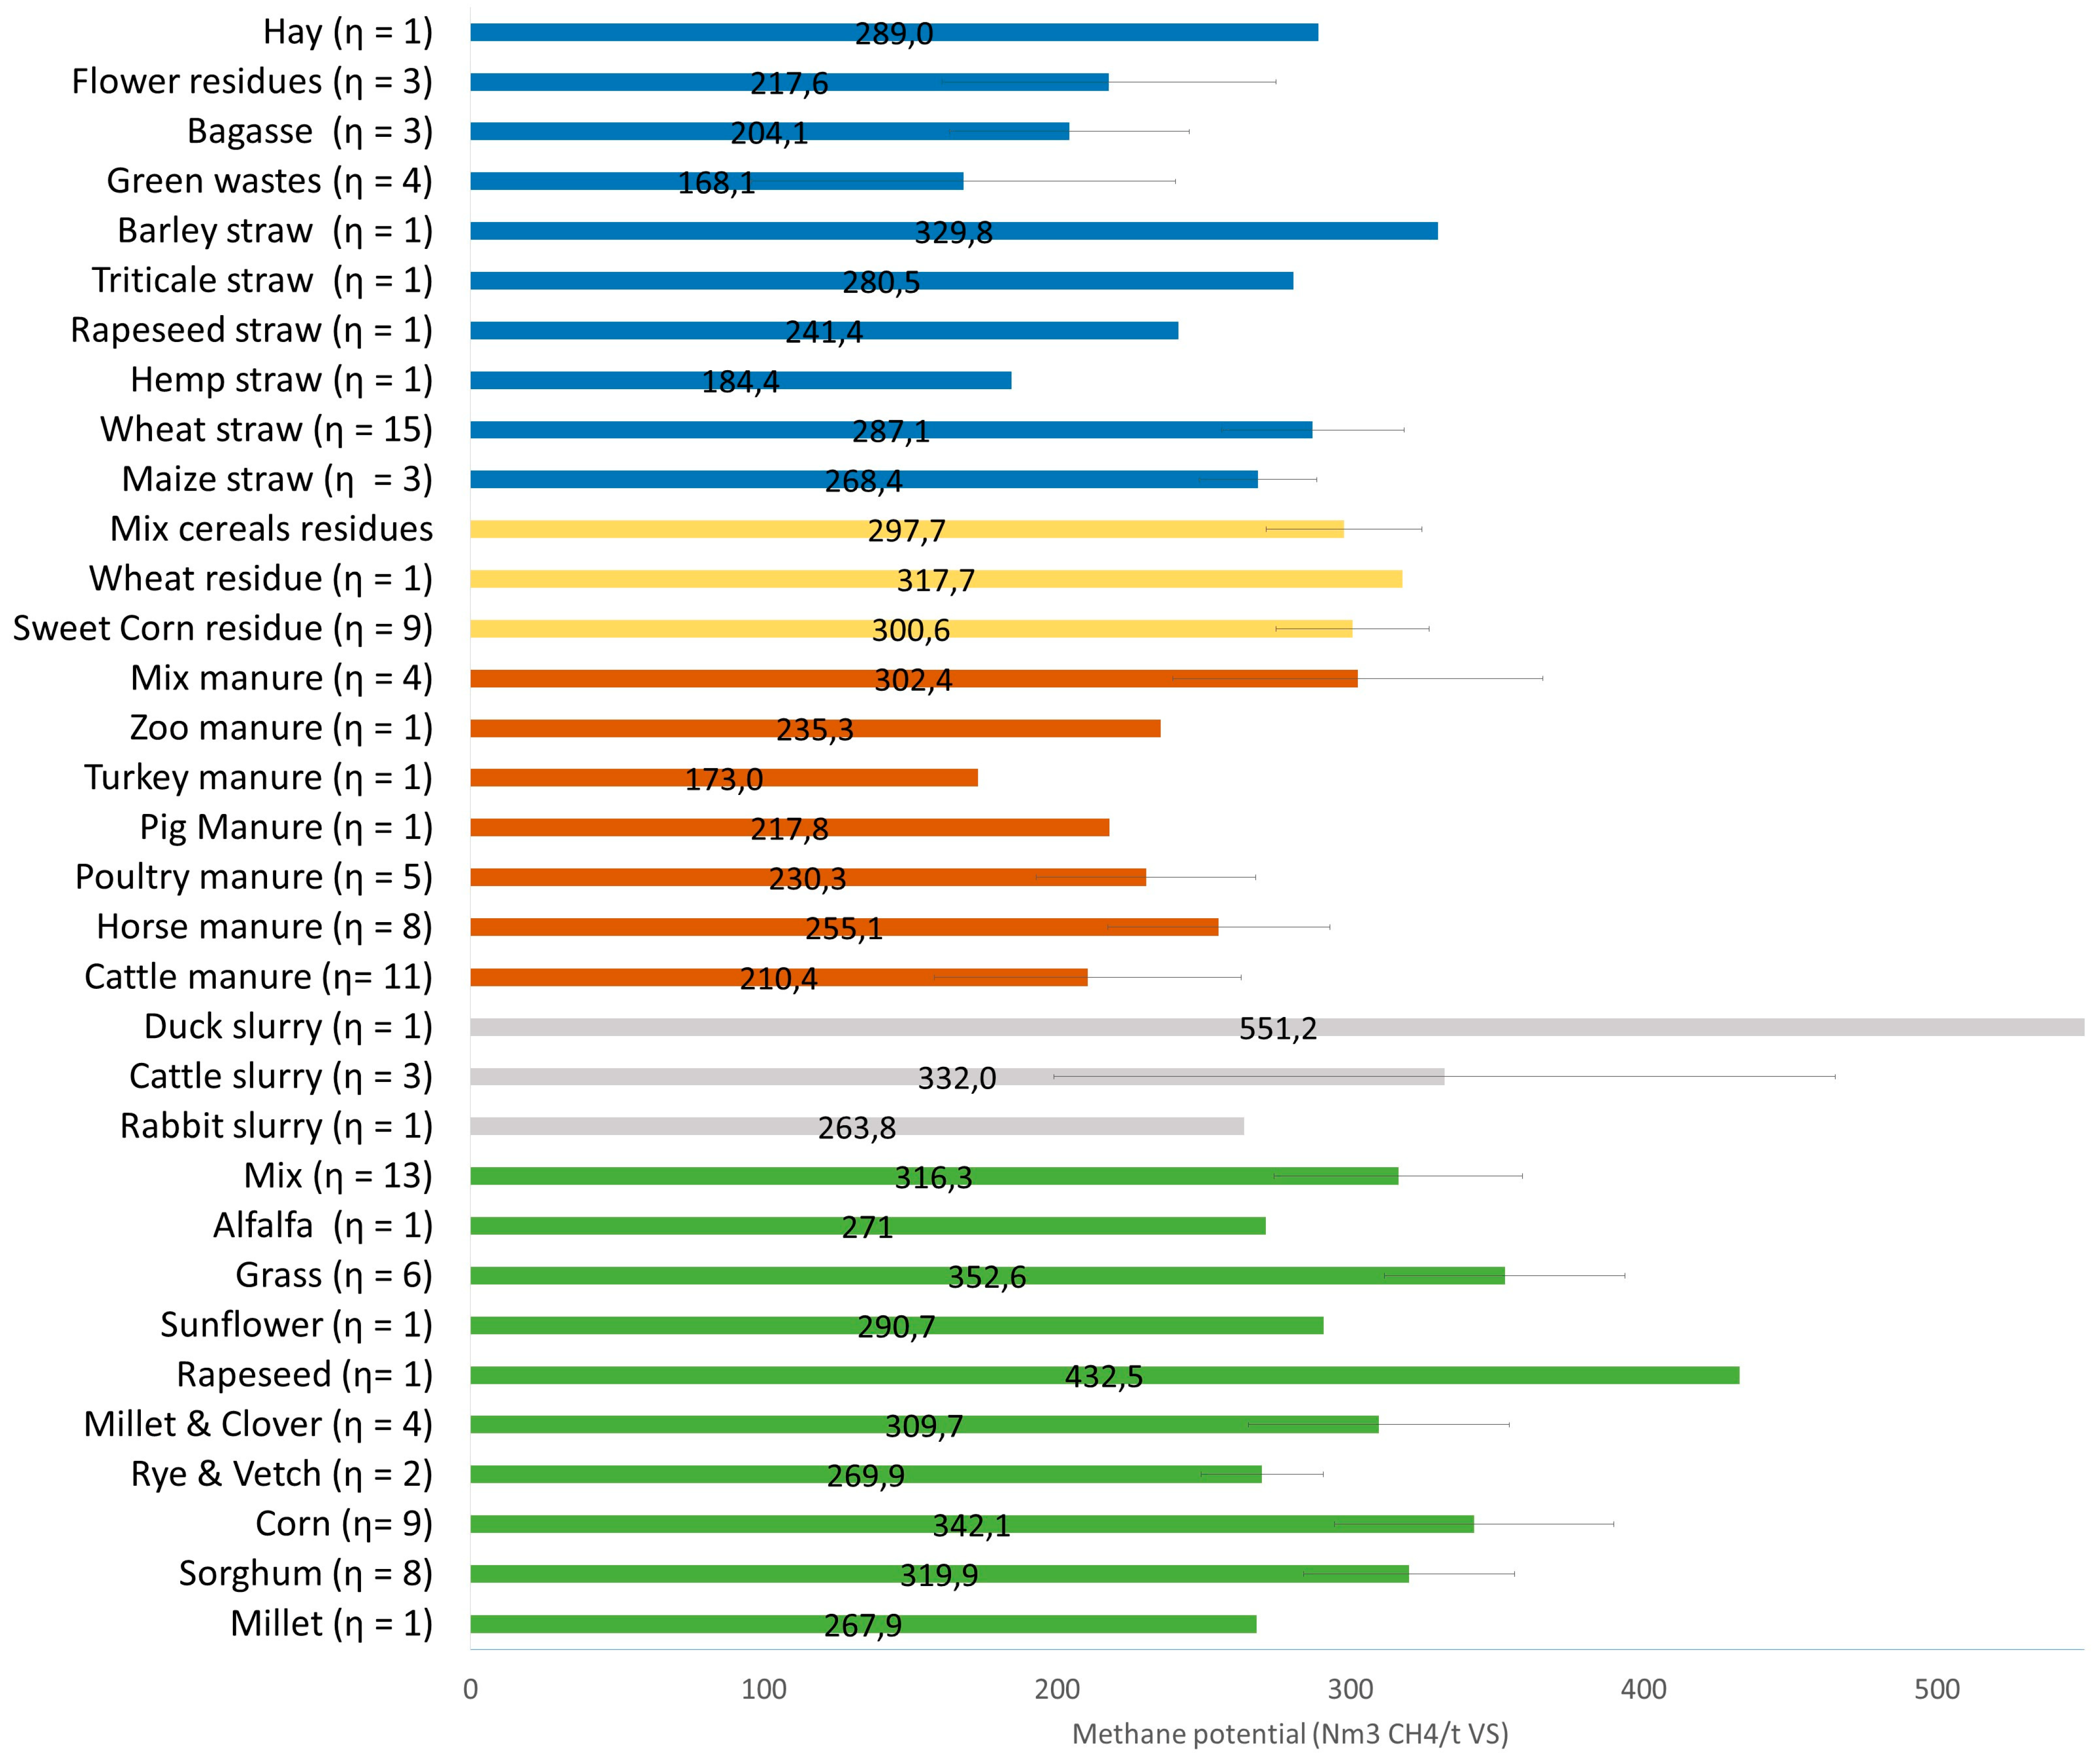
3.2. Biochemical Methane Potential of Feedstock
3.2.1. Cereal and Agro-Industrial Residues (CER)
3.2.2. Manures (MAN)
3.2.3. Animal Slurries (SLU)
3.2.4. Silages and Energy Crops (ENSI)
3.2.5. Lignocellulosic Biomasses (LCM)
3.3. Practical Implementation of this Database
4. Discussion
5. Conclusions
Author Contributions
Funding
Informed Consent Statement
Data Availability Statement
Acknowledgments
Conflicts of Interest
Appendix A
| Family | Type | Sub Type | DM | VS | VS/DM | BMP exp | Biodegradation | C/N | Carbon | Hydrogen | Nitrogen | Sulfur | Oxygen | ||||||
|---|---|---|---|---|---|---|---|---|---|---|---|---|---|---|---|---|---|---|---|
| Mean | Mean | Mean | Mean | SD | CV(%) | Mean | SD | Mean | SD | Mean | SD | Mean | SD | Mean | |||||
| (% FM) | (Nm3 CH4/t VS) | % | (% DM) | (% DM) | (% DM) | (% DM) | (% DM) | ||||||||||||
| ENSI | Millet | --- | 22.9 | 20.8 | 0.91 | 267.9 | 11.9 | 4% | 61 | 54.1 | 42.7 | 0.1 | 5.3 | 0.1 | 0.8 | 0.1 | 0.2 | 0.1 | 41.9 |
| ENSI | Sorghum | --- | 18.4 | 16.2 | 0.88 | 361.8 | 4.1 | 1% | 79 | 28.2 | 42.3 | 0.0 | 5.6 | 0.2 | 1.5 | 0.1 | 0.3 | 0.2 | 38.5 |
| ENSI | Mix | Sorghum, Millet, and Sunflower mix | 16.5 | 14.9 | 0.90 | 406 | 10.9 | 3% | 87 | 19.1 | 43.1 | 0.1 | 6.0 | 0.0 | 2.3 | 0.0 | 0.3 | 0.0 | 38.8 |
| ENSI | Sorghum | Sucro variety | 15.5 | 14.3 | 0.92 | 351.3 | 8.5 | 2% | 79 | 25.1 | 42.6 | 0.3 | 6.0 | 0.0 | 1.7 | 0.0 | 0.2 | 0.0 | 41.8 |
| ENSI | Sorghum | Vega variety | 16.1 | 14.8 | 0.92 | 360.4 | 6.4 | 2% | 79 | 19.5 | 43.4 | 0.1 | 5.9 | 0.0 | 2.2 | 0.1 | 0.2 | 0.0 | 39.9 |
| ENSI | Mix | Vega sorghum variety and San Lucas sunflower variety | 21.5 | 19.1 | 0.89 | 286.9 | 17.1 | 6% | 67 | 25.3 | 41.5 | 0.1 | 5.3 | 0.1 | 1.6 | 0.2 | 0.3 | 0.1 | 40.4 |
| ENSI | Mix | Sunflower, Millet, and Guizotia abyssinica | 16.7 | 14.5 | 0.87 | 312.7 | 4.6 | 1% | 68 | 27.6 | 42.0 | 0.1 | 5.4 | 0.2 | 1.5 | 0.1 | 0.4 | 0.3 | 37.6 |
| ENSI | Mix | Sunflower, Millet, and Guizotia abyssinica | 17.6 | 15.7 | 0.89 | 318.4 | 0.9 | 0% | 69 | 30.4 | 42.8 | 0.2 | 5.5 | 0.0 | 1.4 | 0.1 | 0.2 | 0.1 | 39.1 |
| ENSI | Mix | --- | 18.6 | 16.5 | 0.89 | 337.1 | 32.1 | 10% | 70 | 32.8 | 42.5 | 0.1 | 6.1 | 0.1 | 1.3 | 0.2 | 0.2 | 0.0 | 38.6 |
| ENSI | Millet and Clover | --- | 15.9 | 14.1 | 0.89 | 374.1 | 1.7 | 0% | 85 | 26.6 | 40.6 | 0.0 | 5.8 | 0.2 | 1.5 | 0.3 | 0.2 | 0.0 | 40.6 |
| ENSI | Maize | --- | 35.2 | 33.9 | 0.96 | 272.1 | 5 | 2% | 63 | 47.5 | 42.6 | 0.3 | 6.5 | 0.1 | 0.9 | 0.2 | 0.1 | 0.0 | 46.2 |
| ENSI | Mix | Residue | 23.3 | 22.9 | 0.98 | 371.5 | 16.9 | 5% | 81 | 62.4 | 45.5 | 0.2 | 6.6 | 0.1 | 0.7 | 0.1 | 0.1 | 0.0 | 45.1 |
| ENSI | Sorghum | Sucro variety | 31.3 | 29.9 | 0.96 | 332.7 | 21.5 | 6% | 79 | 73.8 | 43.5 | 0.3 | 5.8 | 0.0 | 0.6 | 0.0 | 0.2 | 0.0 | 45.6 |
| ENSI | Mix | Sorghum (Pacific graze), Millet (Robusta), Vetch (Bingo and Massa), and Clover (Tabor) | 26.6 | 23.9 | 0.90 | 269.4 | 3.3 | 1% | 64 | 27.1 | 40.3 | 0.0 | 5.7 | 0.1 | 1.5 | 0.1 | 0.2 | 0.0 | 42.4 |
| ENSI | Millet and Clover | --- | 29.7 | 26.0 | 0.88 | 275.8 | 4.1 | 1% | 61 | 21.9 | 41.4 | 0.0 | 5.5 | 0.2 | 1.9 | 0.2 | 0.6 | 0.0 | 38.3 |
| ENSI | Millet and Clover | --- | 27.1 | 24.9 | 0.92 | 303.7 | 17.3 | 6% | 69 | 23.3 | 42.6 | 0.2 | 5.8 | 0.2 | 1.8 | 0.2 | 0.3 | 0.2 | 41.3 |
| ENSI | Millet and Clover | --- | 27.1 | 24.9 | 0.92 | 285.2 | 4 | 1% | 65 | 31.5 | 42.9 | 0.1 | 5.6 | 0.0 | 1.4 | 0.1 | 0.2 | 0.0 | 42.1 |
| ENSI | Sorghum | --- | 19.8 | 18.0 | 0.91 | 285.6 | 2.1 | 1% | 64 | 54.5 | 41.8 | 0.0 | 6.0 | 0.1 | 0.8 | 0.1 | 0.1 | 0.0 | 42.2 |
| ENSI | Maize | --- | 36.5 | 35.3 | 0.97 | 336 | 20.4 | 6% | 82 | 47.9 | 41.8 | 0.2 | 6.4 | 0.2 | 0.9 | 0.2 | 0.2 | 0.1 | 47.4 |
| ENSI | Rye and Vetch | --- | 49.4 | 45.9 | 0.93 | 255.1 | 10.9 | 4% | 62 | 40.2 | 42.3 | 0.3 | 5.3 | 0.2 | 1.1 | 0.1 | 0.2 | 0.0 | 44.1 |
| ENSI | Rye and Vetch | --- | 28.3 | 26.7 | 0.94 | 284.6 | 14.7 | 5% | 68 | 58.8 | 42.8 | 0.2 | 5.6 | 0.3 | 0.7 | 0.1 | 0.2 | 0.1 | 45.0 |
| ENSI | Mix | --- | 28.9 | 25.8 | 0.89 | 368.7 | 4.3 | 1% | 81 | 57.0 | 41.8 | 0.2 | 5.8 | 0.1 | 0.7 | 0.1 | 0.2 | 0.0 | 40.7 |
| ENSI | Mix | Faba bean, Rye, and Radish | 20.3 | 18.8 | 0.92 | 300.1 | 0.7 | 0% | 72 | 29.4 | 42.0 | 0.2 | 5.5 | 0.0 | 1.4 | 0.1 | 0.2 | 0.0 | 43.2 |
| ENSI | Mix | Faba bean, Triticale, and Radish | 17.5 | 16.1 | 0.91 | 294.3 | 6.2 | 2% | 70 | 30.2 | 41.0 | 0.3 | 5.7 | 0.1 | 1.4 | 0.1 | 0.3 | 0.0 | 43.1 |
| ENSI | Mix | Grass | 54.6 | 46.6 | 0.85 | 253.9 | 14.4 | 6% | 55 | 25.7 | 39.7 | 0.2 | 5.8 | 0.1 | 1.5 | 0.2 | 0.3 | 0.0 | 37.9 |
| ENSI | Mix | Sorghum and Maize | 32.1 | 28.4 | 0.89 | 315.9 | 1.8 | 1% | 74 | 51.5 | 38.7 | 0.2 | 6.1 | 0.2 | 0.8 | 0.2 | 0.3 | 0.2 | 42.8 |
| ENSI | Mix | Peas, Vetch, Oats, and Beans | 27.0 | 24.5 | 0.91 | 331 | 15 | 5% | 67 | 20.6 | 45.0 | 0.0 | 6.1 | 0.0 | 2.2 | 0.2 | 0.2 | 0.0 | 37.4 |
| ENSI | Maize | --- | 33.0 | 32.1 | 0.97 | 319.1 | 10.7 | 3% | 73 | 44.4 | 44.4 | 0.2 | 6.4 | 0.1 | 1.0 | 0.0 | 0.1 | 0.0 | 45.4 |
| ENSI | Sorghum | --- | 35.9 | 33.1 | 0.92 | 272.6 | 3.7 | 1% | 62 | 51.7 | 43.9 | 0.3 | 5.3 | 0.1 | 0.8 | 0.0 | 0.2 | 0.2 | 42.0 |
| ENSI | Mix | Moha and Clover | 50.3 | 44.8 | 0.89 | 282.5 | 11.2 | 4% | 58 | 34.9 | 43.9 | 0.2 | 6.0 | 0.1 | 1.3 | 0.1 | 0.2 | 0.0 | 37.7 |
| ENSI | Rapeseed | --- | 18.2 | 17.2 | 0.94 | 432.5 | 5.6 | 1% | 93 | 79.4 | 44.4 | 0.3 | 6.4 | 0.2 | 0.6 | 0.1 | 0.5 | 0.5 | 42.4 |
| ENSI | Grass | --- | 27.8 | 24.7 | 0.89 | 264.3 | 15 | 6% | 57 | 25.2 | 41.5 | 0.2 | 6.1 | 0.1 | 1.6 | 0.2 | 0.2 | 0.0 | 39.3 |
| ENSI | Sorghum | --- | 23.6 | 21.2 | 0.90 | 305.3 | 3 | 1% | 69 | 45.0 | 40.8 | 0.0 | 6.0 | 0.0 | 0.9 | 0.1 | 0.2 | 0.1 | 41.8 |
| ENSI | Sunflower | --- | 15.6 | 14.1 | 0.90 | 290.7 | 0.9 | 0% | 63 | 44.1 | 41.7 | 0.2 | 6.3 | 0.0 | 0.9 | 0.1 | 0.2 | 0.0 | 41.2 |
| ENSI | Grass | --- | 17.2 | 13.5 | 0.78 | 406.3 | 4.8 | 1% | 70 | 34.6 | 42.8 | 0.1 | 5.8 | 0.2 | 1.2 | 0.0 | 0.2 | 0.0 | 28.2 |
| ENSI | Maize | --- | 28.5 | 27.2 | 0.96 | 376.3 | 31.1 | 8% | 89 | 43.3 | 43.1 | 0.1 | 5.9 | 0.3 | 1.0 | 0.1 | 0.1 | 0.0 | 45.4 |
| ENSI | Alfalfa | --- | 69.0 | 62.4 | 0.90 | 271 | 0.1 | 0% | 60 | 26.7 | 42.9 | 0.2 | 5.7 | 0.0 | 1.6 | 0.1 | 0.2 | 0.0 | 40.0 |
| ENSI | Sorghum | --- | 24.7 | 23.3 | 0.94 | 289.8 | 10.9 | 4% | 67 | 43.3 | 43.6 | 0.1 | 5.8 | 0.1 | 1.0 | 0.1 | 0.2 | 0.1 | 43.7 |
| ENSI | Grass | Ray-grass | 17.6 | 16.7 | 0.95 | 393.3 | 26.5 | 7% | 87 | 66.5 | 44.5 | 0.0 | 6.0 | 0.0 | 0.7 | 0.1 | 0.2 | 0.1 | 43.1 |
| ENSI | Maize | --- | 19.8 | 19.4 | 0.98 | 418 | 4.2 | 1% | 90 | 42.1 | 46.8 | 0.1 | 6.3 | 0.1 | 1.1 | 0.1 | 0.2 | 0.1 | 43.4 |
| ENSI | Grass | --- | 21.3 | 18.9 | 0.89 | 461.2 | 3.7 | 1% | 100 | 23.8 | 41.4 | 0.2 | 5.9 | 0.0 | 1.7 | 0.0 | 0.4 | 0.1 | 39.2 |
| ENSI | Maize | --- | 33.6 | 32.4 | 0.96 | 383.9 | 1.5 | 0% | 85 | 45.6 | 44.6 | 0.2 | 6.4 | 0.2 | 1.0 | 0.1 | 0.1 | 0.0 | 44.4 |
| ENSI | Maize | --- | 30.2 | 28.8 | 0.95 | 335.1 | 10 | 3% | 75 | 42.2 | 43.6 | 0.2 | 6.5 | 0.1 | 1.0 | 0.1 | 0.1 | 0.0 | 43.9 |
| ENSI | Grass | --- | 23.4 | 21.3 | 0.91 | 403.2 | 14.2 | 4% | 90 | 29.3 | 42.9 | 0.2 | 5.7 | 0.1 | 1.5 | 0.2 | 0.3 | 0.0 | 40.8 |
| ENSI | Grass | --- | 39.9 | 36.1 | 0.91 | 187.2 | 11.5 | 6% | 40 | 49.5 | 42.4 | 0.3 | 6.4 | 0.1 | 0.9 | 0.0 | 0.3 | 0.0 | 40.6 |
| ENSI | Maize | --- | 32.0 | 30.3 | 0.95 | 301.1 | 7.4 | 2% | 71 | 37.7 | 42.2 | 0.1 | 6.2 | 0.1 | 1.1 | 0.2 | 0.3 | 0.0 | 44.9 |
| MAN | Mix | Manure and Spates | 32.1 | 17.3 | 0.54 | 253.4 | 14.9 | 6% | 38 | 27.2 | 31.7 | 0.1 | 4.4 | 0.2 | 1.2 | 0.1 | 0.4 | 0.0 | 16.2 |
| MAN | Cattle | After phase separation, Straw | 15.3 | 13.8 | 0.90 | 321.9 | 16.8 | 5% | 80 | 15.8 | 39.8 | 0.0 | 5.4 | 0.0 | 2.5 | 0.1 | 0.5 | 0.0 | 41.8 |
| MAN | Horse | --- | 8.0 | 5.3 | 0.66 | 237.6 | 14.3 | 6% | 42 | 22.4 | 35.8 | 0.1 | 5.0 | 0.2 | 1.6 | 0.1 | 0.3 | 0.0 | 23.8 |
| MAN | Cattle | Straw | 27.7 | 25.1 | 0.91 | 257.7 | 14.9 | 6% | 63 | 45.9 | 40.3 | 0.2 | 5.5 | 0.2 | 0.9 | 0.1 | 0.2 | 0.0 | 43.7 |
| MAN | Cattle | Straw | 16.6 | 14.3 | 0.86 | 236 | 21.7 | 9% | 51 | 30.7 | 41.8 | 0.1 | 5.3 | 0.3 | 1.4 | 0.0 | 0.2 | 0.1 | 37.8 |
| MAN | Cattle | Fern | 27.6 | 24.1 | 0.87 | 162 | 5.7 | 4% | 33 | 32.6 | 43.2 | 0.3 | 5.6 | 0.0 | 1.3 | 0.2 | 0.2 | 0.0 | 36.9 |
| MAN | Cattle | Straw | 43.1 | 34.5 | 0.80 | 191.3 | 8.4 | 4% | 39 | 54.2 | 40.6 | 0.1 | 4.8 | 0.2 | 0.7 | 0.1 | 1.4 | 0.3 | 32.7 |
| MAN | Horse | --- | 81.6 | 69.1 | 0.85 | 258.2 | 11.9 | 5% | 57 | 49.6 | 40.8 | 0.1 | 5.1 | 0.2 | 0.8 | 0.1 | 0.8 | 0.1 | 37.1 |
| MAN | Poultry | --- | 57.2 | 35.3 | 0.62 | 216.8 | 6.9 | 3% | 49 | 12.0 | 28.7 | 0.3 | 4.0 | 0.3 | 2.4 | 0.0 | 0.4 | 0.1 | 26.2 |
| MAN | Poultry | --- | 75.9 | 58.0 | 0.76 | 263.8 | 1.9 | 1% | 63 | 15.3 | 34.7 | 0.3 | 4.7 | 0.2 | 2.3 | 0.0 | 0.6 | 0.1 | 34.3 |
| MAN | Pig | --- | 31.6 | 27.0 | 0.85 | 217.8 | 13.5 | 6% | 50 | 19.5 | 38.8 | 0.1 | 5.6 | 0.1 | 2.0 | 0.3 | 0.4 | 0.0 | 38.7 |
| MAN | Cattle | Straw, after 1 month conservation | 17.0 | 13.0 | 0.76 | 198.6 | 17.3 | 9% | 38 | 29.2 | 39.5 | 0.1 | 5.3 | 0.0 | 1.4 | 0.3 | 0.7 | 0.2 | 29.7 |
| MAN | Turkey | --- | 68.3 | 52.3 | 0.77 | 173 | 1.1 | 1% | 37 | 13.5 | 36.6 | 0.2 | 5.1 | 0.1 | 2.7 | 0.3 | 0.5 | 0.0 | 31.6 |
| MAN | Mix | --- | 15.3 | 13.8 | 0.90 | 243.3 | 1 | 0% | 56 | 21.4 | 40.9 | 0.1 | 5.9 | 0.0 | 1.9 | 0.0 | 0.3 | 0.0 | 40.9 |
| MAN | Poultry | --- | 71.2 | 58.3 | 0.82 | 211 | 16.1 | 8% | 49 | 8.2 | 36.7 | 0.2 | 5.6 | 0.1 | 4.5 | 0.1 | 0.6 | 0.0 | 34.4 |
| MAN | Poultry | --- | 60.3 | 50.4 | 0.84 | 274.1 | 13 | 5% | 69 | 15.5 | 35.3 | 0.0 | 5.6 | 0.1 | 2.3 | 0.3 | 1.0 | 0.2 | 39.5 |
| MAN | Cattle | Straw | 45.6 | 34.2 | 0.75 | 131.9 | 1.4 | 1% | 21 | 51.3 | 43.5 | 0.3 | 5.8 | 0.0 | 0.8 | 0.3 | 0.3 | 0.0 | 24.6 |
| MAN | Horse | --- | 20.2 | 16.4 | 0.81 | 182.6 | 9.9 | 5% | 41 | 27.5 | 39.5 | 0.0 | 4.5 | 0.2 | 1.4 | 0.0 | 0.5 | 0.0 | 35.2 |
| MAN | Cattle | Straw | 69.8 | 61.7 | 0.88 | 233.2 | 15.3 | 7% | 55 | 34.0 | 40.6 | 0.3 | 5.2 | 0.0 | 1.2 | 0.2 | 0.6 | 0.1 | 40.9 |
| MAN | Poultry | --- | 49.6 | 40.5 | 0.82 | 185.6 | 8.8 | 5% | 42 | 15.3 | 37.7 | 0.2 | 5.4 | 0.1 | 2.5 | 0.2 | 0.7 | 0.0 | 35.4 |
| MAN | Horse | --- | 34.4 | 29.1 | 0.85 | 308.4 | 15.3 | 5% | 65 | 55.3 | 40.9 | 0.0 | 5.5 | 0.0 | 0.7 | 0.1 | 0.4 | 0.1 | 37.1 |
| MAN | Horse | --- | 33.2 | 27.0 | 0.81 | 281.2 | 16.2 | 6% | 57 | 79.1 | 39.6 | 0.3 | 5.6 | 0.2 | 0.5 | 0.0 | 0.3 | 0.1 | 35.3 |
| MAN | Zoo | --- | 31.3 | 25.5 | 0.81 | 235.3 | 10.7 | 5% | 51 | 30.8 | 38.7 | 0.3 | 5.3 | 0.2 | 1.3 | 0.3 | 0.3 | 0.1 | 35.6 |
| MAN | Cattle | Straw | 22.8 | 20.1 | 0.88 | 166.9 | 7.3 | 4% | 38 | 39.2 | 41.2 | 0.2 | 5.5 | 0.1 | 1.1 | 0.1 | 0.3 | 0.1 | 40.1 |
| MAN | Mix | Straw | 22.3 | 19.4 | 0.87 | 346.9 | 15.9 | 5% | 73 | 18.6 | 41.1 | 0.1 | 6.1 | 0.2 | 2.2 | 0.1 | 0.3 | 0.1 | 37.2 |
| MAN | Mix | Straw | 20.9 | 18.1 | 0.86 | 366 | 7.1 | 2% | 72 | 20.1 | 42.8 | 0.0 | 6.2 | 0.1 | 2.1 | 0.3 | 0.3 | 0.1 | 35.0 |
| MAN | Horse | --- | 57.6 | 50.3 | 0.87 | 281.1 | 10 | 4% | 62 | 62.4 | 40.7 | 0.1 | 5.7 | 0.2 | 0.7 | 0.1 | 0.5 | 0.0 | 39.8 |
| MAN | Horse | --- | 51.0 | 44.8 | 0.88 | 240.9 | 13.6 | 6% | 57 | 75.1 | 39.3 | 0.2 | 5.6 | 0.2 | 0.5 | 0.1 | 0.6 | 0.2 | 41.8 |
| MAN | Cattle | Straw | 43.1 | 34.5 | 0.80 | 191.4 | 8.3 | 4% | 46 | 17.2 | 35.0 | 0.2 | 5.3 | 0.0 | 2.0 | 0.3 | 0.5 | 0.0 | 37.3 |
| MAN | Cattle | Straw | 33.7 | 27.9 | 0.83 | 223.8 | 9 | 4% | 49 | 21.2 | 38.4 | 0.1 | 5.8 | 0.0 | 1.8 | 0.1 | 0.4 | 0.0 | 36.6 |
| MAN | Horse | --- | 31.5 | 26.0 | 0.83 | 250.6 | 18.6 | 7% | 60 | 13.5 | 36.2 | 0.0 | 5.6 | 0.1 | 2.7 | 0.3 | 0.6 | 0.0 | 37.3 |
| CER | Maize Residues | Follicle | 73.9 | 71.7 | 0.97 | 279.2 | 19 | 7% | 64 | 33.1 | 43.1 | 0.2 | 6.8 | 0.1 | 1.3 | 0.0 | 0.2 | 0.0 | 45.6 |
| CER | Wheat | Contaminated culture | 86.2 | 84.0 | 0.97 | 317.7 | 2.1 | 1% | 78 | 22.9 | 41.2 | 0.1 | 6.8 | 0.0 | 1.8 | 0.1 | 0.2 | 0.0 | 47.4 |
| CER | Mix | Cereals | 75.6 | 72.5 | 0.96 | 285.9 | 15.8 | 6% | 64 | 29.4 | 43.0 | 0.3 | 6.7 | 0.1 | 1.5 | 0.0 | 0.1 | 0.0 | 44.5 |
| CER | Mix | Cereal dust | 89.4 | 80.1 | 0.90 | 300.1 | 5.6 | 2% | 66 | 42.6 | 41.9 | 0.0 | 5.8 | 0.1 | 1.0 | 0.1 | 0.1 | 0.0 | 40.8 |
| CER | Mix | Cereal residue | 72.0 | 64.7 | 0.90 | 250.2 | 9.3 | 4% | 57 | 11.4 | 40.6 | 0.3 | 6.2 | 0.1 | 3.6 | 0.2 | 0.3 | 0.0 | 39.2 |
| CER | Maize | Fresh residue from sweet corn | 24.6 | 24.2 | 0.98 | 314 | 20 | 6% | 77 | 53.1 | 43.5 | 0.2 | 6.0 | 0.1 | 0.8 | 0.0 | 0.1 | 0.0 | 47.9 |
| CER | Maize | Fresh residue from sweet corn | 21.9 | 21.4 | 0.98 | 262.7 | 0.1 | 0% | 63 | 43.3 | 43.5 | 0.2 | 6.2 | 0.1 | 1.0 | 0.0 | 0.2 | 0.1 | 46.6 |
| CER | Maize | Fresh residue from sweet corn | 23.9 | 23.3 | 0.97 | 306 | 5.4 | 2% | 71 | 43.7 | 43.8 | 0.0 | 6.4 | 0.1 | 1.0 | 0.1 | 0.1 | 0.0 | 46.3 |
| CER | Maize | Fresh residue from sweet corn | 26.7 | 26.3 | 0.99 | 335.5 | 5.4 | 2% | 78 | 49.6 | 44.6 | 0.2 | 6.3 | 0.0 | 0.9 | 0.1 | 0.1 | 0.0 | 46.5 |
| CER | Maize | Fresh residue from sweet corn | 23.6 | 23.1 | 0.98 | 312.3 | 14 | 4% | 69 | 36.9 | 44.6 | 0.2 | 6.7 | 0.1 | 1.2 | 0.0 | 0.6 | 0.2 | 44.7 |
| CER | Maize | Fresh residue from sweet corn | 21.9 | 21.4 | 0.98 | 263.7 | 24.5 | 9% | 60 | 57.8 | 44.0 | 0.3 | 6.7 | 0.0 | 0.8 | 0.2 | 0.04 | 0.1 | 46.4 |
| CER | Maize | Fresh residue from sweet corn | 26.5 | 26.0 | 0.98 | 306.8 | 5.2 | 2% | 71 | 56.7 | 43.7 | 0.3 | 6.7 | 0.1 | 0.8 | 0.2 | 0.1 | 0.1 | 46.9 |
| CER | Mix | Cereals | 87.0 | 80.6 | 0.93 | 313.3 | 7.8 | 2% | 67 | 12.1 | 43.3 | 0.0 | 6.7 | 0.0 | 3.6 | 0.3 | 0.2 | 0.0 | 38.9 |
| CER | Maize | Flour | 87.0 | 85.4 | 0.98 | 325.4 | 28.8 | 9% | 80 | 37.8 | 41.4 | 0.2 | 6.8 | 0.0 | 1.1 | 0.1 | 0.1 | 0.0 | 48.8 |
| CER | Mix | Cereals | 77.0 | 71.9 | 0.93 | 328.4 | 7.2 | 2% | 73 | 18.3 | 43.2 | 0.1 | 6.4 | 0.1 | 2.4 | 0.2 | 0.2 | 0.0 | 41.3 |
| CER | Mix | Silo’s lose | 79.8 | 74.1 | 0.93 | 320.4 | 14.7 | 5% | 77 | 56.2 | 40.2 | 0.0 | 6.2 | 0.0 | 0.7 | 0.1 | 0.3 | 0.0 | 45.4 |
| CER | Mix | Cereals | 75.6 | 72.5 | 0.96 | 285.9 | 15.8 | 6% | 66 | 29.8 | 42.4 | 0.1 | 6.7 | 0.1 | 1.4 | 0.1 | 0.3 | 0.0 | 44.9 |
| SLU | Cattle | --- | 4.7 | 3.5 | 0.74 | 291 | 3 | 1% | 51 | 15.7 | 40.5 | 0.2 | 5.4 | 0.1 | 2.6 | 0.1 | 0.5 | 0.0 | 25.6 |
| SLU | Rabbit | --- | 18.4 | 15.9 | 0.86 | 263.8 | 4.7 | 2% | 55 | 24.1 | 41.6 | 0.2 | 5.9 | 0.0 | 1.7 | 0.1 | 0.5 | 0.1 | 36.7 |
| SLU | Cattle | --- | 26.3 | 24.2 | 0.92 | 224.1 | 3.7 | 2% | 70 | 16.0 | 35.9 | 0.2 | 5.1 | 0.1 | 2.2 | 0.2 | 0.6 | 0.0 | 48.0 |
| SLU | Duck | --- | 6.2 | 5.2 | 0.84 | 551.2 | 26.3 | 5% | 100 | 14.2 | 42.1 | 0.2 | 6.1 | 0.1 | 3.0 | 0.2 | 0.4 | 0.1 | 31.9 |
| SLU | Cattle | --- | 10.4 | 8.1 | 0.78 | 481 | 10.2 | 2% | 91 | 27.3 | 39.5 | 0.1 | 5.8 | 0.0 | 1.4 | 0.3 | 0.5 | 0.2 | 30.6 |
| LCM | Maize Residue | Cob | 28.4 | 27.7 | 0.98 | 272.2 | 2.1 | 1% | 63 | 497.8 | 44.1 | 0.2 | 6.3 | 0.1 | 0.1 | 0.0 | 0.1 | 0.1 | 47.2 |
| LCM | Hemp | Dust | 88.1 | 69.0 | 0.78 | 184.4 | 4.5 | 2% | 36 | 48.5 | 39.6 | 0.1 | 5.3 | 0.0 | 0.8 | 0.0 | 0.2 | 0.0 | 32.5 |
| LCM | Straw | Plant residues | 88.0 | 83.9 | 0.95 | 277.6 | 7.6 | 3% | 68 | 60.0 | 42.2 | 0.0 | 5.8 | 0.1 | 0.7 | 0.1 | 0.3 | 0.0 | 46.4 |
| LCM | Straw | --- | 87.6 | 84.6 | 0.97 | 274.1 | 2.2 | 1% | 67 | 77.8 | 42.7 | 0.1 | 6.0 | 0.0 | 0.5 | 0.0 | 0.3 | 0.1 | 47.1 |
| LCM | Maize | Beans | 42.0 | 36.4 | 0.87 | 246.8 | 13.3 | 5% | 51 | 165.7 | 42.8 | 0.1 | 5.5 | 0.3 | 0.3 | 0.1 | 0.8 | 0.1 | 37.3 |
| LCM | Bagasse and Straw | --- | 52.2 | 48.3 | 0.92 | 188.1 | 9.1 | 5% | 42 | 245.9 | 43.3 | 0.1 | 5.7 | 0.2 | 0.2 | 0.1 | 0.3 | 0.1 | 43.0 |
| LCM | Bagasse | --- | 43.2 | 40.9 | 0.95 | 173.7 | 7.2 | 4% | 39 | 376.8 | 44.6 | 0.2 | 5.9 | 0.2 | 0.1 | 0.0 | 0.2 | 0.1 | 44.0 |
| LCM | Straw | --- | 54.0 | 47.5 | 0.88 | 199.8 | 8.8 | 4% | 42 | 193.6 | 43.4 | 0.1 | 5.4 | 0.2 | 0.2 | 0.0 | 0.2 | 0.0 | 38.7 |
| LCM | Bagasse | --- | 56.7 | 41.2 | 0.73 | 250.6 | 16.5 | 7% | 39 | 297.1 | 42.8 | 0.2 | 5.5 | 0.2 | 0.1 | 0.0 | 0.1 | 0.0 | 24.1 |
| LCM | Straw | Waste | 79.2 | 71.8 | 0.91 | 329.8 | 0.8 | 0% | 72 | 79.1 | 42.8 | 0.1 | 5.8 | 0.0 | 0.5 | 0.1 | 0.2 | 0.1 | 41.4 |
| LCM | Green waste | --- | 37.9 | 35.2 | 0.93 | 212.1 | 1.8 | 1% | 47 | 136.8 | 43.4 | 0.0 | 5.8 | 0.1 | 0.3 | 0.1 | 0.6 | 0.1 | 42.7 |
| LCM | Straw | --- | 86.5 | 82.2 | 0.95 | 277.6 | 21.8 | 8% | 67 | 64.0 | 43.0 | 0.3 | 5.7 | 0.1 | 0.7 | 0.1 | 0.1 | 0.0 | 45.5 |
| LCM | Hay | Meadow | 86.0 | 80.4 | 0.93 | 289 | 7.1 | 2% | 65 | 51.4 | 42.6 | 0.1 | 6.3 | 0.0 | 0.8 | 0.1 | 0.1 | 0.0 | 43.7 |
| LCM | Straw | Plant residues | 89.0 | 85.1 | 0.96 | 292.7 | 27.4 | 9% | 70 | 89.0 | 42.5 | 0.1 | 6.1 | 0.3 | 0.5 | 0.0 | 0.2 | 0.2 | 46.4 |
| LCM | Straw | Plant residues | 87.2 | 83.2 | 0.95 | 298.9 | 2.3 | 1% | 69 | 89.3 | 42.9 | 0.1 | 6.2 | 0.1 | 0.5 | 0.0 | 0.1 | 0.1 | 45.6 |
| LCM | Straw | --- | 88.3 | 84.0 | 0.95 | 302.1 | 5.9 | 2% | 72 | 73.6 | 42.3 | 0.2 | 6.0 | 0.3 | 0.6 | 0.1 | 0.3 | 0.3 | 46.0 |
| LCM | Straw | --- | 88.8 | 86.0 | 0.97 | 290.6 | 7.1 | 2% | 69 | 132.0 | 43.0 | 0.1 | 6.3 | 0.0 | 0.3 | 0.0 | 0.1 | 0.0 | 47.1 |
| LCM | Straw | --- | 75.9 | 70.4 | 0.93 | 305.5 | 6.4 | 2% | 70 | 102.2 | 42.9 | 0.0 | 5.7 | 0.1 | 0.4 | 0.0 | 0.2 | 0.0 | 43.5 |
| LCM | Straw | Waste | 84.9 | 81.3 | 0.96 | 293.7 | 1 | 0% | 67 | 126.8 | 44.2 | 0.2 | 5.9 | 0.0 | 0.3 | 0.0 | 0.1 | 0.0 | 45.2 |
| LCM | Flower residue | Lavender | 88.7 | 81.2 | 0.92 | 200.5 | 9.6 | 5% | 42 | 41.5 | 45.0 | 0.1 | 6.0 | 0.0 | 1.1 | 0.2 | 0.3 | 0.1 | 39.3 |
| LCM | Maize | Leaf | 37.8 | 35.0 | 0.93 | 286.3 | 23.3 | 8% | 65 | 56.5 | 43.2 | 0.1 | 5.8 | 0.0 | 0.8 | 0.0 | 0.1 | 0.0 | 42.8 |
| LCM | Straw | Plant residues | 86.3 | 82.3 | 0.95 | 280.5 | 2.9 | 1% | 69 | 68.3 | 41.5 | 0.3 | 6.0 | 0.1 | 0.6 | 0.1 | 0.2 | 0.1 | 47.1 |
| LCM | Straw | Waste | 84.5 | 77.3 | 0.92 | 306 | 23.1 | 8% | 66 | 128.8 | 43.5 | 0.3 | 5.9 | 0.0 | 0.3 | 0.0 | 0.1 | 0.0 | 41.7 |
| LCM | Straw | Rapeseed waste | 71.9 | 62.9 | 0.87 | 241.4 | 3 | 1% | 54 | 31.1 | 40.0 | 0.2 | 5.8 | 0.2 | 1.3 | 0.0 | 0.4 | 0.2 | 40.0 |
| LCM | Straw | --- | 85.0 | 81.2 | 0.96 | 309.7 | 10.1 | 3% | 72 | 162.8 | 43.8 | 0.3 | 5.9 | 0.0 | 0.3 | 0.1 | 0.1 | 0.0 | 45.6 |
| LCM | Straw | Waste | 83.9 | 78.2 | 0.93 | 283.8 | 8.8 | 3% | 62 | 119.4 | 43.6 | 0.1 | 6.3 | 0.0 | 0.4 | 0.2 | 0.2 | 0.1 | 42.8 |
| LCM | Green waste | --- | 44.6 | 34.5 | 0.77 | 178.2 | 0.1 | 0% | 33 | 23.9 | 40.3 | 0.1 | 5.5 | 0.1 | 1.7 | 0.2 | 0.1 | 0.0 | 29.7 |
| LCM | Mix | Green waste | 34.4 | 26.4 | 0.77 | 218.9 | 11.6 | 5% | 45 | 21.9 | 37.5 | 0.3 | 5.3 | 0.2 | 1.7 | 0.1 | 0.2 | 0.0 | 31.9 |
| LCM | Green waste | --- | 80.6 | 36.9 | 0.46 | 63.1 | 3.4 | 5% | 7 | 29.2 | 34.5 | 0.0 | 4.5 | 0.0 | 1.2 | 0.2 | 0.3 | 0.0 | 5.3 |
| LCM | Flower residue | Pomace | 47.1 | 39.6 | 0.84 | 281.1 | 1.7 | 1% | 64 | 17.6 | 38.3 | 0.1 | 5.5 | 0.0 | 2.2 | 0.1 | 0.6 | 0.0 | 37.3 |
| LCM | Straw | --- | 90.6 | 85.8 | 0.95 | 240 | 6.3 | 3% | 60 | 406.3 | 41.2 | 0.3 | 5.7 | 0.3 | 0.1 | 0.0 | 0.8 | 0.3 | 46.9 |
| LCM | Flower residue | Lavender | 82.8 | 78.2 | 0.94 | 171.3 | 12.4 | 7% | 37 | 68.8 | 44.3 | 0.0 | 6.3 | 0.0 | 0.6 | 0.3 | 0.6 | 0.1 | 42.6 |
| LCM | Straw | Waste | 88.8 | 82.3 | 0.93 | 267 | 7.4 | 3% | 64 | 263.7 | 40.3 | 0.1 | 6.1 | 0.3 | 0.2 | 0.1 | 0.8 | 0.1 | 45.3 |
| Family | Type | Sub Type | Cellulose | Hemicelluloses | Lignin | Protein | COD | |||
|---|---|---|---|---|---|---|---|---|---|---|
| Mean | SD | Mean | SD | Mean | SD | Calculated | Calculated | |||
| (g/100g DM) | (g/100g DM) | (g/100g DM) | (% DM) | (g COD/g CxHyOz) | ||||||
| ENSI | Millet | --- | 28.6 | 1.4 | 17.7 | 1.1 | 22.3 | 0.3 | 4.9 | 1.3 |
| ENSI | Sorghum | --- | 21.7 | 0.0 | 10.8 | 0.2 | 21.1 | 0.3 | 9.4 | 1.4 |
| ENSI | Mix | Sorghum, Millet, and Sunflower mix | 22.7 | 0.3 | 12.7 | 0.2 | 19.4 | 0.1 | 14.1 | 1.4 |
| ENSI | Sorghum | Sucro variety | 25.1 | 0.5 | 12.1 | 0.6 | 18.1 | 0.1 | 10.6 | 1.3 |
| ENSI | Sorghum | Vega variety | 22.8 | 0.7 | 13.7 | 0.4 | 20.0 | 0.9 | 13.9 | 1.4 |
| ENSI | Mix | Vega sorghum variety and San Lucas sunflower variety | 24.7 | 0.2 | 10.1 | 0.1 | 26.7 | 0.7 | 10.3 | 1.3 |
| ENSI | Mix | Sunflower, Millet, and Guizotia abyssinica | 17.3 | 0.3 | 7.1 | 0.1 | 26.6 | 1.3 | 9.5 | 1.4 |
| ENSI | Mix | Sunflower, Millet, and Guizotia abyssinica | 17.9 | 0.1 | 8.6 | 0.2 | 25.6 | 0.3 | 8.8 | 1.4 |
| ENSI | Mix | --- | 22.6 | 0.8 | 9.2 | 0.2 | 25.1 | 0.3 | 8.1 | 1.4 |
| ENSI | Millet and Clover | --- | 29.6 | 0.2 | 19.1 | 0.3 | 19.6 | 0.5 | 9.5 | 1.3 |
| ENSI | Maize | --- | 47.7 | 1.5 | 11.5 | 0.5 | 11.4 | 0.2 | 5.6 | 1.3 |
| ENSI | Mix | Residue | 13.5 | 0.3 | 9.0 | 0.2 | 14.0 | 0.1 | 4.6 | 1.3 |
| ENSI | Sorghum | Sucro variety | 31.4 | 0.4 | 18.0 | 0.5 | 17.8 | 0.1 | 3.7 | 1.2 |
| ENSI | Mix | Sorghum (Pacific graze), Millet (Robusta), Vetch (Bingo and Massa), and Clover (Tabor) | 30.3 | 2.5 | 14.2 | 0.5 | 19.7 | 0.8 | 9.3 | 1.3 |
| ENSI | Millet and Clover | --- | 22.4 | 0.4 | 15.4 | 0.3 | 22.2 | 1.0 | 11.8 | 1.4 |
| ENSI | Millet and Clover | --- | 12.9 | 0.4 | 6.6 | 0.1 | 18.6 | 1.8 | 11.4 | 1.3 |
| ENSI | Millet and Clover | --- | 11.2 | 0.1 | 6.4 | 0.1 | 21.0 | 0.2 | 8.5 | 1.3 |
| ENSI | Sorghum | --- | 28.3 | 0.6 | 17.2 | 0.4 | 18.7 | 0.1 | 4.8 | 1.3 |
| ENSI | Maize | --- | 49.9 | 0.6 | 12.6 | 0.4 | 11.4 | 0.2 | 5.5 | 1.2 |
| ENSI | Rye and Vetch | --- | 25.8 | 0.0 | 15.1 | 0.0 | 22.1 | 0.1 | 6.6 | 1.2 |
| ENSI | Rye and Vetch | --- | 26.7 | 0.0 | 17.4 | 0.0 | 20.6 | 0.1 | 4.5 | 1.2 |
| ENSI | Mix | --- | 22.3 | 0.4 | 13.3 | 0.5 | 19.5 | 0.4 | 4.6 | 1.3 |
| ENSI | Mix | Faba bean, Rye, and Radish | 19.6 | 0.6 | 10.6 | 0.1 | 22.4 | 0.1 | 8.9 | 1.2 |
| ENSI | Mix | Faba bean, Triticale, and Radish | 17.5 | 0.0 | 8.8 | 0.0 | 18.1 | 0.2 | 8.5 | 1.2 |
| ENSI | Mix | Grass | 21.7 | 0.0 | 12.3 | 0.0 | 28.9 | 0.5 | 9.6 | 1.4 |
| ENSI | Mix | Sorghum and Maize | 22.0 | 0.5 | 15.4 | 0.3 | 17.8 | 0.3 | 4.7 | 1.2 |
| ENSI | Mix | Peas, Vetch, Oats, and Beans | 21.9 | 0.3 | 10.7 | 0.3 | 20.2 | 0.8 | 13.7 | 1.5 |
| ENSI | Maize | --- | 45.5 | 1.0 | 10.5 | 0.3 | 13.3 | 0.4 | 6.2 | 1.3 |
| ENSI | Sorghum | --- | 30.5 | 0.6 | 20.5 | 0.2 | 24.5 | 0.5 | 5.3 | 1.3 |
| ENSI | Mix | Moha and Clover | 28.4 | 0.1 | 13.5 | 0.5 | 19.2 | 1.0 | 7.9 | 1.5 |
| ENSI | Rapeseed | --- | 25.7 | 1.2 | 10.2 | 1.0 | 27.4 | 0.3 | 3.5 | 1.4 |
| ENSI | Grass | --- | 21.5 | 0.5 | 11.7 | 0.2 | 27.1 | 0.2 | 10.3 | 1.4 |
| ENSI | Sorghum | --- | 31.6 | 0.2 | 14.0 | 0.1 | 22.9 | 0.3 | 5.7 | 1.3 |
| ENSI | Sunflower | --- | 20.9 | 0.4 | 9.1 | 0.2 | 22.8 | 0.8 | 5.9 | 1.4 |
| ENSI | Grass | --- | 29.9 | 0.2 | 16.9 | 0.2 | 25.7 | 1.6 | 7.7 | 1.7 |
| ENSI | Maize | --- | 41.1 | 0.4 | 11.7 | 0.8 | 16.5 | 0.8 | 6.2 | 1.2 |
| ENSI | Alfalfa | --- | 23.6 | 0.7 | 9.2 | 0.1 | 21.5 | 0.6 | 10.1 | 1.4 |
| ENSI | Sorghum | --- | 29.8 | 0.3 | 13.1 | 0.8 | 16.8 | 0.4 | 6.3 | 1.3 |
| ENSI | Grass | Ray-grass | 31.9 | 1.6 | 14.1 | 0.9 | 21.9 | 1.6 | 4.2 | 1.3 |
| ENSI | Maize | --- | 27.3 | 0.2 | 18.4 | 0.1 | 20.0 | 0.7 | 6.9 | 1.4 |
| ENSI | Grass | --- | 24.9 | 0.2 | 14.8 | 0.5 | 19.5 | 0.3 | 10.9 | 1.4 |
| ENSI | Maize | --- | 52.3 | 3.5 | 11.2 | 0.9 | 15.4 | 0.6 | 6.1 | 1.3 |
| ENSI | Maize | --- | 41.3 | 1.2 | 9.6 | 0.4 | 13.1 | 1.3 | 6.5 | 1.3 |
| ENSI | Grass | --- | 21.1 | 0.7 | 9.7 | 0.2 | 18.1 | 0.7 | 9.1 | 1.3 |
| ENSI | Grass | --- | 26.0 | 0.4 | 13.7 | 0.3 | 18.4 | 1.1 | 5.3 | 1.4 |
| ENSI | Maize | --- | 37.1 | 0.5 | 11.6 | 0.0 | 19.9 | 1.3 | 7.0 | 1.3 |
| MAN | Mix | Manure and Spates | 28.7 | 0.8 | 14.8 | 0.4 | 52.3 | 2.9 | 7.3 | 2.0 |
| MAN | Cattle | After phase separation, Straw | 24.5 | 0.6 | 17.5 | 0.5 | 26.0 | 0.7 | 15.7 | 1.2 |
| MAN | Horse | --- | 25.3 | 2.5 | 14.2 | 0.6 | 48.7 | 2.2 | 10.0 | 1.7 |
| MAN | Cattle | Straw | 25.6 | 0.1 | 18.2 | 0.2 | 29.4 | 1.0 | 5.5 | 1.2 |
| MAN | Cattle | Straw | 22.5 | 1.8 | 15.3 | 0.0 | 34.9 | 0.6 | 8.5 | 1.4 |
| MAN | Cattle | Fern | 20.0 | 0.7 | 14.5 | 1.1 | 36.3 | 1.2 | 8.3 | 1.4 |
| MAN | Cattle | Straw | 29.2 | 1.4 | 16.3 | 0.6 | 34.9 | 0.4 | 4.7 | 1.5 |
| MAN | Horse | --- | 29.1 | 0.9 | 17.1 | 0.5 | 32.3 | 0.3 | 5.1 | 1.4 |
| MAN | Poultry | --- | 16.6 | 0.4 | 13.6 | 0.2 | 35.4 | 2.9 | 14.9 | 1.4 |
| MAN | Poultry | --- | 16.8 | 0.1 | 13.5 | 0.2 | 36.3 | 0.5 | 14.2 | 1.3 |
| MAN | Pig | --- | 19.6 | 1.7 | 11.6 | 0.8 | 36.8 | 0.1 | 12.4 | 1.3 |
| MAN | Cattle | Straw, after 1 month conservation | 18.8 | 0.8 | 13.6 | 0.3 | 48.5 | 2.6 | 8.5 | 1.6 |
| MAN | Turkey | --- | 21.7 | 0.7 | 21.5 | 0.2 | 22.8 | 0.5 | 17.0 | 1.5 |
| MAN | Mix | --- | 19.6 | 0.6 | 12.8 | 0.0 | 31.2 | 2.3 | 12.0 | 1.3 |
| MAN | Poultry | --- | 20.1 | 0.2 | 14.4 | 0.1 | 23.5 | 0.6 | 28.1 | 1.4 |
| MAN | Poultry | --- | 22.1 | 1.0 | 17.4 | 0.7 | 20.0 | 0.4 | 14.2 | 1.2 |
| MAN | Cattle | Straw | 13.6 | 0.1 | 8.8 | 0.1 | 52.0 | 1.9 | 5.3 | 1.9 |
| MAN | Horse | --- | 20.0 | 0.5 | 12.7 | 0.4 | 56.5 | 3.7 | 9.0 | 1.3 |
| MAN | Cattle | Straw | 29.2 | 1.4 | 16.9 | 0.2 | 30.4 | 0.3 | 7.5 | 1.3 |
| MAN | Poultry | --- | 19.1 | 0.3 | 17.1 | 0.1 | 26.4 | 0.2 | 15.4 | 1.4 |
| MAN | Horse | --- | 35.0 | 1.3 | 20.0 | 1.3 | 27.2 | 1.3 | 4.6 | 1.4 |
| MAN | Horse | --- | 31.8 | 0.0 | 18.9 | 0.0 | 27.1 | 0.1 | 3.1 | 1.4 |
| MAN | Zoo | --- | 21.9 | 0.2 | 15.2 | 0.1 | 38.6 | 1.6 | 7.8 | 1.4 |
| MAN | Cattle | Straw | 19.1 | 0.3 | 11.5 | 0.1 | 40.1 | 4.0 | 6.6 | 1.3 |
| MAN | Mix | Straw | 20.2 | 0.2 | 14.9 | 0.4 | 28.6 | 0.1 | 13.8 | 1.4 |
| MAN | Mix | Straw | 18.9 | 0.2 | 12.7 | 0.1 | 35.7 | 2.7 | 13.3 | 1.5 |
| MAN | Horse | --- | 31.6 | 0.2 | 20.0 | 0.1 | 27.1 | 0.5 | 4.1 | 1.3 |
| MAN | Horse | --- | 29.6 | 0.6 | 19.9 | 0.1 | 34.6 | 0.3 | 3.3 | 1.2 |
| MAN | Cattle | Straw | 28.5 | 0.2 | 15.7 | 0.1 | 36.4 | 0.0 | 12.8 | 1.3 |
| MAN | Cattle | Straw | 25.0 | 1.0 | 18.1 | 0.6 | 43.2 | 0.2 | 11.3 | 1.4 |
| MAN | Horse | --- | 20.7 | 0.5 | 16.4 | 0.4 | 28.3 | 0.7 | 16.8 | 1.3 |
| CER | Maize Residues | Follicle | 49.0 | 1.2 | 10.8 | 0.5 | 12.0 | 0.0 | 8.2 | 1.3 |
| CER | Wheat | Contaminated culture | 59.3 | 1.1 | 6.0 | 0.1 | 5.5 | 0.5 | 11.3 | 1.2 |
| CER | Mix | Cereals | 50.2 | 0.6 | 7.9 | 0.3 | 14.2 | 0.0 | 9.1 | 1.3 |
| CER | Mix | Cereal dust | 29.7 | 0.4 | 21.3 | 0.3 | 21.4 | 1.2 | 6.1 | 1.3 |
| CER | Mix | Cereal residue | 33.3 | 1.7 | 14.7 | 1.2 | 16.1 | 0.1 | 22.3 | 1.4 |
| CER | Maize | Fresh residue from sweet corn | 29.5 | 1.5 | 16.1 | 1.5 | 15.4 | 0.4 | 5.1 | 1.2 |
| CER | Maize | Fresh residue from sweet corn | 25.8 | 0.4 | 18.9 | 0.2 | 16.4 | 0.0 | 6.3 | 1.2 |
| CER | Maize | Fresh residue from sweet corn | 29.5 | 0.1 | 19.0 | 0.2 | 16.2 | 0.1 | 6.3 | 1.3 |
| CER | Maize | Fresh residue from sweet corn | 29.5 | 0.2 | 20.5 | 0.0 | 12.2 | 0.1 | 5.6 | 1.3 |
| CER | Maize | Fresh residue from sweet corn | 29.0 | 0.3 | 19.9 | 0.0 | 12.9 | 0.3 | 7.6 | 1.3 |
| CER | Maize | Fresh residue from sweet corn | 27.6 | 0.4 | 16.8 | 0.6 | 16.3 | 0.2 | 4.8 | 1.3 |
| CER | Maize | Fresh residue from sweet corn | 28.4 | 0.1 | 18.9 | 0.1 | 14.0 | 0.1 | 4.8 | 1.3 |
| CER | Mix | Cereals | 29.3 | 0.9 | 10.9 | 0.3 | 18.7 | 0.4 | 22.3 | 1.5 |
| CER | Maize | Flour | 60.9 | 0.4 | 7.2 | 0.1 | 6.2 | 0.5 | 6.8 | 1.2 |
| CER | Mix | Cereals | 50.6 | 1.3 | 7.3 | 0.6 | 10.6 | 0.1 | 14.8 | 1.4 |
| CER | Mix | Silo’s lose | 51.6 | 0.7 | 10.7 | 0.5 | 18.7 | 0.5 | 4.5 | 1.2 |
| CER | Mix | Cereals | 49.3 | 1.9 | 6.8 | 0.3 | 13.3 | 0.3 | 8.9 | 1.3 |
| SLU | Cattle | --- | 8.7 | 0.0 | 7.7 | 0.3 | 38.6 | 1.1 | 16.1 | 1.8 |
| SLU | Rabbit | --- | 20.6 | 0.7 | 13.5 | 0.1 | 28.6 | 0.0 | 10.8 | 1.4 |
| SLU | Cattle | --- | 26.4 | 0.7 | 20.0 | 0.9 | 28.8 | 0.1 | 14.0 | 1.0 |
| SLU | Duck | --- | 13.2 | 0.1 | 23.5 | 1.3 | 19.1 | 0.1 | 18.6 | 1.6 |
| SLU | Cattle | --- | 17.8 | 0.0 | 12.7 | 1.0 | 33.8 | 0.9 | 9.0 | 1.6 |
| LCM | Maize Residue | Cob | 29.0 | 0.6 | 26.0 | 0.4 | 19.8 | 0.1 | 0.6 | 1.2 |
| LCM | Hemp | Dust | 19.5 | 0.8 | 8.9 | 0.0 | 28.2 | 0.0 | 5.1 | 1.5 |
| LCM | Straw | Plant residues | 28.5 | 0.3 | 17.5 | 0.2 | 16.3 | 0.3 | 4.4 | 1.2 |
| LCM | Straw | --- | 30.9 | 0.5 | 18.3 | 0.2 | 17.0 | 0.4 | 3.4 | 1.2 |
| LCM | Maize | Beans | 33.6 | 1.5 | 22.7 | 0.7 | 19.4 | 0.5 | 1.6 | 1.4 |
| LCM | Bagasse and Straw | --- | 30.1 | 2.5 | 18.2 | 1.7 | 17.6 | 1.5 | 1.1 | 1.3 |
| LCM | Bagasse | --- | 32.1 | 0.2 | 15.7 | 0.2 | 22.8 | 0.7 | 0.7 | 1.3 |
| LCM | Straw | --- | 31.7 | 0.2 | 20.6 | 0.3 | 23.1 | 0.4 | 1.4 | 1.4 |
| LCM | Bagasse | --- | 33.4 | 0.6 | 21.2 | 0.4 | 30.9 | 2.9 | 0.9 | 1.9 |
| LCM | Straw | Waste | 25.3 | 1.7 | 24.1 | 1.8 | 21.3 | 2.1 | 3.4 | 1.3 |
| LCM | Green waste | --- | 31.9 | 0.7 | 13.8 | 0.4 | 17.9 | 1.3 | 2.0 | 1.3 |
| LCM | Straw | --- | 30.5 | 0.8 | 18.5 | 0.3 | 18.8 | 0.5 | 4.2 | 1.2 |
| LCM | Hay | Meadow | 26.8 | 2.0 | 19.9 | 1.9 | 23.7 | 2.2 | 5.2 | 1.3 |
| LCM | Straw | Plant residues | 30.1 | 0.3 | 17.8 | 0.1 | 18.3 | 0.5 | 3.0 | 1.2 |
| LCM | Straw | Plant residues | 31.3 | 0.0 | 17.4 | 0.1 | 18.3 | 1.2 | 3.0 | 1.3 |
| LCM | Straw | --- | 29.2 | 0.9 | 18.9 | 0.3 | 14.7 | 0.4 | 3.6 | 1.2 |
| LCM | Straw | --- | 32.3 | 0.7 | 18.3 | 0.4 | 15.7 | 0.6 | 2.0 | 1.2 |
| LCM | Straw | --- | 30.3 | 0.0 | 20.2 | 0.1 | 24.6 | 1.1 | 2.6 | 1.3 |
| LCM | Straw | Waste | 31.4 | 0.9 | 22.0 | 0.7 | 18.4 | 0.3 | 2.2 | 1.3 |
| LCM | Flower residue | Lavender | 20.8 | 0.7 | 12.1 | 0.5 | 30.8 | 0.1 | 6.8 | 1.4 |
| LCM | Maize | Leaf | 25.7 | 1.7 | 20.8 | 1.5 | 27.5 | 1.8 | 4.8 | 1.3 |
| LCM | Straw | Plant residues | 26.2 | 1.1 | 16.6 | 0.9 | 19.5 | 1.4 | 3.8 | 1.2 |
| LCM | Straw | Waste | 30.2 | 1.7 | 23.8 | 1.1 | 26.0 | 1.1 | 2.1 | 1.3 |
| LCM | Straw | Rapeseed waste | 24.5 | 1.5 | 11.7 | 0.8 | 23.7 | 2.0 | 8.1 | 1.3 |
| LCM | Straw | --- | 29.8 | 0.2 | 19.7 | 0.3 | 20.9 | 1.1 | 1.7 | 1.2 |
| LCM | Straw | Waste | 27.8 | 2.1 | 21.5 | 1.4 | 23.7 | 1.3 | 2.3 | 1.3 |
| LCM | Green waste | --- | 18.3 | 1.2 | 11.1 | 0.7 | 46.0 | 0.2 | 10.6 | 1.6 |
| LCM | Mix | Green waste | 16.8 | 1.6 | 12.5 | 1.1 | 50.2 | 4.2 | 10.7 | 1.5 |
| LCM | Green waste | --- | 15.4 | 0.8 | 12.9 | 0.9 | 42.1 | 1.5 | 7.4 | 2.8 |
| LCM | Flower residue | Pomace | 17.1 | 0.8 | 7.8 | 0.0 | 17.1 | 0.6 | 13.6 | 1.3 |
| LCM | Straw | --- | 31.5 | 0.7 | 17.0 | 0.7 | 27.9 | 2.5 | 0.6 | 1.2 |
| LCM | Flower residue | Lavender | 24.5 | 0.9 | 10.7 | 0.5 | 30.0 | 0.1 | 4.0 | 1.4 |
| LCM | Straw | Waste | 29.2 | 0.3 | 20.1 | 0.0 | 26.6 | 0.1 | 1.0 | 1.2 |
Appendix B
| Reference | N. | Sample Familly | Sample Description | DM | VS | HCell | Cell | Lignin | COD | Prot | BMP (mL CH4/g VS) |
|---|---|---|---|---|---|---|---|---|---|---|---|
| [14] | 2 | Manures | Dairy and Separated liquid manure | 58–124 91 g/kg | 41–102 71 g/kg | 10% VS | 32% VS | 14% VS | 71–129 100 g/kg | 6% VS | 243–261 252 |
| 9 | Food residue | Cheese whey, Plain pasta, Meat pasta, Used vegetable oil, Ice cream, Fresh dog food, Cola beverage, Cabbage, and Potatoes | 71–991 274 g/kg | 60–989 274 g/kg | 0–0 0% VS | 0–36 3% VS | 0–0 0% VS | 91–2880 642 g/kg | 0–19 10% VS | 216–649 390 | |
| 1 | Switchgras | Switchgrass | 930 g/kg | 905 g/kg | 42% VS | 49% VS | 8% VS | 707 g/kg | 1% VS | 122 | |
| 1 | Silage | Corn silage | 217 g/kg | 201 g/kg | 12% VS | - | 14% VS | 296 | |||
| [25] | 20 | Municipal solid wastes | Municipal solid wastes | 94–99 97% RM | 53–90 74% RM | - | - | ND–0.4 0.1 g/g VS | 38–279 145 g/g VS | 29–89 52 g/g VS | 87–357 226 |
| [26] | 95 | Grass | Meadow grass | 51 | 288 | - | - | - | - | - | 406 |
| [18] | 204 | 295 | 329 | 355 | |||||||
| [17] | 9 | Lawn cuttings | Meadow grass, Grass mixture, White clover, and Short bluegrass | - | - | 22% VS | 28% VS | 6% VS | - | 16% VS | 298–404 333 |
| 9 | Hedge cuttings | Oval-leaved privet, Ivy, Beech hedge, Chokeberry, and Ground-elder | - | - | 12% VS | 28% VS | 16% VS | - | 12% VS | 149–277 203 | |
| 16 | Wood cuttings | Birch tree, Plane tree, Willow, and Cypress | - | - | 12% VS | 24% VS | 24% VS | - | 10% VS | 138–245 177 | |
| 17 | Wild plants | Northern bluegrass, Green foxtail, Bamboo, Common reed, Tufted hair-grass, Reed canary grass, Chrysanthemum, and Dandelion | - | - | 24% VS | 38% VS | 10% VS | z | 8% VS | 106–319 227 | |
| 6 | Crops | Maize, Wheat straw, and Sugar beet | - | - | 30% VS | 28% VS | 4% VS | - | 8% VS | 223–479 404 | |
| [27] | 58 | Agro-industrial wastes | Solid food processing waste and non-conformed end products | - | 4–99 52% DM | - | - | - | - | - | 66–845 396 |
| 1 | Macroaglae | - | - | 56% DM | - | - | - | - | - | 238 | |
| 20 | Biowaste | Household organic waste | - | 3–88 42% DM | - | - | - | - | - | 185–845 370 | |
| 4 | Energy crops | Maize and switch grass | - | 89–94 92% DM | - | - | - | - | - | 211–370 264 | |
| 11 | Fatty waste | Industrial sludge digester with fatty feedstock | - | 0–29 13% DM | - | - | - | - | - | 53–1321 475 | |
| 14 | Meat waste | Slaughterhouse waste or stale meat | - | 23–96 70% DM | - | - | - | - | - | 172–594 475 | |
| 2 | Co-digestion mix | - | 83% DM | - | - | - | - | - | 185 | ||
| 66 | Municipal solid wastes | Fresh wastes collected from different localisation and after different treatment | - | 15–85 60% DM | - | - | - | - | - | 26–423 211 | |
| 42 | Plant and Vegetable | Wheat and barley residues, Potatoes, Tomatoes, etc. | - | 42–95 81% DM | - | - | - | - | - | 0–449 264 | |
| 18 | Agro-industrial sludges | Sludges produced from agro-industrial WWTP | - | 2–80 18% DM | - | - | - | - | - | 0–687 317 | |
| 30 | Sewage sludge WWTP | Different WWTP at different process steps (pre-treated or not) | - | 11–84 66% DM | - | - | - | - | - | 13–343 172 | |
| 31 | Stabilised municipal solid waste | Landfill drillings | - | 14–66 40% DM | - | - | - | - | - | 0–264 132 | |
| [20] | 14 | Leaf | Reed canary grass | - | - | 22–36 31% DM | 16–29 26% DM | 1–5 3% DM | - | - | 321–388 352 |
| Steam | Reed canary grass | - | - | 24–34 30% DM | 21–41 35% DM | 1–10 7% DM | - | - | 283–417 344 | ||
| [24] | 3 | Manures | Chicken, Dairy, and Swine manures | 26–39 32% FM | 20–29 23% FM | 15–28 22% DM | 11–20 17% DM | 2–17 8% DM | - | 13–20 17% DM | 51–322 223 |
| 3 | Crops straws | Corn stover, Wheat straw, and Rice straw | 85–93 89% FM | 77–82 79% FM | 25–30 27% DM | 41–42 42% DM | 8–11 10% DM | - | 3–6 4% DM | 241–281 256 | |
| 5 | Food and green wastes | Kitchen waste, Fruit and vegetable, Used animal/vegetable oil, and Yard waste | 4–100 60% FM | 3–100 57% FM | 0–20 7% DM | 0–21 10% DM | 0–11 5% DM | - | 0–21 9% DM | 183–811 531 | |
| 2 | Processing organic wastes | Vinegar residue and Rice husk | 90–92 91% FM | 74–85 80% FM | 18–33 26% DM | 23–41 32% DM | 12–20 16% DM | - | 3–12 7% DM | 49–253 151 | |
| 1 | Energy crops | Switchgrass | 91% FM | 87% FM | 32% DM | 43% DM | 11% DM | - | 3% DM | 246 | |
| 2 | Lignocellulosic biomass | Chenopodium album leaf, seed, and stalk | 84–86 85% FM | 78–83 81% FM | 17–19 18% DM | 20–39 30% DM | 8–16 12% DM | - | 3–17 10% DM | 171–262 217 | |
| [28] | 88 | All | - | 87–96 92% DM | 9–76 57% DM | - | - | 104–502 251 | |||
| [16] | 18 | Miscanthus | Miscanthus giganteus | - | - | 25% DM | 44% DM | 9% DM | - | 4% DM | 263 |
| 16 | Switchgrass | - | - | 33% DM | 40% DM | 7% DM | - | 4% DM | 213 | ||
| 36 | Spelt straw | - | - | 31% DM | 44% DM | 7% DM | - | 2% DM | 275 | ||
| 37 | Fiber sorghum | Winter and Autumn | - | - | 22–25 24% DM | 33–42 37% DM | 5–7 6% DM | - | 4–7 5% DM | 363–438 400 | |
| 369 | Tall Fescue | Spring, Summer, and Autumn | - | - | 22–25 24% DM | 25–29 27% DM | 4–4 4% DM | - | 9–11 10% DM | 400–425 408 | |
| 21 | Immature rye | - | - | 18% DM | 22% DM | 2% DM | - | 9% DM | 525 | ||
| 73 | Fiber corn | Winter and Autumn | - | - | 2–4 3% DM | 20–20 20% DM | 18–18 18% DM | - | 5–7 6% DM | 313–400 356 | |
| [29] | 23 | Anaerobic sludges | Effluent from anaerobic digesters | - | - | - | - | - | - | - | 32–214 73 |
| 30 | Standard compounds | Cellulose, Starch, and Gelatine | - | - | - | - | - | - | - | 289–407 361 | |
| 50 | Household wastes | Fruit and vegetable waste, Milk waste, Meat waste, and Co-digestion mixtures | - | - | - | - | - | - | - | 214–900 461 | |
| 10 | Agriculture wastes | Wheat straw, Bamboo waste, and Banana stem | - | - | - | - | - | - | - | 139–300 224 | |
| 19 | Sewage sludges | Primary and secondary Sludge and Co-digestion mixtures | - | - | - | - | - | - | - | 171–429 353 | |
| 6 | Lipid rich wastes | Butter and Oil wastes | - | - | - | - | - | - | - | 793–943 891 | |
| [5] | 6 | Cereal crops | Barley, Wheat, Triticale, and Oats | 54–69 62% FM | 49–67 58% FM | - | - | - | - | - | 281–366 336 |
| 3 | Oil seed rapes | Macerated, Whole crop, and Not macerated | 88–93 91% FM | 85–89 87% FM | - | - | - | - | - | 215–646 393 | |
| 7 | Root crops | Potatoes, Turnips, Sugar beet, Energy beet, and Fodder beet | 11–26 19% FM | 10–25 18% FM | - | - | - | - | - | 306–399 349 | |
| 5 | Grass silages | Grass silage and Fresh grass | 12–29 19% FM | 11–27 18% FM | - | - | - | - | - | 368–400 385 | |
| 2 | Baled silages | - | 17–17 17% FM | 15–16 15% FM | - | - | - | - | - | 428–433 431 | |
| 8 | Other grass substrates | Silage, Hay, Savazi grass, Silage effluent, Grass digestate, Fresh maize, and Maize silage | 6–87 29% FM | 3–82 27% FM | - | - | - | - | - | 127–394 324 | |
| 7 | Dairy slurries | - | 6–9 7% FM | 4–7 6% FM | - | - | - | - | - | 136–239 201 | |
| 4 | Other agricultural wastes | Beef slurry, Pig slurry, Poultry manure, and Farm yard manure | 5–51 21% FM | 4–30 14% FM | - | - | - | - | - | 99–311 194 | |
| 4 | Milk processing wastes | Sludges with or without dissolved air floatation | 4–16 9% FM | 3–9 7% FM | - | - | - | - | - | 189–787 473 | |
| 4 | Abattoir wastes | Mix, paunch content, and Sludges | 13–20 17% FM | 11–18 15% FM | - | - | - | - | - | 166–404 286 | |
| 7 | Miscellaneous wastes | Bakery waste, Brewing stillage, Grocery waste, Fish offal mix, Bread waste, Park and grass waste, and WWTP | 9–66 32% FM | 7–64 29% FM | - | - | - | - | - | 247–592 396 | |
| 10 | Domestic and commercial food wastes | Rural and urban food waste, Food wastes from canteens and restaurants, and Centralised collection centre combining the two types or not | 22–95 37% FM | 19–88 32% FM | - | - | - | - | - | 274–535 329 | |
| 3 | Alternative wastes | Recycled paper, Used cooking oil, and Grease trap wastes | 27–100 72% FM | 26–99 68% FM | - | - | - | - | - | 254–805 434 | |
| 12 | Seaweeds | 9 brown & 3 green Seaweeds | 13–78 23% FM | 8–46 15% FM | - | - | - | - | - | 101–341 213 | |
| [19] | 24 | Main and secondary crops | Sugar beet, Barley/ryegrass, Maize, Triticale, Marrow stem kale, Rye/triticale, Potatoes, Oat/forage Pea/false flax, Rye, Sundangrass, Forage sorghum, Rye/fodder vetch, Barley/turnip rape, Oat, Amaranth, Quinoa, Rapeseed, Sunflower, Forage pea, and Buckwheat | 9–59 33% FM | 81–97 92% DM | 2–25 15% DM | 3–37 27% DM | 1–13 6% DM | - | 4–19 9% DM | 210–399 294 |
| 10 | Catch crops | Triticale, Barley, Rye, Landsberger mix, Sudengrass hybrid, Forage sorgum, Ryegrass, Phacelia, Fodder radish, and Buckwheat/phacelia | 9–58 24% FM | 73–96 90% DM | 0–24 17% DM | 24–34 30% DM | 2–9 5% DM | - | 5–26 11% DM | 235–376 311 | |
| 4 | Annual grass and legume mix | Ryegrass, Clover, Alfalfa clover, and Alfalfa | 15–48 28% FM | 85–93 90% DM | 11–18 14% DM | 26–29 28% DM | 4–7 5% DM | - | 7–20 14% DM | 240–388 307 | |
| 5 | Perennial crops | Tall wheatgrass, Countru mallow, Jerusalem artichoke, Miscanthus, and Cup plant | 14–40 28% FM | 85–97 90% DM | 5–24 16% DM | 28–42 33% DM | 7–13 10% DM | - | 4–15 9% DM | 179–259 228 | |
| [30] | 58 | Solid manure | 2–99% FM | 1–92% DM | - | - | - | - | - | 129–366 225 | |
| 7 | Animal slurries | - | - | - | - | - | 225–551 293 | ||||
| 3 | Slaughterhouse waste | - | - | - | - | - | 186–664 349 | ||||
| 16 | Mix of AD feedstock | - | - | - | - | - | 90–253 101 | ||||
| 6 | AD digestats | - | - | - | - | - | 214–405 304 | ||||
| 36 | Grass and intermediate crops | - | - | - | - | - | 191–444 304 | ||||
| 24 | Cereals and crop residues | - | - | - | - | - | 191–388 304 | ||||
| 26 | Silages | - | - | - | - | - | 186–495 338 | ||||
| [30] | 38 | Lignocellulosic plants | - | - | - | - | - | 62–326 270 | |||
| 15 | Grape marcs | - | - | - | - | - | 79–219 129 | ||||
| 3 | Algae | - | - | - | - | - | 146–169 165 | ||||
| 25 | Food wastes and biowastes | - | - | - | - | - | 96–518 338 | ||||
| 10 | Sludges | - | - | - | - | - | 56–776 259 | ||||
| 3 | Effluents | - | - | - | - | - | 225–281 276 | ||||
| 3 | Fat and lipid wastes | - | - | - | - | - | 596–878 630 | ||||
| 2 | Products and wastes from meat | - | - | - | - | - | 203–388 293 | ||||
| 2 | Organic fraction of municipal waste | - | - | - | - | - | 281 | ||||
| [21] | 41 | Energy crops | Barley, Clover, Cup plant, Grassland, Maize, Millet, Potatoes, Rye, Sugar beet, Sunflower, and Triticale | 88–94 91% FM | 79–89 85% FM | 3–28 18% DM | 5–39 27% DM | 0–11 4% DM | - | 4–20 9% DM | 177–401 311 |
| [22] | 43 | Grasses | Lolium perenne, Dactylis glomerata, Poa pratensis, and Fescuta pratensis | 87–94 91% FM | 78–88 84% FM | 21–32 26% DM | 20–36 29% DM | 2–7 4% DM | - | 6–20 11% DM | 314–422 353 |
| 18 | Legumes | Trifolium pratense and Repens | 88–93 90% FM | 80–85 82% FM | 3–22 11% DM | 16–33 25% DM | 5–9 7% DM | - | 13–29 21% DM | 265–346 301 | |
| [13] | 2 | Biowaste | Banana peel waste, Tomato waste, and | 11% FM | 83% DM | - | - | - | 2 g O2/g VS | - | 329 |
| 1 | Effluent | Winery wastewater | 3% FM | 65% DM | - | - | - | 3 g O2/g VS | - | 251 | |
| 10 | Plants | ? | ? | ? | ? | ? | ? | ? | 111–379 229 | ||
| 21 | Vegetables | ? | ? | ? | ? | ? | ? | ? | 186–443 314 | ||
| 24 | Fruits | ? | ? | ? | ? | ? | ? | ? | 185–529 314 | ||
| 7 | Cereals | ? | ? | ? | ? | ? | ? | ? | 261–325 293 | ||
| 12 | Manures | ? | ? | ? | ? | ? | ? | ? | 154–325 211 | ||
| 17 | Diet | ? | ? | ? | ? | ? | ? | ? | 250–775 432 | ||
| 10 | Sludges | ? | ? | ? | ? | ? | ? | ? | 164–711 411 | ||
| 4 | Beverage wastewaters | ? | ? | ? | ? | ? | ? | ? | 250–593 411 | ||
| 18 | Organic fraction of municipal solid wastes | ? | ? | ? | ? | ? | ? | ? | 175–571 464 | ||
| 8 | Other | ? | ? | ? | ? | ? | ? | ? | 207–443 379 | ||
| [23] | 20 | Sludges | 10 primary and 10 bioglogical Sludges | 5–46 21% FM | 4–33 15% FM | - | - | - | 1–2 2% VS | 0–60 28 mg BSA/g VS | 58–318 181 |
References
- Brémond, U.; Bertrandias, A.; Steyer, J.-P.; Bernet, N.; Carrere, H. A vision of European biogas sector development towards 2030: Trends and challenges. J. Clean. Prod. 2021, 287, 125065. [Google Scholar] [CrossRef]
- Scarlat, N.; Dallemand, J.-F.; Fahl, F. Biogas: Developments and perspectives in Europe. Renew. Energy 2018, 129, 457–472. [Google Scholar] [CrossRef]
- Wang, X.; Lu, X.; Li, F.; Yang, G. Effects of Temperature and Carbon-Nitrogen (C/N) Ratio on the Performance of Anaerobic Co-Digestion of Dairy Manure, Chicken Manure and Rice Straw: Focusing on Ammonia Inhibition. PLoS ONE 2014, 9, e97265. [Google Scholar] [CrossRef] [PubMed] [Green Version]
- Wang, X.; Yang, G.; Feng, Y.; Ren, G.; Han, X. Optimizing feeding composition and carbon–nitrogen ratios for improved methane yield during anaerobic co-digestion of dairy, chicken manure and wheat straw. Bioresour. Technol. 2012, 120, 78–83. [Google Scholar] [CrossRef]
- Allen, E.; Wall, D.M.; Herrmann, C.; Murphy, J.D. A detailed assessment of resource of biomethane from first, second and third generation substrates. Renew. Energy 2016, 87, 656–665. [Google Scholar] [CrossRef]
- Monlau, F.; Sambusiti, C.; Barakat, A.; Guo, X.M.; Latrille, E.; Trably, E.; Steyer, J.-P.; Carrere, H. Predictive Models of Biohydrogen and Biomethane Production Based on the Compositional and Structural Features of Lignocellulosic Materials. Environ. Sci. Technol. 2012, 46, 12217–12225. [Google Scholar] [CrossRef]
- Achinas, S.; Euverink, G.J.W. Theoretical analysis of biogas potential prediction from agricultural waste. Resour.-Effic. Technol. 2016, 2, 143–147. [Google Scholar] [CrossRef] [Green Version]
- Cresson, R.; Pommier, S.; Beline, F.; Bouchez, T.; Buffière, P.; Rivero, J.A.C.; Patricia, C.; Pauss, A.; Pouech, P.; Ribeiro, T. Etude Interlaboratoires Pour l’harmonisation Des Protocoles de Mesure Du Potentiel Méthanogène Des Matrices Solides Hétérogènes. In Proceedings of the Journées Recherche Industrie Biogaz et Méthanisation, Rennes, France, 3–5 February 2015. [Google Scholar]
- Holliger, C.; Astals, S.; de Laclos, H.F.; Hafner, S.D.; Koch, K.; Weinrich, S. Towards a standardization of biomethane potential tests: A commentary. Water Sci. Technol. 2021, 83, 247–250. [Google Scholar] [CrossRef]
- Holliger, C.; Alves, M.; Andrade, D.; Angelidaki, I.; Astals, S.; Baier, U.; Bougrier, C.; Buffière, P.; Carballa, M.; De Wilde, V.; et al. Towards a standardization of biomethane potential tests. Water Sci. Technol. 2016, 74, 2515–2522. [Google Scholar] [CrossRef]
- Filer, J.; Ding, H.H.; Chang, S. Biochemical Methane Potential (BMP) Assay Method for Anaerobic Digestion Research. Water 2019, 11, 921. [Google Scholar] [CrossRef]
- Bond, T.; Brouckaert, C.J.; Foxon, K.M.; Buckley, C. A critical review of experimental and predicted methane generation from anaerobic codigestion. Water Sci. Technol. 2012, 65, 183–189. [Google Scholar] [CrossRef]
- Rodrigues, R.; Klepacz-Smolka, A.; Martins, R.; Quina, M. Comparative analysis of methods and models for predicting biochemical methane potential of various organic substrates. Sci. Total. Environ. 2019, 649, 1599–1608. [Google Scholar] [CrossRef]
- Labatut, R.A.; Angenent, L.T.; Scott, N.R. Biochemical methane potential and biodegradability of complex organic substrates. Bioresour. Technol. 2011, 102, 2255–2264. [Google Scholar] [CrossRef]
- Garcia, N.H.; Mattioli, A.; Gil, A.; Frison, N.; Battista, F.; Bolzonella, D. Evaluation of the methane potential of different agricultural and food processing substrates for improved biogas production in rural areas. Renew. Sustain. Energy Rev. 2019, 112, 1–10. [Google Scholar] [CrossRef]
- Godin, B.; Mayer, F.; Agneessens, R.; Gerin, P.; Dardenne, P.; Delfosse, P.; Delcarte, J. Biochemical methane potential prediction of plant biomasses: Comparing chemical composition versus near infrared methods and linear versus non-linear models. Bioresour. Technol. 2015, 175, 382–390. [Google Scholar] [CrossRef]
- Triolo, J.M.; Pedersen, L.; Qu, H.; Sommer, S.G. Biochemical methane potential and anaerobic biodegradability of non-herbaceous and herbaceous phytomass in biogas production. Bioresour. Technol. 2012, 125, 226–232. [Google Scholar] [CrossRef]
- Grieder, C.; Mittweg, G.; Dhillon, B.S.; Montes, J.M.; Orsini, E.; Melchinger, A.E. Kinetics of methane fermentation yield in biogas reactors: Genetic variation and association with chemical composition in maize. Biomass-Bioenergy 2012, 37, 132–141. [Google Scholar] [CrossRef]
- Herrmann, C.; Idler, C.; Heiermann, M. Biogas crops grown in energy crop rotations: Linking chemical composition and methane production characteristics. Bioresour. Technol. 2016, 206, 23–35. [Google Scholar] [CrossRef] [Green Version]
- Kandel, T.P.; Sutaryo, S.; Møller, H.B.; Jørgensen, U.; Lærke, P.E. Chemical composition and methane yield of reed canary grass as influenced by harvesting time and harvest frequency. Bioresour. Technol. 2013, 130, 659–666. [Google Scholar] [CrossRef]
- Dandikas, V.; Heuwinkel, H.; Lichti, F.; Drewes, J.; Koch, K. Correlation between biogas yield and chemical composition of energy crops. Bioresour. Technol. 2014, 174, 316–320. [Google Scholar] [CrossRef]
- Dandikas, V.; Heuwinkel, H.; Lichti, F.; Drewes, J.E.; Koch, K. Correlation between Biogas Yield and Chemical Composition of Grassland Plant Species. Energy Fuels 2015, 29, 7221–7229. [Google Scholar] [CrossRef]
- Catenacci, A.; Azzellino, A.; Malpei, F. Development of statistical predictive models for estimating the methane yield of Italian municipal sludges from chemical composition: A preliminary study. Water Sci. Technol. 2019, 79, 435–447. [Google Scholar] [CrossRef] [PubMed]
- Li, Y.; Zhang, R.; Liu, G.; Chen, C.; He, Y.; Liu, X. Comparison of methane production potential, biodegradability, and kinetics of different organic substrates. Bioresour. Technol. 2013, 149, 565–569. [Google Scholar] [CrossRef]
- Lesteur, M.; Latrille, E.; Maurel, V.B.; Roger, J.; Gonzalez, C.; Junqua, G.; Steyer, J. First step towards a fast analytical method for the determination of Biochemical Methane Potential of solid wastes by near infrared spectroscopy. Bioresour. Technol. 2011, 102, 2280–2288. [Google Scholar] [CrossRef] [PubMed] [Green Version]
- Raju, C.S.; Ward, A.J.; Nielsen, L.; Møller, H.B. Comparison of near infra-red spectroscopy, neutral detergent fibre assay and in-vitro organic matter digestibility assay for rapid determination of the biochemical methane potential of meadow grasses. Bioresour. Technol. 2011, 102, 7835–7839. [Google Scholar] [CrossRef]
- Doublet, J.; Boulanger, A.; Ponthieux, A.; Laroche, C.; Poitrenaud, M.; Rivero, J.C. Predicting the biochemical methane potential of wide range of organic substrates by near infrared spectroscopy. Bioresour. Technol. 2013, 128, 252–258. [Google Scholar] [CrossRef]
- Triolo, J.M.; Ward, A.J.; Pedersen, L.; Løkke, M.M.; Qu, H.; Sommer, S.G. Near Infrared Reflectance Spectroscopy (NIRS) for rapid determination of biochemical methane potential of plant biomass. Appl. Energy 2014, 116, 52–57. [Google Scholar] [CrossRef]
- Strömberg, S.; Nistor, M.; Liu, J. Early prediction of Biochemical Methane Potential through statistical and kinetic modelling of initial gas production. Bioresour. Technol. 2015, 176, 233–241. [Google Scholar] [CrossRef]
- Mortreuil, P.; Baggio, S.; Lagnet, C.; Schraauwers, B.; Monlau, F. Fast prediction of organic wastes methane potential by near infrared reflectance spectroscopy: A successful tool for farm-scale biogas plant monitoring. Waste Manag. Res. 2018, 36, 800–809. [Google Scholar] [CrossRef]
- Wei, Z.; Li, Y.; Hou, Y. Quick estimation for pollution load contributions of aromatic organics in wastewater from pulp and paper industry. Nord. Pulp Pap. Res. J. 2018, 33, 568–572. [Google Scholar] [CrossRef]
- Jain, R.; Goomer, S. Evaluation of Food Nitrogen and Its Protein Quality Assessment Methods. Int. J. Food Sci. Nutr. 2019, 6, 68–74. [Google Scholar]
- Sluiter, A.; Hames, B.; Ruiz, R.; Scarlata, C.; Sluiter, J.; Templeton, D.; Crocker, D. Determination of Structural Carbohydrates and Lignin in Biomass; Technical Report NREL/TP-510-42618; National Renewable Energy Laboratory: Golden, CO, USA, 2012. [Google Scholar]
- Hafner, S.D.; De Laclos, H.F.; Koch, K.; Holliger, C. Improving Inter-Laboratory Reproducibility in Measurement of Biochemical Methane Potential (BMP). Water 2020, 12, 1752. [Google Scholar] [CrossRef]
- ADEME. Méthanisation de Fumiers Bovin et Volaille—Impact Du Stockage Du Fumier et Essais Pilote et Potentiel Énergétique; ADEME Bourgogne: Dijon, France, 2013. [Google Scholar]
- Teurki, R.; Agricultures & Territoires Chambre d’Agriculture Somme; Agricultures & Territoires Chambre d’Agriculture Nord-Pas de Calais; Agence de l’eau Picardie; Agence de l’eau Seine Normandie. Satege Les Effluents D’élevage: Mieux Les Connaître Pour Bien Les Valoriser. 2013. [Google Scholar]
- Corno, L. Arundo Donax L.(Giant Cane) as a Feedstock for Bioenergy and Green Chemistry; University of Milano: Milano, Italy, 2016. [Google Scholar]
- Hutňan, M. Maize Silage as Substrate for Biogas Production. Adv. Silage Prod. Util. 2016, 16, 173–196. [Google Scholar]
- Doligez, P. Réussir Le Compostage de Fumier Équin. Available online: https://equipedia.ifce.fr/infrastructure-et-equipement/installation-et-environnement/effluents-delevage/reussir-le-compostage-de-fumier-equin?tx__%5Baction%5D=&tx__%5Bcontroller%5D=Standard&cHash=113657bc00a1d6a39f98a694daa686fb (accessed on 7 May 2021).
- Luna-de Risco, M.; Normak, A.; Orupõld, K. Biochemical Methane Potential of Different Organic Wastes and Energy Crops from Estonia. Agron. Res. 2011, 9, 331–342. [Google Scholar]
- Kafle, G.K.; Chen, L. Comparison on batch anaerobic digestion of five different livestock manures and prediction of biochemical methane potential (BMP) using different statistical models. Waste Manag. 2016, 48, 492–502. [Google Scholar] [CrossRef] [Green Version]
- Cu, T.T.T.; Nguyen, T.X.; Triolo, J.M.; Pedersen, L.; Le, V.D.; Le, P.D.; Sommer, S.G. Biogas Production from Vietnamese Animal Manure, Plant Residues and Organic Waste: Influence of Biomass Composition on Methane Yield. Asian-Australas. J. Anim. Sci. 2015, 28, 280–289. [Google Scholar] [CrossRef] [Green Version]
- Yang, G.; Li, Y.; Zhen, F.; Xu, Y.; Liu, J.; Li, N.; Sun, Y.; Luo, L.; Wang, M.; Zhang, L. Biochemical methane potential prediction for mixed feedstocks of straw and manure in anaerobic co-digestion. Bioresour. Technol. 2021, 326, 124745. [Google Scholar] [CrossRef]
- Carabeo-Pérez, A.; Odales-Bernal, L.; López-Dávila, E.; Jiménez, J. Biomethane potential from herbivorous animal’s manures: Cuban case study. J. Mater. Cycles Waste Manag. 2021, 23, 1404–1411. [Google Scholar] [CrossRef]
- Barakat, A.; Monlau, F.; Steyer, J.-P.; Carrere, H. Effect of lignin-derived and furan compounds found in lignocellulosic hydrolysates on biomethane production. Bioresour. Technol. 2012, 104, 90–99. [Google Scholar] [CrossRef]
- Dinuccio, E.; Balsari, P.; Gioelli, F.; Menardo, S. Evaluation of the biogas productivity potential of some Italian agro-industrial biomasses. Bioresour. Technol. 2010, 101, 3780–3783. [Google Scholar] [CrossRef]
- Böske, J.; Wirth, B.; Garlipp, F.; Mumme, J.; Weghe, H.V.D. Anaerobic digestion of horse dung mixed with different bedding materials in an upflow solid-state (UASS) reactor at mesophilic conditions. Bioresour. Technol. 2014, 158, 111–118. [Google Scholar] [CrossRef] [PubMed]
- Holliger, C.; De Laclos, H.F.; Hack, G. Methane Production of Full-Scale Anaerobic Digestion Plants Calculated from Substrate’s Biomethane Potentials Compares Well with the One Measured On-Site. Front. Energy Res. 2017, 5, 12. [Google Scholar] [CrossRef]


| Family | CER | ENSI | LCM | MAN | SLU |
|---|---|---|---|---|---|
| Sample number | 17 | 46 | 33 | 31 | 5 |
| DM (% FM) | 21.9–89.4 57.2 | 15.5–69.0 27.3 | 28.4–90.6 71.2 | 8.0–81.6 39.2 | 4.7–26.3 13.2 |
| VS (% FM) | 21.4–85.4 54.3 | 13.5–62.4 25.0 | 26.4–86.0 64.3 | 5.3–69.1 31.8 | 3.5–24.2 11.4 |
| C (% DM) | 40.2–44.6 42.8 | 38.7–46.7 42.6 | 34.5–45.0 42.2 | 28.7–43.5 38.7 | 35.9–42.1 39.9 |
| H (% DM) | 5.8–6.9 6.5 | 5.2–6.6 5.9 | 4.5–6.3 5.8 | 3.8–6.3 5.4 | 5.1–6.0 5.6 |
| N (% DM) | 0.6–3.8 1.4 | 0.5–2.3 1.2 | 0.1–2.3 0.6 | 0.4–4.6 1.6 | 1.6–2.8 2.2 |
| S (% DM) | 0.1–0.7 0.2 | 0.1–0.9 0.2 | 0.1–1.0 0.3 | 0.2–1.6 0.5 | 0.4–0.7 0.5 |
| C/N | 11.4–57.8 37.3 | 19.1–79.4 39.2 | 17.6–497.8 131.7 | 8.2–79.1 31.4 | 14.2–27.3 19.5 |
| Cellulose-like (% VS) | 25.8–60.9 39.0 | 11.2–52.3 27.1 | 15.4–33.6 27.4 | 13.6–35.0 23.4 | 8.7–26.4 17.3 |
| Hemicellulose-like (% VS) | 6.0–21.3 13.7 | 6.4–20.5 12.6 | 7.8–26.0 17.5 | 8.8–21.5 15.7 | 7.7–23.5 15.5 |
| Lignin-like (% VS) | 5.5–21.4 14.1 | 11.4–28.9 20.3 | 14.7–50.2 24.2 | 20.0–56.5 34.9 | 19.1–38.6 29.8 |
| Proteins (% DM) | 4.5–22.5 9.1 | 3.5–14.1 7.7 | 0.6–13.6 3.9 | 3.1–28.1 10.4 | 9.0–18.6 13.7 |
| COD (g/g (CxHyOz)) | 1.2–1.5 1.3 | 1.2–1.7 1.3 | 1.2–2.8 1.4 | 1.2–2.0 1.4 | 1.0–1.8 1.5 |
| Family | CER | ENSI | LCM | MAN | SLU |
| BMPth (Nm3 CH4/t VS) | 407–469 434 | 410–582 449 | 400–920 466 | 397–659 466 | 320–568 483 |
| BMP (Nm3 CH4/t VS) | 250–336 300 | 187–461 324 | 63–330 251 | 132–366 237 | 224–551 362 |
| BMP (Nm3 CH4/t FM) | 56–278 164 | 41–169 78 | 23–254 167 | 13–178 75 | 10–54 35 |
Disclaimer/Publisher’s Note: The statements, opinions and data contained in all publications are solely those of the individual author(s) and contributor(s) and not of MDPI and/or the editor(s). MDPI and/or the editor(s) disclaim responsibility for any injury to people or property resulting from any ideas, methods, instructions or products referred to in the content. |
© 2023 by the authors. Licensee MDPI, Basel, Switzerland. This article is an open access article distributed under the terms and conditions of the Creative Commons Attribution (CC BY) license (https://creativecommons.org/licenses/by/4.0/).
Share and Cite
Lallement, A.; Peyrelasse, C.; Lagnet, C.; Barakat, A.; Schraauwers, B.; Maunas, S.; Monlau, F. A Detailed Database of the Chemical Properties and Methane Potential of Biomasses Covering a Large Range of Common Agricultural Biogas Plant Feedstocks. Waste 2023, 1, 195-227. https://doi.org/10.3390/waste1010014
Lallement A, Peyrelasse C, Lagnet C, Barakat A, Schraauwers B, Maunas S, Monlau F. A Detailed Database of the Chemical Properties and Methane Potential of Biomasses Covering a Large Range of Common Agricultural Biogas Plant Feedstocks. Waste. 2023; 1(1):195-227. https://doi.org/10.3390/waste1010014
Chicago/Turabian StyleLallement, Audrey, Christine Peyrelasse, Camille Lagnet, Abdellatif Barakat, Blandine Schraauwers, Samuel Maunas, and Florian Monlau. 2023. "A Detailed Database of the Chemical Properties and Methane Potential of Biomasses Covering a Large Range of Common Agricultural Biogas Plant Feedstocks" Waste 1, no. 1: 195-227. https://doi.org/10.3390/waste1010014