Article

An Experimentally Validated Selection Protocol for Biochar as a Sustainable Component in Green Roofs

1
Research Groups of Environmental Sciences, CMK, IMO, Hasselt University, Agoralaan Building D, 3590 Diepenbeek, Belgium
2
Faculty of Electrical Engineering, Universidad de Oriente, Santiago de Cuba 90600, Cuba
3
Act&Sorb, BV, Geleenlaan 31, 3600 Genk, Belgium
*
Author to whom correspondence should be addressed.
Waste 2023, 1(1), 176-194; https://doi.org/10.3390/waste1010013
Submission received: 29 October 2022 / Revised: 7 December 2022 / Accepted: 29 December 2022 / Published: 10 January 2023

Abstract

:
Green roofs contribute to more sustainable cities, but current commercial substrates suffer from important limitations. If carefully selected, biochar could serve as a viable option for a more sustainable green roof substrate. We propose a protocol to select an optimal biochar for green roof substrate amendment. Coffee husks, medium-density fiberboard, palm date fronds, and a mixture of waste wood, tree bark, and olive stone kernels are selected as residues for biochar production to develop a selection protocol. The residues are pyrolyzed at 350, 450, 500, and 550 °C in a lab-scale reactor. A pyrolysis temperature of 450 °C is selected for upscaling and is based on biochar yield, pH, salinity, and elemental composition. From evaluating the biochar characteristics after upscaling, it can be concluded that the biochar’s carbonization degree is mainly controlled by pyrolysis temperature, while yield, pH, and salinity are more dependent on the biomass properties. Ultimately, our procedure evaluates the presence of important contaminants, the biochar’s water holding capacity, salinity, pH, and carbonization degree. To validate the developed protocol, plant coverage experiments on green roofs are performed, which are quantified using a novel digital image processing method, demonstrating its efficient use to facilitate future biochar selection in substrates.

1. Introduction

Cities currently face several climate and sustainability problems, such as the urban heat island effect, loss of vegetation [1], and an excess of runoff water [2]. Green roofs could solve these problems, although commercially available green roof substrates also present certain challenges. Examples are plant mortality, an excess of nutrients in the drainage, too much drainage water [3], and the fact that the components of these substrates, such as expanded clay, are not sustainably produced (e.g., the production of expanded clay requires 3.0 GJ of energy per ton of aggregate [4]. The implementation of biochar in green roof substrate could resolve these problems [5,6,7]. Biochar is the solid product that remains after pyrolysis of biomass or other carbon-based feedstocks in a low-oxygen environment. It comprises a wide range of carbon products, mainly irregular aromatic compounds containing not only C, but also O, H, N, and minerals derived from the feedstock [8]. Biochar has a high amount of residual carbon (>50%), acting as an effective carbon sink [8,9]. The conversion of biomass can be achieved thermally, thermochemically, biochemically, chemically, or mechanically. In thermochemical conversion, biomass is converted into energy carriers such as biochar, bio-oil and syngas. Pyrolysis is the preliminary stage of all thermochemical conversion processes. It comprises the thermal decomposition of materials at elevated temperatures in an inert atmosphere to form solid, liquid, and gaseous products. This structured approach is primarily of theoretical importance and, in that sense, serves as a workable model to bundle the complex set of pyrolytic reactions. The phases do not occur chronologically as a function of a rising pyrolysis temperature; they strongly overlap each other [8]. A number of non-independent process parameters have a fundamental influence on the final product yield and properties. The most important factors are pyrolysis temperature, heating rate, gas residence time, and feedstock type [9]. Furthermore, different feedstocks produce very different proportions of pyrolysis products as they initially consist of a different ratio of lignocellulosic material. Moreover, the same biomass with or without pretreatment can yield a different product ratio after pyrolysis. Such a pretreatment can be mechanical, chemical, thermal, or even biological [8,9]. Lastly, the reactor design is directly linked to the quality of the biochar.
In green roofs, biochar improves water supply to plants [5], reduces runoff water [7] and improves plant and microbial growth [6]. In many cases, however, biochar is also toxic to plants [10,11]. The toxic effect of biochar on plant coverage in green roofs has been hypothesized to be primarily due to components that are adsorbed to the biochar’s surface during pyrolysis such as polycyclic aromatic hydrocarbons (PAHs) [12]. As cellulose, hemicellulose, and lignin are the main precursors of PAH, the initial biomass strongly affects the biochar’s PAH content. Furthermore, elemental composition, moisture content, and the biochar’s morphology are feedstock- and process-dependent and play an important role in PAH formation [13]. Additional negative effects of biochar on plant coverage on green roofs, including a reduction in plant nutrient uptake due to high pH, a reduction in carbon mineralization, or saline stress due to excessive leaching, are all related to the biochar precursor (input material) and production process [14,15]. Taking this into account, it is clear that, when considering biochar as a sustainable component in green roof substrates, clear instructions and selection criteria on its physicochemical properties are essential.
We propose an optimal combination of complementary analytical techniques to provide fast and reliable information on biochar parameters that affect plant coverage on green roofs. The design and validation of such a selection protocol requires optimal biochar production, extensive physicochemical characterization of both the input and the output material, and the evaluation of the effect of the biochar on plant coverage on green roofs. In this study, we first optimize biochar production from six different residue streams in a lab-scale pyrolysis reactor at 350, 450, 500, and 550 °C. For example, Li et al. [16] found that properties such as pH and C, H, N, and O content are, in most cases, more sensitive to pyrolysis temperature than biomass type. All biochars are characterized, and an optimal pyrolysis temperature is selected before upscaling the biochar production to a continuous, pilot-scale reactor. To validate the selection protocol, we evaluate plant coverage for the succulent Sedum hispanicum, using green roof substrates with 1 and 5 wt.% of the six different biochars. Plant coverage is selected as a key parameter for Sedum green roofs as (a) fast coverage of the roof is essential for its functioning [17], and (b) coverage can be quantified digitally for low-growing succulents such as S. hispanicum [18].

2. Material and Methods

2.1. Biomass

Six types of biomass are investigated: (1) coffee husks (COF) (Java Coffee Company NV, Rotselaar, Belgium); (2) medium-density fiberboard (MDF) (side stream of MDF production, Germany); (3) palm date fronds (PDF) (waste stream, Qatar); (4) AB wood mix (AB) (Gielen NV, Genk, Belgium), which consists of different kinds of treated, but uncontaminated wood such as multiplex, MDF, or painted wood (type B wood), as well as impurities such as plastics; (5) tree bark (TB) (Pinus sylvestris, Hubo, Belgium); (6) olive stone kernels (OS) (Caldini, Radicondoli, Italy).
For all analyses, biomass particle size is between 63 µm and 500 µm. Before pyrolysis, all materials are shredded to <4 mm for the lab-scale reactor and <1 cm for the pilot-scale reactor. The different particle sizes are chosen on the basis of dimension and input limitations of both reactors. Wet biomass is oven-dried at 105 ± 3 °C until constant weight after delivery.

2.2. Pyrolysis

A detailed description of the lab-scale reactor can be found in [19]. Pyrolysis is performed under constant N2 flow (70 mL/min), and a heating rate of 15 °C/min is applied until working temperature is reached. Then, an isothermal period of 30 min is applied before the reactor is cooled down. All pyrolysis experiments in the lab-scale reactor are performed in triplicate.
A detailed description of the pilot-scale reactor can be found in [20]. Biochar was produced in the pilot-scale reactor in a pyrolysis gas atmosphere in a single 8 h run for every biomass stream. Mean residence time (MRT) was determined theoretically using an adapted version of the Sullivan’s equation as explained in [20]. The schematic representation of both reactors can be found in Figure S1.
Process parameters of both pyrolysis techniques are displayed in Table 1. A rotary kiln operating at 10 rpm maximized homogeneous heat transfer and mixing of the solids [21] at a conventional inclination angle of 2° [22]. Input speed was varied between 750 g/h for low-density biomass (MDF, PDF, COF, AB, and TB) and 2000 g/h for high density (OS).

2.3. Physicochemical Characterization

2.3.1. Proximate Analysis

First, 10 mg of sample was heated in a thermogravimetric analyzer (TGA) (TA Q500, Zellik, Belgium) from 20 °C to 600 °C at a heating rate of 20 °C/min under 90 mL/min N2 flow and switching to 90 mL/min O2 flow until 900 °C. Volatile matter (VM) and fixed carbon (FC) contents were determined. Ash content was analyzed using ASTM E 1755–01.

2.3.2. Ultimate Analysis

Total C, H, N, and S content of all samples (±2 mg) was determined using a Thermo Electron Flash EA1112 elemental analyzer (Thermo Electron, Waltham, MA, USA). Calibration was carried out using BBOT (2,5-bis (5-tert-butyl-benzoxazol-2-yl) thiophene). Oxygen was calculated by difference (O = 100 % − C% − H% − N% − Ash%). No sulfur was detected.

2.3.3. Component Analysis

The Van Soest and Wine (1968) method was used to determine hemicellulose, cellulose, and lignin content [23]. Prior to analysis, the biomass samples were dried at 105 °C to remove moisture and extracted with ethanol according to ASTM E 1690-01 to remove hydrophobic materials and, therefore, make it easier to wet the material for the analysis of the structural components in the biomass [24]. First, the acid detergent fiber (ADF) and neutral detergent fiber (NDF) were determined. Then, the ADF sample was oxidized by KMnO4 to obtain the lignin content. After this, the resulting sample (cellulose + ash) was burned to obtain the amount of cellulose. Lastly, hemicellulose was determined from the difference between the ADF and the NDF percentages. All steps were performed in quadruplicate.

2.3.4. Elemental Composition after Digestion

Elemental composition was analyzed by inductively coupled plasma atomic emission spectroscopy (ICP-AES). First, 250 mg of crushed sample was acidified in H2O2 (30%, Merck) and HNO3 (65%, J.T.Baker) and digested using the two-stage digestion procedure in [25]. All samples were measured with a Perkin Elmer Optima 3000 DV ICP-AES instrument in axial mode. Instrument calibration was achieved using Merck Sulfur ICP standard Certipur®, VWR Chemicals Phosphorus Plasma Emission Standard and ICP Merck ICP multi-standard solution IV. The following elements were measured: Ag, Al, As, Ba, Bi, Ca, Cd, Co, Cr, Cu, Fe, Hg, K, Li, Mg, Mn, Mo, Na, Ni, P, Pb, S, Sr, Tl. and Zn.

2.3.5. Fourier-Transform Infrared Analysis (FT-IR)

FT-IR spectra were obtained using a model VERTEX 70 FTIR (Bruker, Karlsruhe, Germany) spectrometer equipped with a DTGS detector, FT-IR microscope (Hyperion 2000 equipped with MCT detector), and ATR accessory (Ge crystal) (Bruker, Karlsruhe, Germany). Absorption was measured between 4000 and 600 cm−1 at a resolution of 4 cm−1, and 32 scans were acquired per sample. All spectra were baseline-corrected and normalized at 1600 cm−1.

2.3.6. pH and Electrical Conductivity (EC)

pH was measured after adding 50 mL of OECD (Organization for Economic Co-operation and Development) water to 250 mg of char. The composition of OECD standard water is based on ISO 6341. Solutions were shaken for 24 h and filtered over a 0.45 µm membrane filter. pH was determined using a calibrated combined pH electrode and pH meter 764 Multi-Calimatic (Knick, Berlin, Germany). The EC is a measure for salinity and was measured using an InoLab, cond7110 (Xylem, New York, NY, USA) conductivity meter. The differences in EC between the different biochars were evaluated via ion chromatography (IC) using a DX120 ion chromatograph (ThermoFisher Scientific, Waltham, MA, USA) with an IonPac AS14A analytical column, an IonPac AG14A guard column, and a Dionex ACRS 500, 4 mm suppressor column. Measurements were conducted after shaking biochar for 24 h in ultrapure water in a 1:20 biochar/water ratio.

2.3.7. Leaching Tests

Leaching tests were performed using OECD standard water as leachate. First, 250 mg of sample was added to 50 mL of OECD standard water and shaken for 24 h at room temperature. Solutions were filtered over a 0.45 µm membrane filter. Then, 0.5% of concentrated HNO3 (69%, Merck) was added to each sample to prevent precipitation. All samples were analyzed in quadruplicate using a Perkin Elmer Optima 3000 DV ICP-AES instrument. The same elements were measured as described for the determination of elemental composition after digestion. The leachable amounts were compared to the total concentration of corresponding elements in the biochar.

2.3.8. Polycyclic Aromatic Hydrocarbons Determination Using GC/MS

Sixteen EPA polycyclic aromatic hydrocarbons (PAHs) were determined according to the International Biochar Initiative (IBI), using US EPA 8270 “Semi-volatile organic compounds by gas chromatography/mass spectrometry (GC/MS) after Soxhlet extraction” (US EPA 3540) with 100% toluene (99.5%, AnalaR NORMAPUR®, VWR Chemicals, Leuven, Belgium) as the extracting solvent. Five grams of sample was first extracted, and 1 ppm of surrogate standard spiking solution (TraceCERT®, Sigma-Aldrich, St. Louis, MO, USA) was added. After this, the extract was dried over a column of anhydrous Na2SO4 (>99%, GPR RECTAPUR®, VWR Chemicals, Belgium) and concentrated to a volume of 1 mL in a rotary evaporator (Büchi R-100, Fawil, Switserland). The concentrated extract was measured using GC/MS (Trace 1310 Gas Chromatograph, DSQ-II quadrupole mass spectrometer, Thermo Scientific, USA). The influence of the feedstock is in most cases substantially more important than the influence of the pyrolysis conditions [26,27]. Therefore, in this research, only the influence of feedstock type was inspected in the continuous reactor.

2.3.9. Water Holding Capacity (WHC)

WHC was measured according to ISO 14238-2012. Two grams of biochar was kept inside a glass tube and submerged for 3 h. After this, the sample is was after draining the excess water out of the tube by placing the tube for 2 h on a sand bed. Next, the biochar was weighed again after drying at 105 °C until constant mass. The WHC (in %) was determined from the mass difference between the dry and wet biochar. All analyses were performed in quadruplicate.

2.3.10. Statistical Analysis

A two-way analysis of variance (ANOVA) was applied to two-variable data and tested for interaction at a 5% significance level. On significant data, a post hoc Tukey’s honest significant difference (HSD) test was performed at a 5% significance level. All analyses were performed with R v3.6.2 (RStudio).

2.4. Plant Coverage Experiments

The commercial green roof substrate was composed of expanded clay, lava, green compost, and organic material (5%) and mixed with 1 and 5 wt.% of biochar. Cuttings of Sedum hispanicum were planted on the substrate at a rate of 100 g/m². The plants were put in a controlled environment with a temperature of (22 ± 2) °C and 65% ± 1% humidity. They were watered every 2–3 days, and the total surface for each setup was 0.125 m². To evaluate plant coverage, a novel digital image processing method was applied. Pictures of the setups are taken every 2–3 days with a 12 MP (1.4 micron pixels) camera.
A set of 500 images were taken in order to evaluate the proposed automatic segmentation method; the images were processed using Image Processing Toolbox from MATLAB®. Original images were obtained at a resolution of 4032 × 3024 in “jpg” and R (red) G (green) B (blue) space color. A growth period of 30 days was considered in order to study the variations in green amount in S. hispanicum cuttings.
The automatic segmentation method was based on [18]. In this work, the amount of green in S. hispanicum images was assessed using a combination of extraction color indices and a binarization process, quantifying the amount of green pixels in the image. An overview of the analysis is described in the flow diagram in Figure S2.
The excess red (from the substrate) was subtracted from the greenness image that was obtained from the automatic segmentation method. As a result, the effect of the substrate was removed, and a grayscale image was obtained where almost all the green was represented by a gray intensity larger than 0 (0 = white, 1 = black), considering the threshold that produced the best similitude between original images and black and white images.
Once the separation of the green of the combined image from blue and red spectral bands was completed, the next step was to isolate the green parts in the obtained image. Several automatic thresholding methods can be applied for this purpose such as Otsu’s method, the statistical mean, or the iterative method of Gonzales and Woods [18,28]. However, it has been demonstrated that thresholds obtained by Otsu generally tend to produce an infra-segmentation because it provides a relative high value in the histogram, excluding pixels from the histogram classified as green pixels in the automatic segmentation [18].
In our case, the Otsu method and the iterative method of Gonzales and Woods were not capable of producing the needed differentiation when binary images were compared with grayscale images obtained from the green separation and original images. Therefore, the threshold selection for binarization was developed using the statistical mean (average of the gray level) [18,28] in the grayscale image histogram from a greenness image. White pixels were quantified using the image histogram. Light changes were quantified using the vegetation index (VEG) [18,28].
After application of the color index combination and the black and white binarization, the new binary image only had two numerical values in the grayscale “1” (representing all the white in the image) and “0” (representing all the black). At this point, all the white in the image represents the green amount in the original image. Its amount qualification was done using the black and white image histogram and a devoted algorithm implemented in MATLAB®. Taking into account that, for day 1, all the images did not show the same amount of green between all biochar substrates, it was necessary to normalize the results.
Using the 〖TP〗_WH (Rday1) = (〖TP〗_WH (a))/(〖TP〗_WH (day1)) parameter, the differences in plant coverage were normalized to the initial differences on day 1. The〖TP〗_WH (Rday1) parameter is the ratio between the total amount of white pixels in the image of a specific day (〖TP〗_WH (a)) and the initial day (〖TP〗_WH (day1)) (both dimensionless). A two-sample Kolmogorov–Smirnov test with a confidence interval of α = 0.05 was used to assess statistically significant differences between conditions and control.

3. Results and Discussion

3.1. Characterization of the Input Material

Biomass characterization is essential as the initial biomass composition determines the characteristics of the biochar [29]. Results of the biomass characterization are used to explain differences in biochar properties. Elemental analysis of the biomass was previously published [30]. To summarize, total N content was highest for MDF (4.5 wt.%), followed by COF (2.9 wt.%), in accordance with previous reports [31], and finally AB (2.6 wt.%). C content ranged from 48 wt.% to 38 wt.%. Total H content was around 6 wt.% for all biomasses, while total O content ranged between 33 wt.% and 48 wt.%. Ash content in the biomass determined the ash content of the biochar as most of the inorganic elements remain present in the biochar after pyrolysis. Ash content was the highest in COF and PDF (almost 10 wt.%), explained by the fact that tropical wood species require more minerals for growth, and potassium was fixed in the leaflets prior to distribution to other parts of the plants [32]. The lowest ash contents were found in MDF and OS (around 1 wt.%). Differences in ash content were supported by ICP-AES analysis of the input materials, also showing that Ca, K, and Mg were present as the major elements (Table 2). FC was the highest in TB (39 wt.%), followed by OS (30 wt.%). All other biomasses had a similar FC between 17 and 20 wt.%. VM was usually inversely proportional to FC and was the highest in AB and MDF (79 wt.%), followed by COF (74 wt.%). The PDF and OS had a VM content of 68 wt.%, while this was as low as 57 wt.% in TB [30].
FTIR analysis supported the previous tests. and a summary of the band assignment for all residues is shown in Table S1. The absorption bands at around 3300 cm−1 (O–H stretching vibration), 2900 cm−1 (C–H stretching vibrations), and 1455 and 1371 cm−1 (C–H bending vibrations) had rather weak intensities for COF, MDF, AB, and TB compared to PDF and OS. These different intensities correlated well with the highest hemicellulose content in OS and PDF (24.5 wt.% and 10.3 wt.%, respectively), as well as with the low H/C and O/C ratio in COF, MDF, AB, and TB and high H/C and O/C ratios in OS and PDF (Table 2). The broad band at 1736 cm−1 was typical for the C=O stretch in hemicellulose. A good correlation of our results (R2 = 0.87) between the hemicellulose content and the height of this absorption band was found using the method described in [33]. No meaningful correlations could be made for cellulose or lignin using this method due to band overlap. The sharp absorption band at 1262 cm−1 (aromatic ring vibration of guaiacyl lignin) was not observed for OS and was observed only as a shoulder for PDF. This band was most pronounced for MDF, AB, TB, and COF, correlating well with their relatively higher lignin contents (Table S1). The absorption band at 718 cm−1 was attributed to Ca–O bonds [34] and was most visible in the spectra of COF and PDF due to their high Ca concentration

3.2. Influence of Pyrolysis Temperature

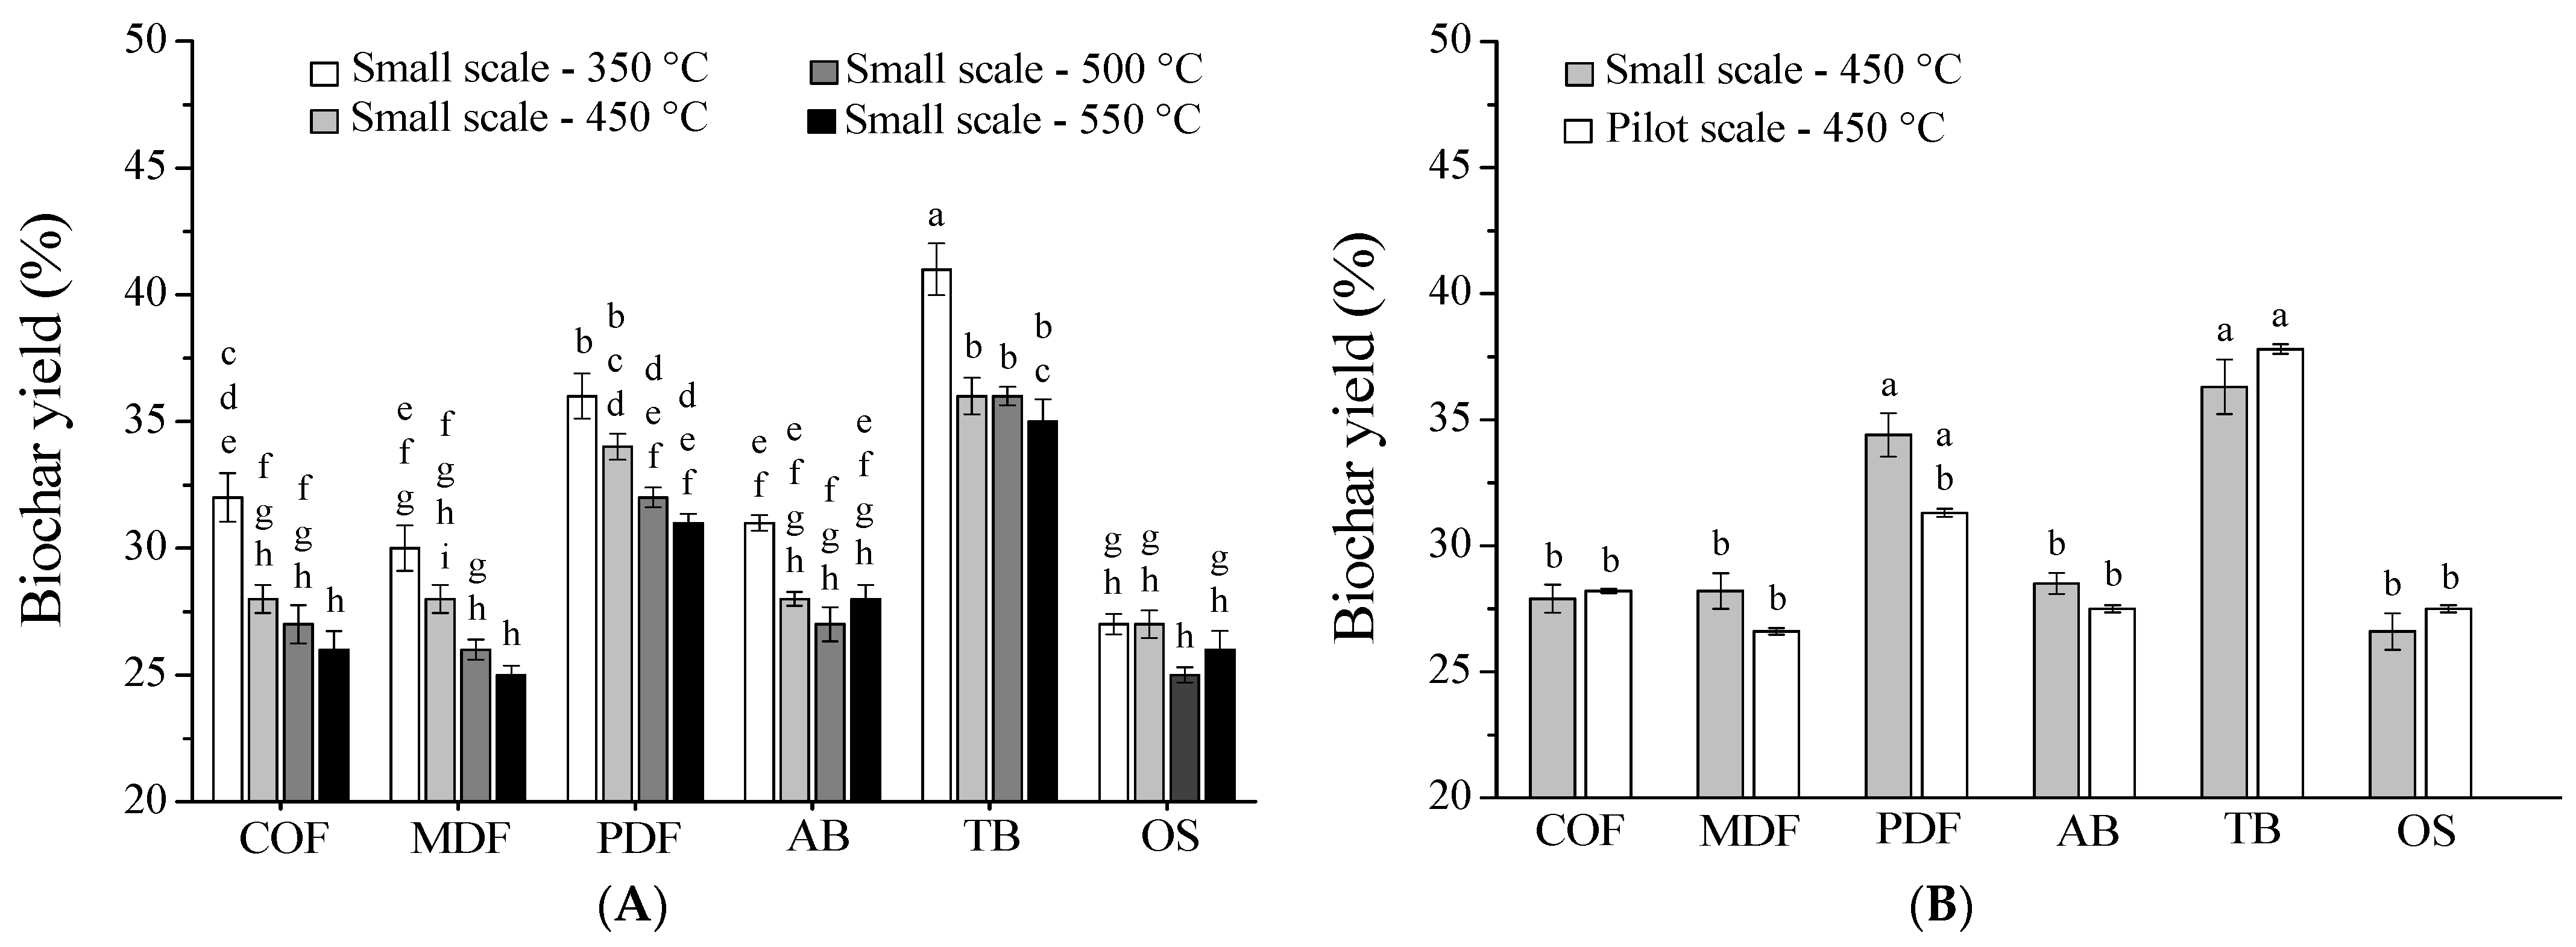
3.2.1. Biochar Yield and Elemental Composition
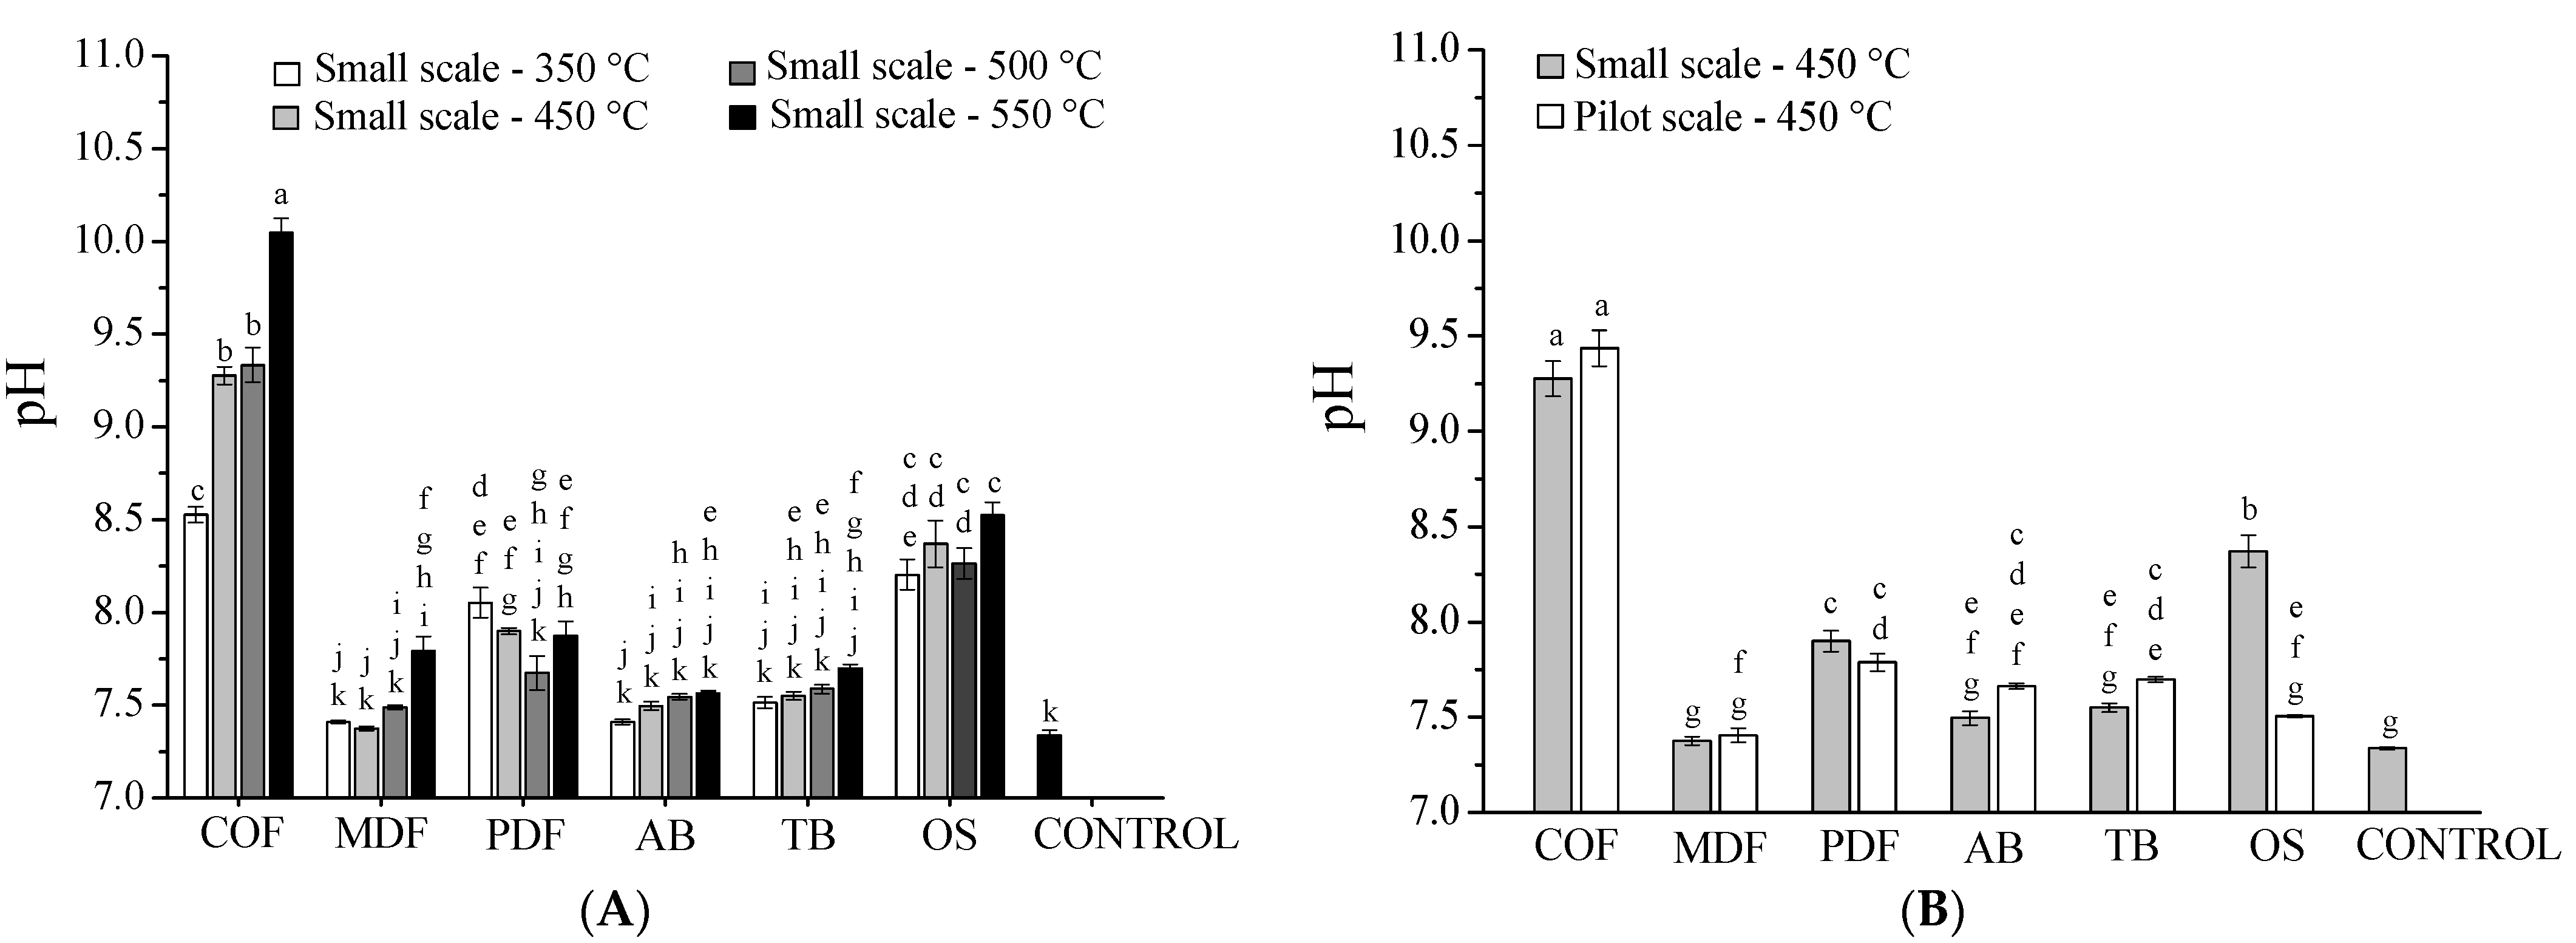
Pyrolysis temperature in the lab-scale reactor was varied between 350 and 550 °C to select the optimal pyrolysis temperature for biochar. Biochar yield generally decreased significantly (p < 0.05) with increasing pyrolysis temperature (Figure 1A), as previously reported [35]. Contrastingly, biochar yield in OS did not change significantly with increasing pyrolysis temperature. This can be explained by the fact that OS mainly consisted of hemicellulose (24.5 wt.%) and cellulose (61.1 wt.%) (Table 2), which already start to decompose at 220 °C and 300 °C, respectively [36]. All other biomasses showed a significant amount of the more thermally stable lignin. The degradation of lignin took place between 200 °C and 700 °C, explaining the decreasing biochar yield with increasing pyrolysis temperature [36]. Biochar yield was highest for TB, explained by the lowest amount of VM, highest FC content, and low hemicellulose content in the biomass (Table 2). PDF had the second highest yield, followed by COF. This can possibly be explained by the higher VM and lower FC content in COF than in PDF biomass, as well as by the composition of the ash content in both biomasses. The levels of alkali metals such as K were significantly (p < 0.05) higher in COF than in PDF (12.7 g/kg compared to 7.8 g/kg, respectively), while the levels of alkaline earth metals such as Ca were higher (p < 0.05) in PDF than in COF (15.4 g/kg compared to 12.4 g/kg, respectively) (Table 2). K has been shown to catalyze thermal degradation of biomass [37], while Ca hinders this degradation process [38], partly explaining the higher biochar yield in PDF. Lignin content was, however, higher in COF than in PDF, but the higher FC content suggests that this was more stable in PDF, due to the described catalytic effect of the present alkali metals in COF [37].
In addition to the biochar yield, there was a decrease in H, N, and O content and an increase in C and ash content with increasing pyrolysis temperature (Table 3), in line with earlier studies [39,40]. The carbonization degree is determined by the biochar C content and is an important biochar characteristic as it is directly linked to plant responses. Highly carbonized and aromatized biochars do not provide a direct carbon or nutrient source to plants, while less carbonized biochars do [41]. Furthermore, carbonization degree is an important measure for the carbon sequestration possibilities of the produced biochar. On the other hand, biochar produced at 450 °C is significantly more aromatic/stable than biochar produced at 350 °C [42], and stable biochar can survive for a longer time in the soil [41].
Ash content increased with pyrolysis temperature, as confirmed by ICP-OES data. Elements that were abundant in the biomass (Table 2) were also the major elements found in the biochar (Table 4). These elements were concentrated within the biochar as a result of the loss of volatile components during the thermal conversion of the biomass to biochar. In general, most biochars showed an increased concentration of all measured elements (Table 4) with an increasing pyrolysis temperature, as expected on the basis of the increase in ash content with increasing pyrolysis temperature (Table 3). As such, heavy metal concentrations in COF and AB biochar exceeded the threshold imposed by the European Biochar Certificate (EBC) [43]. The COF biochar had an elevated concentration of Cu (212 to 292 mg/kg), while AB had too much Cr (124 to 155 mg/kg), Cu (87 to 149 mg/kg), Pb (488 to 1402 mg/kg), and Zn (485 to 976 mg/kg) (Table S3) to qualify for EBC certified biochar. Biochar concentrations for all of these elements increased with increasing pyrolysis temperature.
High ash content in biochars can be positive when used as fertilizer in nutrient-poor, acidic soils as these biochars generally have high concentrations of K and p (Table 4). Furthermore, biochars with a high ash content increase the soil’s pH [39,44]. For other applications, a high ash content is generally not desired as it is related to a lower C content and increases the chances of contamination with (heavy) metals, e.g., in AB and COF biochar. Additionally, a high content of inorganics in the biochar can catalyze the production of more PAHs [45]. Therefore, a low ash content and, thus, a lower pyrolysis temperature are generally desired for biochar applications in the targeted green roof substrates.
The FTIR data (Table S2) confirmed all of the described trends as band intensities associated with C–H, C–O, C–N, or C=O functionalities decreased with increasing pyrolysis temperature. Absorption bands that were more prominent with increasing pyrolysis temperature were either due to an increase of aromatic (C=C) bonds or an increase in ash content with possible in situ CaCO3 (and other carbonates) formation, certainly in biochars with high ash content (COF, PDF, and TB) [42].

3.2.2. Biochar pH

High alkalinity and salinity of biochar are both important negative characteristics for its use in growing media [46,47]. Therefore, a clear understanding of these parameters is essential before the biochar can be used in a green roof substrate. As shown in Figure 2A, COF, PDF, and OS biochars had a significantly (p < 0.05) higher pH than the control sample (OECD water). All biochars, except PDF and OS, showed an increase in pH with higher pyrolysis temperatures, and this increase was correlated to an increase in ash and a decrease in O content [39,44]. The latter was directly correlated to the decrease in the remaining acid functional groups (primarily phenolic –OH and –COOH groups) from the original feedstock, as confirmed by FTIR analysis (Table S2). In COF and PDF, the high pH was explained by a high ash content (Table 3), while, in OS, the high pH was caused by its elemental composition and the very high degree of aromaticity already achieved at 350 °C (Table S2).
COF had the highest pH of all biochars (Figure 2). However, ash and O content in PDF biochar was comparable with that of COF biochar, while pH values were substantially lower. However, the inorganic composition of both biochars was different. The ash of COF biochar mainly consisted of Ca (32 to 38 g/kg and increasing with pyrolysis temperature), K (36 to 46 g/kg and increasing with pyrolysis temperature), and Mg (9 to 11 g/kg and increasing with pyrolysis temperature). The PDF biochar had a comparable Ca (39 to 49 g/kg and increasing with pyrolysis temperature) and Mg (9 to 11 g/kg and increasing with pyrolysis temperature) content to COF, but its K content was significantly lower (18 to 22 g/kg) (Table 4).
The availability of these inorganics and the differences in pH between COF and PDF biochar were further investigated through leaching experiments. The COF and PDF biochars leached out most of their K in OECD water (Figure 3). The Ca concentration of COF biochar tended to decrease in OECD water, while that of PDF increased, regardless of the production temperature. The higher pH of COF biochar can, therefore, be explained by higher levels of both K and Ca, which were present as carbonates and oxides after pyrolysis [as also concluded from FTIR (Table S2)]. This was also the case for other biochars; the pH of OS biochar was higher than that of TB biochar due to the elevated K content in the former. Furthermore, both MDF and AB biochars were low in K and showed only a minor pH increase as a function of the pyrolysis temperature. Another explanation for the elevated pH of COF and OS biochars is that Na+ exchange with H+ from OECD water affected the buffer capacity and increased the pH (NaHCO3 is the main buffering component in OECD water). Most plants prefer a neutral environment, and a high pH can lead to phytotoxicity [48]. For sedum species in general, a substrate pH of around 6 is usually optimal for plant growth [49]. Therefore, a moderate-to-low pyrolysis temperature, with a limited increase in pH, is best for the desired application in the targeted green roof substrates.

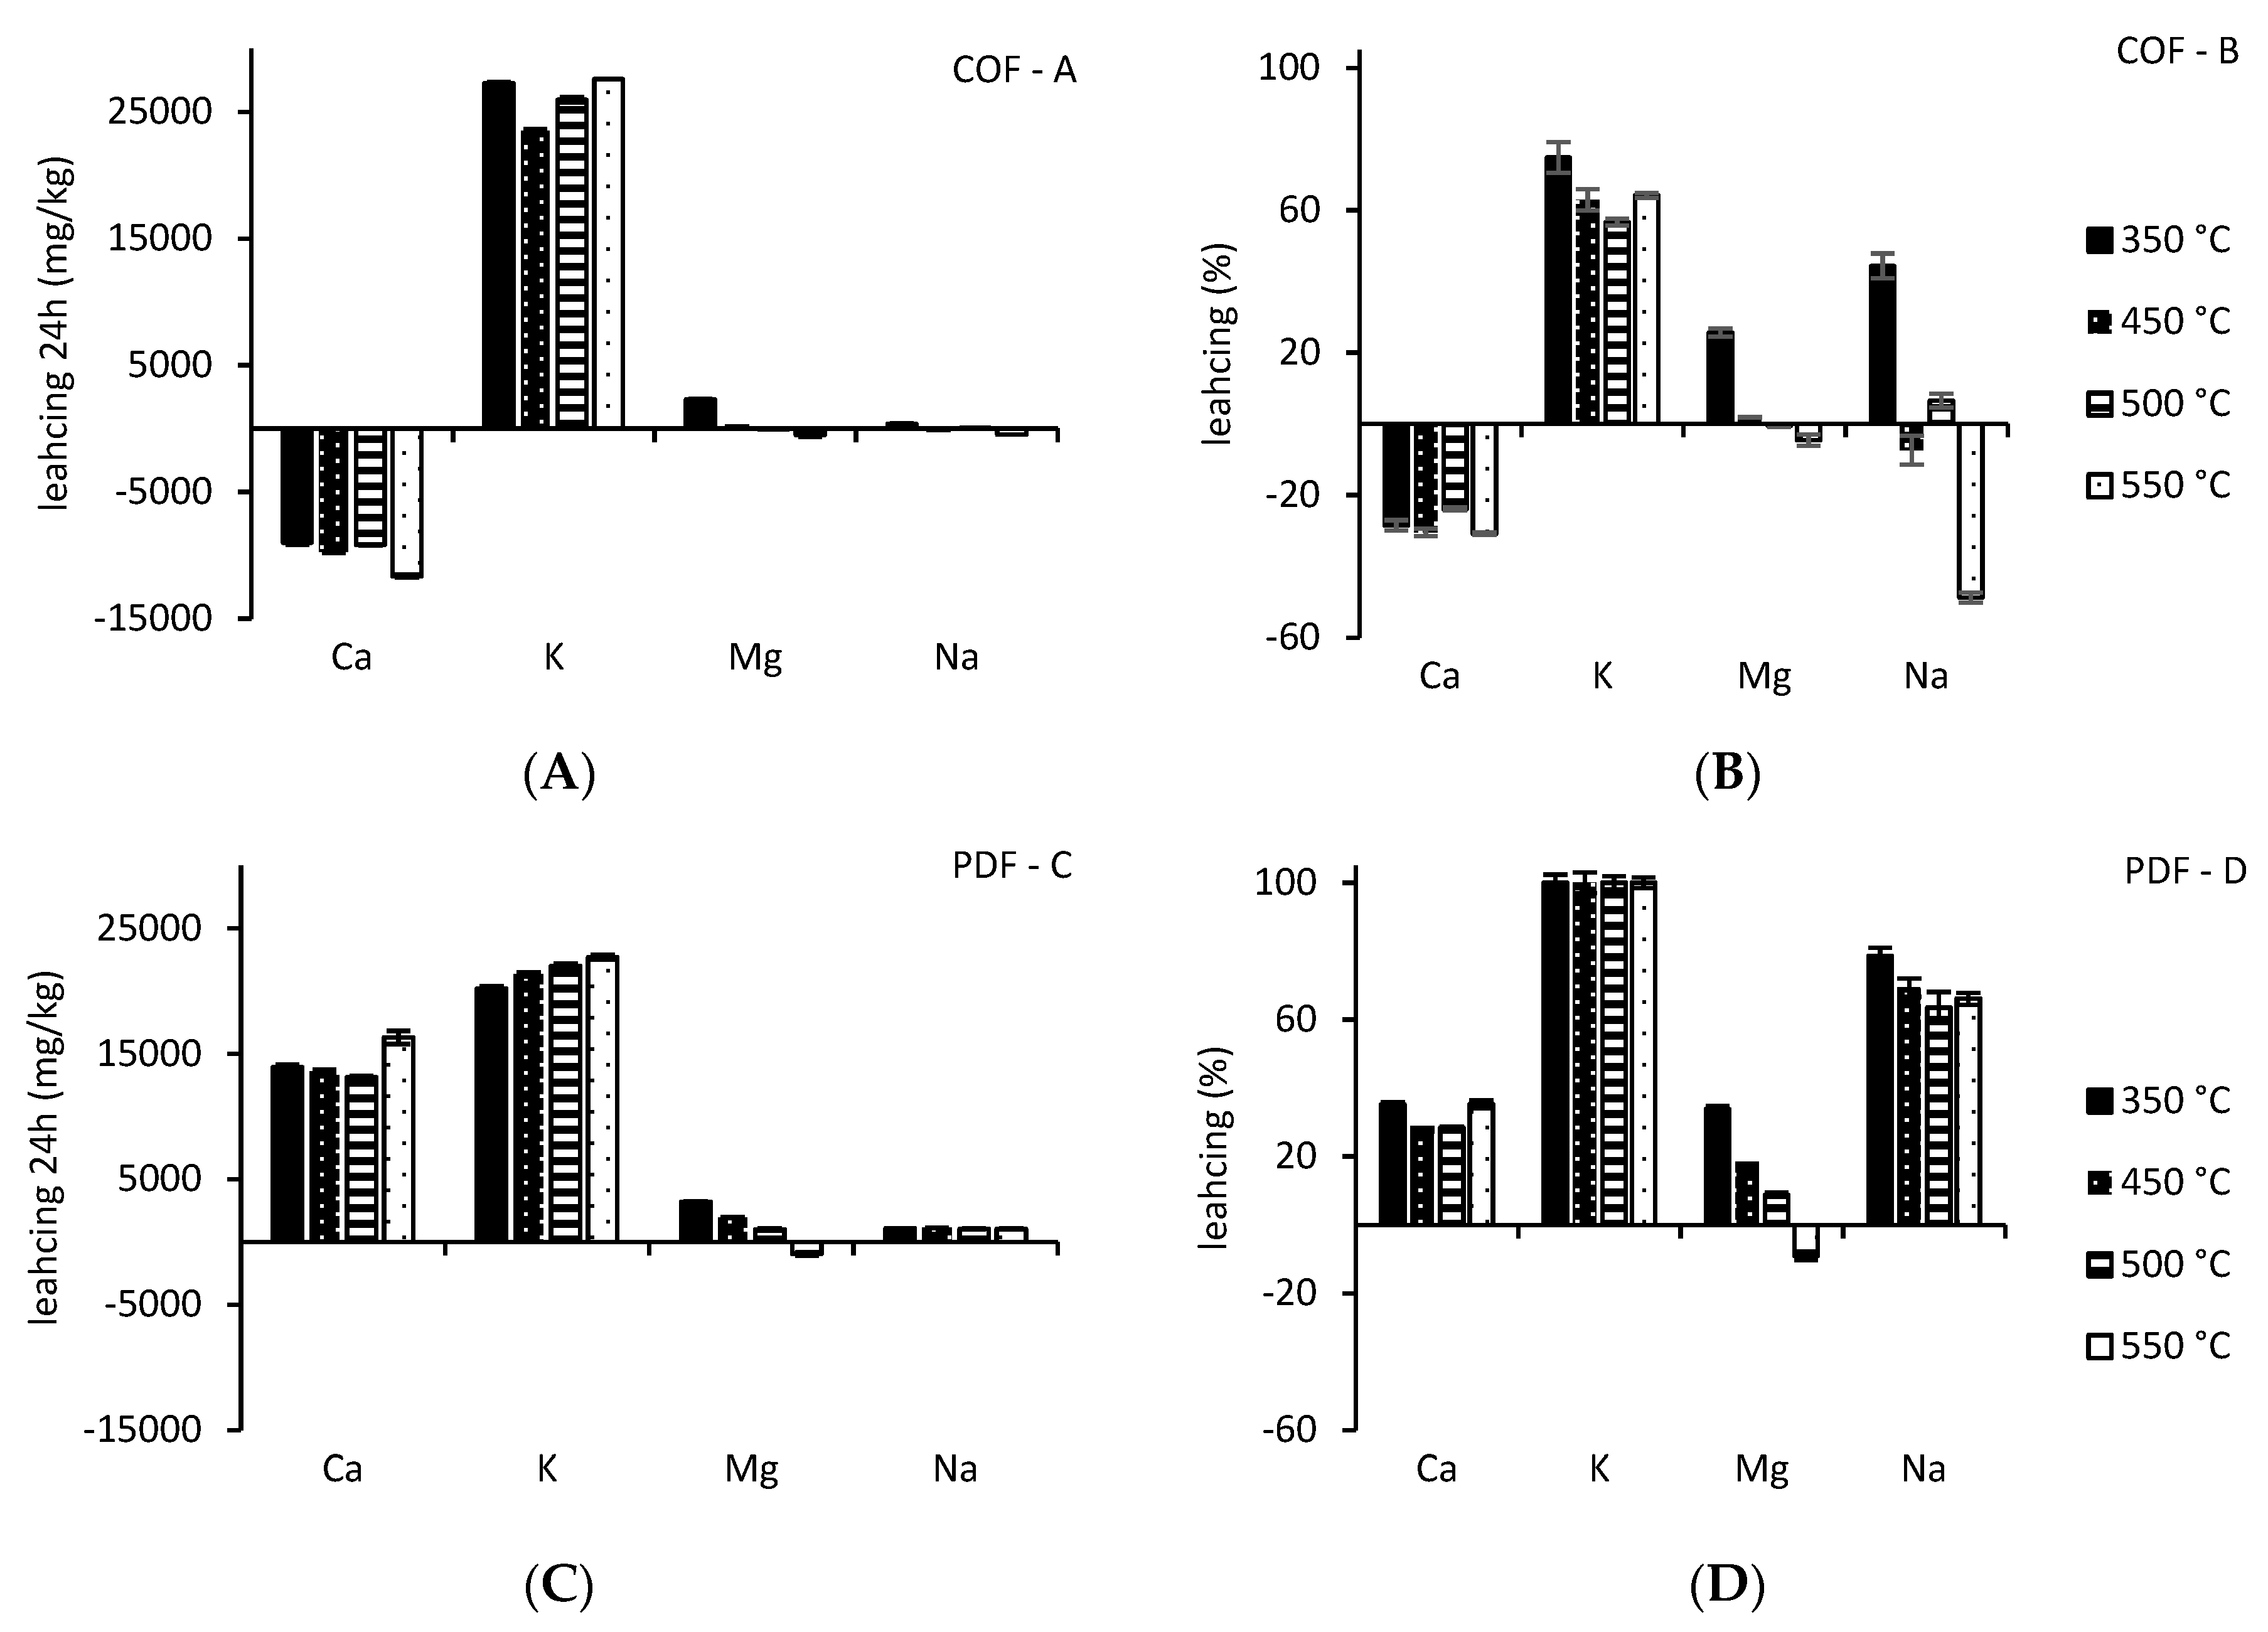
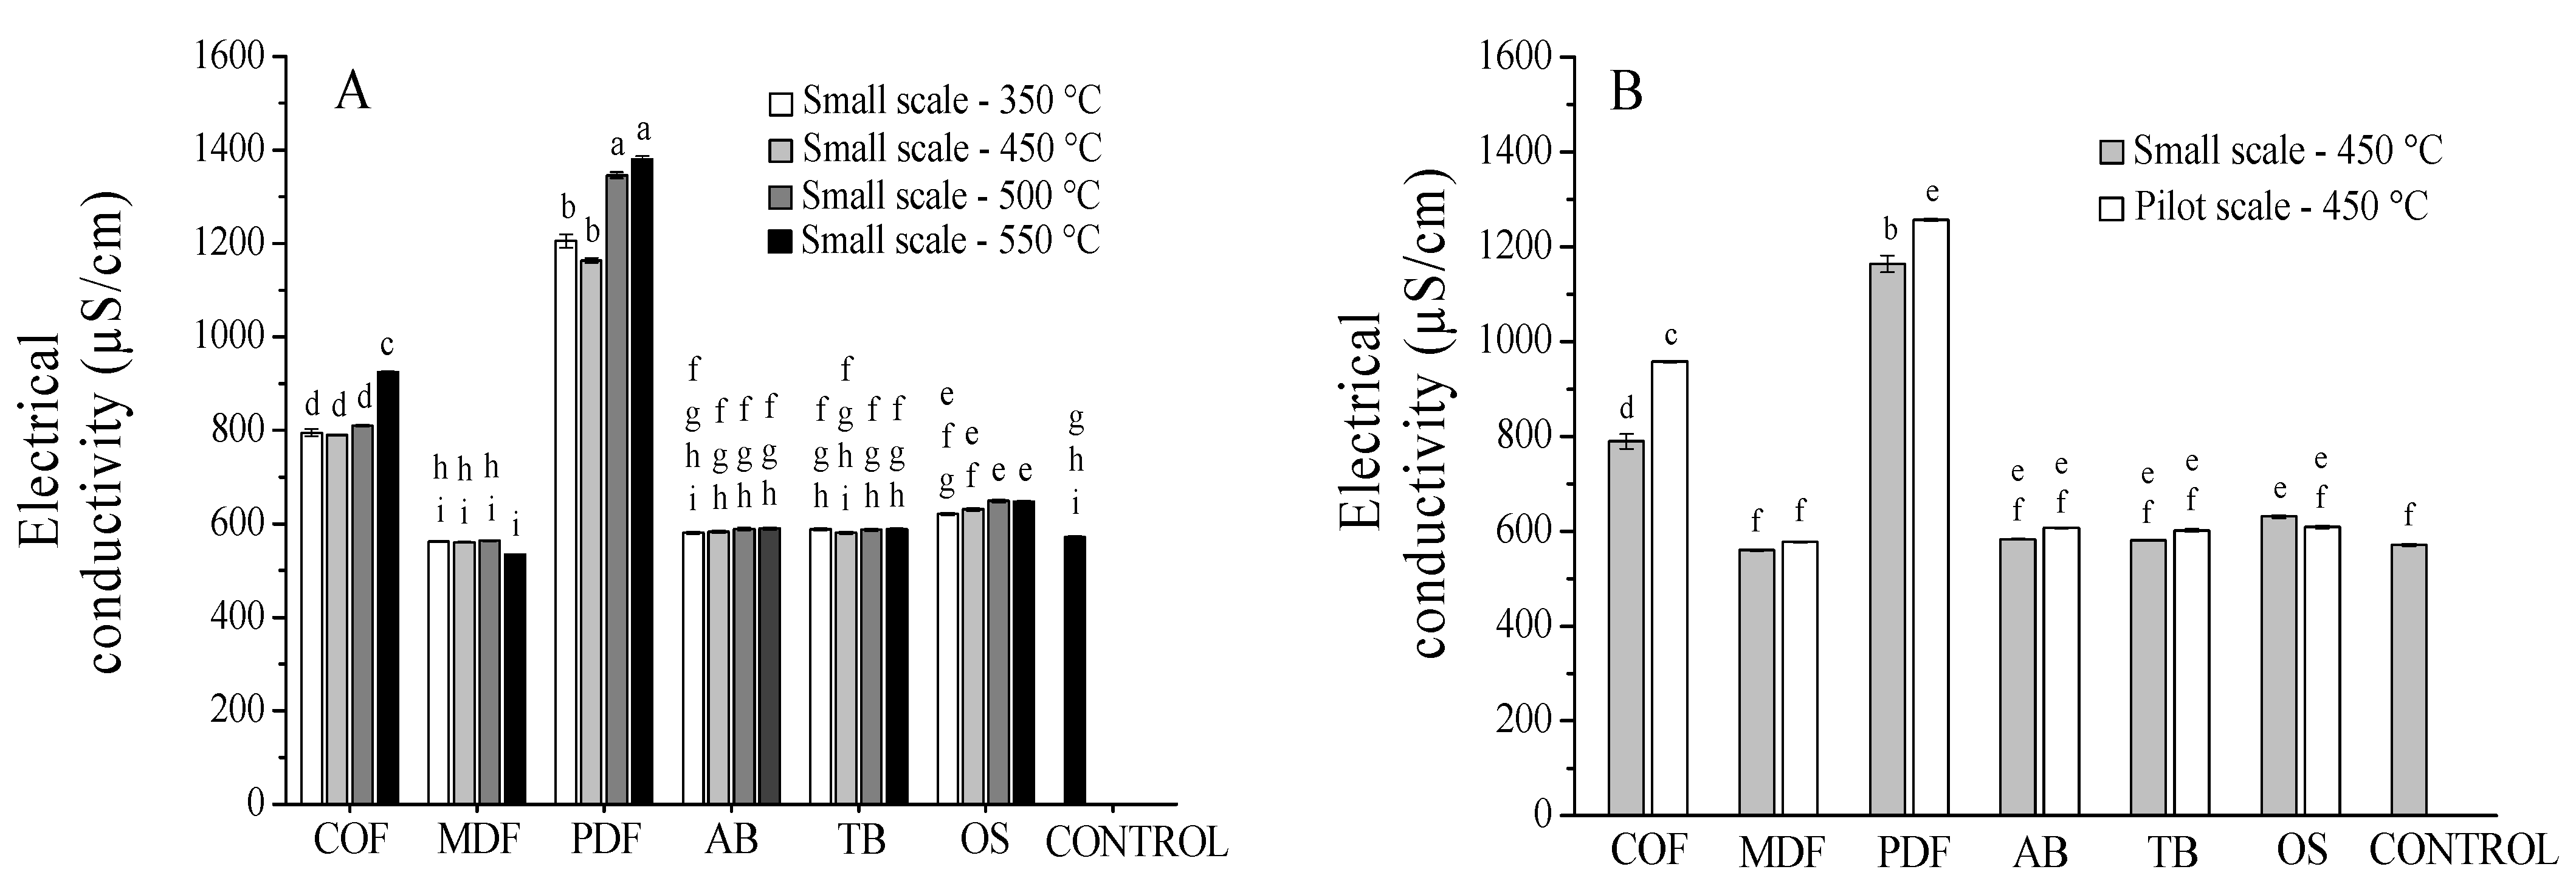
3.2.3. Biochar Salinity

Except for COF and PDF biochar, EC was very comparable for all biochars and the control in OECD standard water, ranging between 580 and 610 µS/cm (Figure 4). Due to the high ash content in COF and PDF biochar, the EC was significantly (p < 0.05) elevated (Table 3). In general, EC tended to increase with increasing pyrolysis temperature; however, this increase was only significant (p < 0.05) in the biochars with the highest ash content (COF and PDF).
The results of the leaching experiments (Figure 3) could also explain the difference in EC between COF and PDF as their ash content was similar. Compared to COF biochar, PDF leached out more inorganic elements after 24 h (Figure 3), explaining its higher EC. However, the difference in EC could also be the result of more Cl leaching: 31.8 g/kg at 450 °C, over 24 h in ultrapure water for PDF biochar compared to 0.6 g/kg for COF biochar. The general increase in EC with rising pyrolysis temperature is in line with the increase in ash content (Table 3). Even though for most analyzed elements, the percentage leached decreased with pyrolysis temperature (Figure 3B,D), the total amount of leached elements increased with pyrolysis temperature due to the increase in ash content (Figure 3A,C). High saline concentrations resulting from element leaching are problematic since they reduce plant water uptake (osmotic effect). Additionally, excessive amounts of salt entering the plant’s transpiration stream damage the plant cells, reducing plant growth and, therefore, plant coverage (ion-excess effect). Major plant processes such as germination, growth, and photosynthesis are all affected [15].

3.3. Influence of Upscaling the Biochar Production

Taking all results into account, biochar production was upscaled using a pyrolysis temperature of 450 °C to further test their performance in green roof substrates. This temperature guaranteed high yield, moderate pH, low ash and high C content, and moderate concentrations of nutrients. Before producing biochar in the pilot-scale reactor, the mean residence time (MRT) of the biochar was determined on the basis of the kiln parameters and the dynamic angle of repose of the biochar [20]. Table 5 shows that the MRT for pyrolysis in the pilot-scale reactor was very similar, between 12.2 and 14.0 min, for all biomasses, while it was considerably longer (30 min) in the lab-scale reactor.
Despite biochar in the lab-scale reactor, biochar yields did not deviate a lot between both reactors (<10%) (Figure 1B) [30]. In fact, only PDF biochar produced in the pilot-scale reactor showed a significant (p < 0.05) difference from PDF produced in the lab-scale reactor at 450 °C, confirming that MRT is not the most influential parameter when it comes to biochar yield [44,50]. C content was usually around 5 wt. % lower in the continuous reactor, while H and O content was usually higher (Table 3). Therefore, biochar from the lab-scale reactor, produced in the described working conditions, was more aromatic and hydrophilic due to a higher degree of carbonization (higher C content) and aromatization (lower H/C ratio). Ash and N content was very comparable between both reactors. The similar ash content was confirmed by the related elemental composition of the biochars produced in the lab-scale and pilot-scale reactor, as can be seen in Table 4. Biochars made from MDF showed the largest difference in ash content between both reactors. These were also the only biochars that showed considerable differences between the detected element concentrations. For biochars with the highest C and lowest ash content (MDF and OS biochar), FC was around 10% lower while VM was around 10% higher, in line with the lower MRT. For all other biochars, VM and FC were comparable between both reactors. As in the lab-scale reactor, heavy metal content in COF (Cu: 195 mg/kg) and AB (Cr: 141 mg/kg, Cu: 161 mg/kg, Pb: 321 mg/kg, and Zn: 315 mg/kg) (Table S3) biochar again exceeded the EBC limits. The pH was only significantly different (p < 0.05) in biochars from both reactors for OS (Figure 2B), which can be attributed to their large difference in carbonization degree. The OS biochar from the pilot-scale reactor was the only biochar for which the H/C ratio was even lower than for the biochar from the lab-scale reactor produced at 350 °C, likely due to its high biomass density (790 kg/m3) combined with a lower residence time in the pilot-scale reactor. The COF and PDF biochars showed a significant (p < 0.05) difference in salinity between both reactors (Figure 4B); however, taking the scale of this parameter into account, it can be concluded that salinity was relatively comparable for all biochars after upscaling. Therefore, the initial biomass’ organic and mineral fraction mainly affects biochar yield, pH and EC, while carbonization degree is more affected by the MRT.
The FTIR data of the biochars (Table S2) again confirmed these observations. Spectra of COF and AB biochars were very similar between both reactors. For MDF biochar, the broad band between 1300 and 1100 cm−1, as well as the shoulder around 1690 cm−1, was more pronounced for char produced at 450 °C in the pilot-scale reactor (MDF450C). Furthermore, the bands associated with aromaticity were weaker, correlating well with H/C ratios from the ultimate analysis (Table 3). For PDF, the band between 3100 and 3500 cm−1, and the bands at 1160 and 1110 cm−1 were stronger for PDF450 from the pilot-scale reactor. A higher degree of aromatization for PDF450 from the lab-scale reactor was supported by stronger band intensities at 3025, 1580, and 675 cm−1. In the case of TB and OS biochars, a more aromatic product was obtained from the lab-scale reactor according to the intensities of diagnostic bands (e.g., 756 cm−1).
For the biochars in the pilot-scale reactor, additional analysis of the 16 EPA PAHs and WHC was performed. The values of the 16 EPA PAHs exceeded class III EBC biochar limits (6 mg/kg) and IBI biochar limits (6 mg/kg) for AB biochar and exceeded class II biochar limits (4 mg/kg) for both COF and PDF biochar [43,51]. There was a clear distinction in PAH concentrations between biochars. This difference can be explained by the fact that PAHs tend to concentrate in the bio-oil as a result of dehydrogenation and gas-phase addition reactions in the biomass. This bio-oil becomes trapped inside the pores of the biochar during production or can be deposited on the biochar surface while cooling [52]. OS and TB biochars showed a smooth surface in SEM images (Figure S3), making it difficult for bio-oil to adsorb on this surface, while PDF, COF, and AB biochars clearly offered more surface for bio-oil to condensate.
Furthermore, AB biochar had the least polar surface of all tested biochars (O/C = 0.10 and H/C = 0.42) and was, therefore, most suited for PAH adsorption. MDF biochar, on the other hand, was more polar (O/C = 0.15, H/C = 0.49) and could, therefore, adsorb fewer PAHs. Next, the WHC of OS was very low compared to other biochars (Table 4), as a result of its very smooth surface as seen in SEM images. The surface of TB was similarly uniform, but porous on the inside, explaining the higher WHC compared to OS. All other biochars showed a high and comparable WHC due to their heterogeneous, fibrous morphological structure.

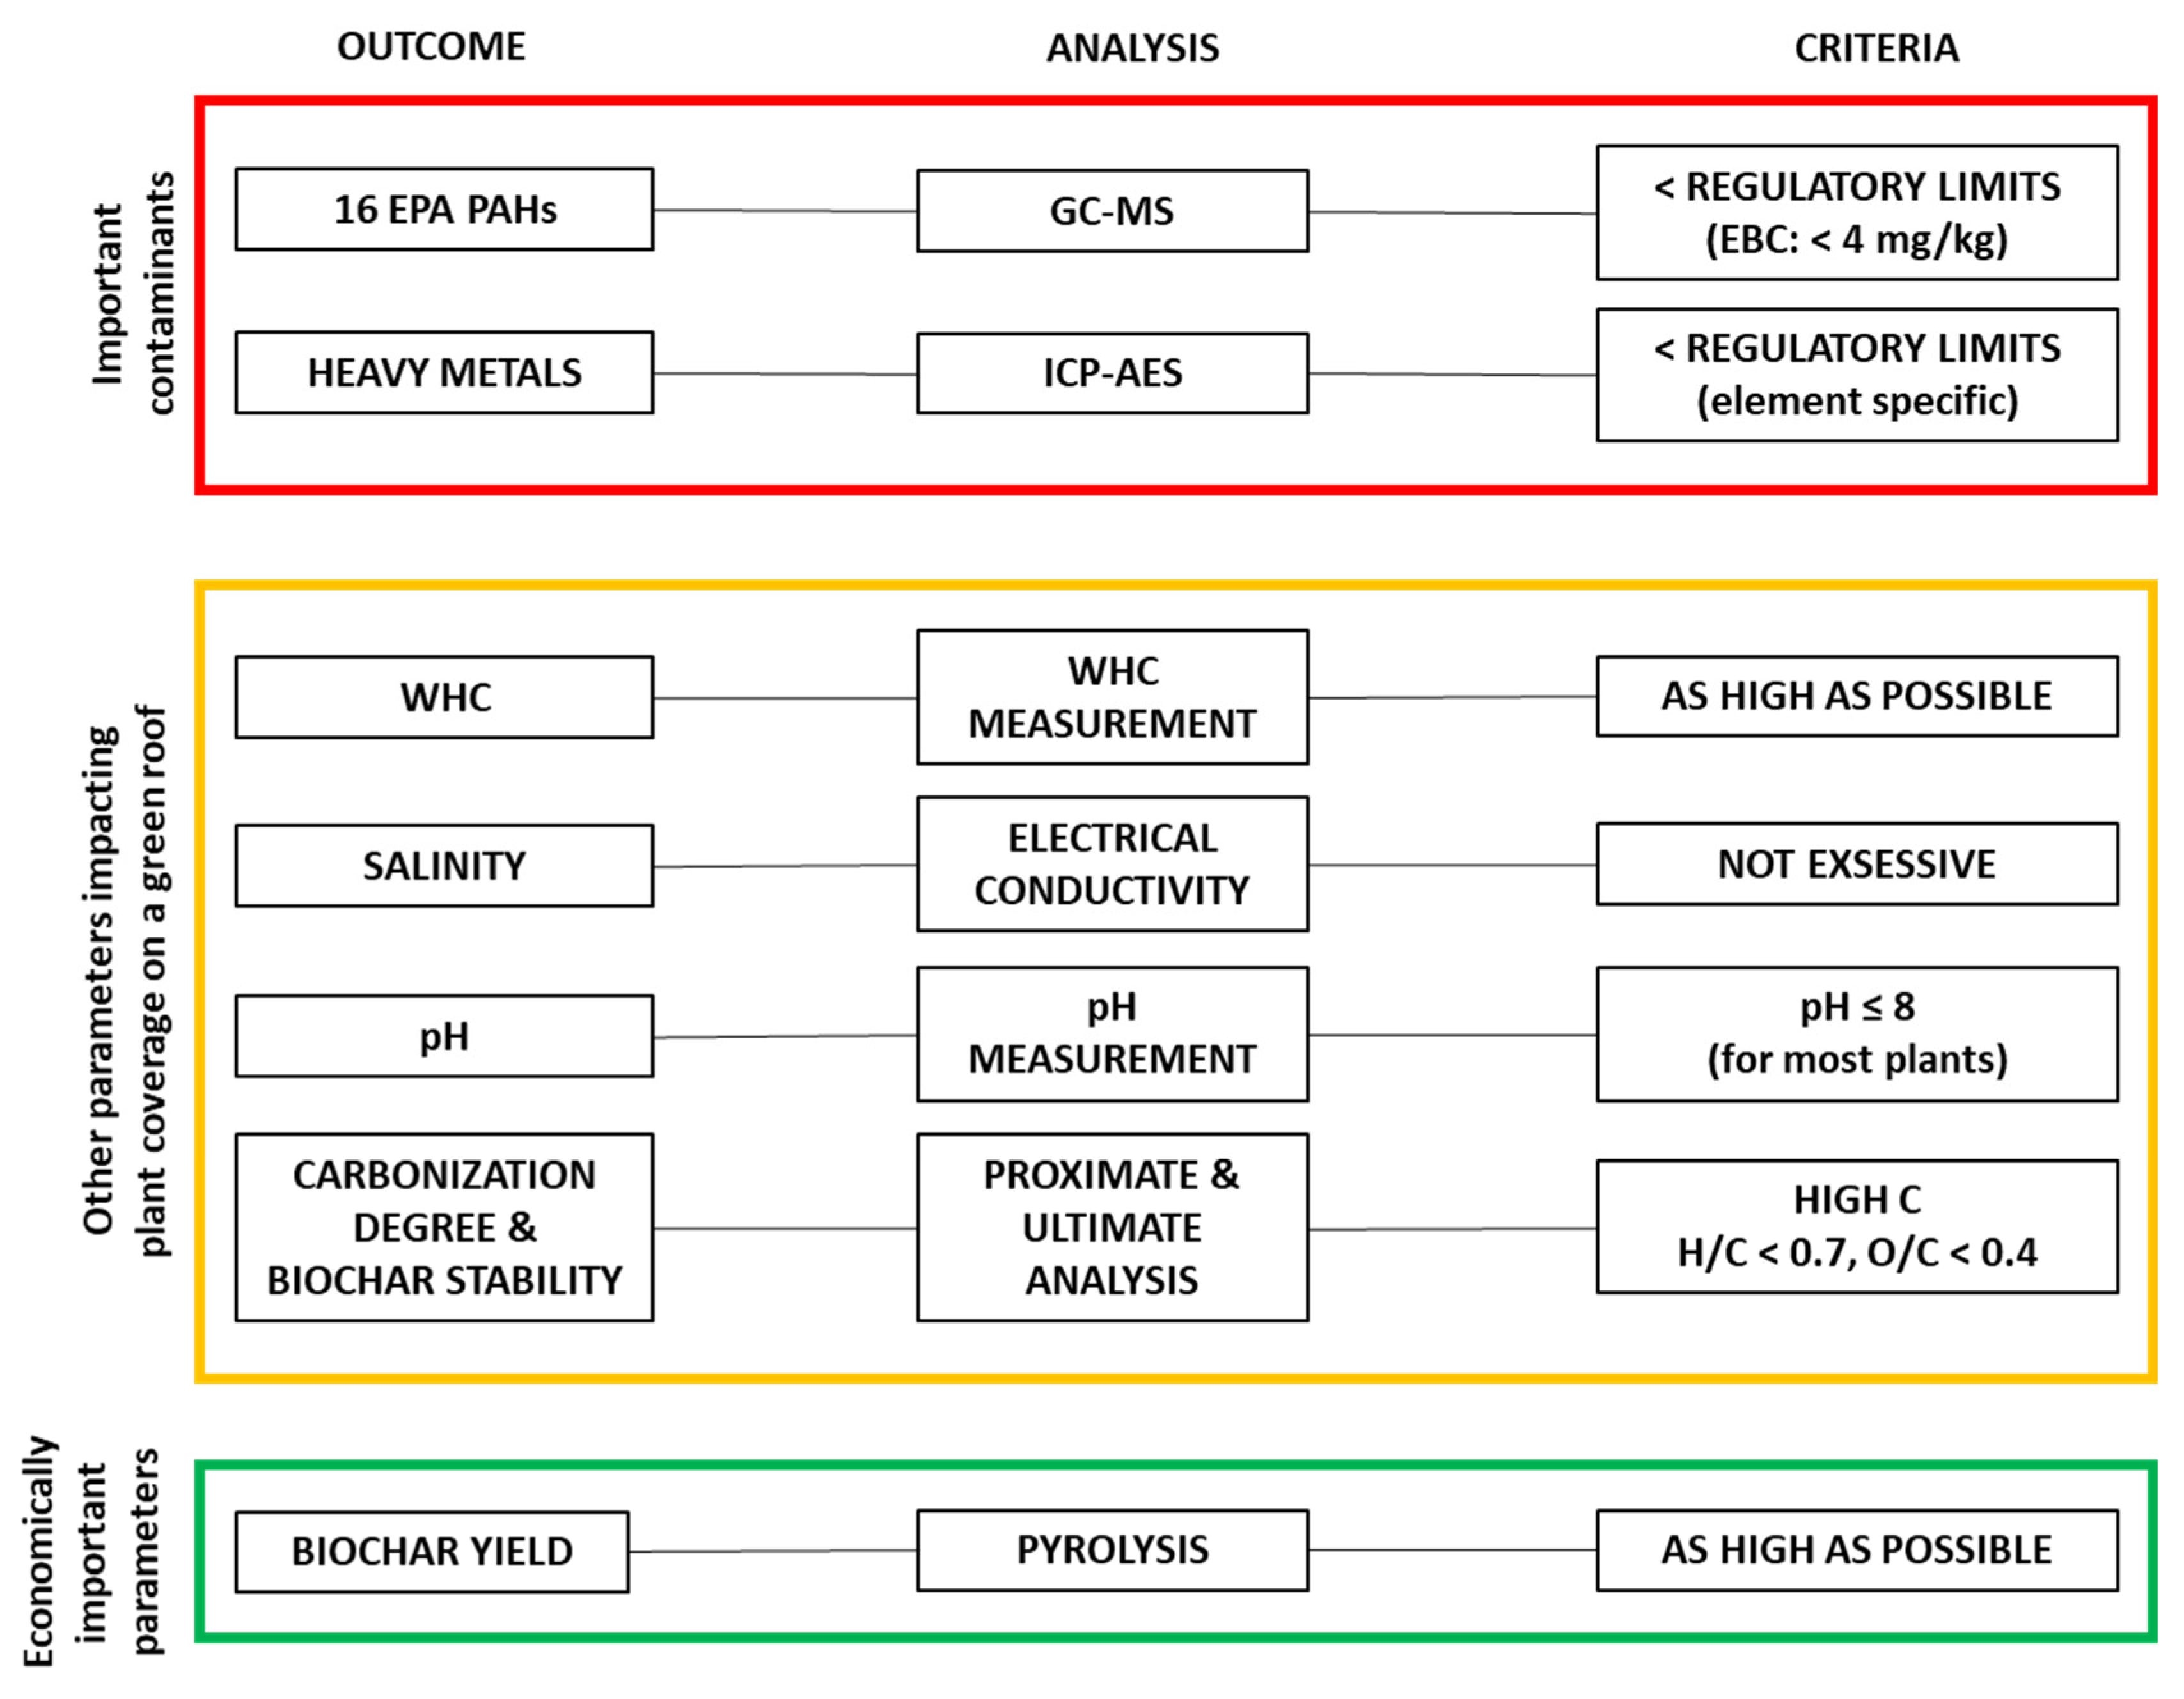
3.4. Selection of the Most Promising Biochar for Plant Coverage on Green Roof Substrates

Combining all described biochar characteristics, a selection procedure can be designed to determine which biomass is optimal for biochar production as an amendment in green roof substrates. In Figure 5, on top, the most important biochar contaminants are listed together with the appropriate analysis method. Both PAHs and heavy metals have to meet regulatory limits if the biochar is to be applied in green roof substrates. The middle section shows additional important biochar characteristics that impact plant coverage on a green roof, including WHC, salinity, pH, carbonization degree, and biochar stability [15,16]. In this section, the only regulated characteristic is the carbonization degree. According to the EBC, O/C has to be below 0.4 and H/C has to be below 0.7 [43]. The limits for all other parameters are more arbitrary and plant-specific, but it is clear that a high WHC and a moderate salinity, pH, and biochar stability are desired in green roof substrates. The bottom section shows parameters that are important to consider for economic reasons, such as biochar yield. If followed from top to bottom, this sequence of analyses allows for the effective use of a certain biochar in green roof substrates.
Applying this protocol to the biochars selected in this study, TB came out on top, followed by MDF, not only because of economic reasons (highest yield) but also because of its low concentrations of contaminants, low ash content, high WHC, moderate EC, moderate pH, high carbon content, and high biochar stability. AB and COF biochars had heavy metal concentrations above the regulatory limits imposed by EBC and can, therefore, not be used as a substrate amendment. Enhanced levels of total PAHs in AB, COF, and PDF (Table 4) made these biochars unsuitable for green roofs. Due to its smooth surface, WHC in OS biochar was too low to provide additional water to plants on a green roof; therefore, this biochar is also not suitable. Lastly, COF and PDF had an excessive pH and salinity and the lowest carbon and FC contents, again making them unfavorable for substrate amendment. From best to worst, the residues can be ranked as TB > MDF > OS > PDF = COF = AB.

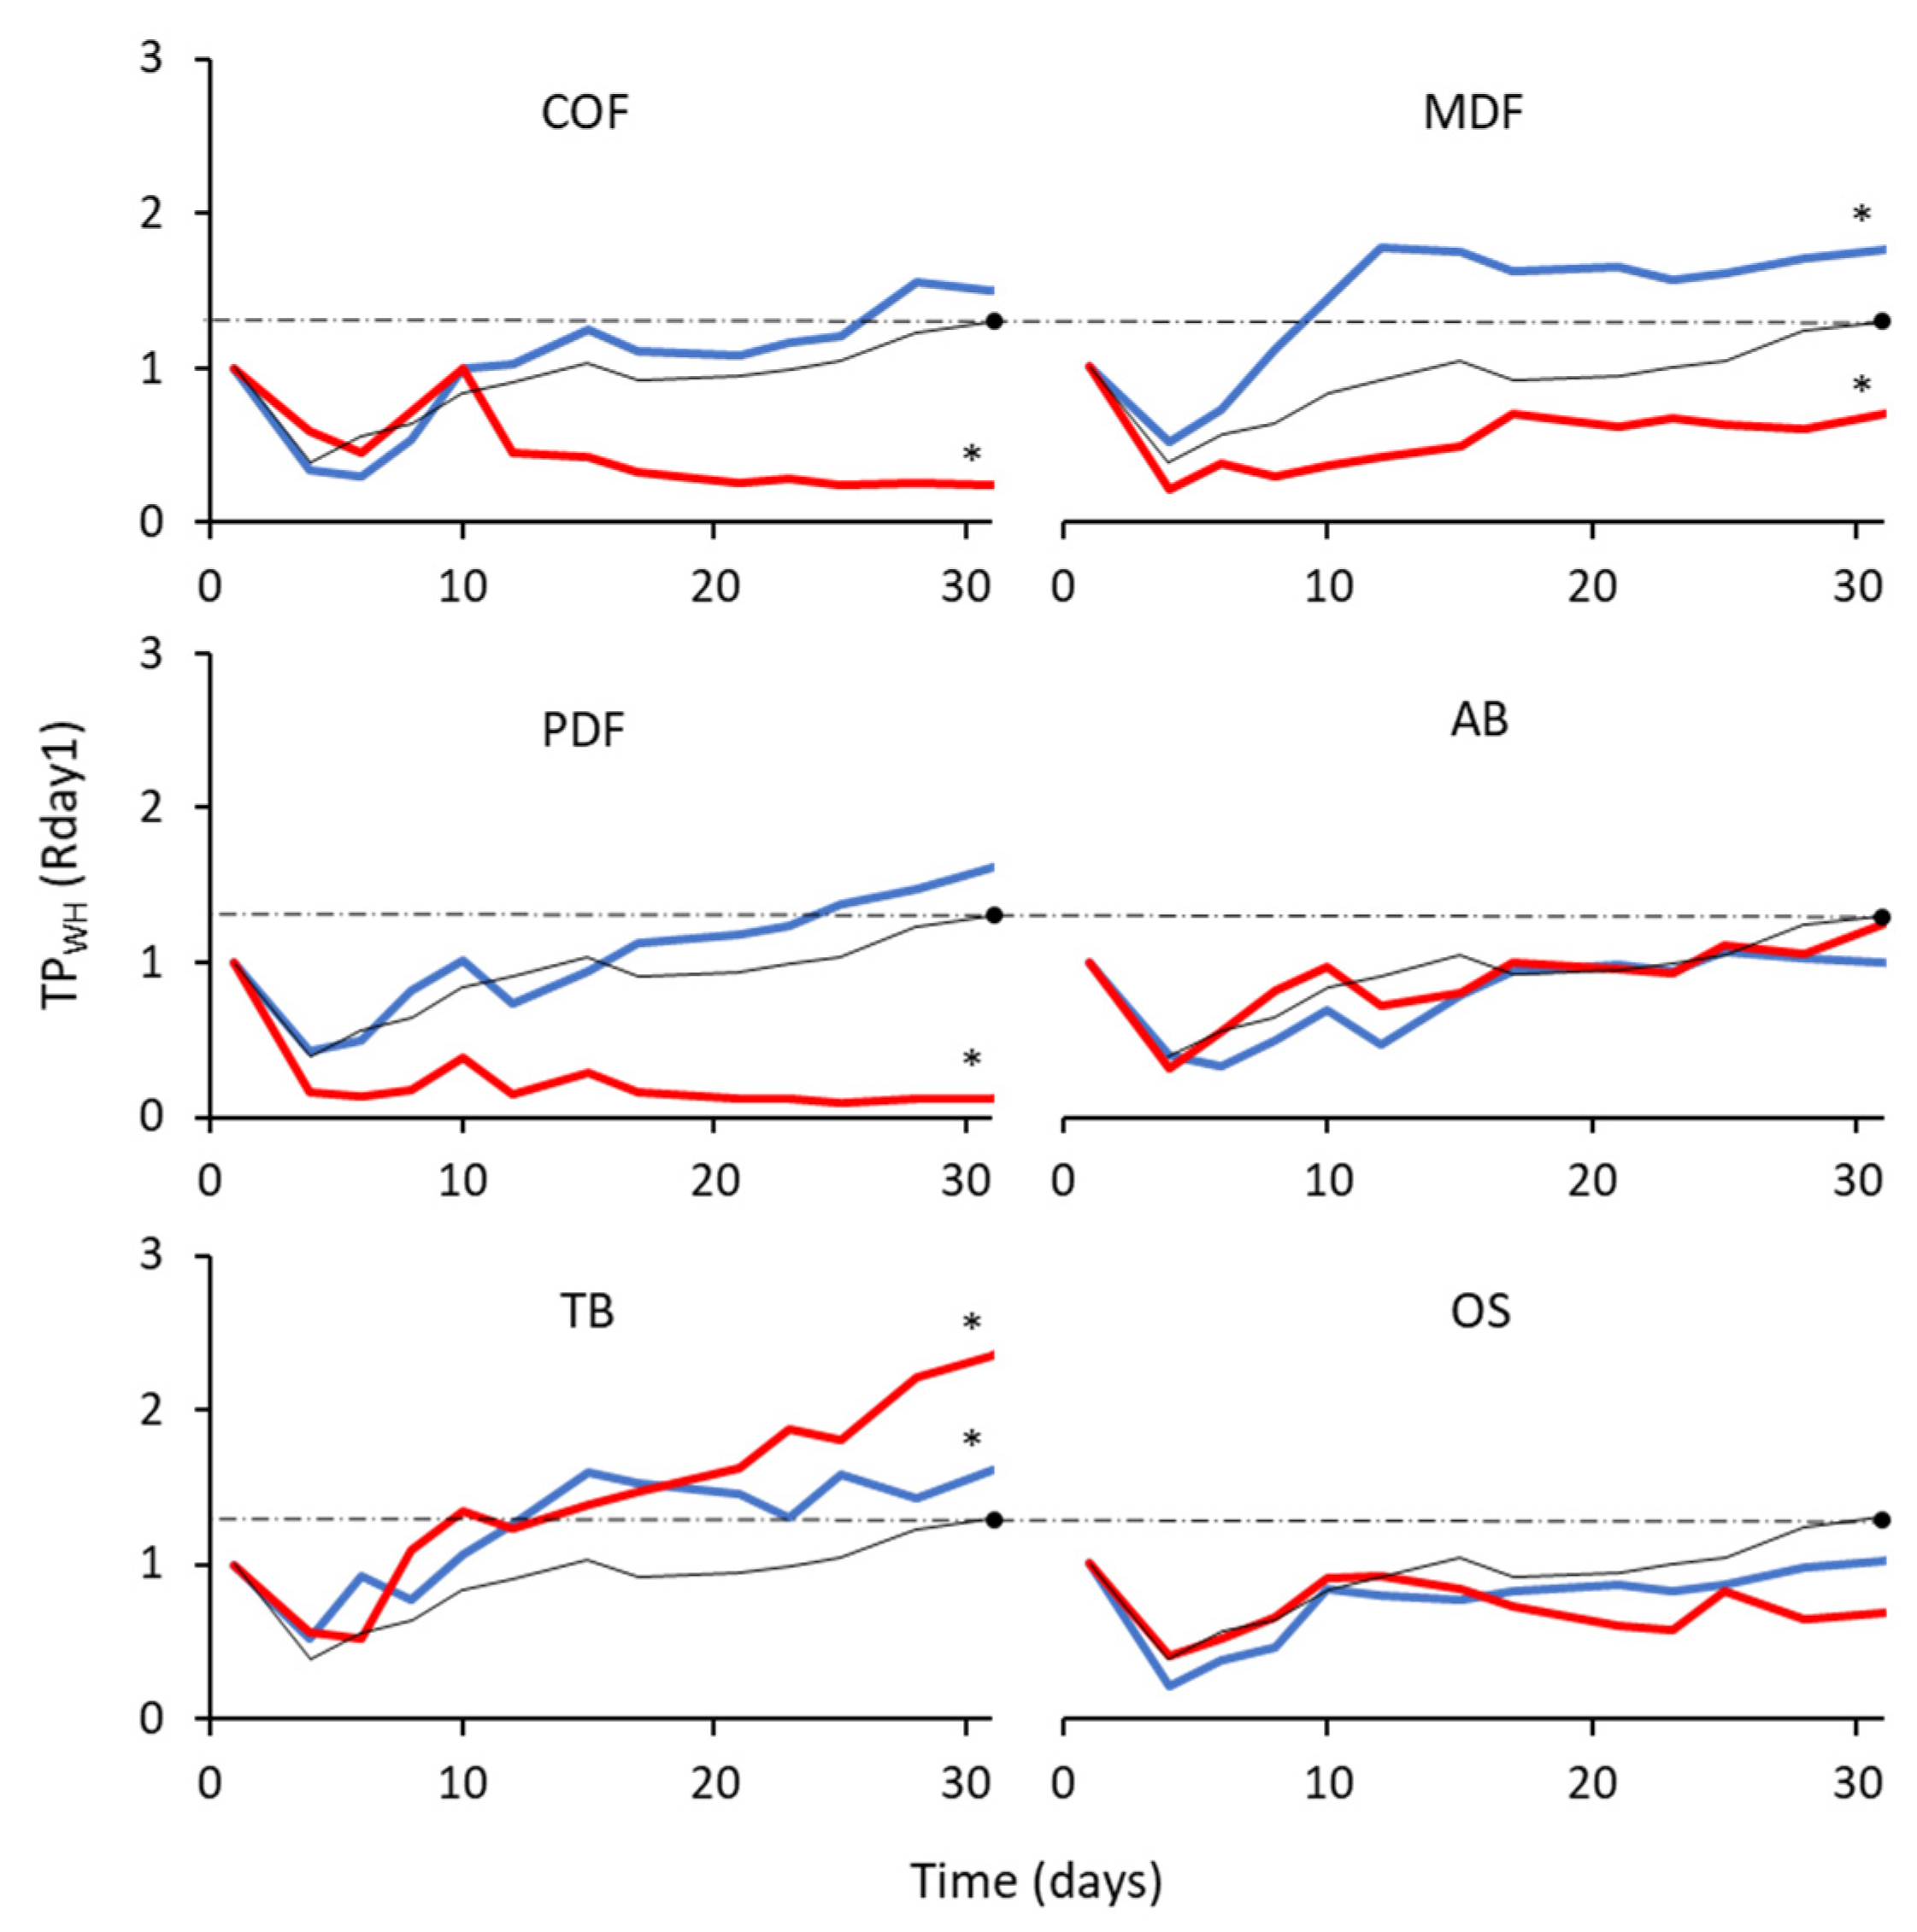
3.5. Confirmation of Analytical Data by Plant Coverage Experiments

In order to strengthen the selection procedure based on physicochemical analyses, a 30 day plant growth experiment was performed on green roof substrates mixed with different biochar percentages (0 (control), 1, and 5 wt.%) and S. hispanicum seedlings. Reliable information on plant coverage was obtained through digital imaging. Figure S2 shows the used segmentation strategy to determine the amount of green in the digital image, a proxy for plant coverage. In Figure S4, the coverage of S. hispanicum on substrate with 5 wt.% of TB biochar is displayed in its original image, green segmentation, and black and white binarization. Considering the quantitative information obtained by the black and white image histograms, plant coverage curves were obtained as shown in Figure 6.
Plant coverage curves of substrates with COF and PDF biochar were very similar. At 1 wt.% of biochar addition, these curves showed no significant difference (p > 0.05) with the control, while, at 5 wt.%, the plant coverage quickly reduced to zero (significant from both 1% biochar addition and the control (p < 0.05)). This suggests an equilibrium between positive (WHC and nutrients) and negative (PAHs, pH, and salinity) effects of the biochar at low application rates, while the negative effects prevailed at higher percentages, making the biochar toxic. A high pH of COF biochar was not beneficial in green roof substrates, but can be interesting for application in acidic soils where it can, among other things, decrease the mobility of heavy metals. Both AB and OS conditions were not significantly different from the control (p > 0.05). For AB, this can again be assigned to a balance between positive and negative effects of the biochar. For OS, there was very little influence of the biochar as it did not change pH, conductivity, WHC, or PAHs to a great extent. The MDF biochar at 1 wt.%, as well as the substrate with 1 and 5 wt.% of TB biochar addition, showed significantly (p < 0.05) more plant coverage than the control substrate as expected from physicochemical analysis. No significant difference in plant coverage was found among these three conditions. MDF at 5 wt.%, however, clearly showed less coverage than 1 wt.% or even the control. This might be explained by the very low density of MDF biochar. Applying 5% of MDF biochar by weight is equal to applying 38% by volume; in contrast, for TB, this was only 20 v/v%. Chen et al. (2018) also described an optimal application rate for biochar in green roof substrates, since higher rates had negative effects on plant growth [6]. When comparing MDF and TB biochar, the N content in the MDF biochar was substantially higher (4.10 wt.%) than in the TB biochar (0.86 wt.%), and the latter was actually low compared to the other biochars (Table 3). Although the maximum coverage when using MDF was reached faster than in TB, the N content in the biochar did not seem to be a limiting factor for plant response in this experiment.
Overall, these plant coverage experiments approached the selection of the best performing biochar and ranking of the biochar from best to worst according to their performance in green roof substrates as follows: TB > MDF > AB > OS > PDF = COF. This ranking is consistent with the ranking based only on physicochemical data (Section 3.4), except for AB. Biochar made from AB was excluded mostly due to its high amount of heavy metals (Cr, Cu, Pb, and Zn), and it did not show an excessive pH or salinity. It was found that these heavy metals do not leach from the biochar in leaching experiments in OECD water over 24 h. Therefore, these elements cannot cause any harmful effects to the growing plants. However, the biochar still cannot be used as it does not meet regulatory requirements.

4. Conclusions

A selection protocol for the use of biochars in green roof substrates was proposed and evaluated using extensive physicochemical analysis of the biochar and plant coverage experiments. A pyrolysis temperature of 450 °C was selected for upscaling and was based on biochar yield, pH, salinity, and elemental composition.
It was found that, with increasing temperature, there was an increasing C (68% for COF and PDF, 88% for MDF, 78% for ABS, 79% for TB, and 88% for OS at 550 °C) and ash content (23% COF, 4% MDF, 25% PDF, 12% ABS, 11% TB, and 4% OS), while pH in water and conductivity increased; there was also a decreasing yield of biochars and decreasing N, H and O content. Upscaling from a lab-scale to a pilot-scale rotary kiln reactor operated with industrially relevant parameters caused a decrease in carbonization degree due to its lower residence time, but other characteristics such as yield, pH and EC were primarily dependent on initial biomass. Applying the developed protocol for the selection of the best-performing biochars to the six produced biochars, we found that some biochars were unsuitable due to an excessive amount of heavy metals, salinity, pH, or PAHs, while others had a low WHC.
In our screening, TB was chosen as the best-performing biochar due to its favorable characteristics as substrate amendment and high yield. Its favorable performance was confirmed in plant coverage experiments with S. hispanicum, which were quantified using a novel digital image processing method, demonstrating its efficient use to facilitate future biochar selection in substrates and underscoring the value and suitability of the protocol designed.

Supplementary Materials

The following supporting information can be downloaded at https://www.mdpi.com/article/10.3390/waste1010013/s1, Figure S1. Schematic representation of the lab-scale reactor and the pilot-scale reactor; Figure S2. Flow diagram for green segmentation strategy; Figure S3. SEM images of biomasses and biochars produced in the pilot-scale reactor; Figure S4. Growth process of Sedum hispanicum approached as surface green coverage on substrate with 5 wt.% biochar for 31 days. Top: original image, middle: image after green segmentation, and bottom: image after black and white binarization; Table S1. Band assignments of FT-IR spectra of the different biomass samples. Results of FT-IR for MDF were previously published; Table S2. Band assignments of FT-IR spectra of the different biochar samples; Table S3. Heavy metal concentrations in all biochars. References [20,34,42,53,54,55,56,57,58,59,60,61] are cited in the supplementary materials.

Author Contributions

Conceptualization, T.H. and K.V.; methodology, T.H. and K.V.; software, J.P.T.; validation, T.H.; formal analysis, T.H. and J.P.T.; investigation, T.H., W.V. and J.P.T.; resources, K.V.; writing—original draft preparation, T.H. and J.P.T.; writing—review and editing, R.C., P.S., D.V., J.Y., A.C. and S.S.; visualization, T.H., J.P.T. and P.S.; supervision, S.S.; project administration, S.S.; funding acquisition, S.S. and K.V. All authors have read and agreed to the published version of the manuscript.

Funding

This work was supported by Vlaams Agentschap Innoveren en Ondernemen (VLAIO) and European Institute of Innovation and Technology (EIT) [BM20160604].

Institutional Review Board Statement

Not applicable.

Informed Consent Statement

Not applicable.

Data Availability Statement

Not available anymore.

Acknowledgments

The authors would like to acknowledge Jan Czech and Linda Boelanders for GC/MS measurements, Martine Vanhamel and Linda Van Buggenhout for FTIR measurements, and Elsy Thijsen and Greet Cuyvers for ICP-AES measurements.

Conflicts of Interest

The authors declare no conflict of interest.

References

  1. Mohajerani, A.; Bakaric, J.; Jeffrey-Bailey, T. The urban heat island effect, its causes, and mitigation, with reference to the thermal properties of asphalt concrete. J. Environ. Manag. 2017, 197, 522–538. [Google Scholar] [CrossRef] [PubMed]
  2. Prosdocimi, I.; Kjeldsen, R.; Miller, J.D. Detection and attribution of urbanization effect on flood extremes using nonstationary flood-frequency models. Water Resour. Res. 2015, 51, 4244–4262. [Google Scholar] [CrossRef] [PubMed] [Green Version]
  3. Kuoppamäki, K.; Lehvävirta, S. Mitigating nutrient leaching from green roofs with biochar. Landsc. Urban Plan. 2016, 152, 39–48. [Google Scholar] [CrossRef]
  4. Bremner, T.W.; Ries, J.P.; Wolfe, W.H. Achieving sustainability with lightweight aggregates. In Proceedings of the International Conference: Sustainable Construction Materials and Technologies, 11–13 June 2007 Coventry; Kraus, R.N., Naik, T.R., Claisse, P., Sadeghi-Pouya, Eds.; Special Papers Proceedings; Pub. UW Milwaukee CBU: Milwaukee, WI, USA, 2007; pp. 13–17. [Google Scholar]
  5. Cao, C.T.N.; Farrell, C.; Kristiansen, P.E.; Rayner, J.P. Biochar makes green roof substrates lighter and improves water supply to plants. Ecol. Eng. 2014, 71, 368–374. [Google Scholar] [CrossRef]
  6. Chen, H.; Ma, J.; Wei, J.; Gong, X.; Yu, X.; Guo, H.; Zhao, Y. Biochar increases plant growth and alters microbial communities via regulating the moisture and temperature of green roof substrates. Sci. Total Environ. 2018, 635, 333–342. [Google Scholar] [CrossRef]
  7. Kuoppamäki, K.; Hagner, M.; Lehvävirta, S.; Setälä, H. Biochar amendment in the green roof substrate affects runoff quality and quantity. Ecol. Eng. 2016, 88, 1–9. [Google Scholar] [CrossRef]
  8. Lehmann, J.; Joseph, S. (Eds.) Biochar for Environmental Management: Science and Technology and Implementation; Routledge: London, UK, 2015. [Google Scholar]
  9. Sri Shalini, S.; Palanivelu, K.; Ramachandran, A.; Raghavan, V. Biochar from biomass waste as a renewable carbon material for climate change mitigation in reducing greenhouse gas emissions—A review. Biomass Convers. Biorefinery 2021, 11, 2247–2267. [Google Scholar] [CrossRef] [Green Version]
  10. Ippolito, J.A.; Laird, D.A.; Busscher, W.J. Environmental benefits of biochar. J. Environ. Qual. 2012, 41, 967–972. [Google Scholar] [CrossRef] [Green Version]
  11. Spokas, K.A.; Cantrell, K.B.; Novak, J.M.; Archer, D.W.; Ippolito, J.A.; Collins, H.P.; Boateng, A.A.; Lima, I.M.; Lamb, M.C.; McAloon, A.J.; et al. Biochar: A synthesis of its agronomic impact beyond carbon sequestration. J. Environ. Qual. 2012, 41, 973–989. [Google Scholar] [CrossRef] [Green Version]
  12. Schimmelpfennig, S.; Glaser, B. One step forward toward characterization: Some important material properties to distinguish biochars. J. Environ. Qual. 2012, 41, 1001–1013. [Google Scholar] [CrossRef]
  13. Wang, C.; Wang, Y.; Herath, H.M.S.K. Polycyclic Aromatic Hydrocarbons (PAHs) in biochar—Their formation, occurrence and analysis: A review. Org. Geochem. 2017, 114, 1–11. [Google Scholar] [CrossRef]
  14. El-Naggar, A.; El-Naggar, A.H.; Shaheen, S.M.; Sarkar, B.; Chang, S.X.; Tsang, D.C.W.; Rinklebe, J.; Ok, Y.S. Biochar composition-dependent impacts on soil nutrient release, carbon mineralization, and potential environmental risk: A review. J. Environ. Manag. 2019, 241, 458–467. [Google Scholar] [CrossRef] [PubMed]
  15. Parihar, P.; Singh, S.; Singh, R.; Singh, V.P.; Prasad, S.M. Effect of salinity stress on plants and its tolerance strategies: A review. Environ. Sci. Pollut. Res. 2015, 22, 4056–4075. [Google Scholar] [CrossRef] [PubMed]
  16. Li, S.; Harris, S.; Anandhi, A.; Chen, G. Predicting biochar properties and functions based on feedstock and pyrolysis temperature: A review and data syntheses. J. Clean. Prod. 2019, 215, 890–902. [Google Scholar] [CrossRef]
  17. Luckett, K. Green Roof Construction and Maintenance; McGraw-Hill: New York, NY, USA, 2009. [Google Scholar]
  18. Guijarro, M.; Pajares, G.; Riomoros, I.; Herrera, P.J.; Burgos-Artizzu, X.P.; Ribeiro, A. Automatic segmentation of relevant textures in agricultural images. Comput. Electron. Agric. 2011, 75, 75–83. [Google Scholar] [CrossRef] [Green Version]
  19. Vanreppelen, K.; Vanderheyden, S.; Kuppens, T.; Schreurs, S.; Yperman, J.; Carleer, R. Activated carbon from pyrolysis of brewer spend grain: Production and adsorption properties. Waste Manag. Res. 2014, 32, 634–645. [Google Scholar] [CrossRef]
  20. Haeldermans, T.; Lataf, M.A.; Vanroelen, G.; Samyn, P.; Vandamme, D.; Cuypers, A.; Vanreppelen, K.; Schreurs, S. Numerical prediction of the mean residence time of solid materials in a pilot-scale rotary kiln. Powder Technol. 2019, 354, 392–401. [Google Scholar] [CrossRef]
  21. Boateng, A.A. Rotary Kilns-Transport Phenomena and Transport Processes; Elsevier: Amsterdam, The Netherlands, 2008. [Google Scholar]
  22. Vijayan, S.N.; Sendhilkumar, S. Industrial applications of rotary kiln in various sectors—A review. Int. J. Eng. Innov. Res. 2014, 3, 342–345. [Google Scholar]
  23. Faithfull, N.T. Methods in Agricultural Chemical Analysis; CABI Publishing: Oxfordshire, UK, 2002. [Google Scholar]
  24. Smets, K.; Adriaensens, P.; Reggers, G.; Schreurs, S.; Carleer, R.; Yperman, J. Flash pyrolysis of rapeseed cake: Influence of temperature on the yield and the characteristics of the pyrolysis liquid. J. Anal. Appl. Pyrolysis 2011, 90, 118–125. [Google Scholar] [CrossRef]
  25. Stals, M.; Thijssen, E.; Vangronsveld, J.; Carleer, R.; Schreurs, S.; Yperman, J. Flash pyrolysis of heavy metal contaminated biomass from phytoremediation: Influence of temperature, entrained flow and wood/leaves blended pyrolysis on the behaviour of heavy metals. J. Anal. Appl. Pyrolysis 2010, 87, 1–7. [Google Scholar] [CrossRef]
  26. Hale, S.E.; Lehmann, J.; Rutherford, D.; Zimmerman, A.R.; Bachmann, R.T.; Shitumbanuma, V.; Toole, A.O.; Sundqvist, K.L.; Arp, H.P.H.; Cornelissen, G. Quantifying the total and bioavailable polycyclic aromatic hydrocarbons and dioxins in biochars. Environ. Sci. Technol. 2012, 46, 2830–2838. [Google Scholar] [CrossRef]
  27. Keiluweit, M.; Kleber, M.; Sparrow, M.A.; Simoneit, B.R.T.; Prahl, F.G. Solvent-extractable polycyclic aromatic hydrocarbons in biochar: Influence of pyrolysis temperature and feedstock. Environ. Sci. Technol. 2012, 46, 9333–9341. [Google Scholar] [CrossRef]
  28. Burgos-Artizzu, X.P.; Ribeiro, A.; Guijarro, M.; Pajares, G. Real-time image processing for crop/weed discrimination in maize fields. Comput. Electron. Agric. 2011, 75, 337–346. [Google Scholar] [CrossRef] [Green Version]
  29. Sun, X.; Shan, R.; Li, X.; Pan, J.; Liu, X.; Deng, R.; Song, J. Characterization of 60 types of Chinese biomass waste and resultant biochars in terms of their candidacy for soil application. GCB Bioenergy 2017, 9, 1423–1435. [Google Scholar] [CrossRef]
  30. Haeldermans, T.; Campion, L.; Kuppens, T.; Vanreppelen, K.; Cuypers, A.; Schreurs, S. A comparative techno-economic assessment of biochar production from different residue streams using conventional and microwave pyrolysis. Bioresour. Technol. 2020, 318, 124083. [Google Scholar] [CrossRef] [PubMed]
  31. Veiga, T.R.L.A.; Lima, J.T.; Lima de Abreu Dessimoni, A.; Pego, M.F.F.; Soares, J.R.; Trugilho, P.F. Different Plant Biomass Characterizations for Biochar Production. Cerne 2017, 23, 529–536. [Google Scholar] [CrossRef] [Green Version]
  32. Nasser, R.A.; Salem, M.Z.M.; Hiziroglu, S.; Al-Mefarrej, H.A.; Mohareb, A.S.; Alam, M.; Aref, I.M. Chemical analysis of different parts of date palm (Phoenix dactylifera L.) using ultimate, proximate and thermo-gravimetric techniques for energy production. Energies 2016, 9, 374. [Google Scholar] [CrossRef] [Green Version]
  33. Adapa, P.K.; Karunakaran, C.; Tabil, L.G.; Schoenau, G.J. Qualitative and quantitative analysis of lignocellulosic biomass using infrared spectroscopy. In Proceedings of the CSBE/SCGAB 2009 Annual Conference, Winnipeg, MB, USA, 6–10 August 2009. [Google Scholar]
  34. Galvàn-Ruiz, M.; Hernàndez, J.; Baños, L.; Noriega-Montes, J.; Rodriguez-Garcia, M.E. Characterization of calcium carbonate, calcium oxide, and calcium hydroxide as starting point to the improvement of lime for their use in construction. J. Mater. Civ. Eng. 2009, 21, 694–698. [Google Scholar] [CrossRef]
  35. Tang, Y.; Alam, M.S.; Konhauser, K.O.; Alessi, D.S.; Xu, S.; Tian, W.J.; Liu, Y. Influence of pyrolysis temperature on production of digested sludge biochar and its application for ammonium removal from municipal wastewater. J. Clean. Prod. 2019, 209, 927–936. [Google Scholar] [CrossRef]
  36. Uzun, B.B.; Pütün, A.E.; Pütün, E. Composition of products obtained via fast pyrolysis of olive-oil residue: Effect of pyrolysis temperature. J. Anal. Appl. Pyrolysis 2007, 79, 147–153. [Google Scholar] [CrossRef]
  37. Jiang, L.; Hu, S.; Sun, L.S.; Su, S.; Xu, K.; He, L.M.; Xiang, J. Influence of different demineralization treatments on physicochemical structure and thermal degradation of biomass. Bioresour. Technol. 2013, 146, 254–260. [Google Scholar] [CrossRef]
  38. Rodriguez Correa, C.; Hehr, T.; Voglhuber-Slavinsky, A.; Rauscher, Y.; Kruse, A. Pyrolysis vs. hydrothermal carbonization: Understanding the effect of biomass structural components and inorganic compounds on the char properties. J. Anal. Appl. Pyrolysis 2019, 140, 137–147. [Google Scholar] [CrossRef]
  39. Usevičiūtė, L.; Baltrėnaitė-Gedienė, E. Dependence of pyrolysis temperature and lignocellulosic physical-chemical properties of biochar on its wettability. Biomass Convers. Biorefinery 2020, 11, 2775–2793. [Google Scholar] [CrossRef]
  40. Yuan, J.-H.; Xu, R.-K.; Zhang, H. The forms of alkalis in the biochar produced from crop residues at different temperatures. Bioresour. Technol. 2011, 102, 3488–3497. [Google Scholar] [CrossRef] [PubMed]
  41. Naeem, M.A.; Khalid, M.; Ahmad, Z.; Naveed, M. Low pyrolysis temperature biochar improves growth and nutrient availability of maize on typic calciargid. Commun. Soil Sci. Plant Anal. 2016, 47, 41–51. [Google Scholar] [CrossRef]
  42. Haeldermans, T.; Claesen, J.; Maggen, J.; Carleer, R.; Yperman, J.; Adriaensens, P.; Samyn, P.; Vandamme, D.; Cuypers, A.; Vanreppelen, K.; et al. Microwave assisted and conventional pyrolysis of MDF—Characterization of the produced biochars. J. Anal. Appl. Pyrolysis 2019, 138, 218–230. [Google Scholar] [CrossRef]
  43. European Biochar Certificate (EBC). Guidelines for a Sustainable Production of Biochar; European Biochar Certificate (EBC): Arbaz, Switzerland, 2020. [Google Scholar] [CrossRef]
  44. Ronsse, F.; van Hecke, S.; Dickinson, D.; Prins, W. Production and characterization of slow pyrolysis biochar: Influence of feedstock type and pyrolysis conditions. GCB Bioenergy 2013, 5, 104–115. [Google Scholar] [CrossRef]
  45. Dieguez-Alonso, A.; Anca-Couce, A.; Zobel, N.; Behrendt, F. Understanding the primary and secondary slow pyrolysis mechanisms of holocellulose, lignin and wood with laser-induced fluorescence. Fuel 2015, 153, 102–109. [Google Scholar] [CrossRef]
  46. Fornes, F.; Belda, R.M.; Lidón, A. Analysis of two biochars and one hydrochar from different feedstock: Focus set on environmental, nutritional and horticultural considerations. J. Clean. Prod. 2015, 86, 40–48. [Google Scholar] [CrossRef]
  47. Fornes, F.; Belda, R.M. Biochar versus hydrochar as growth media constituents for ornamental plant cultivation. Sci. Agric. 2018, 75, 304–312. [Google Scholar] [CrossRef]
  48. Mierzwa-Hersztek, M.; Gondek, K.; Jewiarz, M.; Dziedzic, K. Assessment of energy parameters of biomass and biochars, leachability of heavy metals and phytotoxicity of their ashes. J. Mater. Cycles Waste Manag. 2019, 21, 786–800. [Google Scholar] [CrossRef]
  49. Zheng, Y.; Clark, M.J. Optimal growing substrate pH for five sedum species. HortScience 2013, 48, 448–452. [Google Scholar] [CrossRef] [Green Version]
  50. Zhang, J.; Liu, J.; Liu, R. Effects of pyrolysis temperature and heating time on biochar obtained from the pyrolysis of straw and lignosulfonate. Bioresour. Technol. 2015, 176, 288–291. [Google Scholar] [CrossRef]
  51. International Biochar Initiative. Standardized Product Definition and Product Testing Guidelines for Biochar That Is Used in Soil; International Biochar Initiative: Washington, DC, USA, 2015. [Google Scholar]
  52. Dutta, T.; Kwon, E.; Bhattacharya, S.S.; Jeon, B.H.; Deep, A.; Uchimiya, M.; Kim, K.H. Polycyclic aromatic hydrocarbons and volatile organic compounds in biochar and biochar-amended soil: A review. GCB Bioenergy 2017, 9, 990–1004. [Google Scholar] [CrossRef]
  53. Xu, F.; Yu, J.; Tesso, T.; Dowell, F.; Wang, D. Qualitative and quantitative analysis of lignocellulosic biomass using infrared techniques: A mini-review. Appl. Energy 2013, 104, 801–809. [Google Scholar] [CrossRef] [Green Version]
  54. Acquah, G.E.; Via, B.K.; Fasina, O.O.; Eckhardt, L.G. Rapid Quantitative Analysis of Forest Biomass Using Fourier Transform Infrared Spectroscopy and Partial Least Squares Regression. J. Anal. Methods Chem. 2016, 2016, 1–11. [Google Scholar] [CrossRef] [PubMed] [Green Version]
  55. Müller, G.; Bartholme, M.; Kharazipour, A.; Polle, A. FTIR-ATR spectroscopic analysis of changes in fiber properties during insulating fiberboard manufacture of Beech Wood. Wood Fiber Sci. 2008, 40, 532–543. [Google Scholar]
  56. Lyman, D.J.; Benck, R.; Dell, S.; Merle, S.; Murray-Wijelath, J. FTIR-ATR analysis of brewed coffee: Effect of roasting conditions. J. Agric. Food Chem. 2003, 51, 3268–3272. [Google Scholar] [CrossRef]
  57. Lao, W.; Li, G.; Zhou, Q.; Qin, T. Quantitative analysis of biomass in three types of wood-plastic composites by FTIR spectroscopy. BioResources 2014, 9, 6073–6086. [Google Scholar] [CrossRef] [Green Version]
  58. Liu, Y.; He, Z.; Uchimiya, M. Comparison of Biochar Formation from Various Agricultural By-Products Using FTIR Spectroscopy. Mod. Appl. Sci. 2015, 9, 246–253. [Google Scholar] [CrossRef] [Green Version]
  59. Zhao, L.; Cao, X.; Mašek, O.; Zimmerman, A. 2013 Heterogeneity of biochar properties as a function of feedstock sources and production temperatures. J. Hazard. Mater. 2013, 256, 1–9. [Google Scholar] [CrossRef] [PubMed]
  60. Molenda, J.; Swat, M.; Osuch-Słomka, E. Effect of Thermal Conditions of Pyrolysis Process on the Quality of Biochar Obtained from Vegetable Waste. Eng. Prot. Environ. 2018, 21, 289–302. [Google Scholar] [CrossRef]
  61. Dai, L.; Tan, F.; Li, H.; Zhu, N.; He, M.; Zhu, Q.; Hu, G.; Wang, L.; Zhao, J. Calcium-rich biochar from the pyrolysis of crab shell for phosphorus removal. J. Environ. Manag. 2017, 198, 70–74. [Google Scholar] [CrossRef] [PubMed]
Figure 1. Biochar yield in function of the pyrolysis temperature (A), and comparison between lab-scale and pilot-scale reactor (T = 450 °C) (B) [30]. Means with different letters indicate a statistically significant difference (Tukey’s HSD, p < 0.05). COF = coffee husks, MDF = medium-density fiberboard, PDF = palm date fronds, AB = AB wood waste, TB = tree bark, and OS = olive stones. The lowercase letters above the columns are presented to compare different columns to each other. Columns with the same letter are not statistically different from each other, while columns with differing letters are statistically different from each other.
Waste 01 00013 g001
Figure 2. Influence of pyrolysis temperature (A) and upscaling (B) on the pH of biochar submerged in “Organization for Economic Cooperation and Development” (OECD) standard water. Means with different letters indicate statistically significant difference (Tukey’s HSD, p < 0.05). COF = coffee husks, MDF = medium-density fiberboard, PDF = palm date fronds, AB = AB wood waste, TB = tree bark, OS = olive stones, and control = OECD standard water. The lowercase letters above the columns are presented to compare different columns to each other. Columns with the same letter are not statistically different from each other, while columns with differing letters are statistically different from each other.
Waste 01 00013 g002
Figure 3. Leached concentration and % leached (leached concentration/total concentration × 100) of elements out of COF (A,B) and PDF (C,D) biochar produced at different pyrolysis temperatures in the lab-scale reactor after 24 h in milli-q water. COF = coffee husks and PDF = palm date fronds.
Waste 01 00013 g003
Figure 4. Influence of pyrolysis temperature (A) and upscaling (B) on the EC of biochar submerged in “Organization for Economic Cooperation and Development” (OECD) standard water. Means with different letters indicate statistically significant difference (Tukey’s HSD, p < 0.05). COF = coffee husks, MDF = medium-density fiberboard, PDF = palm date fronds, AB = AB wood waste, TB = tree bark, OS = olive stones, and control = OECD standard water. The lowercase letters above the columns are presented to compare different columns to each other. Columns with the same letter are not statistically different from each other, while columns with differing letters are statistically different from each other.
Waste 01 00013 g004
Figure 5. Selection procedure for the best performing biochar as amendment in green roof substrate. COF = coffee husks, MDF = medium-density fiberboard, PDF = palm date fronds, AB = AB wood waste, TB = tree bark, and OS = olive stones.
Waste 01 00013 g005
Figure 6. Surface coverage of Sedum hispanicum plants on green roof substrates with different biochars (T = 450 °C) in different application ratios (1 wt.% = blue, 5 wt.% = red, control = black, and endpoint of control = dashed black) over a period of 30 days. An asterisk (*) indicates a statistically significant difference from the control (p < 0.05). COF = coffee husks, MDF = medium-density fiberboard, PDF = palm date fronds, AB = AB wood waste, TB = tree bark, and OS = olive stones.
Waste 01 00013 g006
Table 1. Pyrolysis parameters of the lab-scale and pilot-scale reactor. * Rotation of the screw in the lab-scale reactor and rotation of the kiln in the pilot-scale reactor.
Pyrolysis ParameterLab-Scale ReactorPilot-Scale Reactor
Heating rate15 °C/minConstant at 450 °C
Pyrolysis temperature (°C)350, 450, 500, 550450
Residence time at
pyrolysis temperature (min)
3012–14
Active reactor length (mm)2001000
Reactor diameter (mm)4595
Rotation speed * (rpm)510
Incline angle (°)02
Input40 g/batchMaterial-dependent
Table 2. Physicochemical characteristics of the biomass streams. EtOH ex. = ethanol extractables, Undet. = undetermined, N.D. = not detected. Error on proximate analysis was assumed to be 10%.
SampleHemi-CelluloseCelluloseLigninEtOH ex.Undet.AlCaFeKMgNaP
Biomasswt.%wt.%wt.%wt.%wt.%mg/kgmg/kgmg/kgmg/kgmg/kgmg/kgmg/kg
COF3.23 ± 0.0538.08 ± 1.6217.30 ± 0.648.49 ± 0.1323.00 ± 2.98390 ± 1412,416 ± 313704 ± 1412,720 ± 3263382 ± 46283 ± 4694 ± 9
MDF4.49 ± 0.0442.43 ± 0.3827.04 ± 0.1215.80 ± 0.288.81 ± 0.36167 ± 103274 ± 1158 ± 2327 ± 3187 ± 4113 ± 676 ± 2
PDF10.35 ± 0.5528.56 ± 0.9210.53 ± 0.6928.69 ± 0.3012.42 ± 2.0035 ± 215,405 ± 21284 ± 77871 ± 1123641 ± 31552 ± 13497 ± 10
AB6.34 ± 0.1857.87 ± 2.1017.71 ± 0.6412.89 ± 0.142.58 ± 0.29228 ± 422948 ± 184361 ± 38571 ± 9282 ± 15411 ± 380 ± 65
TB4.97 ± 0.1064.71 ± 0.899.60 ± 0.237.46 ± 0.109.59 ± 0.671258 ± 3510,650 ± 4981323 ± 531939 ± 42838 ± 4144 ± 2362 ± 37
OS24.53 ± 0.1061.11 ± 0.191.05 ± 0.1012.14 ± 0.050.34 ± 0.04N.D.564 ± 2630 ± 53051 ± 5657 ± 365 ± 3N.D.
Table 3. Proximate and ultimate analysis of the biochars. VM = volatile matter, FC = fixed carbon, L = lab-scale reactor, P = pilot-scale reactor, COF = coffee husks, MDF = medium-density fiberboard, PDF = palm date fronds, AB = AB wood waste, TB = tree bark, and OS = olive stones. The blanks (-) in VM and FC indicate that these samples were not measured. Results of proximate and ultimate analysis for MDF were previously published [42].
SampleN (%)C (%)H (%)O (%)Molar H/CMolar O/CAsh (%)VM (%)FC (%)
COF350L3.52 ± 0.0859.97 ± 0.293.55 ± 0.0617.60 ± 0.360.71 ± 0.010.22 ± 0.0115.36 ± 0.18--
COF450L2.75 ± 0.0163.15 ± 0.082.22 ± 0.0210.80 ± 0.250.42 ± 0.010.13 ± 0.0121.07 ± 0.2313.7 ± 1.461.4 ± 6.1
COF500L2.79 ± 0.0266.07 ± 0.632.03 ± 0.036.74 ± 0.680.37 ± 0.010.08 ± 0.0122.36 ± 0.27--
COF550L2.59 ± 0.0367.80 ± 0.281.68 ± 0.033.62 ± 0.390.30 ± 0.010.04 ± 0.0123.57 ± 0.27--
COF450P3.10 ± 0.0363.27 ± 0.193.08 ± 0.029.16 ± 0.200.58 ± 0.020.11 ± 0.0121.39 ± 0.0712.7 ± 1.365.9 ± 6.6
MDF350L4.93 ± 0.1180.88 ± 1.683.40 ± 0.096.79 ± 1.690.50 ± 0.020.06 ± 0.024.00 ± 0.06--
MDF450L4.54 ± 0.1180.35 ± 0.702.91 ± 0.067.37 ± 0.720.44 ± 0.010.07 ± 0.014.83 ± 0.184.1 ± 0.488.6 ± 8.7
MDF500L4.57 ± 0.0983.78 ± 0.402.77 ± 0.074.82 ± 0.420.40 ± 0.010.04 ± 0.014.06 ± 0.06--
MDF550L3.58 ± 0.0288.34 ± 0.511.69 ± 0.011.98 ± 0.520.23 ± 0.010.02 ± 0.014.41 ± 0.05--
MDF450P4.10 ± 0.0176.52 ± 0.903.13 ± 0.0314.84 ± 0.900.49 ± 0.010.15 ± 0.071.42 ± 0.0321.9 ± 2.276.6 ± 7.7
PDF350L0.63 ± 0.0160.51 ± 0.332.99 ± 0.0214.22 ± 0.420.59 ± 0.010.18 ± 0.0121.64 ± 0.27--
PDF450L0.63 ± 0.0265.51 ± 0.562.19 ± 0.037.12 ± 0.560.40 ± 0.010.08 ± 0.0123.81 ± 0.048.8 ± 0.964.6 ± 6.5
PDF500L0.65 ± 0.0166.92 ± 1.012.12 ± 0.026.04 ± 1.070.38 ± 0.010.07 ± 0.0124.27 ± 0.16--
PDF550L0.56 ± 0.0268.00 ± 0.361.72 ± 0.024.91 ± 0.480.30 ± 0.010.05 ± 0.0124.81 ± 0.31--
PDF450P0.95 ± 0.0360.28 ± 0.512.88 ± 0.0412.66 ± 0.520.57 ± 0.050.16 ± 0.0123.24 ± 0.0812.5 ± 1.364.3 ± 6.4
AB350L2.63 ± 0.0274.39 ± 0.183.69 ± 0.0214.60 ± 0.280.60 ± 0.010.15 ± 0.014.68 ± 0.21--
AB450L2.72 ± 0.0172.95 ± 0.472.76 ± 0.0414.67 ± 0.810.45 ± 0.010.15 ± 0.016.90 ± 0.664.7 ± 0.587.7 ± 8.8
AB500L2.49 ± 0.0378.84 ± 0.142.32 ± 0.028.57 ± 0.900.35 ± 0.010.08 ± 0.017.78 ± 0.89--
AB550L2.51 ± 0.0478.20 ± 0.782.15 ± 0.034.82 ± 1.570.33 ± 0.010.05 ± 0.0212.33 ± 1.36--
AB450P1.95 ± 0.0479.88 ± 0.272.79 ± 0.0110.87 ± 0.300.42 ± 0.060.10 ± 0.014.51 ± 0.107.0 ± 0.788.5 ± 8.9
TB350L0.92 ± 0.0370.37 ± 1.613.06 ± 0.0716.46 ± 1.610.52 ± 0.020.18 ± 0.029.20 ± 0.12--
TB450L0.93 ± 0.0475.60 ± 0.752.68 ± 0.0312.01 ± 0.750.43 ± 0.010.12 ± 0.018.78 ± 0.0510.7 ± 1.178.7 ± 7.9
TB500L0.88 ± 0.0178.20 ± 0.362.16 ± 0.027.41 ± 0.370.33 ± 0.010.07 ± 0.0111.35 ± 0.09--
TB550L0.85 ± 0.0278.96 ± 0.292.07 ± 0.017.51 ± 0.300.32 ± 0.010.07 ± 0.0110.61 ± 0.05--
TB450P0.86 ± 0.0270.27 ± 0.892.77 ± 0.0418.03 ± 0.890.47 ± 0.030.19 ± 0.018.08 ± 0.0813.9 ± 1.478.0 ± 7.8
OS350L0.43 ± 0.0184.62 ± 0.982.56 ± 0.059.21 ± 0.980.36 ± 0.010.08 ± 0.013.17 ± 0.02--
OS450L0.47 ± 0.0985.07 ± 0.722.47 ± 0.058.74 ± 0.730.35 ± 0.010.08 ± 0.013.25 ± 0.054.8 ± 0.590.2 ± 9.0
OS500L0.43 ± 0.0285.73 ± 0.102.22 ± 0.078.26 ± 0.140.31 ± 0.010.07 ± 0.013.36 ± 0.07--
OS550L0.38 ± 0.0188.65 ± 1.691.85 ± 0.045.49 ± 1.700.25 ± 0.020.05 ± 0.013.62 ± 0.09--
OS450P0.53 ± 0.0180.24 ± 0.513.17 ± 0.0112.90 ± 0.510.47 ± 0.050.11 ± 0.012.65 ± 0.0415.3 ± 1.580.6 ± 8.1
Table 4. Elemental composition, content of 16 EPA polycyclic aromatic hydrocarbon (PAHs), and water holding capacity (WHC) of the biochars. The blanks (-) in the 16 EPA PAHs and WHC indicate that these samples were not measured. L = lab-scale reactor, P = pilot-scale reactor, COF = coffee husks, MDF = medium-density fiberboard, PDF = palm date fronds, AB = AB wood waste, TB = tree bark, and OS = olive stones.
SampleAlCaFeKMgNaP16 EPA PAHsWHC
Biocharmg/kgmg/kgmg/kgmg/kgmg/kgmg/kgmg/kgppm%
COF350L1240 ± 7031,630 ± 18751895 ± 10036,470 ± 25659000 ± 450863 ± 461781 ± 51--
COF450L1290 ± 6032,000 ± 13002050 ± 13037,350 ± 21509250 ± 290900 ± 331950 ± 60--
COF500L1525 ± 2538,470 ± 8102395 ± 1345,840 ± 83011,200 ± 2401060 ± 322310 ± 107--
COF550L1505 ± 1037,820 ± 1402300 ± 3543,025 ± 60010,770 ± 75970 ± 252255 ± 88--
COF450P1100 ± 1032,300 ± 5001800 ± 2036,700 ± 50010,100 ± 100940 ± 332600 ± 565.98 ± 0.24398 ± 6
MDF350L662 ± 13710,617 ± 320220 ± 32172 ± 10632 ± 17282 ± 13278 ± 7--
MDF450L519 ± 538427 ± 229229 ± 81357 ± 6553 ± 15318 ± 69319 ± 74--
MDF500L753 ± 31610,274 ± 579192 ± 71603 ± 18650 ± 15292 ± 18318 ± 27--
MDF550L677 ± 8912,481 ± 204245 ± 82270 ± 27808 ± 5289 ± 17321 ± 18--
MDF450P235 ± 44100 ± 90302 ± 91460 ± 30446 ± 8180 ± 10110 ± 100.91 ± 0.12332 ± 6
PDF350L156 ± 039,610 ± 800965 ± 5717,775 ± 4709484 ± 2401365 ± 281555 ± 30--
PDF450L124 ± 548,800 ± 920860 ± 3021,290 ± 77011,260 ± 2901630 ± 501900 ± 60--
PDF500L106 ± 046,220 ± 145526 ± 421,645 ± 24011,280 ± 351655 ± 401870 ± 95--
PDF550L126 ± 546,260 ± 300877 ± 2120,370 ± 33010,585 ± 1051595 ± 251830 ± 40--
PDF450P89 ± 249,400 ± 170138 ± 117,490 ± 17011,290 ± 832270 ± 622440 ± 555.35 ± 0.76376 ± 10
AB350L431 ± 15240 ± 260832 ± 781660 ± 40614 ± 201075 ± 40248 ± 11--
AB450L538 ± 05900 ± 90694 ± 221720 ± 0749 ± 511170 ± 5315 ± 16--
AB500L549 ± 96290 ± 30767 ± 101890 ± 20747 ± 51160 ± 20309 ± 12--
AB550L948 ± 127610 ± 2002252 ± 01860 ± 50859 ± 31130 ± 25362 ± 8--
AB450P540 ± 107900 ± 200620 ± 202370 ± 60960 ± 301810 ± 70450 ± 209.61 ± 0.50306 ± 4
TB350L1214 ± 3120,780 ± 1121165 ± 53000 ± 181335 ± 25156 ± 2665 ± 55--
TB450L1170 ± 2021,170 ± 3001010 ± 153230 ± 301350 ± 15200 ± 15675 ± 20--
TB500L1200 ± 225,350 ± 381043 ± 193260 ± 291405 ± 9174 ± 1569 ± 25--
TB550L1223 ± 3025,750 ± 180986 ± 343605 ± 381516 ± 16206 ± 4782 ± 42--
TB450P1100 ± 5022,600 ± 800830 ± 203200 ± 1001320 ± 40220 ± 20640 ± 901.54 ± 0.66230 ± 3
OS350L75 ± 101891 ± 57190 ± 137308 ± 109178 ± 197 ± 2298 ± 6--
OS450L50 ± 11850 ± 70210 ± 207420 ± 60180 ± 2120 ± 5400 ± 40--
OS500L62 ± 52002 ± 48301 ± 128364 ± 94198 ± 5131 ± 1229 ± 30--
OS550L93 ± 42635 ± 270775 ± 128122 ± 29210 ± 11141 ± 5226 ± 23--
OS450P124 ± 13250 ± 490190 ± 206800 ± 200177 ± 980 ± 10230 ± 300.40 ± 0.0270 ± 2
Table 5. Determination of the mean residence time (MRT) in the pilot-scale reactor.
SampleBiomass Density (kg/m3)Biomass Angle of Repose (°)MRT (min)
MDF17049.014.0
PDF16038.012.3
COF38037.012.2
AB23043.013.1
TB26043.013.1
OS79037.012.3
Disclaimer/Publisher’s Note: The statements, opinions and data contained in all publications are solely those of the individual author(s) and contributor(s) and not of MDPI and/or the editor(s). MDPI and/or the editor(s) disclaim responsibility for any injury to people or property resulting from any ideas, methods, instructions or products referred to in the content.

