Article

Pancreatic Cancer 3D Cell Line Organoids (CLOs) Maintain the Phenotypic Characteristics of Organoids and Accurately Reflect the Cellular Architecture and Heterogeneity In Vivo

1
National Institute for Cellular Biotechnology, School of Biotechnology, Dublin City University, D09 NR58 Dublin, Ireland
2
Department of Biology, University of Pisa, S.S. 12 Abetone e Brennero 4, 56127 Pisa, Italy
3
Trinity St. James Cancer Institute, Trinity College Dublin, D08 W9RT Dublin, Ireland
4
Histopathology Department, St. Vincent’s University Hospital, Elm Park, D04 T6F4 Dublin, Ireland
*
Author to whom correspondence should be addressed.
These authors contributed equally to this work.
Organoids 2022, 1(2), 168-183; https://doi.org/10.3390/organoids1020013
Submission received: 29 September 2022 / Revised: 19 October 2022 / Accepted: 2 December 2022 / Published: 12 December 2022
(This article belongs to the Topic Human Current and Future Model Systems)

Abstract

:
Pancreatic cancer is a highly lethal disease. Therapeutic resistance to chemotherapy is a major cause of treatment failure and recurrence in pancreatic cancer. Organoids derived from cancer stem cells (CSC) are promising models for the advancement of personalised therapeutic responses to inform clinical decisions. However, scaling-up of 3D organoids for high-throughput screening is time-consuming and costly. Here, we successfully developed organoid-derived cell lines (2.5D) from 3D organoids; the cells were then expanded and recapitulated back into organoids known as cell line organoids (CLOs). The 2.5D lines were cultured long term into 2D established cell lines for downstream comparison analysis. Experimental characterisation of the models revealed that the proliferation of CLOs was slightly faster than that of parental organoids. The therapeutic response to chemotherapeutic agents in 3D CLOs and organoids showed a similar responsive profile. Compared to 3D CLOs and organoids, 2D cell lines tended to be less responsive to all the drugs tested. Stem cell marker expression was higher in either 3D CLOs or organoids compared to 2D cell lines. An in vivo tumorigenicity study found CLOs form tumours at a similar rate to organoids and retain enhanced CSC marker expression, indicating the plasticity of CSCs within the in vivo microenvironment.

1. Introduction

Pancreatic ductal adenocarcinoma (PDAC) is one of the most aggressive cancers. PDAC is the 4th leading cause of cancer-related death and is predicted to become the 2nd by 2030 [1,2]. The 5-year overall survival (OS) rate is 10% [2,3]. PDAC has a complex background involving environmental epidemiological risk factors, germline and somatic mutations, inherited predisposition loci, and alterations in the epigenetic landscape [4]. Most commonly, driver somatic mutations occur in four genes: KRAS (observed in 95% of patients), TP53 (72%), CDKN2A (30%), and SMAD4 (32%) [5]. In addition, numerous point somatic mutations in other genes have been identified from PDAC samples. Notably, on average, 63 mutations occur per PDAC tumour genome [6].
The poor progress in PDAC therapy is largely attributed to the asymptomatic nature of the disease in its early stages. By the time of diagnosis, ~80% of the patients present at late stages with locally advanced or metastatic tumours, which are considered to be surgically non-operable. In patients with resectable tumours, the highest survival rates are achieved by surgical excision of the tumour with neo- or adjuvant chemotherapy [7]. Nevertheless, among resected patients, 30–60% experience tumour recurrence within 12 months, with only 10–20% of these patients reaching an OS of 5 years [8,9]. Therapy with FOLFIRINOX (5-fluorouracil, leucovorin, irinotecan, and oxaliplatin), the modified version (mFOLFIRINOX), or gemcitabine with nab-paclitaxel (GEM/nabPTX) combination regimens currently remain the most common options, although treatment prolongs the OS only to a modest degree [10,11,12]. Not all patients respond to chemotherapeutic drug therapy, and those who do often develop drug resistance [10]. This resistance is due to the presence of highly heterogeneous tumorous stroma as well as cancer stem cells (CSC) that gradually change the molecular phenotype of the tumour [13,14,15,16].
Another fundamental aspect of improved drug development is that common laboratory models used for PDAC investigation and drug testing are not able to fully represent the original tumour. For decades, 2-dimensional (2D) cell lines established from patients’ tumours have been used as convenient PDAC models. Their biggest advantages are robustness in handling and the ability to culture for an undefined period of time. The culturing techniques and media composition are well described, making the culture time and cost-effective. Although there are over 40 known PDAC cell lines, only approximately 15 of them are suitable for studies [17]. The drawbacks of 2D established cell lines are being increasingly recognised, for example, 2D cell lines do not recapitulate the complex tissue 3D architecture, intercellular connections, and the microenvironment; 2D cell lines are characterised by homogenous cellular profiles, while the original tumour presents a stochastic heterogeneous composition that includes pancreatic cells at various stages of cancerous transformation and other cell types (stromal cancer-associated fibroblasts (CAFs), stellate cells, vasculature, extracellular matrix (ECM), CSC, etc.) [18]. Long-term culturing of the cell lines inevitably leads to the accumulation of genomic changes and even more strengthening of the cell line homogeneity.
Recently, 3D tumour organoid systems have been developed for many cancer types [19,20,21,22,23,24,25,26,27]. These complex, self-organising structures are cultured from tumour cells embedded in the 3D extracellular matrix (ECM). They often show cell heterogeneity, cellular polarisation, possess a lumen, preserved cell architecture, and cell-to-cell communication, highly resembling the patient’s phenotypic characteristics. Organoid culture requires a complex media composition with growth factors and sophisticated techniques, which is more time-consuming and expensive. Nevertheless, once established, the organoids can proliferate indefinitely and are able to be expanded, managed, and cryopreserved [28].
Previously, we introduced novel methodologies that aimed to address the drawbacks of organoid scale-up. We established experimental approaches to develop PDAC organoids from patient-derived xenograft (PDX) tumours, and the simultaneous development of isogenic matched primary cell lines. We recapitulated the primary cell line cultures to organoids (CLOs) and highlighted the usefulness of CLOs as PDAC organoid models, as they maintain similar phenotypic, molecular, and transcriptomic signatures as their matched patient-derived organoids and PDX [29].
In this present study, we further developed isogenic matched 2D cell lines and CLOs from three patient-derived organoids and described their phenotypic characteristics, and the ability of CLOs to reflect in vivo cellular heterogeneity.

2. Materials and Methods

2.1. Establishment of Isogenic Matched 2D Organoid-Derived Cell Line

The 2.5D and 2D cell lines were derived from 3D organoids purchased from ATCC (PDM-37, HCM-CSHL-0090-C25; PDM-41, HCM-CSHL-0094-C25; PDM106, HCM-BROD-0008-C25). The 3D organoids were maintained in Complete Human Feeding Media (CHFM), 50% v/v L-WRN conditioned media, 500 nM A83-01 (Sigma-Aldrich, SML0788, St. Louis, MO, USA), 100 ng/mL hFGF10 (Biolegend, 559308, San Diego, CA, USA), 50 ng/mL EGF (ThermoFisher, PHG0311, Waltham, MA, USA), 0.01 µM Gastrin 1 (Tocris, 3006, Bristol, UK), 1.25 mM N-acetylcysteine (R&D, 5619, Minneapolis, MN, USA), 10 mM Nicotinamide (Sigma-Aldrich, N0636), 1× B-27 supplement (Life Technologies, 17504-044, Carlsbad, CA, USA), 10.5 µM Y-27632 (Sigma-Aldrich, Y0503) in DMEM-F12 (Merck, D642, Darmstadt, Germany) supplemented with 1 mM HEPES buffer (Merck, H3375) and 1× antibiotic-antimycotic (ThermoFisher, 15240062).
The 1.5 × 10⁵ cells were mixed in 100 μL of extracellular matrix (ECM) (Sigma, E1270, 8–12 mg/mL) diluted to 1 mg/mL and 50 μL was plated per well in a 24-well plate. Cells were fed 500 μL of the CHFM with the Rho kinase inhibitor (ROCKi). Cells were cultured until they began to adhere to the bottom of the plate, fed with CHFM. To passage cells, 1 mL of TrypLE (ThermoFisher, 12605010) was added to each well until the cells detached, and 1 mL of DMEM High Glucose GlutaMAX (ThermoFisher, 10566-016) with 10% FBS was added to stop trypsinisation. Cells were transferred to a 6-well plate, then upscaled to a T25 cm3 flask. After this, the media were changed from CHFM to 50:50 GlutaMax DMEM and L-WRN conditioned media with 10% FBS and 1% antibiotic-antimycotic. All experiments were performed within 10 passages.

2.2. Cell Line Organoid (CLO) Recapitulation to Organoid

Scaled-up early passage 2.5D organoid-derived cell lines were trypsinized, and 5 × 10⁵ cells/well were resuspended in 20–50 μL ECM per well and plated onto a 24-well polyHEMA (Sigma, P3932)-coated plate overlaid with CHFM with ROCKi, with media changed every 2 days without ROCKi. All experiments were performed within 10 passages.

2.3. Cell Viability Assays

Organoids and CLOs were seeded at 5 × 10³ in 10 μL of ECM, and cell lines were seeded at a density of 1 × 10⁴–5 × 10⁴ cells/mL in a 96-well plate. The plates were placed in the Incucyte Live Cell Imaging System (S3, Sartorius, Göttingen, Germany), and brightfield images were taken every 6 h over a 10-day period. To evaluate the cytotoxicity, 72 h (organoids and CLOs) and 24 h (cell lines) post seeding, the cell models were treated with increasing concentrations of 5-FU, cisplatin, and nab-paclitaxel. After five days’ incubation with the drug, the viability was measured using CellTitre-Glo (Promega, G9682, Madison, WI, USA), as per the manufacturer’s instructions. The luminescence was then read with an integration of 1.0 s and gain of 100 on a plate reader (Biotek) using Gen4 software. The percentage growth was calculated relative to an untreated control. All assays were performed in triplicate.

2.4. Quantitative Reverse Transcription PCR (RT-qPCR)

Organoids and CLOs were grown as described for 10–14 days. TRI-reagent® (Sigma, T9424) was used to lyse cells, and RNA isolation was performed using the Direct-zol RNA Miniprep Plus Kit (Zymo Research, K2072, Irvine, CA, USA). A High-Capacity cDNA Reverse Transcription Kit (Applied Biosystems, 4368814, Waltham, MA, USA) was used to synthesise cDNA from RNA. A G-Storm Thermal Cycler (Model GS1, Somerton Biotechnology Centre) was used to perform cDNA synthesis using the following program: annealing at 25 °C for 10 min, cDNA synthesis at 37 °C for 120 min, enzyme inactivation at 85 °C for 5 min.
The RT-qPCR assay was prepared using 20× TaqMan Gene Expression Assay (NANOG, ID: Hs02387400; POU5F1/OCT4, ID: Hs04260367; SOX2, ID: Hs01053049; 18S, ID: Hs03003631). The reaction was carried out in MicroAmp Fast Optical 96-well reaction plates (ThermoFisher, 4346907). The plate was sealed using Adhesive PCR Plate Seals (ThermoFisher, AB0558) and centrifuged briefly. Using an Applied Biosystems 7900 Real-Time PCR System, RT-qPCR was performed at 50 °C for 2 min, 95 °C for 20 s, and 40 cycles of 95 °C for 1 s and 60 °C for 20 s. Relative quantification was measured by the relative quantification method (2−ΔΔCt) with 18S as an endogenous control. Each biological replicate was measured in technical triplicate wells.

2.5. Slide Preparation for Immunofluorescence Staining

2.5.1. Cell Lines

Cells were seeded in a glass-bottomed 8-well plate (Ibidi, 80827) and grown overnight. Media was removed from the cells and washed three times in a PBS 0.1% Tween 20 (Sigma, P1379) and 2% BSA (Sigma, A9418) (PTB) solution. Cells were fixed in ice-cold methanol for 5 min at 20 °C and washed in the PTB solution.

2.5.2. Organoids and CLOs

Organoids and CLOs were collected, fixed in formalin, and dehydrated using increasing concentrations of sucrose and then were placed in optimal cutting temperature (OCT) embedding matrix gel (Tissue-Tek, KMA-0100-00A) and placed at −80 °C overnight. Using a cryostat (Leica, CM 1900, Wetzlar, Germany), the OCT-embedded organoids were cut into 8 μm sections and placed onto Super Frost Plus slides (Thermo Fisher, 10149870, MA, USA) and stored at 4 °C until further use.

2.6. Immunofluorescence Staining

Cells were blocked for 1 h 30 min in 10% goat serum (ThermoFisher, 16210064), the primary antibodies ALDH1A1 1:200 dilution (Abcam, ab52492, Cambridge, UK), CXCR4 1:100 dilution (Santa Cruz Biotechnology, sc-53534, Dallas, TX, USA), EpCAM 1:50 dilution (Santa Cruz Biotechnology, sc-25308), and HCAM 1:100 dilution (Santa Cruz Biotechnology, sc-7297) were diluted in the PTB solution, and added to the cells overnight at 4 °C. The cells were washed with PTB solution, and the secondary antibodies Alexa Fluor 488 Mouse 1:1500 dilution (Invitrogen, A-11001, Waltham, MA, USA) and Alexa Fluor 488 Rabbit 1:2000 dilution (Invitrogen, A-11008) were diluted in the PTB solution and added to the cells. The cells were incubated for 1-h at room temperature in the dark. The secondary antibody was removed, the cells were washed, and DAPI (1:2500) was added to the cells. The coverslips were mounted using ProLong Gold Antifade Mountant (Invitrogen, P36930) and allowed to dry for 24 h.
The immunofluorescence was observed using a Leica TCS SP8 STED super resolution microscope equipped with a CCD camera and 100× oil immersion objective. DAPI was excited with a 405 nm PicoQuant laser unit, and emission was captured between 387 and 474 nm. Alexa Fluor 488 was excited at 499 nm, with emission captured between 490 and 566 nm. Images were acquired in which combinations of excitation and emission wavelengths for specific dyes were applied sequentially. The fluorescence intensity was quantified using ImageJ software. The area of integrated intensity and mean gray value around the cells was measured, and the average background was subtracted from the images.

2.7. In Vivo Xenograft Study

Female SCID (CB17/lcr-Prkdcscid/lcrCrl) mice were obtained from Charles Rivers (UK), maintained in pathogen-free conditions, and fed a standard diet. Mice were kept at 25 °C with a 12 h light-dark schedule and free access to food and water. All experiments were approved by the DCU Research Ethics Committee (DCUREC/2012/202) and the Health Products Regulatory Authority (HPRA) under project authorisation AE19115/P023, and were carried out in accordance with the relevant guidelines and regulations and in compliance with the ARRIVE guidelines. PT291 organoids, CLOs, and cell lines [29] were seeded as described earlier and grown for one week prior to implantation. A cell suspension of 2 × 10⁷ cells was prepared for the organoids, CLO, and 2D cell line. Cell pellets were resuspended in 1 mL of ECM. The ECM-cell suspension was plated in 400 μL ECM domes, allowed to solidify at 37 °C, and implanted subcutaneously on the flanks of the mice. Under anaesthesia (isoflurane, an O2 carrier gas), a small incision was made in the skin of the left flank of the animal. The ECM-cell dome was then drawn into a syringe and injected into the pocket under the skin, and the wound was sealed with a single staple. The animals were monitored post-surgery, and staple removal was completed within 10 days. Animals were monitored weekly for body weight and tumour development. Tumours were measured by height, width, and depth using electronic callipers. Tumour volume was calculated as outlined according to an equation: tumour volume = (height × width × depth)/1.9.
Mice were euthanized by cervical dislocation, and tumours were excised when the tumour reached a volume of >1600 mm3, a tumour axis >15 mm, or due to reaching humane endpoints. The tumour was then quickly divided into sections and preserved by liquid nitrogen flash freezing and formalin fixation. Flash-frozen samples were stored at −80 °C, and formalin-fixed samples were dehydrated in 50%, 70%, 90%, and 100% ethanol, followed by 100% xylene, and then embedded in paraffin. Formalin fixed paraffin-embedded (FFPE) blocks were stored at 4 °C until sectioning.
Sectioning of in vivo tumour samples was carried out using a Reichert-Jung 2030 microtome. Blocks were cut into 5 μM sections, which were floated in a water bath at 40 °C and mounted onto a SuperFrost Plus slide (ThermoFisher, 10149870) and allowed to dry at 60 °C for 2 h.

2.8. Immunohistochemistry

Immunohistochemistry (IHC) was performed on a DAKO Autostainer. Deparaffinisation and antigen retrieval were performed on slides using the DAKO PT Link and pH 6 (DAKO, S169984) or pH 9 (DAKO, S236784-2) antigen retrieval solutions. The slides were placed in the PT Link at 65 °C, heated to 95 °C, and maintained at this temperature for 20 min. The slides were then cooled to 95 °C and placed in the DAKO Autostainer. The reagents were applied as follows: Real HP Blocking (DAKO, S202386) for 10 min, Antibody for 30 min, Real EnVision (DAKO, K500711-2) for 30 min, Real DAB (DAKO, K500711-2) twice for 5 min, and Haematoxylin (DAKO, S330130-2) for 10 min. The antibodies applied are as follows: ALDH1A 1:200 dilution (Abcam, ab52492), CXCR4 1:100 dilution (Santa Cruz Biotechnology, sc-53534), EpCAM 1:50 dilution (Santa Cruz Biotechnology, sc-25308), HCAM 1:100 dilution (Santa Cruz Biotechnology, sc-7297), Ki67 1:200 dilution (DAKO, M724029-2), MASPIN 1:50 dilution (Invitrogen, PA5-35104), PDX11:50 dilution (Invitrogen, PA514824). Following the staining process, the slides were dehydrated in a fume hood using 70%, 90%, and 100% ethanol for two 3-min washes, followed by two 5-min xylene washes. Slides were mounted using DPX (Sigma, 44581), and the slides were allowed to air dry overnight in the fume hood.

2.9. Statistical Methods

Data were plotted and analysed using GraphPad Prism software (version 8.0, GraphPad, La Jolla, CA, USA), and the results are presented as the mean with standard deviation of three biological replicates. Statistical significance was determined by a two-tailed Student’s t-test with Welch’s correction and an ANOVA, where appropriate. * denotes p < 0.005, ** denotes p < 0.01, *** denotes p < 0.001.

3. Results

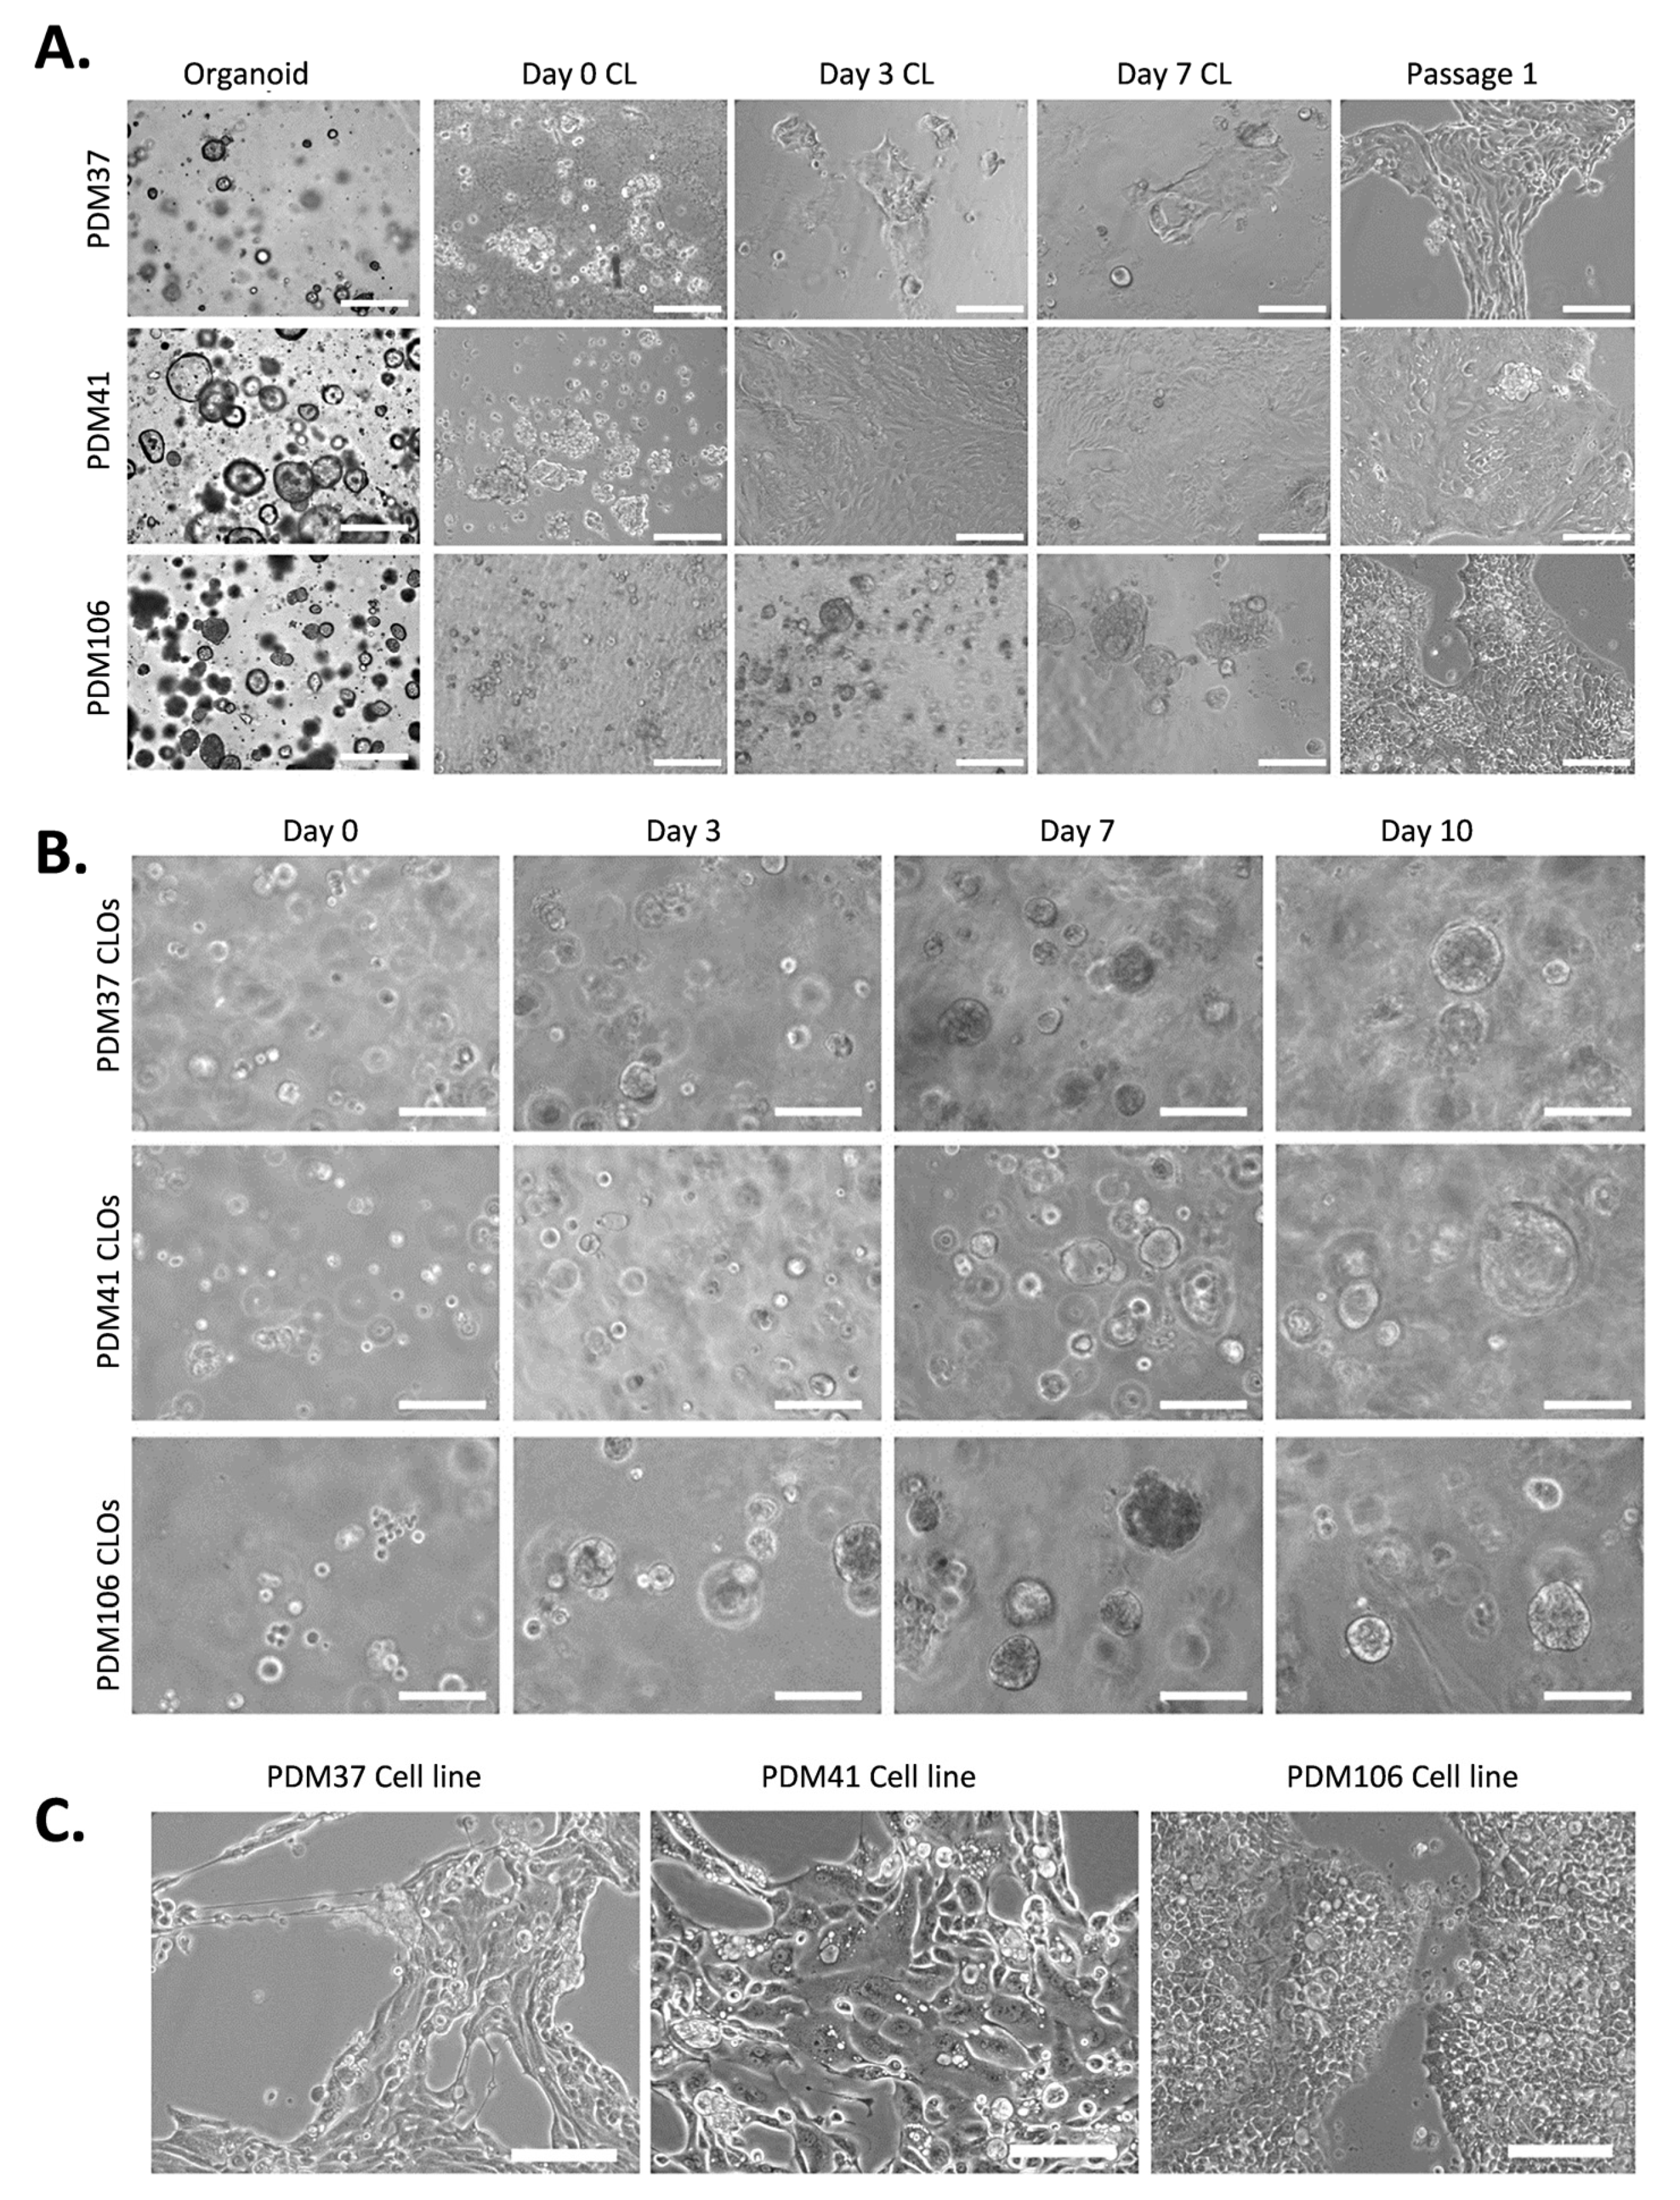
3.1. Generation of 2.5D Organoid-Derived Cell Lines and 3D Cell Line Organoids (CLOs) from PDAC Organoids

We developed three new 2.5D organoid-derived cell lines and isogenic matched 3D CLOs from PDAC organoids. The 2.5D cells were developed by plating the organoids in lower concentrations of ECM, allowing the cells to migrate from the organoids, attach to the bottom of the plate, and proliferate over time (Figure 1A). These early-passage 2.5D cells were then cultured using organoid conditions for two passages, which resulted in the generation of CLOs. The CLOs exhibited similar morphology patterns and rates to the original organoid (Figure 1B). The newly developed cell lines were cultured long term and maintained their morphology after several passages similar to established PDAC cell lines (Figure 1C).

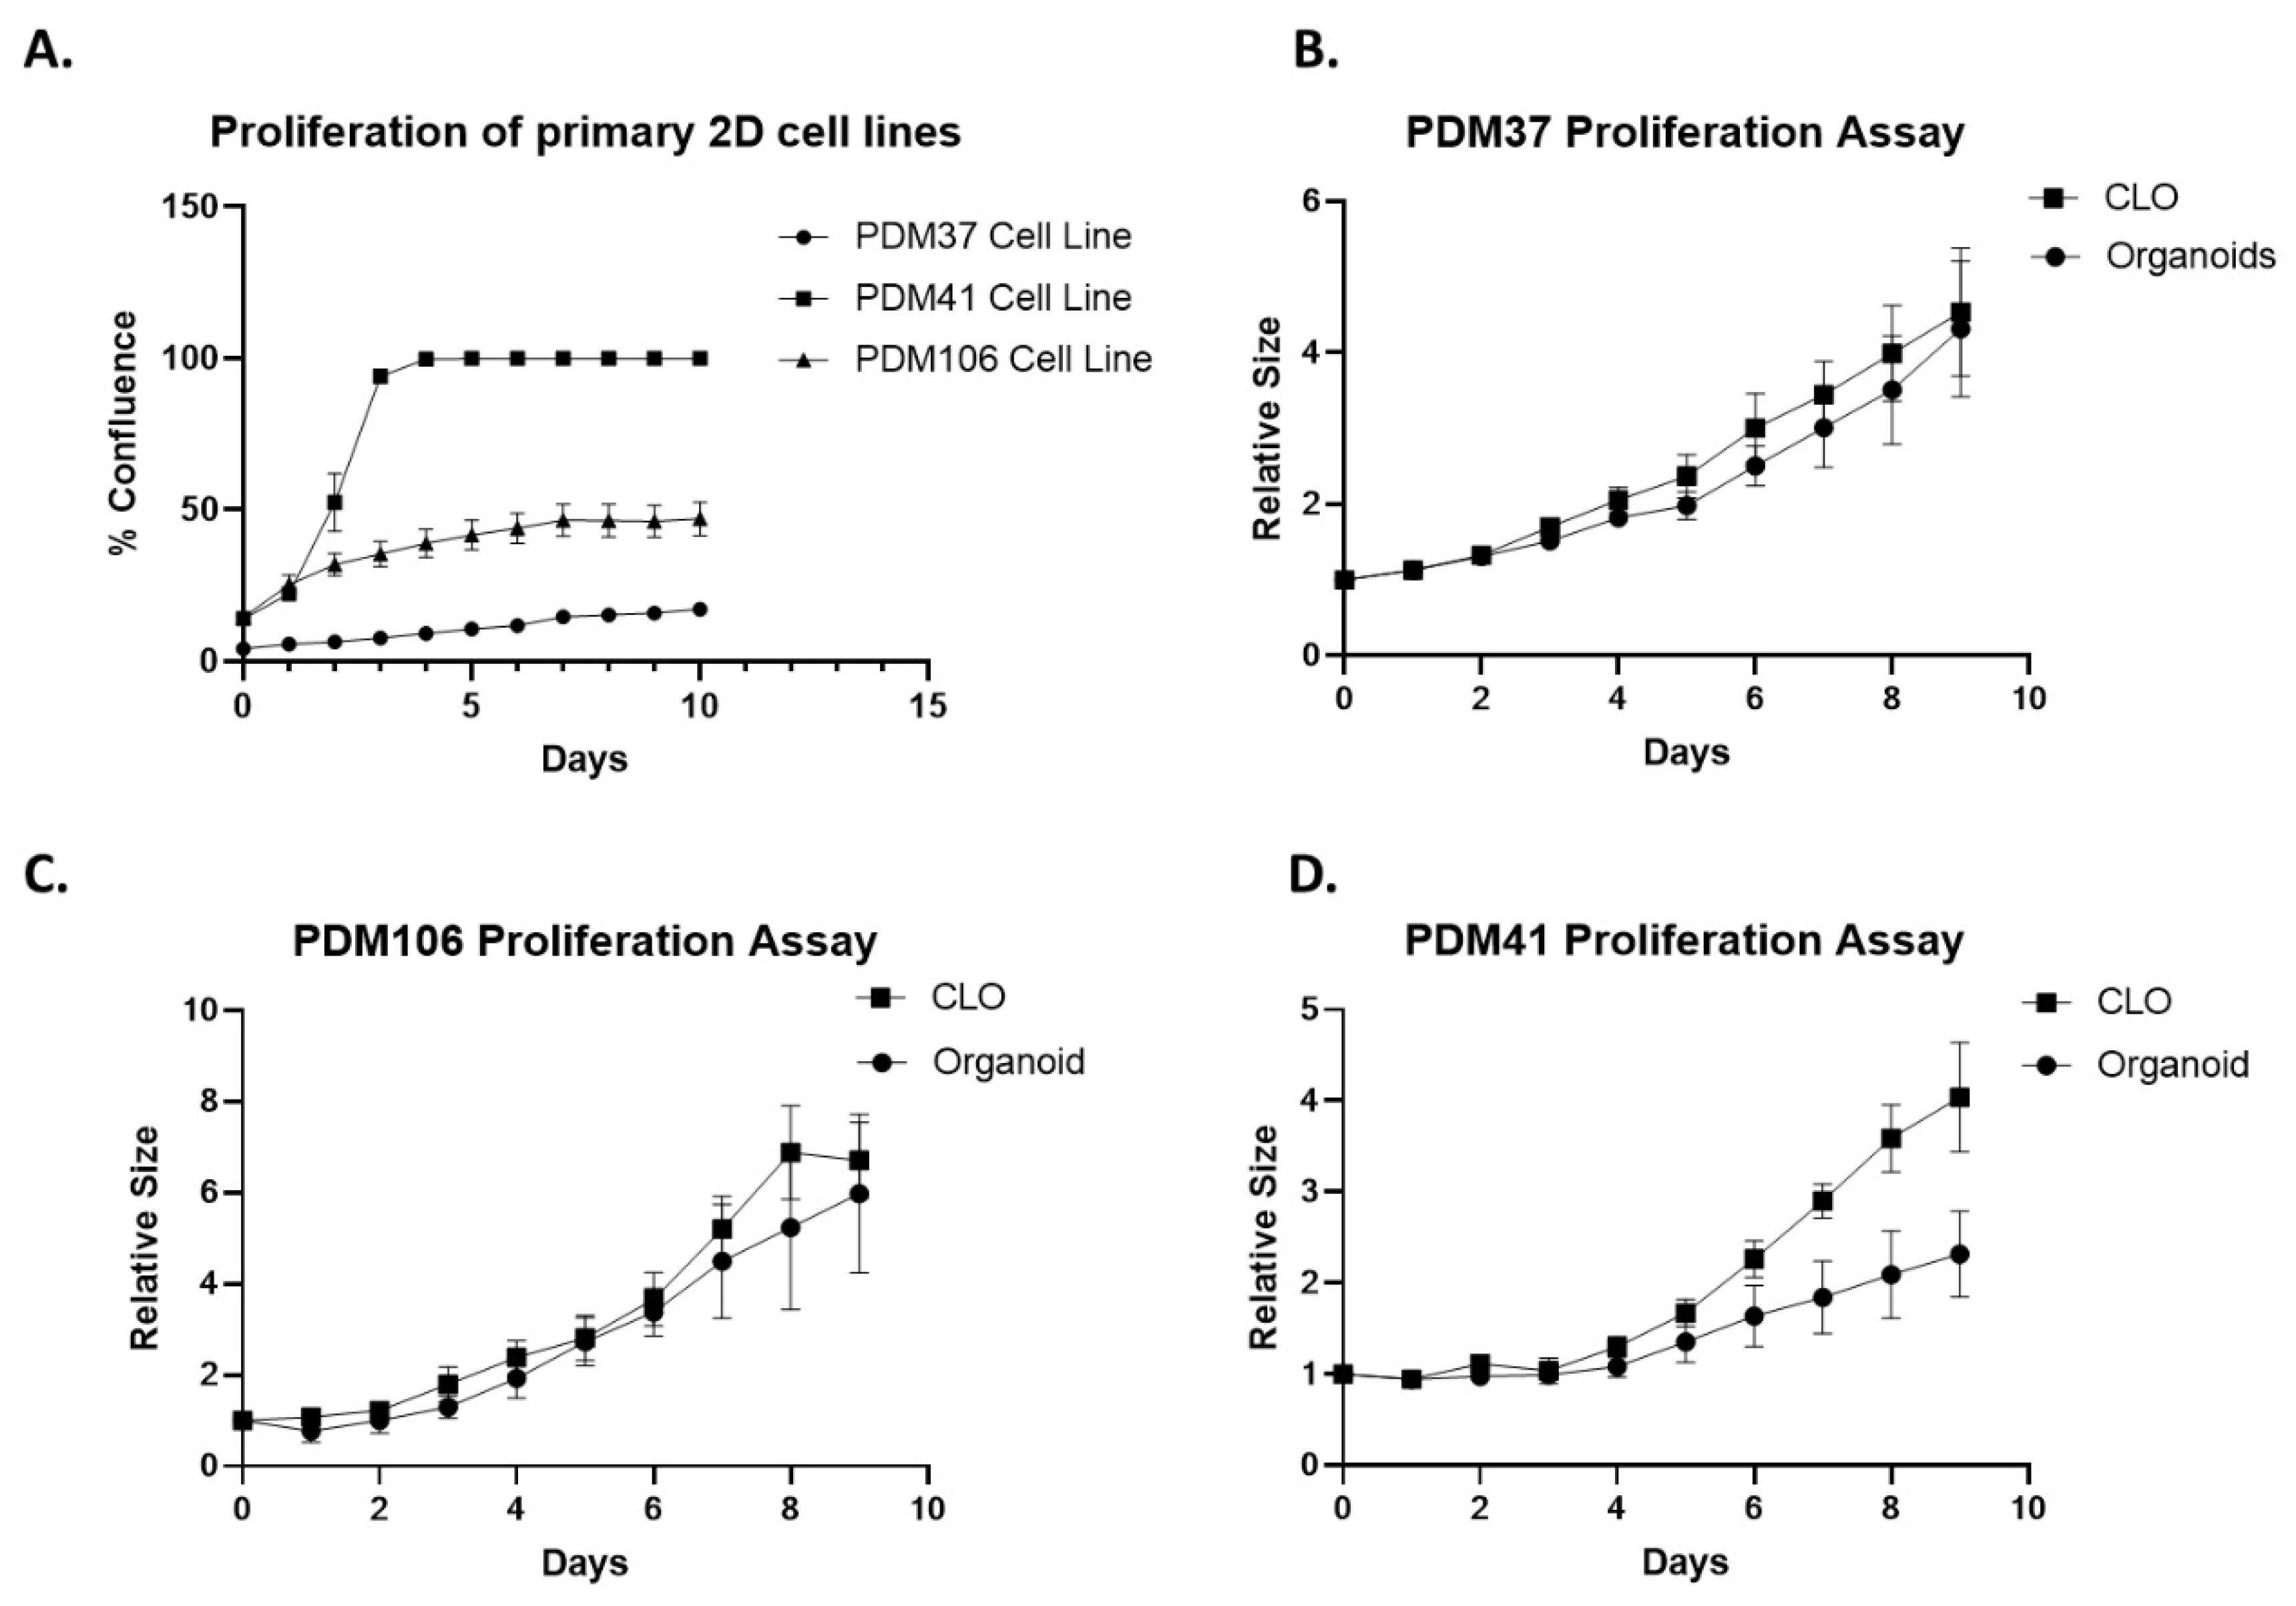
3.2. Relative Proliferation of Newly Established Primary 2D Cell Lines, Organoids, and CLOs

Proliferation assays were performed using the Incucyte Live Cell Imaging System to measure the growth rate of the newly generated 2D cell lines (>8 passages). The cell line PDM41 reached confluency within 4 days. PDM37 and PDM106 cell lines did not reach 100% confluency but achieved a maximal confluency of 47 ± 6% and 54 ± 6%, respectively, within 10 days, highlighting a slower rate of proliferation for these cell lines (Figure 2A). For organoids and CLOs, the total brightfield area of organoids and matched CLOs was calculated relative to day 0. Similar proliferation rates were observed between the isogenic matched organoids and CLOs. The PDM37 organoid displayed a relative size of 4.3 ± 1.6 compared to 4.5 ± 1.5 in PDM37 CLO. In addition, PDM106 organoid and CLO also displayed similar relative sizes of 6.0 ± 3.0 and 6.7 ± 1.5 after 9 days of growth, respectively (Figure 2B,C). The PDM41-CLO proliferated faster with a relative size of 4.0 ± 1.0 compared to 2.3 ± 0.8 PDM41-organoid (Figure 2D).

3.3. Therapeutic Response between 2D, CLOs, and Organoids

To assess the drug sensitivity between 2D and 3D CLOs and their original organoids, cell models were treated with different concentrations of 5-FU, cisplatin, and nab-paclitaxel. The viability of 3D CLOs and organoids decreased in a dose-dependent manner and showed a similar responsive profile to each other (Figure 3), except PDM106 organoids were non-responsive to cisplatin drug treatment. The 2D cell lines tended to be less responsive to all the drugs tested compared to the 3D CLOs and organoids. An IC50 value was not achieved in response to cisplatin and nab-paclitaxel in PDM41-CL and nab-paclitaxel in PDM106-CL (Table 1). This suggests our recapitulated 3D CLOs maintain the drug response profiles of their original 3D organoids and could be used as an easily expandable resource for drug screening.

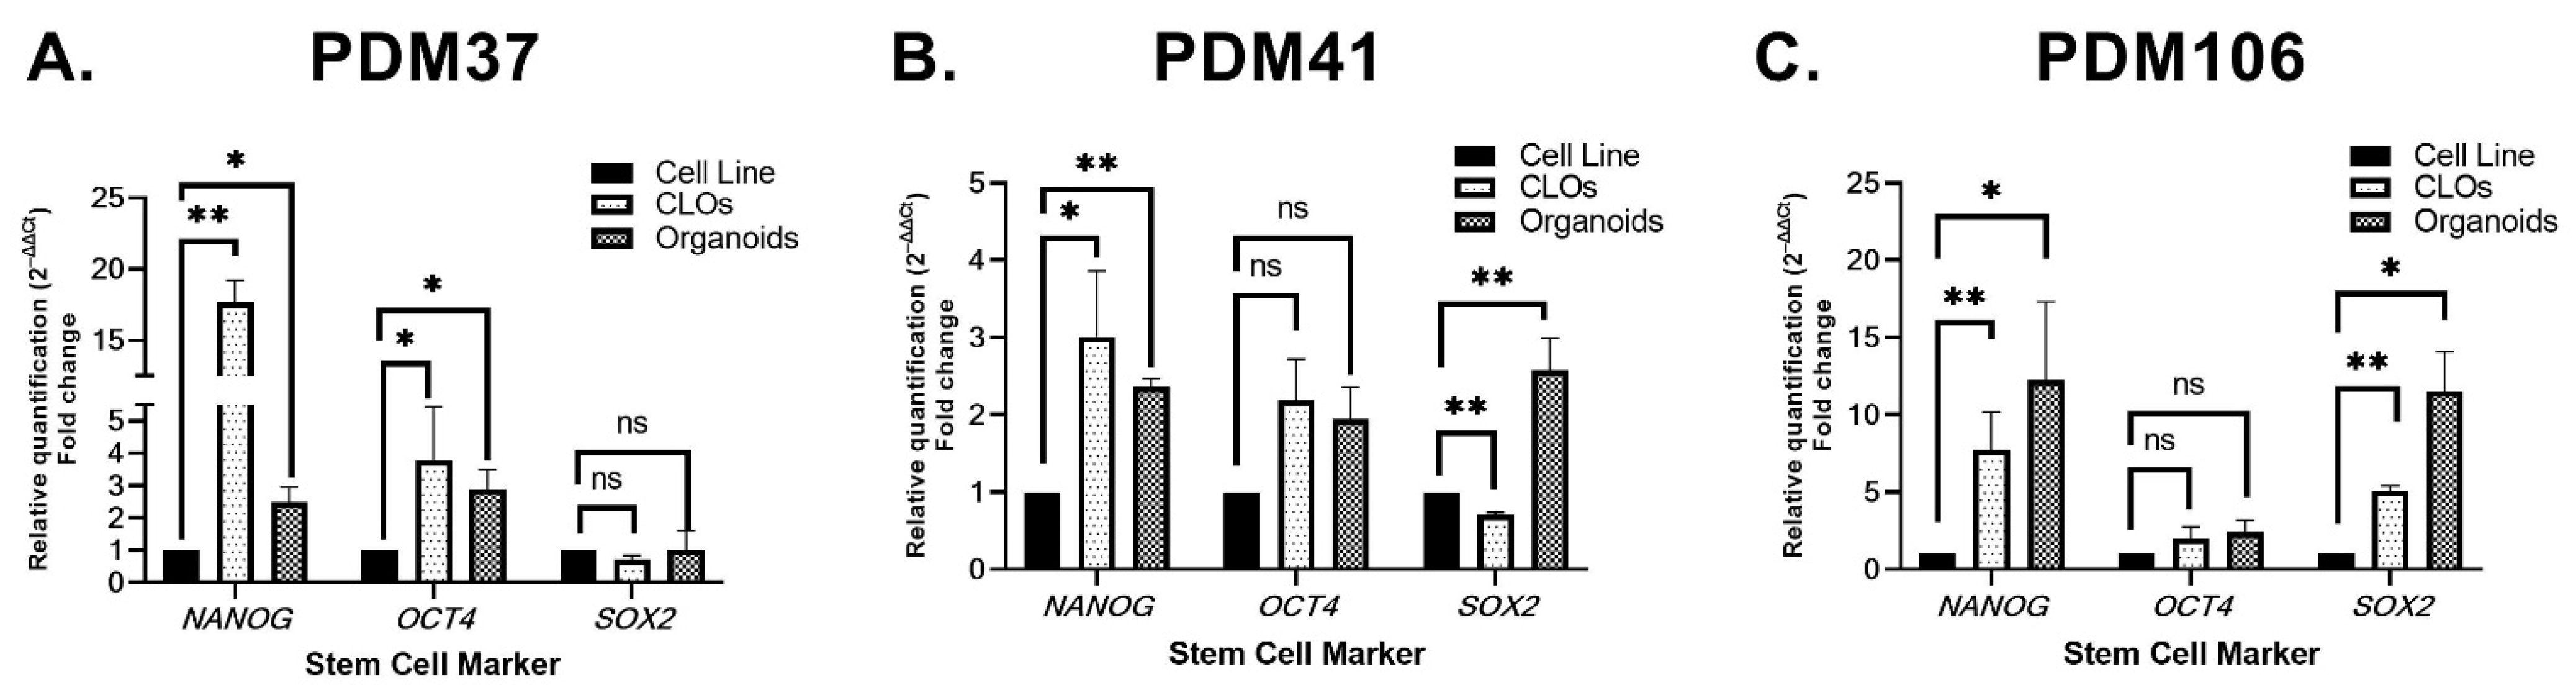
3.4. Stem Cell Marker Expression between Isogenic 2D Primary Cell Lines, Organoids, and CLOs

RT-qPCR was performed to examine the gene expression of stem cell-associated markers, NANOG, OCT4, and SOX2, in all models. These markers are key transcription regulators that maintain the self-renewal capabilities and pluripotency properties of stem cells [30,31]. A significant up-regulation of NANOG and OCT4 was observed in PDM37-CLOs and organoids relative to the 2D PDM37-CL (p < 0.05); however, there was a non-significant expression of SOX2 in both the PDM37 organoids and isogenic CLOs compared to the 2D PDM37-CL (Figure 4A). NANOG expression was up-regulated in PDM41 CLO and organoids relative to the 2D PDM41-CL. OCT4 levels were non-significantly increased in PDM41 organoids and CLOs compared to the PDM41-CL. SOX2 was down-regulated in PDM41-CLOs (p < 0.01), but was increased in PDM41-organoids compared to the 2D PDM41-CL (p < 0.01) (Figure 4B). In the PDM106 models, NANOG and SOX2 levels were all significantly higher in PDM106 organoids and CLOs compared to the 2D PDM106-CL, but OCT4 levels were not significantly increased in organoids and CLOs compared to the 2D PDM106-CL (Figure 4C). In general, we observed an increased expression of two SC markers in both CLOs and organoids relative to 2D cell lines in all three models.

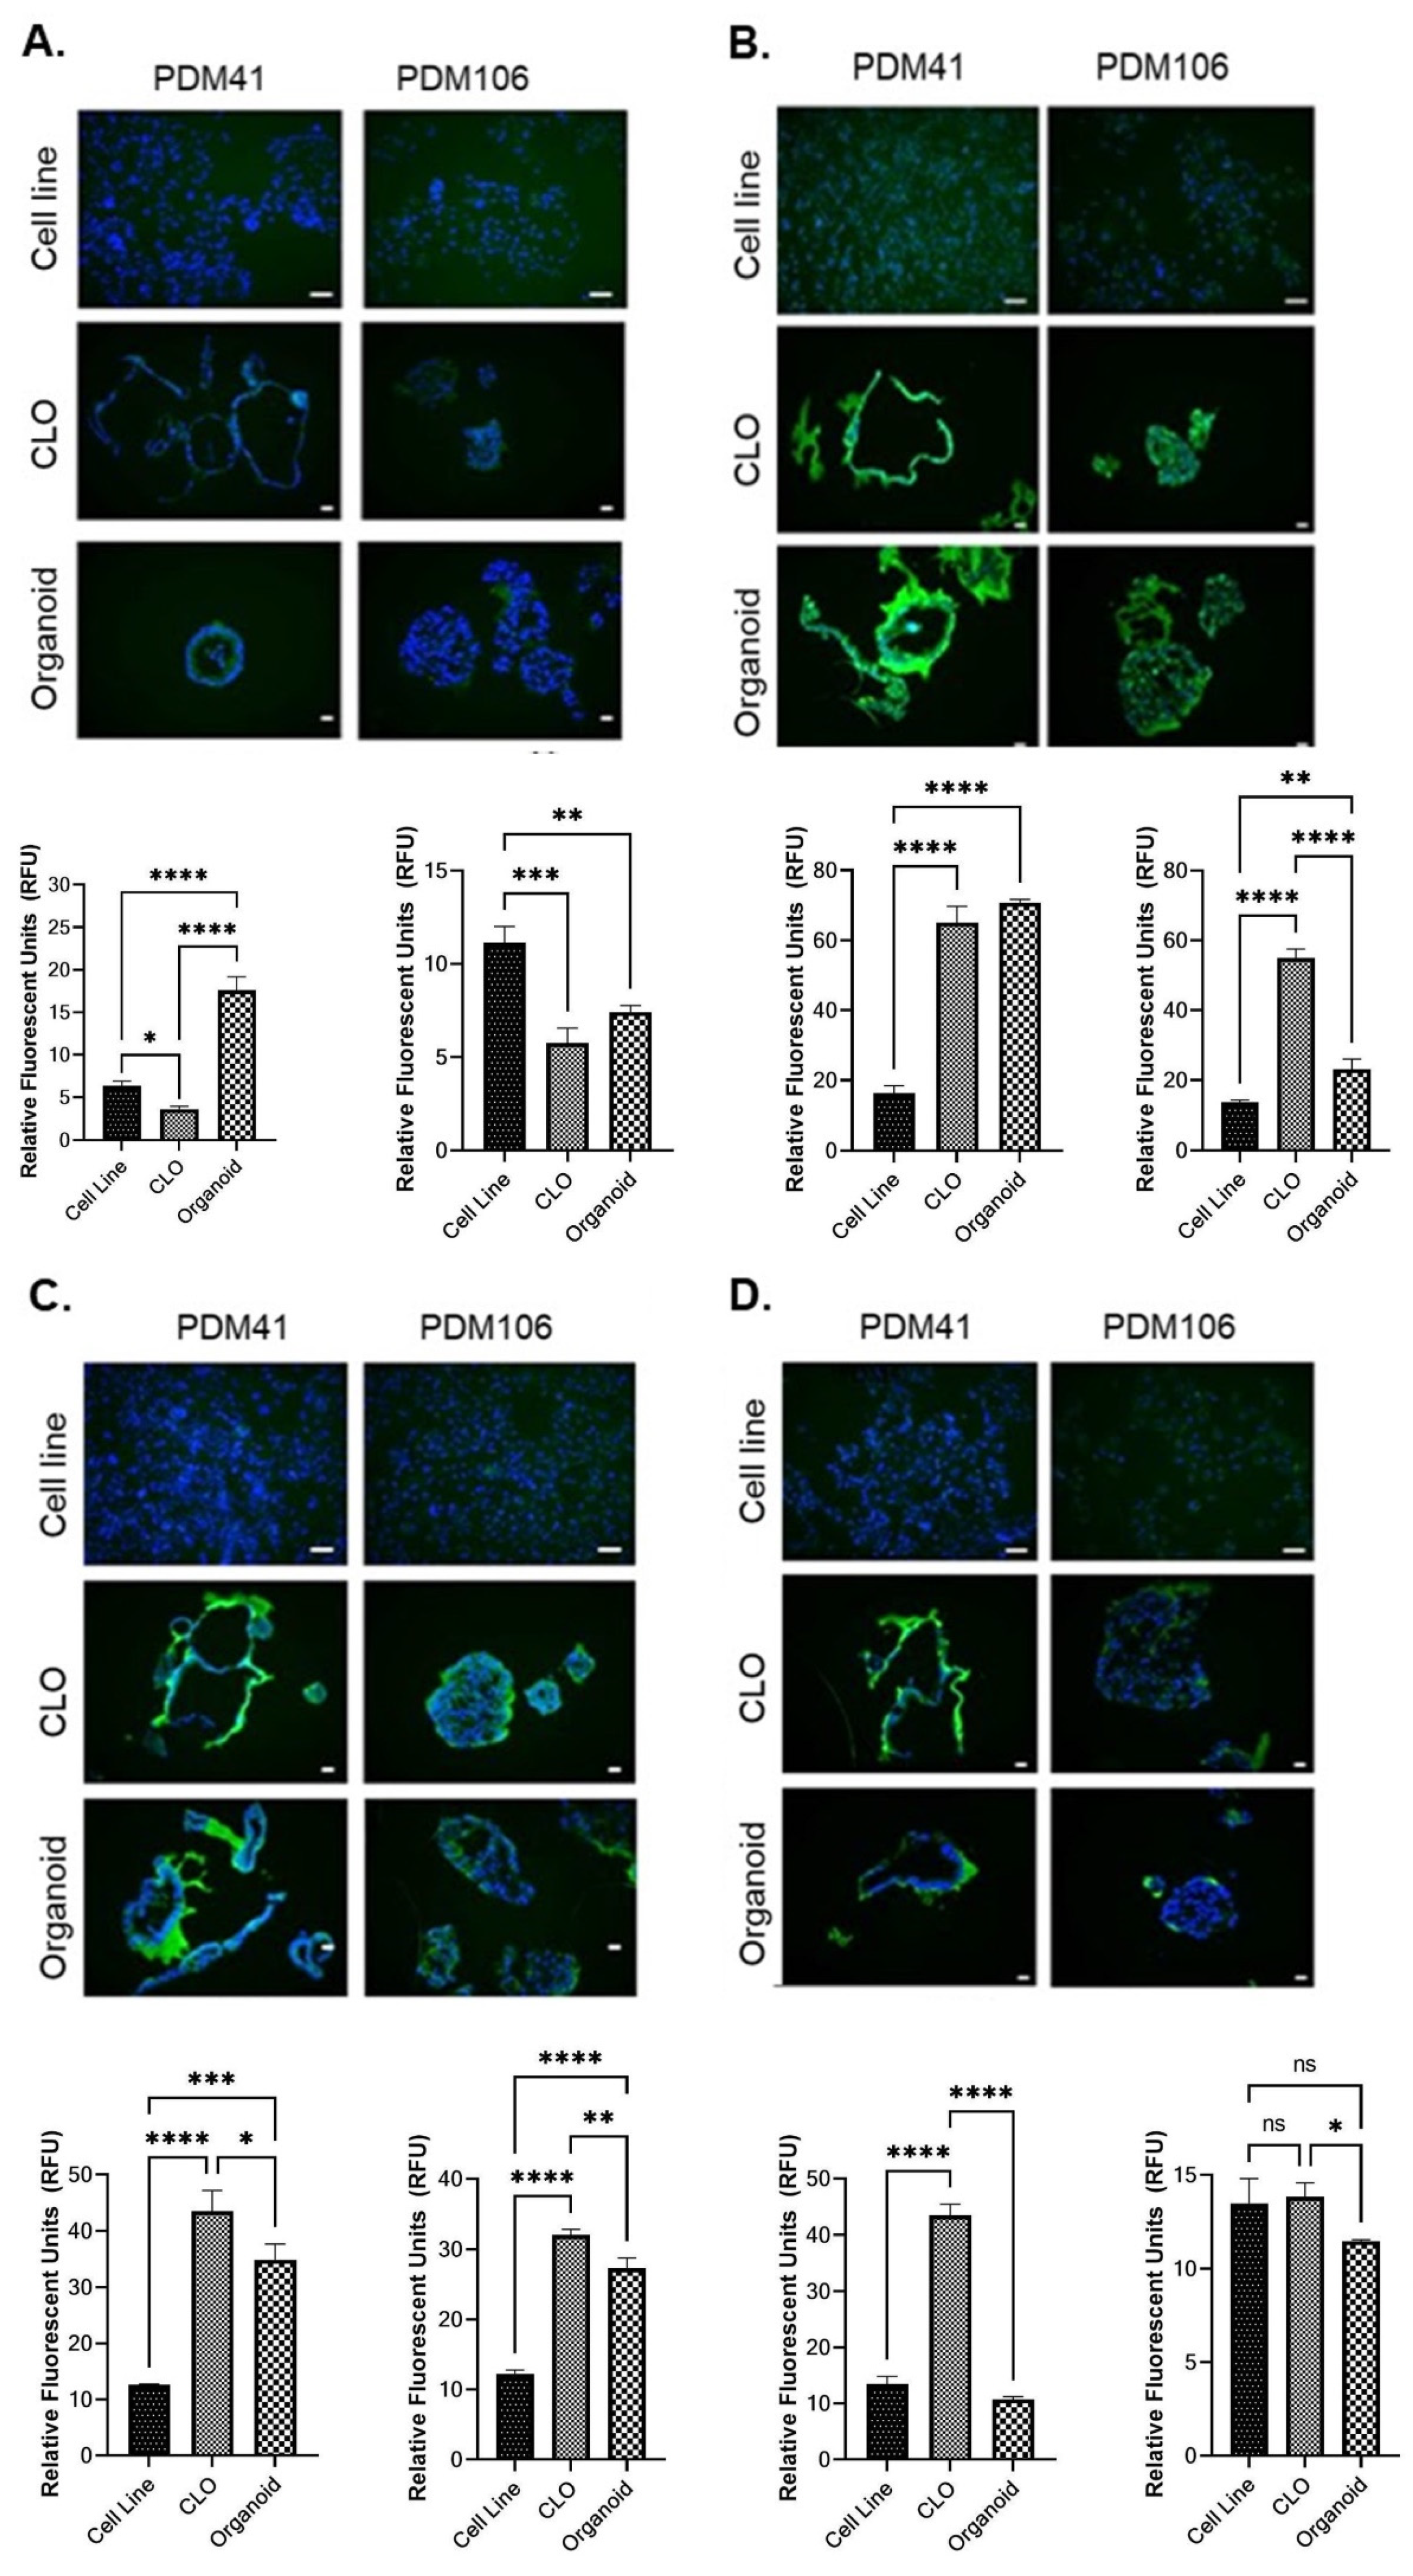
3.5. Immunofluorescence Analysis of Cancer Stem Cell Markers

Immunofluorescence was carried out to determine whether the expression profiles of pancreatic cancer stem cell markers, ALDH1A1, CXCR4, HCAM, and EpCAM, were maintained between 2D cell lines, CLOs, and organoids in the PDM41 and PDM106 models. ALDH1A1 expression was higher in 2D cell lines compared to CLO in both models (Figure 5A). Increased abundance of CXCR4 and HCAM was observed in CLOs and organoids compared to cell lines in both models (Figure 5B,C). There was no significant increase in EpCAM expression between 2D and organoids in both PDM41 and PDM106. Contradictory findings of EpCAM expression between the 2D and CLO models, where PDM41-CLO expressed 3-fold higher levels of EpCAM and PDM106-CLO had a non-significant change compared to 2D, indicated that EpCAM expression may be cell specific (Figure 5D).

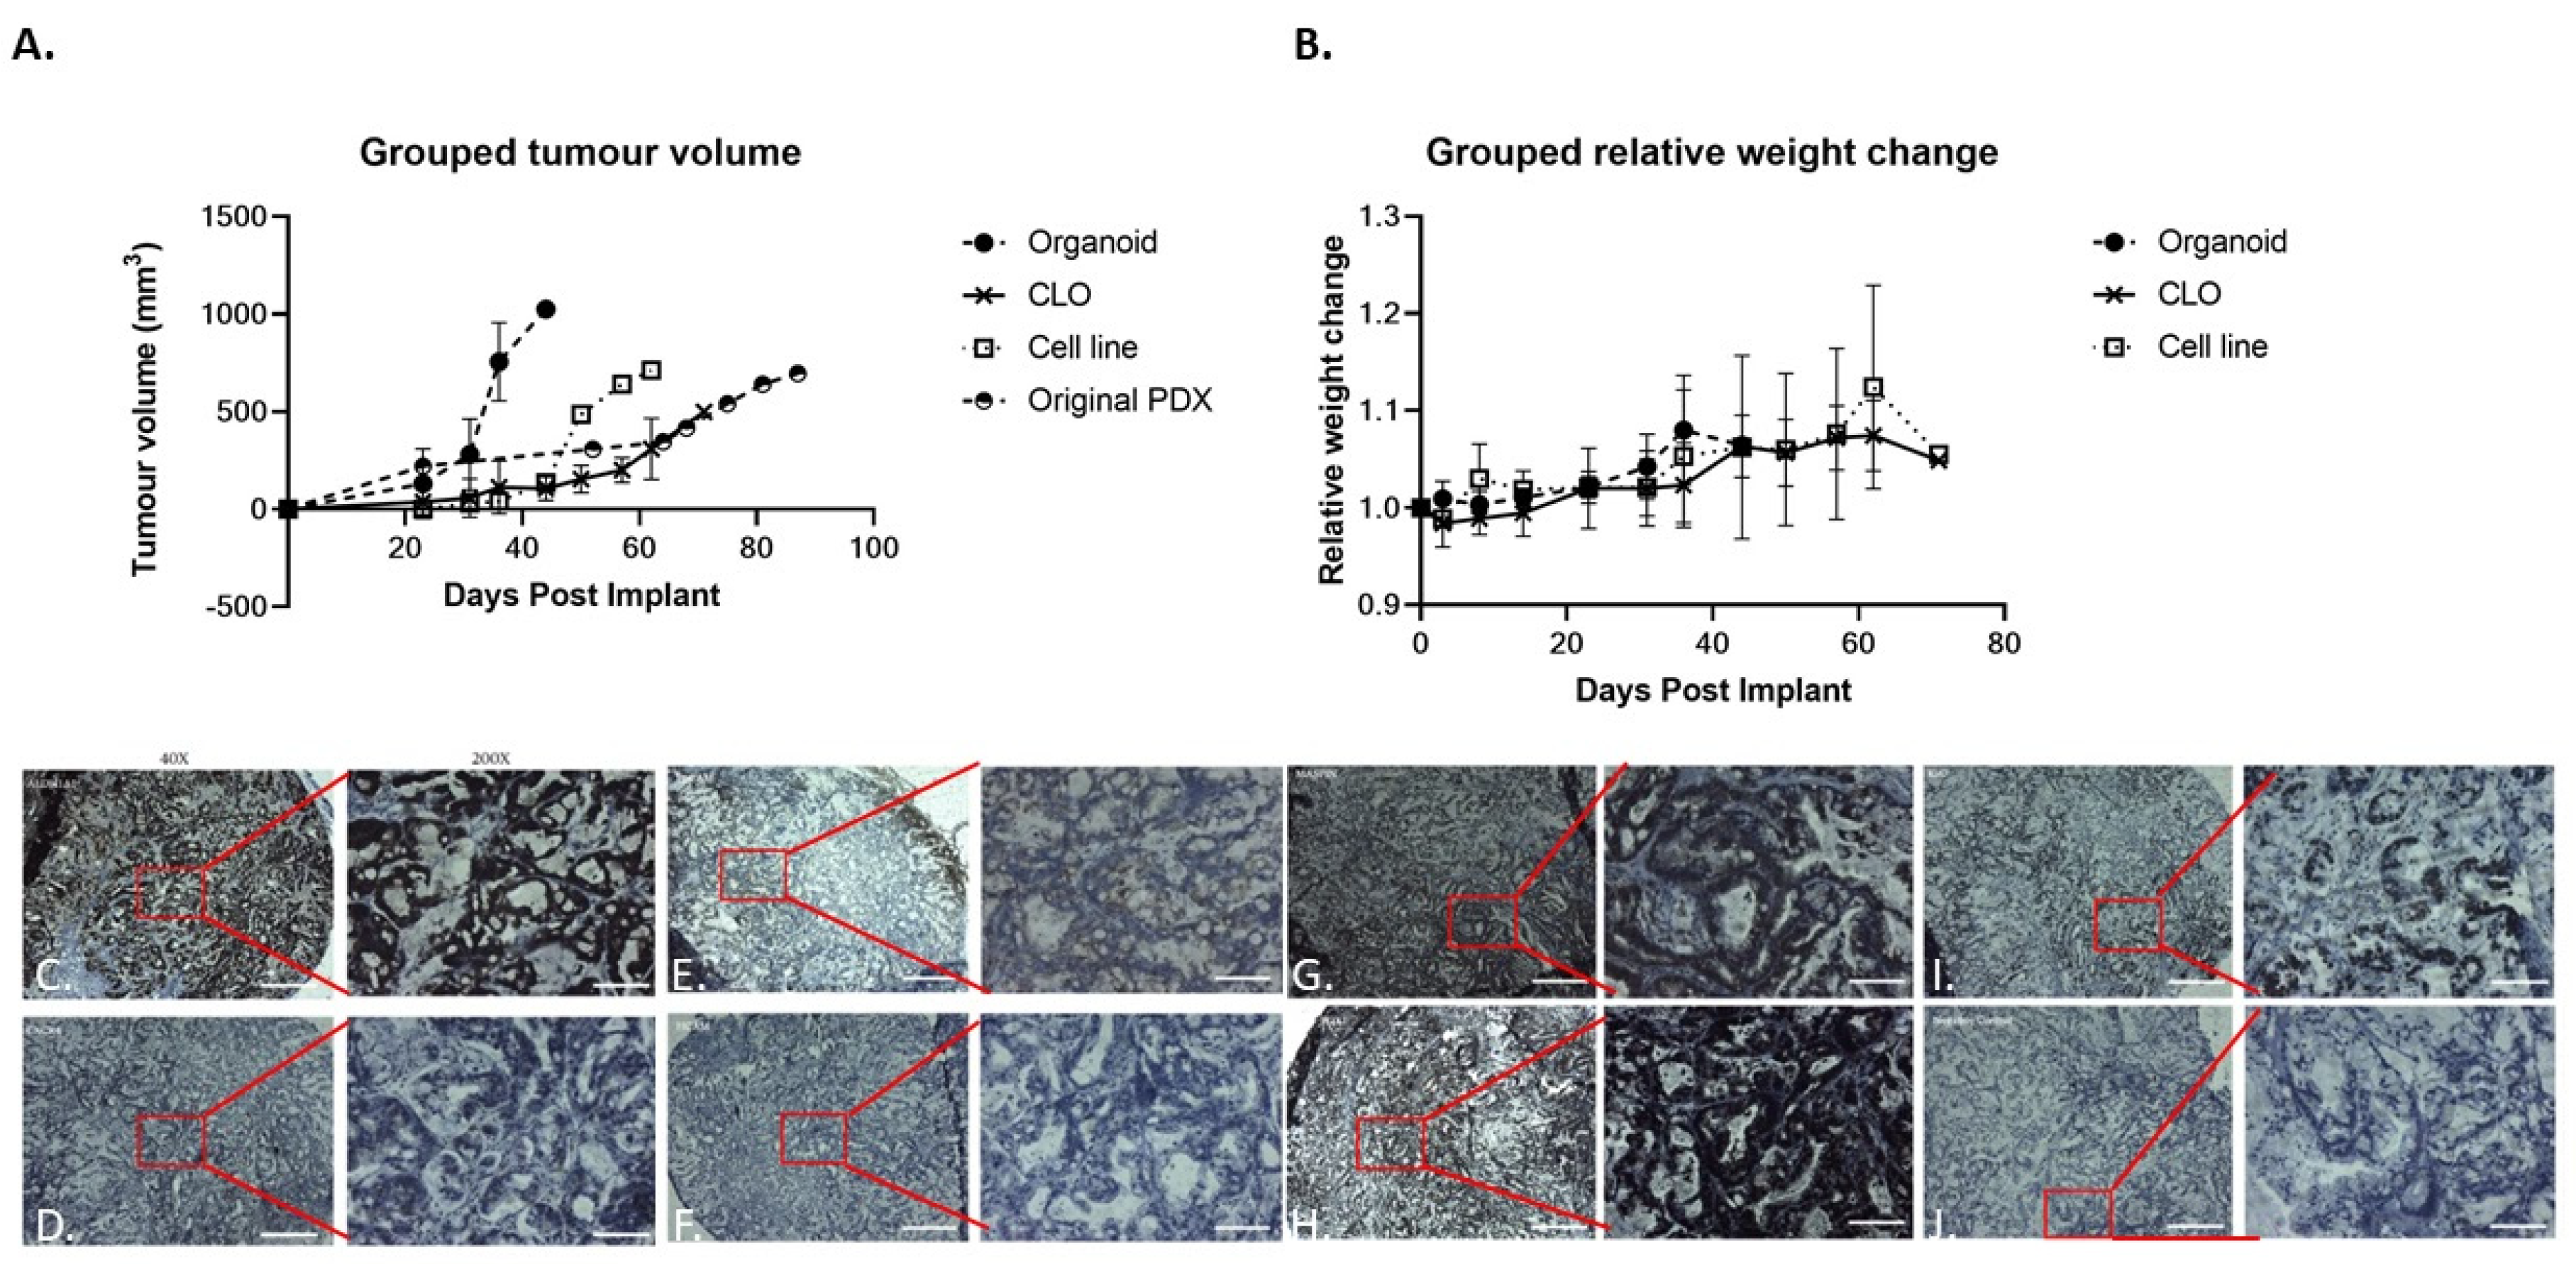
3.6. In Vivo Tumorigenesis Comparison in Novel 2D Cell Line, CLO, and Organoid

In order to assess the ability of our models to form tumours in vivo, subcutaneous injection of the 2D cells, CLOs, and organoids from our previously established PT291 models [29] into SCID immunodeficient mice was performed. In this study, all mice in the organoid and CLO groups developed tumours; however, only one of the mice implanted with the 2D cell line developed a measurable tumour. The proliferation rates of the PT291 models are shown in Supplementary Figure S1. The original PT291 PDX in vivo tumour growth is included for comparison [32] (Figure 6A). There was no significant difference in weight change between models (Figure 6B).
H&E staining of the tumours showed the histopathology components of pancreatic cancer cells (Supplementary Figures S2 and S3). Immunohistochemistry was performed on CLOs for pancreatic cancer stem cell markers ALDH1A1, CXCR4, EpCAM, and HCAM; pancreatic cancer markers MASPIN and PDX1; and the proliferation marker Ki67. Strong expression of ALDH1A1, but low levels of CXCR4, EpCAM, and no expression of HCAM were observed (Figure 6C–F). Pancreatic cancer markers MASPIN and PDX1 were strongly expressed (Figure 6G,H). Intense nuclear staining was observed for Ki67 in staining in CLO xenografts (Figure 6I). These findings suggest that the CLOs have the capacity to form tumours in vivo and maintain the expression of pancreatic cancer and cancer stem cell markers.

4. Discussion

The absence of representative in vitro tumour models is one of the obstacles to the study of disease progression and the development of effective treatments in PDAC. As it is simple to use, inexpensive, and highly replicable, 2D cell culture is a vital model in cancer research and drug screening; however, there are several limitations associated with it [33], as 2D culture can cause genetic mutations as well as rapid changes in the polarity and morphology of the cells. Furthermore, as cells adhere and grow into a single layer on the flat surface, traditional 2D cell culture does not offer an adequate in vivo environment as it fails to resemble the complex natural microenvironment experienced by cells in the tumour [34]. In addition, as cells in 2D monolayers receive the same amount of nutrients and growth factors in the medium, they tend to have homogenous growth and proliferation. This causes more cells to be in the same stage of the cell cycle, which does not mimic the heterogeneous nature of the tumours [33,35]. Novel 3D cell culture systems have overcome these limitations. They provide the spatial cell–cell interactions and cell–ECM interactions and represent more accurate in vivo models. These interactions play vital roles in different cellular functions, including cell differentiation, proliferation, vitality, expression of genes and proteins, and drug metabolism [36].
Although organoids are considered a more representative model of PDAC, their usefulness could be limited due to difficulties in obtaining patient samples as well as their time-consuming maintenance. In this present study, we illustrate the possibility of establishing a culture methodology for 2.5D cell lines for scale-up to CLOs and the long-term culture of 2D cell lines derived from established PDOs. We performed detailed comparative experiments assessing the morphology and phenotypic characteristics, such as proliferation rates, chemotherapeutic drug sensitivity, stem cell, and CSC markers, and in vivo growth and protein expression analysis of isogenic 2D cell lines, CLOs, and organoids.
Previous studies have shown that cells grown in 2D versus 3D have different proliferation rates and sensitivity levels to chemotherapeutic drugs, with 3D spheroid models showing increased levels of drug resistance [37,38]. In our study, the organoids and matched CLOs had similar proliferation rates and displayed increased sensitivity to treatment with 5-FU, cisplatin, and nab-paclitaxel compared to their isogenic 2D matched cell line. In accordance with our findings, a recent study by Christian et al. showed that 22 of 26 compounds in a drug screen were potent in the majority of PDAC organoid lines, but most compounds were not active in 2D cancer cell lines, confirming that the culture environment has a strong influence on drug responses [39].
Stem-cell-related pluripotency genes, such as NANOG, OCT4, and SOX2, are expressed in aggressive cancers that show resistance to clinical treatments, resulting in poor survival. These transcription factors control the expression of pluripotent factors and can reduce the expression of lineage-specific genes [31,32,40]. We observed an upregulation of key stem cell markers and transcription factors, NANOG, OCT4, and SOX2, in CLOs compared to 2D primary cultures, indicating a pluripotent stem cell state in these models. In addition, CSCs are considered one of the main drivers of tumour heterogeneity and malignancy. These cells are involved in cancer progression, recurrence, metastasis, and resistance to anti-cancer therapies. CSCs in various tumour types express specific surface markers, which are used to isolate and characterise these populations. Different surface markers such as CD24, HCAM, CXCR4, CD133, and EpCAM (epithelial specific antigen, ESA) are commonly used to identify CSCs in PDAC [14,41,42].
Molecular profiling of cancer stem cell markers CXCR4, EpCAM, HCAM, and ALDH1A1 was performed in our models. CXCR4 and CXCL12 of the chemokine signalling network promote PDAC tumour growth, invasion, chemoresistance, and metastasis by regulating the tumour microenvironment through complex crosstalk with Akt, ERK, c-myc, β-catenin, NFκβ, and p53 signalling pathways. CXCR4/CXCL12 expression is involved in the early stages of pancreatic carcinogenesis in PanINs and maintained into later phases during disease progression [43,44]. We observed consistent low expression of CXCR4 in the 2D cell line models compared to increased expression in the isogenic organoid and CLO models. Hypoxia and HIF1ɑ have been shown to promote the expression of CXCR4 in PDAC and glioblastoma [45,46]. PDAC tumours tend to display significantly more hypoxia compared to other solid tumours; under oxygen limited conditions, hypoxia-inducible pathways are activated, initiating a cascade of signalling events that promote the aggressiveness of pancreatic cancer [47], and 3D organoids display a hypoxic core mimicking the tumour microenvironment gradients [48], which further validates our use of organoids and CLOs as in vitro models of pancreatic cancer.
EpCAM/ESA is specifically expressed in epithelial tissue and overexpressed in numerous epithelial-derived tumours such as those of the pancreas, stomach, lung, kidney, breast, and liver [49]. EpCAM is thought to participate in cellular proliferation, cell signalling pathways, migration, and differentiation, as well as in metastasis and cancer stem cells possibly through regulation of the PTEN/AKT/mTOR pathways [40,50]. In pancreatic cancer, overexpression of EpCAM is associated with a shorter overall survival rate [51]. Li et al. found that the subpopulation of CD44+CD24+ESA+ pancreatic cancer cells had stem cell-like characteristics of self-renewal, exhibited increased tumorigenic potential, and had elevated expression of the developmental signalling molecule sonic hedgehog [41]. The expression of the transmembrane glycoprotein EpCAM was retained in our 2D and 3D models but showed cell-dependent expression. Although EpCAM is known to be highly expressed in PDAC and established cell lines [52], studies showed that breast cancer cells with a mesenchymal phenotype are independent of EpCAM in invasion processes and tumour progression [53]. Moreover, overexpression of EpCAM in vivo inhibited the invasive growth of fibroblastic L-cells and dedifferentiated mammary carcinoma L153S cells [54].
HCAM, also known as CD44, is an adhesion molecule involved in cell–cell and cell–matrix adhesion, as well as cellular growth and differentiation. HCAM is a known CSC marker, plays an important role in inducing EMT, and correlates to a more mesenchymal phenotype in cancer [55]. Expression of HCAM was highly expressed in all three organoid and CLO models compared to isogenic 2D cell lines. We observed a similar low HCAM expression in the PT291 2D cell line and matched CLO (Supplementary Figure S3), which was also confirmed in the in vivo PT291-CLO xenograft. Studies in prostate cancer showed that higher expression of HCAM may be cell type dependent rather than related to culture conditions, suggesting that PT291 may have a more epithelial than mesenchymal phenotype [56].
Functional markers are also used to identify CSCs within the tumour. A clinical study of patients with pancreatic cancer showed that ALDH+ pancreatic tumour cells are associated with metastatic disease progression and shortened overall survival, suggesting ALDH expression as a prognostic marker of PDAC [57]. ALDH1A1 is involved in retinoic acid metabolism and has a role in proliferation and differentiation [58]. High expression levels of ALDH1A1 were observed in the PDM41 organoids but reduced expression in the isogenic 2D cell lines and CLOs. High expression levels of ALDH1A1 were also observed in the PT291 PDO xenograft.
Finally, to assess if the organoids, CLOs, and 2D cell lines retained their original tumour characteristics after being propagated long-term as organoids, the PT291 2D cell line, CLO, and organoid models were re-implanted as subcutaneous xenografts. All cell models resulted in tumour growth, with measurable tumours for the organoid and CLO tumours forming. Interestingly, organoid tumours grew faster than the matched CLO tumours. H&E staining showed clear morphological differences between the tumours developed from the PT291 organoid, cell line, and CLO. The organoids and cell lines developed large cell clusters with no tumour-like structures forming; however, the CLO tumours formed adenocarcinomas with atypical cells, glands, and/or a desmoplastic stroma, and are more representative of an in vivo tumour. Sylvia et al. showed that orthotopic implantation of PDOs resulted in the organoid progressing through all stages of tumour development, from PanIN to a PDAC tumour [59].

5. Conclusions

In conclusion, this study is the first to generate PDAC 2D and 3D CLOs that are isogenic and derived from PDAC PDOs. We show that the CLOs represent the histological architecture of PDAC and retain the phenotypic and molecular features of PDOs. The CLOs showed a similar sensitivity response to chemotherapeutic agents with their derived 3D PDOs compared to 2D cell lines. Furthermore, the CLOs demonstrated tumorigenesis in vivo and maintained the expression pattern of PDAC markers. These results suggest that our established CLO culture method can be used as an expandable, easy scale-up, affordable, and less time-consuming research model mirroring 3D organoid studies to investigate the mechanisms of PDAC.

Supplementary Materials

The following supporting information can be downloaded at: https://www.mdpi.com/article/10.3390/organoids1020013/s1, Figure S1: Percentage of confluence of the cell lines PDM37-CL, PDM41-CL, PDM106-CL and PT291-CL, Figure S2: H&E staining of PT291 Cell line, CLO and organoid in SCID mice. Figure S3: Images of immunofluorescence staining of HCAM (green/red) and counterstained with DAPI (blue) in PT291 matched cell line, CLOs and organoids.

Author Contributions

N.W and S.R.N. performed study concept and design; S.N., E.S. and N.W. performed development of methodology and writing, review, and revision of the paper; L.P., J.S., A.U., N.T.C., J.M., S.R., F.O., S.R.N., S.N. and N.W. provided acquisition, analysis, and interpretation of data, and statistical analysis; M.B.C. and N.S. provided pathology technical support. All authors have read and agreed to the published version of the manuscript.

Funding

This research was supported by a research grant from Science Foundation Ireland (SFI) under the Starting Investigator Research Grant (SIRG) Programme [Grant number 15/SIRG/3482] and the Pancreatic Cancer Research Fund. The authors also acknowledge PRECODE (the European Union’s Horizon 2020 research and innovation programme under the Marie Sklodowska-Curie grant agreement Nº 861196).

Institutional Review Board Statement

All animal work has received ethical approval from the DCU Research Ethics Committee (DCUREC/2012/202) and the Health Products Regulatory Authority (HPRA) under project authorisation AE19115/P023. All methods were performed in accordance with the relevant guidelines and regulations, in compliance with the DCU Research Ethics Committee and the Department of Health.

Informed Consent Statement

Not applicable.

Data Availability Statement

Not applicable.

Acknowledgments

Confocal imaging was carried out at the Nano Research Facility in Dublin City University, which was funded under the Programme for Research in Third Level Institutions (PRTLI) Cycle 5. The PRTLI is co-funded through the European Regional Development Fund (ERDF), part of the European Union Structural Funds Programme 2011–2015.

Conflicts of Interest

The authors declare no conflict of interest.

References

  1. Rahib, L.; Smith, B.D.; Aizenberg, R.; Rosenzweig, A.B.; Fleshman, J.M.; Matrisian, L.M. Projecting cancer incidence and deaths to 2030: The unexpected burden of thyroid, liver, and pancreas cancers in the United States. Cancer Res. 2014, 74, 2913–2921. [Google Scholar] [CrossRef] [Green Version]
  2. Siegel, R.L.; Miller, K.D.; Jemal, A. Cancer statistics, 2016. CA Cancer J. Clin. 2016, 66, 7–30. [Google Scholar] [CrossRef] [PubMed] [Green Version]
  3. Ushio, J.; Kanno, A.; Ikeda, E.; Ando, K.; Nagai, H.; Miwata, T.; Kawasaki, Y.; Tada, Y.; Yokoyama, K.; Numao, N.; et al. Pancreatic Ductal Adenocarcinoma: Epidemiology and Risk Factors. Diagnostics 2021, 11, 562. [Google Scholar] [CrossRef]
  4. Hackeng, W.M.; Hruban, R.H.; Offerhaus, G.J.A.; Brosens, L.A.A. Surgical and molecular pathology of pancreatic neoplasms. Diagn. Pathol. 2016, 11, 47. [Google Scholar] [CrossRef] [PubMed] [Green Version]
  5. Raphael, B.J.; Hruban, R.H.; Aguirre, A.J.; Moffitt, R.A.; Yeh, J.J.; Stewart, C.; Robertson, A.G.; Cherniack, A.D.; Gupta, M.; Getz, G.; et al. Integrated Genomic Characterization of Pancreatic Ductal Adenocarcinoma. Cancer Cell 2017, 32, 185–203. [Google Scholar] [CrossRef] [PubMed] [Green Version]
  6. Jones, S.; Zhang, X.; Parsons, D.W.; Lin, J.C.-H.; Leary, R.J.; Angenendt, P.; Mankoo, P.; Carter, H.; Kamiyama, H.; Jimeno, A.; et al. Core Signaling Pathways in Human Pancreatic Cancers Revealed by Global Genomic Analyses. Science 2008, 321, 1801–1806. [Google Scholar] [CrossRef] [Green Version]
  7. Gillen, S.; Schuster, T.; Büschenfelde, C.M.Z.; Friess, H.; Kleeff, J. Preoperative/Neoadjuvant Therapy in Pancreatic Cancer: A Systematic Review and Meta-analysis of Response and Resection Percentages. PLoS Med. 2010, 7, e1000267. [Google Scholar] [CrossRef] [Green Version]
  8. La Torre, M.; Nigri, G.; Cavallini, M.; Mercantini, P.; Ziparo, V.; Ramacciato, G. The Glasgow Prognostic Score as a Predictor of Survival in Patients with Potentially Resectable Pancreatic Adenocarcinoma. Ann. Surg. Oncol. 2012, 19, 2917–2923. [Google Scholar] [CrossRef]
  9. Nishio, K.; Kimura, K.; Amano, R.; Yamazoe, S.; Ohrira, G.; Nakata, B.; Hirakawa, K.; Ohira, M. Preoperative predictors for early recurrence of resectable pancreatic cancer. World J. Surg. Oncol. 2017, 15, 16. [Google Scholar] [CrossRef] [Green Version]
  10. Adamska, A.; Domenichini, A.; Falasca, M. Pancreatic Ductal Adenocarcinoma: Current and Evolving Therapies. Int. J. Mol. Sci. 2017, 18, 1338. [Google Scholar] [CrossRef]
  11. Christenson, E.S.; Jaffee, E.; Azad, N.S. Current and emerging therapies for patients with advanced pancreatic ductal adenocarcinoma: A bright future. Lancet Oncol. 2020, 21, e135–e145. [Google Scholar] [CrossRef] [PubMed]
  12. Nevala-Plagemann, C.; Hidalgo, M.; Garrido-Laguna, I. From state-of-the-art treatments to novel therapies for advanced-stage pancreatic cancer. Nat. Rev. Clin. Oncol. 2020, 17, 108–123. [Google Scholar] [CrossRef] [PubMed]
  13. Liang, C.; Shi, S.; Meng, Q.; Liang, D.; Ji, S.; Zhang, B.; Qin, Y.; Xu, J.; Ni, Q.; Yu, X. Complex roles of the stroma in the intrinsic resistance to gemcitabine in pancreatic cancer: Where we are and where we are going. Exp. Mol. Med. 2017, 49, e406. [Google Scholar] [CrossRef] [PubMed] [Green Version]
  14. Ishiwata, T.; Matsuda, Y.; Yoshimura, H.; Sasaki, N.; Ishiwata, S.; Ishikawa, N.; Takubo, K.; Arai, T.; Aida, J. Pancreatic cancer stem cells: Features and detection methods. Pathol. Oncol. Res. 2018, 24, 797–805. [Google Scholar] [CrossRef] [PubMed]
  15. Quiñonero, F.; Mesas, C.; Doello, K.; Cabeza, L.; Perazzoli, G.; Jimenez-Luna, C.; Rama, A.R.; Melguizo, C.; Prados, J. The challenge of drug resistance in pancreatic ductal adenocarcinoma: A current overview. Cancer Biol. Med. 2019, 16, 688–699. [Google Scholar] [CrossRef]
  16. Stopa, K.B.; Kusiak, A.A.; Szopa, M.D.; Ferdek, P.E.; Jakubowska, M.A. Pancreatic Cancer and Its Microenvironment—Recent Advances and Current Controversies. Int. J. Mol. Sci. 2020, 21, 3218. [Google Scholar] [CrossRef]
  17. Knudsen, E.S.; Balaji, U.; Mannakee, B.; Vail, P.; Eslinger, C.; Moxom, C.; Mansour, J.; Witkiewicz, A.K. Pancreatic cancer cell lines as patient-derived avatars: Genetic characterisation and functional utility. Gut 2018, 67, 508–520. [Google Scholar] [CrossRef] [Green Version]
  18. Hosein, A.N.; Brekken, R.A.; Maitra, A. Pancreatic cancer stroma: An update on therapeutic targeting strategies. Nat. Rev. Gastroenterol. Hepatol. 2020, 17, 487–505. [Google Scholar] [CrossRef]
  19. Wang, S.; Gao, D.; Chen, Y. The potential of organoids in urological cancer research. Nat. Rev. Urol. 2017, 14, 401–414. [Google Scholar] [CrossRef]
  20. Watters, K.M.; Bajwa, P.; Kenny, H.A. Organotypic 3D Models of the Ovarian Cancer Tumor Microenvironment. Cancers 2018, 10, 265. [Google Scholar] [CrossRef]
  21. Kim, M.; Mun, H.; Sung, C.O.; Cho, E.J.; Jeon, H.-J.; Chun, S.-M.; Jung, D.J.; Shin, T.H.; Jeong, G.S.; Kim, D.K.; et al. Patient-derived lung cancer organoids as in vitro cancer models for therapeutic screening. Nat. Commun. 2019, 10, 3991. [Google Scholar] [CrossRef] [Green Version]
  22. Bs, A.M.G.; Ci, X.; Lin, D.; Wang, Y. A synopsis of prostate organoid methodologies, applications, and limitations. Prostate 2020, 80, 518–526. [Google Scholar] [CrossRef]
  23. Seidlitz, T.; Koo, B.-K.; Stange, D.E. Gastric organoids—An in vitro model system for the study of gastric development and road to personalized medicine. Cell Death Differ. 2021, 28, 68–83. [Google Scholar] [CrossRef]
  24. Linkous, A.; Balamatsias, D.; Snuderl, M.; Edwards, L.; Miyaguchi, K.; Milner, T.; Reich, B.; Cohen-Gould, L.; Storaska, A.; Nakayama, Y.; et al. Modeling Patient-Derived Glioblastoma with Cerebral Organoids. Cell Rep. 2019, 26, 3203–3211. [Google Scholar] [CrossRef] [PubMed] [Green Version]
  25. Reidy, E.; Leonard, N.; Treacy, O.; Ryan, A. A 3D View of Colorectal Cancer Models in Predicting Therapeutic Responses and Resistance. Cancers 2021, 13, 227. [Google Scholar] [CrossRef] [PubMed]
  26. Dekkers, J.F.; van Vliet, E.J.; Sachs, N.; Rosenbluth, J.M.; Kopper, O.; Rebel, H.G.; Wehrens, E.J.; Piani, C.; Visvader, J.E.; Verissimo, C.S.; et al. Long-term culture, genetic manipulation and xenotransplantation of human normal and breast cancer organoids. Nat. Protoc. 2021, 16, 1936–1965. [Google Scholar] [CrossRef] [PubMed]
  27. Brooks, A.; Liang, X.; Zhang, Y.; Zhao, C.-X.; Roberts, M.S.; Wang, H.; Zhang, L.; Crawford, D.H. Liver organoid as a 3D in vitro model for drug validation and toxicity assessment. Pharmacol. Res. 2021, 169, 105608. [Google Scholar] [CrossRef]
  28. Clevers, H. Modeling Development and Disease with Organoids. Cell 2016, 165, 1586–1597. [Google Scholar] [CrossRef] [Green Version]
  29. Nelson, S.R.; Zhang, C.; Roche, S.; O’Neill, F.; Swan, N.; Luo, Y.; Larkin, A.; Crown, J.; Walsh, N. Modelling of pancreatic cancer biology: Transcriptomic signature for 3D PDX-derived organoids and primary cell line organoid development. Sci. Rep. 2020, 10, 2778. [Google Scholar] [CrossRef] [Green Version]
  30. Herreros-Villanueva, M.; Bujanda, L.; Billadeau, D.D.; Zhang, J.-S. Embryonic stem cell factors and pancreatic cancer. World J. Gastroenterol. 2014, 20, 2247–2254. [Google Scholar] [CrossRef]
  31. Gzil, A.; Zarębska, I.; Bursiewicz, W.; Antosik, P.; Grzanka, D.; Szylberg, Ł. Markers of pancreatic cancer stem cells and their clinical and therapeutic implications. Mol. Biol. Rep. 2019, 46, 6629–6645. [Google Scholar] [CrossRef] [PubMed] [Green Version]
  32. Roche, S.; O’Neill, F.; Murphy, J.; Swan, N.; Meiller, J.; Conlon, N.T.; Geoghegan, J.; Conlon, K.; McDermott, R.; Rahman, R.; et al. Establishment and Characterisation by Expression Microarray of Patient-Derived Xenograft Panel of Human Pancreatic Adenocarcinoma Patients. Int. J. Mol. Sci. 2020, 21, 962. [Google Scholar] [CrossRef] [PubMed] [Green Version]
  33. Jensen, C.; Teng, Y. Is It Time to Start Transitioning From 2D to 3D Cell Culture? Front. Mol. Biosci. 2020, 7, 33. [Google Scholar] [CrossRef] [PubMed] [Green Version]
  34. Kapałczyńska, M.; Kolenda, T.; Przybyła, W.; Zajączkowska, M.; Teresiak, A.; Filas, V.; Ibbs, M.; Bliźniak, R.; Łuczewski, L.; Lamperska, K. 2D and 3D cell cultures—A comparison of different types of cancer cell cultures. Arch. Med. Sci. 2018, 14, 910–919. [Google Scholar] [CrossRef]
  35. Edmondson, R.; Broglie, J.J.; Adcock, A.F.; Yang, L. Three-Dimensional Cell Culture Systems and Their Applications in Drug Discovery and Cell-Based Biosensors. ASSAY Drug Dev. Technol. 2014, 12, 207–218. [Google Scholar] [CrossRef] [Green Version]
  36. Duval, K.; Grover, H.; Han, L.-H.; Mou, Y.; Pegoraro, A.F.; Fredberg, J.; Chen, Z. Modeling Physiological Events in 2D vs. 3D Cell Culture. Physiology 2017, 32, 266–277. [Google Scholar] [CrossRef] [Green Version]
  37. Adcock, A.F.; Trivedi, G.; Edmondson, R.; Yang, C.S.A.L. Three-Dimensional (3D) Cell Cultures in Cell-based Assays for in-vitro Evaluation of Anticancer Drugs. J. Anal. Bioanal. Tech. 2015, 6, 1. [Google Scholar] [CrossRef]
  38. Durand, R.E.; Olive, P.L. Resistance of tumor cells to chemo- and radiotherapy modulated by the three-dimensional architecture of solid tumors and spheroids. Methods Cell Biol. 2001, 64, 211–233. [Google Scholar] [CrossRef]
  39. Hirt, C.K.; Booij, T.H.; Grob, L.; Simmler, P.; Toussaint, N.C.; Keller, D.; Taube, D.; Ludwig, V.; Goryachkin, A.; Pauli, C.; et al. Drug screening and genome editing in human pancreatic cancer organoids identifies drug-gene interactions and candidates for off-label therapy. Cell Genom. 2022, 2, 100095. [Google Scholar] [CrossRef]
  40. Patil, K.; Khan, F.B.; Akhtar, S.; Ahmad, A.; Uddin, S. The plasticity of pancreatic cancer stem cells: Implications in therapeutic resistance. Cancer Metastasis Rev. 2021, 40, 691–720. [Google Scholar] [CrossRef]
  41. Li, C.; Heidt, D.G.; Dalerba, P.; Burant, C.F.; Zhang, L.; Adsay, V.; Wicha, M.; Clarke, M.F.; Simeone, D.M. Identification of Pancreatic Cancer Stem Cells. Cancer Res. 2007, 67, 1030–1037. [Google Scholar] [CrossRef] [PubMed] [Green Version]
  42. Hermann, P.C.; Huber, S.L.; Herrler, T.; Aicher, A.; Ellwart, J.W.; Guba, M.; Bruns, C.J.; Heeschen, C. Distinct Populations of Cancer Stem Cells Determine Tumor Growth and Metastatic Activity in Human Pancreatic Cancer. Cell Stem Cell 2007, 1, 313–323. [Google Scholar] [CrossRef] [PubMed] [Green Version]
  43. Morimoto, M.; Matsuo, Y.; Koide, S.; Tsuboi, K.; Shamoto, T.; Sato, T.; Saito, K.; Takahashi, H.; Takeyama, H. Enhancement of the CXCL12/CXCR4 axis due to acquisition of gemcitabine resistance in pancreatic cancer: Effect of CXCR4 antagonists. BMC Cancer 2016, 16, 305. [Google Scholar] [CrossRef] [Green Version]
  44. RL Sleightholm, BK Neilsen, J Li, MM Steele Emerging roles of the CXCL12/CXCR4 axis in pancreatic cancer progression and therapy. Pharmacol. Ther. 2017, 179, 158–170. [CrossRef] [PubMed]
  45. Sun, J.-S.; Zhang, X.-L.; Yang, Y.-J.; Nie, Z.-G.; Zhang, Y. Hypoxia promotes C-X-C chemokine receptor type 4 expression through microRNA-150 in pancreatic cancer cells. Oncol. Lett. 2015, 10, 835–840. [Google Scholar] [CrossRef] [PubMed] [Green Version]
  46. Zagzag, D.; Lukyanov, Y.; Lan, L.; Ali, M.A.; Esencay, M.; Mendez, O.; Yee, H.; Voura, E.B.; Newcomb, E.W. Hypoxia-inducible factor 1 and VEGF upregulate CXCR4 in glioblastoma: Implications for angiogenesis and glioma cell invasion. Lab. Investig. 2006, 86, 1221–1232. [Google Scholar] [CrossRef] [PubMed] [Green Version]
  47. Erkan, M.; Kurtoglu, M.; Kleeff, J. The role of hypoxia in pancreatic cancer: A potential therapeutic target? Expert Rev. Gastroenterol. Hepatol. 2016, 10, 301–316. [Google Scholar] [CrossRef]
  48. Hubert, C.G.; Rivera, M.; Spangler, L.C.; Wu, Q.; Mack, S.C.; Prager, B.C.; Couce, M.; McLendon, R.E.; Sloan, A.E.; Rich, J.N. A Three-Dimensional Organoid Culture System Derived from Human Glioblastomas Recapitulates the Hypoxic Gradients and Cancer Stem Cell Heterogeneity of Tumors Found In Vivo. Cancer Res. 2016, 76, 2465–2477. [Google Scholar] [CrossRef] [Green Version]
  49. Patriarca, C.; Macchi, R.M.; Marschner, A.K.; Mellstedt, H. Epithelial cell adhesion molecule expression (CD326) in cancer: A short review. Cancer Treat. Rev. 2012, 38, 68–75. [Google Scholar] [CrossRef]
  50. Wang, M.-H.; Sun, R.; Zhou, X.-M.; Zhang, M.-Y.; Lu, J.-B.; Yang, Y.; Zeng, L.-S.; Yang, X.-Z.; Shi, L.; Xiao, R.-W.; et al. Epithelial cell adhesion molecule overexpression regulates epithelial-mesenchymal transition, stemness and metastasis of nasopharyngeal carcinoma cells via the PTEN/AKT/mTOR pathway. Cell Death Dis. 2018, 9, 2. [Google Scholar] [CrossRef]
  51. Fong, D.; Steurer, M.; Obrist, P.; Barbieri, V.; Margreiter, R.; Amberger, A.; Laimer, K.; Gastl, G.; Tzankov, A.; Spizzo, G. Ep-CAM expression in pancreatic and ampullary carcinomas: Frequency and prognostic relevance. J. Clin. Pathol. 2008, 61, 31–35. [Google Scholar] [CrossRef] [PubMed]
  52. Skoda, J.; Hermanova, M.; Loja, T.; Nemec, P.; Neradil, J.; Karasek, P.; Veselska, R. Co-Expression of Cancer Stem Cell Markers Corresponds to a Pro-Tumorigenic Expression Profile in Pancreatic Adenocarcinoma. PLoS ONE 2016, 11, e0159255. [Google Scholar] [CrossRef] [PubMed] [Green Version]
  53. Martowicz, A.; Spizzo, G.; Gastl, G.; Untergasser, G. Phenotype-dependent effects of EpCAM expression on growth and invasion of human breast cancer cell lines. BMC Cancer 2012, 12, 501. [Google Scholar] [CrossRef] [PubMed] [Green Version]
  54. Litvinov, S.V.; Velders, M.P.; A Bakker, H.; Fleuren, G.J.; O Warnaar, S. Ep-CAM: A human epithelial antigen is a homophilic cell-cell adhesion molecule. J. Cell Biol. 1994, 125, 437–446. [Google Scholar] [CrossRef]
  55. Wu, K.; Xu, H.; Tian, Y.; Yuan, X.; Wu, H.; Liu, Q.; Pestell, R. The role of CD44 in epithelial–mesenchymal transition and cancer development. OncoTargets Ther. 2015, 8, 3783–3792. [Google Scholar] [CrossRef] [PubMed] [Green Version]
  56. Fontana, F.; Raimondi, M.; Marzagalli, M.; Sommariva, M.; Limonta, P.; Gagliano, N. Epithelial-To-Mesenchymal Transition Markers and CD44 Isoforms Are Differently Expressed in 2D and 3D Cell Cultures of Prostate Cancer Cells. Cells 2019, 8, 143. [Google Scholar] [CrossRef] [Green Version]
  57. Rasheed, Z.A.; Yang, J.; Wang, Q.; Kowalski, J.; Freed, I.; Murter, C.; Hong, S.-M.; Koorstra, J.-B.; Rajeshkumar, N.V.; He, X.; et al. Prognostic Significance of Tumorigenic Cells With Mesenchymal Features in Pancreatic Adenocarcinoma. Gynecol. Oncol. 2010, 102, 340–351. [Google Scholar] [CrossRef]
  58. Tomita, H.; Tanaka, K.; Tanaka, T.; Hara, A. Aldehyde dehydrogenase 1A1 in stem cells and cancer. Oncotarget 2016, 7, 11018–11032. [Google Scholar] [CrossRef] [Green Version]
  59. Boj, S.F.; Hwang, C.-I.; Baker, L.A.; Chio, I.I.C.; Engle, D.D.; Corbo, V.; Jager, M.; Ponz-Sarvise, M.; Tiriac, H.; Spector, M.S.; et al. Organoid Models of Human and Mouse Ductal Pancreatic Cancer. Cell 2015, 160, 324–338. [Google Scholar] [CrossRef]
Figure 1. (A) Images taken of PDM37, PDM41, and PDM106 at day 0, day 3, day 7, and passage 1 during the development of newly generated 2.5D cell lines (CL). (B) Images taken at day 0, day 3, day 7, and day 10 of cell line organoids (CLOs) recapitulated from 2.5D cell lines. (C) Images of long-term established 2D cell lines after continuous culture (>8 passages). Magnification, 100×. Scale bar, 400 µm.
Organoids 01 00013 g001
Figure 2. (A) Percentage of confluence of cell lines PDM37-CL, PDM41-CL, and PDM106-CL cultured over 10 days. Total brightfield area of CLOs and organoids cultured over 9 days plotted as relative size (B) PDM37-CLO vs. organoids (C) PDM106-CLO vs. organoids (D) PDM41-CLO vs. organoids. Results were plotted using GraphPad Prism v8. Error bars represent the standard deviation of biological triplicate experiments.
Organoids 01 00013 g002
Figure 3. Percentage of cell viability of increasing concentrations of 5-FU, cisplatin, and nab-paclitaxel on PDM41 (AC) and PDM106 (DF) organoids, CLOs, and 2D cell lines. Percentage viability was calculated relative to an untreated control, and results were plotted using GraphPad Prism v8. Error bars represent the standard deviation of biological triplicate experiments.
Organoids 01 00013 g003
Figure 4. Quantitative analysis of the expression of selected stem cell markers NANOG, OCT4, and SOX2 in (A) PDM37, (B) PDM41, and (C) PDM106 cell lines, organoids and CLOs. Expression was normalised to 18S according to the relative quantification method (2–ΔΔCt) and graphed relative to the isogenic 2D cell line. Data were plotted using GraphPad Prism v8. Error bars represent the standard deviation of biological triplicate experiments. The significance of the difference in each group was measured by a two-tailed Student’s t-test with Welch’s correction (* p < 0.05; ** p < 0.01; ns non-significant).
Organoids 01 00013 g004
Figure 5. Images of immunofluorescence staining of (A) ALDH1A1, (B) CXCR4, (C) HCAM, and (D) EpCAM (green/red) and counterstained with DAPI (blue) in matched cell lines, CLOs, and organoids from PDM41 and PDM106. Scale bar, 100 μm. The relative fluorescent units were plotted using GraphPad Prism v8. Error bars represent the standard deviation of biological triplicate experiments. A repeated measure ANOVA was used to determine statistical significance (* p < 0.05; ** p < 0.01; *** p < 0.005; **** p < 0.0001; ns non-significant).
Organoids 01 00013 g005
Figure 6. (A) Average tumour growth of PT291 organoids (n = 3) (shaded circle), CLO (n = 3) (cross), cell line (n = 1) (open box), and original PDX tumour (n = 1) (half-shaded circle) in mice. (B) The weight of each mouse in group PT291 organoids (n = 3) (shaded circle), CLO (n = 3) (cross) and cell lines (n = 1) (open box) was normalised to weight at tumour implantation and measured throughout the study. Graphs were plotted using GraphPad Prism v8. Error bars represent the standard deviation. Immunohistochemistry of CLO tumours subcutaneously implanted in SCID mice stained with (C) ALDH1A1, (D) CXCR4, (E) EpCAM, (F) HCAM, (G) MASPIN, (H) PDX1, (I) Ki67, and (J) negative control. Magnification, 40×. Scale bar, 500 μm. The red box represents an area of 200× image magnification with a scale bar of 100 μm.
Organoids 01 00013 g006
Table 1. IC50 values of 5-FU, cisplatin, and nab-paclitaxel in PDM41 and PDM106 organoids, CLOs, and cell lines.
5-FU (µM)Cisplatin (µM)Nab-Paclitaxel (ng/mL)
PDM41
Organoids51.769.5158.24
CLOs95.0614.35190.2
Cell line324.9Not responsiveNot responsive
PDM106
Organoids164.7Not responsive380.3
CLOs144.717.43223.2
Cell line207.411.26Not responsive
Publisher’s Note: MDPI stays neutral with regard to jurisdictional claims in published maps and institutional affiliations.

