Article

Effects of Dietary β-Mannanase Supplementation on Egg Quality during Storage

by
Camila Lopes Carvalho
1,
Ines Andretta
1,*,
Gabriela Miotto Galli
1,
Nathalia de Oliveira Telesca Camargo
1,
Thais Bastos Stefanello
1,
Marcos José Migliorini
2,
Raquel Melchior
1 and
Marcos Kipper
3
1
Department of Animal Science, Faculdade de Agronomia, Universidade Federal do Rio Grande do Sul, Porto Alegre 91540000, Brazil
2
Postgraduate Program in Animal Science, State University of Santa Catarina (UDESC), Chapecó 89815630, Brazil
3
Elanco Animal Health, São Paulo 04703002, Brazil
*
Author to whom correspondence should be addressed.
Poultry 2023, 2(1), 111-122; https://doi.org/10.3390/poultry2010011
Submission received: 26 December 2022 / Revised: 17 January 2023 / Accepted: 2 March 2023 / Published: 8 March 2023
(This article belongs to the Collection Poultry Nutrition)

Abstract

:
The purpose of this study was to determine if adding β-mannanase to the diet can improve the quality of storage eggs from laying hens. Lightweight laying hens (36 weeks old), housed in cages with four birds each, were randomly assigned to one of two treatments: control group (diet without additives), or birds fed with 300 g/ton of β-mannanase. The experiment was carried out on a commercial farm (14 thousand birds). The study took 84 days to be completed, and each of its three productive phases lasted 28 days. On the final day of each phase, 125 eggs were randomly collected. The quality of the fresh eggs was assessed, and after each storage interval, the remaining eggs were kept and randomly divided to evaluate their quality (7, 14, 21, 28, 35, and 42 days). Analysis of variance was used to compare means considering differences at 5 and 10%. When compared to the control group, β-mannanase was able to prevent the loss of egg weight and albumen weight during storage (p < 0.05). Yolk color (palette) also improved by 2.5% (p < 0.001), while lightness, red intensity, and yellow intensity all increased in comparison to the control group by 1.9% (p < 0.001), 7.7% (p < 0.001), and 4.10% (p < 0.001). Additionally, compared to the control treatment, β-mannanase was able to lower the yolk pH and TBARS levels by 2.4% (p < 0.001). As a result, adding β-mannanase to laying hen diets is a successful method for enhancing egg quality.

1. Introduction

Eggs are the result of efficient biological transformation by laying hens, which are able to transform food of lower biological value into products of high nutritional quality for human consumption. However, eggs are perishable products that lose their quality in a short time if not properly handled and stored.
Shelf life is defined as the storage time during which eggs remain suitable for consumption under certain conditions of temperature, relative humidity, and handling [1,2]. The egg, being a nutrient-rich product, becomes an ideal medium for the growth of microorganisms, including pathogens [3]. Therefore, establishing the shelf life of eggs is essential to secure safety for the consumer and food quality. The diets provided for the laying hens are among many factors that can influence egg quality. Feeding can influence the internal and external characteristics of the eggs and cause physicochemical changes in the albumen and yolk, which may modify the taste, freshness, and flavor [4]. Therefore, some feeding practices can be used as alternatives to improve shelf life and egg quality [5]. Regarding this context, the effect of many ingredients and dietary nutritional levels were already studied. However, results on the antinutritive effects of some compounds on egg quality are still limited, and little scientific knowledge is available on the tools that can help producers deal with this problem.
The β-mannans are non-starch polysaccharides that exhibit anti-nutritive activity when present in poultry diets [6]. These components are found in plant cell walls and are present in many ingredients used mainly in animal feed, such as soybeans and products made from them [7]. β-mannans can also be found on the surface of microorganisms. For this reason, the animal’s innate immune system is activated by feeds containing β-mannans and responds with the proliferation of monocytes, macrophages, and dendritic cells, as well as increased production of cytokines. Those factors can cause an increase in inflammatory responses and unnecessary energy expenditure [8]. By hydrolyzing the β-mannans, the β-mannanase enzyme can avoid the anti-nutritional effects, improving immunity, allowing better digestion and nutrient absorption, in addition to limiting the growth of pathogenic bacteria [6].
Previous studies have reported improvements in egg quality when birds are fed β-mannanase [9,10]. However, to our knowledge, there are no studies on the effects on egg quality during the storage period. In this study, the effects of β-mannanase supplementation in the diet of laying hens were tested to evaluate egg quality during different storage periods.

2. Materials and Methods

2.1. Animal, Housing, and Experimental Design

The Institutional Ethics Committee on the Use of Animals (CEUA/UFRGS) under protocol number 39,783, approved this experimental protocol. One hundred cages were randomly selected in a commercial farm (Salvador do Sul, Rio Grande do Sul, Brazil) with about 14 thousand laying hens (light weight; 36 weeks old). In a complete randomized design, the replicates were allocated to two treatments: control treatment (CON; basal diet with no additives), and β-mannanase treatment (BMA; control diet supplemented with 300 g/ton of β-mannanase). The exogenous enzyme used (β-mannanase; Hemicell HT™, Elanco Animal Health, So Paulo, Brazil) is produced during the fermentation of the bacteria Paenibacillus lentus.
A corn-soybean meal diet was formulated to meet Hyline W 36 nutrient requirements [11]. In order to replace β-mannanase, kaolin was included in the basal feed. Water was provided by nipple drinkers and food by gutter feeders, and during the whole experiment, they were supplied ad libitum.
The animals remained kept in conventional sheds, that were east-west oriented, with concrete flooring masonry walls, and wire mesh ceilings. Side curtains were installed in the shed, which could be opened or closed to provide thermal comfort. The average lowest and maximum temperatures were 18 °C and 36 °C, respectively, as well as 35.8% and 94.7% relative humidity. There were 16 h of light and 8 h of darkness each day under the light regime. Throughout the course of the trial, birds were housed in galvanized wire cages that were 100 cm long by 40 cm broad by 45 cm high, with four birds per cage for a total floor surface of 500 cm2/hen.
The supplementation period lasted 84 days. This time frame was split into three distinct phases for evaluation (36–40 weeks, phase 1; 41–44 weeks, phase 2; and 45–48 weeks, phase 3). On the final day of each phase, 120 eggs from each treatment were randomly chosen and collected (240 in total).

2.2. Egg Quality Assessment

Fresh eggs’ quality was evaluated on the first day, and after each storage interval, the other eggs were maintained at 25 °C (room temperature) and randomized for quality evaluation (7, 14, 21, 28, 35, and 42 days). Weekly evaluations of 15 eggs per treatment were conducted, with the exception of the measurements of total solids content, shell characteristics, and thiobarbituric acid reactive substances (TBARS).
During the storage period, each egg was identified and weighed separately once a week. The following equation was used to determine the weight loss (%) of eggs during storage, according to Caner and Cansiz’s description [4].
Using a digital caliper (TMX PD—150, China), the albumen height was calculated as the average of three measurements made at different positions on the albumen at a distance of 10 mm from the yolk. The equation suggested by Haugh was used to determine the Haugh unit [12].
A digital caliper (TMX PD—150, China) was used to measure yolk width and height (mm). The Funk equation [13] was used to determine the yolk index.
The Roche colorimetric fan (DSM Animal Nutrition & Health, Sao Paulo, Brazil) was used to measure the color of the yolk on a scale from 1 (light yellow) to 15 (red-dish orange). Additionally, each color space was assessed separately. The luminosity (L*), red intensity (a*), and yellow intensity (b*) were determined in this study using a portable spectrophotometer (Delta Vista model 450 G, Novo Hamburgo, Brazil).
The dense and liquid albumen were homogenized after the separation of the yolk and albumen, and the pH was then assessed using a digital pH meter (Kasvi model k39-2014B, Paraná, Brazil) that had been calibrated with buffer solutions of pH 4, 7, and 10. The same equipment (Kasvi model k39-2014B, Paraná, Brazil) was used to measure the pH of the yolk by inserting the electrode into two randomly chosen sites from the yolk.
The specific gravity was calculated according to Wells [14], where the specific gravity was determined. To determine lipid oxidation, Giampietro et al. [15] method was utilized. Three yolks per treatment and three storage durations were used to assess TBARS values (0, 21, and 42 days). A spectrophotometer (532 nm) was used to quantify the amount of lipid peroxide decomposition. The TBARS standard utilized was 1,1,3,3-tetramethoxypropane (TMP), and findings were represented as mg TMP/kg egg yolk.
Pomeranz and Meloan’s [16] technique for measuring the total solids content in albumen and yolk was utilized. Albumen and yolk were weighed individually into previously dried porcelain crucibles at a rate of five grams. After being kept in an oven at 60 °C for 12 h, the samples were weighed and then kept at 105 °C for 12 h before being weighed once again. At two-week intervals, seven eggs from each treatment were inspected to measure the total solids content. After they were separated, cleaned, dried, and weighed on days 0, 21, and 42, the percentage of shells was calculated.

2.3. Statistical Analyses

The study’s design was entirely randomized. Every egg was treated as a separate experimental unit. SAS statistical software was used to carry out the statistical procedures (9.4, SAS Inst. Inc., Cary, NC, USA). The data were examined for normality before being submitted to analysis of variance with PROC MIXED. The effects of treatment, experimental phases, storage days, and interactions were all taken into consideration by the statistical models. The overall averages and probabilities for all the responses evaluated in the study are given in a table to simplify the presentation of the results. If an impact (p < 0.10) is pertinent to the project’s goal (i.e., the effect of the treatment or its interaction with phase and/or day), the means are further stated (separately per phase and day of assessment). Each storage day of each experimental phase was used to determine the probability of treatment effect. The probability was then evaluated at significance levels of 5% and 10%.

3. Results

3.1. General Traits

Eggs from laying hens fed diets containing β-mannanase were 2% heavier (p < 0.05) than the control group (Table 1). No effect of treatment was found for weight loss during storage (Table S1). However, interactions (p < 0.05) ‘treatment by phase’ and ‘treatment by storage day’ were noticed for this response. When individually assessing phases and days, it was possible to observe that the eggs from the group fed with β-mannanase showed lower weight loss when compared to the control group on days 7 (p = 0.004) and 21 (p < 0.001) of storage in phase 1. The same was observed on day 42 of storage in phase 3 (p = 0.020).
The supplementation of diets with β-mannanase did not affect the specific gravity in the overall trial. In addition, no interactions were found for this response.

3.2. Albumen Traits

The supplementation of diets with β-mannanase did not affect the albumen height (Table S2) in the overall database, however, interactions (p = 0.050) ‘treatment by storage day’ were noticed for this response.
The β-mannanase group showed higher albumen weight than the control group in the overall database (p < 0.001) and interaction (p = 0.045) between ‘treatment by phase’. On day 21 (p = 0.063/Table 2) of phase 1, an increase in albumen weight of 7% was shown when compared to the control group. The β-mannanase group also showed higher values on days 7 (p = 0.016), 14 (p = 0.023), and 35 (p < 0.001) of storage in phase 2, an increase of 10.2%, 7%, and 12% respectively.
Albumen pH did not show significant differences or interactions.

3.3. Yolk Traits

Yolk height, length, index, and weight were not affected by β-mannanase supplementation. The Haugh unit was also similar for both treatments. In addition, no interactions treatment by period or by day were found for yolk height, yolk index, and Haught unit.
However, providing β-mannanase-supplemented feed to laying hens reduced the yolk pH by 2% (p < 0.001) when assessing the overall database. β-mannanase supplementation was able to minimize pH relative to the control group up to day 42 (p = 0.002/Table 3) in phase 1, up to day 7 (p = 0.002) in phase 2, and up to day 35 (p = 0.047) in phase 3, which indicated lower deterioration during storage in eggs from birds fed supplemented diets.
The supplementation of diets with β-mannanase did not affect the yolk length, however, interaction (p = 0.007) ‘treatment by storage day’ was noticed for this response (Table S3). In phase 1, the group fed with β-mannanase showed lower yolk length when compared to the control group at day 21 (p = 0.005) of storage. In phase 2, higher values were noticed in fresh eggs from supplemented birds compared to the control group (p = 0.021). However, on days 7 (p = 0.008) and 28 (p = 0.022) of storage, values from supplemented treatment were lower than the control treatment. In phase 3, higher values were noticed on day 1 (p = 0.024), while a tendency (p = 0.099) with lower values than the control group was observed on day 14 of storage.
Interactions ‘treatment by phase’ (p = 0.014) and ‘treatment by storage day’ (p = 0.005) were observed for yolk weight (Table S4). Eggs from the group fed with β-mannanase showed higher yolk weight on day 42 (p = 0.003) of phase 1. However, the β-mannanase group showed lower values than the control group on day 21 (p < 0.001) in phase 2. In addition, yolk weight was higher on day 1 of phase 3 (p = 0.027) in the β-mannanase group when compared to the control.

3.4. Yolk Color

The supplementation of diets with β-mannanase improved all yolk color responses assessed in the database (p < 0.01). Interactions treatment by phase and by day were also noticed for these responses.
Higher color scores were observed on days 28 (Table 4; p < 0.001) and 42 (p = 0.002) of phase 1 when comparing the supplemented to the control group. In addition, higher values were noticed on days 1 (p = 0.001) and 7 (p = 0.024) of storage of phase 2.
The β-mannanase group showed higher yolk lightness (L* color) than the control group at days 21 (p = 0.003), 28 (p < 0.001), 35 (p < 0.001), and 42 (p = 0.029) of storage in phase 1 (Table 5). Higher values were also noticed when compared supplemented to the control group on days 7 (p < 0.001), 14 (p = 0.035), 21 (p = 0.005), and 35 (p < 0.001) of storage in phase 3.
Yolk redness (a* color) was improved by the β-mannanase on days 28 (p = 0.007) and 35 (p = 0.040) of storage (Table 6). Higher redness values were also observed on days 7 (p = 0.025), 28 (p = 0.007), and 35 (p = 0.013) of storage in phase 2; and on day 42 (p = 0.001) in phase 3 of storage.
β-mannanase improved yolk yellowness (b* color) on days 14 (p = 0.030), 21 (p = 0.005), and 28 (p < 0.001) in phase 1 (Table 7). The same occurred in phase 2, on days 28 (p = 0.012) and 35 (p = 0.013) of storage. Besides, higher values were observed on days 1 (p = 0.039), 28 (p = 0.006), and 42 (p = 0.009) of storage in phase 3.
Eggs from supplemented hens also presented lower heterogeneity (variability among eggs of the same treatment) for both redness and yellowness responses (Figure 1). This trait is not assessed in many studies but is certainly an important response for the poultry industry.

3.5. Shell Traits

Shell weight was improved by β-mannanase supplementation at 3% when considering the overall database. Treatment by phase and treatment by day interactions were found for this response (p < 0.05; Table 8). When assessing the detailed data, it is possible to observe that most of the effect was observed in phase 3, when β-mannanase treatment showed higher shell weight than the control group on days 1 (p = 0.001), 7 (p < 0.001), 14 (p = 0.001), 28 (p = 0.015), and 35 (p < 0.001).

3.6. Lipid Peroxidation and Total Solids

Lower TBARS values were observed in the β-mannanase group when compared to the control in fresh eggs from phase 2 (−17%; p < 0.05) and 3 (−3%; p = 0.055; Table 9). The same happened on day 1 of phase 2 (p = 0.018). Eggs from supplemented laying hens also showed a 42% lower TBARS content after 42 (p = 0.035) and 21 (p = 0.003) days of storage in phase 3.

3.7. Shell Traits

No supplementation effect was noticed for total solids of albumen (Table S5) and yolk when compared to the control group.

4. Discussion

Eggshell consists mainly of calcium carbonate, but also magnesium carbonate, calcium phosphate, and others. The balance between calcium and phosphorus ions is essential for the formation of the shell [4]. The specific gravity indicates the amount of shell in relation to the other components of the egg and is closely related to the shell thickness and consequently to the deposition of calcium carbonate. Shell weight can also be used to confirm specific gravity findings and assess calcium metabolism. In this study, no significant differences in specific gravity were noticed, but higher values in terms of shell weight were found in eggs from supplemented birds. This is probably related to the greater preservation of albumen and yolk in eggs from β-mannanase treatment.
Still related to the shell is the albumen, which can suffer changes due to the porosity of the shell. Regarding albumen weight, higher values were observed in the birds fed with β-mannanase compared to the control group. The weight of the yolk and albumen has a positive relationship with the weight of the egg [17], as their masses are greater in eggs of greater weight when compared to those of lower weight. Egg weight can be correlated with several factors, such as heritability, age, and bird weight. Egg weight also has a strong influence on the nutritional level of the diet [18]. Furthermore, mannans are known to decrease viscosity and hinder the action of enzymes [19] β-mannanase, by breaking down β-mannans, may facilitate the action of enzymes and increase the amount of protein absorbed, which may explain the higher yolk and albumen weight observed in this study.
During storage, changes in albumen and yolk are detected, and the rate of these changes is influenced by temperature [4] and other factors. Egg freshness can be evaluated through parameters such as pH [20]. The changes that occur in the egg during storage affect the functional properties of the yolk. These changes include the thinning of the albumen, the increase in pH, the weakening and stretching of the yolk membrane (which separates the albumen from the yolk), and the increase in the water content of the yolk [21,22]. In the present study, β-mannanase decreased yolk pH at all periods, improving its quality.
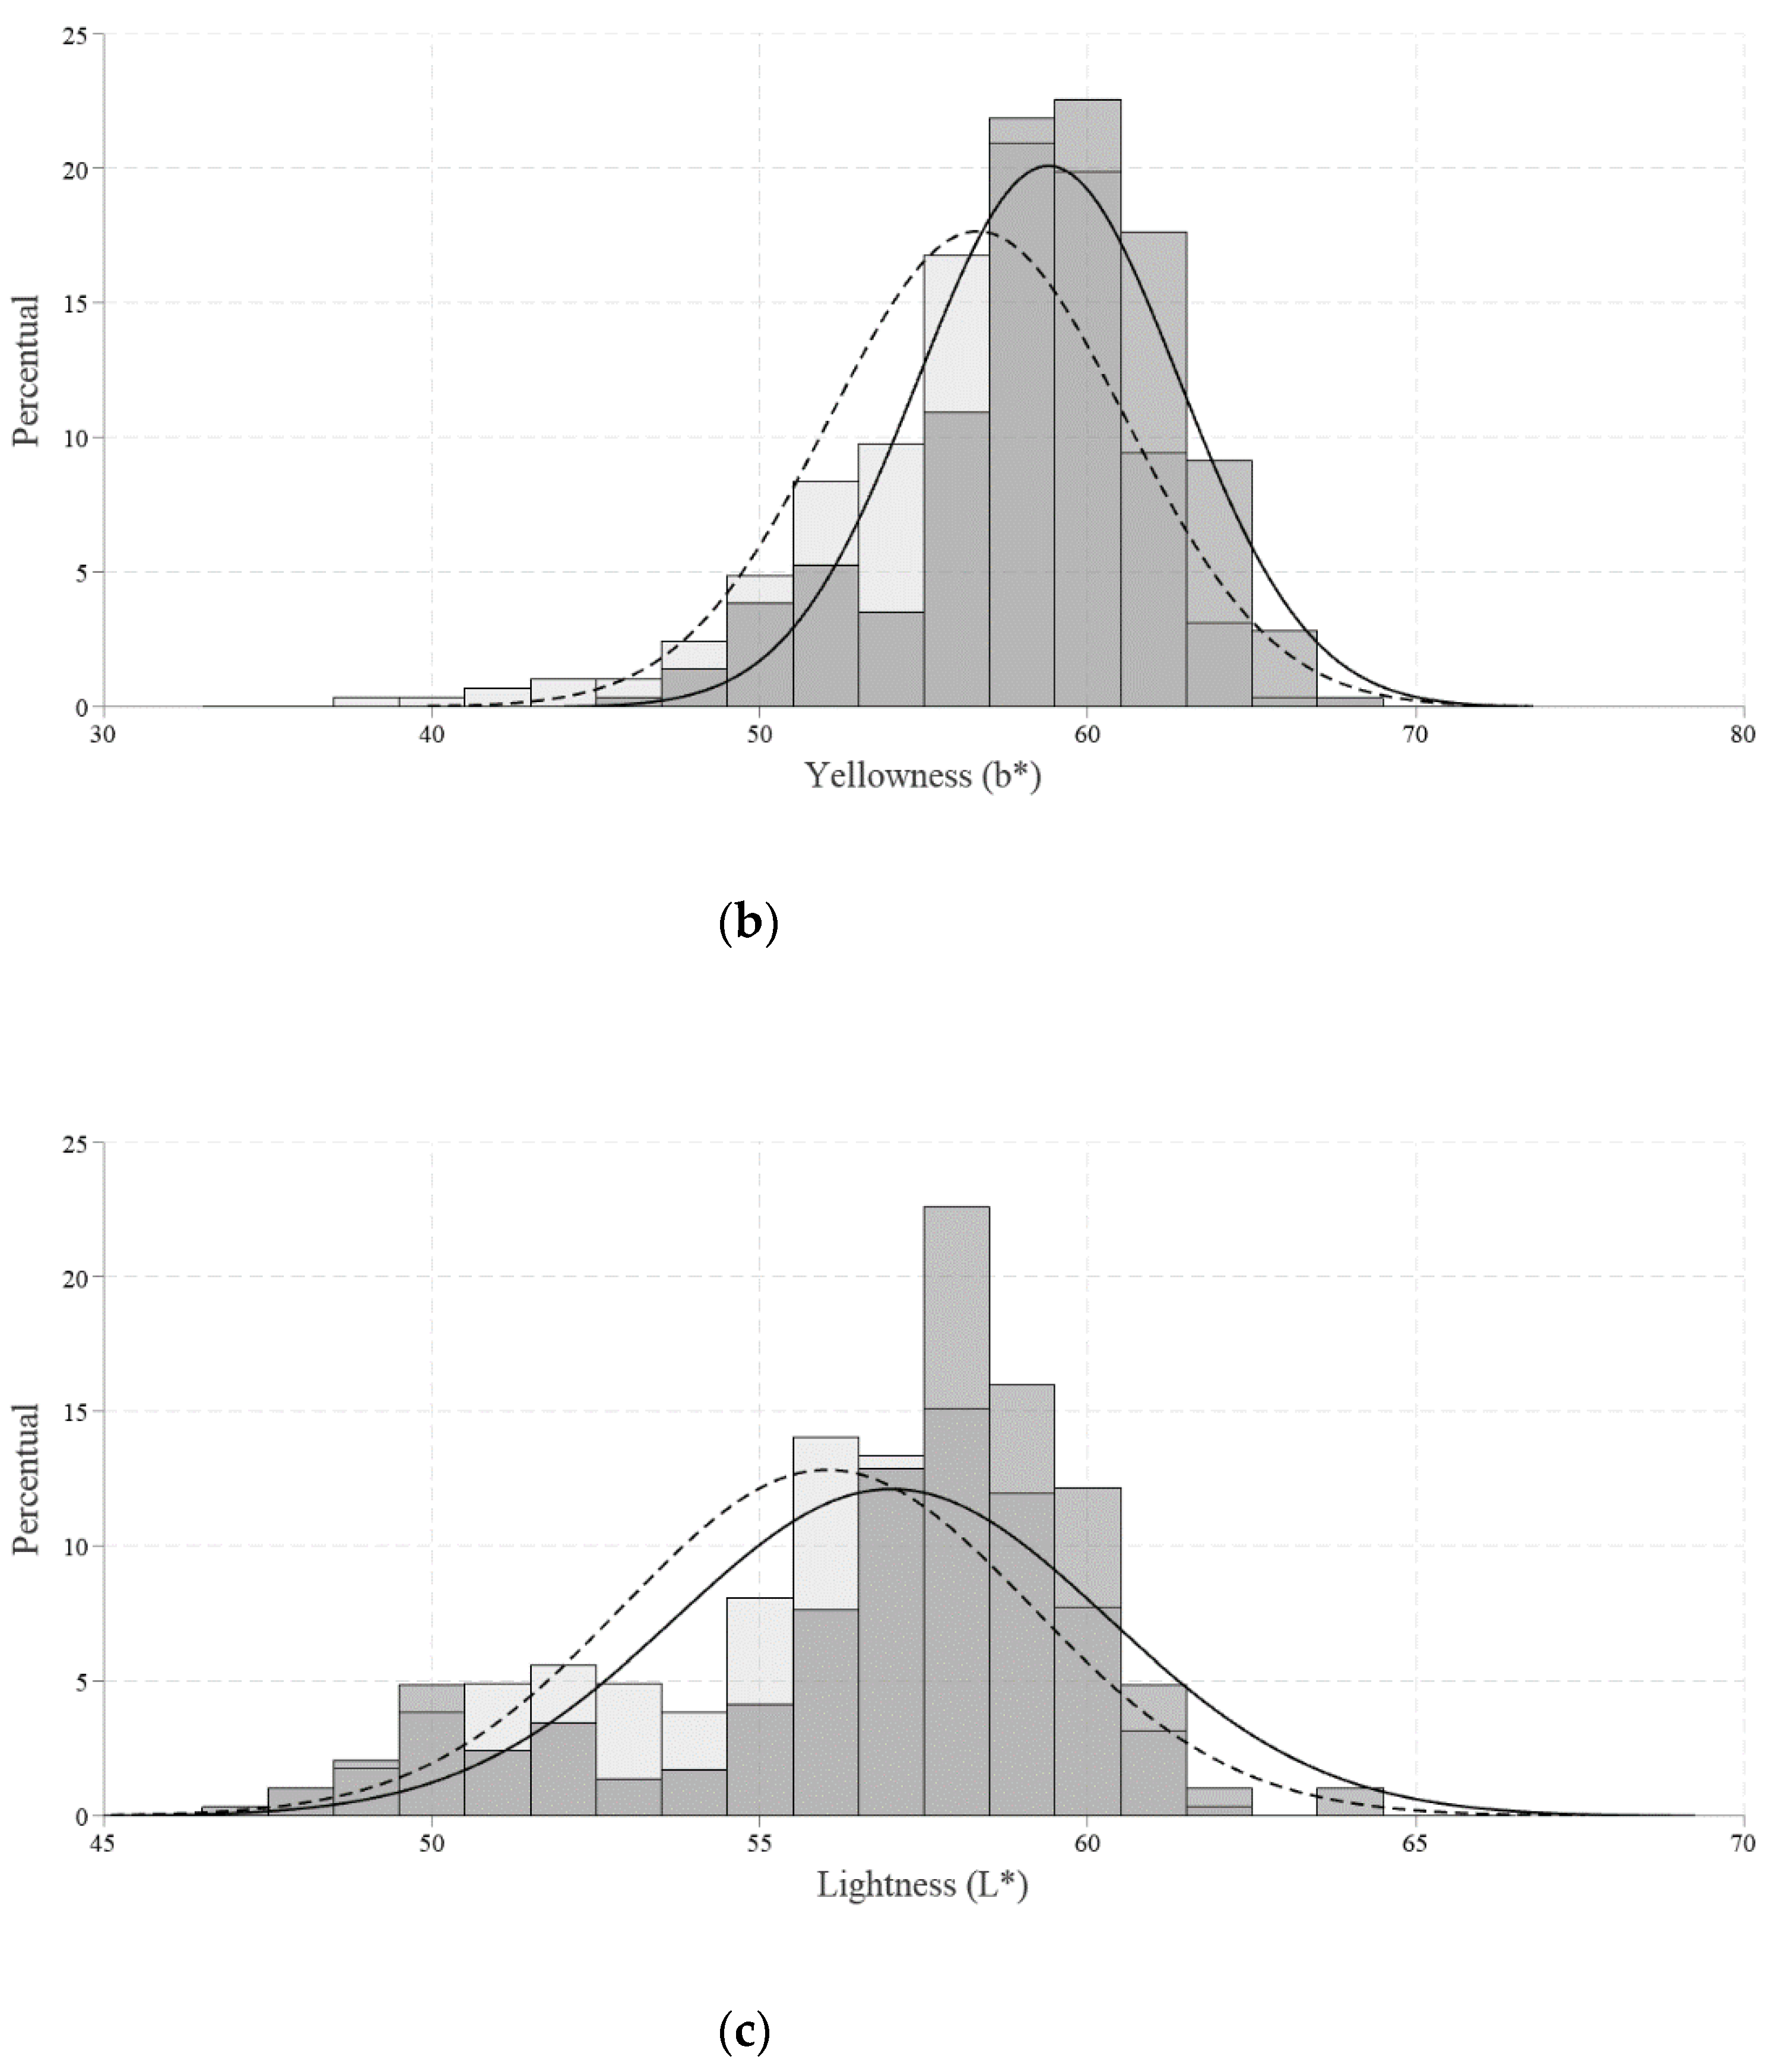
Regarding the yolk color, luminosity values (L* color) from the β-mannanase group were higher than the control group. Such findings indicate lower luminosity, that is, they were opaquer because they transmit less light. Higher values were also found for the intensity of red (a* color) and the intensity of yellow (b* color) compared to the control group. The use of the palette also showed an increase in the yolk color in the β-mannanase group when compared to the control. According to Narinc [23] the L* a* b* method is more reliable than the palette since it demonstrates numerical values. A higher color intensity of the yolk increases the acceptance of eggs by consumers [24] and is seen as something positive. Pigmentation occurs through the absorption of carotenoid pigments present in diets [25]. The major carotenoids in corn are xanthophylls, lutein, and zeaxanthin (Perry et al., 2009). Such components are unsaturated and lipophilic [26], that is, they accumulate in the yolk that has the highest concentration of fat in the egg. Furthermore, carotenoids have many double bonds in their molecules and can be oxidized depending on storage time, lighting, and ambient temperature, which reduces yolk pigmentation [21,27]. Therefore, β-mannanase can decrease the effects of storage and, consequently, slow down the deleterious effects of yolk pigmentation. Furthermore, by improving the absorption of nutrients and/or increasing the production of micelles, which transport carotenoids, β-mannanase can provide more carotenes to the yolk and generate a yellowish or reddish color.
To clarify the observed TBARS results, it is important to understand that lipid oxidation (peroxidation) is one of the most important reactions in food chemistry, consisting of a series of chemical and biochemical reactions that cause changes in the type and concentration of molecules present in foods, which can alter taste and nutritional quality and produce toxic compounds. Like other lipid molecules, cholesterol is susceptible to oxidation, producing cholesterol oxidation products (COPs) or oxysterols. Oxysterols are found in many foods, especially cholesterol-rich foods such as eggs. TBARS is the most commonly used method for quantifying malondialdehyde (MDA) in foods, which is one of the end products formed through the decomposition of certain lipid peroxidation products [28]. Giampietro et al. [29] observed that TBARS values of egg yolks increased over storage periods. In the present study, we observed that β-mannanase was able to decrease TBARS values, which may be related to greater production of micelles and consequently a greater amount of carotenoids deposited in yolk, which act as antioxidants [30]. Another factor that may be related is the lower viscosity generated by β-mannanase [19]. The viscosity impairs the absorption of nutrients and can lead to a greater amount of free radicals, the enzyme may reduce this production.
Few studies link gut health to egg quality. Regarding shelf life, our group did not find studies that relate the use of β-mannanase to this topic. The results found in this study can help and serve as an alternative in promoting the maintenance of intestinal health in laying hens, in addition to the possible decrease in the deterioration of egg quality by improving the use of nutrients by the bird.

5. Conclusions

The present study shows that β-mannanase can increase the quality of eggs. Supplementation was able to improve egg weight, albumen weight, yolk pH, and TBARS. In addition, β-mannanase was shown to be efficient in improving yolk color, which is desired by consumers. Future studies are needed to better understand the mechanisms by which this additive was able to improve some characteristics of egg quality.

Supplementary Materials

The following supporting information can be downloaded at: https://www.mdpi.com/article/10.3390/poultry2010011/s1, Table S1: Weight loss (g) of eggs from laying hens fed with β-mannanase depending on storage time; Table S2: Albumen height (mm) of eggs from laying hens fed with β-mannanase depending on storage time; Table S3: Yolk length (mm) of eggs from laying hens fed with β-mannanase depending on storage time; Table S4: Yolk weight (g) of eggs from laying hens fed with β-mannanase depending on storage time. Table S5: Total solids of eggs from laying hens fed with β-mannanase depending on storage time.

Author Contributions

Conceptualization, C.L.C., I.A. and M.K.; methodology, C.L.C., I.A. and M.K.; validation, C.L.C., I.A. and M.K.; formal analysis, C.L.C., I.A. and M.K.; investigation, C.L.C., G.M.G., N.d.O.T.C., T.B.S. and M.J.M.; resources, I.A. and M.K.; data curation, C.L.C. and I.A.; writing—original draft preparation, C.L.C.; writing—review and editing, C.L.C., I.A., G.M.G. and M.K.; visualization, I.A. and M.K.; supervision, I.A., R.M. and M.K.; project administration, I.A. and M.K.; funding acquisition, I.A. and M.K. All authors have read and agreed to the published version of the manuscript.

Funding

Conselho Nacional de Desenvolvimento Cientifico e Tecnológico (CNPq) and Coordenação de Aperfeiçoamento de Pessoal de Nível Superior (CAPES) provided partial funding for this research.

Institutional Review Board Statement

The animal study protocol was approved by the Institutional Ethics Committee on the Use of Animals (CEUA) of Universidade Federal do Rio Grande do Sul (protocol code 39783; 21 December 2020).

Informed Consent Statement

Not applicable.

Data Availability Statement

Not applicable.

Acknowledgments

We thank Granja Petry for the donation of the eggs and Elanco Animal Health for the donation of the products.

Conflicts of Interest

Kipper, M. was employed by Elanco Animal Health, São Paulo, Brazil. The remaining authors declare that the research was conducted in the absence of any commercial or financial relationships that could be construed as a potential conflict of interest.

References

  1. Corradini, M.G. Shelf Life of Food Products: From Open Labeling to Real-Time Measurements. Annu. Rev. Food Sci. Technol. 2018, 9, 251–269. [Google Scholar] [CrossRef] [PubMed]
  2. Caner, C.; Cansiz, O. Effectiveness of chitosan-based coating in improving shelf-life of eggs. J. Sci. Food Agric. 2006, 87, 227–232. [Google Scholar] [CrossRef]
  3. Nyholm, S.V. In the beginning: Egg–microbe interactions and consequences for animal hosts. Philos. Trans. R. Soc. B Biol. Sci. 2020, 375, 20190593. [Google Scholar] [CrossRef]
  4. Oliveira, B.L.; Oliveira, D.D. Qualidade e Tecnologia de Ovos; UFLA: Lavras, Brazil, 2013. [Google Scholar]
  5. Zhang, T.; Bai, S.; Ding, X.; Zeng, Q.; Zhang, K.; Lv, L.; Li, J.; Peng, H.; Xuan, Y.; Wang, J. Dietary Theabrownin Supplementation Improves Production Performance and Egg Quality by Promoting Intestinal Health and Antioxidant Capacity in Laying Hens. Animals 2022, 12, 2856. [Google Scholar] [CrossRef] [PubMed]
  6. Saeed, M.; Ayaşan, T.; Alagawany, M.; El-Hack, M.; Abdel-Latif, M.; Patra, A. The Role of ß-Mannanase (Hemicell) in Improving Poultry Productivity, Health and Environment. Braz. J. Poult. Sci. 2019, 21, 1–8. [Google Scholar] [CrossRef]
  7. Jackson, M.E. Mannanase, alpha-galactosidade, and pectinase. In Enzymes in Farm Animals Nutrition, 2nd ed.; Bedford, M.R., Partridge, G.G., Eds.; CABI Publishing: Wallingford, UK, 2001; pp. 54–94. [Google Scholar]
  8. Hsiao, H.-Y.; Anderson, D.; Dale, N. Levels of β-Mannan in Soybean Meal. Poult. Sci. 2006, 85, 1430–1432. [Google Scholar] [CrossRef]
  9. Çalişlar, S. Effects of dietary guar meal with or without beta-mannanase on performance and egg quality traits in laying hens. Turk. J. Vet.-Anim. Sci. 2020, 44, 511–520. [Google Scholar] [CrossRef]
  10. Ryu, M.H.; Hosseindoust, A.; Kim, J.S.; Choi, Y.H.; Lee, S.H.; Kim, M.J.; Lee, J.H.; Chae, B.J. β-Mannanase Derived from Bacillus Subtilis WL-7 Improves the Performance of Commercial Laying Hens Fed Low or High Mannan-Based Diets. J. Poult. Sci. 2017, 54, 212–217. [Google Scholar] [CrossRef]
  11. Hy-Line. Available online: https://www.hyline.com/filesimages/Hy-Line-Products/Hy-Line-Product-PDFs/W-36/36%20COM%20ENG.pdf (accessed on 26 December 2022).
  12. Haugh, R.R. The Haugh unit for measuring egg quality. U. S. Egg Poult. Mag. 1937, 43, 552–555. [Google Scholar]
  13. Funk, E.M. The relation of the Yolk Index Determined in Natural Position to the Yolk Index as Determined after Separating the Yolk from the Albumen. Poult. Sci. 1948, 27, 367. [Google Scholar] [CrossRef]
  14. Wells, R. A study of the hen’s egg. In British Egg Marketing Board Symposium; Oliver & Boyd: Edinburgh, Scotland, 1968. [Google Scholar]
  15. Giampietro, A.; Scatolini, A.M.; Boiago, M.M.; Coró, D.M.O.; Souza, H.B.A.; Souza, P.A.; Pizzolante, C.C. Estudo da metodologia de TBARS em ovos. Rev. Avis. 2008, 13, 18. [Google Scholar]
  16. Pomeranz, Y.; Meloan, C. Food Analysis: Theory and Practice; Chapman & Hall: Boca Raton, FL, USA, 1994; Volume 778. [Google Scholar]
  17. Orhan, H.; Eyduran, E.; Tatliyer, A.; Saygici, H. Prediction of egg weight from egg quality characteristics via ridge regression and regression tree methods. Rev. Bras. Zootec. 2016, 45, 380–385. [Google Scholar] [CrossRef] [Green Version]
  18. Shim, M.Y.; Song, E.; Billard, L.; Aggrey, S.E.; Pesti, G.M.; Sodsee, P. Effects of balanced dietary protein levels on egg production and egg quality parameters of individual commercial layers. Poult. Sci. 2013, 92, 2687–2696. [Google Scholar] [CrossRef]
  19. Moreira, L.R.S.; Filho, E.X.F. An overview of mannan structure and mannan-degrading enzyme systems. Appl. Microbiol. Biotechnol. 2008, 79, 165–178. [Google Scholar] [CrossRef]
  20. Huang, Q.; Qiu, N.; Ma, M.H.; Jin, Y.G.; Yang, H.; Geng, F.; Sun, S.H. Estimation of egg freshness using S-ovalbumin as an indicator. Poult. Sci. 2012, 91, 739–743. [Google Scholar] [CrossRef]
  21. Jin, Y.H.; Lee, K.T.; Lee, W.I.; Han, Y.K. Effects of Storage Temperature and Time on the Quality of Eggs from Laying Hens at Peak Production. Asian Australas. J. Anim. Sci. 2010, 24, 279–284. [Google Scholar] [CrossRef]
  22. Karoui, R.; Kemps, B.; Bamelis, F.; De Ketelaere, B.; Decuypere, E.; De Baerdemaeker, J. Methods to evaluate egg freshness in research and industry: A review. Eur. Food Res. Technol. 2005, 222, 727–732. [Google Scholar] [CrossRef]
  23. Narinc, D.; Aygun, A.; Kucukonder, H.; Aksoy, T.; Gurcan, E.K. An application of bootstrap technique in animal science: Egg yolk color sample. Kafkas Univ. Vet. Fak. Derg. 2015, 21, 1–7. [Google Scholar] [CrossRef]
  24. Faitarone, A.; Garcia, E.; Roça, R.; Andrade, E.; Vercese, F.; Pelícia, K. Yolk Color and Lipid Oxidation of the Eggs of Commercial White Layers Fed Diets Supplemented with Vegetable Oils. Braz. J. Poult. Sci. 2016, 18, 9–16. [Google Scholar] [CrossRef] [Green Version]
  25. Garcia, E.; Mendes, A.; Pizzolante, C.; Gonçalves, H.; Oliveira, R.; Silva, M. Efeito dos Níveis de Cantaxantina na Dieta Sobre o Desempenho e Qualidade dos Ovos de Poedeiras Comerciais. Braz. J. Poult. Sci. 2002, 4, 1–7. [Google Scholar] [CrossRef]
  26. Cardoso, S.L. Fotofísica de carotenóides e o papel antioxidante de b-caroteno. Química Nova 1997, 20, 535–540. [Google Scholar] [CrossRef] [Green Version]
  27. Oliver, J.; Palou, A. Chromatographic determination of carotenoids in foods. J. Chromatogr. A 2000, 881, 543–555. [Google Scholar] [CrossRef] [PubMed]
  28. Medina-Meza, I.G.; Barnaba, C.; Barbosa-Cánovas, G.V. Effects of high pressure processing on lipid oxidation: A review. Innov. Food Sci. Emerg. Technol. 2014, 22, 1–10. [Google Scholar] [CrossRef]
  29. Giampietro-Ganeco, A.; Scatolino-Silva, A.M.; Borba, H.; Boiago, M.M.; Lima, T.M.A.; Souza, P.A. Comparative study of egg quality characteristics stored in domestic refrigerators. Ars. Vet. 2012, 28, 100–104. [Google Scholar] [CrossRef]
  30. Young, A.J.; Lowe, G.L. Carotenoids—Antioxidant Properties. Antioxidants 2018, 7, 28. [Google Scholar] [CrossRef] [PubMed] [Green Version]
Figure 1. Yolk redness (a*) (a), yellowness (*L) (b), and lightness (L* color) (c) of eggs from laying hens fed β-mannanase (dark gray bars) or control treatment (light gray bars).
Poultry 02 00011 g001aPoultry 02 00011 g001b
Table 1. Quality of eggs from laying hens fed diets supplemented with β-mannanase.
ResponsesTreatments 1p-Value 2,3
CONBMATreatment (T)Day (D)Phase (P)T × DT × PP × DT × P × D
General traits
Weight (g)61.7662.800.0020.405<0.0010.1760.3290.0110.371
Weight loss (g)1.871.820.201<0.0010.2740.0140.0130.8160.010
Spec. gravity (g/mL)1.0051.0050.8640.0560.2980.9990.9330.9700.999
Albumen traits
Height (mm)4.2784.0890.238<0.001<0.0010.0500.249<0.0010.901
Weight (g)33.9135.04<0.001<0.001<0.0010.2100.0450.0020.871
pH9.169.160.819<0.001<0.0010.9930.936<0.0010.430
Haugh unit56.9755.890.131<0.001<0.0010.1790.842<0.0010.553
Yolk traits
Height (mm)13.1212.990.169<0.001<0.0010.7720.771<0.0010.280
Length (mm)46.4146.250.360<0.001<0.0010.0070.611<0.0010.001
Index0.2900.2880.290<0.001<0.0010.5850.207<0.0010.175
Weight (g)16.8716.910.759<0.001<0.0010.0050.014<0.0010.107
pH6.406.25<0.001<0.001<0.0010.1730.028<0.0010.529
Yolk color
Color score5.655.790.004<0.001<0.0010.0010.071<0.0010.036
Lightness (L*)56.0957.15<0.001<0.001<0.0010.0210.007<0.0010.009
Redness (a*)6.336.82<0.001<0.001<0.0010.0890.636<0.0010.485
Yellowness (b*)56.5458.86<0.0010.006<0.0010.0490.106<0.0010.756
Shell traits
Weight (g)5.866.05<0.0010.019<0.0010.051<0.0010.0420.048
1 Mean values are not only for fresh eggs but represent the whole sample of fresh and stored eggs. CON: Control feed, BMA: feed with β-mannanase. 2 The mean values provide an overall value that takes into account both fresh and stored eggs rather than only the evaluation of fresh eggs. Each phase’s last day included a quality evaluation (36–40 weeks, phase 1; 41–44 weeks, phase 2; and 45–48 weeks, phase 3). 15 eggs from each treatment were assessed weekly, and the remaining eggs were kept stored (7, 14, 21, 28, 35, and 42 days). 3 Responses with treatment effect (p < 0.10) are described in the next tables. Significant interactions with treatment (p < 0.10) are described in the Supplementary Materials.
Table 2. Albumen weight (g) of eggs from laying hens fed with β-mannanase depending on storage time.
TreatmentsStorage Period (Days)
171421283542
Phase 1—36 to 40 weeks
Control35.7532.8034.4032.5732.5031.0631.30
BMA36.4934.4234.0335.0232.5131.9330.56
p-value 10.5700.1800.7700.0600.9900.5300.470
SEM 20.640.600.640.660.640.670.50
Phase 2—41 to 44 weeks
Control36.8034.1032.6031.3831.9429.9630.71
BMA37.6337.9835.0632.9233.3334.0331.28
p-value0.4300.0100.0200.1700.340<0.0010.670
SEM0.510.820.550.560.720.590.66
Phase 3—45 to 48 weeks
Control37.9036.5236.8838.5636.0734.4933.99
BMA38.0438.3237.2738.4337.9235.3633.36
p-value0.8800.1500.8100.9200.1600.5300.580
SEM0.470.620.780.660.650.680.57
1 Probability of treatment effect. 2 Standard error.
Table 3. Yolk pH of eggs from laying hens fed with β-mannanase depending on storage time.
TreatmentsStorage Period (Days)
171421283542
Phase 1—36 to 40 weeks
Control6.226.626.476.826.506.656.75
BMA6.186.306.186.606.406.396.42
p-value 10.4510.0390.0890.4560.4490.0140.002
SEM 20.0280.0920.0850.1440.0660.0540.059
Phase 2—41 to 44 weeks
Control5.896.066.116.316.856.356.49
BMA5.845.976.036.266.716.336.46
p-value0.0040.0020.2860.3740.2870.8080.700
SEM0.0100.0150.0330.0280.0620.0320.035
Phase 3—45 to 48 weeks
Control6.016.196.076.246.376.626.63
BMA5.866.016.046.156.456.356.53
p-value0.0010.0030.6540.1180.4670.0470.246
SEM0.0230.0760.0260.0290.0520.0670.043
1 Probability of treatment effect. 2 Standard error.
Table 4. Yolk color score (pallete) of eggs from laying hens fed with β-mannanase depending on storage time.
TreatmentsStorage Period (Days)
171421283542
Phase 1—36 to 40 weeks
Control5.734.875.426.365.936.386.18
BMA6.204.875.136.076.646.676.91
p-value 10.0750.9990.1020.166<0.0010.2020.002
SEM 20.1310.1040.0860.1040.1100.1090.127
Phase 2—41 to 44 weeks
Control5.334.574.676.076.806.466.36
BMA6.005.074.735.856.796.696.33
p-value0.0010.0240.7390.4520.9280.3710.886
SEM0.1110.1120.0980.1460.0770.1260.102
Phase 3—45 to 48 weeks
Control5.735.205.005.155.335.755.50
BMA5.735.074.875.005.645.695.77
p-value0.9990.2990.1680.4780.5610.8200.101
SEM0.0950.0630.0470.1060.1070.1230.090
1 Probability of treatment effect. 2 Standard error.
Table 5. Yolk lightness (L* color) of eggs from laying hens fed with β-mannanase depending on storage time.
TreatmentsStorage Period (Days)
171421283542
Phase 1—36 to 40 weeks
Control51.3058.1857.6057.1355.2755.3857.77
BMA50.3358.7258.7058.4558.7258.6059.14
p-value 10.0680.3360.5480.003<0.001<0.0010.029
SEM 20.2660.2740.8940.2350.5050.4970.321
Phase 2—41 to 44 weeks
Control50.9955.7757.8756.6258.2558.7359.07
BMA51.6556.3557.8758.0158.1158.8258.84
p-value0.3110.2760.9950.0990.7570.8780.762
SEM0.3210.2650.2920.4180.2150.2870.371
Phase 3—45 to 48 weeks
Control50.2653.3754.6156.4957.5657.0958.61
BMA50.0156.3456.2158.3658.4859.1159.38
p-value0.677<0.0010.0350.0050.219<0.0010.134
SEM0.2920.4550.3850.3520.3690.2750.255
1 Probability of treatment effect. 2 Standard error.
Table 6. Yolk redness (a* color) of eggs from laying hens fed with β-mannanase depending on storage time.
TreatmentsStorage Period (Days)
171421283542
Phase 1—36 to 40 weeks
Control7.586.037.217.026.575.807.01
BMA8.266.727.627.417.466.796.95
p-value 10.0580.0810.2650.2660.0070.0400.862
SEM 20.1810.1990.1790.1730.1710.2400.169
Phase 2—41 to 44 weeks
Control6.986.175.946.295.746.235.60
BMA7.206.985.776.706.807.206.04
p-value0.4600.0250.3240.3060.0070.0130.137
SEM0.1430.1840.08620.1950.2050.2010.146
Phase 3—45 to 48 weeks
Control6.817.036.326.095.495.585.39
BMA7.526.826.286.046.056.336.38
p-value0.1690.5430.9200.9370.2330.0690.001
SEM0.2570.1680.2060.2890.2290.2080.162
1 Probability of treatment effect. 2 Standard error.
Table 7. Yolk yellowness (a* color) of eggs from laying hens fed with β-mannanase depending on storage time.
TreatmentsStorage Period (Days)
171421283542
Phase 1—36 to 40 weeks
Control6.055.986.025.965.635.535.55
BMA6.166.126.406.236.165.835.67
p-value 10.2240.1180.0300.005<0.0010.0890.507
SEM 20.4330.4530.8940.5040.7860.9020.885
Phase 2—41 to 44 weeks
Control5.705.525.625.405.755.865.65
BMA5.685.455.805.716.056.105.65
p-value0.8950.7520.2840.1540.0120.0130.981
SEM0.8651.030.8291.060.6140.5000.667
Phase 3—45 to 48 weeks
Control5.475.635.625.625.215.555.41
BMA5.835.845.855.685.825.805.78
p-value0.0390.0710.1260.7410.0060.0910.009
SEM0.8780.5610.7480.8241.1600.7440.731
1 Probability of treatment effect. 2 Standard error.
Table 8. Shell weight of eggs from laying hens fed with β-mannanase depending on storage time.
TreatmentsStorage Period (Days)
171421283542
Phase 1—36 to 40 weeks
Control5.786.176.015.815.886.016.20
BMA6.076.106.026.085.946.015.93
p-value 10.2620.6350.9310.1290.6600.9840.103
SEM 20.1290.0700.0670.0870.0740.1000.081
Phase 2—41 to 44 weeks
Control6.256.116.025.766.065.956.22
BMA6.196.065.975.866.055.906.26
p-value0.6870.7570.7040.5910.9340.7370.859
SEM0.0720.0750.0620.0840.0580.0640.098
Phase 3—45 to 48 weeks
Control5.405.325.425.705.765.295.96
BMA6.186.266.176.036.185.975.90
p-value<0.001<0.001<0.0010.0510.015<0.0010.694
SEM0.1250.1190.1170.0860.0890.0840.074
1 Probability of treatment effect. 2 Standard error.
Table 9. Thiobarbituric acid reactive substances in eggs from laying hens fed β-mannanase.
TreatmentsStorage Period (Days)
12142
Phase 1—36 to 40 weeks
Control4.432.983.55
Probiotic4.642.543.42
p-value10.3530.3050.649
SEM 20.100.200.13
Phase 2—41 to 44 weeks
Control4.773.912.96
Probiotic3.973.413.23
p-value0.0180.1030.480
SEM0.190.160.17
Phase 3—45 to 48 weeks
Control4.143.183.16
Probiotic4.022.371.87
p-value0.0550.0030.035
SEM0.310.170.42
1 Probability of treatment effect. 2 Standard error.
Disclaimer/Publisher’s Note: The statements, opinions and data contained in all publications are solely those of the individual author(s) and contributor(s) and not of MDPI and/or the editor(s). MDPI and/or the editor(s) disclaim responsibility for any injury to people or property resulting from any ideas, methods, instructions or products referred to in the content.

