Article

Using Process Mining to Reduce Fraud in Digital Onboarding

by
Matheus Camilo da Silva
1,†,
Gabriel Marques Tavares
2,†,
Marcos Cesar Gritti
3,
Paolo Ceravolo
2,† and
Sylvio Barbon Junior
1,*
1
Dipartimento di Ingegneria e Architettura, Università Degli Studi di Trieste, 34127 Trieste, Italy
2
Dipartimento di Informatica, Università Degli Studi di Milano Statale, 20122 Milano, Italy
3
Banco Bari Research Data and Development, Curitiba 80250205, Brazil
*
Author to whom correspondence should be addressed.
These authors contributed equally to this work.
FinTech 2023, 2(1), 120-137; https://doi.org/10.3390/fintech2010009
Submission received: 18 January 2023 / Revised: 18 February 2023 / Accepted: 24 February 2023 / Published: 28 February 2023

Abstract

:
In the context of online banking, new users have to register their information to become clients through mobile applications; this process is called digital onboarding. Fraudsters often commit identity fraud by impersonating other people to obtain access to banking services by using personal data obtained illegally and causing damage to the organisation’s reputation and resources. Detecting fraudulent users by their onboarding process is not a trivial task, as it is difficult to identify possible vulnerabilities in the process to be exploited. Furthermore, the modus operandi for differentiating the behaviour of fraudulent actors and legitimate users is unclear. In this work, we propose the usage of a process mining (PM) approach to detect identity fraud in digital onboarding using a real fintech event log. The proposed PM approach is capable of modelling the behaviour of users as they go through a digital onboarding process, while also providing insight into the process itself. The results of PM techniques and the machine learning classifiers showed a promising 80% accuracy rate in classifying users as fraudulent or legitimate. Furthermore, the application of process discovery in the event log dataset produced an insightful visual model of the onboarding process.

1. Introduction

The evolution of technology has allowed the banking sector to offer most of its services via the Internet. Currently, a person can register, make money transfers, and even take out loans without direct interaction with a bank employee [1]. For a person to have access to the online services of a banking institution, they must first go through the digital onboarding (DO) stage. In the context of online banking, DO encompasses the identification process in which a person enters their personal data into the bank’s system through a series of steps, essentially allowing anyone with Internet access and a mobile device to create a bank account at any time at any place.
Although this paradigm of online interaction between banks and customers is beneficial to both, it is up to banks and financial organisations to ensure a reliable, secure, and fraud-free environment for banking services [2]. The availability of these services on the Internet brought with it great challenges in terms of combating fraud since fraudsters have access to digital tools and technologies designed to try to exploit security flaws in banking systems [2,3].
Considering that DO is essentially the gateway to the services of a banking system, its protection is crucial for preserving the integrity of any digital bank. One type of common fraud is identity fraud, in which fraudsters, armed with personal data obtained illegally, try to impersonate other people in order to gain access to banking services illicitly. Manually checking each person’s documents that go through the DO stage of a bank can be very time- and resource-consuming and frankly not feasible depending on the volume of onboarding requests.
To prevent this type of identity fraud in DO, institutions can also rely on new digital tools, technologies, and the detailed data they have on their services [4]. A possible solution could be the application of computer vision approaches to try to assess the validity of users’ documents sent during the DO stage by analysing factors such as image quality, document quality, or whether the document owner’s photo corresponds to a selfie, for example. Another possibility is the application of a biometric analysis of users, that is, a financial institution could verify the identity of a customer in the onboarding [5] process by trying to match their fingerprint from a database of people’s fingerprints. There is also a nondisruptive type of approach, which does not require any extra action from users in DO called behavioural analysis, which proposes to identify and measure patterns in the way that fraudulent users and legitimate users interact with their devices in order to find possible differences in behaviour between the two [6].
DO dynamics are defined by several stakeholders within an organisation considering the context and goals of the application. Nevertheless, there are a set of rules and activities that are executed given the modelling envisioned by collaborators. Given this business view, one can profit from the vast literature on data-driven analysis of business processes [4]. Process mining (PM) is the area dedicated to the extraction of knowledge from event data generated from the recording of the execution of business processes [7]. PM offers a plethora of techniques to provide process-related insights, creating solutions that are specifically tailored for business processes and their stakeholders [8]. For that, PM lies at the intersection between data mining and business process management since it provides a data-driven approach to finding patterns in event data from business environments. Traditionally, PM focuses on leveraging a model considering the relationships between activities within a process. The model discovery is a valuable product for stakeholders as they can analyse how the process is being enacted in reality. As stated by Teinemaa et al. [9], a classical process monitoring analysis delivers dashboards reporting the performance of a business process. However, it falls short in the sense that such techniques are offline, only reflecting historical behaviour, thus with a limited range (i.e., mitigation is not always possible). Particularly, predictive process monitoring (PPM) aims to fill this gap by predicting the future behaviour of process instances, enabling actors to take actions according to the forecasted scenarios. PPM contains many subtasks, such as predicting the remaining time of a given instance or the next activity to be executed [10]. In this work, we focus on outcome-oriented PPM, i.e., the prediction of the last state of a business instance. For instance, in a loan application, the bank would be interested in identifying which users are prone to accept an offer. Therefore, in applying outcome-oriented PPM, the organisation assesses to which extent a user might achieve an expected outcome.
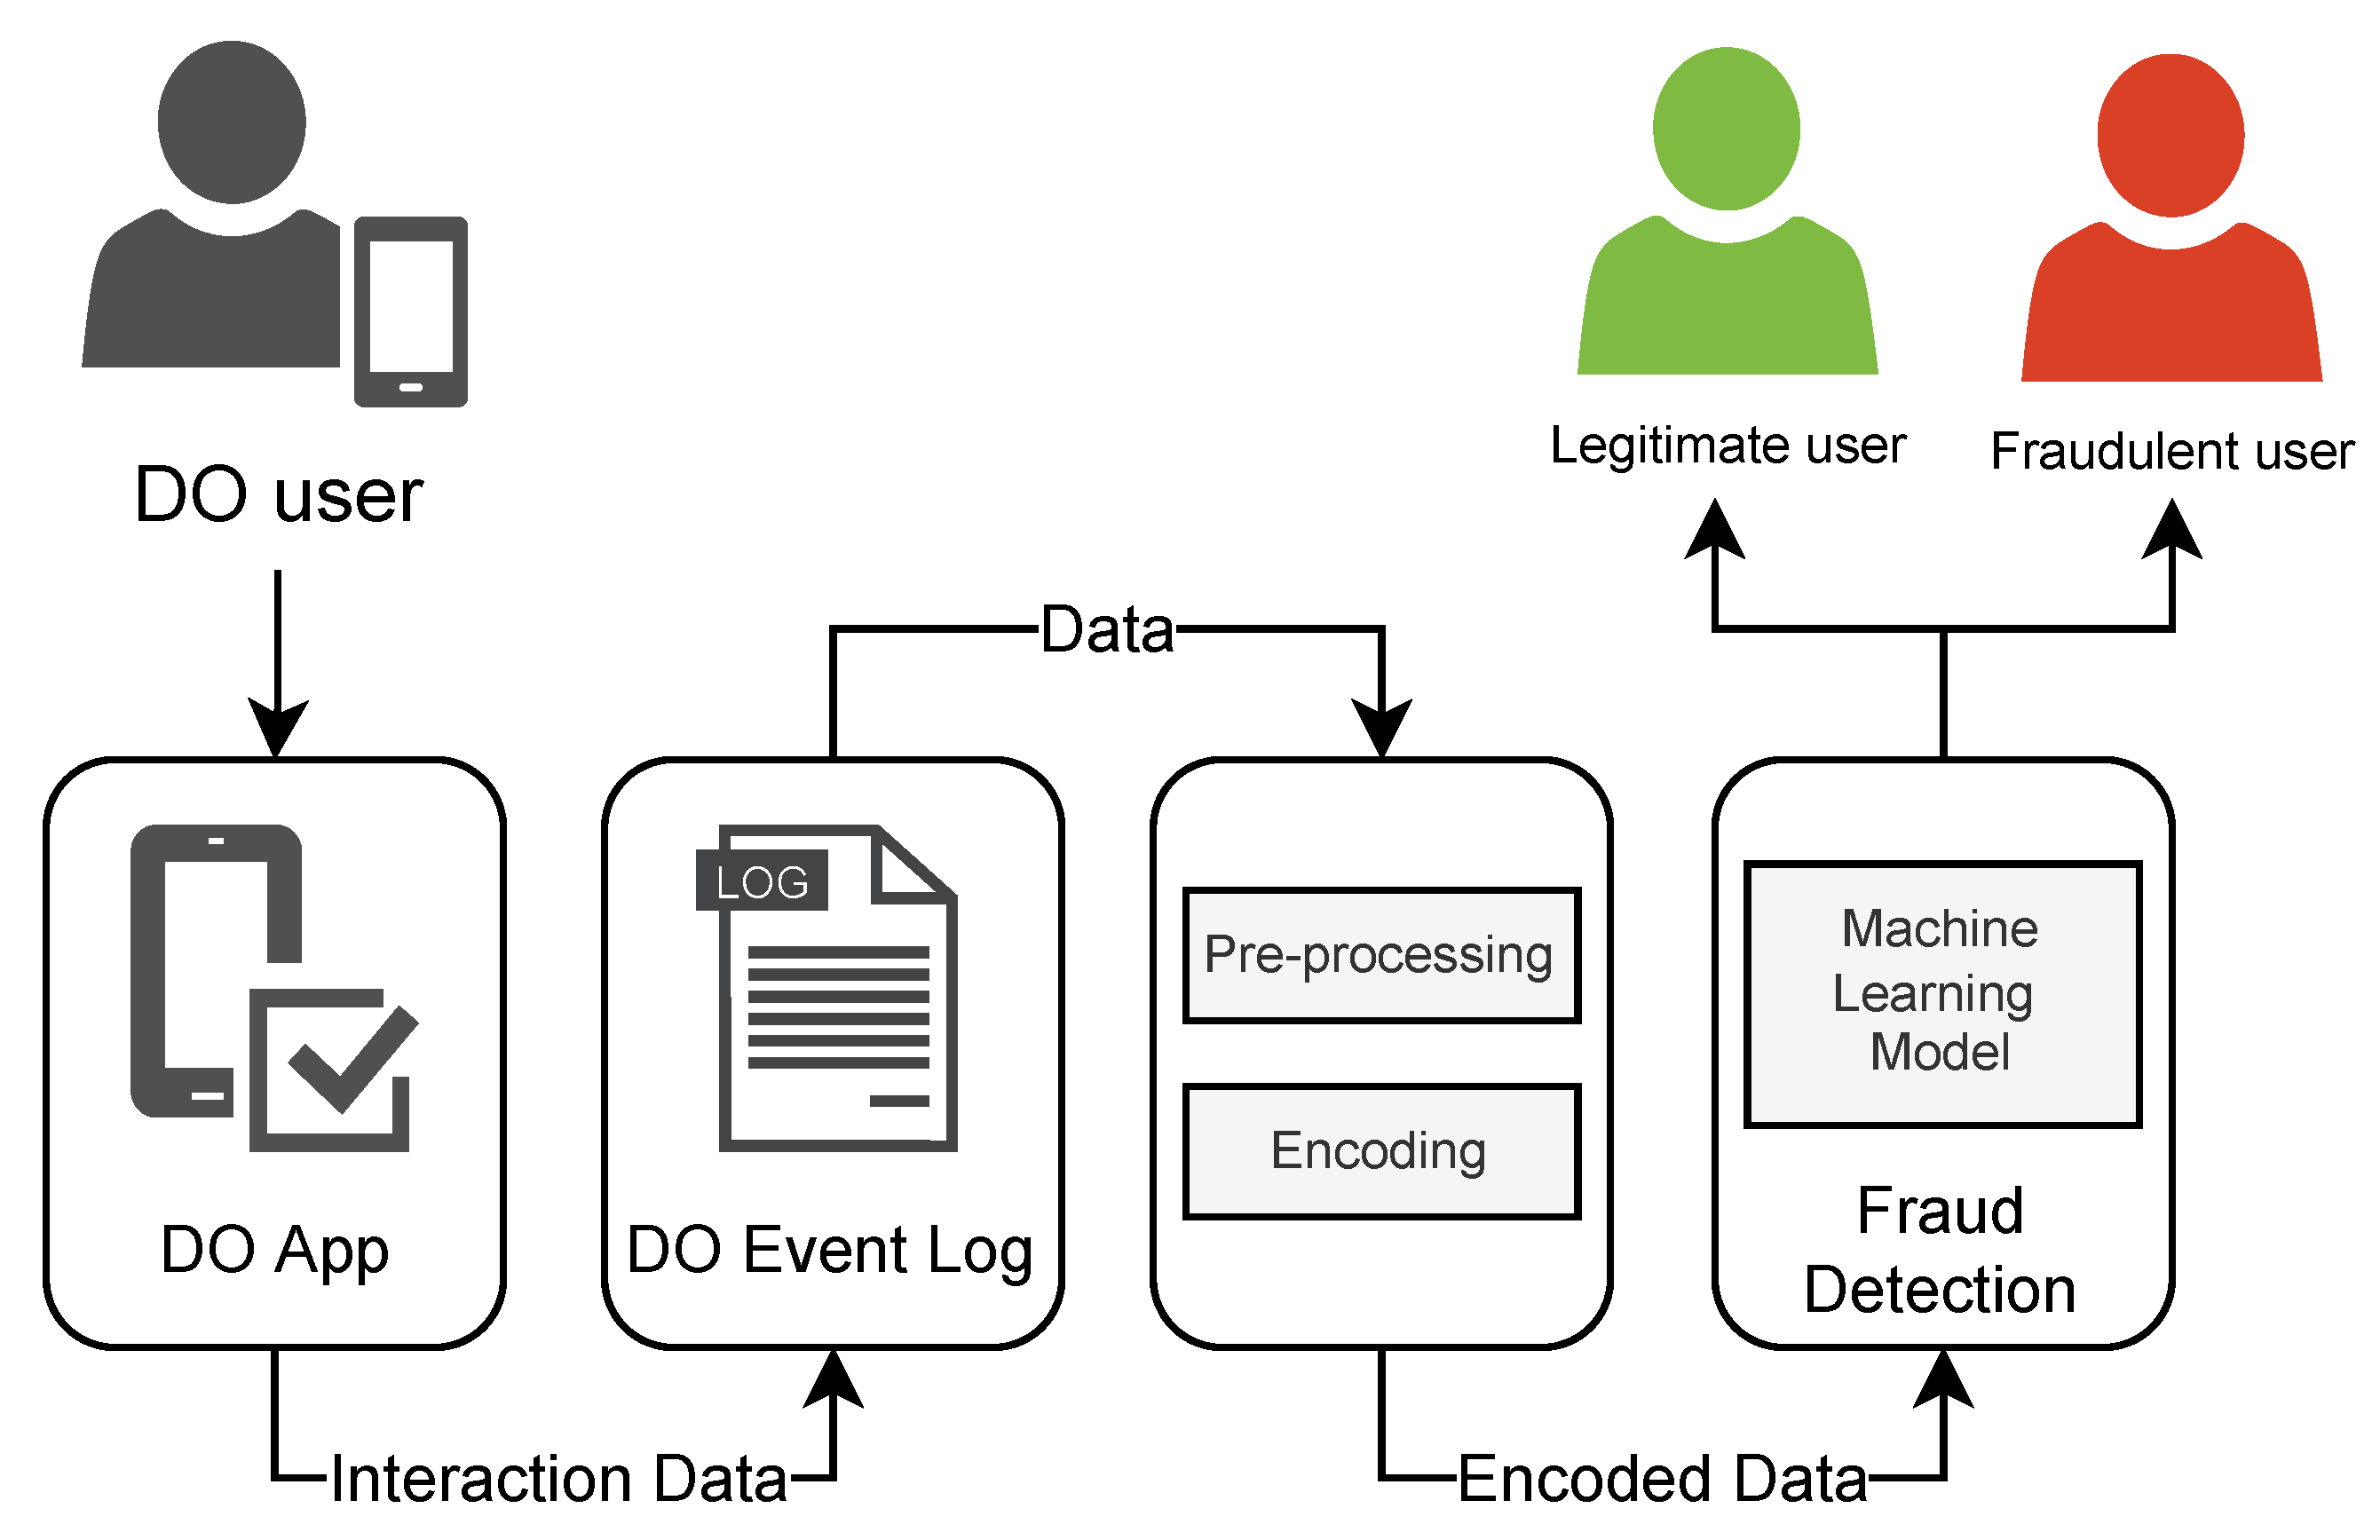
This work aims to propose the usage of PM to mitigate identity fraud in DO. The approach consists of three steps: a combination of event-level and trace-level analysis techniques in a labelled dataset to identify a common sequence of activities done by fraudulent and legitimate users; a representation of these sequences in a vector space using the word2vec algorithm, where similar sequences are closer together; and finally, the classification of embedded vectors with a machine learning (ML) algorithm. The approach used by this work is capable of identifying fraudulent accounts by their DO data with an accuracy of 80% with both random forest (RF) and XGboost (XGB) ML models.
An important contribution of this work is the use of process discovery in DO. By leveraging PM techniques, our approach elucidates the underlying behaviour of fraudulent users of DO. This means treating DO as a sequence of processes gives the ability to classify users in a nondisruptive way to the DO process itself, as it does not require direct user actions such as taking a selfie or collecting a fingerprint. Furthermore, the approach is designed to protect user privacy and personal information, as it only requires data about their interaction with the system, without the need for personal data collection. A side result we obtained is the creation of a dataset of the event logs from the DO process carried out by fraudulent or legitimate fintech accounts.
The remainder of this paper is organised as follows. Section 2 brings a review of related works on the use of PM for fraud detection in the literature. Section 3 provides the necessary background on predictive process monitoring for this work. Section 4 describes in depth the dataset developed for the production of this work, in addition to the processing performed on the analysed data. Section 5 presents the results obtained. Section 6 brings important discussions regarding the obtained results and finally, Section 7 concludes the work.

2. Related Work

PM has a wide range of potential applications in financial systems. It can be used to identify patterns and bottlenecks in processes, optimise workflows, and detect fraudulent activities [4]. In particular, process mining can be applied to improve customer experience by analysing customer behaviour and identifying areas where processes can be streamlined to reduce wait times or improve service quality [11]. In addition, process mining can be used to improve compliance with regulatory requirements, such as anti-money-laundering regulations, by identifying and analysing suspicious transaction patterns [12]. Furthermore, process mining can be used to optimise backoffice processes, such as account reconciliations and invoice processing, by identifying inefficiencies and opportunities for automation. These are just a few examples of the potential applications of process mining in financial systems, and as the technology continues to advance, there may be even more opportunities to improve financial processes and services.
Although works that specifically use PM to mitigate identity fraud in DO of financial systems were not found in the literature, there are several other interesting cases of the use of PM and data mining techniques to detect fraud in different domains, such as the work of Alvarenga et al. [13], which proposed the use of PM and hierarchical clustering in network intrusion alerts generated by intrusion detection systems (IDS). The approach aimed to extract information about the behaviour of attackers in the context of cybersecurity and elucidate the underlying strategies used by attackers to compromise networks in a friendly high-level way. As in our proposal, the work of Alvarenga et al. [13] was capable of modelling unwanted behaviours in its domain; however, its scope was limited to only viewing behaviours identified as unwanted by third parties, while our proposal goes further by training classifiers to identify new instances as fraudulent or legitimate.
In the context of financial systems, the work by Sarno et al. [14] proposed a hybrid method between association rule learning (ARL) and PM to create an automated solution for detecting credit card fraud based on historical data. The proposed method used data-aware PM to extract not only activities (e.g., “made”) but also a value associated with that activity (e.g., “amount of loan requested”). After applying PM, there was a validation stage with an expert who identified fraudulent behaviour in the data extracted by PM. Based on behaviours extracted by PM and identified as fraudulent by the expert, association rules were used to classify new cases.
In the study conducted by Werner et al. [15], they explored the integration of process mining into the audit of financial statements. The audit of financial statements is a highly specialised and complex process, and the increasing digitisation and automation of transaction processing have created new challenges for auditors, as the human component in the manual audit procedures can introduce a vulnerability to error and fraud. A field study was conducted to examine the impact process mining can have if incorporated into contemporary audits by analysing relevant audit standards. The results showed that process mining could be successfully integrated into financial statement audits in compliance with contemporary audit standards and accepted practices, providing a more reliable and robust audit evidence by replacing manual audit procedures.
The work of Jans et al. [12] conducted a case study on applying PM to discover transactional fraud in internal purchase orders of a financial institution. A process diagnosis was carried out, which basically consisted of a series of extensive analyses executed with the help of experts and the ProM [16] tool to infer not only the actual structure of the purchase order process but also to identify potential vulnerabilities. The second stage of the case study was responsible for validating different aspects of the structures inferred in the first stage. Unlike our proposal, the objective of Jans et al. [12] was not to model the behaviour of the user as they went through a fixed process, but rather to create rules and controls that were robust enough so that orders that did skip or violate a step in the designed process could be considered fraudulent (e.g., an order above a certain amount was placed without receiving an approval first).
Despite all of these applications, there is still a gap when it comes to the application of PM for fraud detection in DO. By analysing the event logs generated during the DO process, process mining algorithms can identify patterns and anomalies in the user behaviour, such as the use of fake documents or the manipulation of data, that may indicate fraudulent activity. Process mining can also provide insights into the effectiveness of fraud prevention measures, such as identity verification methods and screening processes. By detecting potential fraud early on, financial institutions can prevent losses and avoid reputational damage. Overall, process mining can provide valuable support for fraud detection in DO, helping financial institutions to identify and mitigate risk more effectively.

3. Predictive Process Monitoring

PM is a body of knowledge, foundations, and techniques that propose a data-driven approach to extract insights about organisational business processes [7]. Being a data-based approach, methods take as inputs event data that store the execution of activities within a process. A unique event records the enacting of an activity along with several possible attributes, such as timestamp, resources, and costs, among others. Note that an activity is also an event attribute. It is important to consider that a business instance may contain several events which can be grouped. Events belonging to the same instance are recognised by their case identifier. It follows that all events affiliated with the same business process compose an event log.
Definition 1 
(Event, Attribute, Case, Event log). Let Σ be the event universe, i.e., the set of all possible event identifiers. Σ * denotes the set of all sequences over Σ. Events may have various attributes, such as a timestamp, activity, resource, cost, and others. Let AN be the set of attribute names. For any event e Σ and an attribute a AN , # a ( e ) is the value of attribute A for event e. Let C be the case universe, that is, the set of all possible identifiers of a business case execution. C is the domain of an attribute CASE AN . An event log L can be viewed as a set of cases L Σ * , where each event appears only once in the log, i.e., for any two different cases, the intersection of their events is empty.
Naturally, a case contains the sequence of activities executed in a process instance, i.e., its trace. Different cases may share the same trace, hence having the same activity sequence. Each unique trace is considered a variant of the process. Therefore, a process may contain one or multiple trace variants with different frequencies.
Definition 2 
(Trace). A trace is a nonempty sequence of events σ Σ * , where each event appears only once and time is nondecreasing, i.e., for 1 i < j | σ | : σ ( i ) σ ( j ) . With an abuse of notation, we refer to the activity name of an event # activity ( e ) as the event itself. Thus, a , b , d denotes a trace of three subsequent events.
Predictive process monitoring (PPM) is a branch of PM that focuses on forecasting the future of an ongoing case [10]. It follows that there are several tasks within PPM. For instance, one can predict the remaining time of an ongoing case [17], the next activity to come [18], or the outcome of a given instance [10]. PPM has seen a major uptake in both industry and academia in the last few years mostly due to the compatibility between predictive techniques grounded in data mining and ML in combination with process science [19]. Furthermore, the area has benefited from using deep learning techniques that inherently capture the sequential data’s characteristic, which is also a common aspect in event data [20].
In this work, we target outcome-oriented PPM, i.e., the task of predicting the outcome of a given process instance. For example, in a reimbursement process, the user is interested in knowing if the request was accepted (positive outcome) or rejected (negative outcome). For that, capturing the relationships between process attributes is fundamental to correctly mapping the correlations between trace behaviour and expected outcomes. Therefore, properly encoding event data becomes a crucial aspect of outcome-oriented PPM. As stated by Fani et al. [19], the fundamental component shared among PPM approaches is the transformation method used to obtain a fixed-length representation of process instances. The importance of encoding techniques was also assessed by Barbon et al. [21]. The authors used several candidate encoding techniques in the context of anomaly detection, which, similarly to outcome-oriented prediction, is a classification problem. The main insight was that there is no unique encoding technique that can be applied to all event logs; however, carefully choosing the transformation method may leverage the quality of posterior techniques applied in the pipeline.
In traditional PPM applications, the goal lies in predicting the future context of incomplete case instances [9]. For this particular application, we aim at predicting the nature of a complete case. This problem is valuable due to the context of the application. New users creating an account may be submitted to a manual inspection (performed by experts) to verify if the user is a fraud suspect. Considering that expert knowledge is resource-consuming and oftentimes not available, our goal is filtering possible fraudulent behaviour and freeing expert time. PPM is an important tool for fraud prevention in today’s digital age. By analysing patterns and trends in past data, PPM is able to make predictions about future behaviour and identify potential fraudulent activity before it occurs. It also provides a powerful and efficient way to monitor complex digital processes, such as DO, and quickly detect any anomalies or irregularities [22], which allows companies to stay one step ahead of fraudsters and protect their customers’ data and financial security.
We built upon the traditional PPM prefix function:
Definition 3 
(Prefix function [9]). Given a trace σ = e 1 , . . . , e n and a positive integer l n , p r e f i x ( σ , l ) = e 1 , . . . , e l .
Consequently, in our application, l is always equals n. Given a trace, outcome-oriented PPM aims to forecast its associated label, i.e., its class.
Definition 4 
(Labelling function [9]). A labelling function y : S Y is a function that maps a trace σ to its class label y ( σ ) Y with Y being the domain of the class labels. For outcome predictions, Y is a finite set of categorical outcomes.
As stated previously, outcome-oriented PPM techniques heavily rely on ML-based classifiers. A traditional classifier takes as input a set of features describing the phenomena’s behaviour (independent variables) and their associated labels (dependent variable). Hence, it is necessary to transform event data to a format that is expected by classifiers.
Definition 5 
(Encoding function). Let an event log L, the encoding is a function f e that maps L to a feature space, i.e., f e : L R n where R n is an n-dimensional real vector space.
The encoding technique may then capture trace behaviour (i.e., relationships between the sequence of activities) and also additional trace attributes. Since additional trace attributes contain important information about the underlying process nature, we take advantage of the timestamp attribute as it may characterise frauds. Given the transformed event space, a classifier assigns a label to a feature vector.
Definition 6 
(Classifier [9]). A classifier c l s : X 1 × · · · × X p Y is a function that takes an encoded n-dimensional sequence and estimates its class label.
The induction of a classifier is performed by providing the encoded event data and its corresponding classes, known as the training phase. Given a new case, first, the case is projected into the transformed feature space, then the classifier indicates to which class the process instance belongs, i.e., in our application scenario, normal or fraudulent behaviour.

4. Material and Methods

Our proposal can be understood as a PM pipeline based on a classification using machine learning. Figure 1 provides an overview of the proposed approach. During the DO process, a user’s interactions with the financial system are recorded through event logs. These event logs undergo preprocessing and are embedded with PM techniques to bridge the gap between PM and ML. Finally, proper ML algorithms are used to classify the event log. Our methodology is discussed in greater detail in the following subsections.

4.1. DO Event Log

Our study was developed with real data obtained from the partnership with a Brazilian fintech. The partner fintech (https://bancobari.com.br/, accessed on 1 January 2023) provided access to historical data from its DO process and the identification of fraudulent accounts. The event log was anonymized and made available in accordance with the Brazilian General Data Protection Law (LGPD), in order to protect sensitive information from the bank’s customers. The use of these data allowed the method proposed by this work to be faithful to the reality of the challenges faced by a fintech in the context of DO.
The event log dataset was built using two distinct data sources. The primer dataset was a database of DO event logs composed of records that contained the type, the timestamp, and a unique lead identifier used to correlate events originated by the same onboarding attempt. The second dataset, from which the historical fraud labels were extracted, was formed manually by the partner fintech’s fraud prevention team with the analysis of account opening attempts. The fraud prevention team acted on the final step of the onboarding process, distinguishing legitimate and fraudulent accounts. The dataset generated from the union of these two sets was capable of identifying if a certain event was related to a fraudulent or legitimate account. It had the following fields: EventType, Timestamp, UserId and Status. In total, 61,101 traces were collected from October 2020 to October 2022, from 30,930 fraudulent accounts and 30,171 legitimate accounts, providing us with a balanced data set in terms of examples per class. The Table 1 and Table 2 show the values that the EventType field could assume during DO. It is important to note that the events associated with a user may have been generated directly by the user’s own action (e.g., EmailInsertion), or by the action of the bank’s internal services (e.g., EmailVerified).

4.2. Data Preprocessing and Encoding

Event data can be grouped and analysed from several perspectives. For instance, at the event level, one can identify if the expected actor executed the activity and if there is missing information or noise in the data. Moving to the trace level, an expert can identify the most common variants (sequence of activities) that appear in the log and detect infrequent paths and cluster traces by similarity. Then, at the log level, a stakeholder can obtain a complete overview of the business process, such as its underlying process model. What is important to highlight is that event data contain levels layered in different granularities. Therefore, traditional PM-based solutions already incorporate PM notions (e.g., event, case, trace, log) inherently. However, classical data mining techniques do not have the sensibility to ingest and interpret event data as techniques are historically built to deal with tabular data. This is often mentioned as the mismatch at the representational level between PM and data mining [23].
Considering the posed representational mismatch, to bridge the gap between PM and data mining, it is necessary to project the event log into a numerical feature space. Trace encoding techniques are then a crucial step to overcome this issue and have been applied to several PM tasks [21,24,25,26]. Leontjeva et al. [25] used hidden Markov models for complex sequence encoding based on indexes. Polato et al. [26] proposed a last-state encoding method for activity and time predictions in processes. Koninck et al. [24] applied both word2vec and doc2vec for trace embedding in several layers, being able to represent activities, traces, logs, and models. The application of natural language-inspired embeddings was explored recently in the literature [27,28] showing significant success. One advantage of using word embeddings is that they may capture long-term relationships and that event data contain descriptions of actions being taken. Therefore, a trace could be interpreted as a sentence since it is composed of a set of words, i.e., activities.
Building upon the hypothesis that traces are sentences, we applied the word2vec algorithm [29]. Word2vec is a breakthrough in the word-embedding literature as it adopts neural networks to generate word representations. The embeddings come from the weights of a two-layer neural network specialised in reconstructing the linguistic context of words in a document. As a consequence, words appearing in a similar scenario are closer to the projected feature space, meaning they are related. In the process domain, traces belonging to similar variants (similar word sequences) sit in the same region of the projected space. Therefore, the encoding function aims at maintaining the distances in the event data space but is now represented in an n-dimensional numeric space, enabling the application of data mining techniques. Given the complex nature of the studied application, we explored several configurations of feature vectors and window sizes. The best results were obtained with 16 as the vector size and 5 for the window size.
As discussed in Section 3, additional attributes contain valuable information regarding the process execution. Thus, to enhance the representational quality of the encoded feature space, we concatenated the projected vectors with complementary time features extracted from the cases. For that, we computed the time differences between the activities’ execution within a case. Then, we extracted several statistical measures based on the set of time differences. This way, given a vector of differences, the extracted features were size, minimum, maximum, mean, median, mode, standard deviation, variance, the 25th and 75th percentiles, interquartile range, weighted geometric mean, weighted harmonic mean, skewness, kurtosis, coefficient of variation, distribution entropy, and the histogram skewness and kurtosis. The final feature vector was composed of 54 dimensions. The projected feature space was then composed of the encoded traces using word2vec combined with the statistical measures extracted from time differences.

4.3. Fraud Detection

Once the gap between PM and data mining has been closed thanks to the representation of DO traces in a vector space in the previous step, it is possible to apply supervised ML algorithms to identify classes by extracting latent patterns in the data. The classes to be identified refer to the user’s registration quality during DO (fraudulent or legitimate).
A common characteristic of datasets in the context of fraud detection is the imbalance of classes, where there is usually a greater number of instances of legitimate cases in comparison to fraudulent ones. With that in mind, we compared the performance and feature importance provided by two algorithms capable of dealing with imbalance for the fraud detection task: RF and XGB. In addition, both have been successfully used in the literature to combat transactional fraud in the financial world [30].
Two important aspects come from the use of the decision-tree-based algorithms RF and XGB. The first and perhaps most obvious is the ability to train algorithms to identify fraudulent instances on the dataset of DO events. The second aspect is that these algorithms also allow the identification of the most important features for carrying out the classification. This means that these algorithms are capable of detecting fraud in a way that is accurate and clear to stakeholders.

5. Results

We organised our results considering two perspectives: PM (Section 5.1) and fraud detection performance (Section 5.2). Both perspectives comprise achievements and performance metrics to support our claimed contribution. The discussions and insights provided are organised in Section 6.

5.1. PM Perspective

Not in vain, the most researched area within PM is process discovery [18]. Process discovery techniques aim to capture the relationships between activities and produce a model that can be easily interpreted by humans. Stakeholders benefit from discovery methods by understanding how in reality the process is being executed, uncovering its underlying behaviour. To discover the model for our study case, we chose the heuristic miner (HM) algorithm [31] given its wide use in research and industry. HM takes frequencies into account and hypothesises that infrequent transitions should not be presented in the model (as they are often outlier behaviour). For that, the algorithm first discovers the directly follows graph representing the activities transitions. Then, using frequencies, a dependency measure is derived and used to guide the creation of a dependency graph. Transitions below a threshold are excluded from the dependency graph. Finally, splits and joins are introduced to represent concurrency.
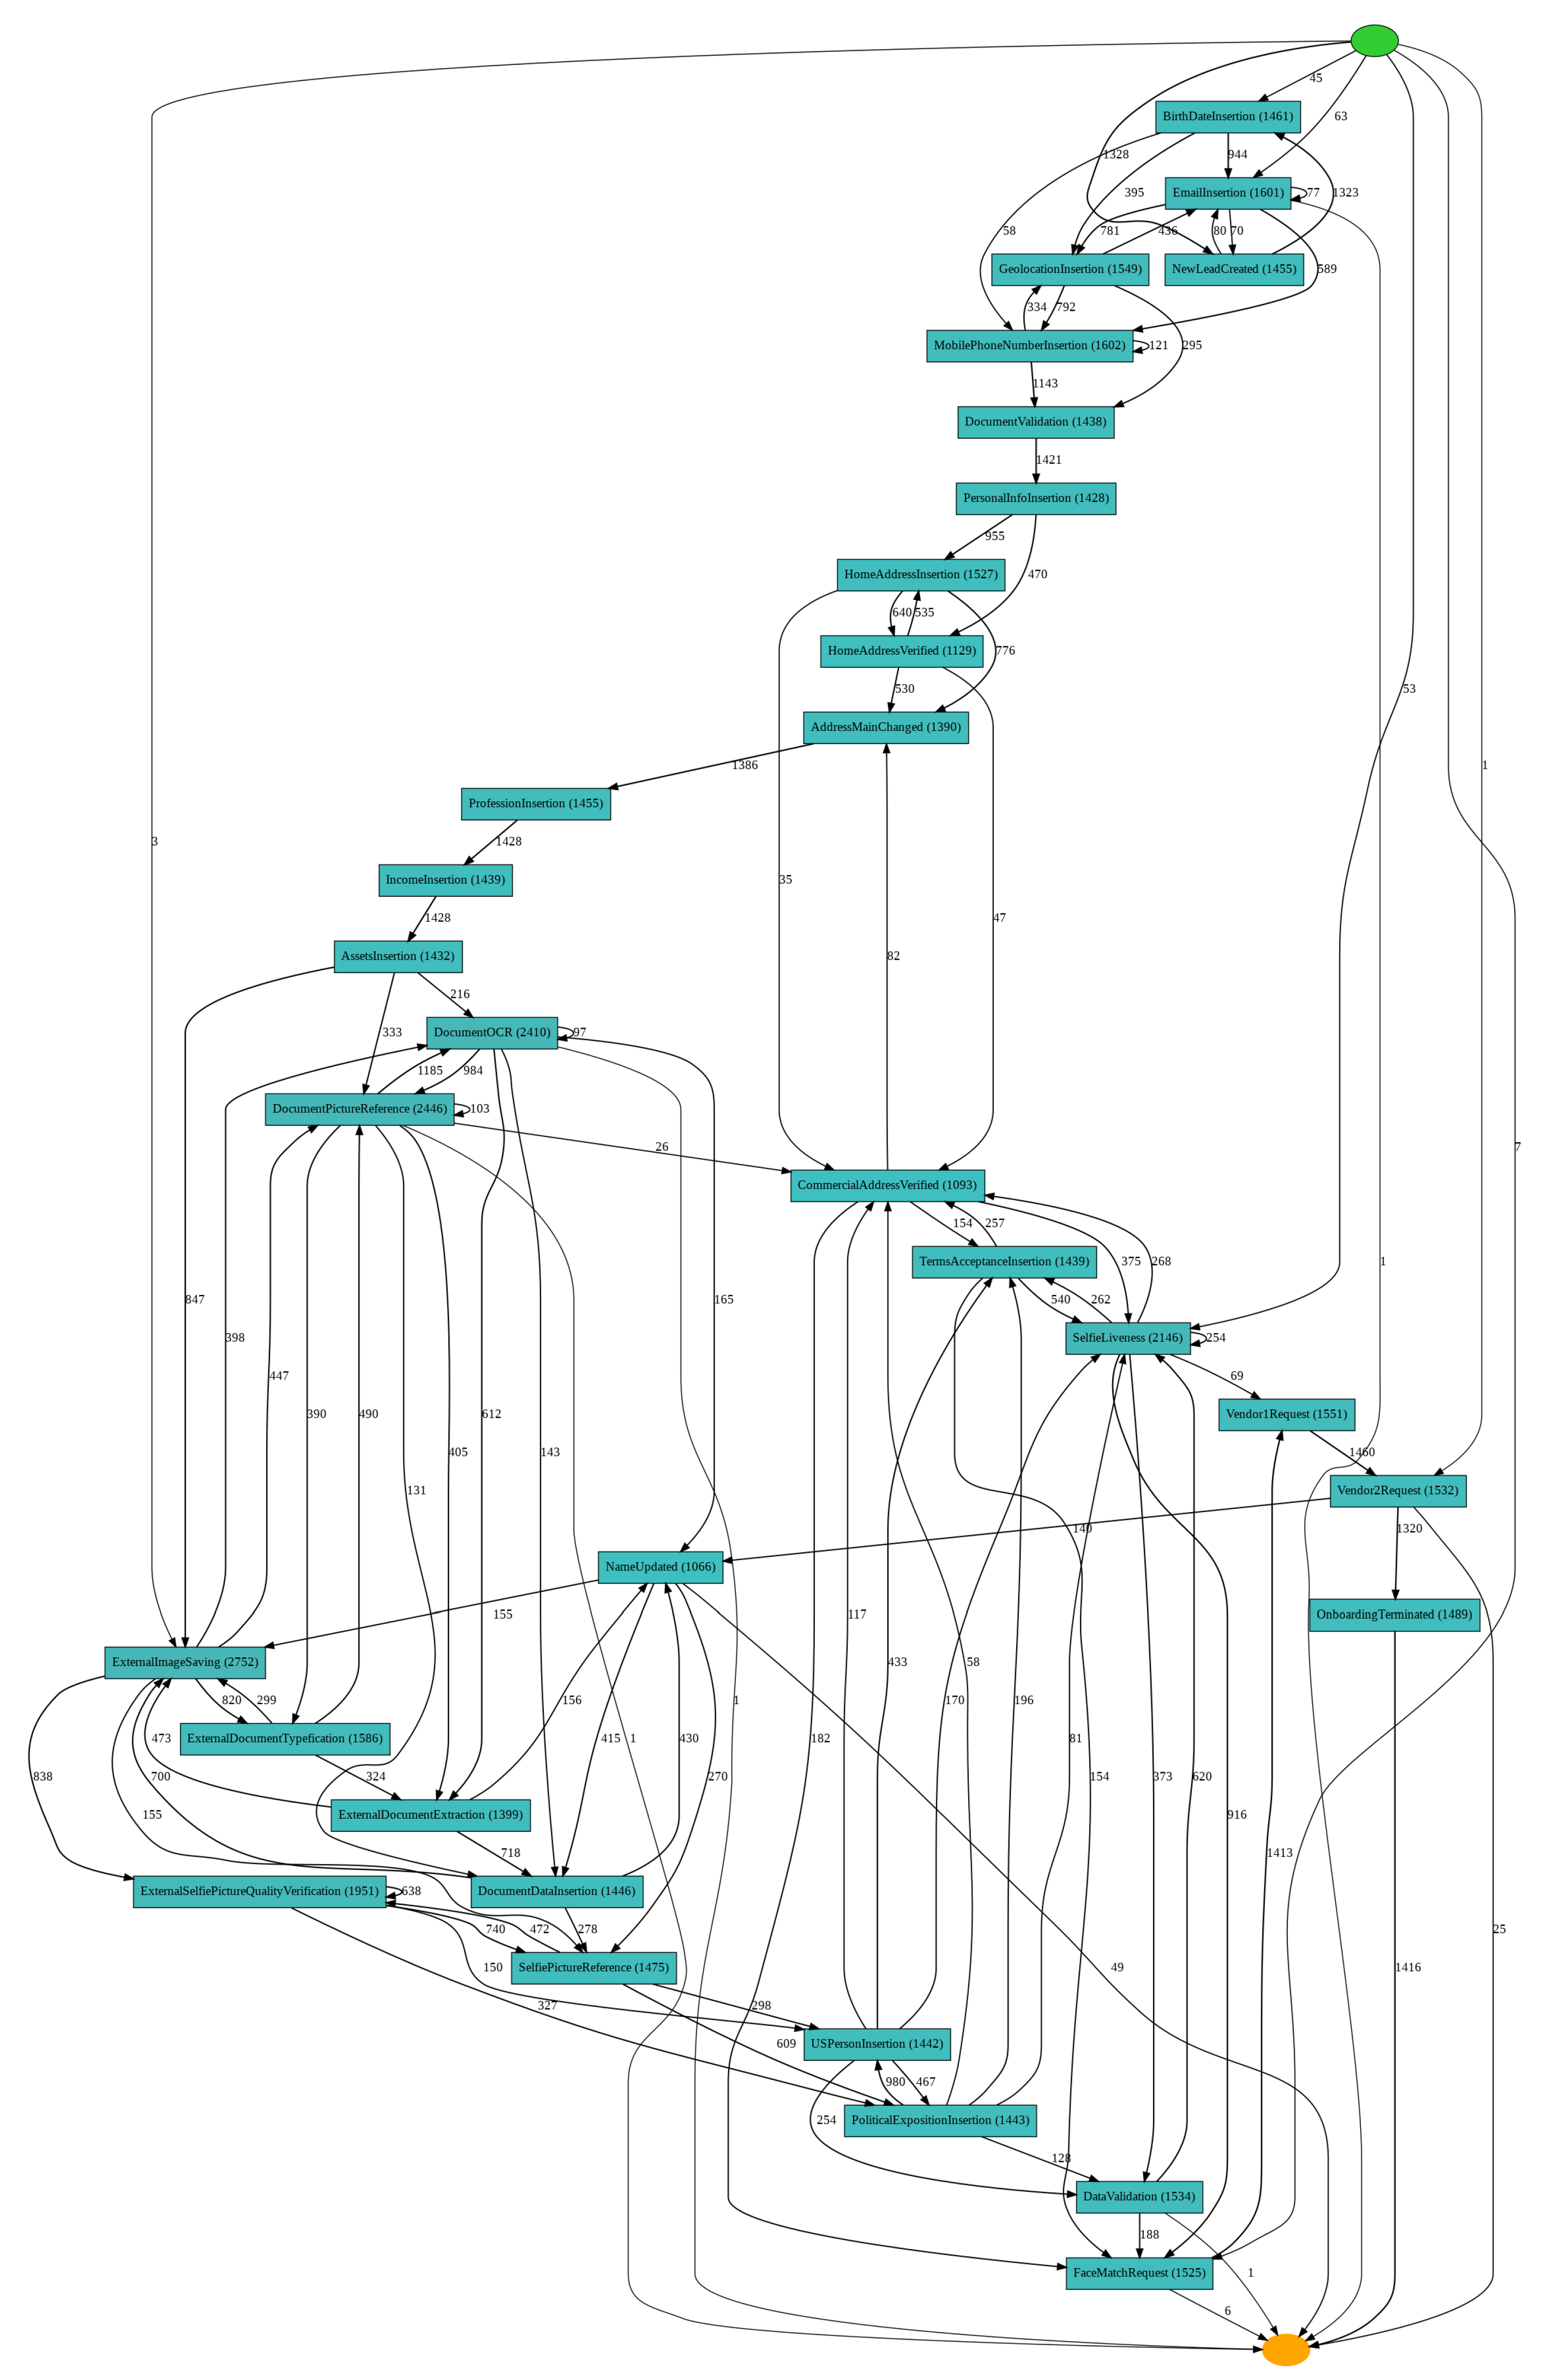
Figure 2 demonstrates the resulting model after submitting the event log to HM. As we can see, the model had a considerable complexity given the number of transitions between several activities. Nevertheless, many patterns could be identified. For instance, the NewLeadCreated activity appeared as the most frequent starting activity (1328 cases out of 1500). This kind of analysis is relevant to fraud prevention as it provides important insights regarding users during DO. Stakeholders could use this information to better investigate deviations such as the five cases starting with ExternalSelfieLivenessGetProcessDivergent or the three cases starting with ExternalImageSaving. This infrequent behaviour might reveal inconsistencies within the application or possible fraudulent users. The same logic applies for the ending activity, where 1068 cases terminated with OnboardingTerminated. The one case finishing with SelfieAndDocumentFailure or the eleven finishing with DocumentFailure could lead to stakeholders redesigning viable manners to retain a user that goes through failures in the account creation process.
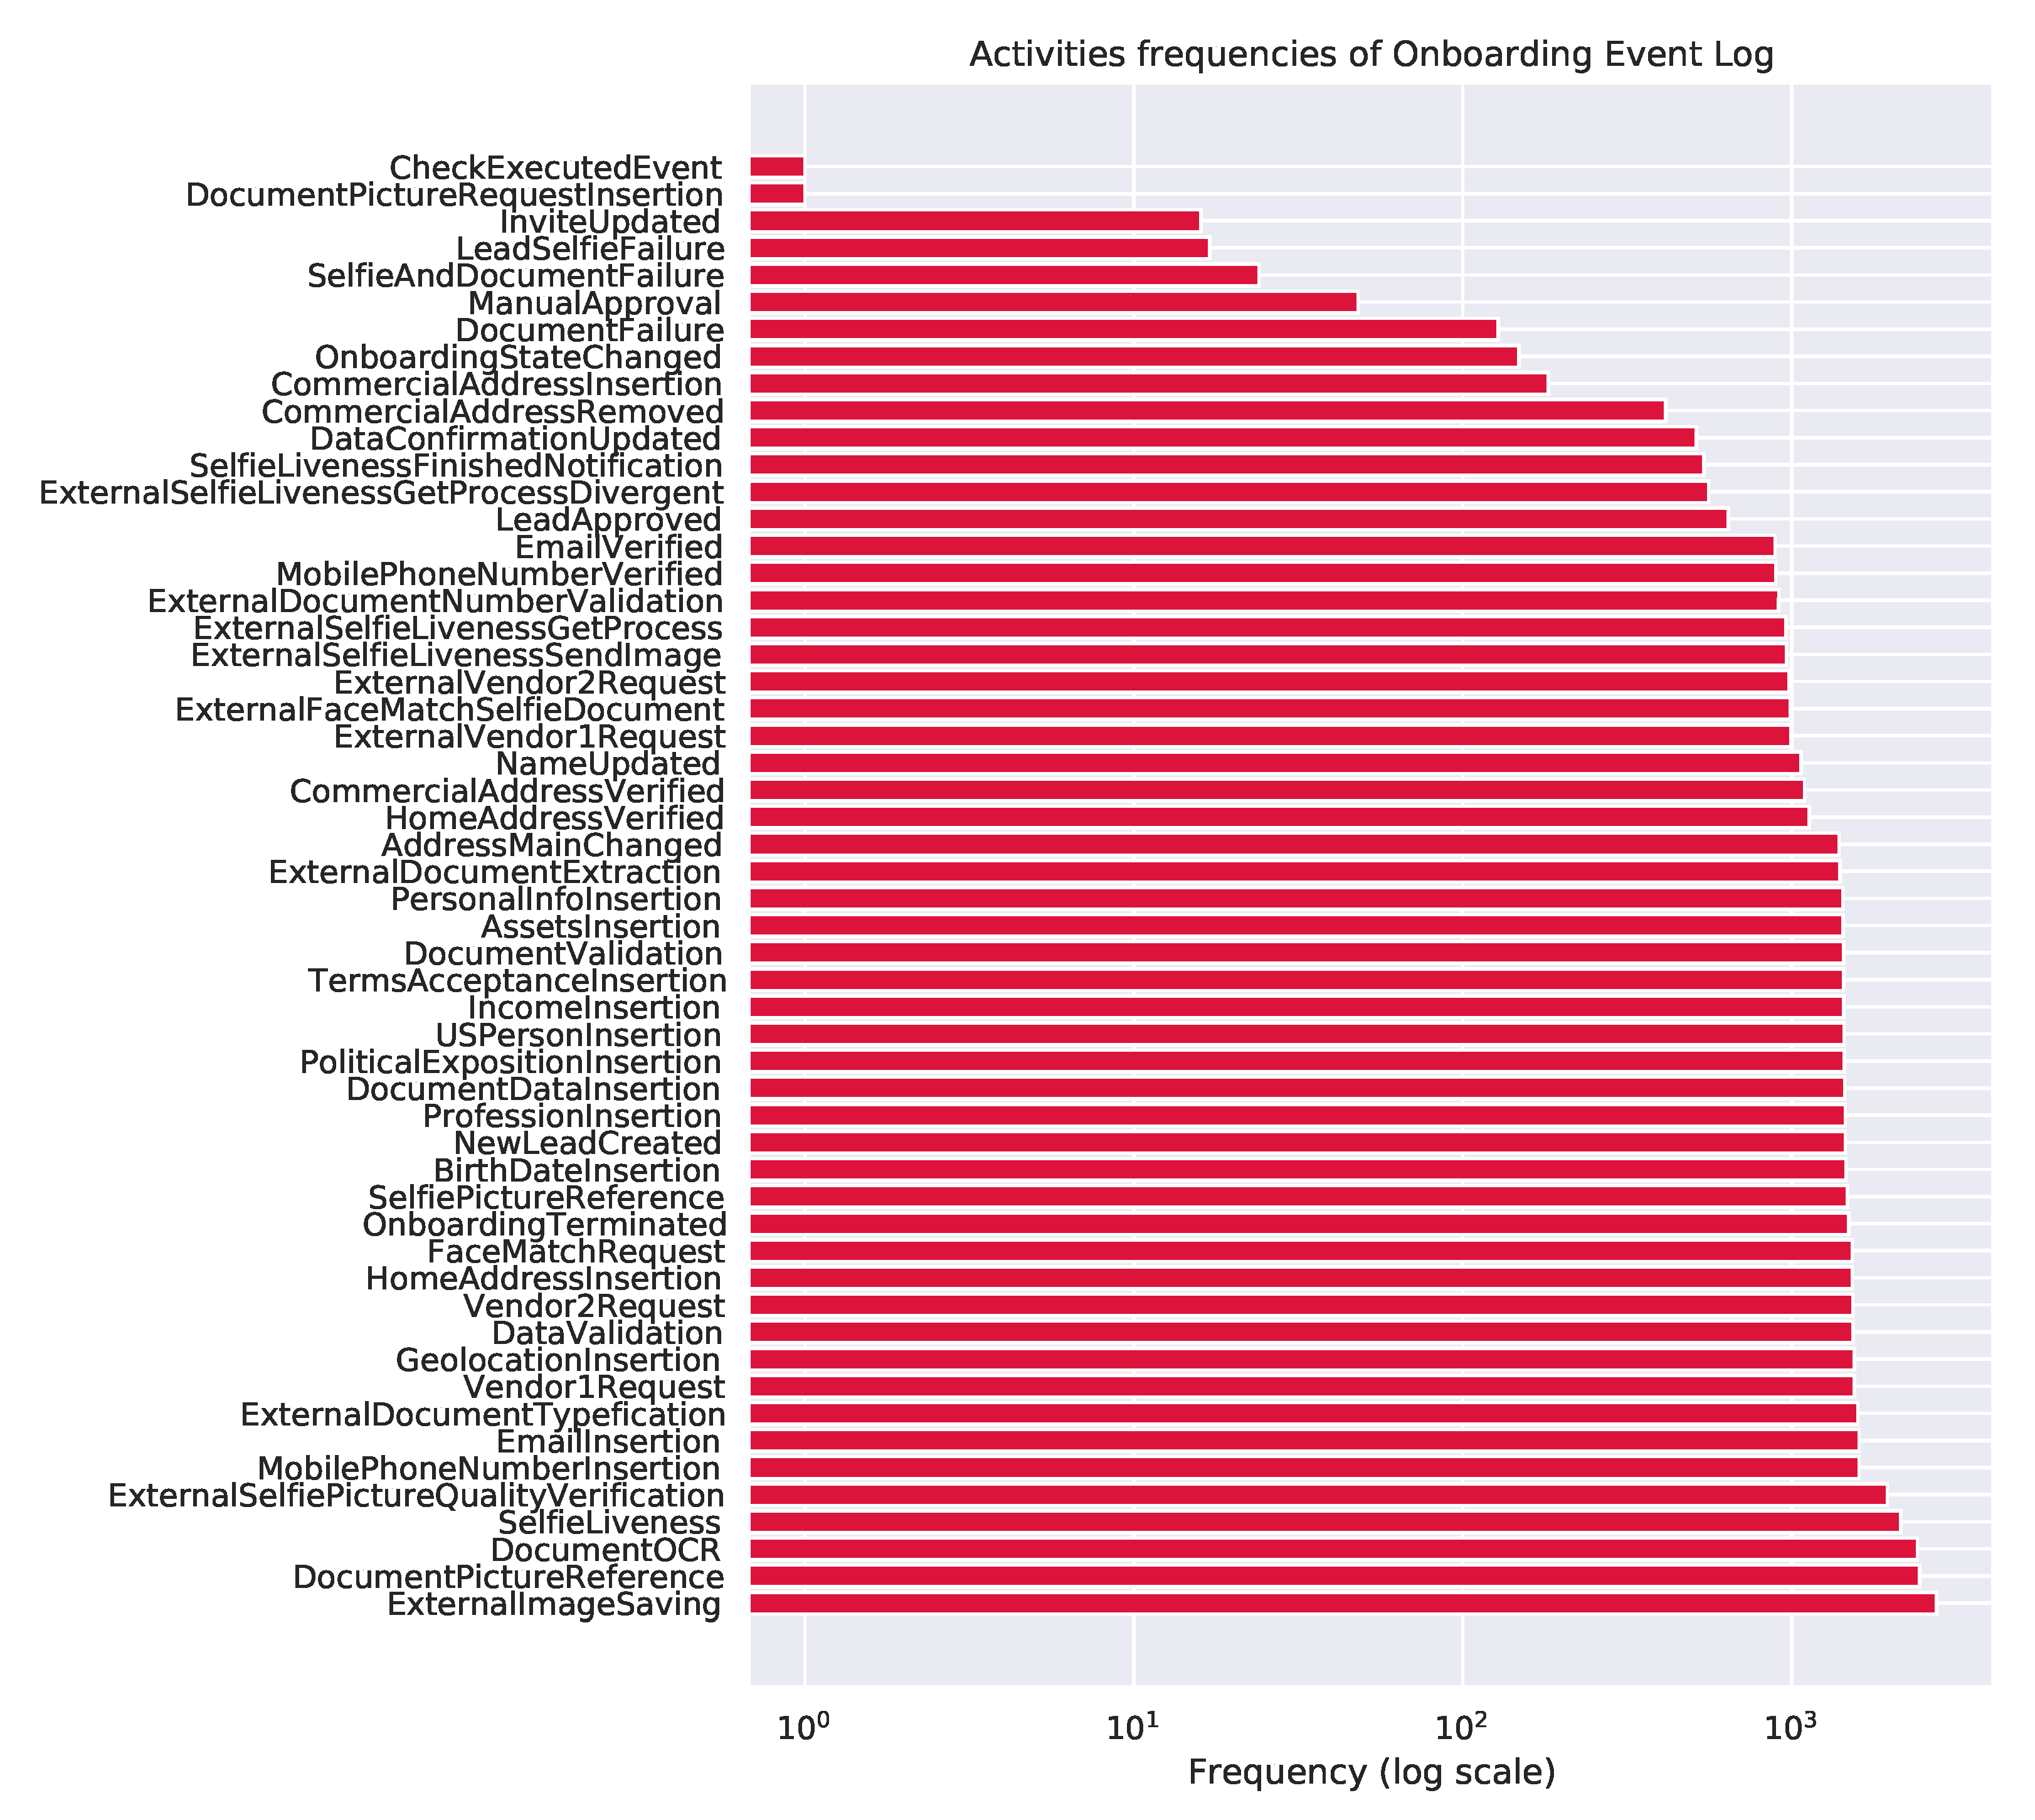
In terms of activity frequencies, significant insights could also be extracted. For instance, the DocumentPictureRequestInsertion and CheckExecutedEvent activities were executed only once in the complete event log. Therefore, stakeholders could simplify the process considering that these activities are corner cases that are difficult to deal with and do not necessarily add value to the process. Making the process simpler is helpful to the whole chain, from stakeholders to system maintainers and users. The most frequent activities represented as EventTypes values found in the base are presented in Figure 3. General process dynamics can also be captured in this representation. Activities MobilePhoneNumberVerified and DocumentValidation seemed to be executed concomitantly after MobilePhoneNumberInsertion. Both also led to PersonalInfoInsertion, heavily indicating that this behaviour was concurrent. Detecting long-term relationships and loops is also valid for system designers that can then improve the software pipeline. Although the directly follows representation is limited in representing some process-related behaviours such as fraud [32], its simple construction allows for nonexperts to better grasp process dynamics and improve the overall service quality.

5.2. Fraud Detection

In the context of fraud detection, the results obtained could be divided between the analysis of the classification models for detecting fraud in the acquired dataset and their interpretability (i.e., their capacity to provide insights into the way the algorithms identify fraud).
The first type of analysis began with the application of a 10-fold cross-validation to compare the RF and XGB ability to identify fraud, this meant that the embedded dataset was split into subsets. Then, the subsets were randomly selected to either test a model or to be grouped back together with the rest of the subsets in order to train the classifier and generate a model. A model must be able to map patterns between attribute values and the class of each instance used in its training, while also being able to do it in future new instances [33]. The selection of folds was repeated ten times, in accordance with the number of folds, where each fold was used for training and at least one time for testing. This type of validation ensured a good setting for evaluating the classifiers since all available data were used and multiple models were generated (ten for each algorithm).
Once trained, each model generated went through the evaluation stage with a test subset. The evaluation was conducted through the analysis of the accuracy metric and F1 score. These two metrics were chosen for their ability to evaluate classification models on an unbalanced dataset, as was the case in this work. The accuracy metric measured only the proportion of the total number of predictions that were correct, while the F1 score took into account the precision and the number of correct positive predictions made out of all positive predictions that could have been made by the classifier (recall). The evaluation consisted of the mean average of the accuracy and F1 score values of the ten models generated by the RF and XGB.
The results of the evaluation step for the RF and XGB classifiers on fraud detection in the acquired dataset Section 4.1 were as follows: the RF classifier had an average performance of 81%, while XGB obtained 80% for the accuracy metric; regarding the F1 score, the results were 79% for both RF and XGB, as shown in Table 3.
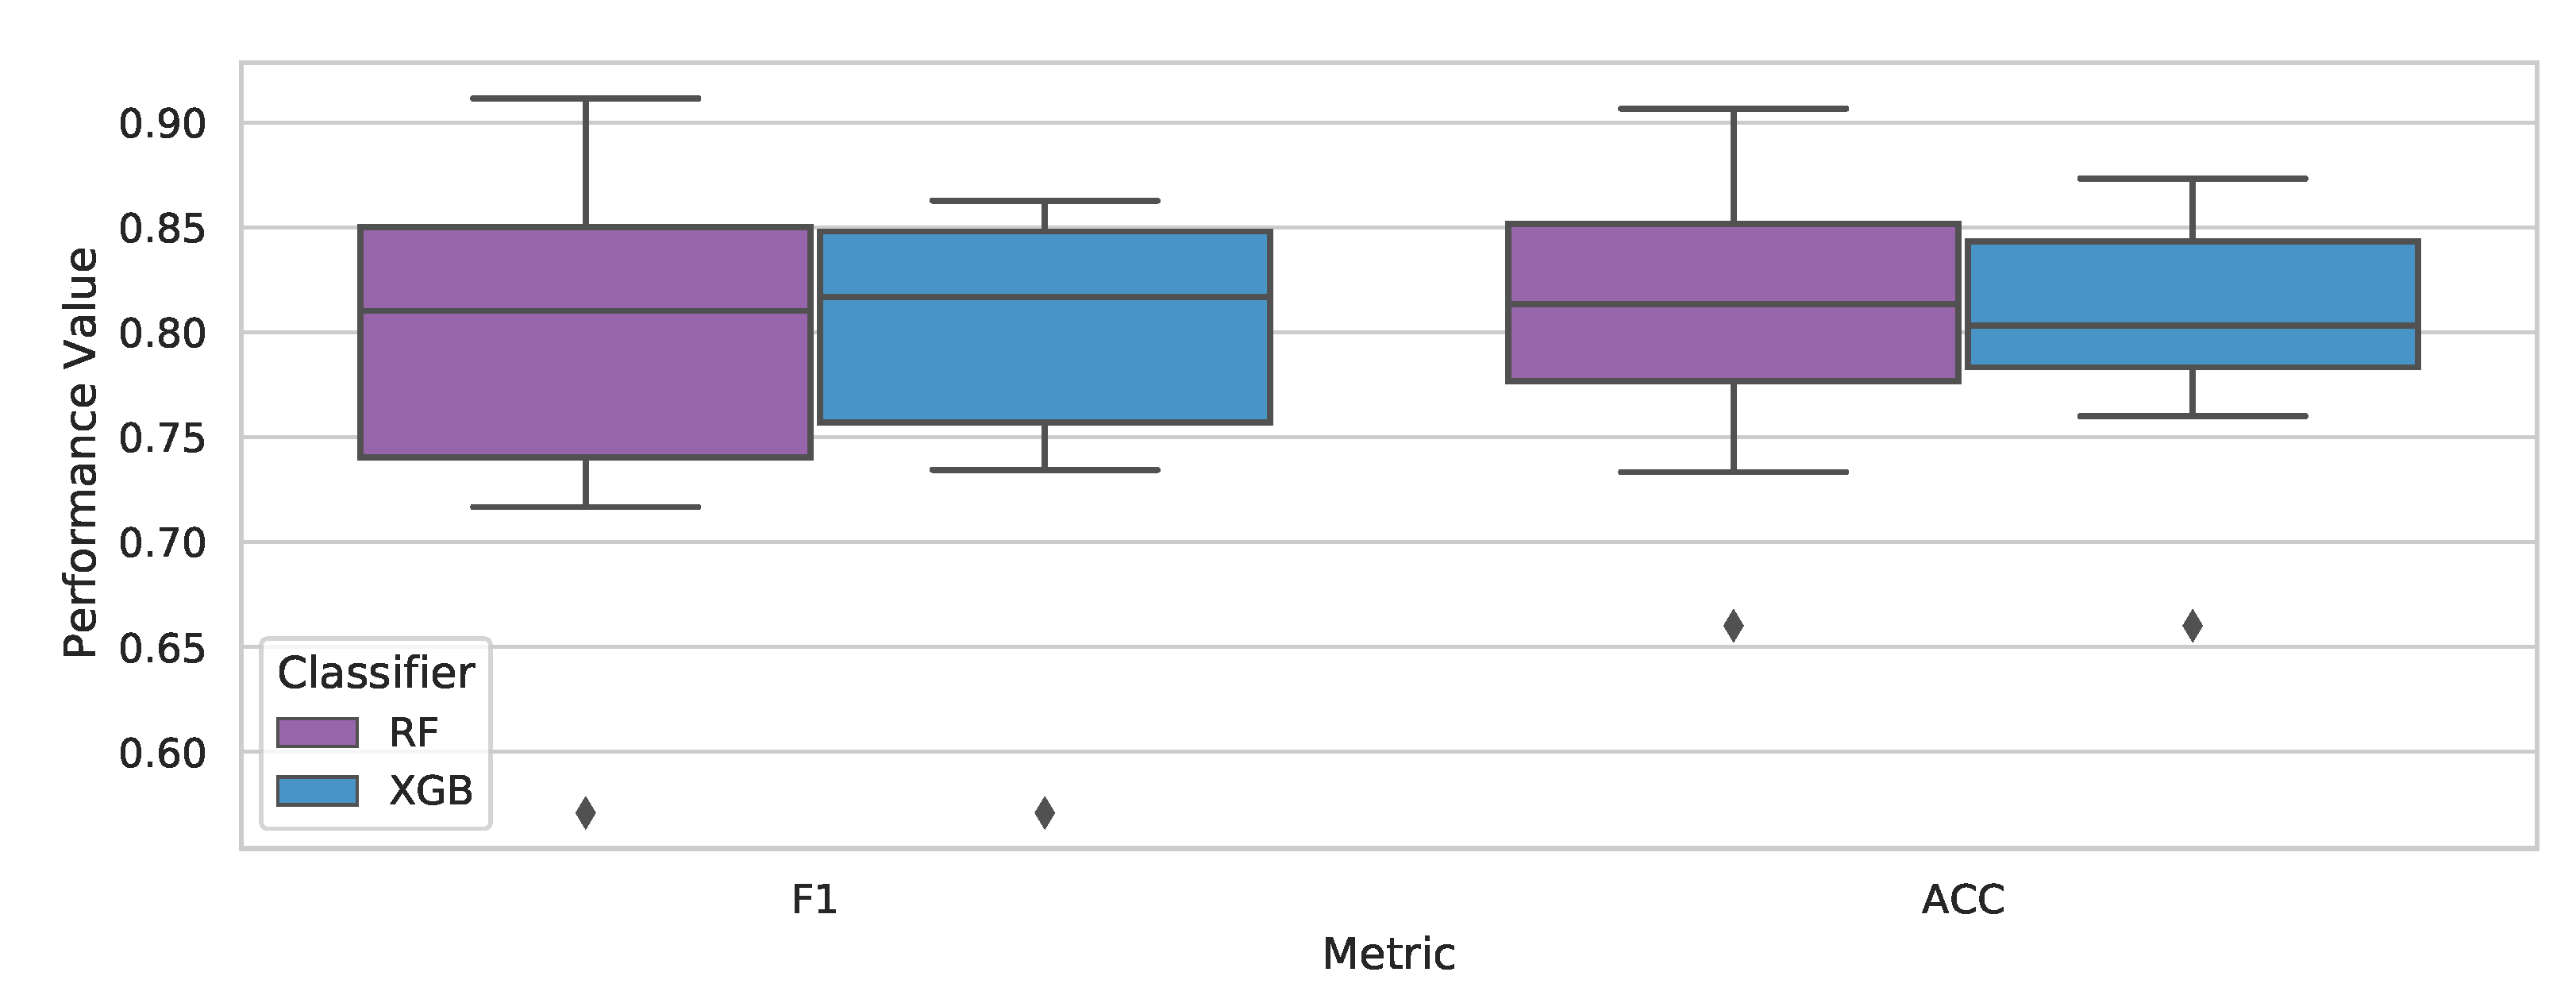
By analysing the boxplot in Figure 4, it was possible to evaluate the RF’s and XGB’s metrics distribution. Both had a negative skewness in the F1 score, which meant that they had a concentration of scores on the lower end of the distribution, between 74% and 81% for the RF and 76% and 82% for XGB. The RF’s higher amplitude (with a maximum of 92%) allowed it to reach greater scores than XGB, but in an inconsistent way. Even though they obtained similar F1 score averages, XGB presented more consistent values, with a smaller amplitude than the RF both for the positive and negative ends of the distribution.
When analysing the accuracy values in Figure 4, we see that the RF also had a larger range from 74% to 91% but with a normal distribution. Despite being smaller, XGB’s distribution presented a positive skewness, which meant that its accuracy values were disproportionately present above its median, towards the higher end.
Since, in the context of the fraud detection task, the objective is to prevent the greatest possible number of fraudulent users from creating accounts through digital onboarding, the ability of a model to identify the greatest possible number of users must be taken into account. It is worth mentioning both models presented similar performance results.
Models generated by a single decision tree are highly readable; a stakeholder with knowledge of their own business rules can look at the nodes of a tree and understand how it describes their data. However, for models generated by more complex algorithms such as XGB and RF, the interpretability of how the model obtains its results is equally complex. Thankfully, they are equipped with a score that represents the “importance” of every feature to their model, where a higher value indicates that a certain feature is more useful to the model’s classification of data.
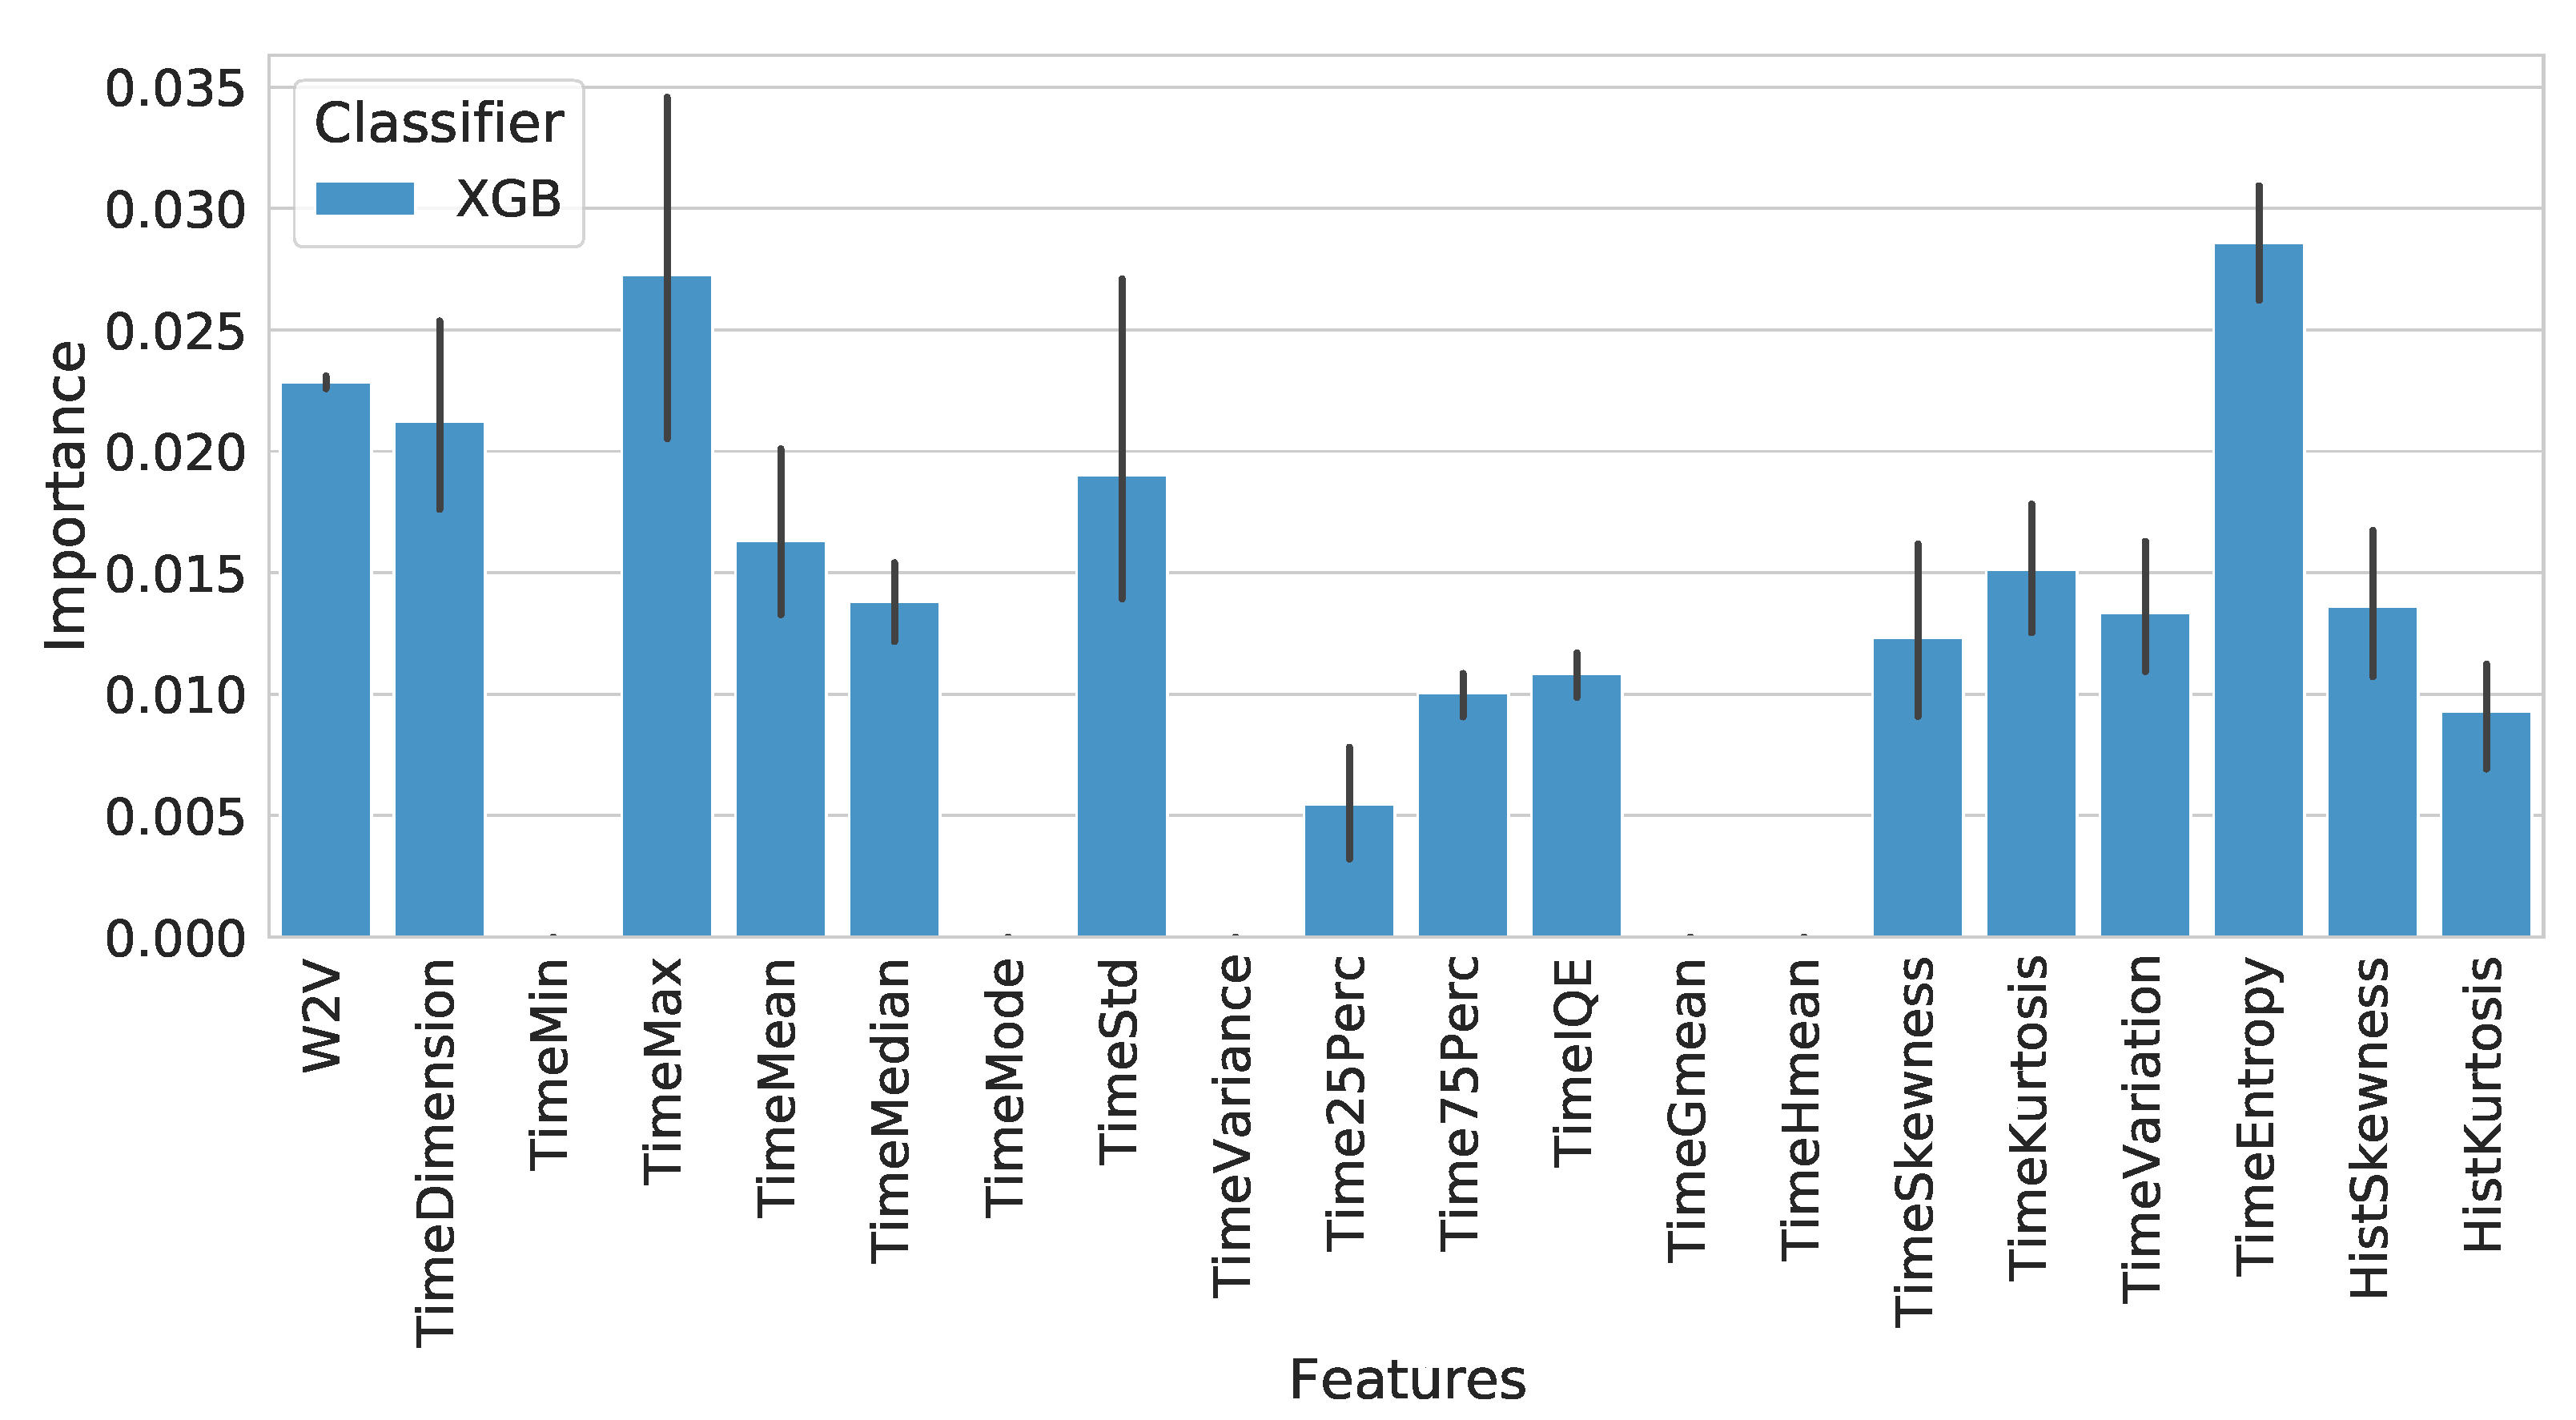
Taking into consideration that the classification step was performed on an embedded dataset concatenated with time features, it was not possible to directly identify the meaning of each feature in relation to their DO process, so we performed a feature importance analysis on the mean importance of the embedded features (w2v) in addition to the time features. The analysis revealed that for the XGB classifier, the features of time, TimeEntropy and TimeMax, were the most relevant ones for identifying fraud at an importance rate of 0.28 and 0.26. The third most important feature was the one representing the embedded features as shown in Figure 5.
In short, the XGB classifier presented the most consistently positive results for creating models capable of detecting identity fraud during the onboarding process, where the most important features for detection were related to the maximum time that the user spent on the entire onboarding, the calculation of the entropy on the distribution of time during the activities of a user in the onboarding process, and finally, the embedded features related to carrying out the activities of the DO process.

6. Discussion

6.1. PM

This work had as its central theme the exploration of the use of PM for the task of detecting frauds in the context of digital systems of financial institutions (i.e., fintech and banks), more specifically within the scope of DO of new customers. PM offers tools that can be used to combat fraud in several ways. A traditional PM approach is the application of algorithms capable of comparing the event logs of a database with a “gold standard” to detect differences. This can be used to find traces that do not follow the “legitimate” pattern of behaviour; however, in the case evaluated by this work, there was no a priori specific behaviour that differentiated legitimate accounts from fraudulent ones. The achievement of this work was the union of PM techniques with ML for modelling fraudulent and legitimate behaviour in a database of DO event logs.
In the behavioural analysis of users during the DO process, it is important not to interfere with the way a user interacts with the system as much as possible, i.e., building additional steps. PM is an approach that can be incorporated into an already implemented system in a nondisruptive way for stakeholders and a noninvasive way for users. The use of PM allows the analysis without the user needing any additional action and in the context of the institution, it also does not require additional implementations, since it only needs data collected from the DO process.
In addition, another important aspect explored by this work was the interpretability in the fight against fraud, the basic idea was that the solution chosen for fraud detection must be able to not only identify fraud but also provide insights into the behaviour of fraudulent users. PM provided a model visualisation for stakeholders (i.e., non-data experts), as was done in Section 4.2, allowing for a better understanding of process dynamics and activities relationships, i.e., PM enabled a data-driven overview of the whole business process and was not limited to event analysis. This type of insight can lead to process enhancement, identifying bottlenecks, and sharpening the system design.

6.2. Challenges and Opportunities

Although PM offers tools such as process discovery that help create visual models of the structure of processes in institutions, these visual models generated are not always simple and easy to understand by stakeholders. A major challenge for the interpretability of these models is to represent them in a way that is understandable but also faithful to what is in the data. This challenge turns out to be an opportunity to apply clustering algorithms, which manage to group similar traces together. This grouping would help to eliminate noise and identify outliers. However, creating a clustering pipeline, i.e., the sequence of techniques and algorithms that must be applied to group the traces in a faithful and easily interpretable way, is a nontrivial task and requires expertise both in the processes represented in the data and in ML. Therefore, this use case is ideal for automated machine learning (AutoML) applications, as proposed in [34,35]. AutoML is the area dedicated to the application of techniques for the automatic induction of ML pipelines, allowing stakeholders to create clustering models of the traces of their processes without having any knowledge in the field of ML.
Initiating efforts for detecting fraud on digital platforms such as DO is crucial for protecting users’ identities and financial security. While advancements in technology, such as the one proposed by this paper, have made it easier for banks to anticipate potential identity fraud and devise solutions to address them, the constantly evolving landscape of digital fraud presents an ongoing challenge. Fraudsters are continuously developing new tactics to evade detection, which means that even the most advanced fraud detection systems need to be constantly updated and improved. As a result, more research and development is needed to stay ahead of these scammers and to ensure that banks can continue to provide safe and secure digital services to their customers.

6.3. Proposal Limitations

The acquisition of a labelled DO dataset was an important achievement of this work; however, the use of this dataset for the development of the proposed models for fraud detection also ended up being a limitation. The generated event logs were specific to the partner company’s DO process and, therefore, the behaviour of users with fraudulent accounts identified by the company’s experts may not reflect fraudulent behaviour in the context of other systems. Furthermore, the proposed model may not be able to detect new fraudulent behaviours that have not been represented in the acquired dataset or may become obsolete if the bank changes the steps of its DO in future updates. Despite this, the limitations of the model can be overcome by retraining the model based on follow-ups with the company’s specialists after an update to the process or the identification of a new fraudulent behaviour.

7. Conclusions

This work conducted a study regarding the application of PM for fraud detection, specifically DO frauds. The results showed that the combination of PM techniques with ML classification algorithms (XGB and RF) was able to correctly identify whether a trace (sequence of events) was carried out by fraudulent or legitimate users. Furthermore, it was shown that the XGB classifier presented more constant results during this phase compared to the RF, but with similar performances. This study also provided a feature importance analysis on the XGB classifier, which revealed the impact of time features (TimeEntropy and TimeMax) in addition to embedded process features on fraud detection.
An important contribution of using a PM approach was the creation of visual models of the DO process. Even if stakeholders have a general knowledge about the DO stages of their institution, it is not always clear to them the users’ behaviour during these stages. As a result, this work applied process discovery techniques to provide insights into user behaviour for DO. Despite the resulting model presented in Figure 2 being relatively complex in relation to the number of transitions between various activities, it was possible to observe several patterns that allowed stakeholders to investigate anomalous cases, for example.
In conclusion, the use of PM approaches, despite being little used, has great potential in the task of detecting fraud by obtaining good results in classifying users during the DO process based on event logs. In addition, it provided process visualisation models to stakeholders, even allowing future applications in areas such as AutoML. In future work, we will strive to detect fraud during the DO process, creating honeypots and obtaining more information from the fraudulent user.

Author Contributions

Conceptualization, S.B.J., G.M.T., M.C.G., P.C. and M.C.d.S.; methodology, G.M.T. and S.B.J.; software, S.B.J. and M.C.d.S.; validation, G.M.T., M.C.G. and P.C.; formal analysis, G.M.T. and P.C.; investigation, all authors; resources, M.C.G.; data curation, M.C.d.S.; writing—original draft preparation, all authors writing—review and editing, S.B.J., M.C.G. and P.C.; visualization, S.B.J. and P.C.; supervision, S.B.J. and P.C.; project administration, S.B.J.; All authors have read and agreed to the published version of the manuscript.

Funding

This research received no external funding.

Data Availability Statement

The dataset used in the making of this work is available at: https://github.com/Mcamilo/Onboarding-Fintech-Event-Log (accessed on 23 February 2023).

Acknowledgments

We would like to thank the Brazilian fintech Banco Bari for the cooperation with this work, for providing expertise and contributing with rare DO data.

Conflicts of Interest

The authors declare no conflict of interest.

Abbreviations

The following abbreviations are used in this manuscript:
DOAJDirectory of open access journals
DODigital onboarding
LDLinear dichroism
MDPIMultidisciplinary Digital Publishing Institute
MLMachine learning
RFRandom gorest
TLAThree-letter acronym
XGBXGBoost

References

  1. Frame, W.; Wall, L.; White, L. Technological Change and Financial Innovation in Banking: Some Implications for Fintech; Working Papers; Federal Reserve Bank of Atlanta: Atlanta, GA, USA, 2018. [Google Scholar] [CrossRef]
  2. Goode, A. Biometrics for banking: Best practices and barriers to adoption. Biom. Technol. Today 2018, 2018, 5–7. [Google Scholar] [CrossRef]
  3. Mundra, A.; Rakesh, N. Online Hybrid Model for Fraud Prevention (OHM-P): Implementation and Performance Evaluation. In ICT and Critical Infrastructure: Proceedings of the 48th Annual Convention of Computer Society of India; Satapathy, S.C., Avadhani, P.S., Udgata, S.K., Lakshminarayana, S., Eds.; Springer International Publishing: Cham, Switzerland, 2014; Volume II, pp. 585–592. [Google Scholar]
  4. Jans, M.; Lybaert, N.; Vanhoof, K. A framework for Internal Fraud Risk Reduction at IT Integrating Business Processes. Int. J. Digit. Account. Res. 2009, 9, 1–29. [Google Scholar] [CrossRef] [PubMed]
  5. Gai, K.; Qiu, M.; Sun, X.; Zhao, H. Security and Privacy Issues: A Survey on FinTech. In Smart Computing and Communication; Qiu, M., Ed.; Springer International Publishing: Cham, Switzerland, 2017; pp. 236–247. [Google Scholar]
  6. Barlas, Y.; Basar, O.E.; Akan, Y.; Isbilen, M.; Alptekin, G.I.; Incel, O.D. DAKOTA: Continuous Authentication with Behavioral Biometrics in a Mobile Banking Application. In Proceedings of the 2020 5th International Conference on Computer Science and Engineering (UBMK), Diyarbakir, Turkey, 9–11 September 2020; pp. 1–6. [Google Scholar] [CrossRef]
  7. Van der Aalst, W. Process Mining: Data Science in Action; Springer: Berlin/Heidelberg, Germany, 2016. [Google Scholar] [CrossRef]
  8. Jans, M.; Alles, M.; Vasarhelyi, M. The case for process mining in auditing: Sources of value added and areas of application. Int. J. Account. Inf. Syst. 2013, 14, 1–20. [Google Scholar] [CrossRef]
  9. Teinemaa, I.; Dumas, M.; Rosa, M.L.; Maggi, F.M. Outcome-Oriented Predictive Process Monitoring: Review and Benchmark. ACM Trans. Knowl. Discov. Data 2019, 13, 1–57. [Google Scholar] [CrossRef]
  10. Di Francescomarino, C.; Ghidini, C. Predictive Process Monitoring. In Process Mining Handbook; Springer International Publishing: Cham, Switzerland, 2022; pp. 320–346. [Google Scholar] [CrossRef]
  11. De Weerdt, J.; Schupp, A.; Vanderloock, A.; Baesens, B. Process Mining for the multi-faceted analysis of business processes—A case study in a financial services organization. Comput. Ind. 2013, 64, 57–67. [Google Scholar] [CrossRef]
  12. Jans, M.; van der Werf, J.M.; Lybaert, N.; Vanhoof, K. A business process mining application for internal transaction fraud mitigation. Expert Syst. Appl. 2011, 38, 13351–13359. [Google Scholar] [CrossRef]
  13. De Alvarenga, S.C.; Barbon, S.; Miani, R.S.; Cukier, M.; Zarpelão, B.B. Process mining and hierarchical clustering to help intrusion alert visualization. Comput. Secur. 2018, 73, 474–491. [Google Scholar] [CrossRef]
  14. Sarno, R.; Dewandono, R.; Ahmad, T.; Naufal, M.; Sinaga, F. Hybrid Association Rule Learning and Process Mining for Fraud Detection. IAENG Int. J. Comput. Sci. 2015, 42, 59–72. [Google Scholar]
  15. Werner, M.; Wiese, M.; Maas, A. Embedding process mining into financial statement audits. Int. J. Account. Inf. Syst. 2021, 41, 100514. [Google Scholar] [CrossRef]
  16. van Dongen, B.F.; de Medeiros, A.K.A.; Verbeek, H.M.W.; Weijters, A.J.M.M.; van der Aalst, W.M.P. The ProM Framework: A New Era in Process Mining Tool Support. In Applications and Theory of Petri Nets 2005; Ciardo, G., Darondeau, P., Eds.; Springer: Berlin/Heidelberg, Germany, 2005; pp. 444–454. [Google Scholar]
  17. Di Francescomarino, C.; Ghidini, C.; Maggi, F.M.; Milani, F. Predictive Process Monitoring Methods: Which One Suits Me Best? In Business Process Management; Weske, M., Montali, M., Weber, I., vom Brocke, J., Eds.; Springer International Publishing: Cham, Switzerland, 2018; pp. 462–479. [Google Scholar]
  18. Dos Santos Garcia, C.; Meincheim, A.; Faria Junior, E.R.; Dallagassa, M.R.; Sato, D.M.V.; Carvalho, D.R.; Santos, E.A.P.; Scalabrin, E.E. Process mining techniques and applications—A systematic mapping study. Expert Syst. Appl. 2019, 133, 260–295. [Google Scholar] [CrossRef]
  19. Fani Sani, M.; Vazifehdoostirani, M.; Park, G.; Pegoraro, M.; Zelst, S.J.V.; van der Aalst, W.M. Event Log Sampling for Predictive Monitoring. In Proceedings of the International Conference on Process Mining, Eindhoven, The Netherlands, 31 October–4 November 2021; Springer: Cham, Switzerland, 2021; pp. 154–166. [Google Scholar]
  20. Vazifehdoostirani, M.; Genga, L.; Dijkman, R. Encoding High-Level Control-Flow Construct Information for Process Outcome Prediction. In Proceedings of the 2022 4th International Conference on Process Mining (ICPM), Bolzano, Italy, 23–28 October 2022. [Google Scholar]
  21. Barbon Junior, S.; Ceravolo, P.; Damiani, E.; Tavares, G.M. Evaluating Trace Encoding Methods in Process Mining. In From Data to Models and Back; Bowles, J., Broccia, G., Nanni, M., Eds.; Springer International Publishing: Cham, Switzerland, 2021; pp. 174–189. [Google Scholar]
  22. Maggi, F.M.; Di Francescomarino, C.; Dumas, M.; Ghidini, C. Predictive Monitoring of Business Processes. In Advanced Information Systems Engineering; Jarke, M., Mylopoulos, J., Quix, C., Rolland, C., Manolopoulos, Y., Mouratidis, H., Horkoff, J., Eds.; Springer International Publishing: Cham, Switzerland, 2014; pp. 457–472. [Google Scholar]
  23. Ceravolo, P.; Tavares, G.M.; Junior, S.B.; Damiani, E. Evaluation Goals for Online Process Mining: A Concept Drift Perspective. IEEE Trans. Serv. Comput. 2020, 15, 2473–2489. [Google Scholar] [CrossRef]
  24. De Koninck, P.; vanden Broucke, S.; De Weerdt, J. act2vec, trace2vec, log2vec, and model2vec: Representation Learning for Business Processes. In Business Process Management; Weske, M., Montali, M., Weber, I., vom Brocke, J., Eds.; Springer International Publishing: Cham, Switzerland, 2018; pp. 305–321. [Google Scholar]
  25. Leontjeva, A.; Conforti, R.; Di Francescomarino, C.; Dumas, M.; Maggi, F.M. Complex Symbolic Sequence Encodings for Predictive Monitoring of Business Processes. In Business Process Management; Motahari-Nezhad, H.R., Recker, J., Weidlich, M., Eds.; Springer International Publishing: Cham, Switzerland, 2015; pp. 297–313. [Google Scholar]
  26. Polato, M.; Sperduti, A.; Burattin, A.; Leoni, M.d. Time and activity sequence prediction of business process instances. Computing 2018, 100, 1005–1031. [Google Scholar] [CrossRef] [Green Version]
  27. Barbon Junior, S.; Ceravolo, P.; Damiani, E.; Omori, N.J.; Tavares, G.M. Anomaly Detection on Event Logs with a Scarcity of Labels. In Proceedings of the 2020 2nd International Conference on Process Mining (ICPM), Padua, Italy, 5–8 October 2020; pp. 161–168. [Google Scholar] [CrossRef]
  28. Tavares, G.M.; Junior, S.B. Process Mining Encoding via Meta-learning for an Enhanced Anomaly Detection. In New Trends in Database and Information Systems; Bellatreche, L., Dumas, M., Karras, P., Matulevičius, R., Awad, A., Weidlich, M., Ivanović, M., Hartig, O., Eds.; Springer International Publishing: Cham, Switzerland, 2021; pp. 157–168. [Google Scholar]
  29. Mikolov, T.; Chen, K.; Corrado, G.; Dean, J. Efficient Estimation of Word Representations in Vector Space. arXiv 2013, arXiv:1301.3781. [Google Scholar] [CrossRef]
  30. Zhang, Y.; Tong, J.; Wang, Z.; Gao, F. Customer Transaction Fraud Detection Using Xgboost Model. In Proceedings of the 2020 International Conference on Computer Engineering and Application (ICCEA), Guangzhou, China, 18–20 March 2020; pp. 554–558. [Google Scholar] [CrossRef]
  31. Weijters, A.; Aalst, W.; Medeiros, A. Process Mining with the Heuristics Miner-Algorithm; BETA Working Paper Series, WP 166; Eindhoven University of Technology: Eindhoven, The Netherlands, 2006. [Google Scholar]
  32. Van der Aalst, W.M. A practitioner’s guide to process mining: Limitations of the directly-follows graph. Procedia Comput. Sci. 2019, 164, 321–328. [Google Scholar] [CrossRef]
  33. Quinlan, J.R. Learning decision tree classifiers. ACM Comput. Surv. 1996, 28, 71–72. [Google Scholar] [CrossRef]
  34. Tavares, G.M.; Barbon Junior, S.; Damiani, E.; Ceravolo, P. Selecting Optimal Trace Clustering Pipelines with Meta-learning. In Proceedings of the Brazilian Conference on Intelligent Systems, Campinas, Brazil, 28 November–1 December 2022; Springer: Berlin/Heidelberg, Germany, 2022; pp. 150–164. [Google Scholar]
  35. Damiani, E. Automating Process Discovery Through Meta-learning. In Proceedings of the Cooperative Information Systems: 28th International Conference, CoopIS 2022, Bolzano, Italy, 4–7 October 2022; Springer: Berlin/Heidelberg, Germany, 2022; Volume 13591, p. 205. [Google Scholar]
Figure 1. Proposed approach overview, from DO user’s interaction to PM classification of user behaviour.
Fintech 02 00009 g001
Figure 2. Onboarding process discovered with the heuristic miner algorithm.
Fintech 02 00009 g002
Figure 3. List of onboarding activities sorted by frequency (log scale) from lowest to highest.
Fintech 02 00009 g003
Figure 4. Predictive performance of RF and XGB classifiers using word2vec encoding.
Fintech 02 00009 g004
Figure 5. Feature importance obtained using XGB models. The feature vector was composed of word2vec encoded features and time-based features.
Fintech 02 00009 g005
Table 1. List of events generated directly by a user’s actions.
EventDescription
NameUpdatedUser updated their name
EmailInsertionUser inserted their email
GeolocationInsertionUser inserted their geolocation data
SelfiePictureReferenceUser inserted their picture
MobilePhoneNumberInsertionUser inserted their phone number and validation code
HomeAddressInsertionUser inserted their home address
TermsAcceptanceInsertionUser accepted the terms for opening of an account
DocumentDataInsertionUser inserted their identification document data
BirthDateInsertionUser inserted their birth date
ProfessionInsertionUser inserted their profession
IncomeInsertionUser inserted their income
NewLeadCreatedUser started their registration and opening terms
PoliticalExpositionInsertionUser selected if they had political connections
USPersonInsertionUser disclosed their US citizenship
AssetsInsertionUser disclosed their assets data
PersonalInfoInsertionUser inserted their personal data information
AddressMainChangedUser selected at which address they wanted to have their correspondence received
DataConfirmationUpdatedUser updated their data
CommercialAddressRemovedUser removed their commercial address
CommercialAddressInsertionUser input their commercial address
Table 2. List of events.
EventDescription
ExternalImageSavingRecording of image sent by customer
DocumentPictureReferenceSending of identification document images by customer
DocumentOCRService to detect characters in the images of documents sent by customer
ExternalDocumentTypeficationService to identify the type of a user’s document
ExternalSelfiePictureQualityVerificationService to assess a user picture’s quality
ExternalDocumentExtractionService to extract document information detected by OCR
DataValidationService for user data validation
SelfieLivenessService to validate that a selfie image is taken by a real person and not from a photo
CommercialAddressVerifiedService to check if the address is valid
Vendor1RequestRequest for a vendor to validate customer data
FaceMatchRequestService to validate if the selfie of a person matches the photo on their identification document
Vendor2RequestRequest for a vendor to validate customer data
DocumentValidationService to validate identification document on a public organ
OnboardingTerminatedOnboarding was terminated
HomeAddressVerifiedService to check if a user’s home address is valid
MobilePhoneNumberVerifiedService to check if the user’s mobile number is valid and belongs to the user
EmailVerifiedService to check if the user’s email is valid and belongs to the user
ExternalSelfieLivenessSendImageService to send the user’s picture to be validated for liveness
ExternalFaceMatchSelfieDocumentService to send the user’s picture to be validated for face match
ExternalVendor1RequestService to send the user’s data to a vendor for validation
ExternalSelfieLivenessGetProcessService to check on the liveness process
ExternalVendor2RequestService to send the user’s data to a vendor for validation
ExternalDocumentNumberValidationService to send the user id number for validation
LeadApprovedService to provide the user with access to bank services
OnboardingStateChangedService that updates the user state in DO
DocumentFailureService that records a problem with the user’s document
ExternalSelfieLivenessGetProcessDivergentService that records when there is a problem with the picture that the user took
SelfieLivenessFinishedNotificationService that records when the liveness check is finished
SelfieAndDocumentFailureService that records a document and picture failure
LeadSelfieFailureService that records a failure only on the picture of a user
ManualApprovalService to approve a user manually by a stakeholder
InviteUpdatedService to provide a user with a new invite
CheckExecutedEventService to check if an event was executed correctly
DocumentPictureRequestInsertionService to require a new insertion of document picture to the user
MemberGetMemberVerifiedService to verify if a user was invited by another user
Table 3. Classifier performance for onboarding fraud detection based on features obtained from predictive PM.
ClassifierMetricPerformance Value
RFACC0.81 (±0.07)
F10.79 (±0.10)
XGBACC0.80 (±0.06)
F10.79 (±0.08)
Disclaimer/Publisher’s Note: The statements, opinions and data contained in all publications are solely those of the individual author(s) and contributor(s) and not of MDPI and/or the editor(s). MDPI and/or the editor(s) disclaim responsibility for any injury to people or property resulting from any ideas, methods, instructions or products referred to in the content.

