1. Introduction
The cryptocurrency market has become a rising trend recently, and even some novice investors want a piece of it. This market is typically open for trading 24 h a day, seven days a week since it is not regulated by a centralized market governance, central bank, or single administrator. Research conducted by Ryan Farrell has outlined three leading indicators of the cryptocurrency industry, including market capitalization, the estimated number of cryptocurrency users, and daily transaction volume [
1].
The cryptocurrency market is highly volatile and can yield a high return on investment in the short term. Using the 2017 Bitcoin market as an example, its price increased by 2000%, from USD 863 on 9 January 2017 [
2] to a peak of USD 17,550 on 11 December 2017. Despite the potential for high returns, there is a high risk associated with this kind of investment. The collapse of the Mt. Gox exchange in February 2014 [
3] demonstrates the vulnerability of investors to sudden exits from the market. As a beginner investor, it is difficult to monitor the crypto market 24/7 and make informed decisions without bias. To address this, a number of platforms for trading cryptocurrencies have emerged, providing tools to help investors analyze past data from the crypto market.
However, having old data alone is not sufficient to help investors predict future trends or fluctuations in cryptocurrency prices. Research conducted by Connor Lamon, Eric Nielsen, and Eric Redondo has demonstrated that prices are typically affected by news and social media posts [
4]. For instance, in 2021, Elon Musk, the founder of Tesla, posted an announcement on Twitter, a popular social media platform, that his company would discontinue accepting Bitcoin as a payment method from May onwards. Following this post, the price of Bitcoin decreased. Subsequently, after one month, Elon Musk posted another announcement stating that Tesla would once again accept Bitcoin. Immediately, the prices of Bitcoin and Ethereum increased. It is assumed that positive sentiment scores of the tweets of the market will lead to an increase in the trading volume and price of the coins, while negative sentiment scores of the tweets of the market will lead to a decrease in the trading volume and price of the coins. It is also assumed that sentiment scores of the tweets of the cryptocurrency market will have a positive correlation with the prices of the coins. Based on the above assumptions, this work aims to develop a web application that recommends profitable stock portfolios and provides easy-to-understand stock analytics using machine learning and big data analytics.
This work contributes by developing a cryptocurrency analysis system for investors. The system provides a price-tracking function and related information about the cryptocurrency, as well as a trading signal based on the sentiment analysis of related crypto tweets using machine learning techniques. Additionally, an approach is designed to provide users with the trading signal of the cryptocurrency based on the analyzed data.
The rest of the paper is arranged as follows: In
Section 2, related online platforms and machine learning techniques are introduced. In
Section 3, the proposed system is described.
Section 4 demonstrates the prototype results and discussion. The paper is summarized in
Section 5.
2. Related Works
It is well-known that fluctuations in cryptocurrency can be extremely volatile, making it difficult to forecast its price [
5]. A study by Siddhi Velankar et al. has found that the price of Bitcoin does not depend on business events or intervening governments, unlike the stock market [
6]. Furthermore, research has revealed that predictions based on historical price data of cryptocurrencies alone are often inaccurate [
7]. Although historical price data reflects the performance of cryptocurrency in the past, it may not accurately reflect future trends, especially in the cryptocurrency market. To correctly predict the cryptocurrency market trend, other factors must be taken into consideration. It has been suggested that there is a correlation between media sentiment and cryptocurrency trends [
4]. A study by Yu and Chen has found that including social media features can significantly improve the accuracy of price prediction [
2]. However, due to time limitations and cost, it is not realistic to analyze all the social media posts from different platforms. Analyzing tweets for cryptocurrency prediction is more efficient [
6,
8,
9], as Twitter is the most popular source of social media providing the earliest and fastest news updates in a concise format [
10]. Therefore, a sentiment analysis model and related dataset are needed to provide an accurate signal for predicting the future trends of cryptocurrencies.
There are a number of online platforms available to help users trade or predict the cryptocurrency market (such as Coinbase, Cryptocurrency forecast: AI Prediction and CoinMarketCap). Each platform has its own advantages and disadvantages, which are listed in
Table 1.
Coinbase is a free, open, and popular cryptocurrency exchange where users can purchase, sell, and exchange cryptocurrency. It also provides the latest news on cryptocurrency and supports mobile platforms. Although Coinbase does not provide an artificial intelligence (AI) prediction feature, it has all the basic features for cryptocurrencies and its interface is concise for cryptocurrency beginners.
Cryptocurrency Forecast: AI Prediction is a mobile application that uses neural networks to provide state-of-the-art predictions of cryptocurrency prices. It offers hourly and daily price predictions of cryptocurrencies, as well as live market statistics, news, and sentiment analysis, to help cryptocurrency users make informed decisions.
CoinMarketCap compiles projected data from user input, calculates the average estimated price, and compares it to the actual price. However, this method of predicting cryptocurrencies based on user voting is rather imprecise; even when there are over 10,000 individuals forecasting, the prediction is still inaccurate.
Besides using social media posts to predict cryptocurrency prices [
4,
8], various technologies can be used to discover the relationship between social media data and cryptocurrency price changes. Neural networks, which are composed of many neurons and create complex networks, have been heavily influenced by the human brain. With the introduction of transfer learning by G.E. Hinton, deep learning has become a reality, which is the extraction of features from raw data with the help of layers [
10]. Neural networks have been applied to a variety of tasks such as signal and image reconstruction [
11,
12], asset allocation [
13,
14], non-negative matrix factorization [
15,
16], model predictive control [
17,
18], sentiment analysis [
19] and clustering [
20,
21]. Furthermore, they are beneficial for text creation, vector representation, word representation estimation, sentence classification, phrase modeling, feature selection [
22], and emotion recognition [
23]. Networks with more than three layers are generally considered deep learning approaches, such as convolutional neural networks (CNN) and recurrent neural networks (RNN). Deep neural networks require complex mathematical models to analyze inputs in intricate detail. Web scraping is an automated process of extracting or mining data from structured web pages, which can be leveraged for various applications, such as price monitoring, news monitoring, and market research. Natural Language Processing (NLP) is a technology that interprets text and spoken words in a similar manner to humans for sentiment analysis [
24], allowing for the classification of data as positive, negative, or neutral. The Natural Language Toolkit (NLTK) is a widely used toolkit for training a machine learning model with the Python package [
25].
Logistic Regression [
26] is a machine-learning classification technique that may be used to estimate the probability of a certain outcome when utilizing cryptocurrency. By taking into account multiple independent variables, Logistic Regression can provide a detailed error analysis that may be used to help inform decision making. This approach is particularly helpful when the expected outcome is binary, such as when trading or investing in a cryptocurrency. Additionally, Logistic Regression can be used to identify the most useful variables when making decisions in the cryptocurrency market. Mathematically, the logistic regression model can be expressed as:
where
θ is a vector of coefficients, x is a vector of predictors, and y is the target variable (in this case, a binary variable).
The logistic function, (
θ^T x) is defined as:
This function takes the dot product of the coefficient vector θ and the predictor vector x and returns a value between 0 and 1, which represents the probability of the target variable being 1.
The naive Bayes algorithm [
27] can be applied to the world of cryptocurrency by using it to classify digital assets. Its classifiers can be used to analyze the various attributes of digital assets, such as price, transaction volume, market capitalization, and other characteristics. This can be beneficial in predicting the performance of digital assets and helping investors make informed decisions. However, since the features of digital assets are not completely independent, the result of using the Naive Bayes algorithm may not be accurate.
A Support Vector Machine (SVM) [
28] is a supervised machine learning algorithm that can be used for both classification and regression tasks. SVMs are more commonly used in classification problems, such as text classification tasks (e.g., spam detection) and image recognition challenges (e.g., recognizing color-based and aspect-based features). However, due to its high computational demands, it is not recommended to use this method for testing models, as the training time can be long with large datasets.
Each of the above classification models has its advantages and disadvantages; for example, Support Vector Machine performs well in classification but requires a considerable training period. Thus, when selecting a categorization model, it is essential to determine which is most suitable for the given needs. With regard to data gathering, the same strategy as before may be applied since it is common and a superior source is available.
3. Proposed System
The proposed system provides cryptocurrency information and prediction functions using React Native. React Native Animated Charts [
29] are utilized to provide different types of charts and log plots that contain more cryptocurrency price data in a chart, depending on the date or different time slot. The system consists of a classification model and a regression analysis model. The classification model is employed to analyze the sentiment of related selected tweets, while the regression analysis model is used to predict a cryptocurrency’s future trends or price fluctuation based on the sentiment analysis results. A machine learning-based approach is then developed to convert the given results to a trading signal for users.
The proposed system must meet the following technical requirements. Firstly, it must provide a list of the last prices of different cryptocurrencies. Secondly, the system must provide related news of selected cryptocurrencies for the users. Thirdly, it must incorporate a prediction function that gives the users a buy or sell signal. Finally, it must provide details of the cryptocurrency that the user has selected.
As for the first requirement, many up-to-date price data are needed in order to provide a list that reflects the latest prices of different cryptocurrencies. Considering the update rate and convenience, the use of existing APIs is intended to provide the most recent price data immediately upon sending a request, such as those provided by CoinGecko, CoinDesk, and Cryptocompare API.
In order to return detail for user-selected cryptocurrencies, a large quantity of historical data for different cryptocurrencies is necessary. To enable users to have a better understanding of the price trend of the chosen cryptocurrency, a price chart with these data is provided. As such, the react-native-animated-charts library is selected to plot aesthetically pleasing, animated linear charts based on a given input. As opposed to hosting a database to store a large amount of data, using APIs is preferable. CoinGecko API is chosen, as it can also provide the timestamps of the price data. Additionally, Cryptopanic API is utilized to attach the relevant news for the selected cryptocurrencies to provide users with related news.
The Tweepy Python library is used to access the Twitter API social platform in order to collect tweets related to cryptocurrency. The TextBlob Python library utilizes NLTK processing libraries to provide sentiment analysis and classification functions. NLTK, a Natural Language Toolkit, provides over 50 corpora and lexical resources and is used for data preprocessing to filter out useless data such as stop words and wordnets. A CNN-LSTM sentiment analysis model is used to predict the sentiment of the tweets. Decision tree and random forest regression machine models are used to predict the future cryptocurrency price based on the last-day sentiment result. Google Colab and Tensorflow are employed for the machine learning process and for observing the results. The Snscrape Python library is utilized to scrape Twitter’s historical cryptocurrency-related tweets. The Pymongo Python library is employed to work with MongoDB and store all the cryptocurrency-related tweets in databases. The result of the sentiment analysis and regression algorithm is a predicted price of the related cryptocurrency.
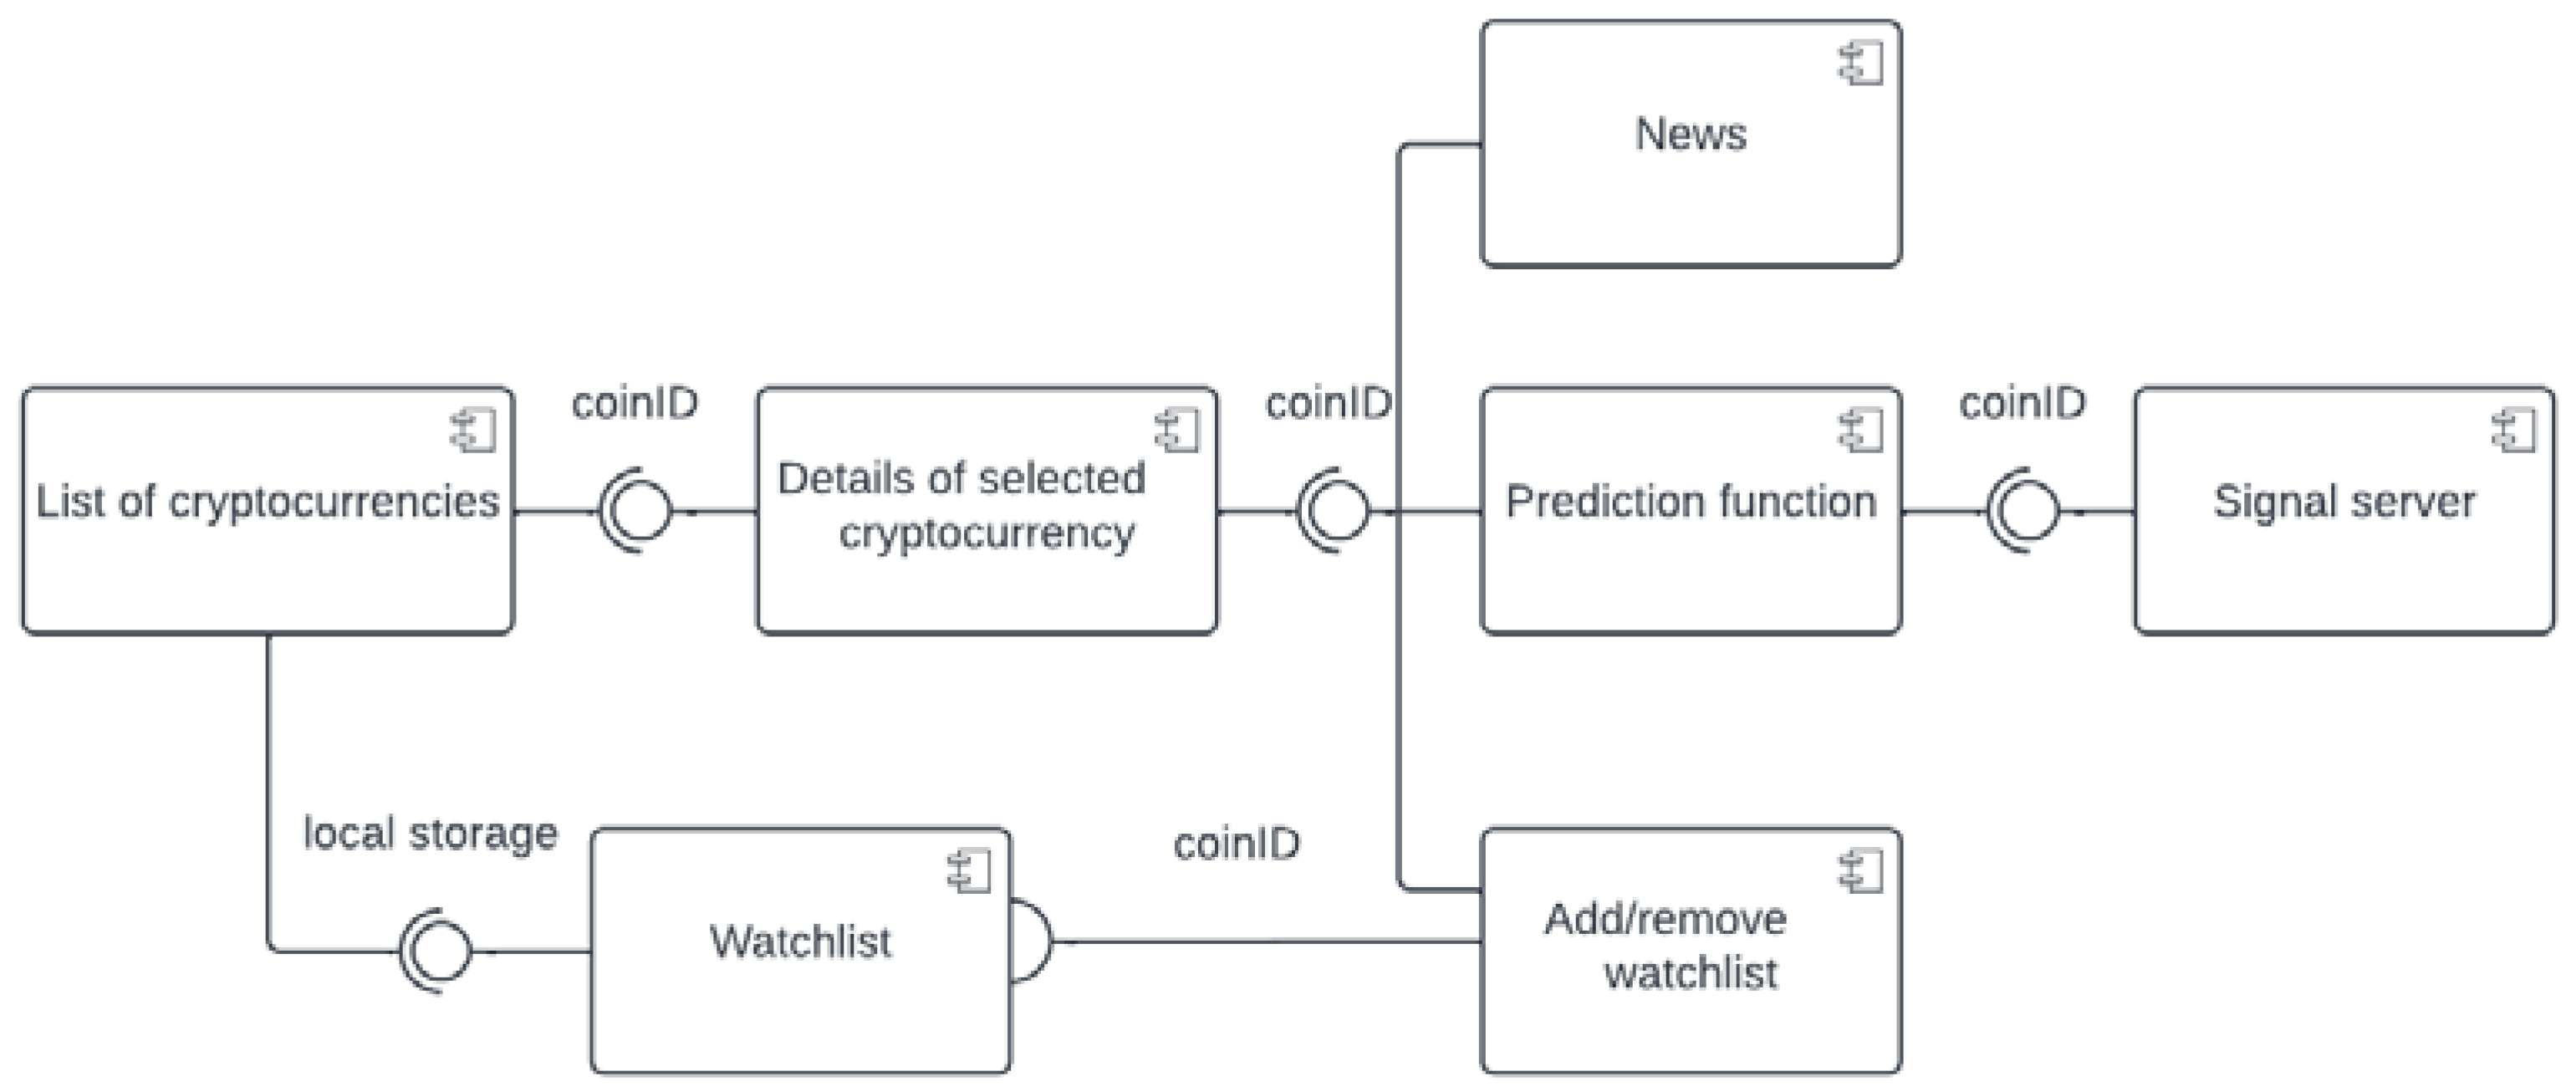
Figure 1 shows the component diagram of the proposed system. Upon initiation, the system requests cryptocurrency data by calling the CoinGecko API. Users are then able to select a cryptocurrency for more details or select their watchlist to view the stored cryptocurrencies. The watchlist data is stored in the local database via the async-storage library. After the user selects a cryptocurrency for detail, they access the detail page. The detail page then requests the detail of the selected cryptocurrency data by calling the CoinGecko API. After the data is returned, users are able to view the cryptocurrency’s detail, such as their real-time price, price chart in different periods, and percentage of price change. Additionally, users can view related news, add or remove cryptocurrencies from the watchlist, or get trading signals. For the watchlist function, users can add or remove the selected cryptocurrency on the detail page. Upon performing these actions, the system adds or removes the cryptocurrency from the Async-Storage. The news page is accessible by the user, and the system requests related news data from the Cryptopanic API. The news will be listed on the page once the system obtains the data from the third-party service. Additionally, users will be able to access the prediction function, available in BTC, ETH, and DOGE, by pressing the prediction button. Upon executing the prediction function, the system will send an API request to the trading signal server. The server will then call the AI model, which will send an API request to the third-party service to obtain the related data and analysis. Ultimately, the AI model will return the result to the client via the server.
Figure 2 shows the data-flow diagram of the proposed system.
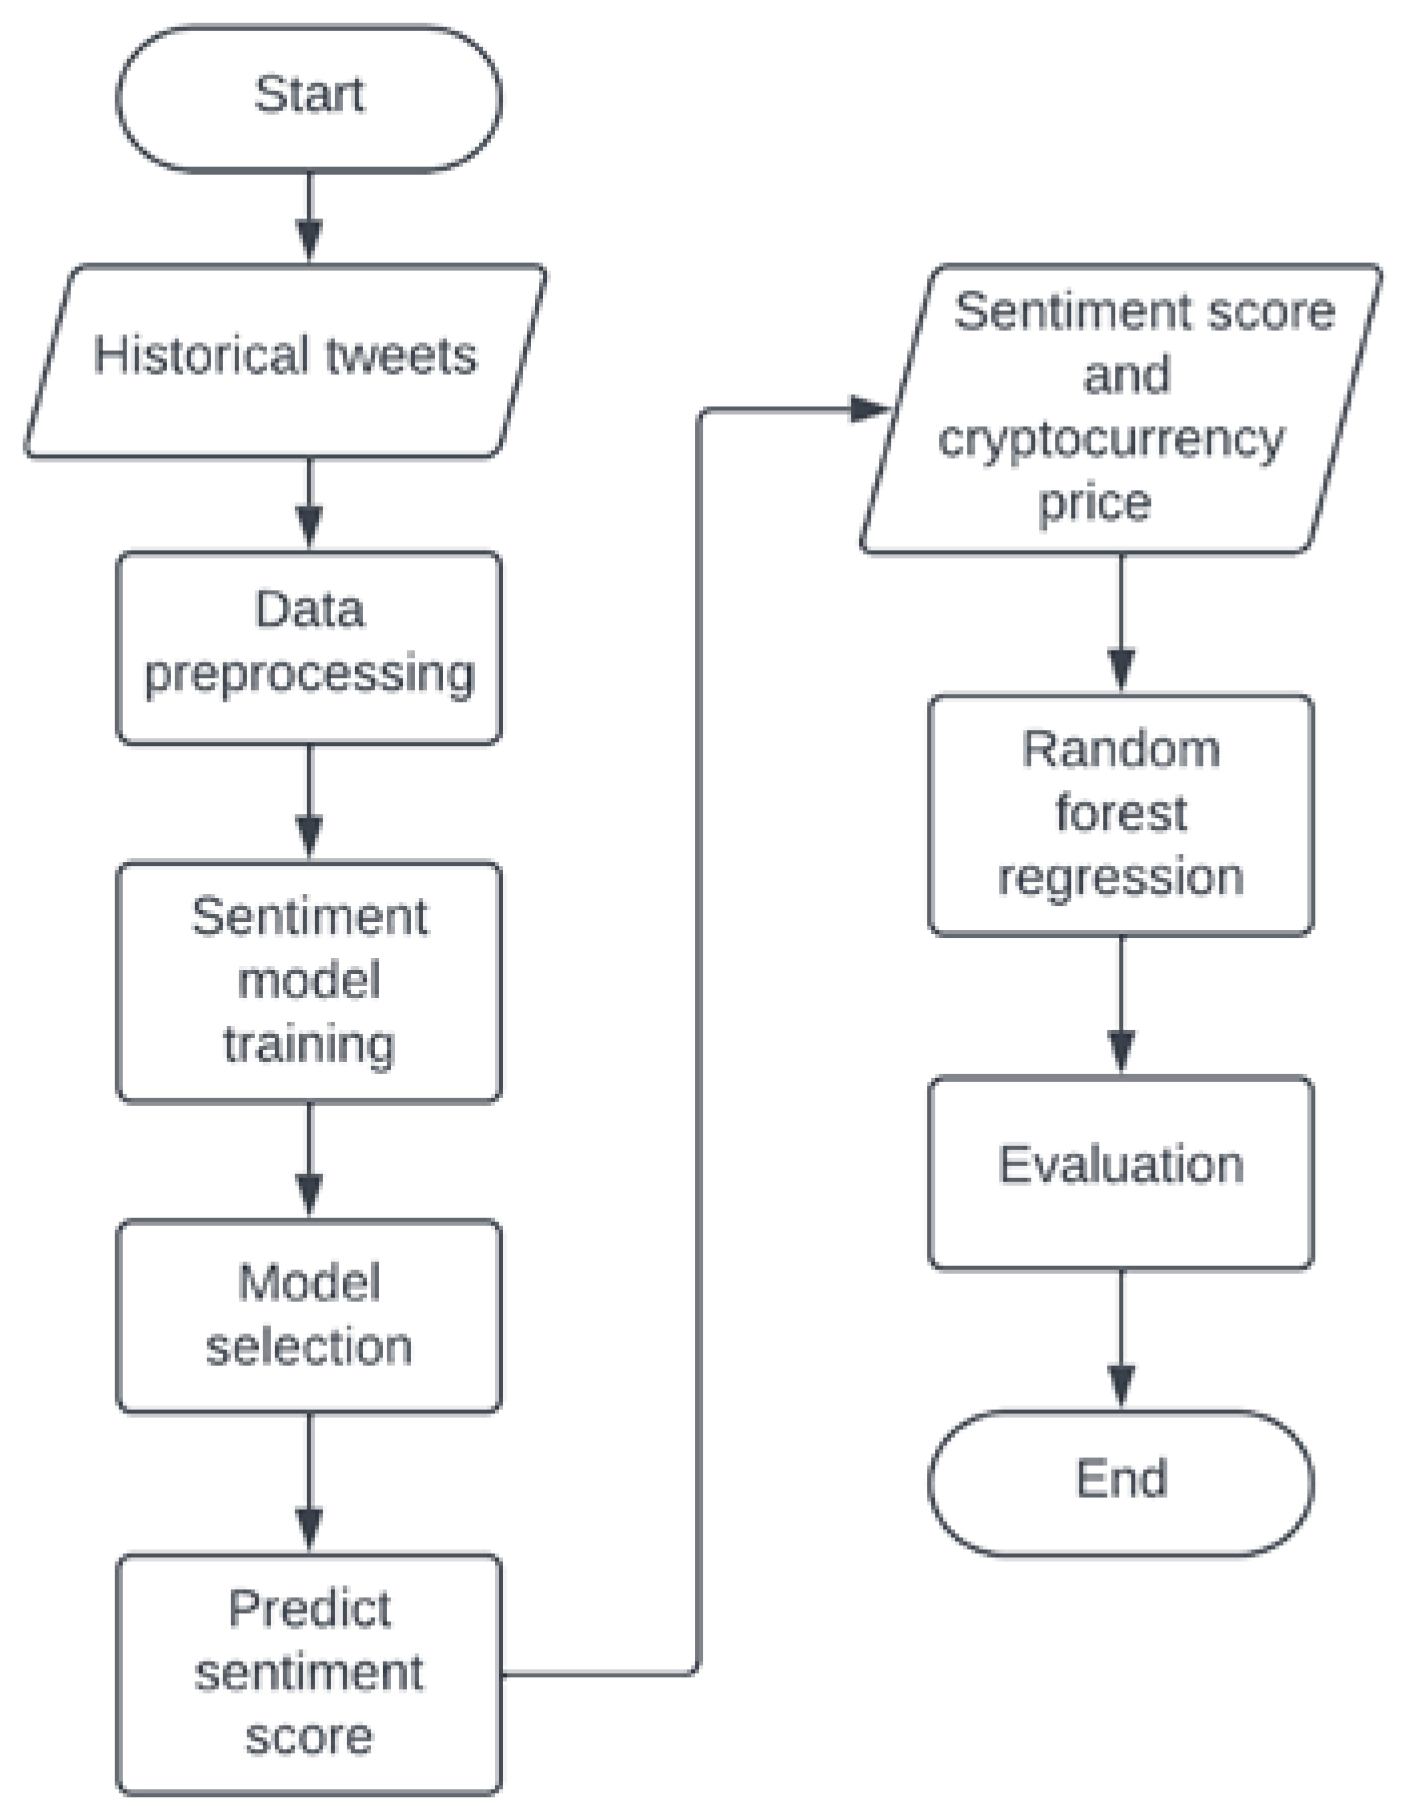
Figure 3 shows the machine learning model flowchart diagram. Initially, historical cryptocurrency-related tweets are obtained and preprocessed to make them suitable for sentiment model training. Data preprocessing [
30] is a data mining approach for transforming unstructured data into a useful and efficient format. This involves data cleansing, noisy data, data transformation and data reduction. This approach is typically used prior to machine learning to remove unnecessary data via data cleaning. Afterward, the model is trained with the preprocessed dataset and evaluated. The best-performing model is chosen as the cryptocurrency tweets sentiment model. Sentiment models are used to predict the January 2022 Twitter cryptocurrency-related tweets sentiment score. Then, the January 2022 sentiment dataset with actual cryptocurrency price from investing.com is split into a 70% training set and a 30% testing set for model training and evaluation. After the trained random forest regression model is completed, evaluation metrics are used to measure the model performance and plot a graph compared to the actual cryptocurrency price.
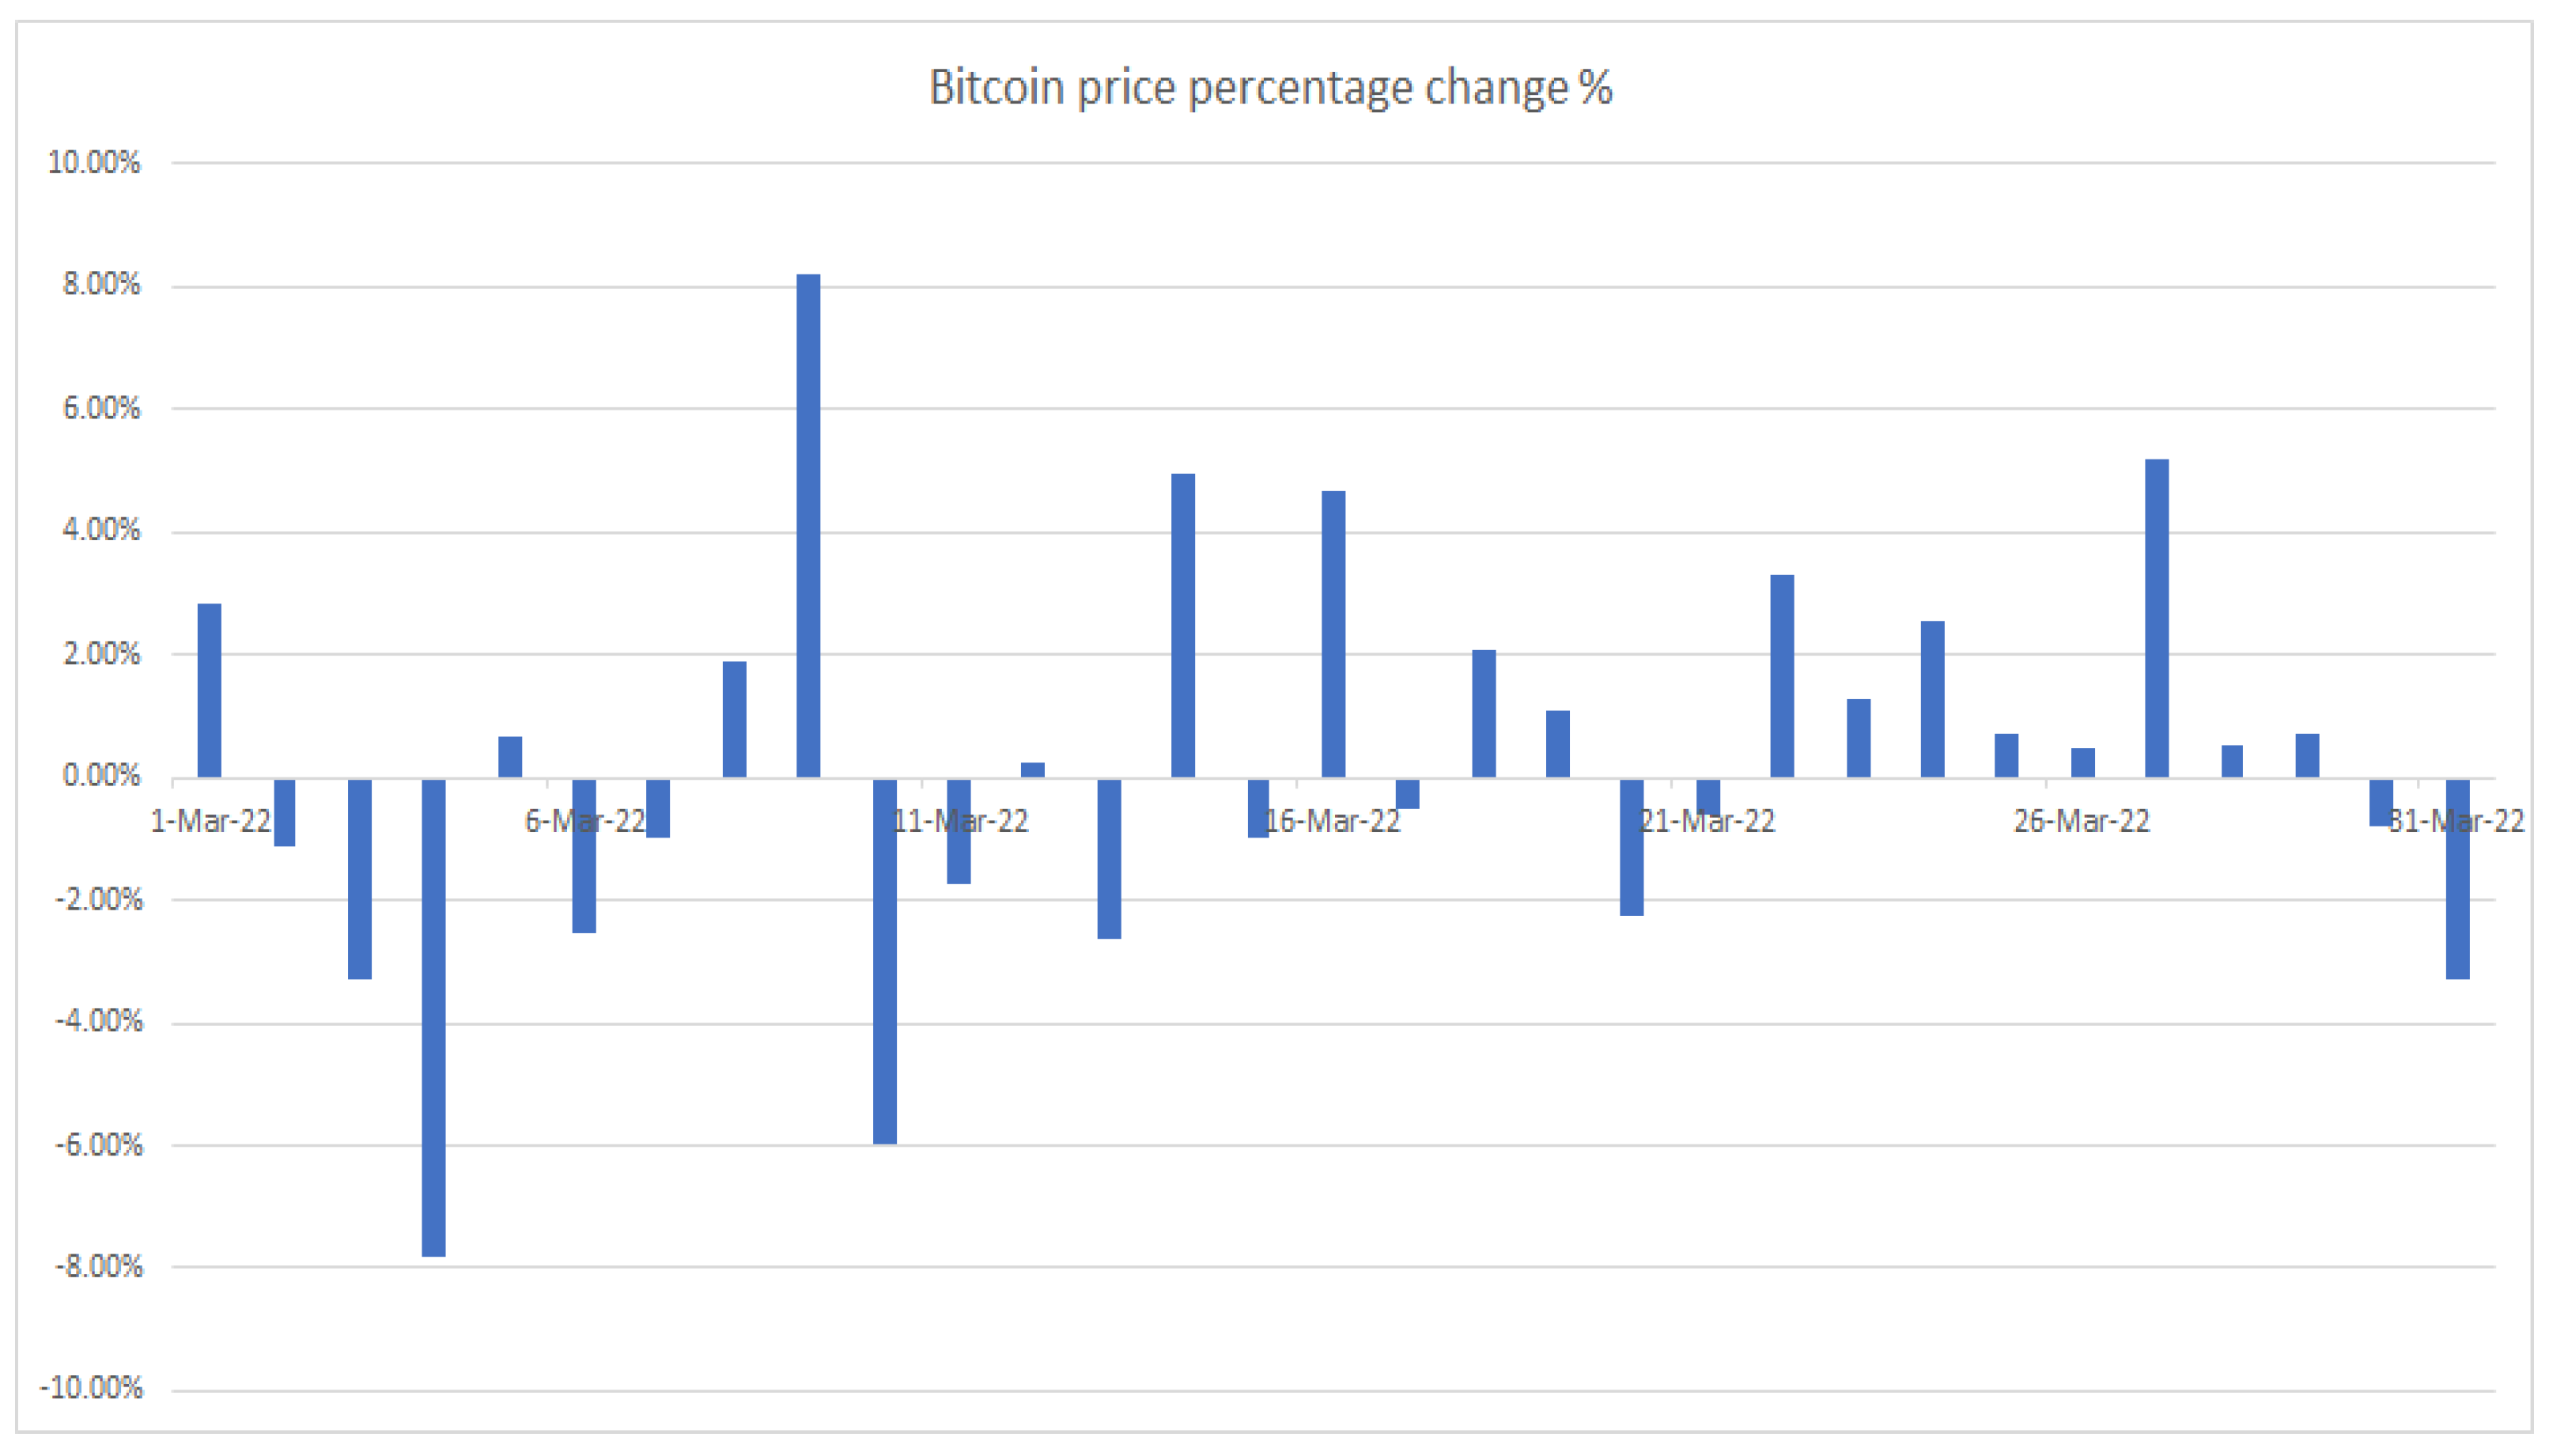
In order to create the trading signal for cryptocurrency trading, the model output is utilized, and the forecasting approach is used to forecast the trading signal. The percentage change (pd) between each predicted price (A) and the last predicted close price of that cryptocurrency (B) is calculated using a percentage difference formula.
The results of the (pd) revealed that the percentage difference in price between the last day was positive, resulting in the signal returning “Buy”. If the percentage change was equal to or larger than 5%, the signal returned “Strong Buy”, as the maximum percentage change was observed to be around 5%.
Figure 4 shows the percentage change in Bitcoin price.
All the signal results calculated above are sent to the prediction API server, thereby allowing the system to obtain predicted signals by posting a request.
4. Prototype Result and Discussion
4.1. Implementation Results of the Model
The accuracy formula will be used to evaluate the trading signal, with the January 2022 testing set being employed for each cryptocurrency.
Table 2 shows the details of the datasets for analysis. Tweets contain a variety of content from different users, some of which may be noisy. The raw data, having a polarity, is susceptible to redundancy. Therefore, preprocessing of tweets is needed and includes the following points: the removal of all URLs (e.g.,
www.abc.com), targets (@username), and hashtags (e.g., #topic); the replacement of all emoticons and smileys; the removal of stop words and punctuation; the replacement of extra white spaces; the removal of duplicate tweets; the removal of tweets that contain “give away”, “pump”, “join”; the removal of tweets with more than 14 hashtags; and the removal of tweets if the creator name contains “bot” (as per the identification of cryptocurrency-related Twitter bot accounts [
31]).
4.2. Experiments on Sentiment Analysis
Sentiment analysis models are used to understand the emotion communicated in a tweet, whether it is positive, negative, or neutral. In order to determine the emotion of a tweet, three different sentiment analysis models have been evaluated using the Twitter Tweets Sentiment Dataset from Kaggle to train and test.
4.2.1. TextBlob
The first sentiment analysis model that was tried was Textblob. An understanding of sentiment analysis was sought, as well as the polarity relationship between tweets. Textblob returns two properties of the tweets, polarity and subjectivity. The polarity score is a float within the range [−1.0, 1.0], and the subjectivity is a float within the range [0.0, 1.0], where 0.0 is very objective, and 1.0 is very subjective. As Textblob is a pre-trained Lexicon-based sentiment analyzer, no additional steps are required to use the model. For the first try, values below [0] were assumed to be negative sentiment data, values equal to [0] were assumed to be a neutral sentiment, and values above [0] were assumed to be a positive sentiment.
Table 3 shows the classification report of TextBlob. The classification report shows that the overall accuracy of the model is 58%. Precision and recall for class 0 are 0.66 and 0.47, respectively, while precision and recall for class 1 are 0.59 and 0.50, respectively. Furthermore, precision and recall for class 2 are 0.54 and 0.80, respectively. The macro average of the precision, recall, and F1-score is 0.60, 0.59, and 0.58, respectively. The weighted average of the precision, recall, and F1-score is 0.59, 0.58, and 0.57, respectively. Overall, this classification report indicates that the model has performed relatively well in terms of classifying the data into the three separate classes. The accuracy of the model is not the highest, but it is still relatively good.
Figure 5 shows the corresponding confusion matrix.
4.2.2. Clustering with TextBlob
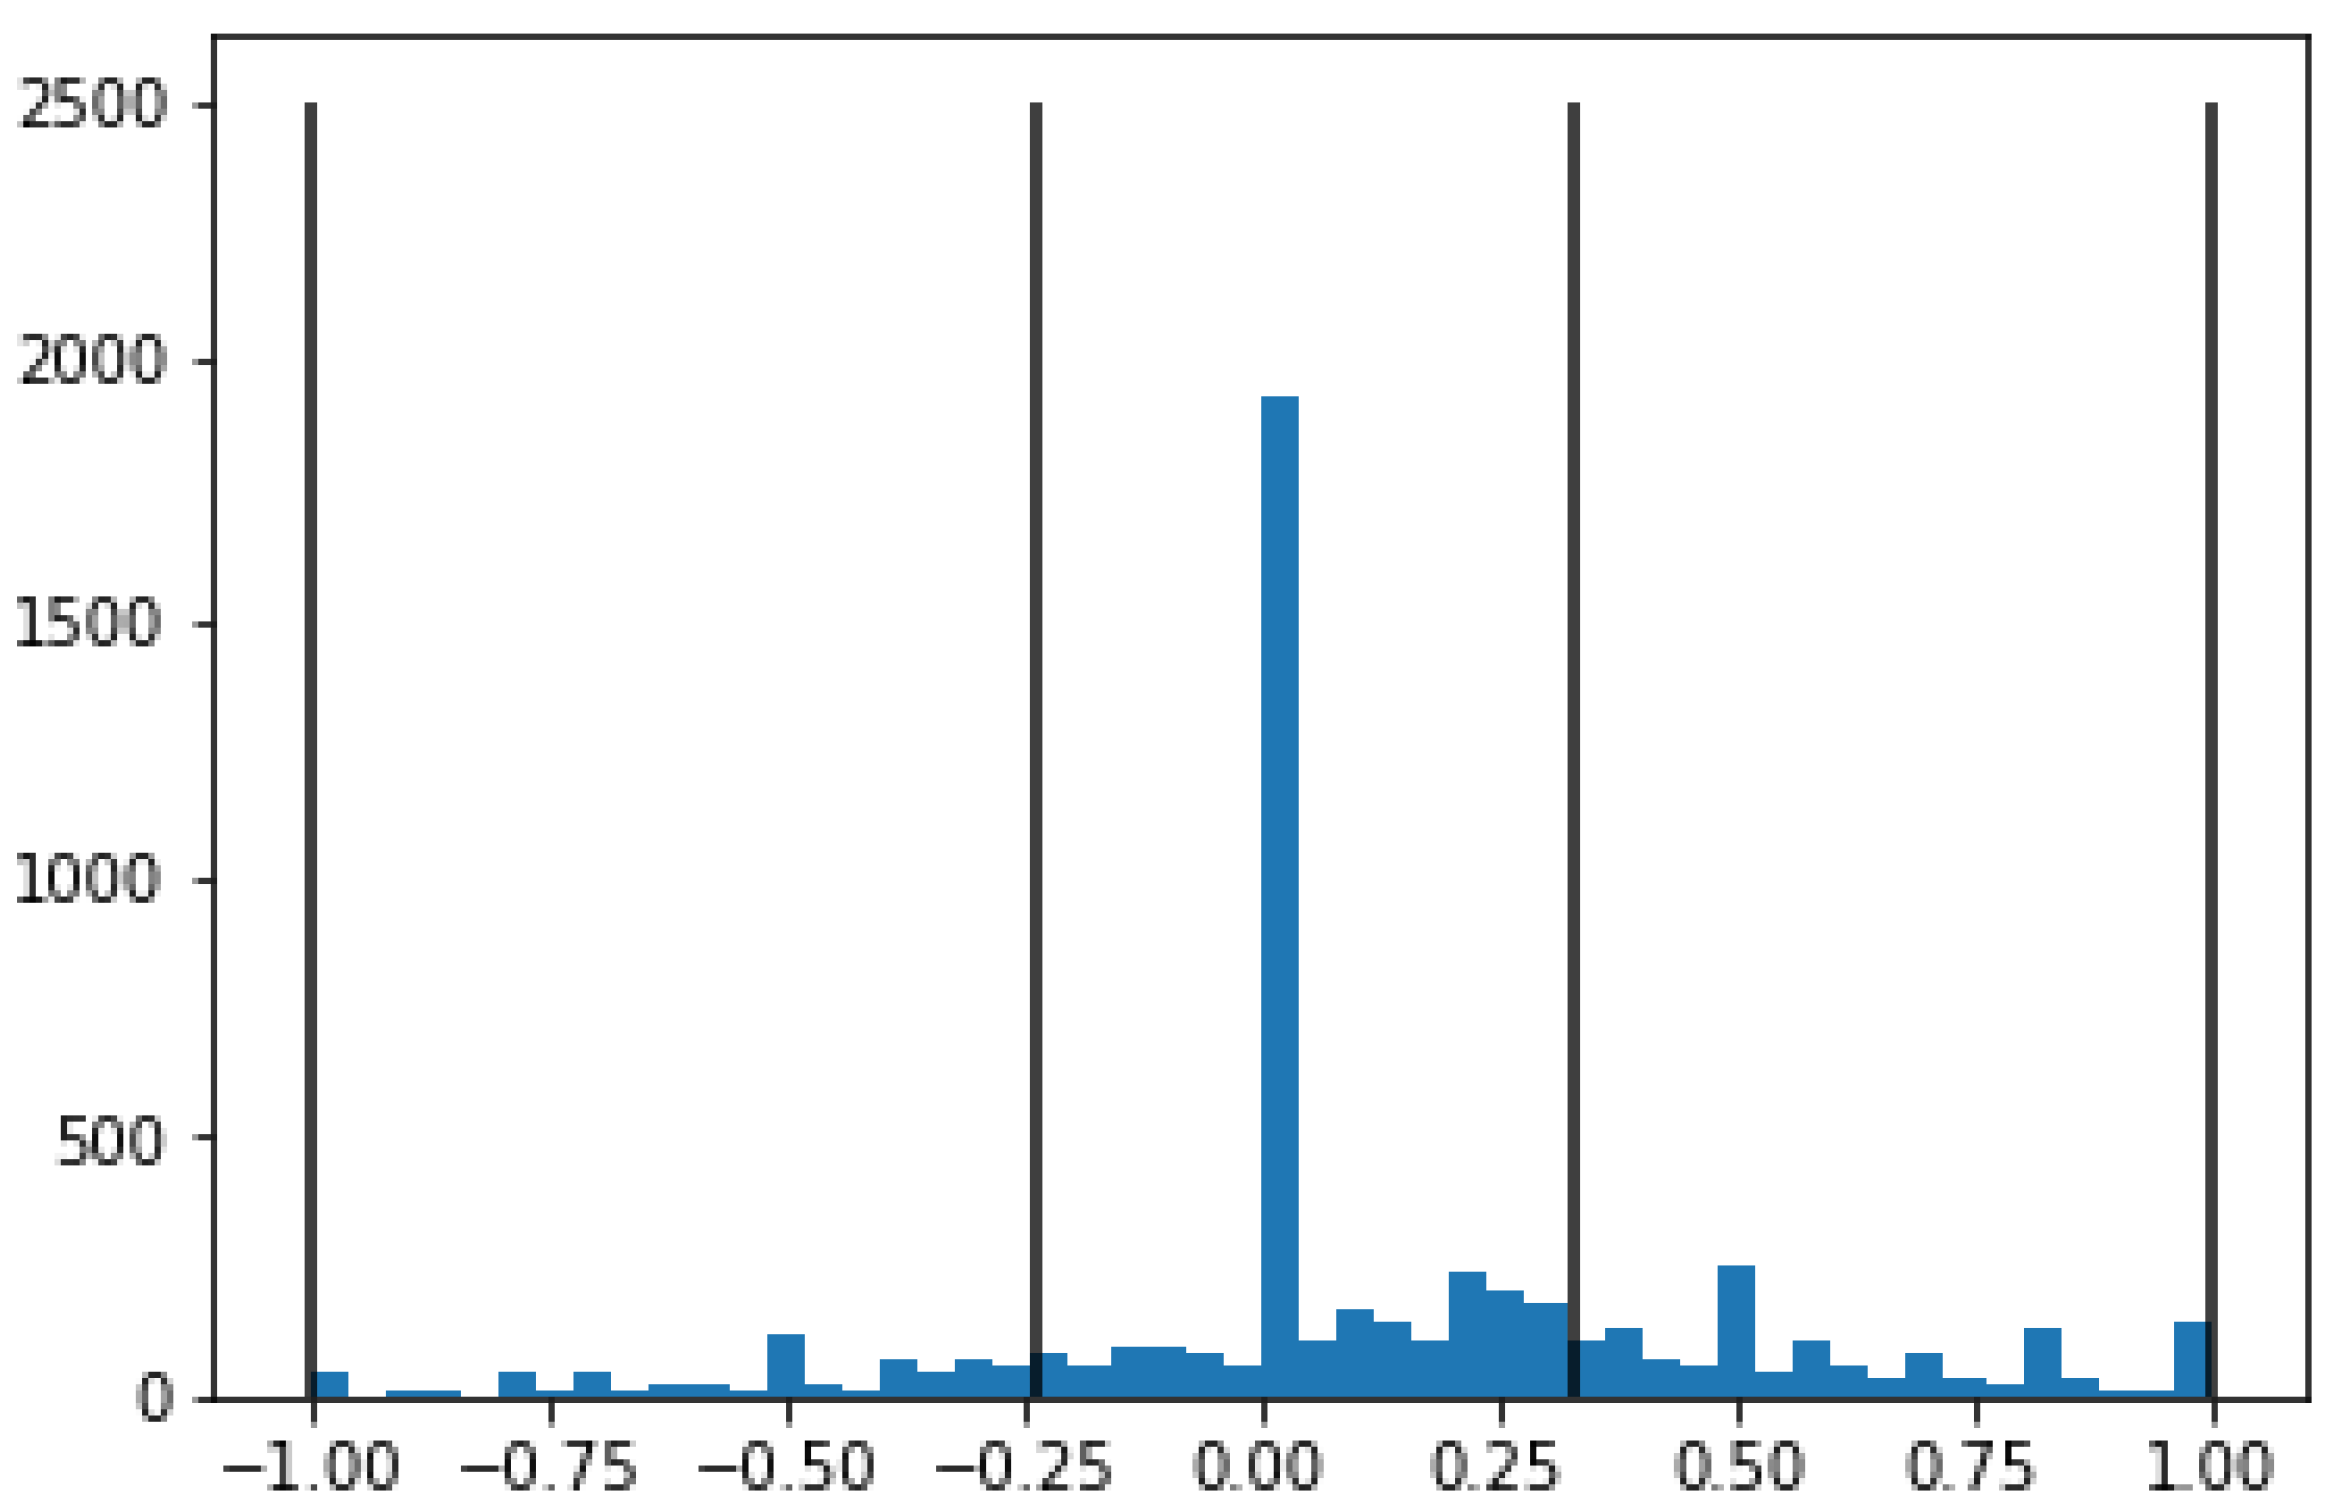
TextBlob is the first sentiment analyzer, and its accuracy has been reported as 58%. Blindly clustering the polarity score and classifying it as positive, negative, or neutral may lead to inaccurate results. To achieve more consistent clustering, Jenks natural breaks optimization can be implemented. This technique clusters the one-dimensional dataset with polarity values into different actual classes of data while maximizing the spaces between the groupings.
Figure 6 is the result of Jenks break for TextBlob. Jenks break clustered polarity scores between [−1.0, −0.236] as negative sentiment data, between [−0.236, 0.328] as neutral, and between [0.328, 1.0] as positive sentiment. The new model accuracy after the Jenks break clustering is 59%.
Table 4 shows the classification report of TextBlob together with clustering. The classification report indicates that the overall accuracy of the TextBlob clustering model is 59%. This is slightly below average, showing that the model is not particularly effective at accurately classifying the data. The precision scores for each cluster are 0.79, 0.51, and 0.69, respectively. Precision indicates the percentage of correctly classified instances out of all instances classified for each cluster. In this case, the model was not particularly accurate in classifying the instances. The recall scores for each cluster are 0.32, 0.82, and 0.53, respectively. The model was more successful in this regard, with cluster 1 having the highest recall score. The F1-scores for each cluster are 0.45, 0.63, and 0.60, respectively. In this case, the model was not particularly accurate, with cluster 1 having the highest F1-score.
4.2.3. CNN-LSTM
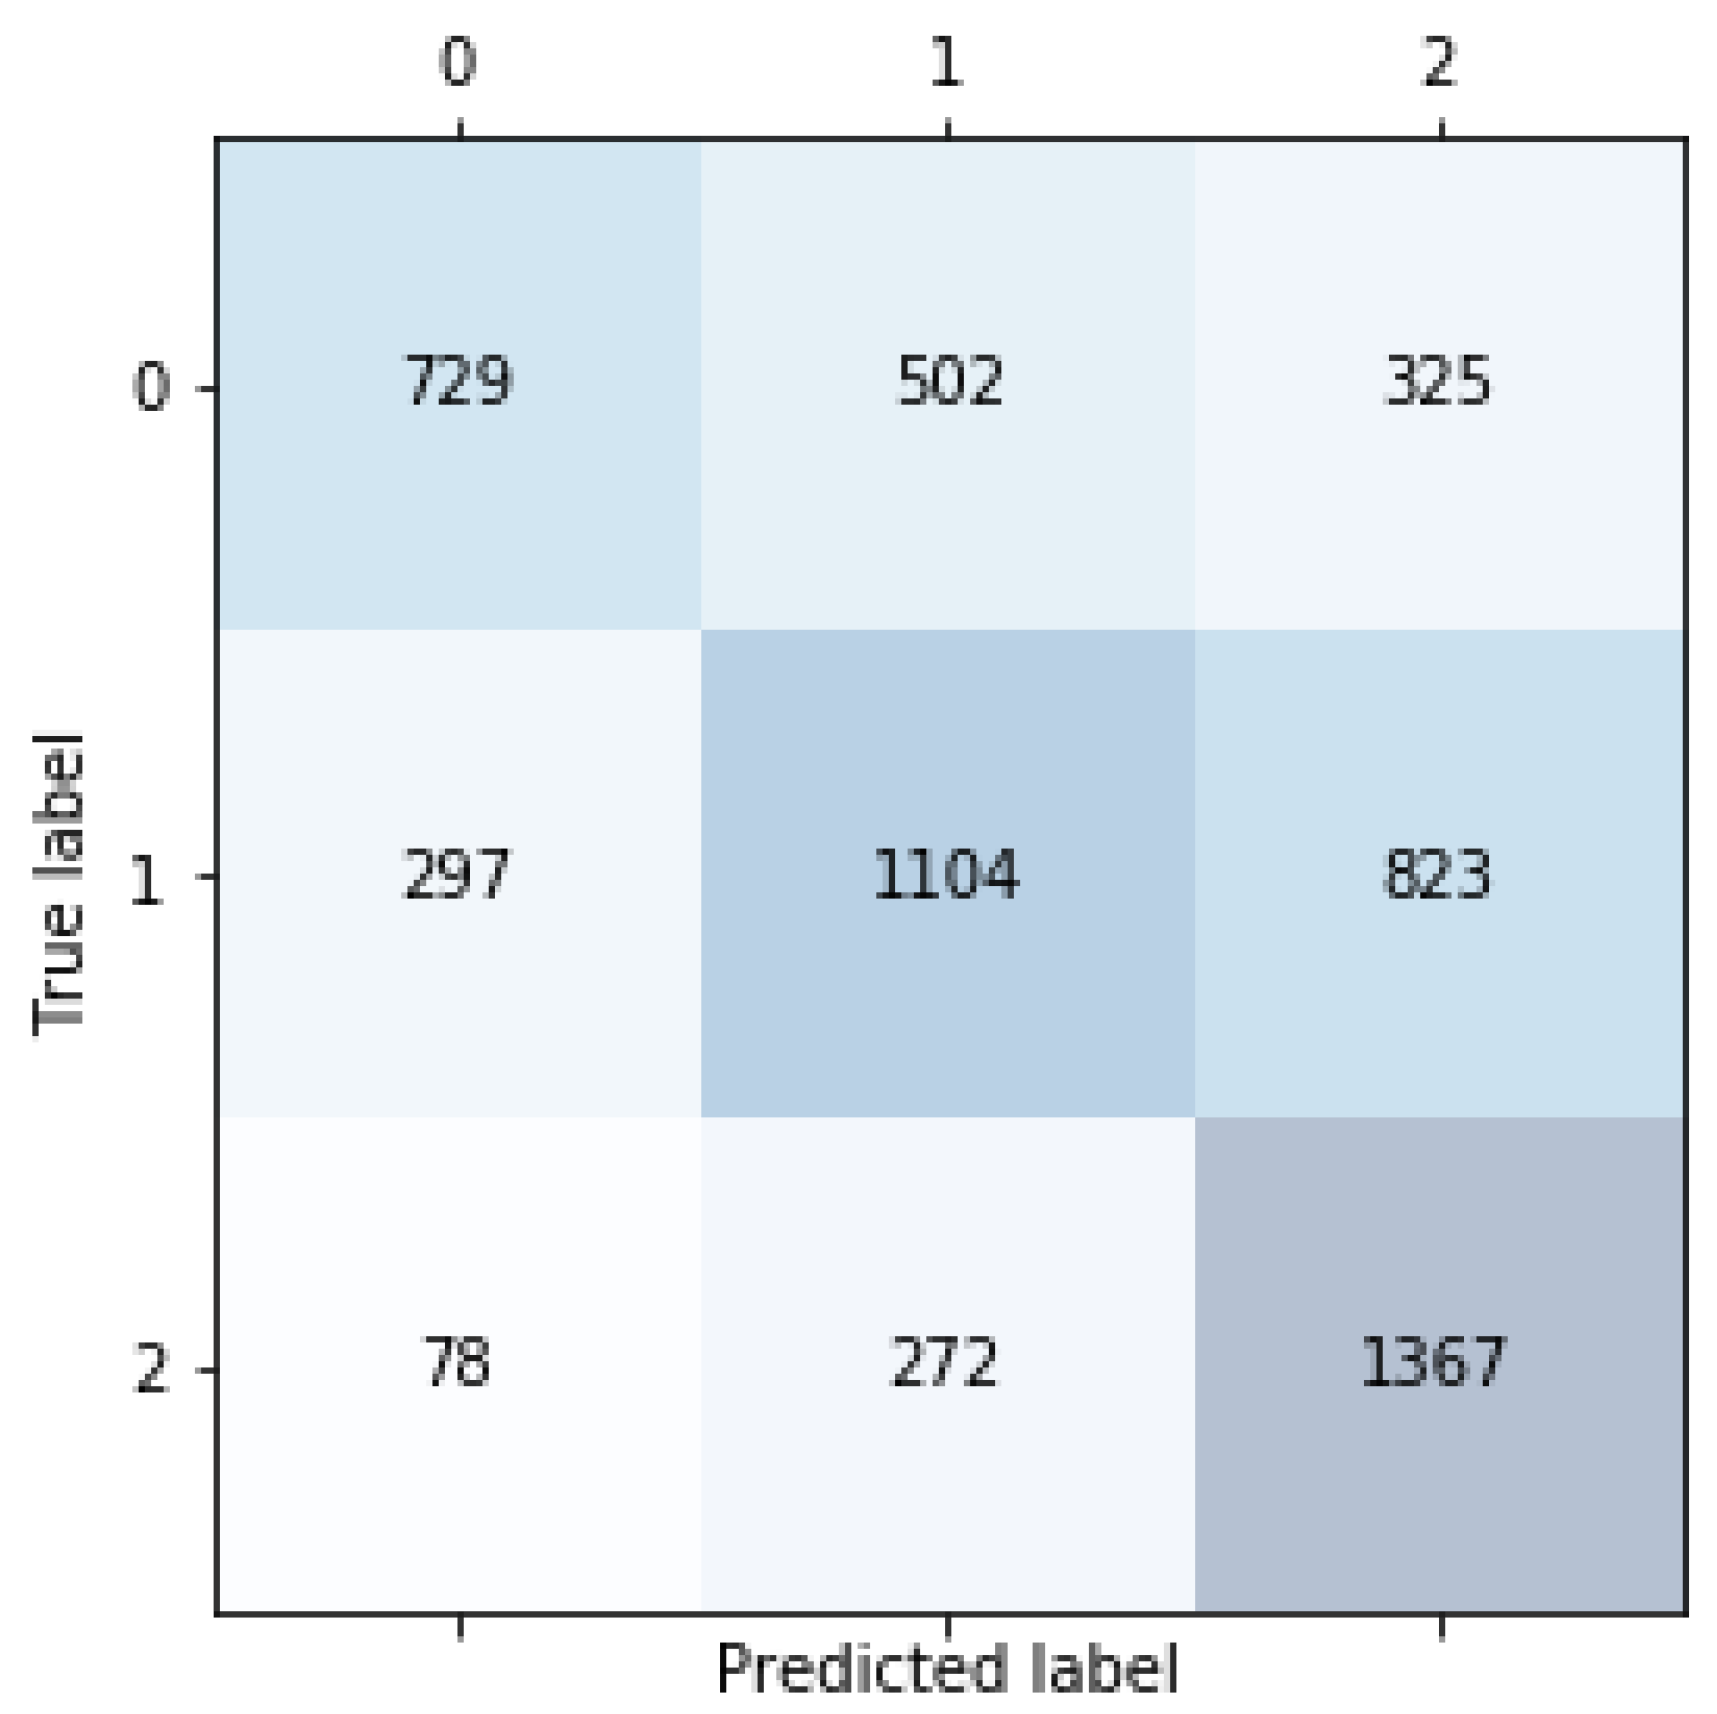
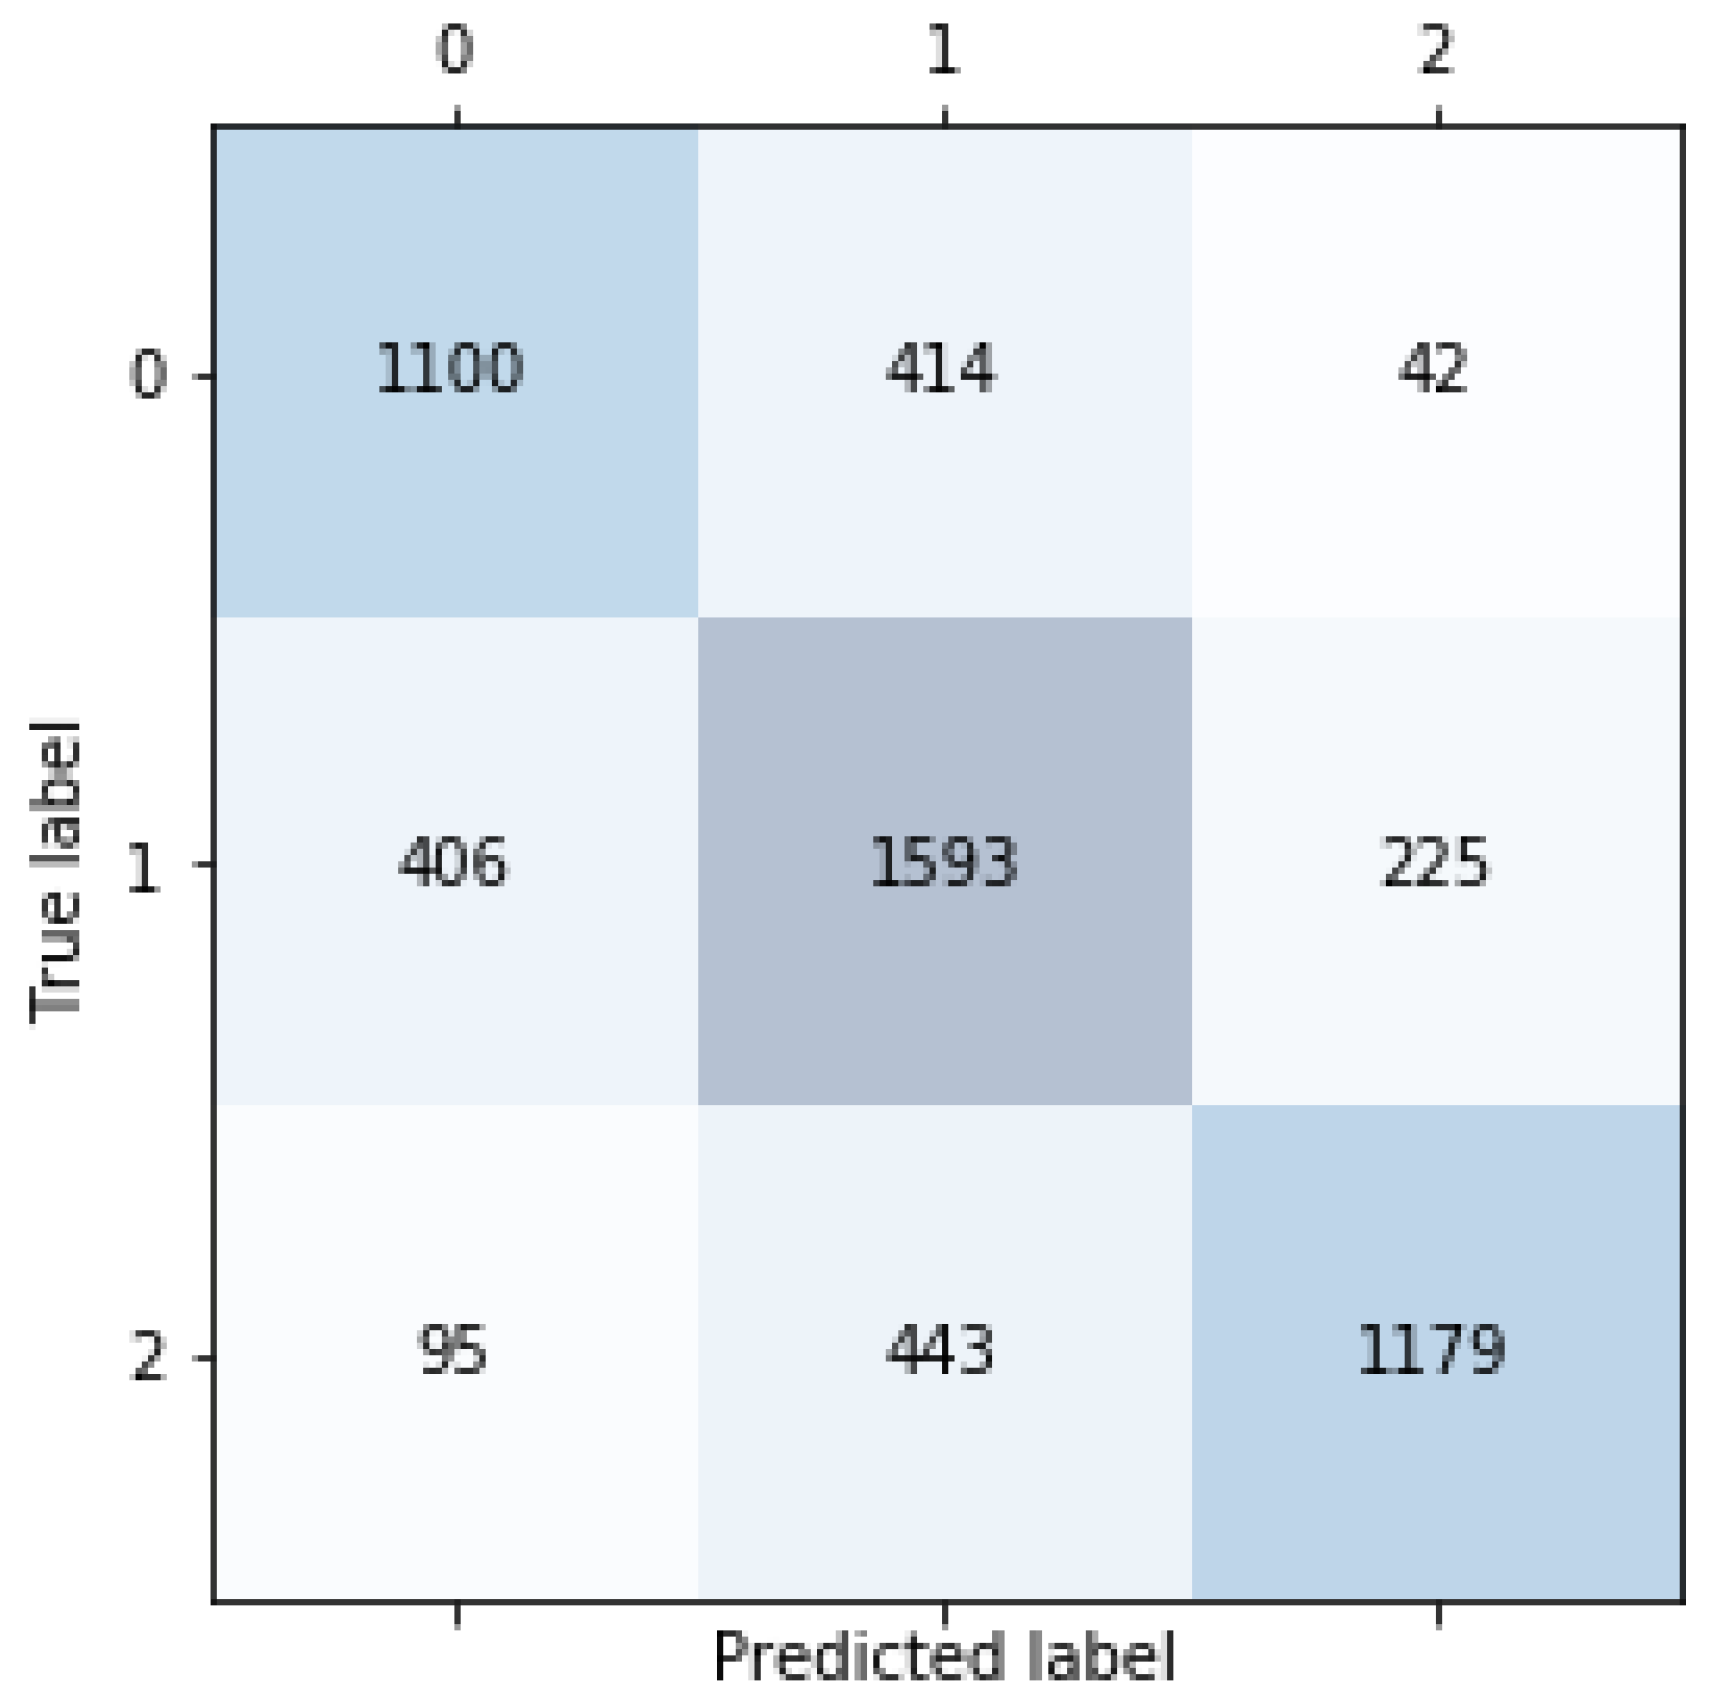
CNN-LSTM is an effective class of deep learning models for sentiment classification tasks due to its ability to extract features from text data and then use these features to accurately predict the sentiment of the text. The CNN component of the model can detect patterns in the text, while LSTM is used to capture the temporal nature of the text and its sentiment. This combination of CNN and LSTM provides an effective approach for classifying sentiment in text data, making it a suitable choice for sentiment analysis tasks. In this work, CNN is used to extract the features of the tokenized tweets, and LSTM is used to predict the sentiment of the tweet. This approach is well-suited for Natural Language Processing tasks, such as text classification. In comparison to Textblob, which is ready to use without any training, CNN-LSTM requires a more significant workload for training and preprocessing. The classification report of CNN-LSTM can be found in
Table 5. The performance of the CNN-LSTM model appears to be fairly good. It achieved an overall accuracy of 70%, with precision scores of 0.69, 0.65, and 0.82 for classes 0, 1, and 2, respectively. The recall scores were 0.71, 0.72, and 0.69 for classes 0, 1, and 2, respectively. The F1-scores were 0.70, 0.68, and 0.75 for classes 0, 1, and 2, respectively. The weighted average F1-score, which takes into account all classes, was 0.71. The corresponding confusion matrix is depicted in
Figure 7.
The results of three different model performances show that the CNN-LSTM model has the highest accuracy and various advantages. However, a downside to consider is the need for a training process and the requirement to learn a large number of words related to cryptocurrency in order to understand tweets about cryptocurrency.
4.2.4. CNN-LSTM for Cryptocurrency Tweet
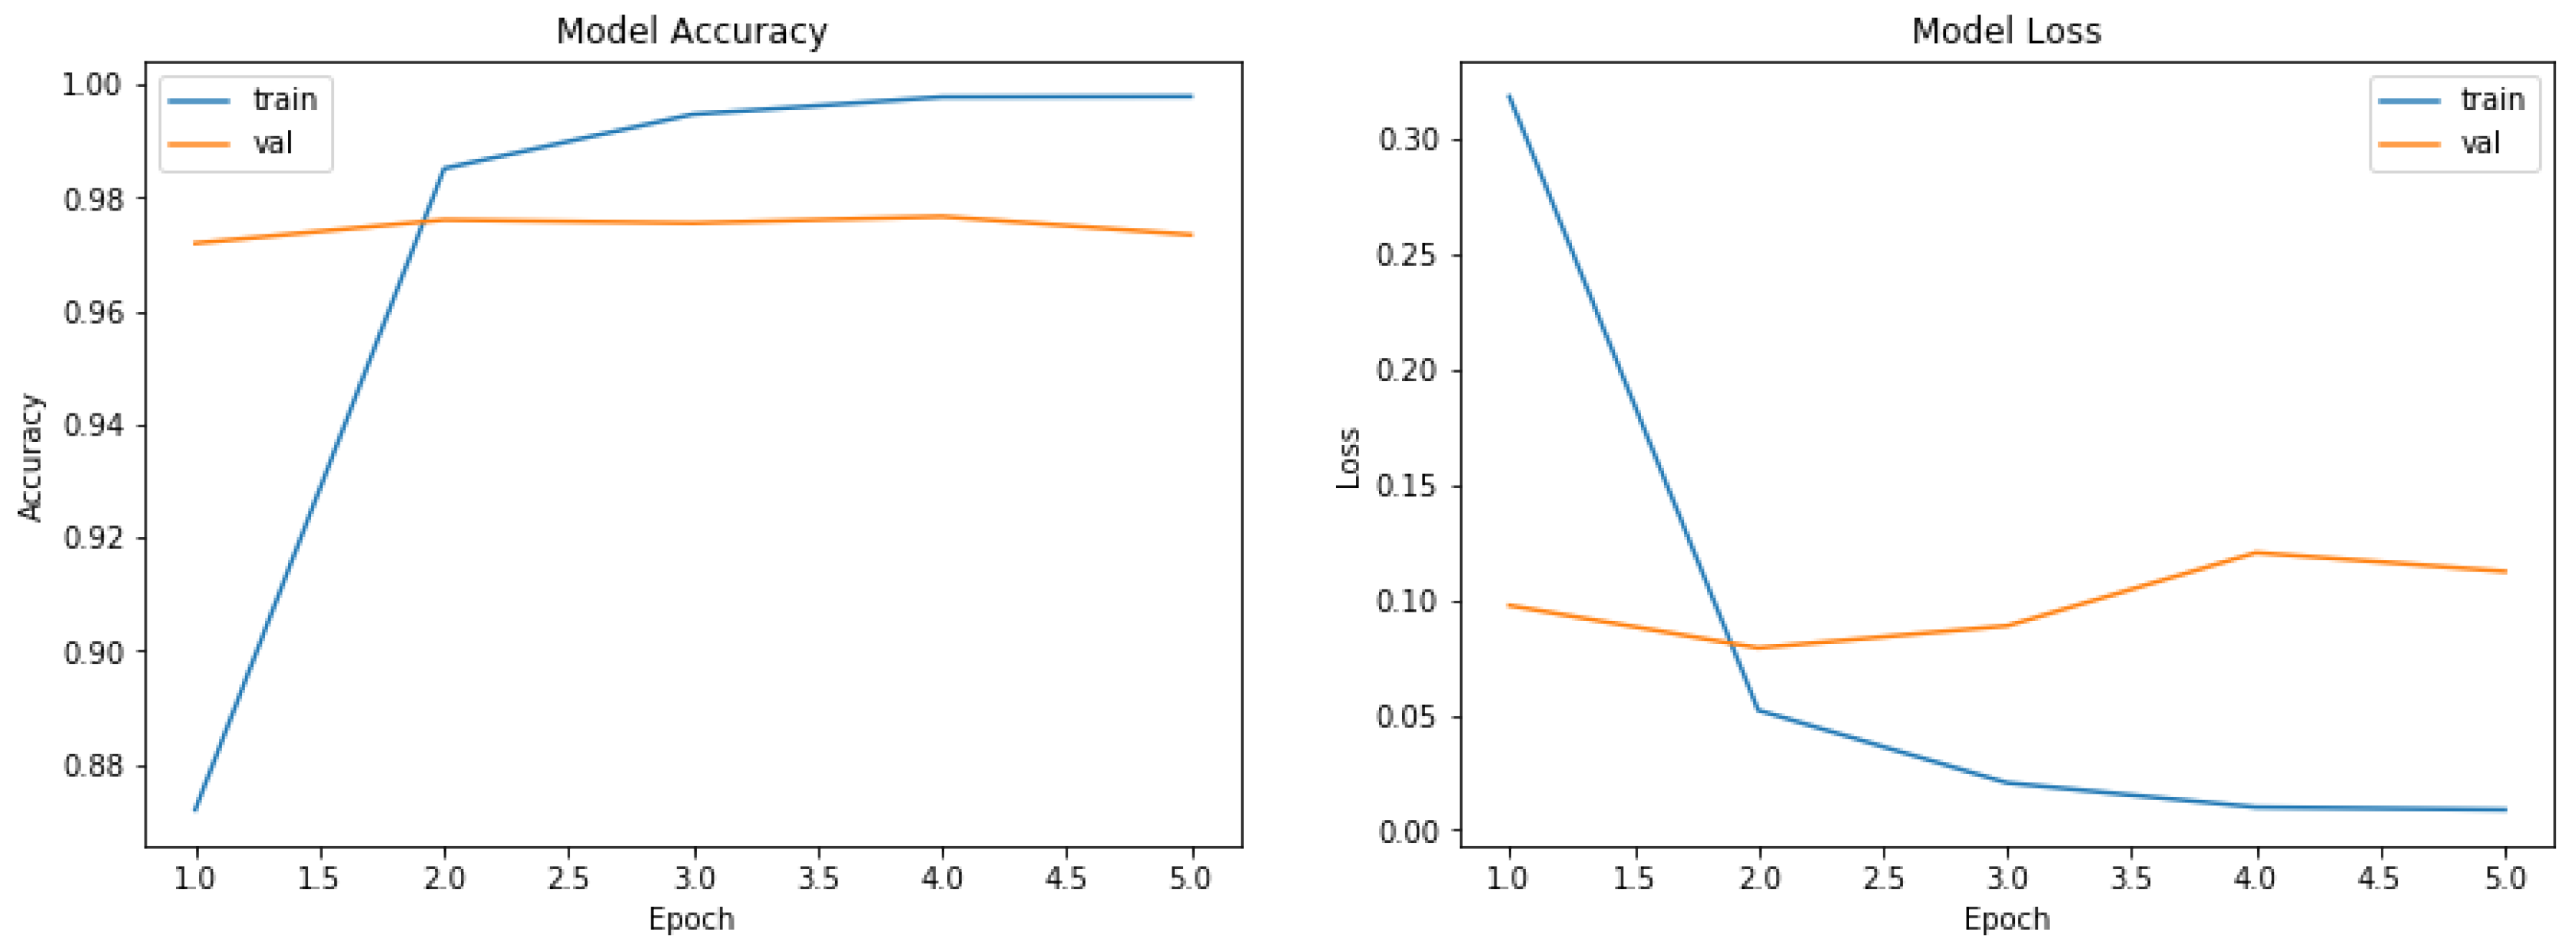
The CNN-LSTM model was trained with the Bitcoin Tweets dataset from Kaggle, as mentioned previously.
Figure 8 displays the model training history, indicating that the accuracy of the model increases with the number of epochs.
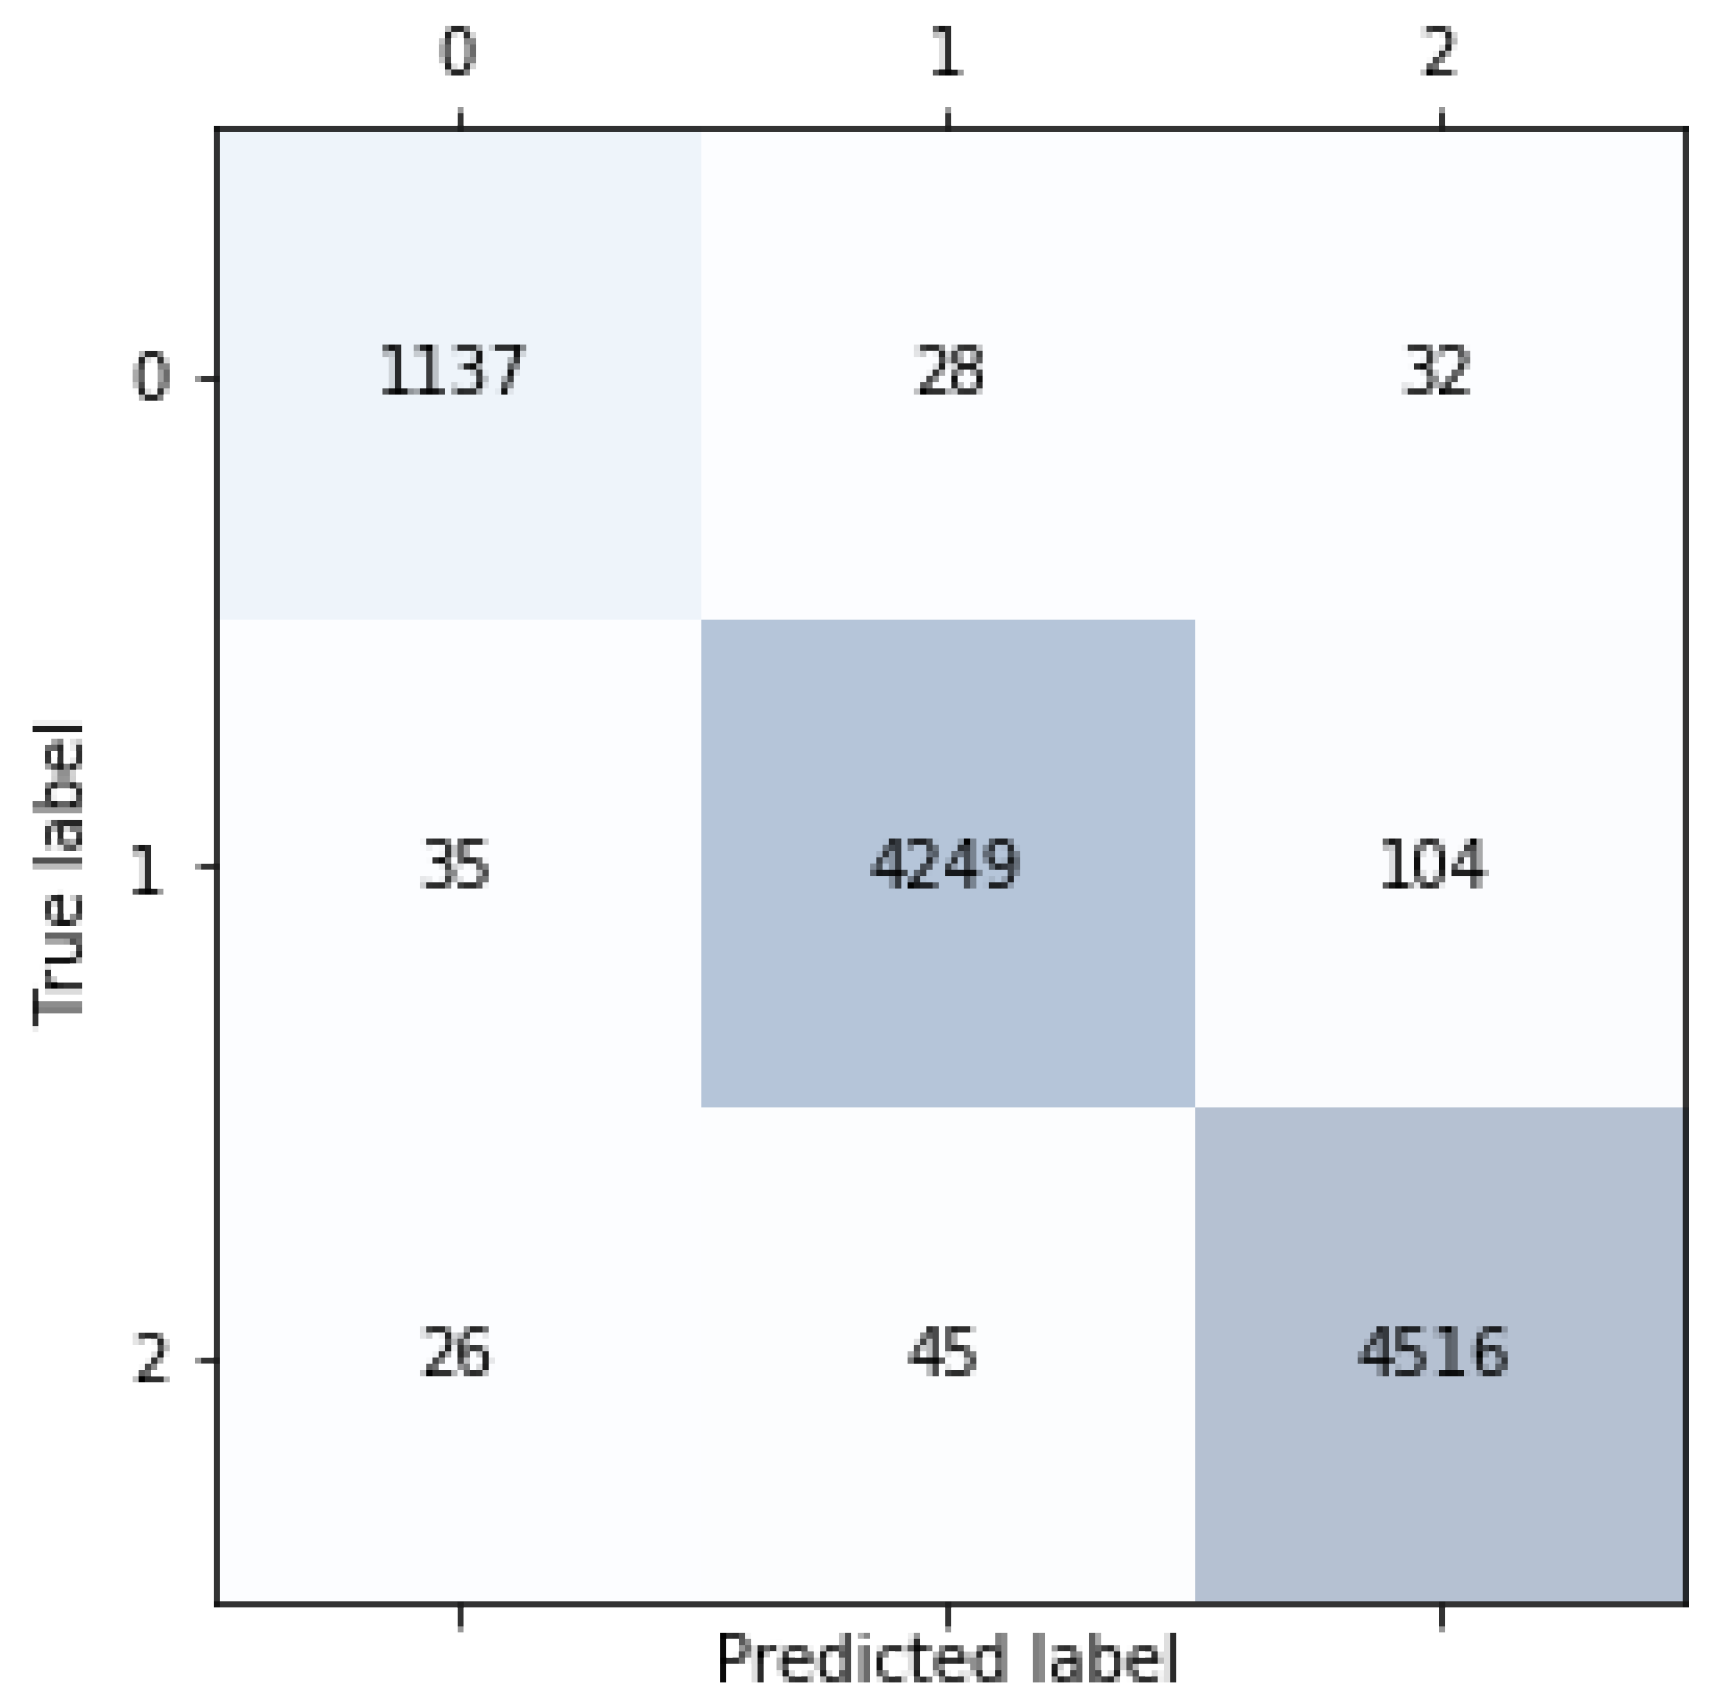
Table 6 shows the classification report of the CNN-LSTM Bitcoin Tweets model. The classification report for the CNN-LSTM Bitcoin tweets classification shows that the model is performing well in all classes. The precision and recall scores are both at least 0.95 for the first class, 0.98 for the second class, and 0.97 for the third class. The overall accuracy of the model is 0.97, which is excellent. The average macro F1-score of 0.97 also shows that the model is performing well in all classes. Overall, this model seems to be performing well for the given task.
Figure 9 displays the corresponding confusion matrix.
4.3. Predicting Future Cryptocurrency Prices
The effect of sentiment on cryptocurrency prices is well-known; therefore, a regression machine-learning algorithm is required to predict future prices with sentiment. Decision Tree, a supervised classification machine learning algorithm, was chosen for forecasting initially, as it is a simpler AI model. A decision tree is much more visible, and its decisions can be understood easier. However, a decision tree is susceptible to overfitting, and the results are not exact. Random Forest Regression, on the other hand, is robust to outliers and more accurate when compared to Decision trees. The Random Forest algorithm comprises a large number of decision trees. The outputs from these randomly chosen decision trees that make up the Random Forest are combined to make the final decision. Three Random Forest Regressor models were trained using a combination of cryptocurrency prices from January 2022 and sentiment from January 2022 cryptocurrency tweets. Each Random Forest Regressor model corresponds to its respective cryptocurrencies, such as the Bitcoin Random Forest Regressor learning from tweets related to Bitcoin and the Bitcoin historical price.
The MAE and MSE were employed to evaluate the model. The MAE and MSE of the BTC-random forest model were 2788 and 10,540,621, respectively. The MAE and MSE of the ETH-random forest model were 319 and 134,573, respectively. Lastly, the MAE and MSE of the Doge-random forest model were 0.0134 and 0.000219, respectively.
4.4. Prototype
The work used @gensim, @pymongo, @pandas, @datetime, and @tweepy as the libraries for the machine learning setup. In order to make Twitter’s tweets streaming API work, a local MongoDB server was used for storing three different cryptocurrency tweets collection and sentiment scores. RapidMiner Studio was also installed, and the trained model was put into a custom process. The MongoDB URL was changed to the local MongoDB URL. All dependencies and Python 3.6 or higher were installed. In this system, an API service has been chosen to implement cryptocurrency data as it provides a vast amount of data and reduces the risk of data loss for historical data. Additionally, using an API service can reduce the cost of using database services and prevent the risk of SQL injection by the user.
Users receive a list of cryptocurrencies first, which provides an overview of each. They can then select the watchlist page, which displays all cryptocurrencies added by the user. They also have the option to select a cryptocurrency and view its details, such as a price chart and the latest price. After accessing the detail page, users can perform four actions: add the cryptocurrency to the watchlist, remove it from the watchlist, execute the prediction function, and view related news of the cryptocurrency.
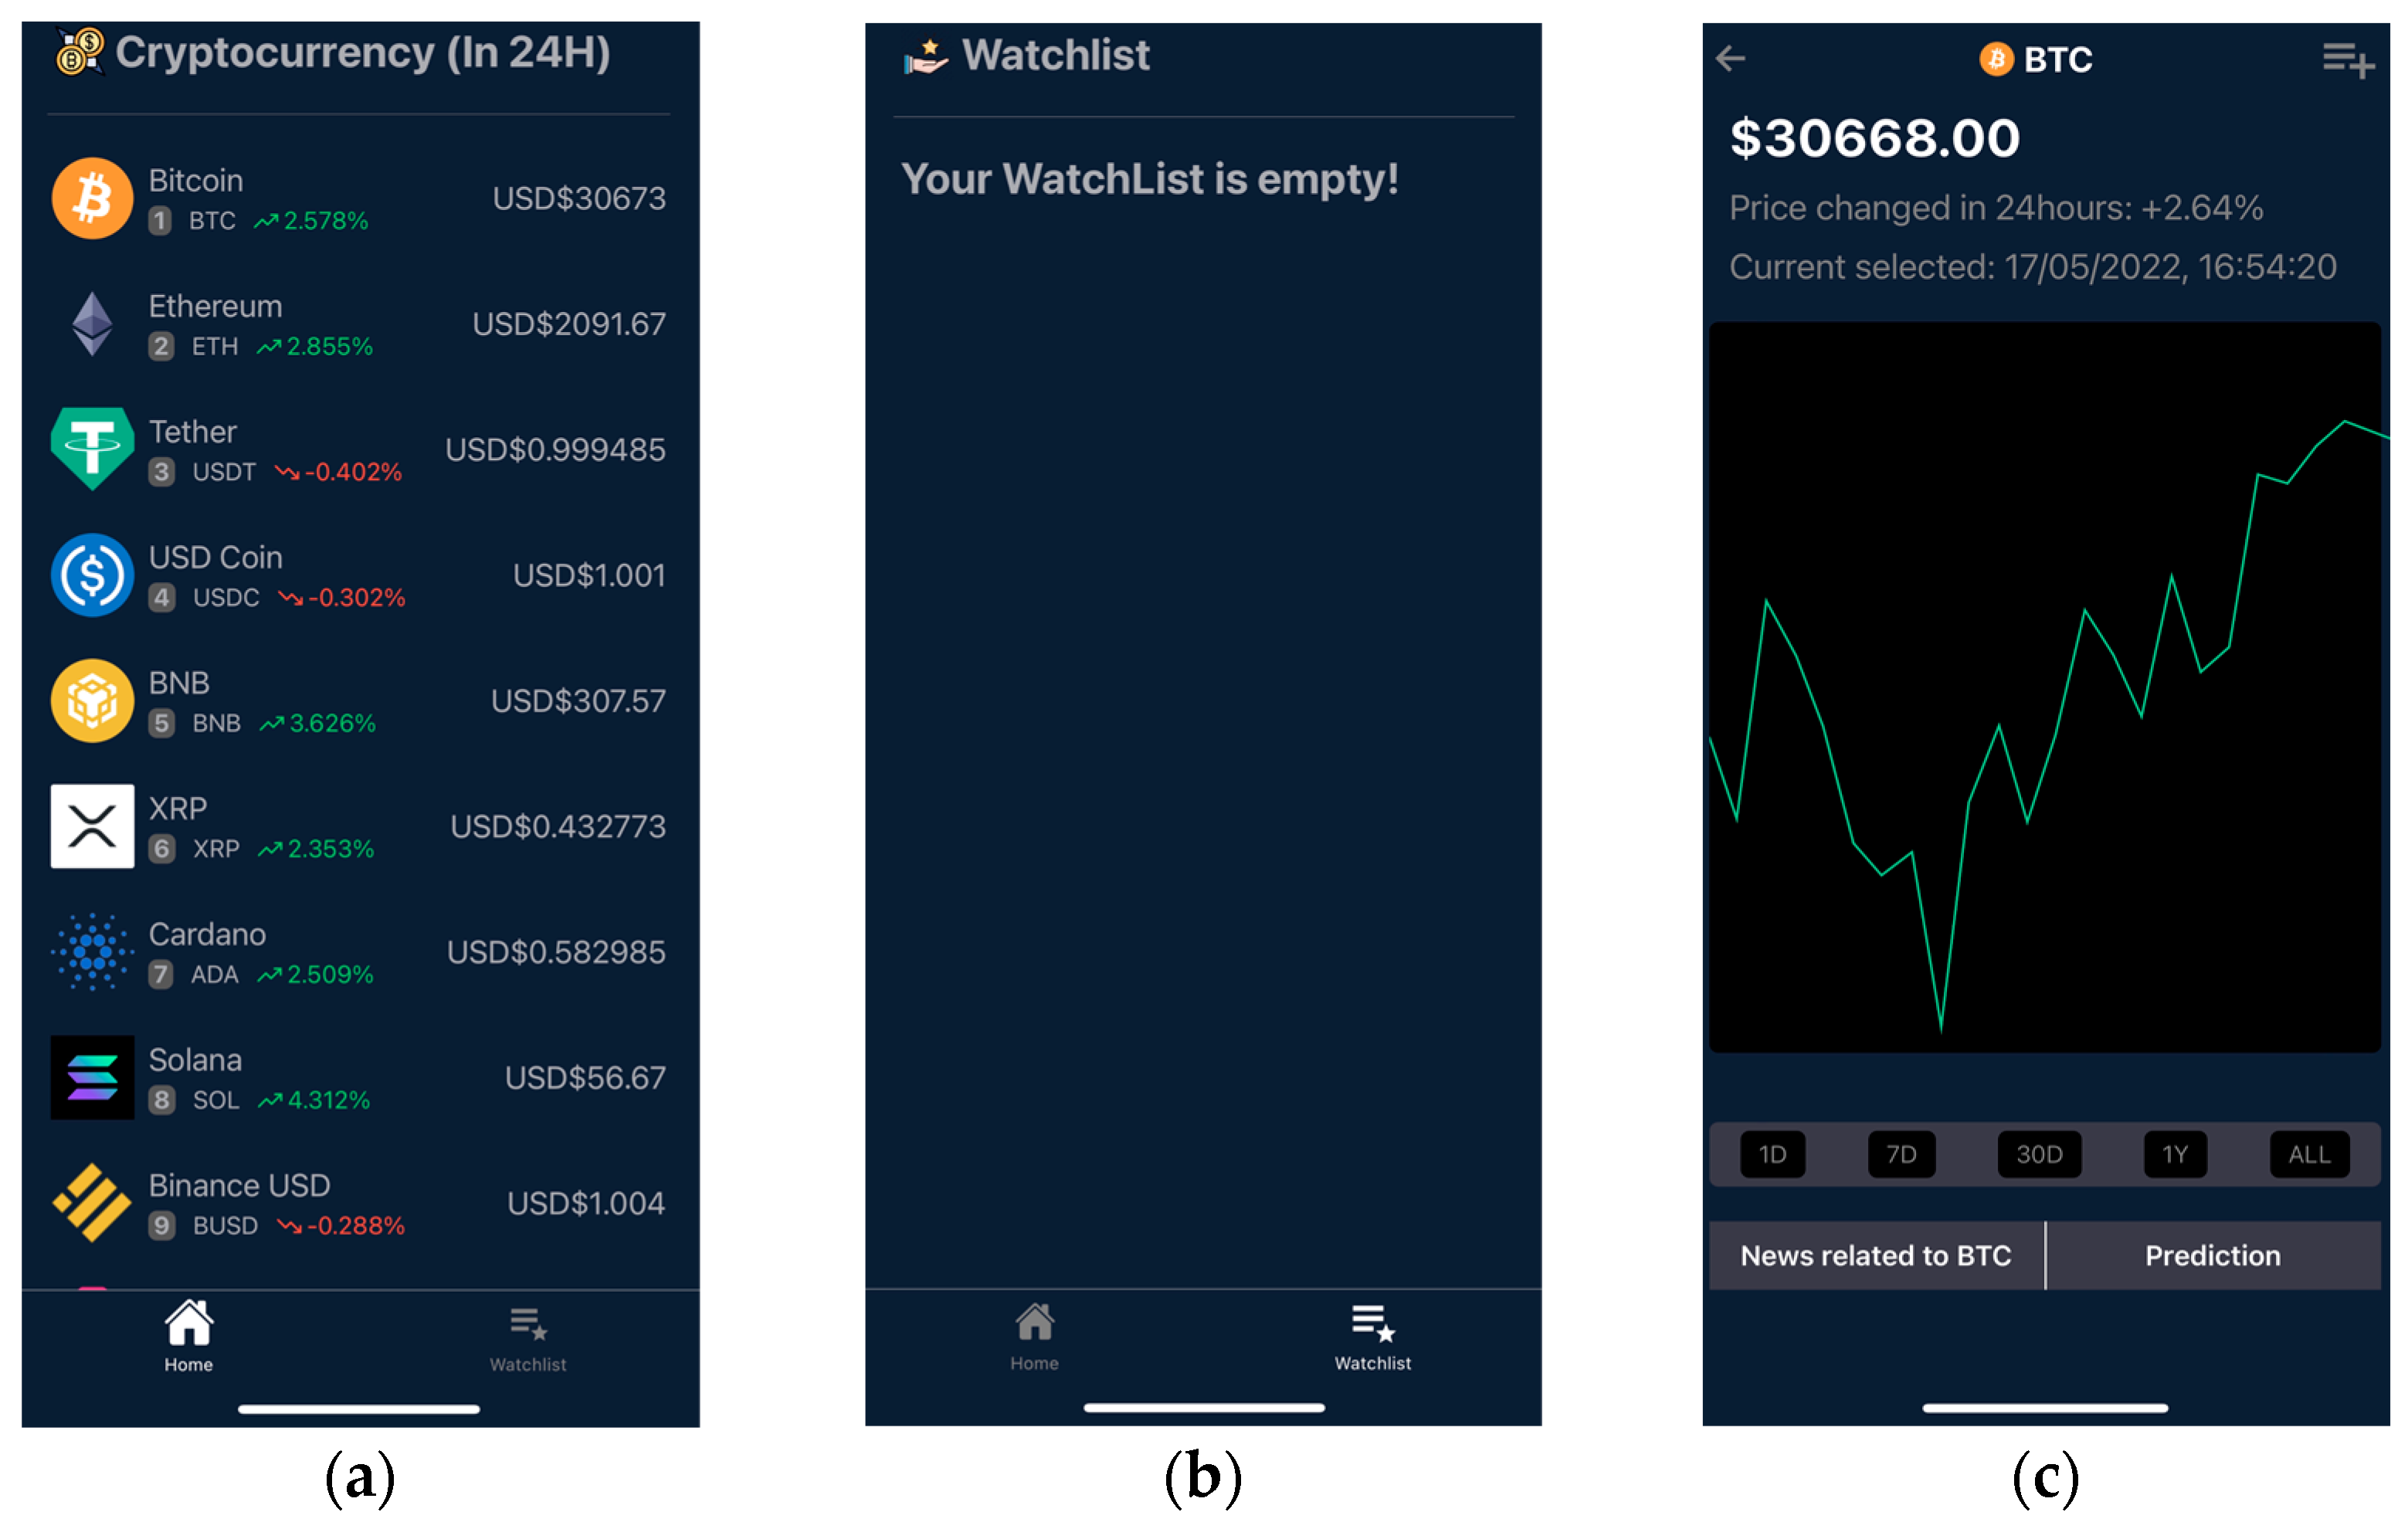
From
Figure 10a, a list of cryptocurrencies with their prices over the last 24 h, acquired from the CoinGecko API, is provided. A tab navigator at the bottom of the page allows the user to choose between the homepage and watchlist. By clicking on the watchlist tab, the user is able to view any items that are on their watchlist, as shown in
Figure 10b. If the user selects a cryptocurrency, they will be directed to the detail page (
Figure 10c). In
Figure 10c, the current price, price change, currently selected time, price chart, news button, and prediction button are all obtained from the CoinGecko API. When the user points to the price chart, the above values keep changing to the pointing value. Furthermore, the user can press on the period bar to select a different period of the price chart. Each time the user changes the period, the system calls the CoinGecko API again to obtain the data.
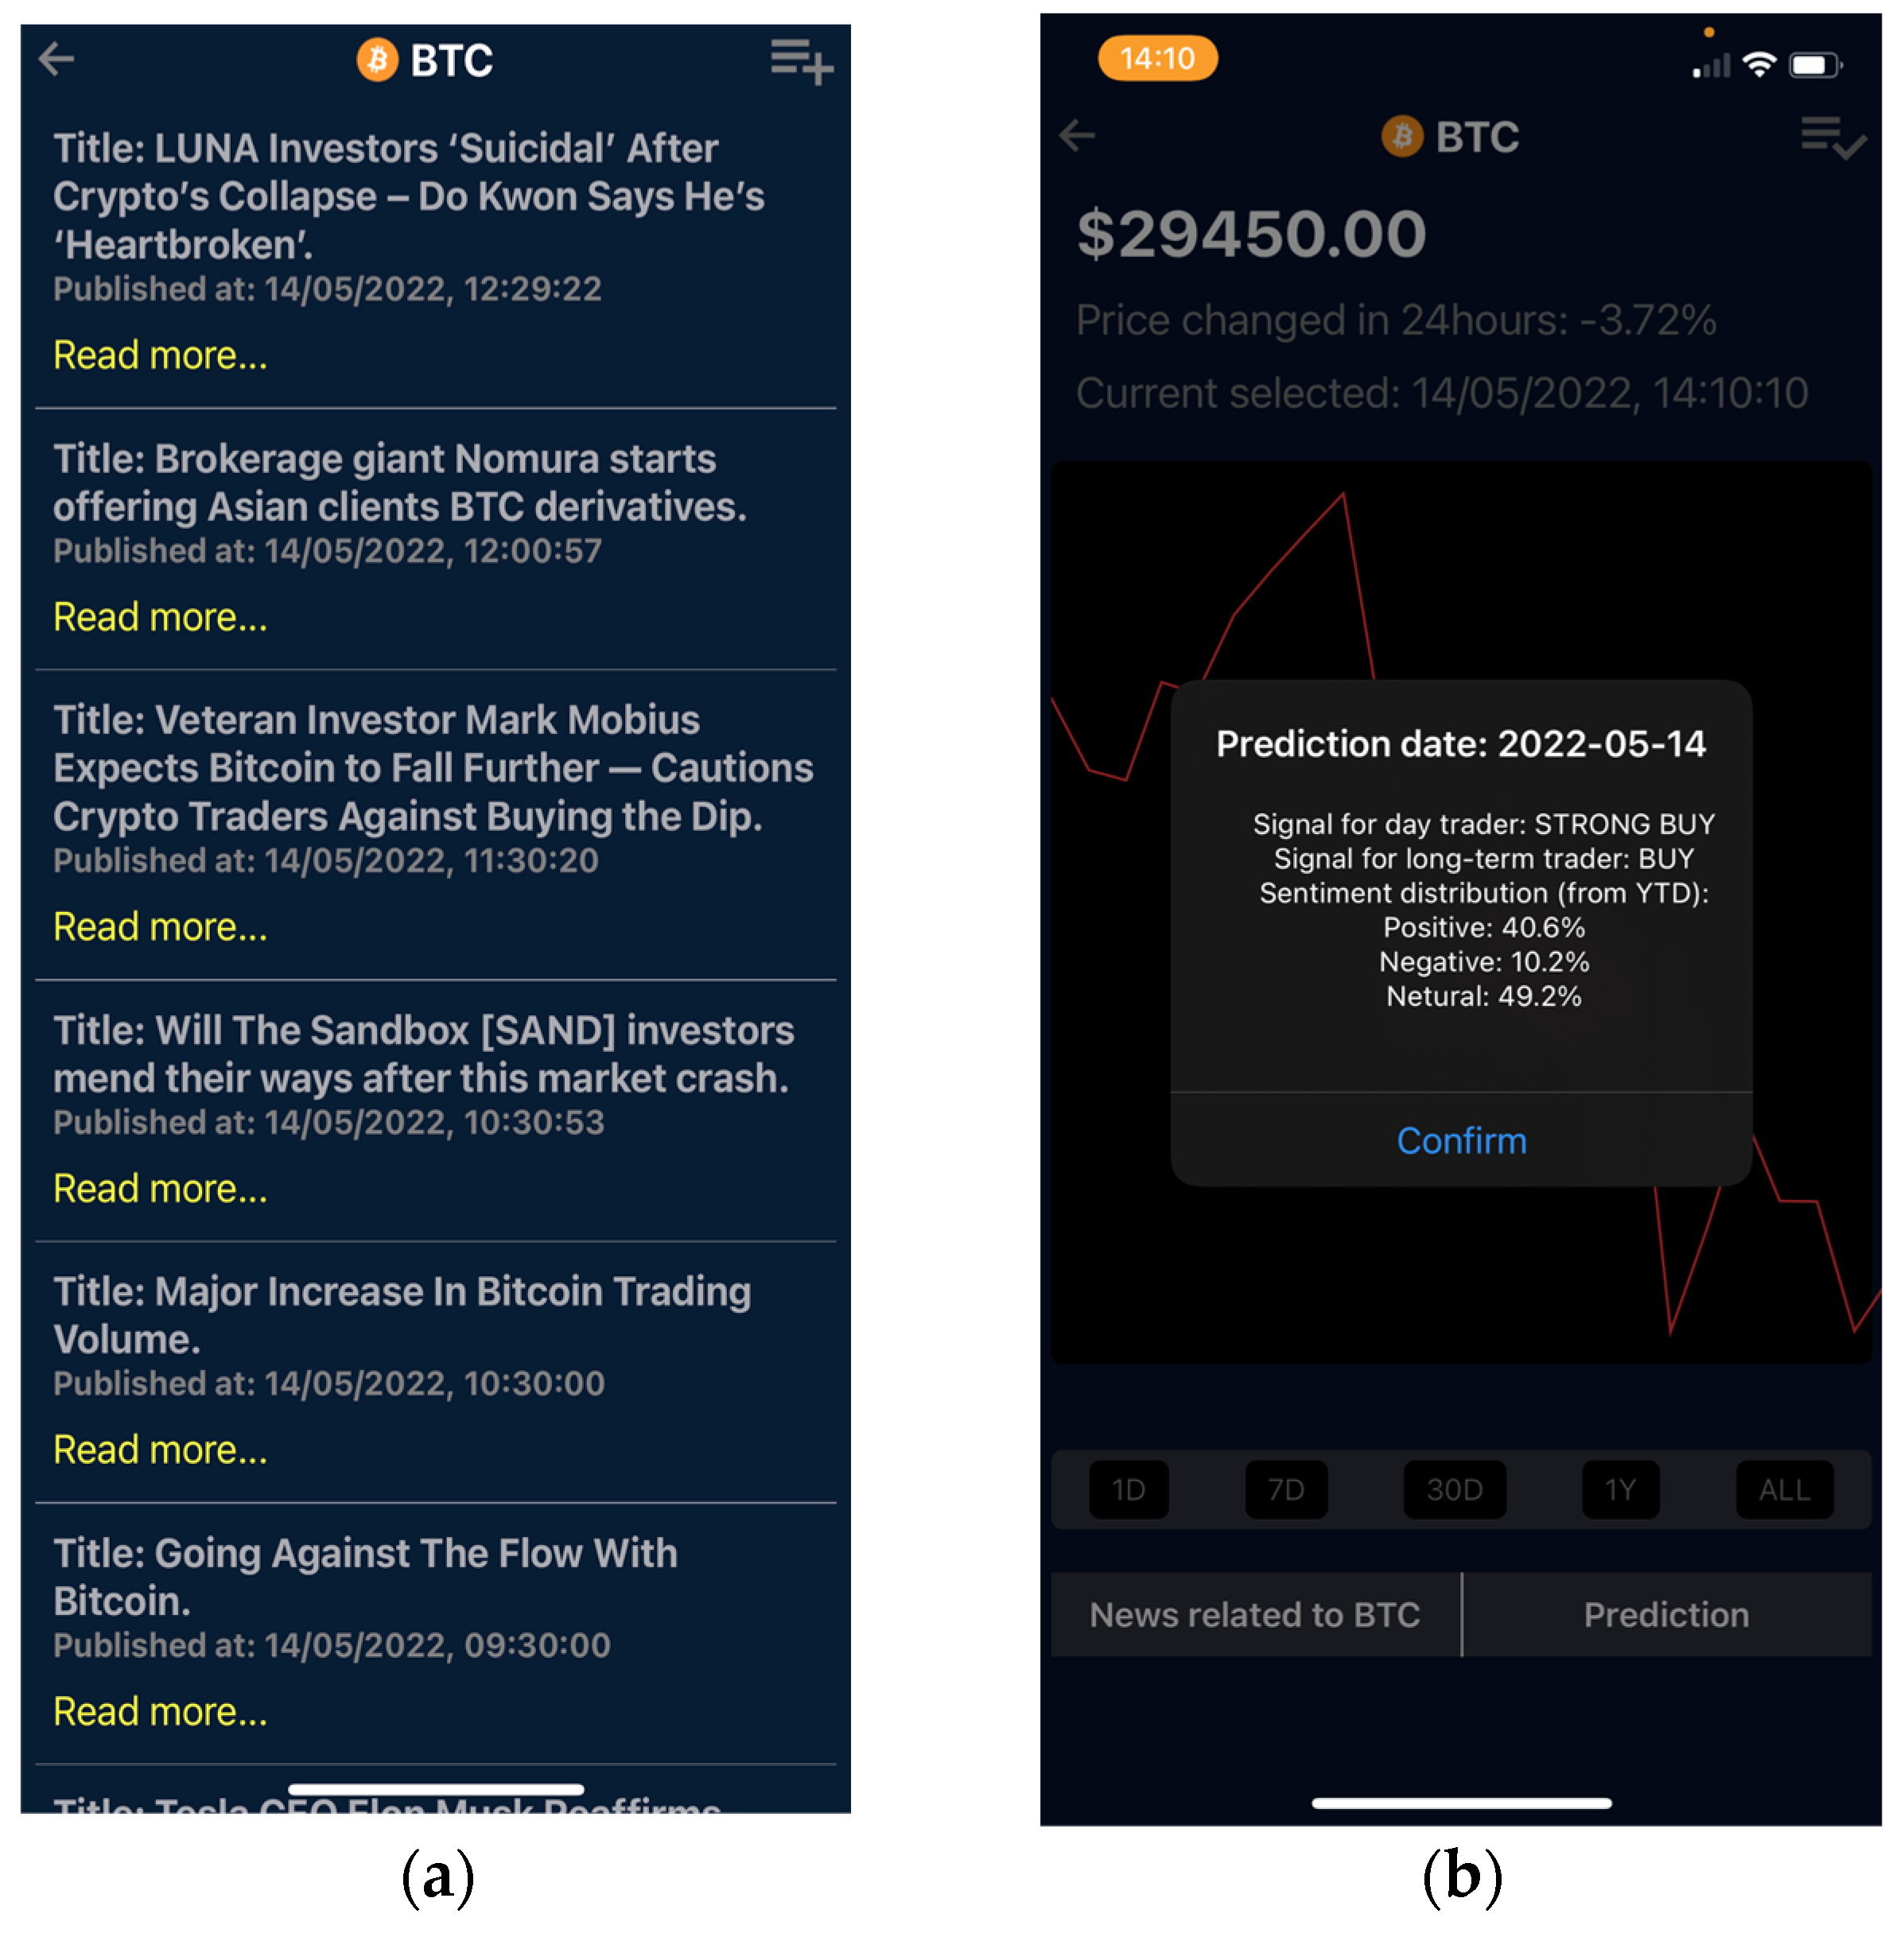
Furthermore, pressing the “News related to BTC” button executes the news function.
Figure 11a shows the news data obtained by the system, which sent a request to the CryptoPanic API. Pressing the “prediction” button, if available, produces the prediction result, which is shown as a popup message like
Figure 11b. The result data is obtained from the trading signal server. When the user presses the prediction button, the system will send a request to the trading signal server if the function is available on the selected cryptocurrency, and the result will be displayed as an alert message. Upon pressing the news button, the system will send a request to the Cryptopanic API, and the result will be displayed using the Flatlist component, which will list all related news.
4.5. Trading Signal Prediction
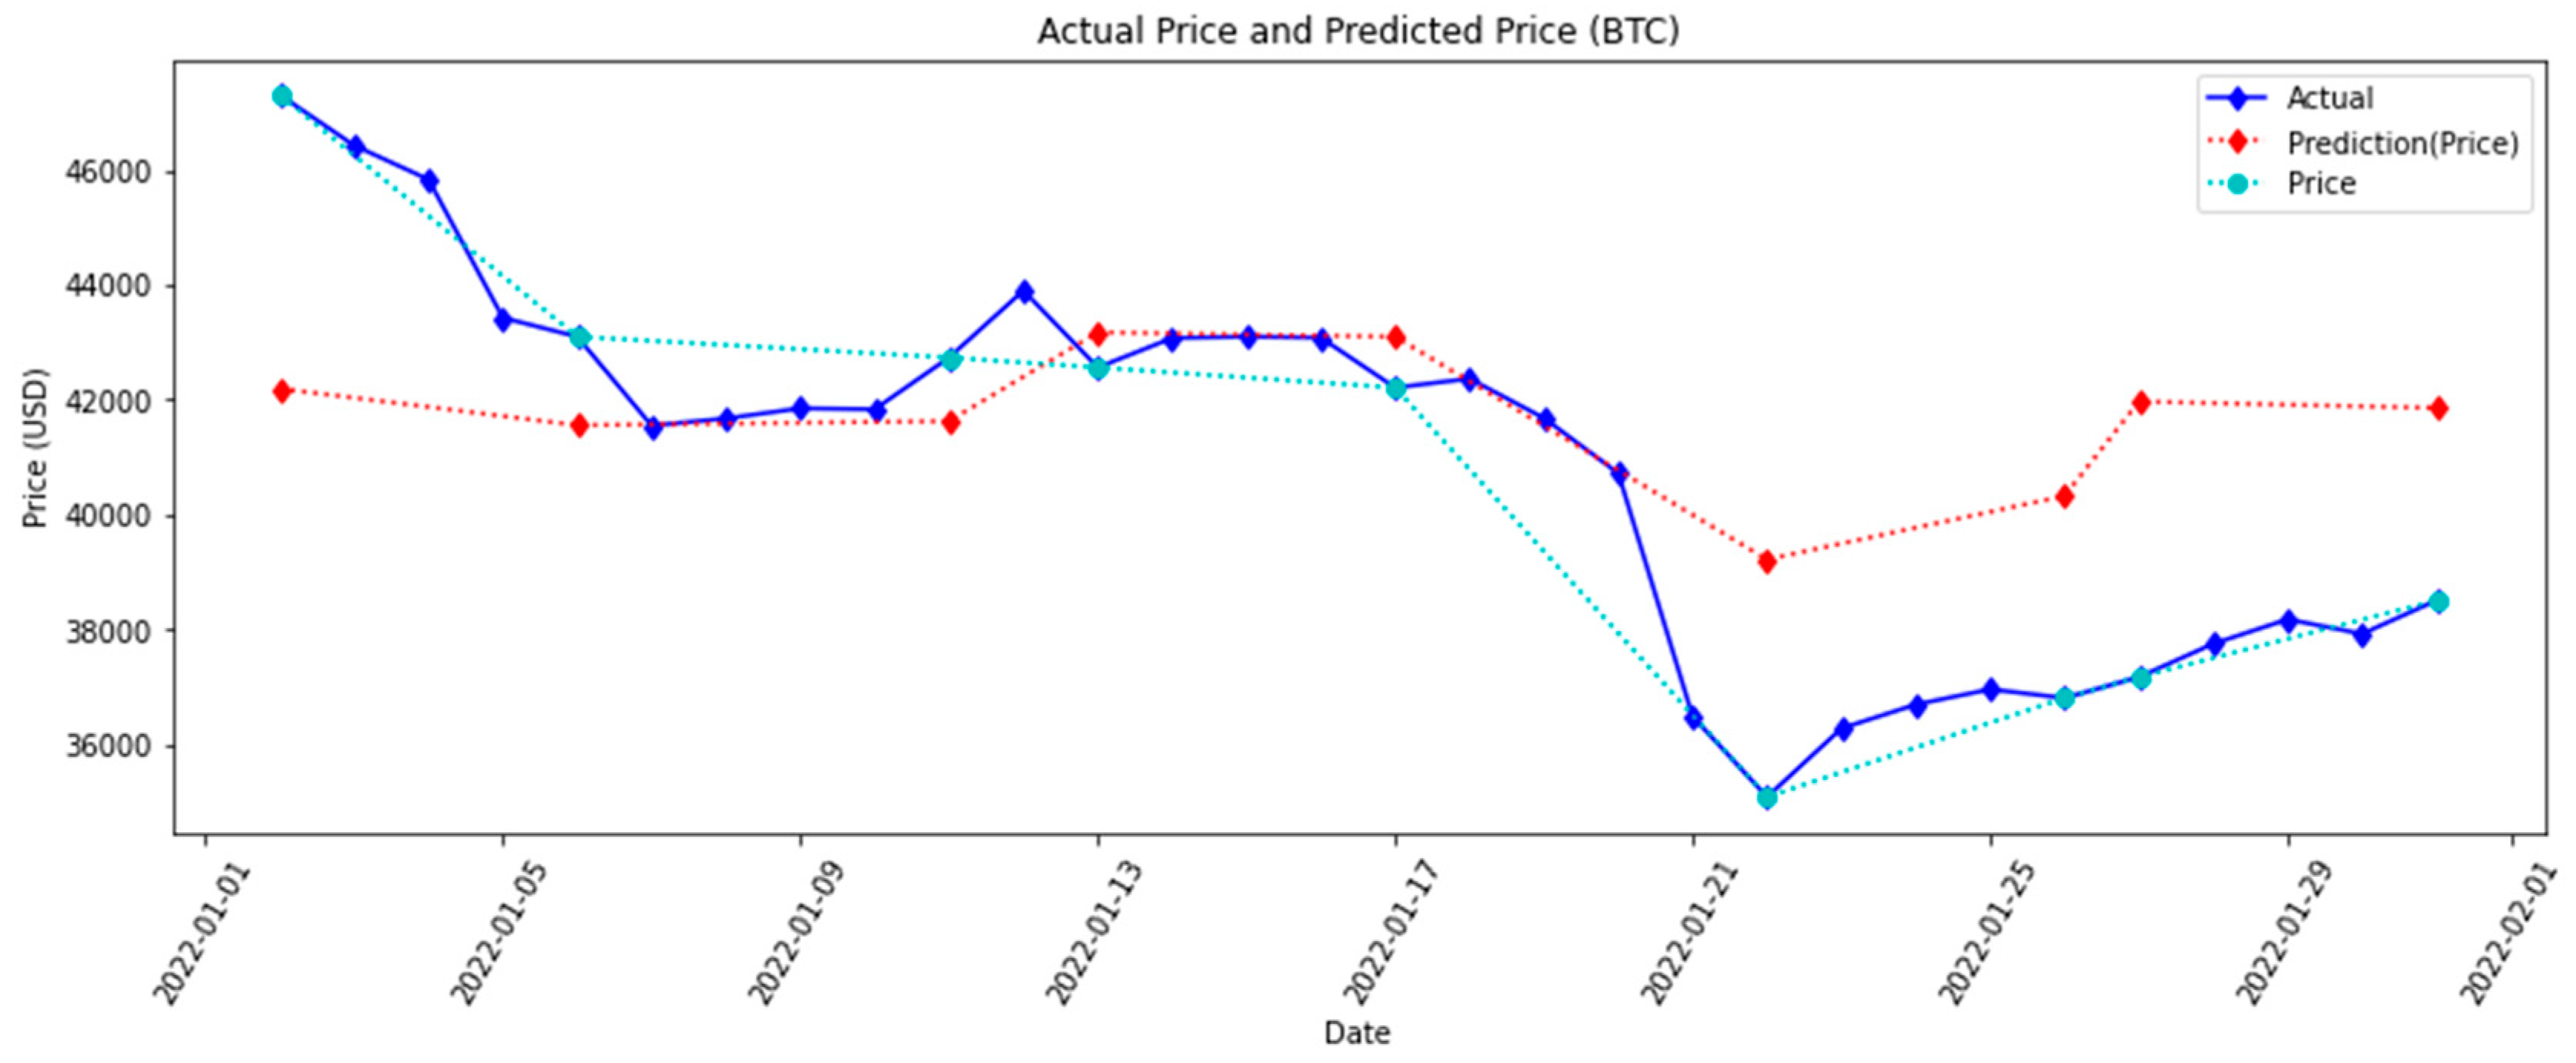
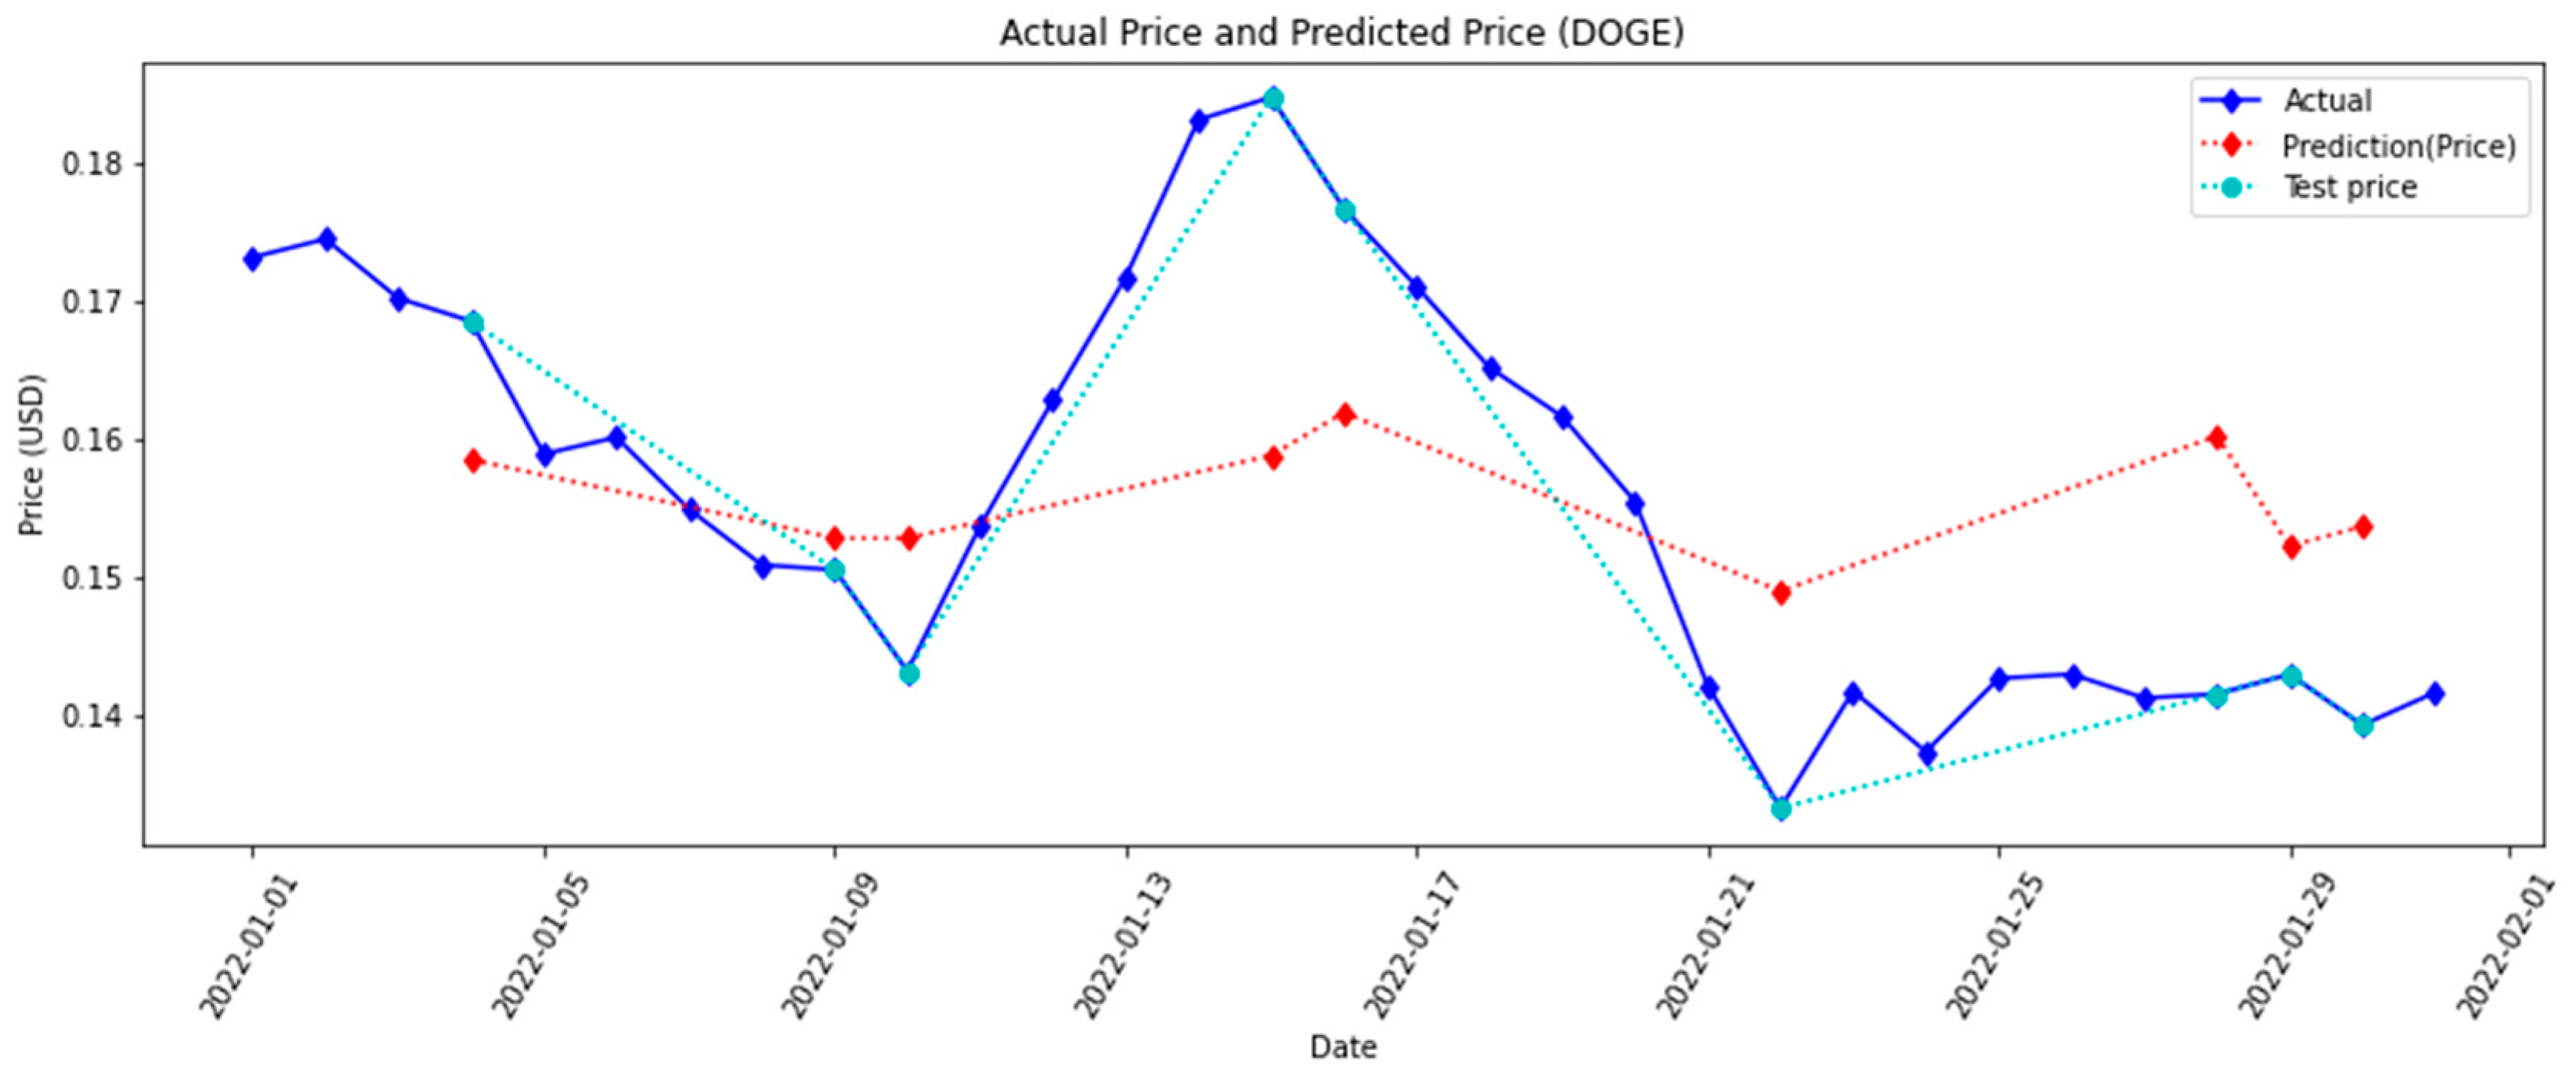
Figure 12,
Figure 13 and
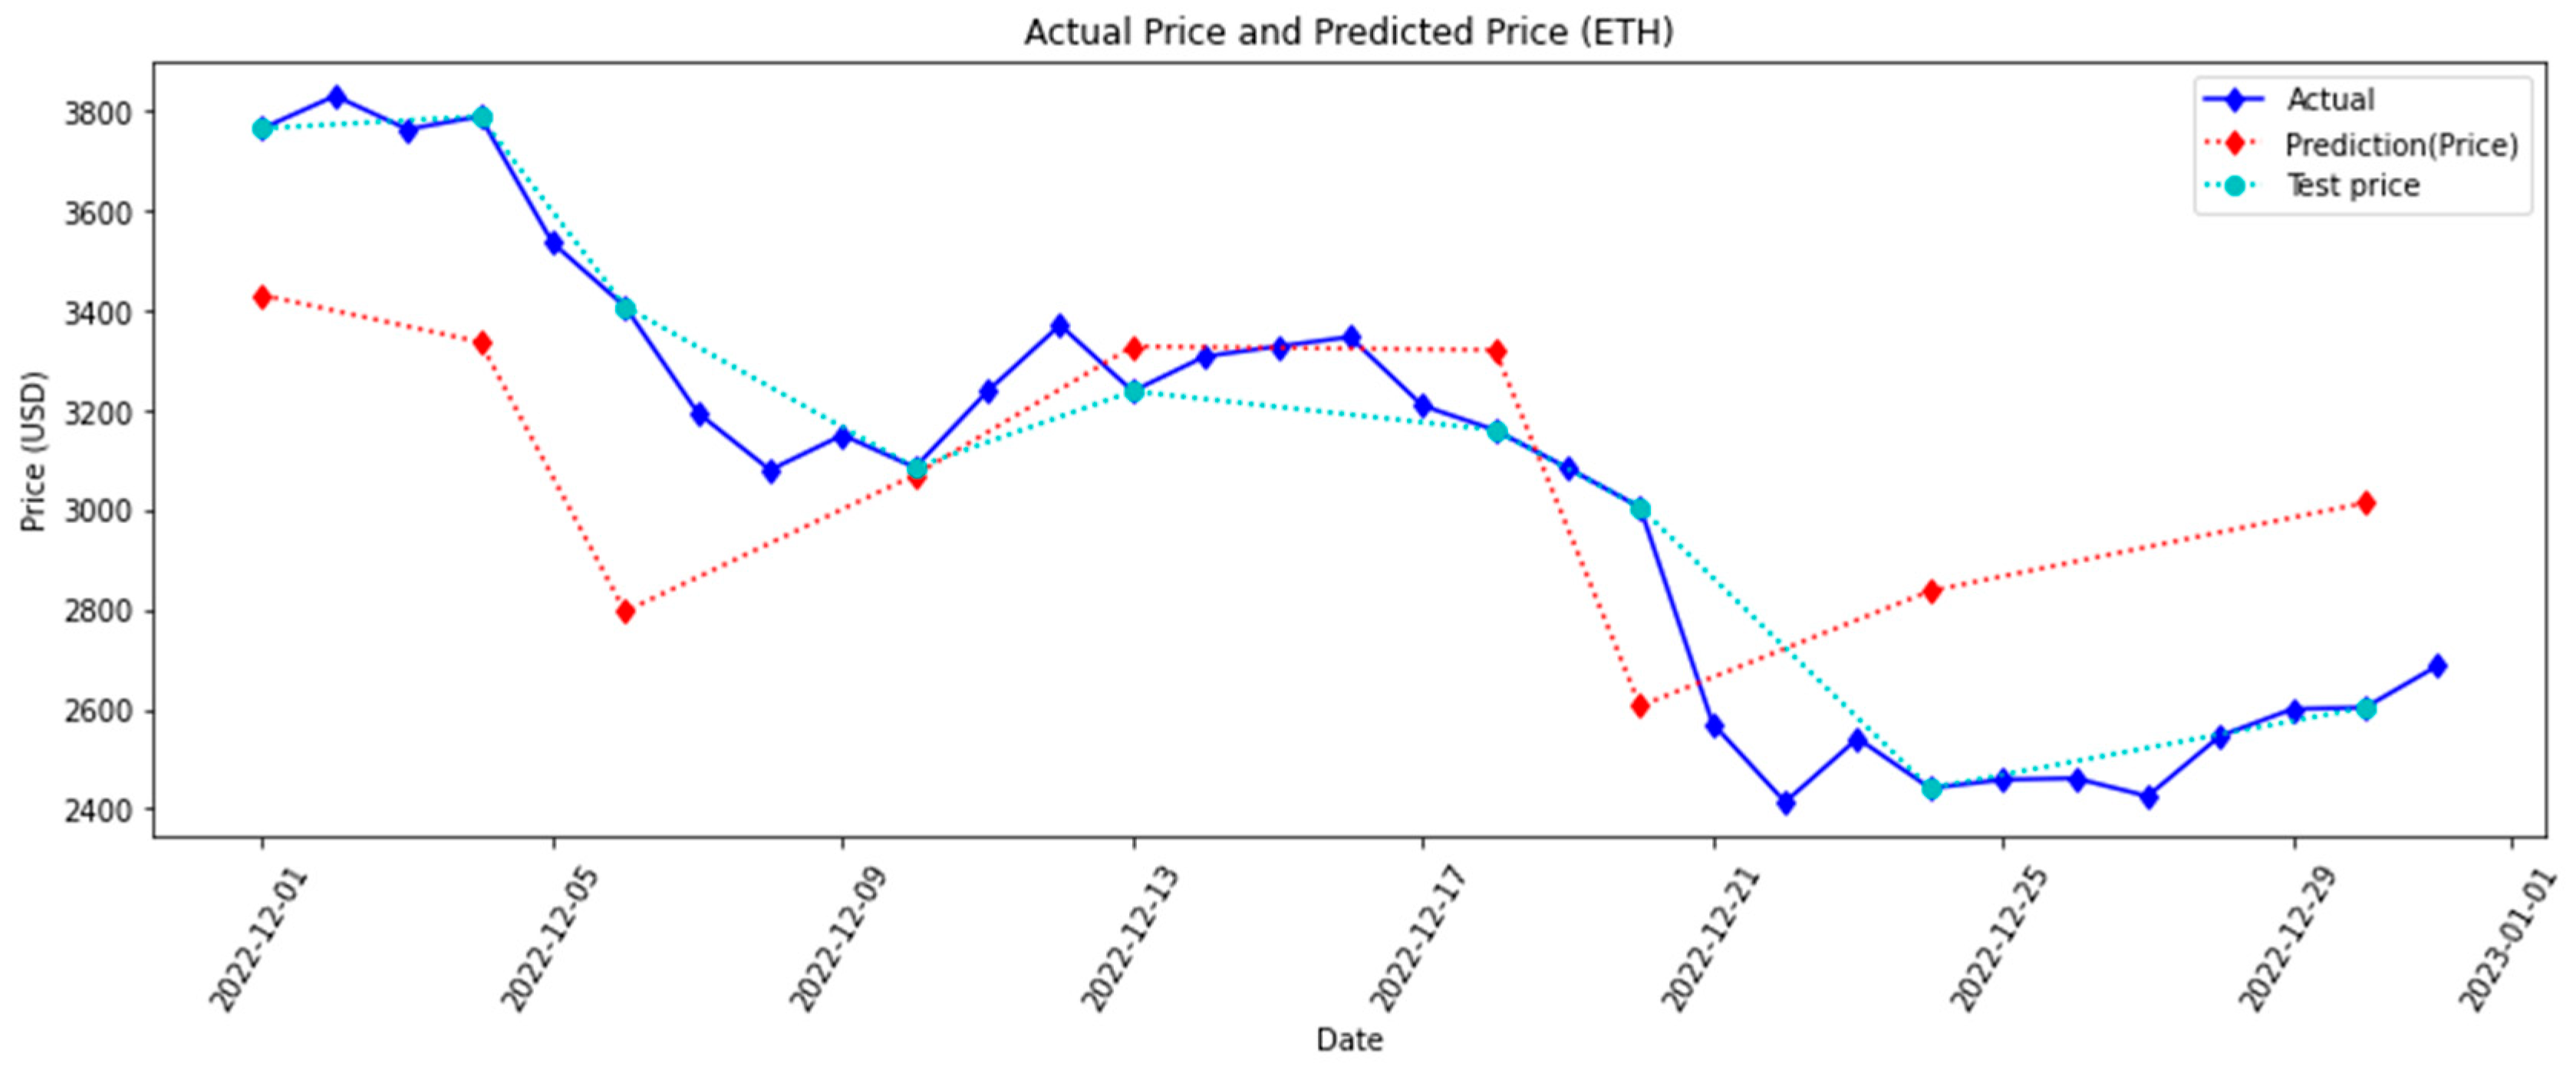
Figure 14 show the results of the CNN–LSTM-based model for Bitcoin, Dogecoin, and Ethereum over a period of one month. The red line indicates the predicted trend, while the blue line indicates the actual trend. The cyan line shows the testing data, which is randomly chosen from the actual trend.
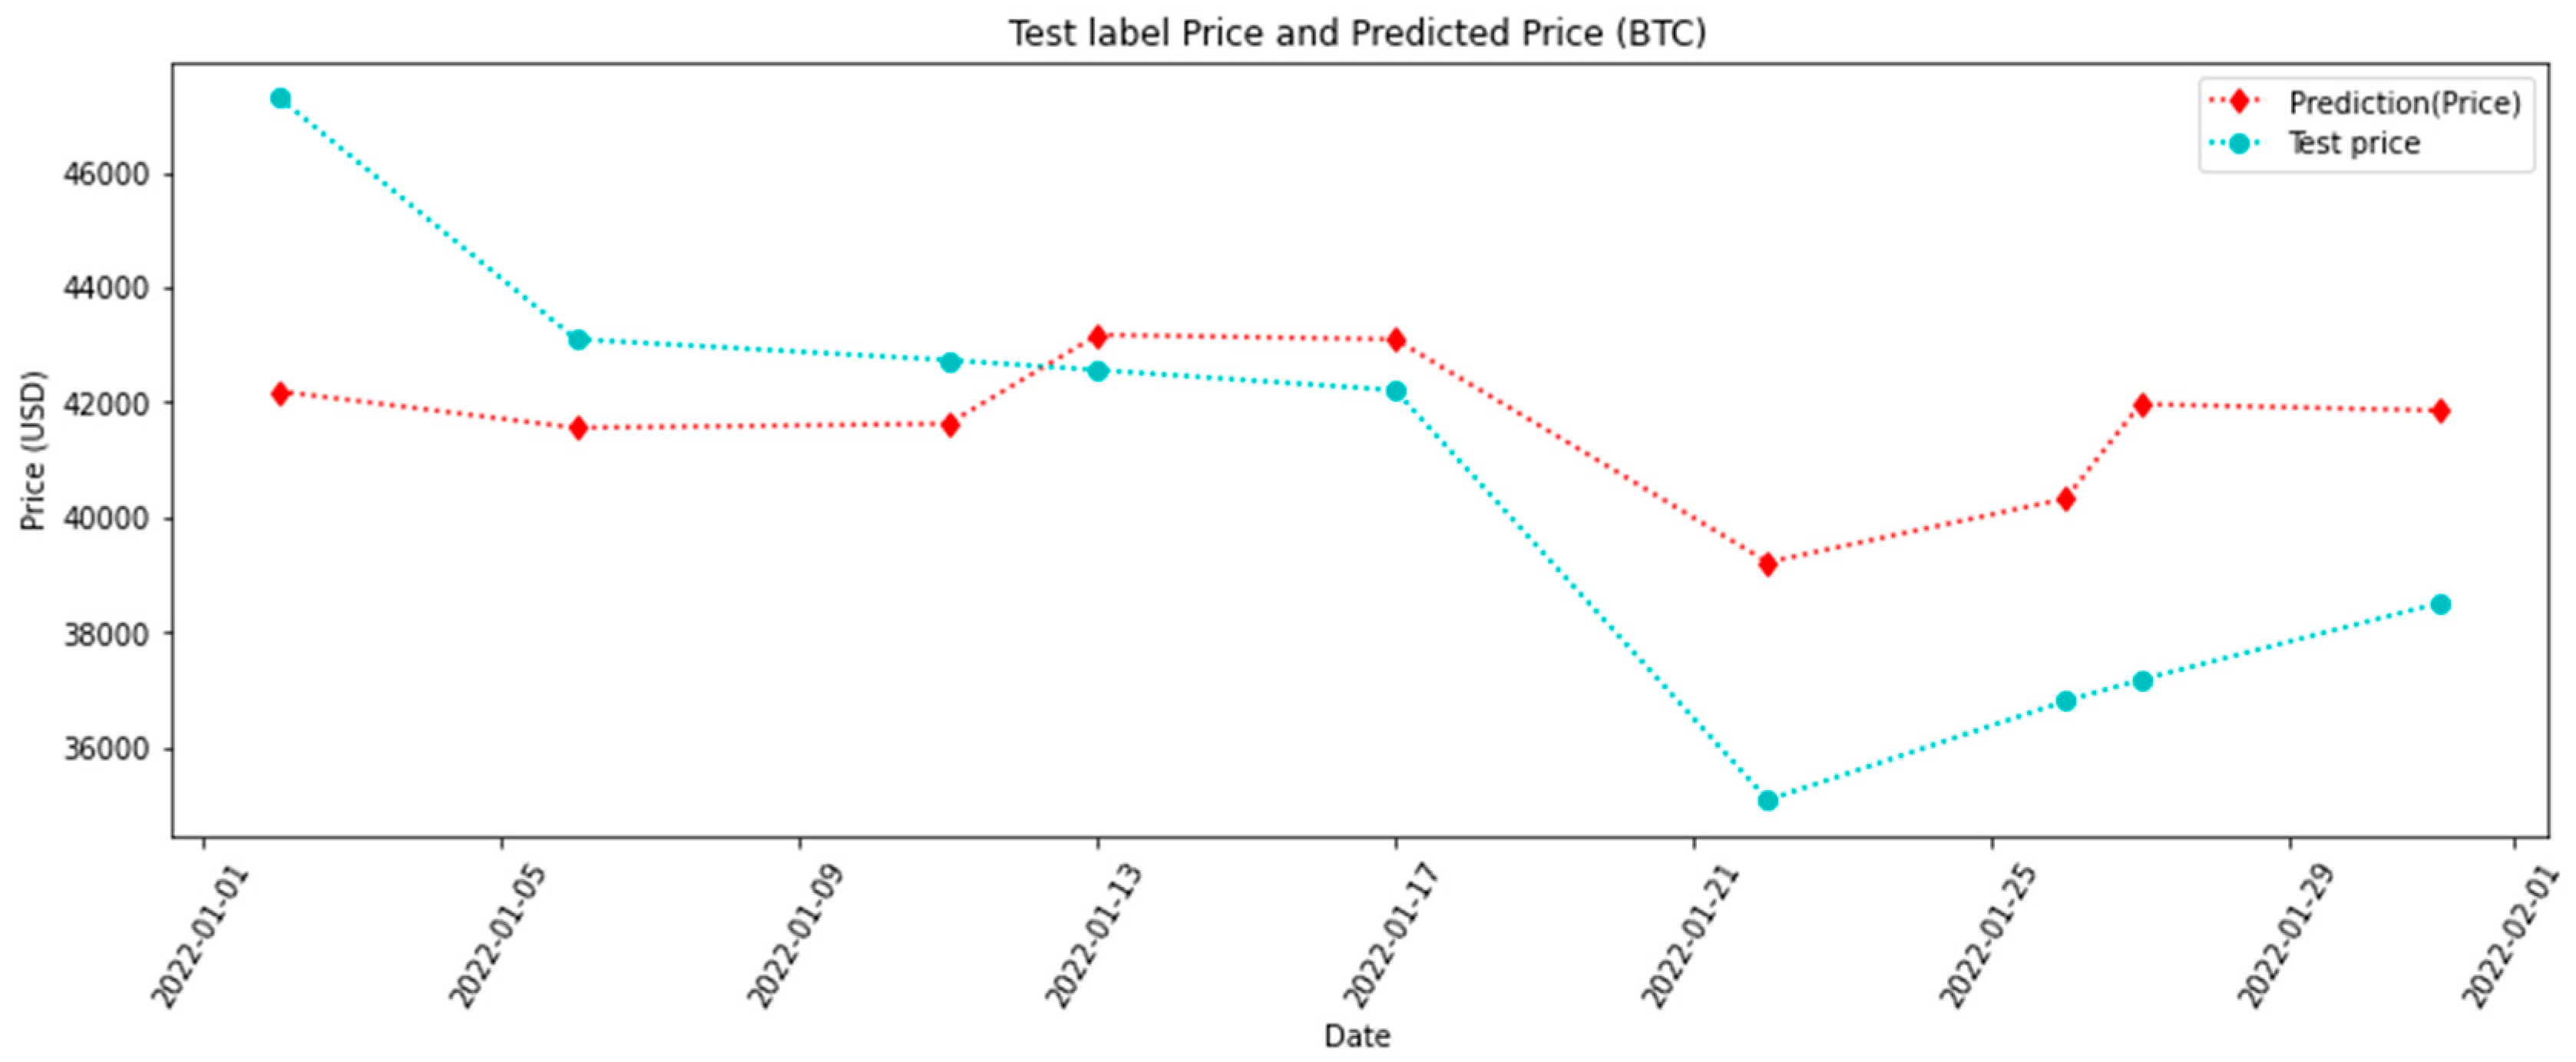
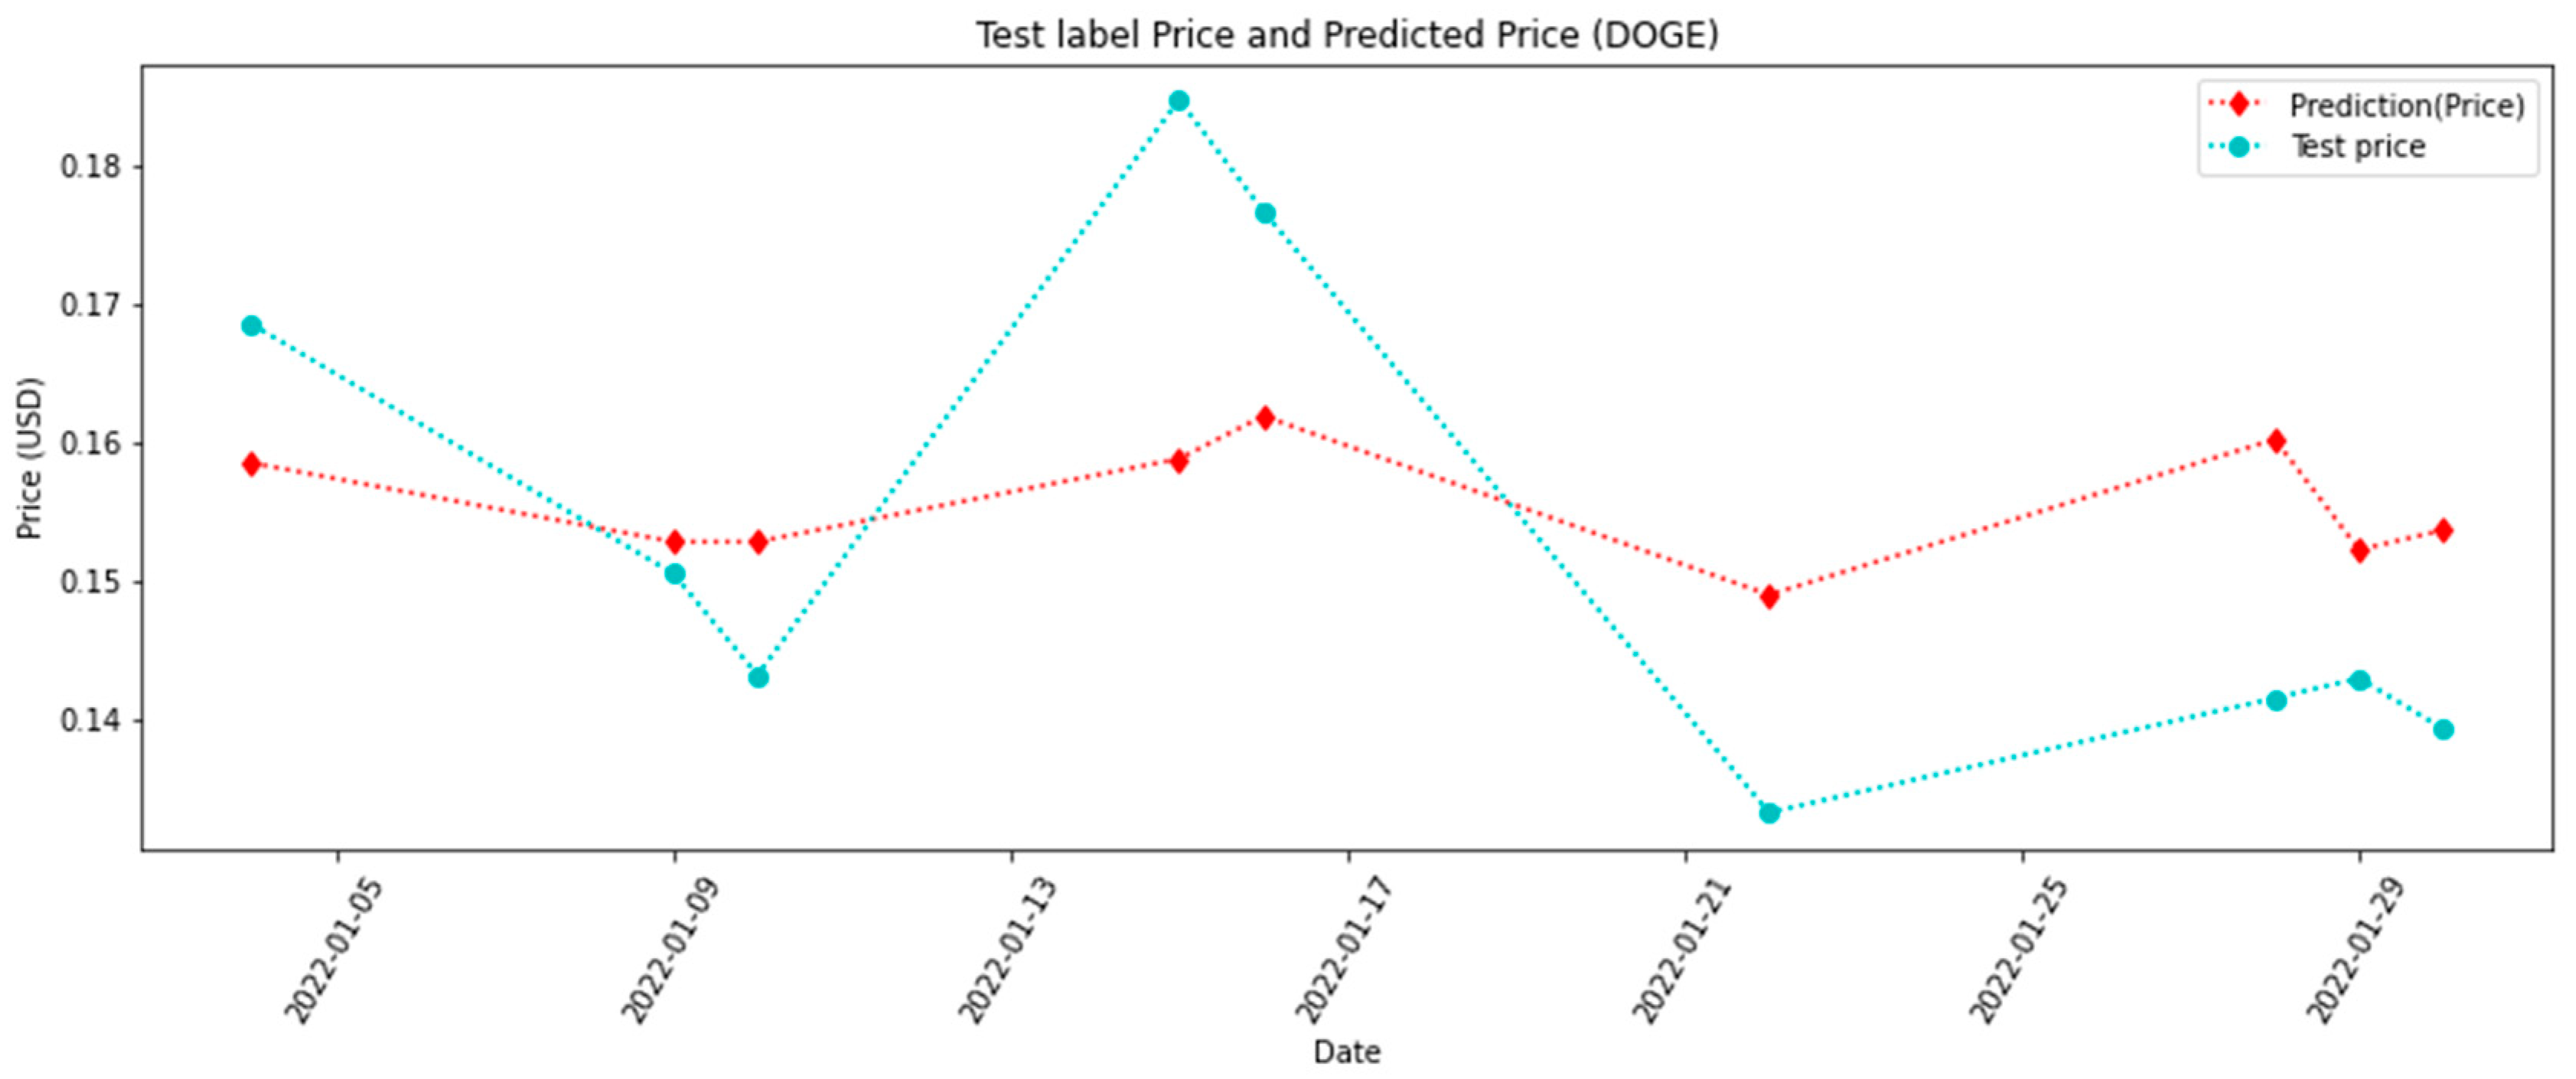
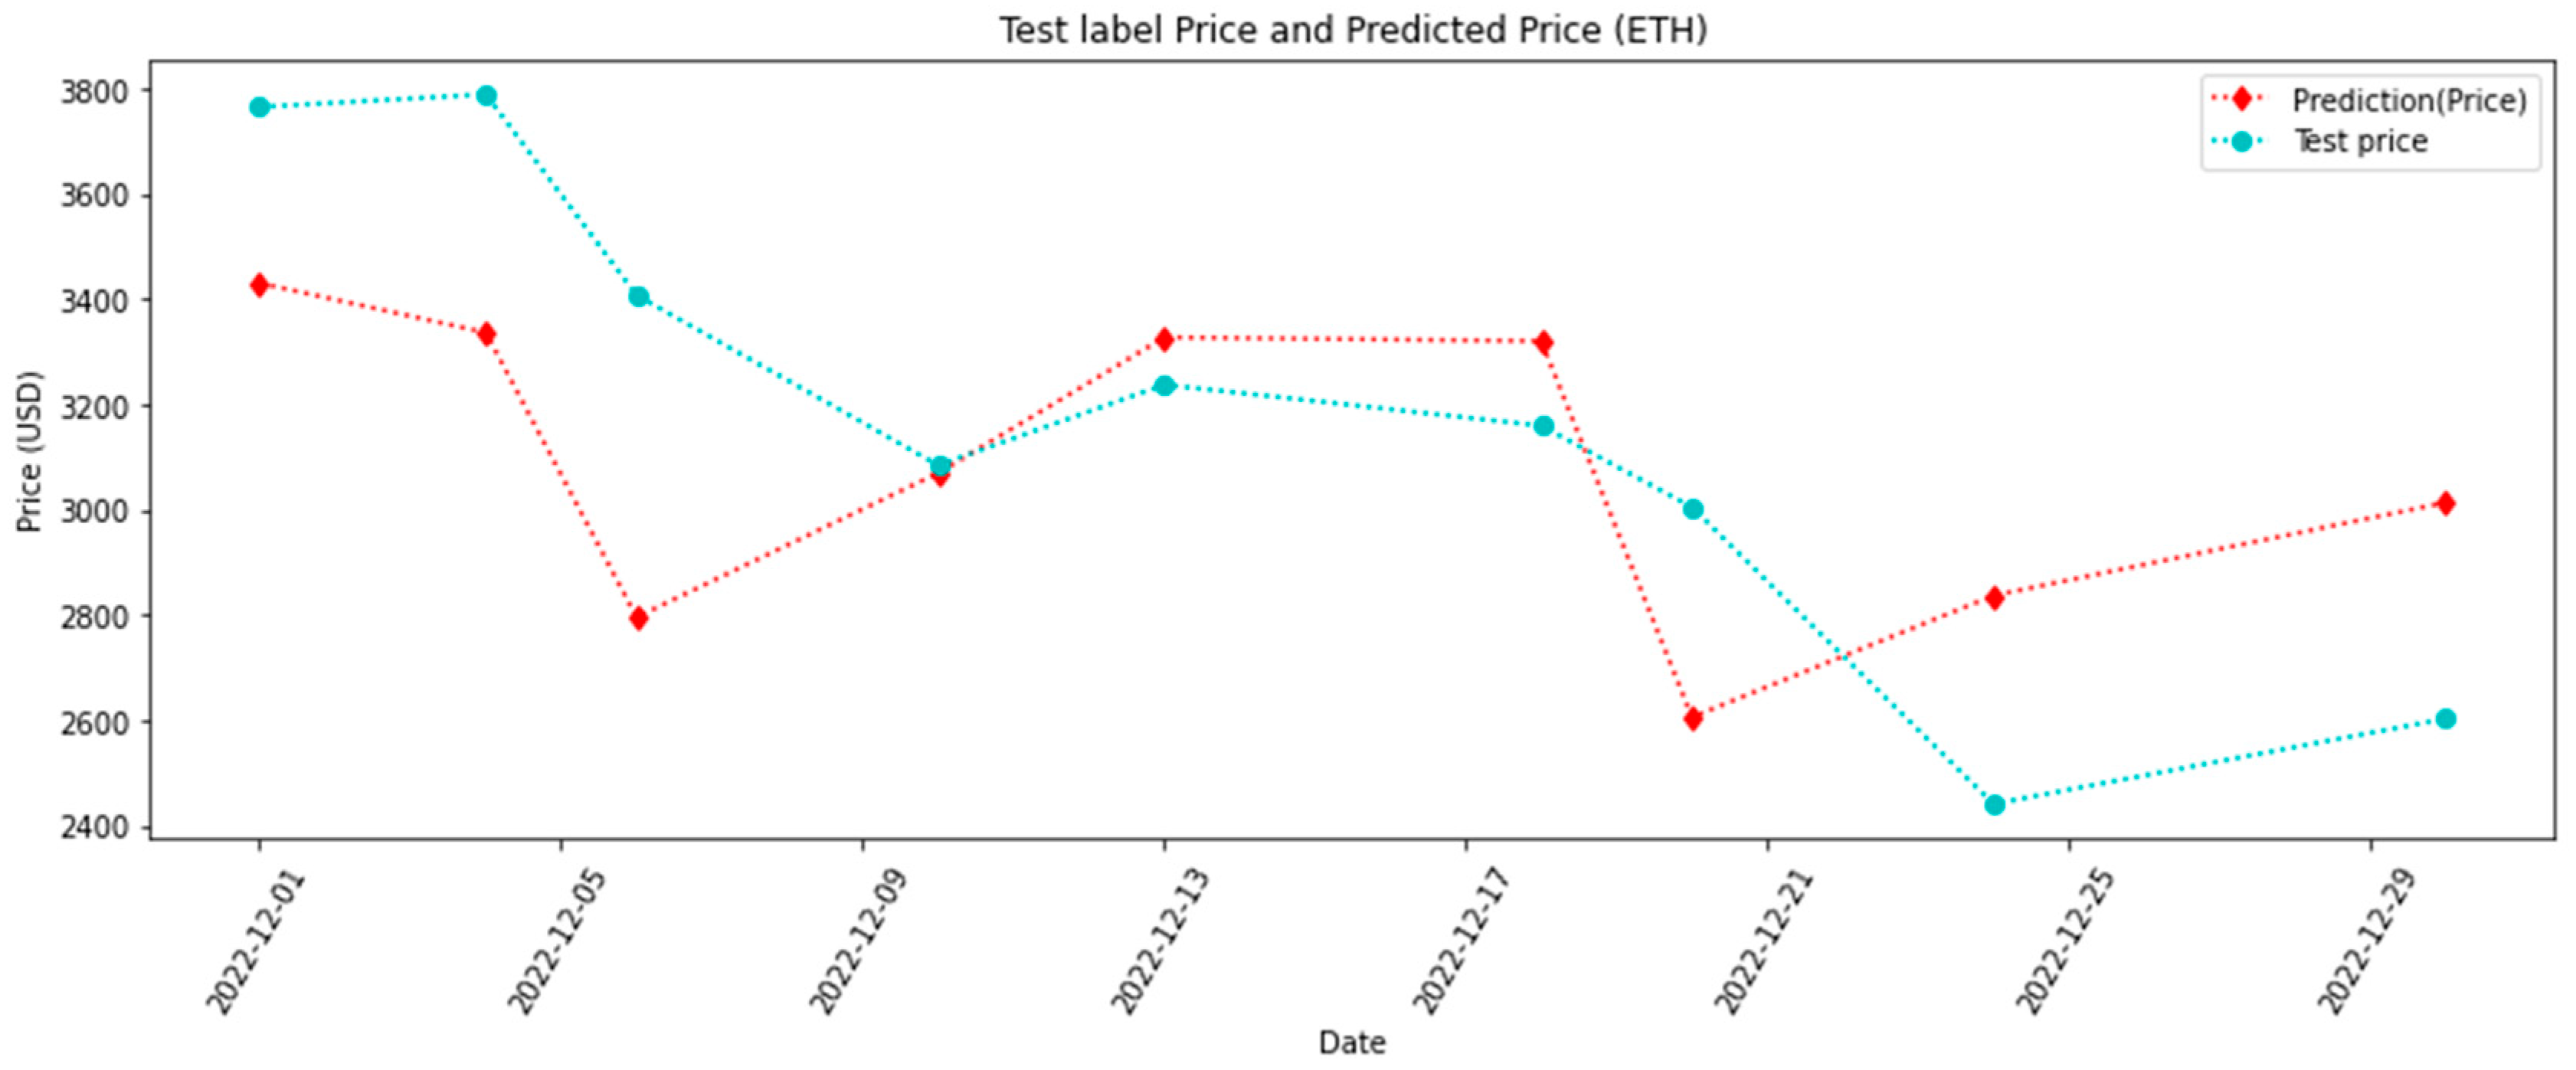
Figure 15,
Figure 16 and
Figure 17 have eight periods, with each edge between two points representing one period. These figures clearly demonstrate the comparison between the predicted trend and the testing trend.
Table 7 lists the total signal and the successful signal for the same one-month period. The approach has an accuracy of 62.5% in predicting the trends of the selected cryptocurrencies. The results depicted in the graphs and tables indicate that this approach is stable and has the capability to predict the market trends of cryptocurrencies, thus generating trading signals.

 ,
, 


