
Enhancing the Yield Potential of Soybean after Magneto-Priming: Detailed Study on Its Relation to Underlying Physiological Processes


Abstract
:1. Introduction
2. Material and Methods
2.1. Plant Material
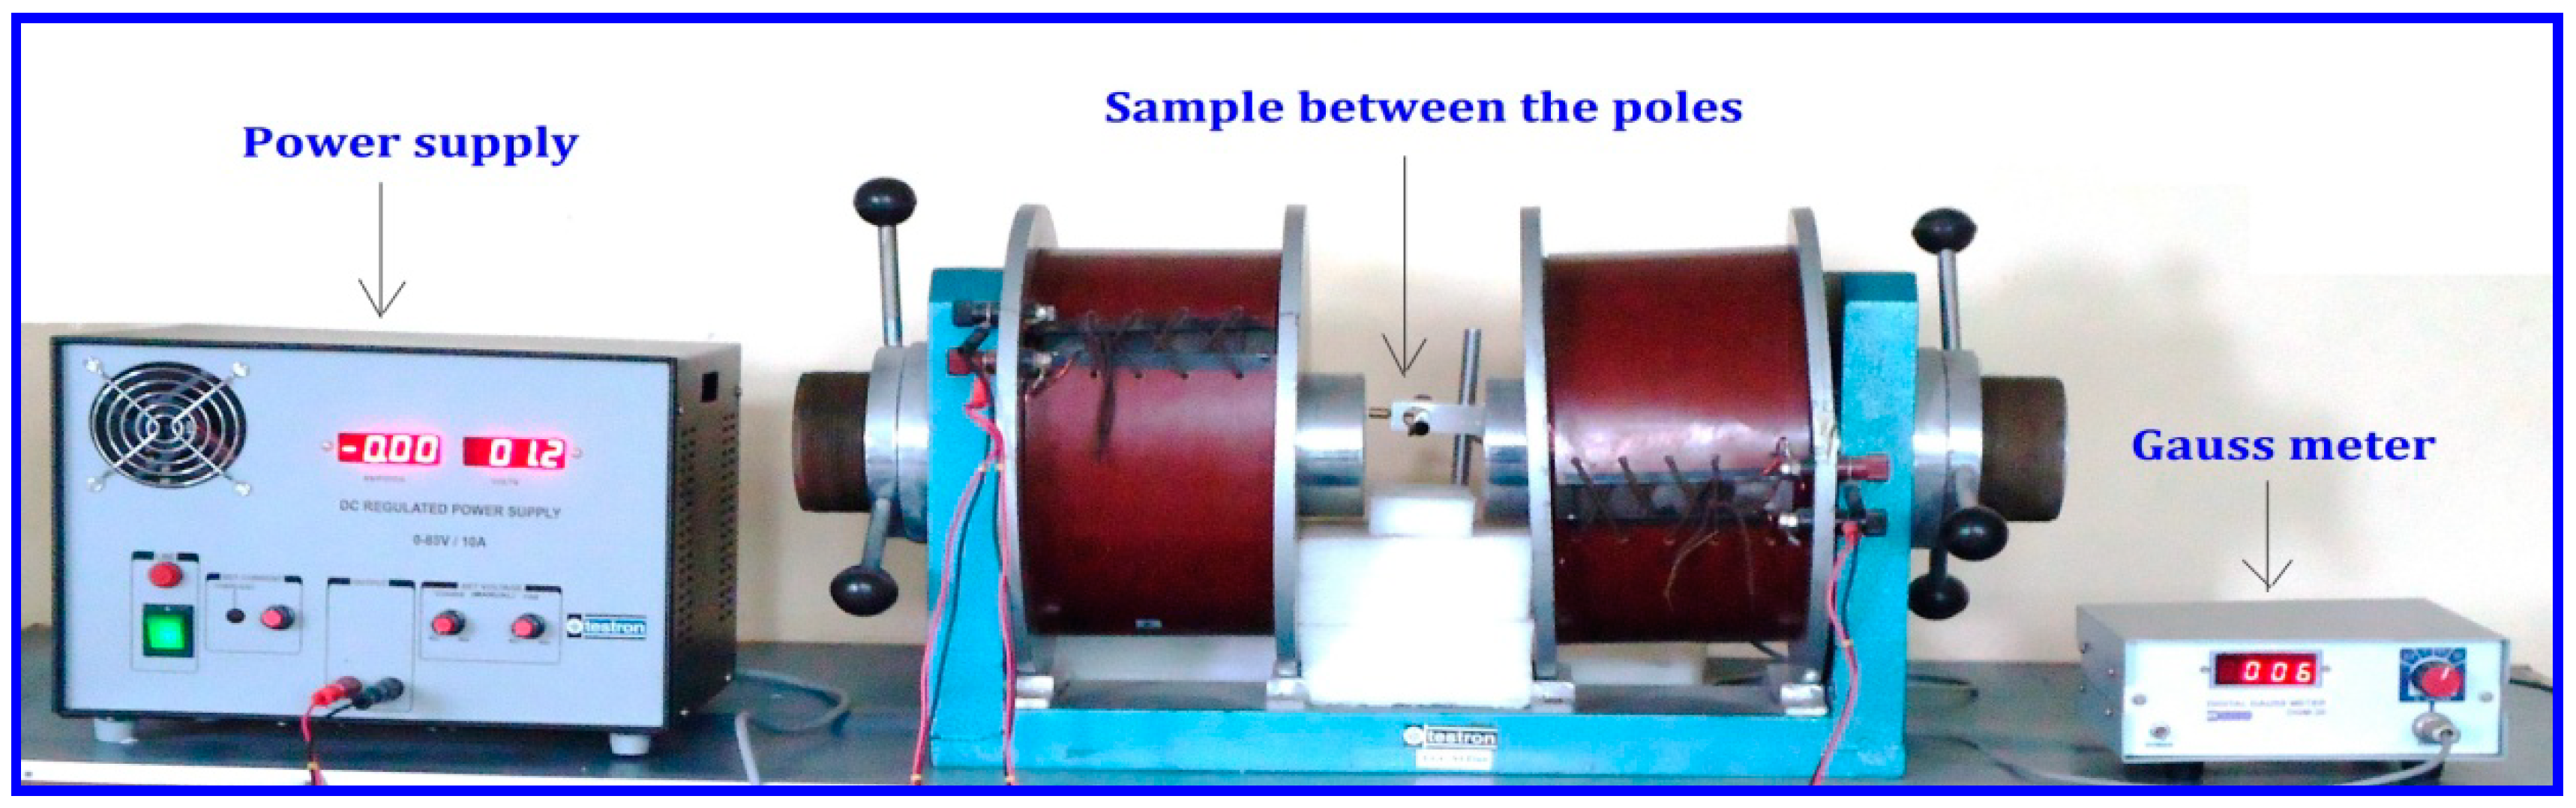
2.2. Magnetic Field Treatment
2.3. Data Collection and Analysis
2.4. Growth Analysis: Above Ground Parts
2.5. Growth Analysis: Below Ground Parts
2.6. Crop Yield and Yield Attributes
2.7. Photosynthesis and Carbon Fixation Parameters
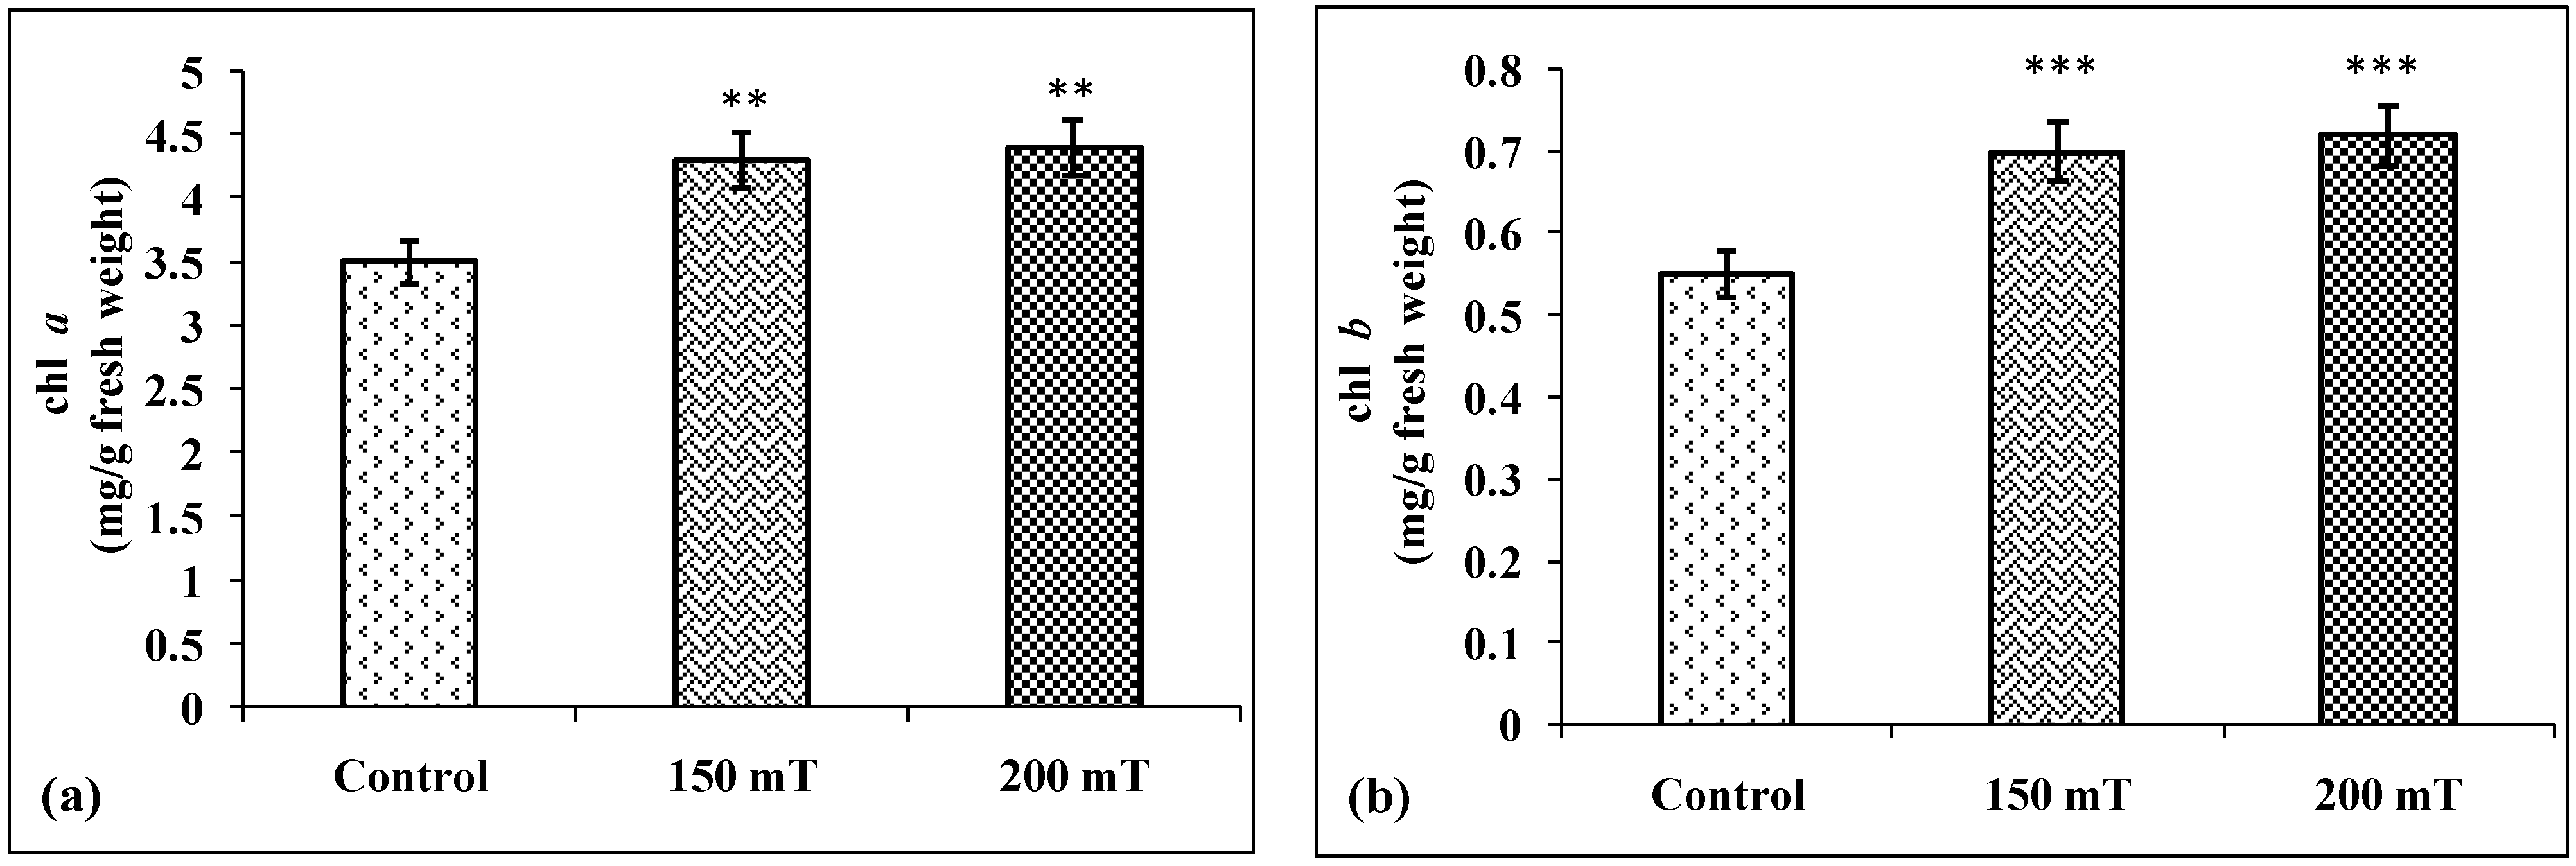
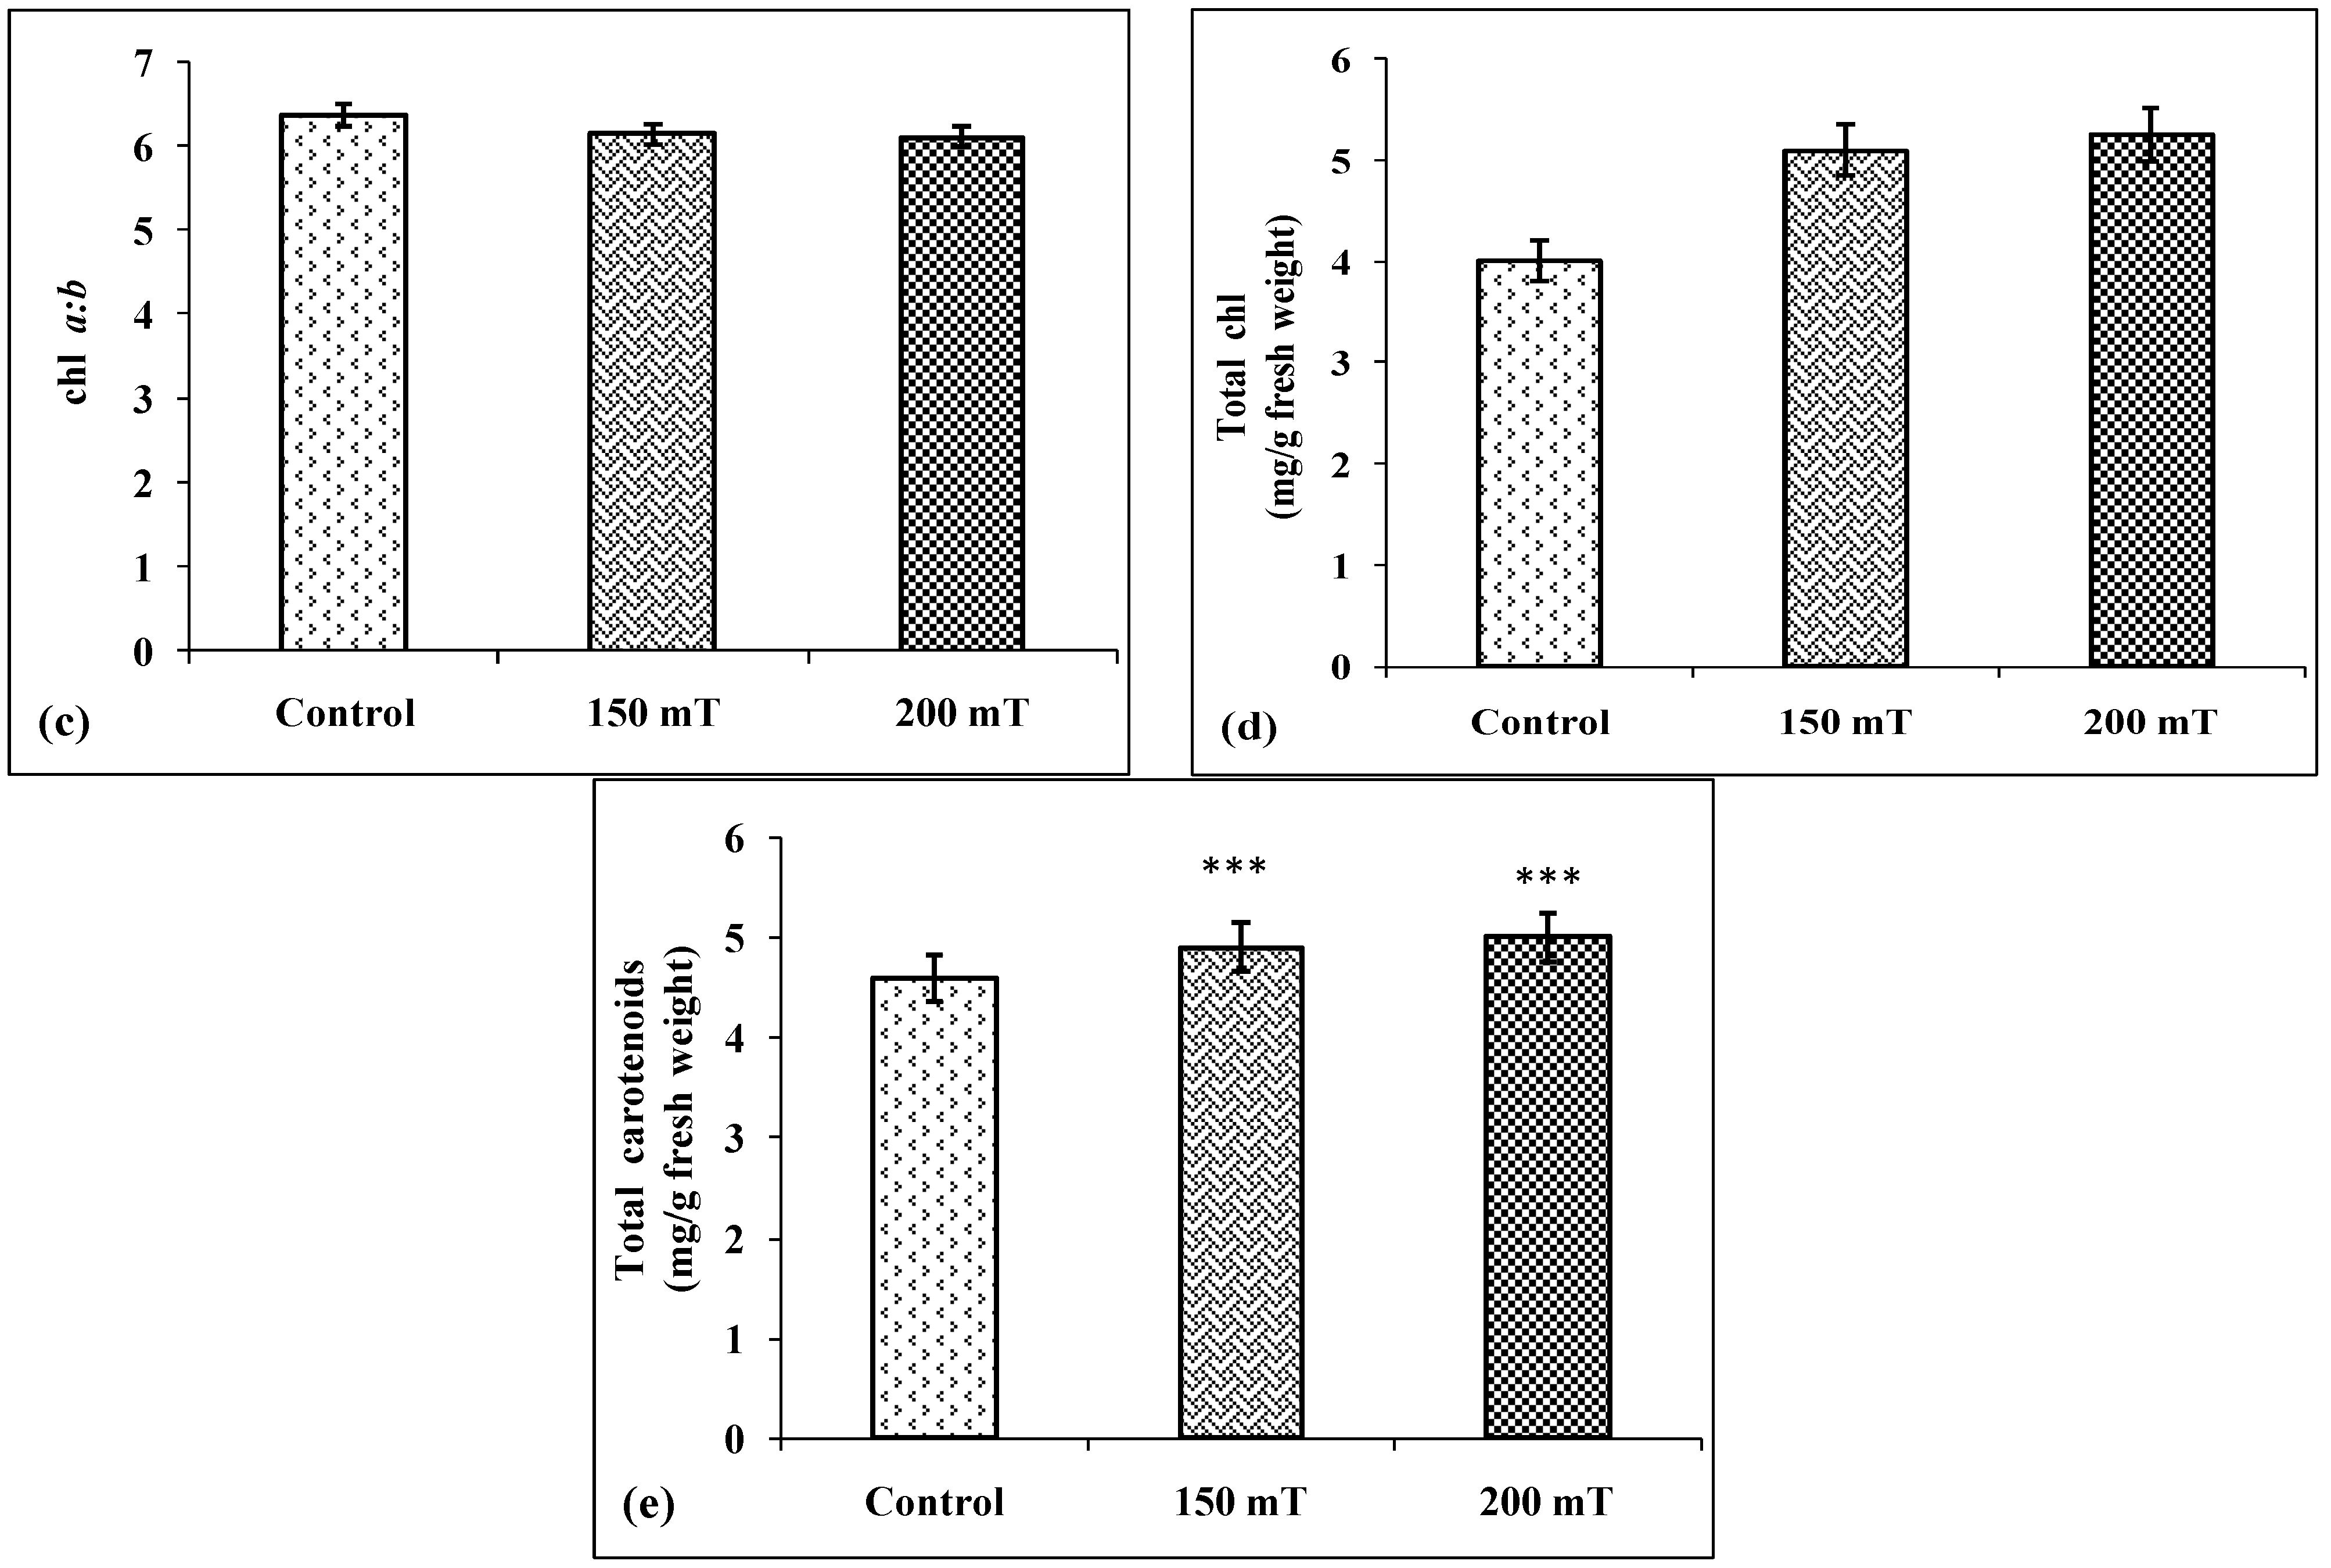
- Photosynthetic pigments
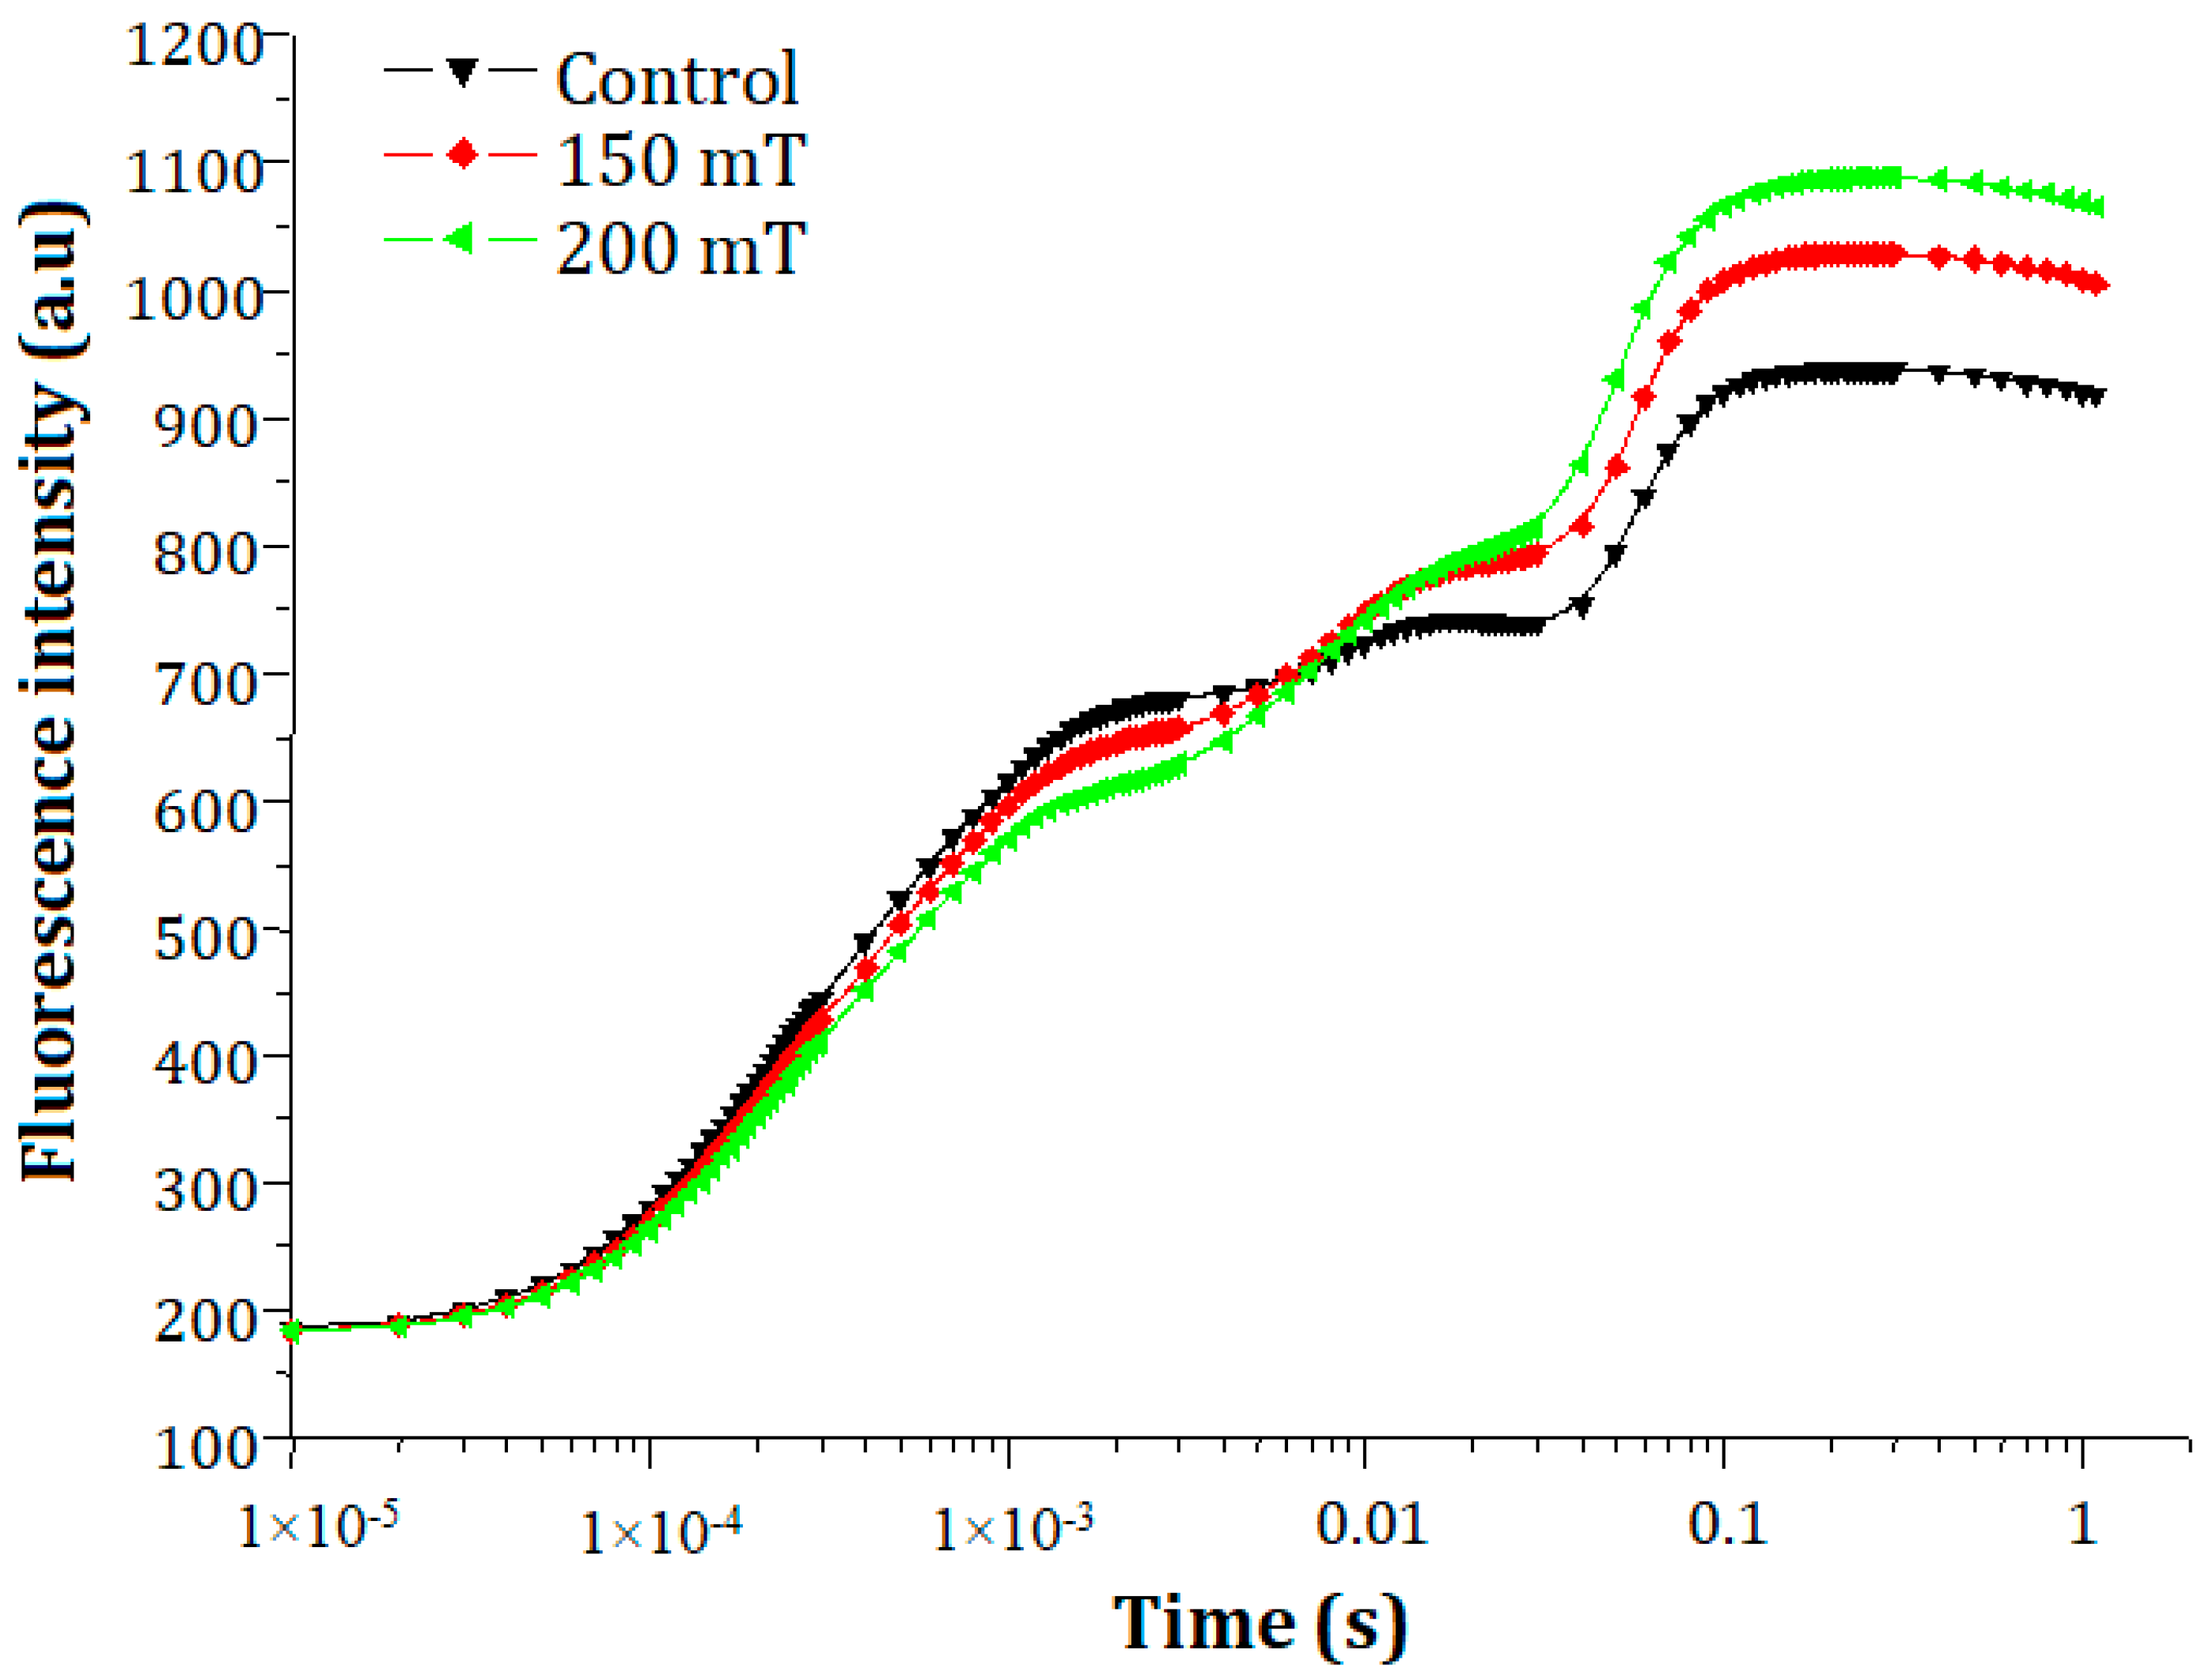
- Fluorescence measurements
- Carbonic anhydrase (E.C. 4.2.1.1)
- Gas exchange parameters
2.8. Extraction and Estimation of the Antioxidant Enzymes
- Guaiacol Peroxidase (EC 1.11.1.7)
- Ascorbic acid peroxidase (EC 1.11.1.11)
- Superoxide Dismutase (EC 1.15.1.1)
- Catalase (EC1.11.1.6)
2.9. Estimation of L-Ascorbic Acid
2.10. Lipid Peroxidation (MDA)
2.11. Nitrogen Fixation Parameters after SMF Pre-Treatment
- Extraction and estimation of leghemoglobin (Lb) content
- Heme concentration
- Nitrate reductase (NR) activity (E.C. 1.6.6.1)
- Protein Analysis
- Total free amino acids
2.12. Statistical Analysis
3. Results
3.1. Growth and Biomass
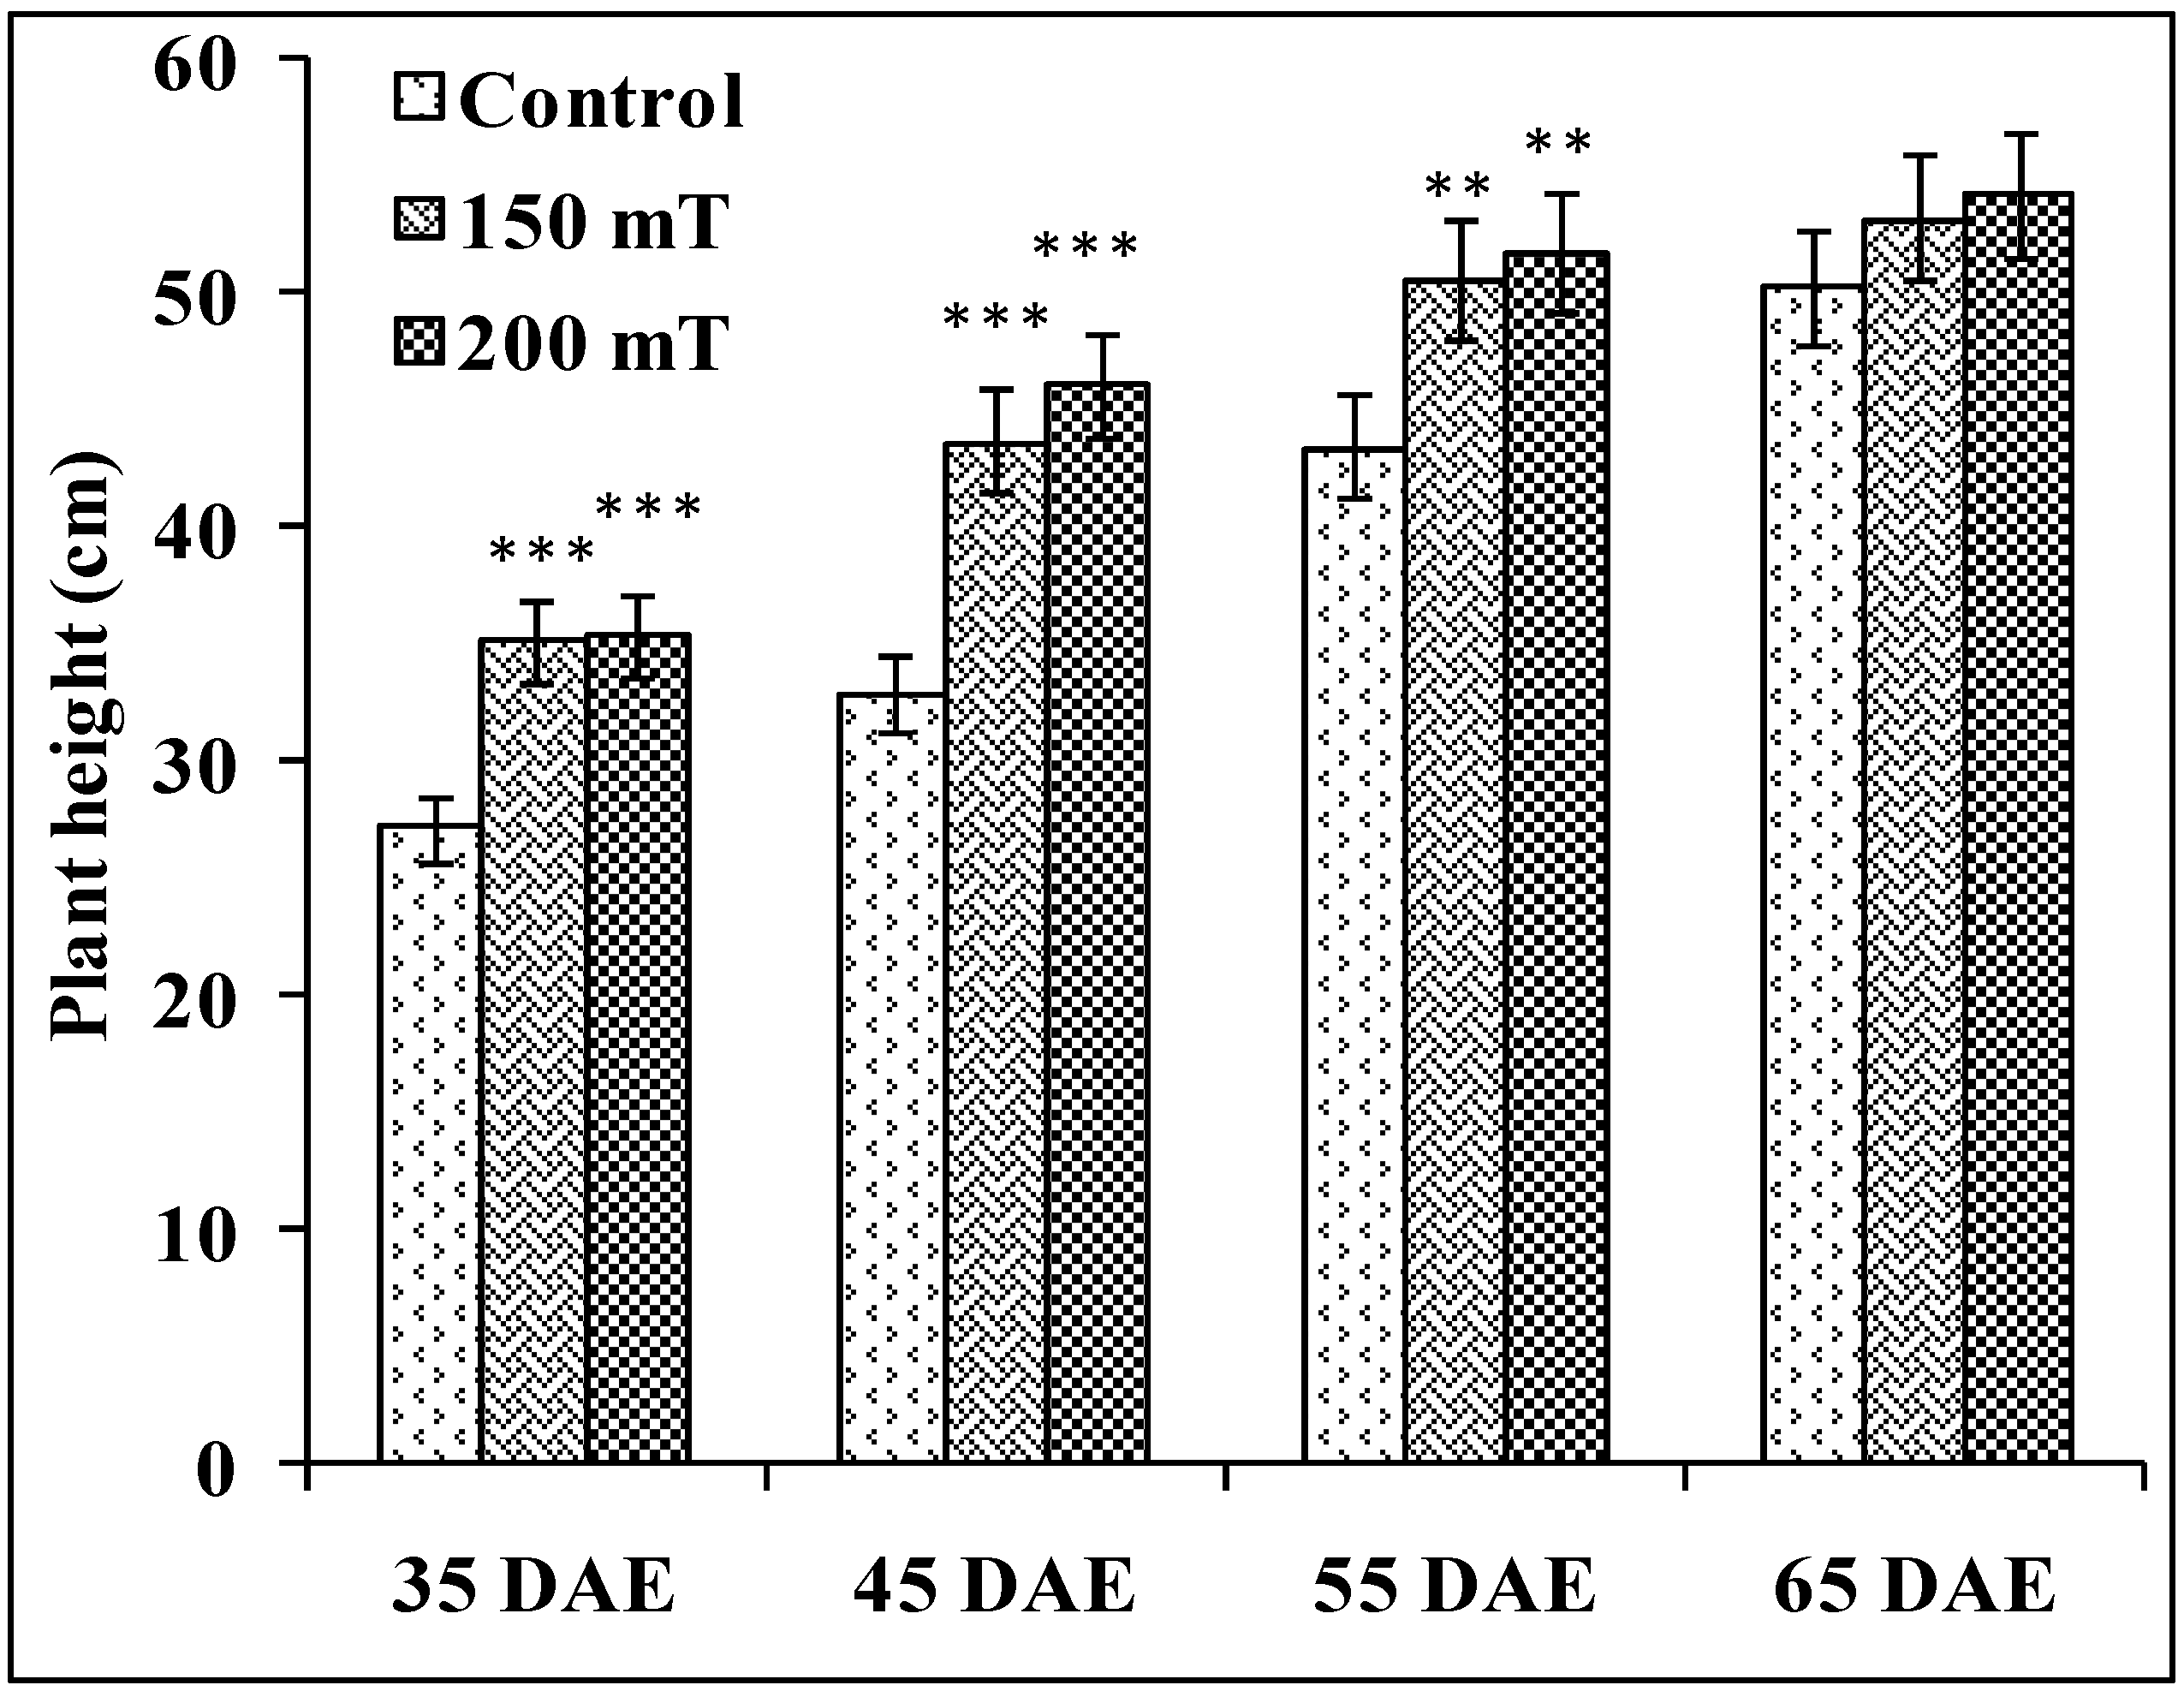
3.1.1. Plant Height
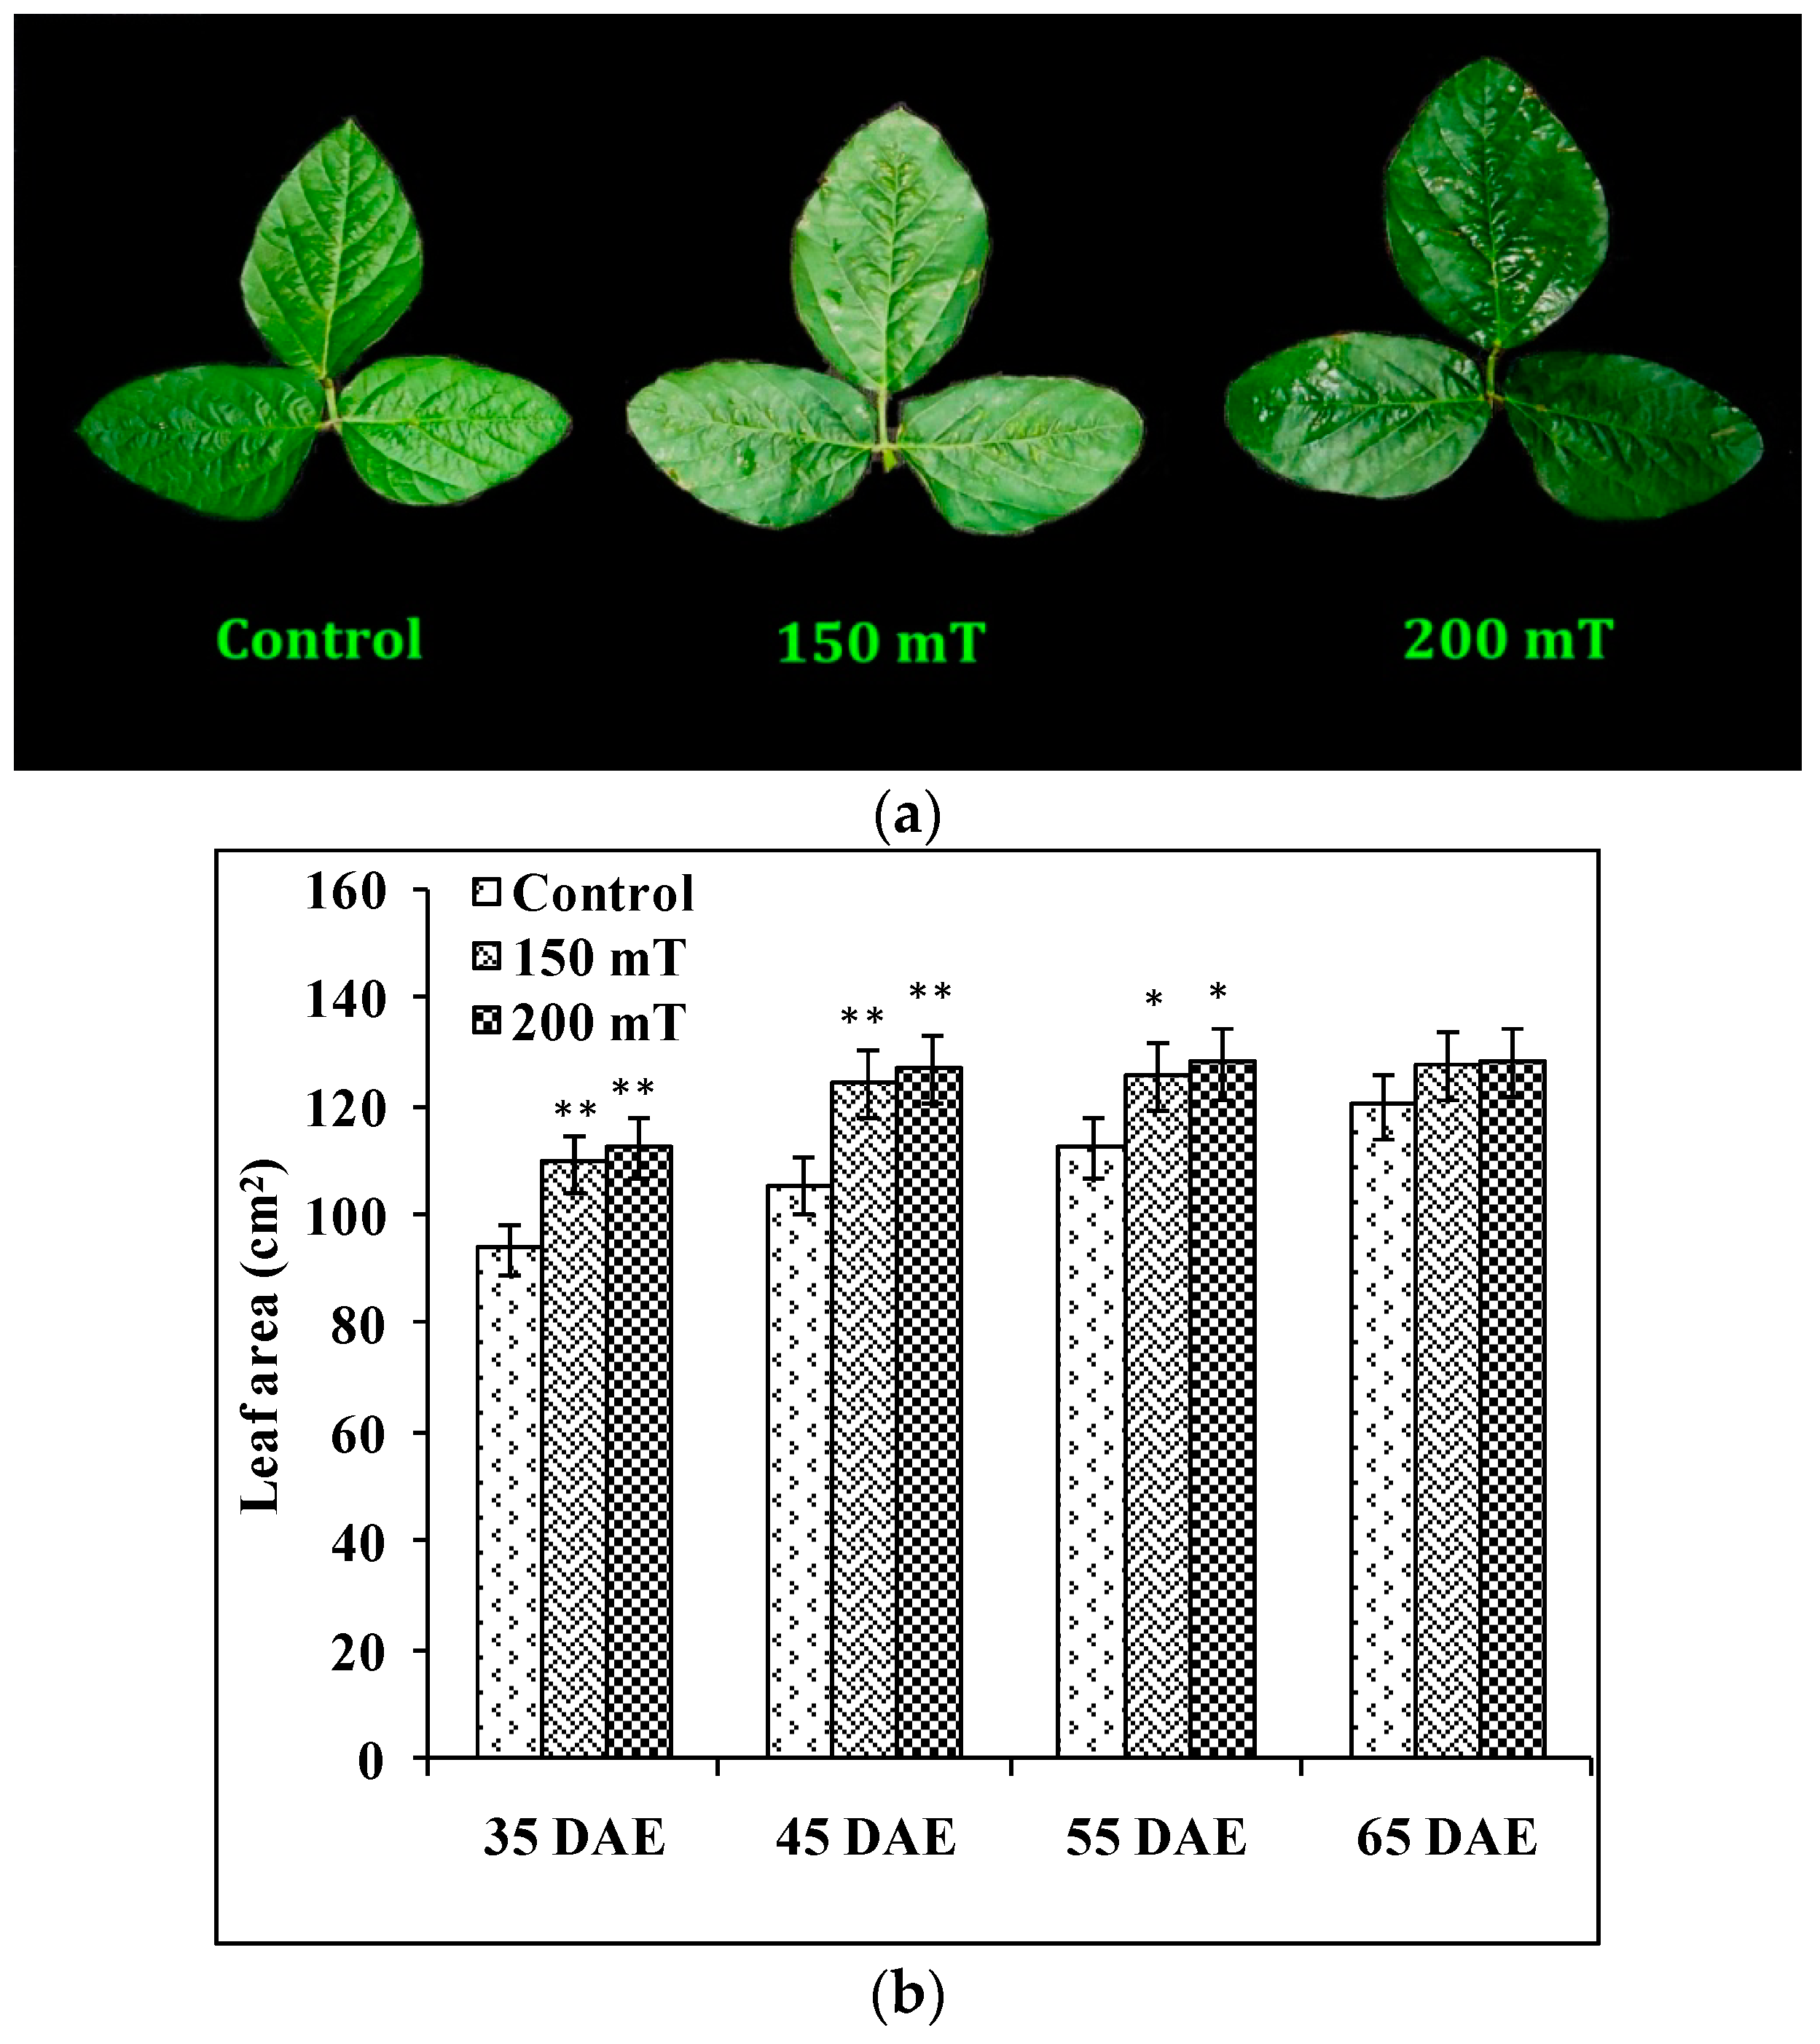
3.1.2. Leaf Area
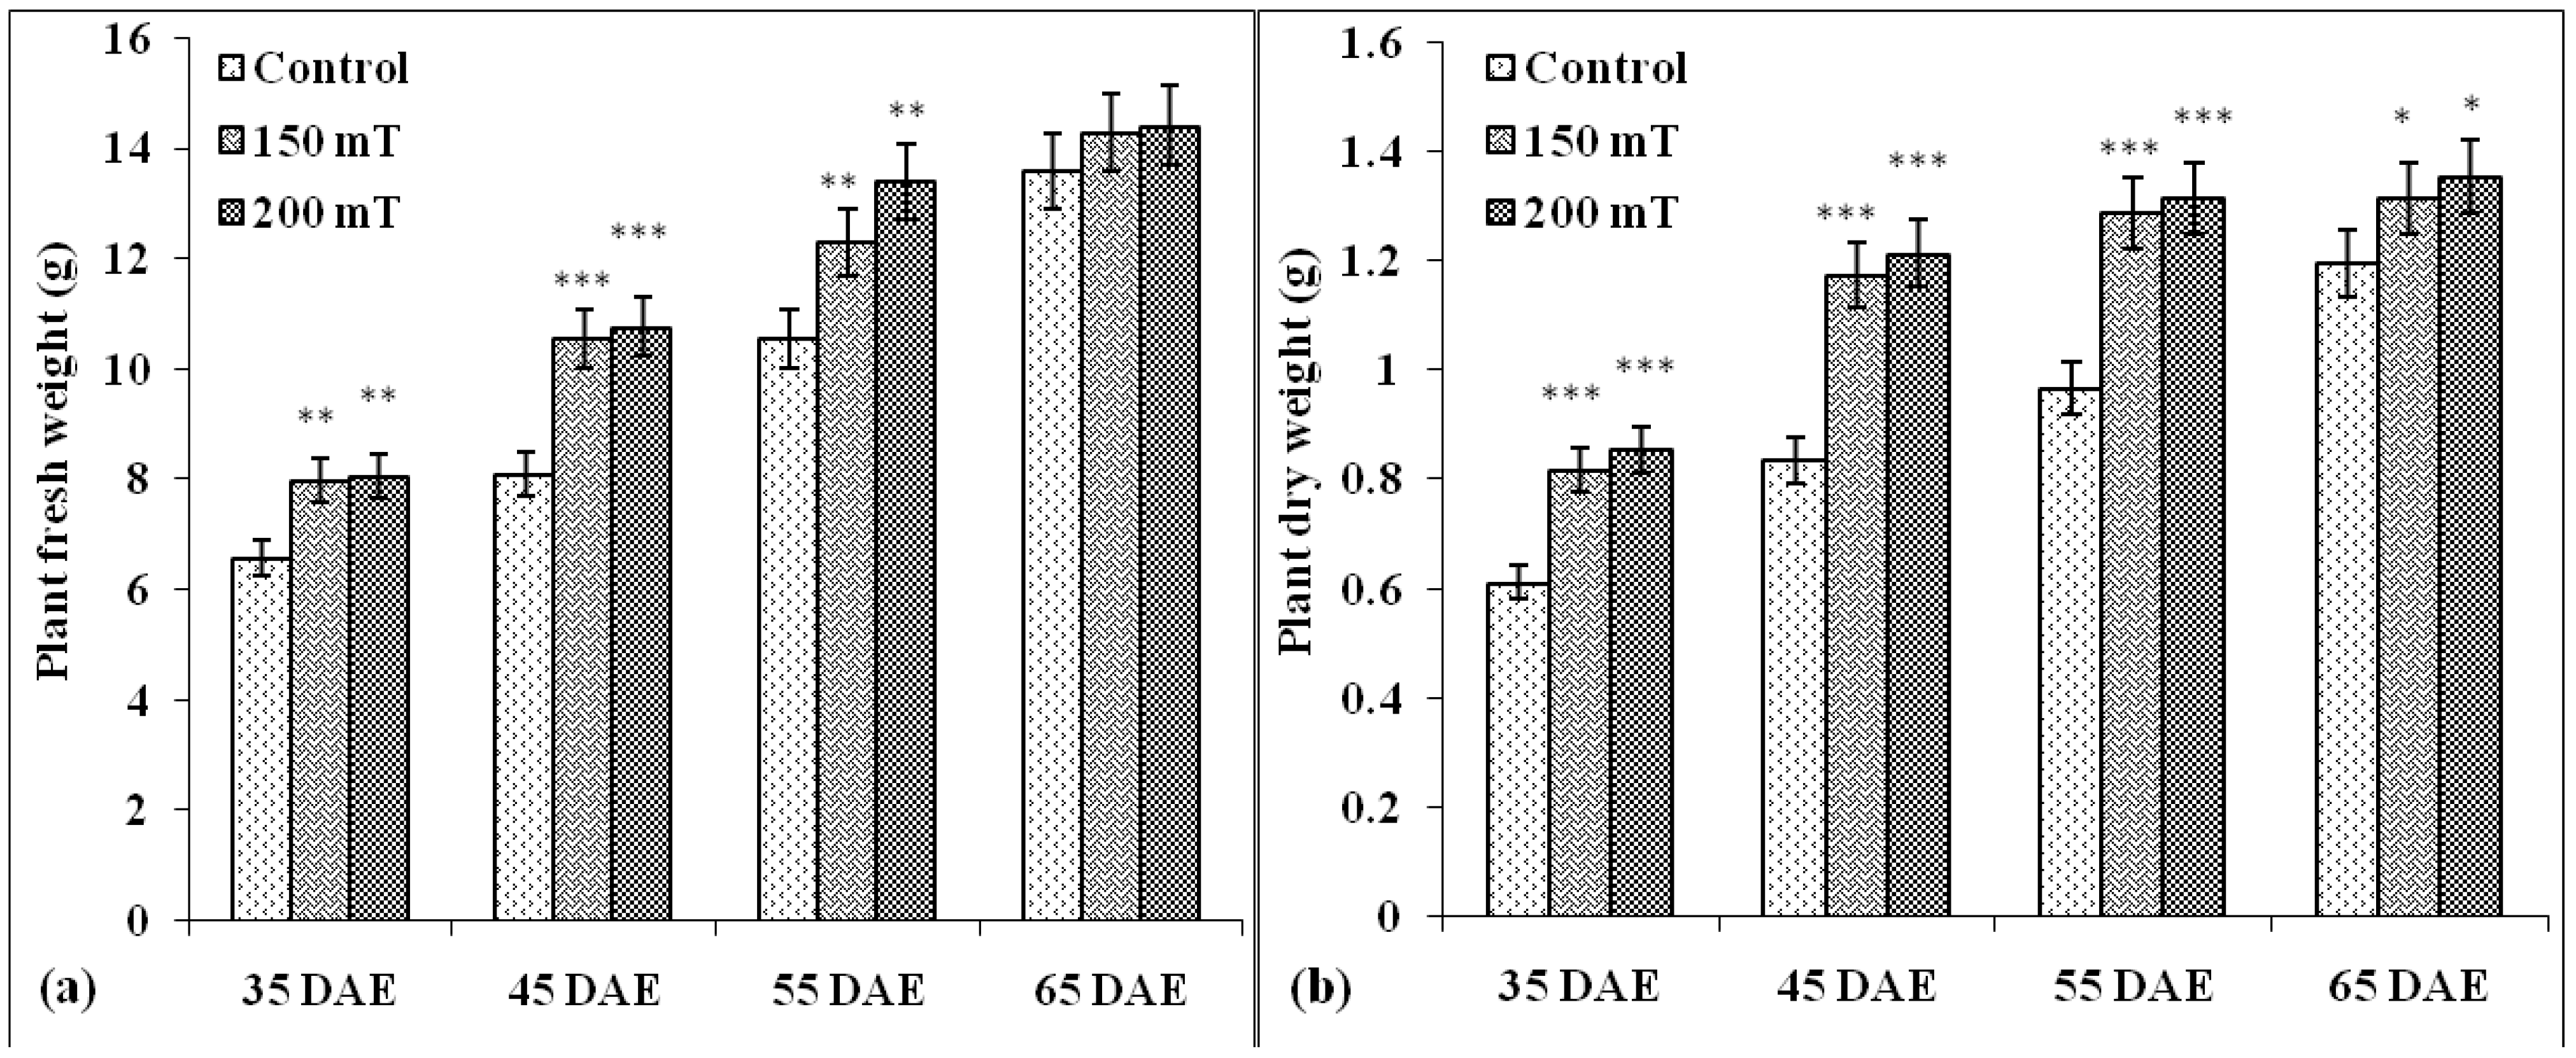
3.1.3. Plant Fresh Weight and Dry Weight
3.2. Photosynthesis and Carbon Fixation Parameters
3.2.1. Chlorophyll Content
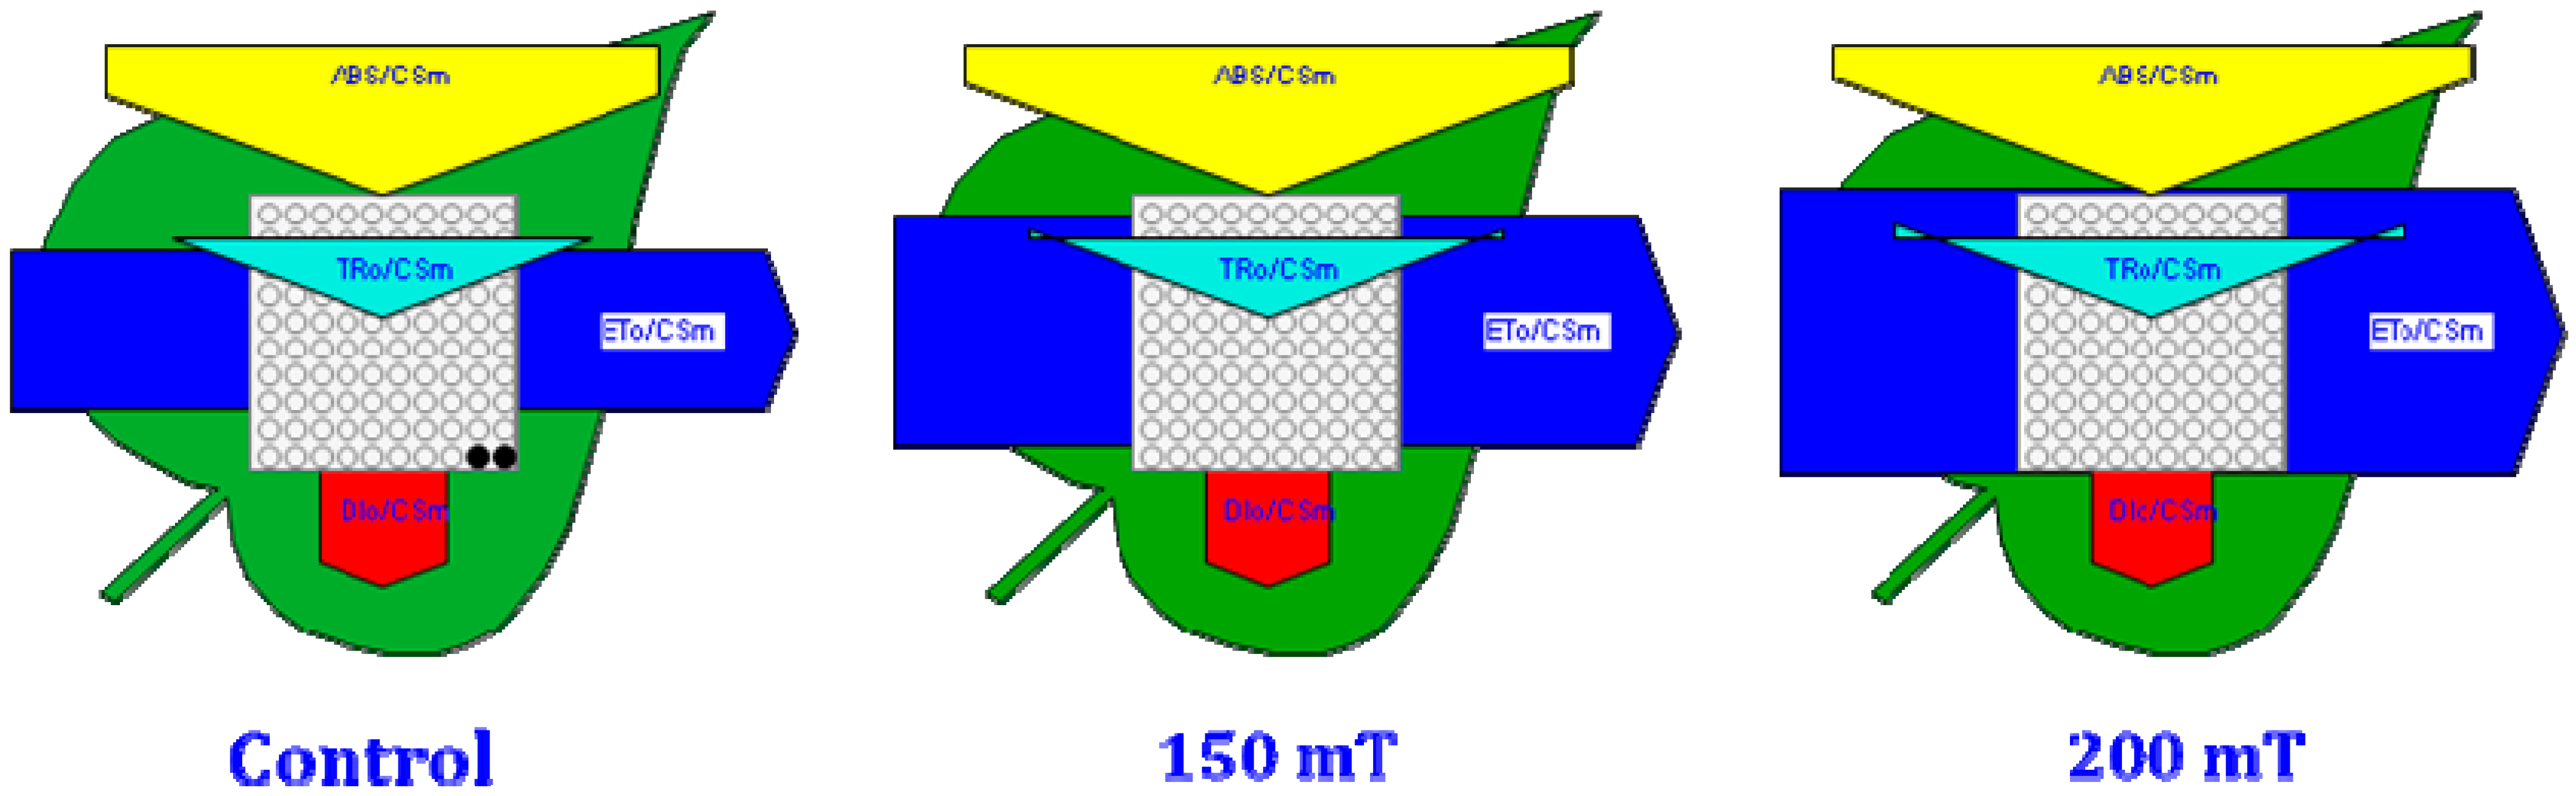
3.2.2. Chlorophyll a Fluorescence
3.2.3. Carbonic Anhydrase
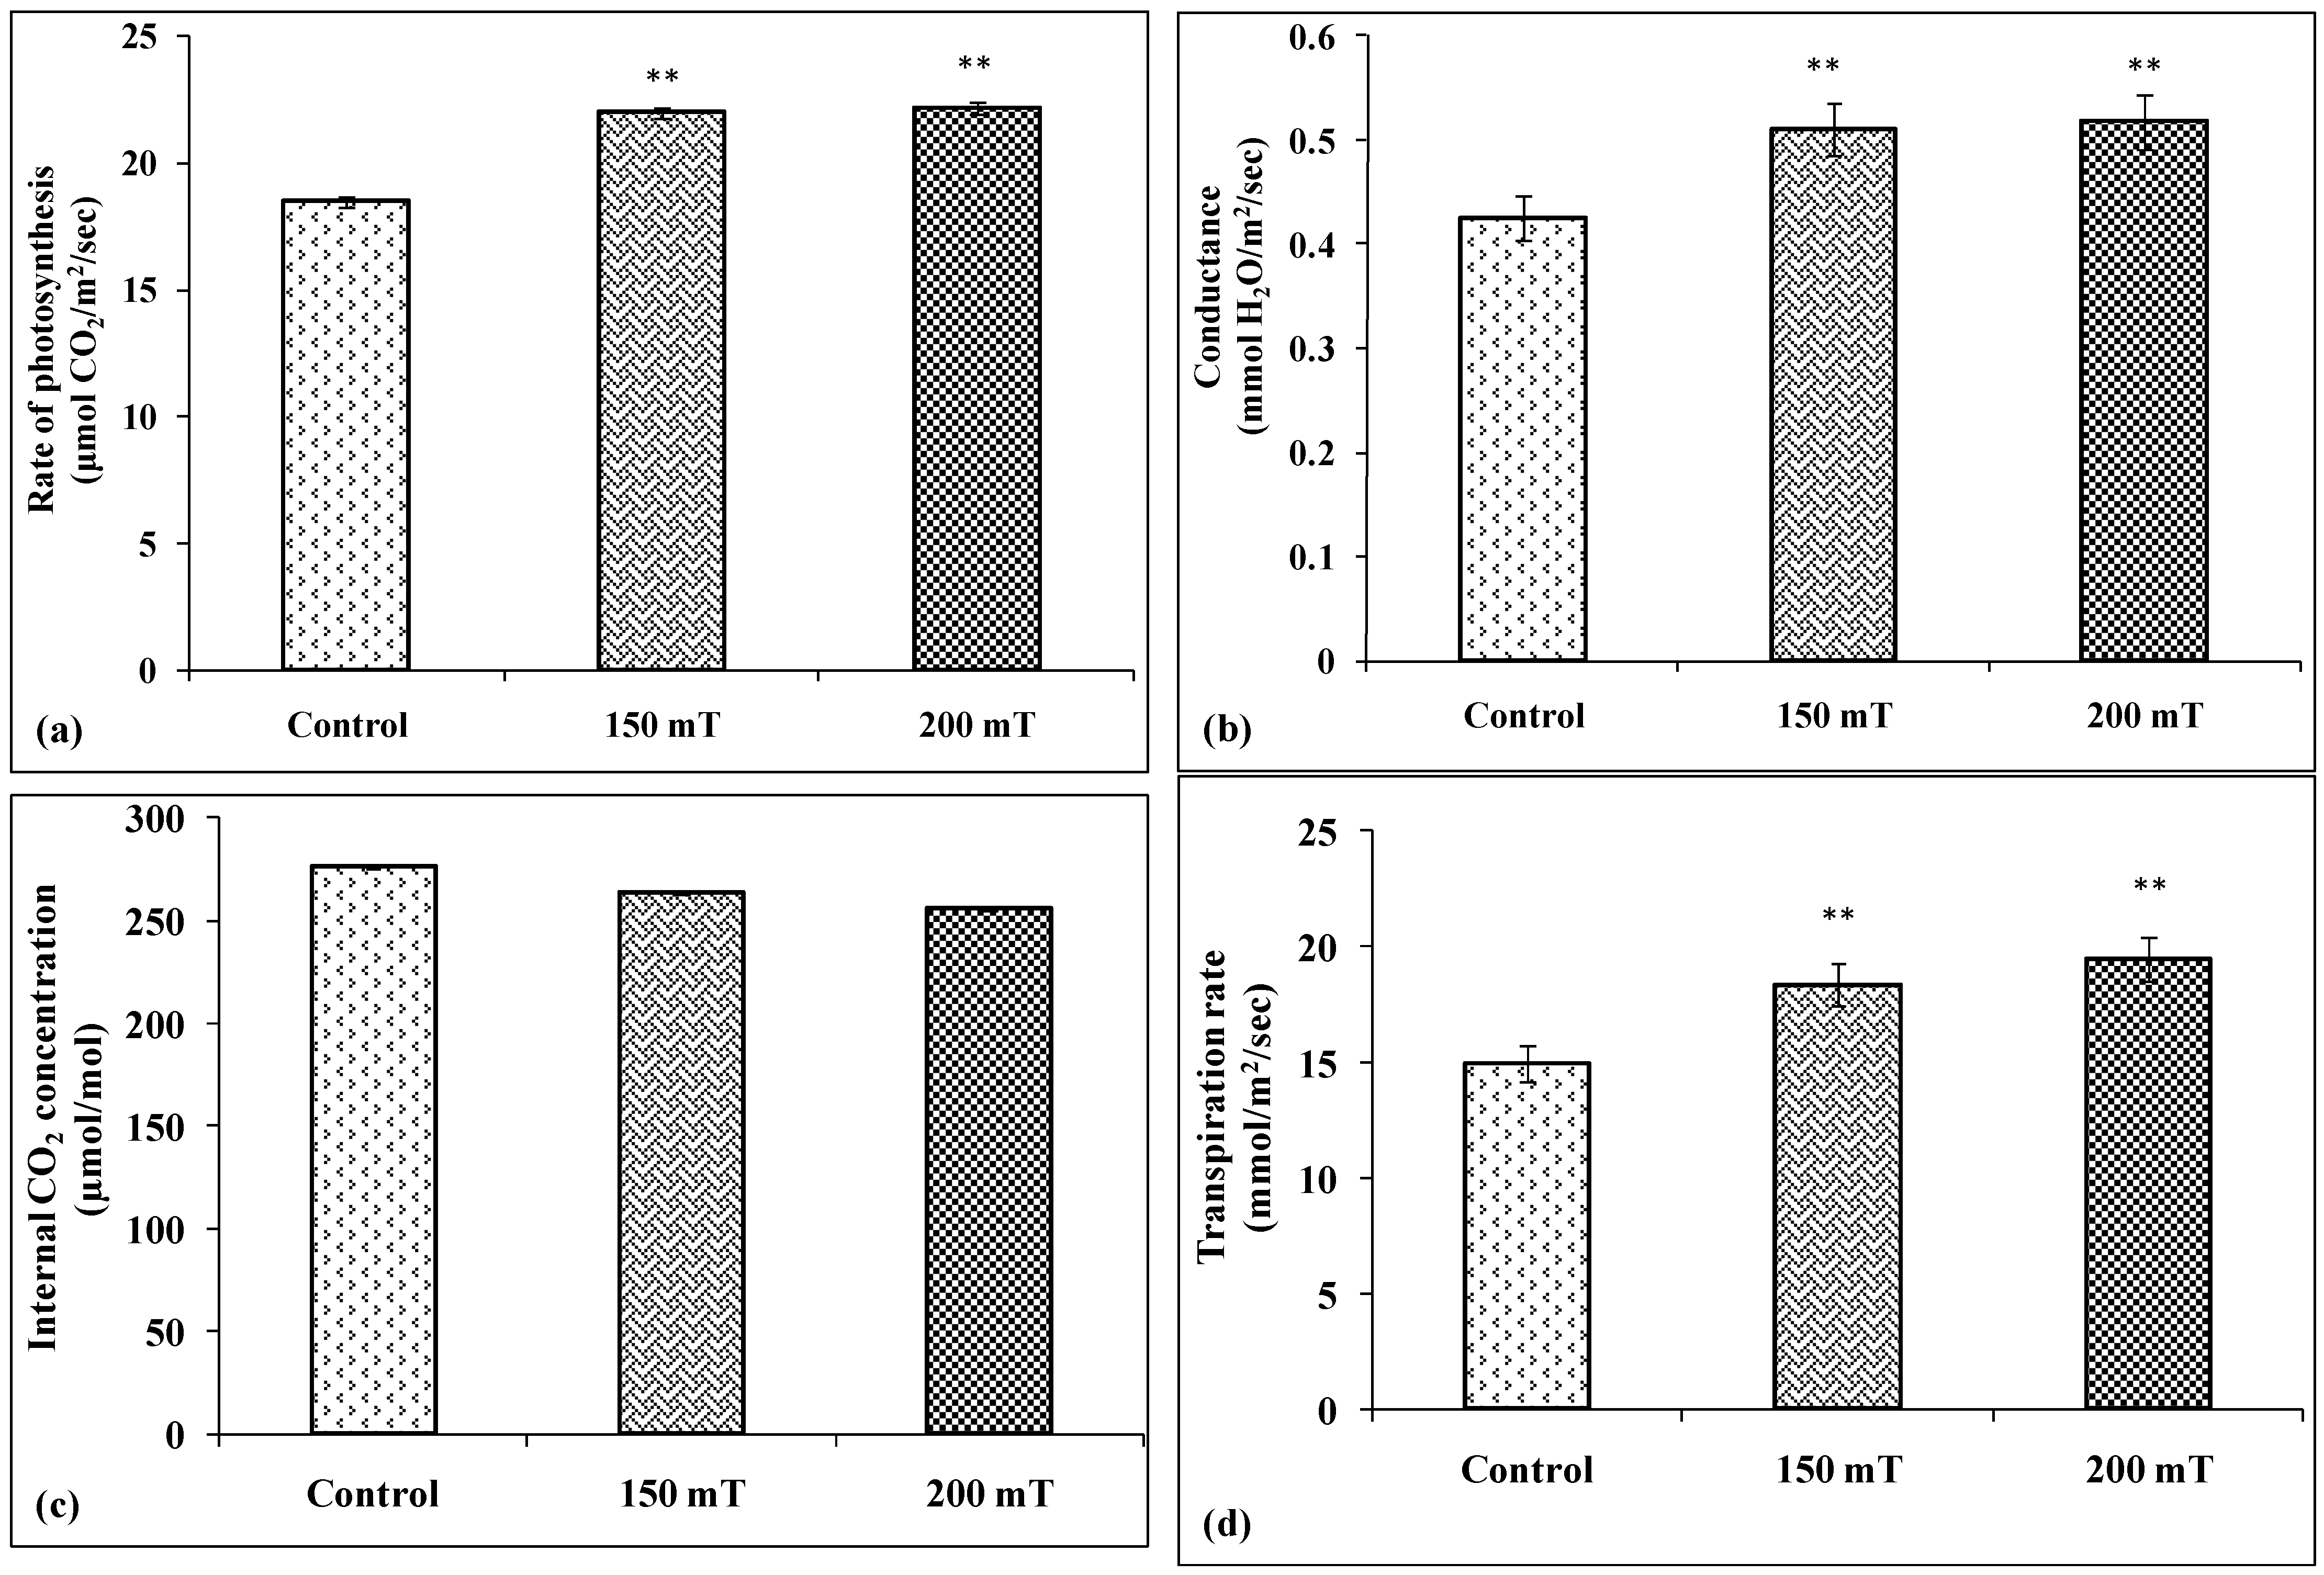
3.2.4. CO2 Fixation
3.3. Antioxidant Defence System
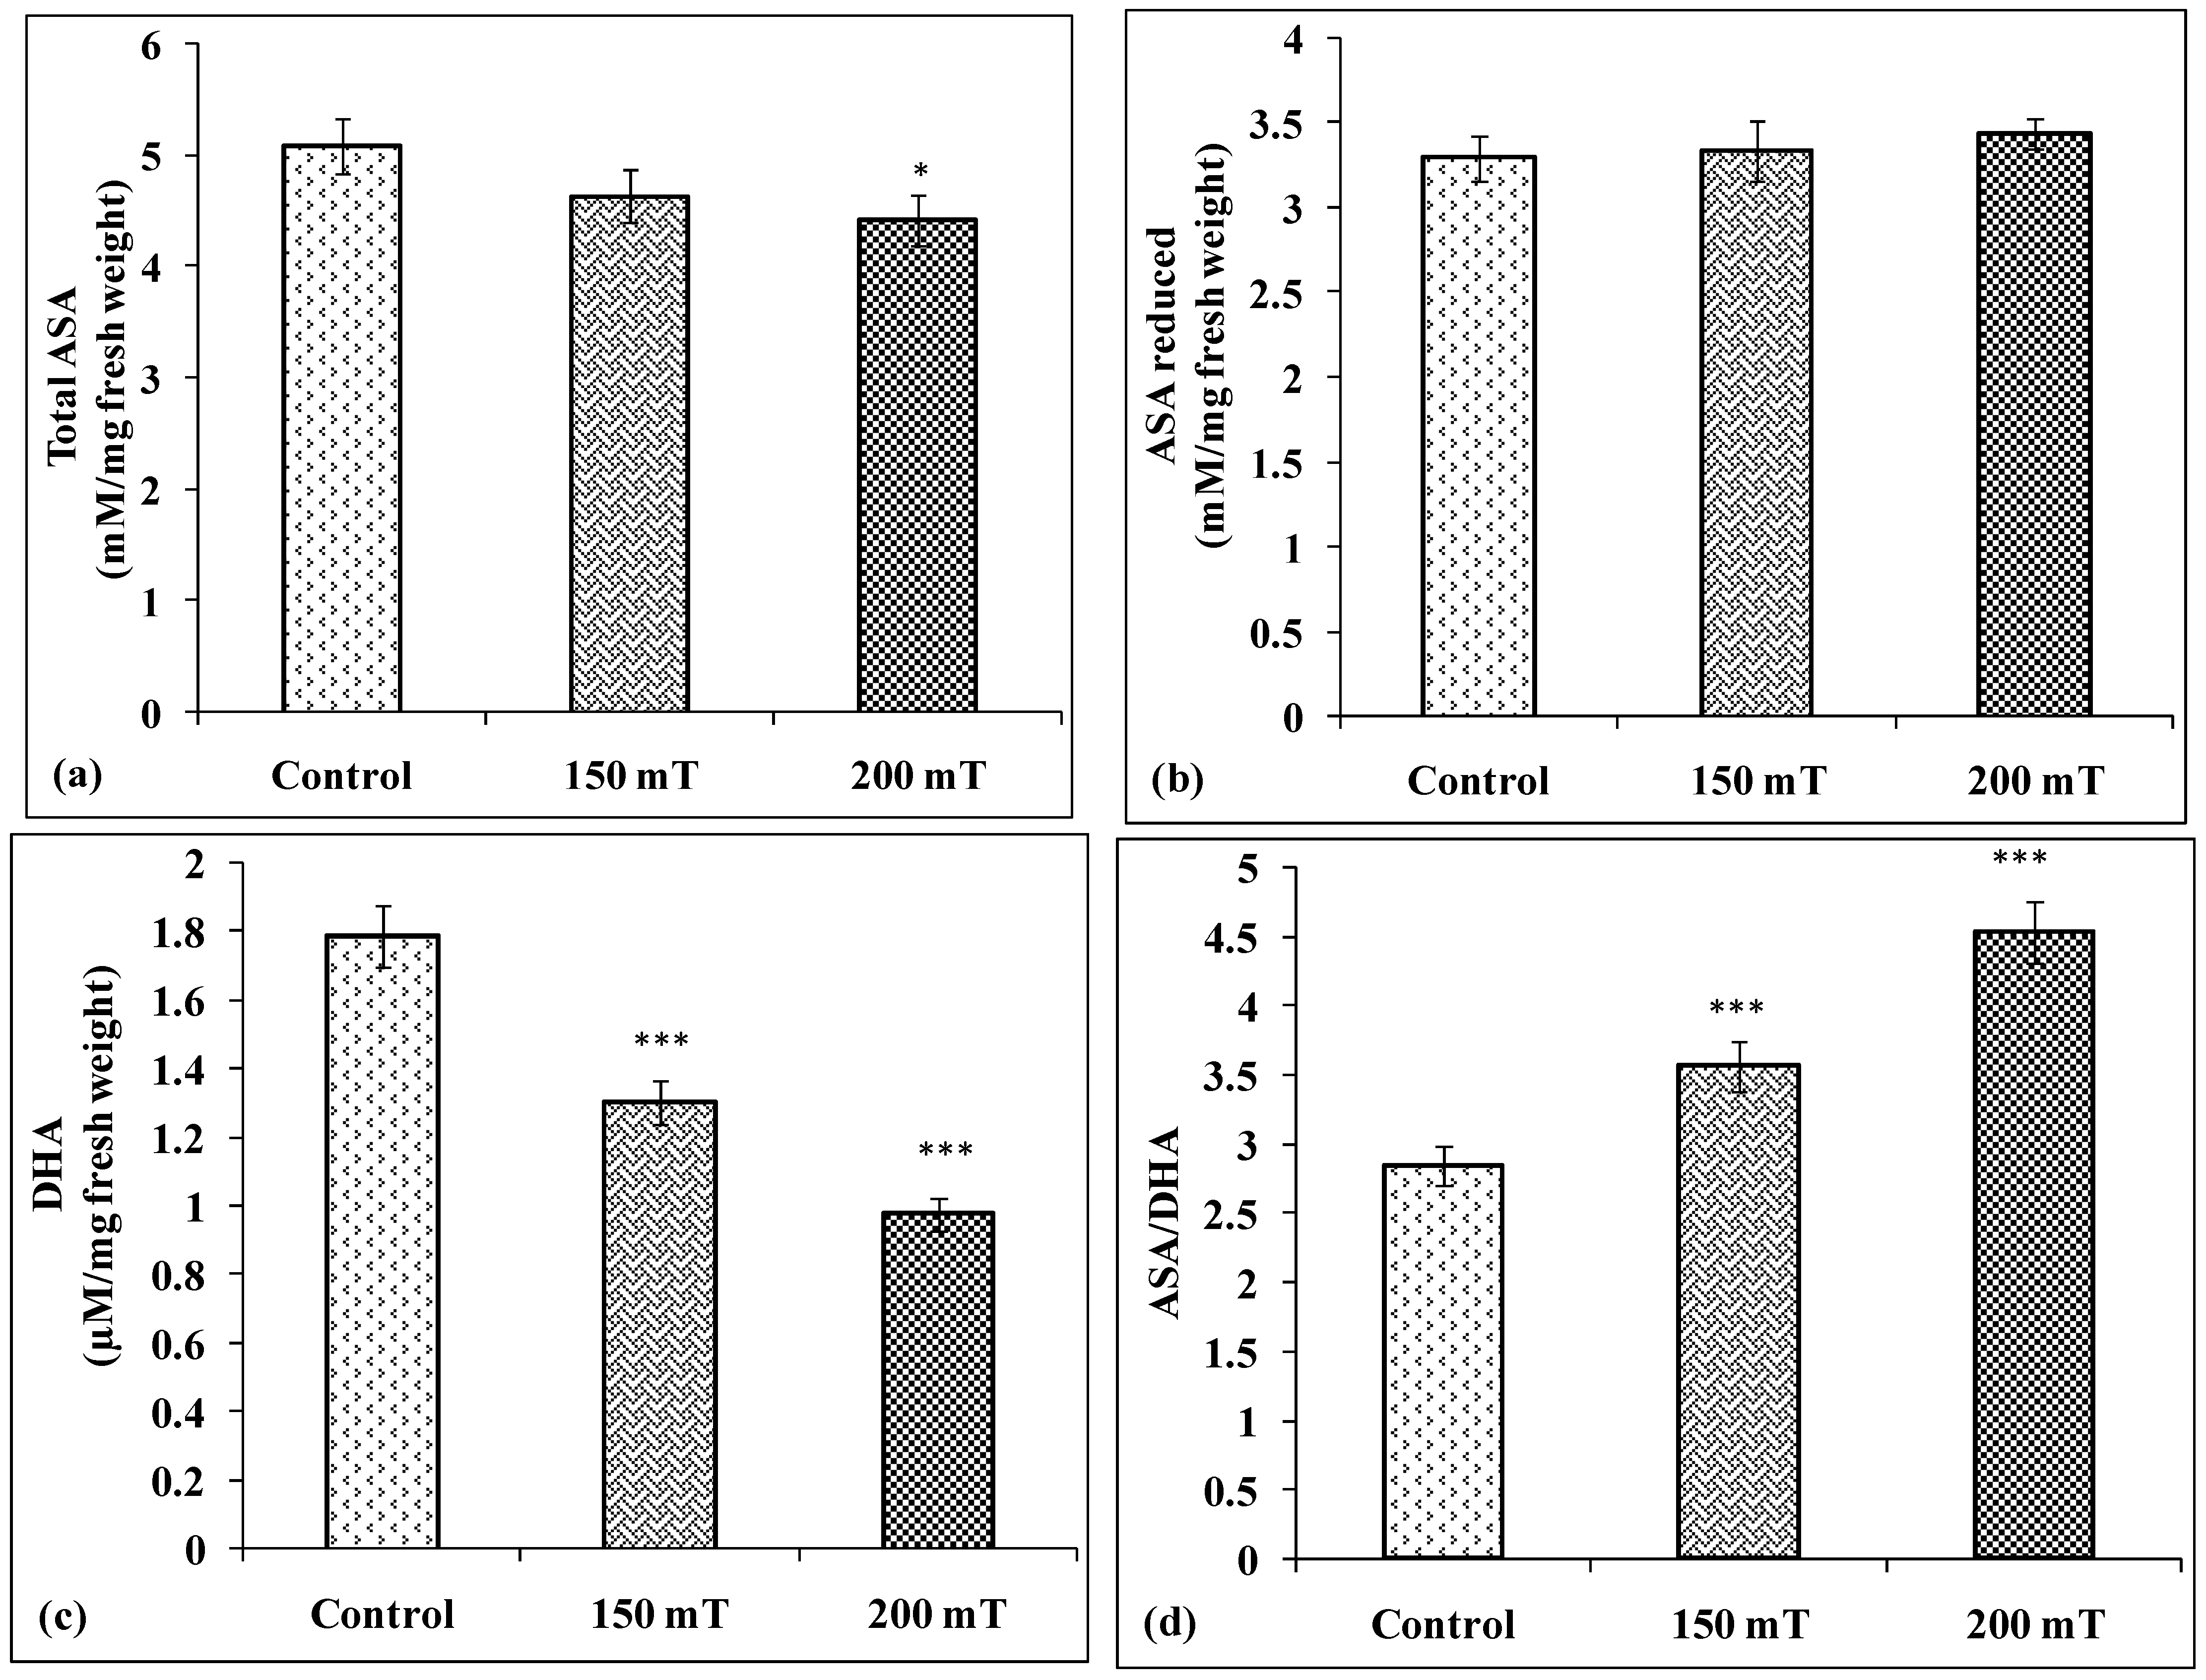
3.3.1. Ascorbic Acid Level (ASA)
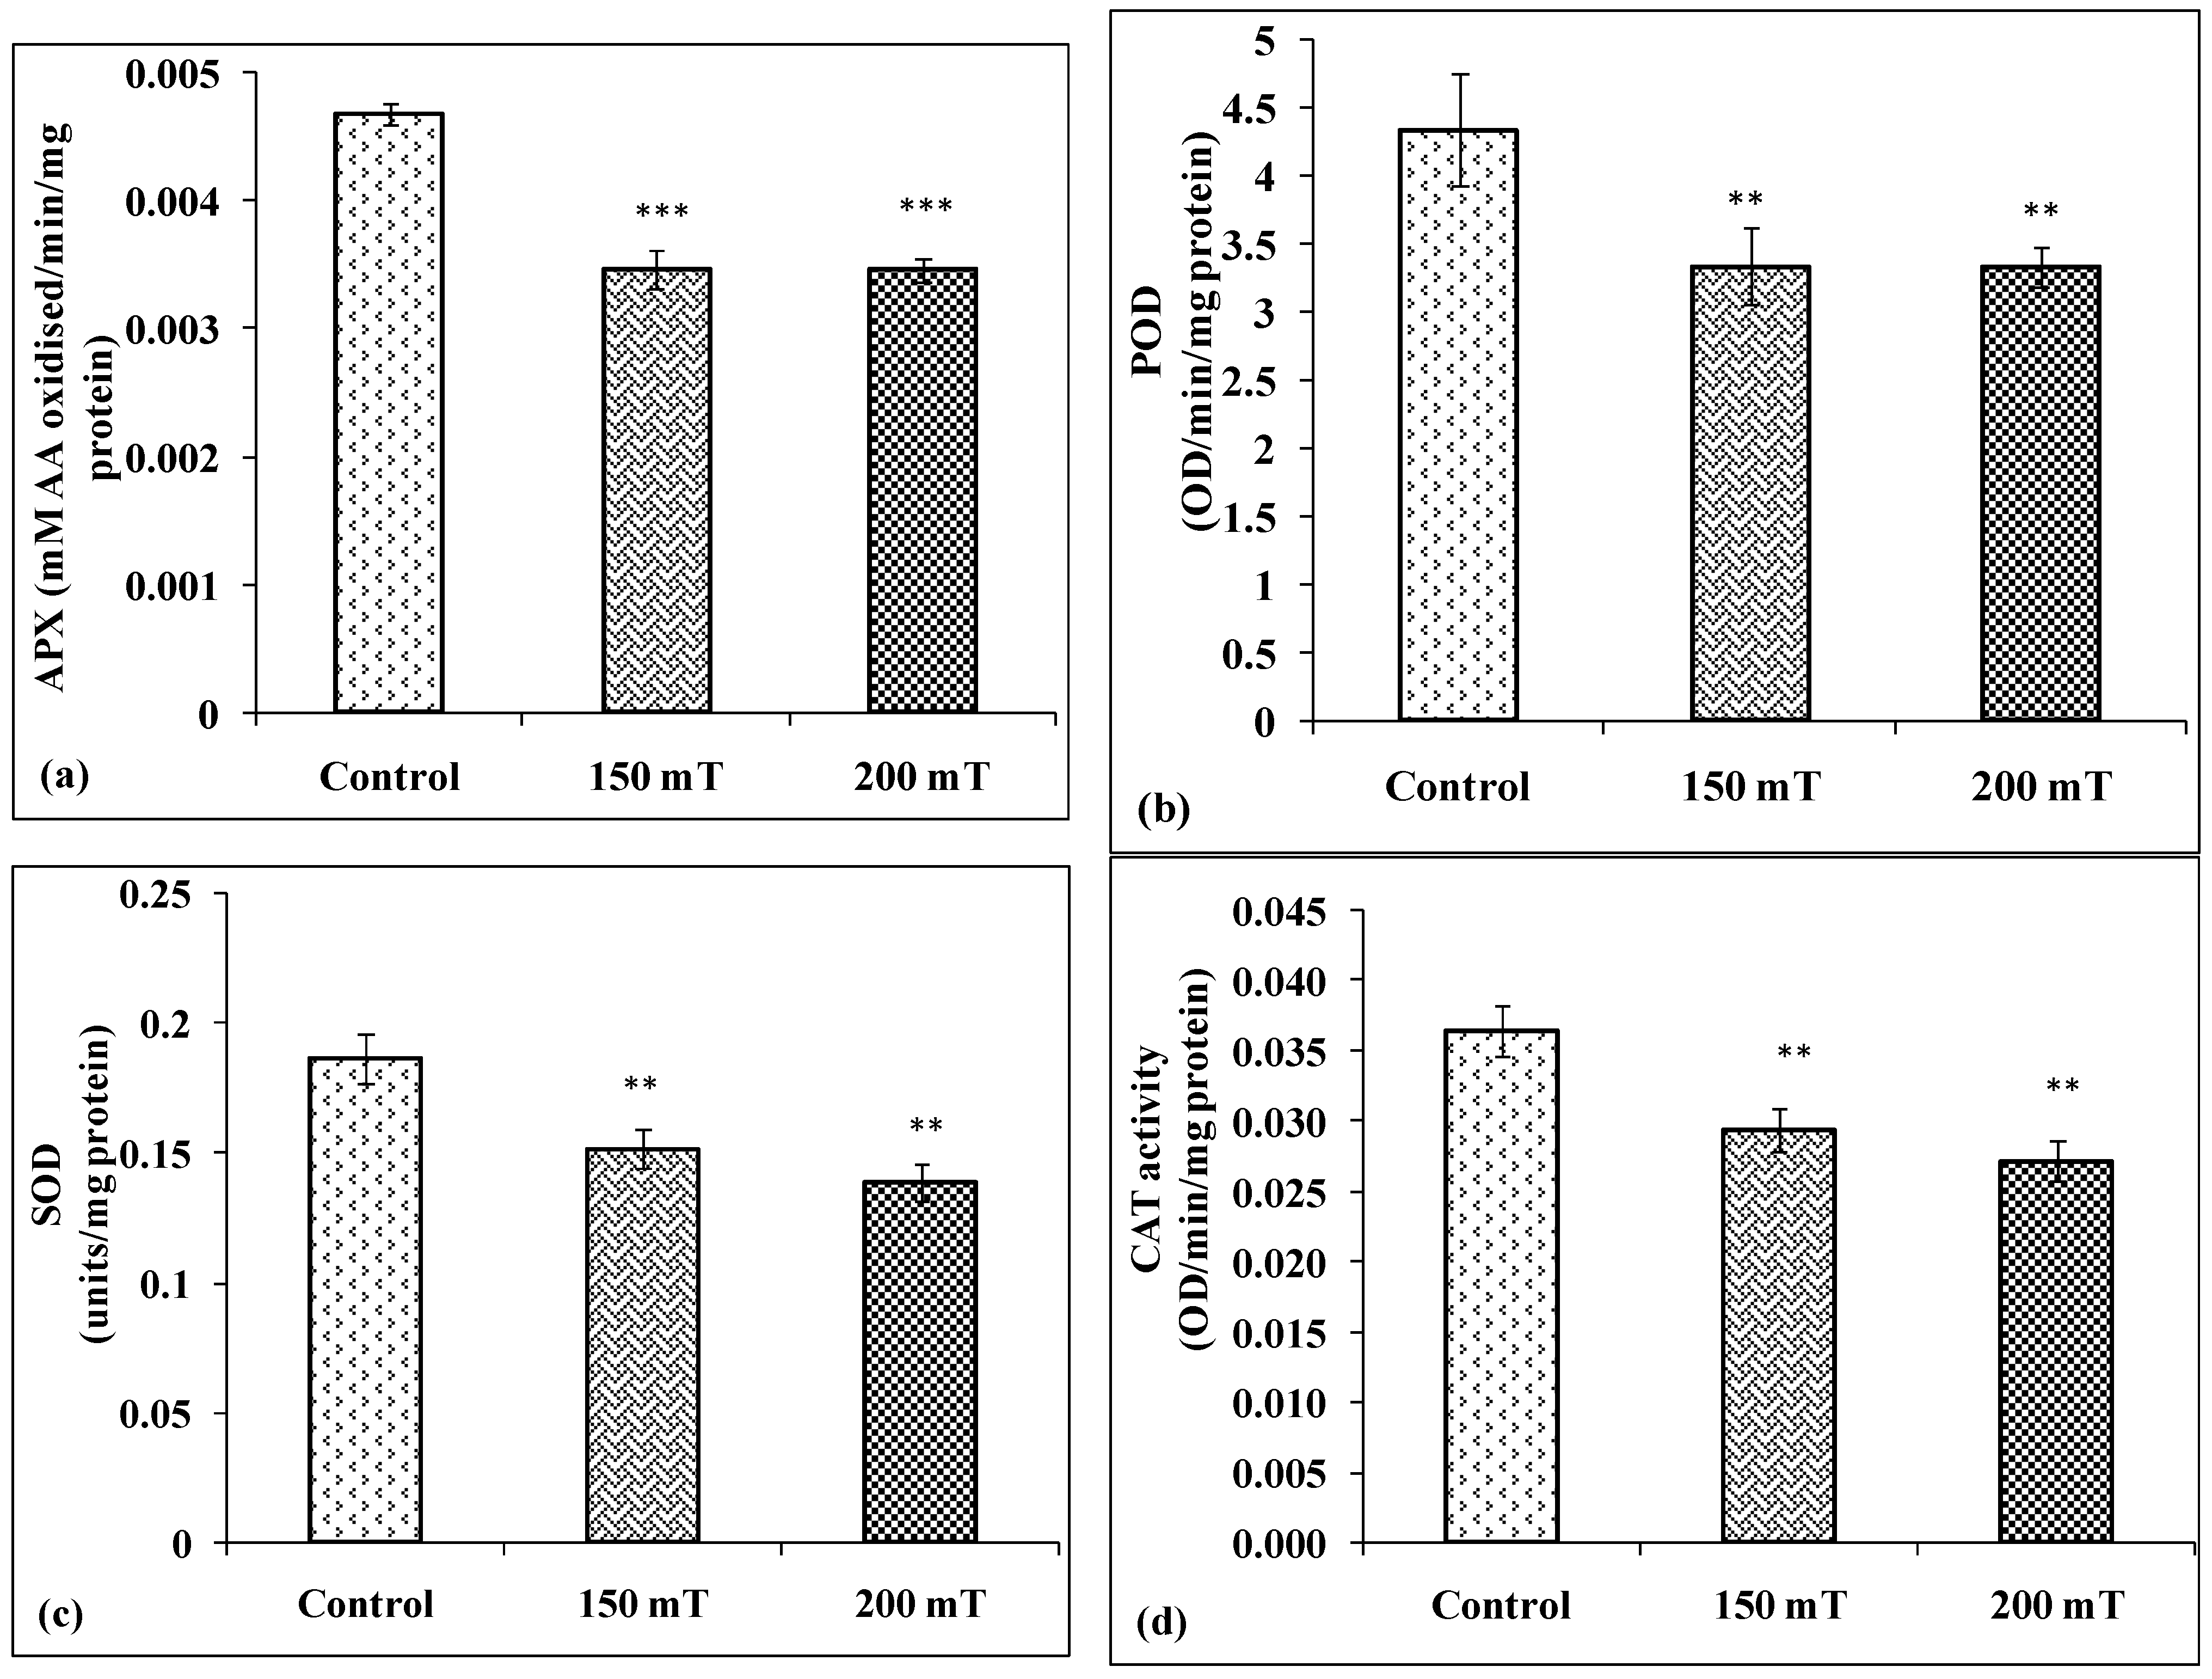
3.3.2. Antioxidant Enzymes
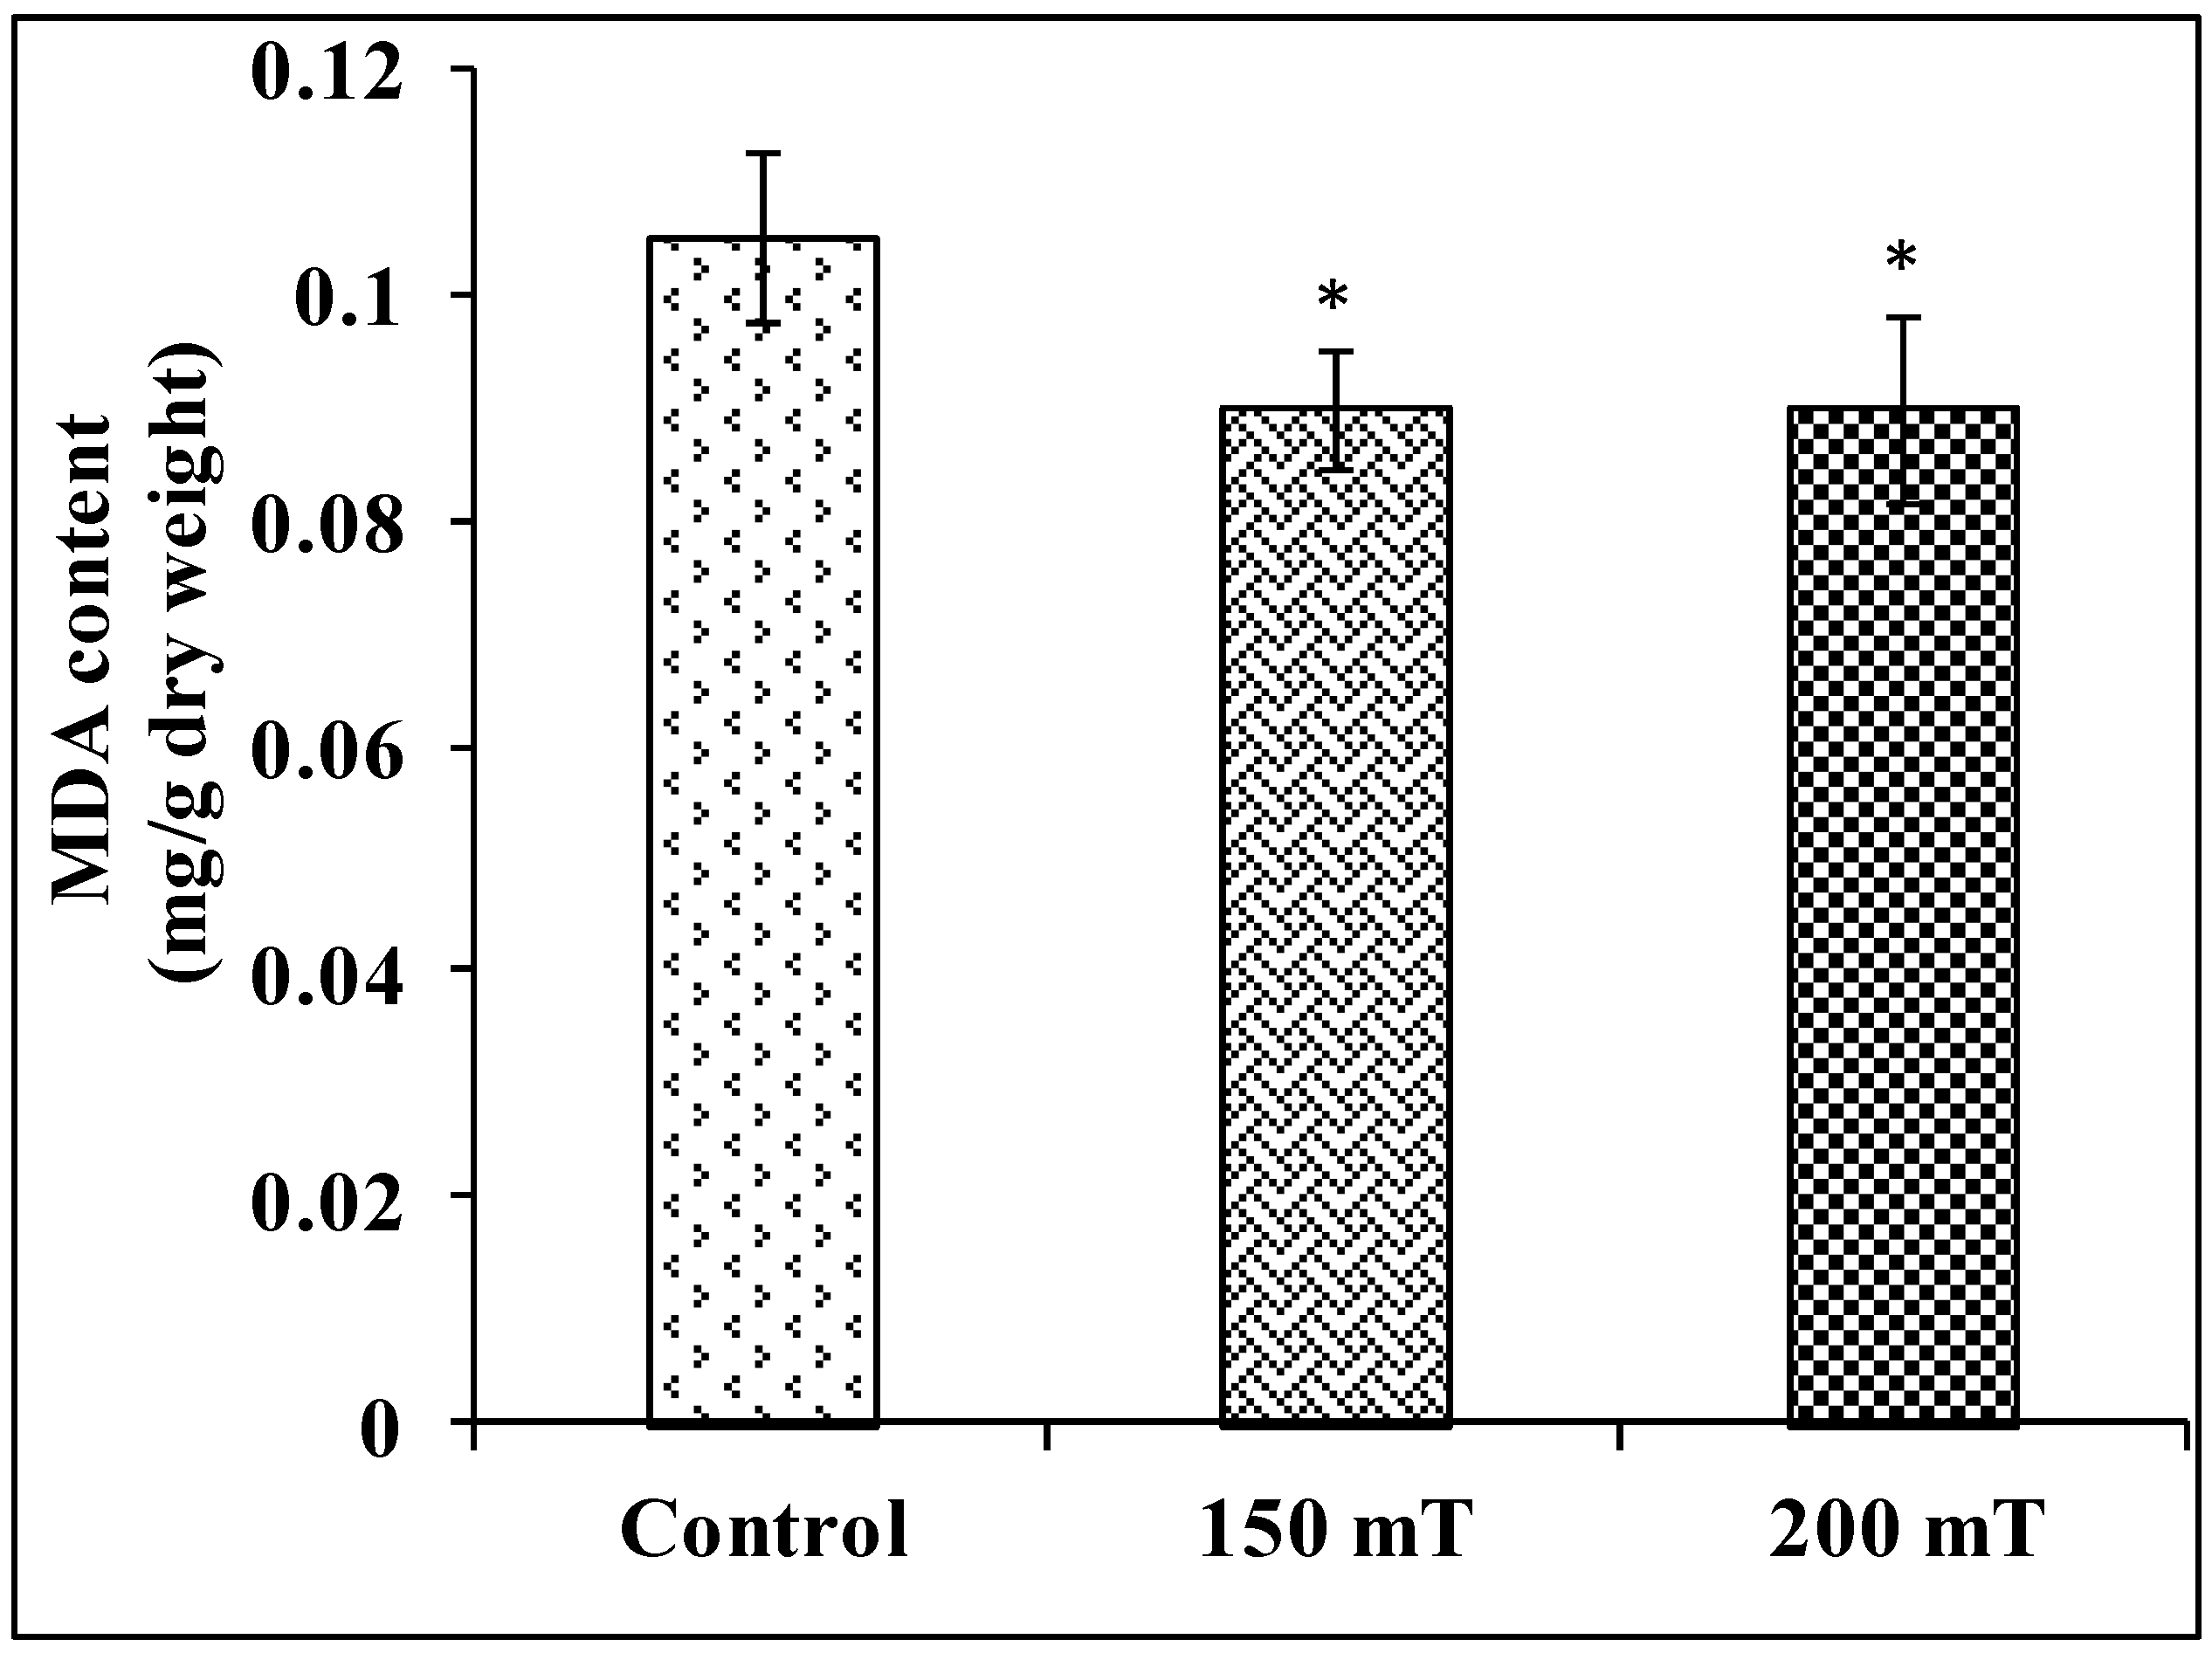
3.3.3. Malondialdehyde (MDA)
3.4. Root Growth, Nodulation and Nitrogen Fixation after SMF Pre-Treatment
3.4.1. Root Length
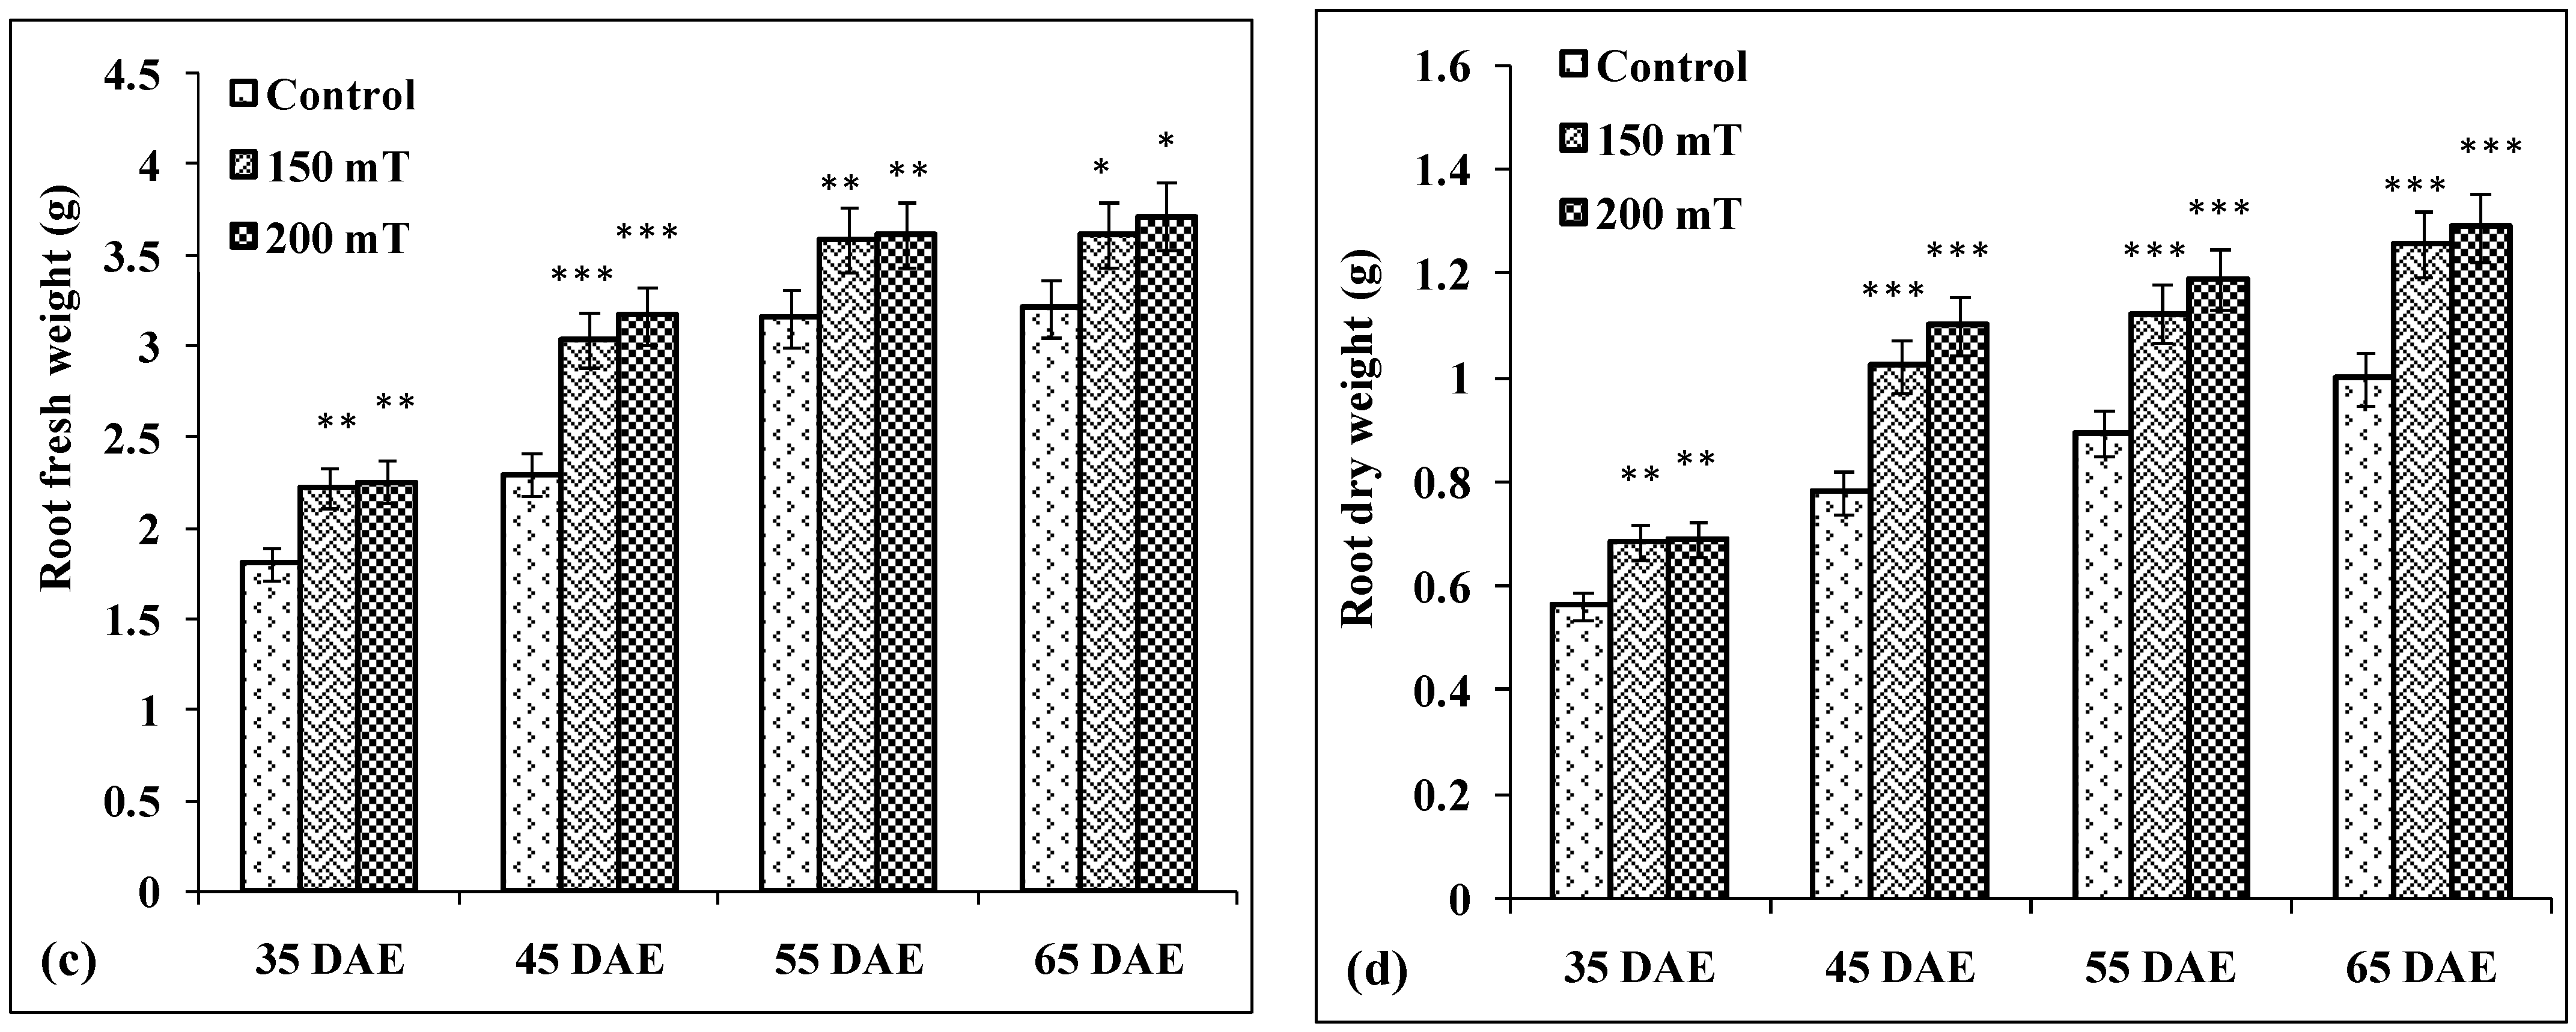
3.4.2. Root Fresh Weight
3.4.3. Root Dry Weight
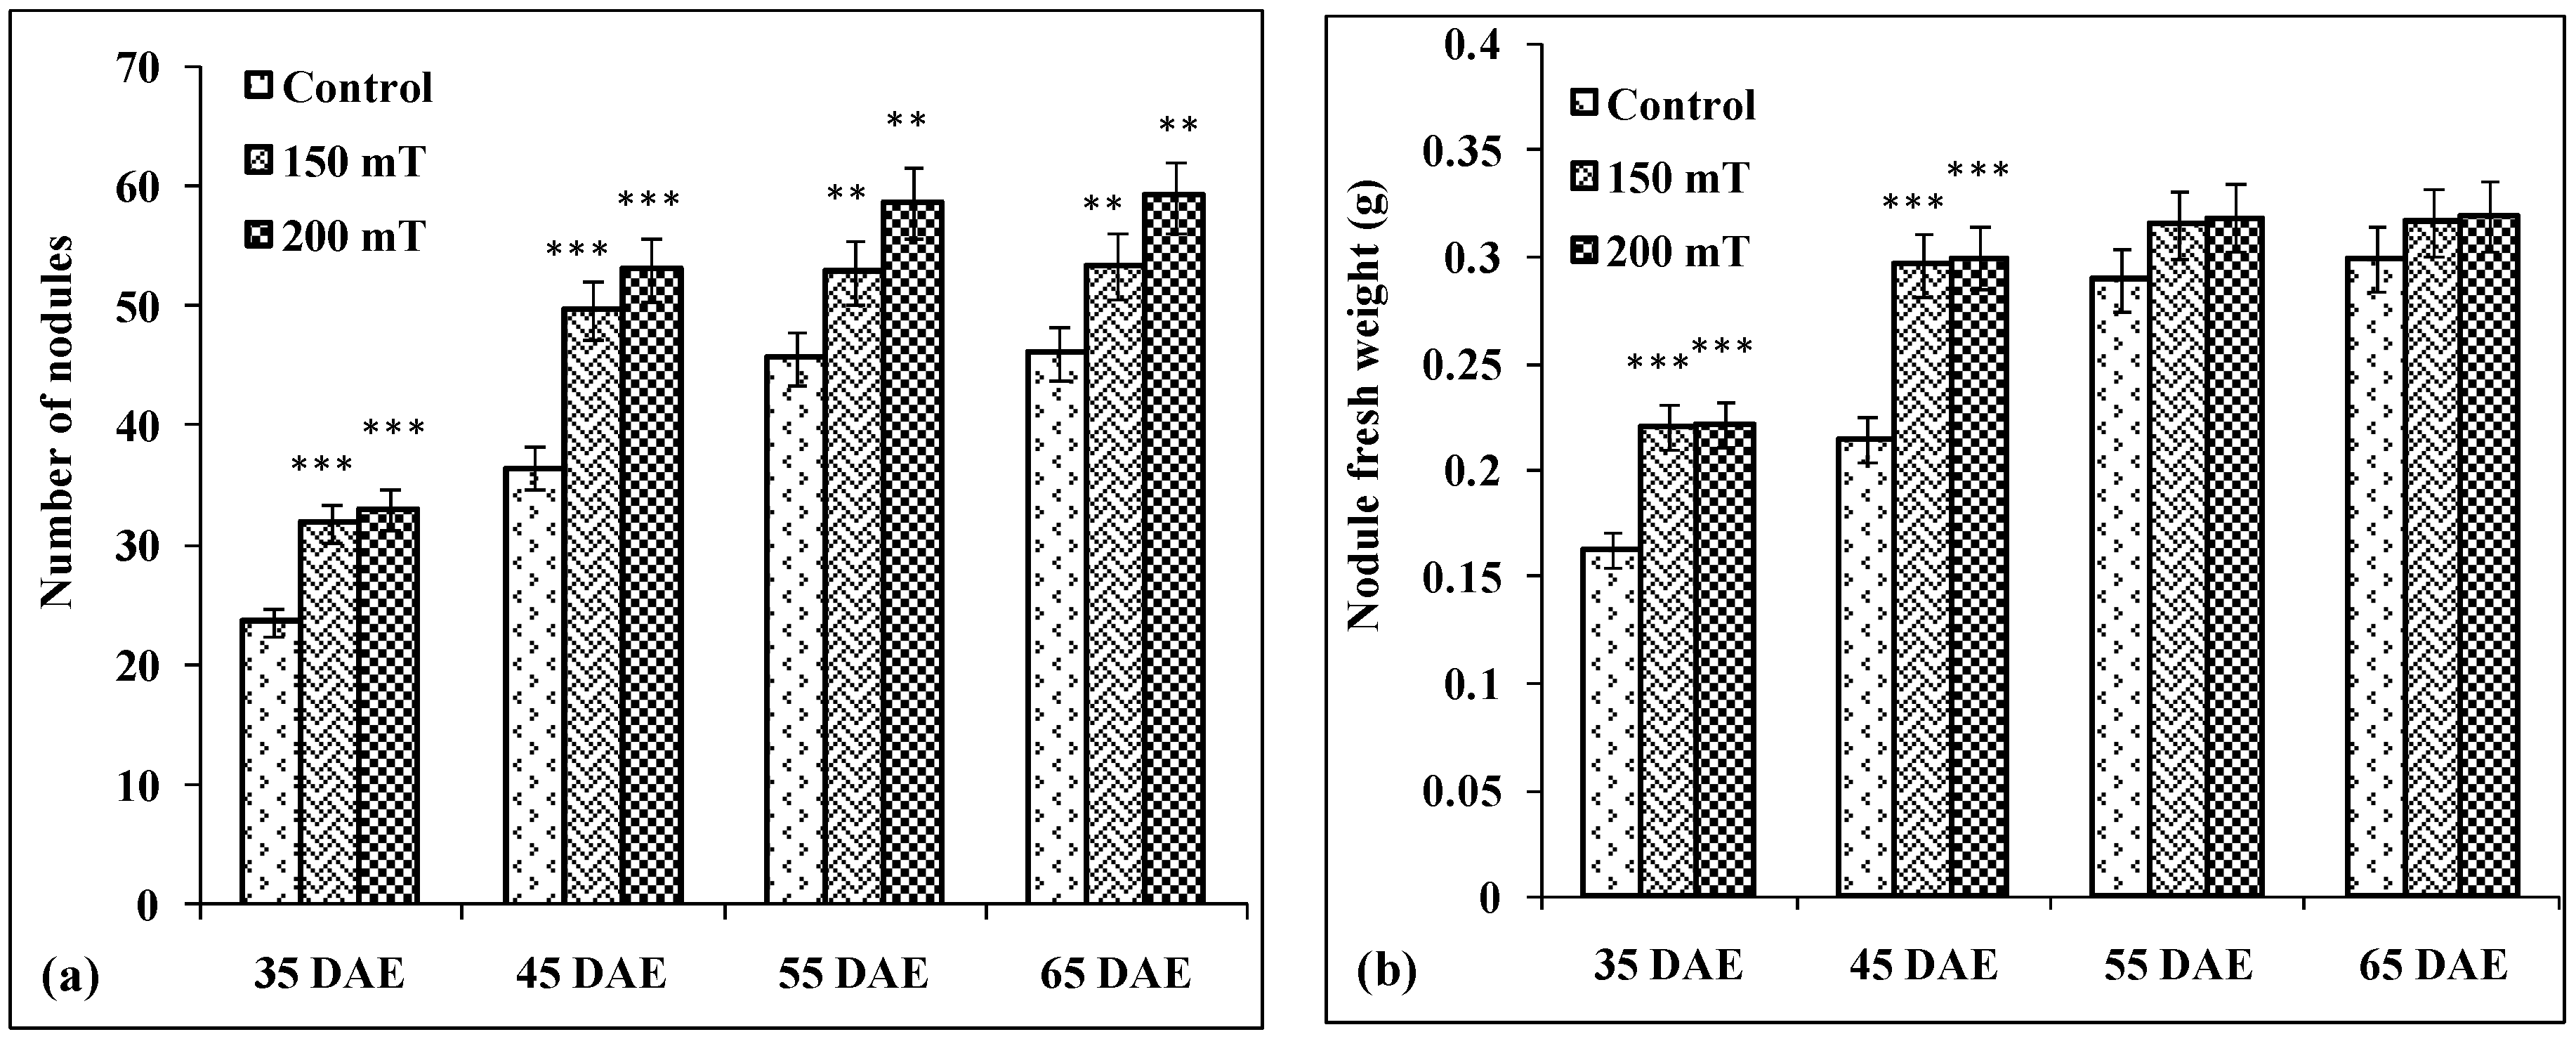
3.4.4. Number of Nodules
3.4.5. Nodule Fresh Weight
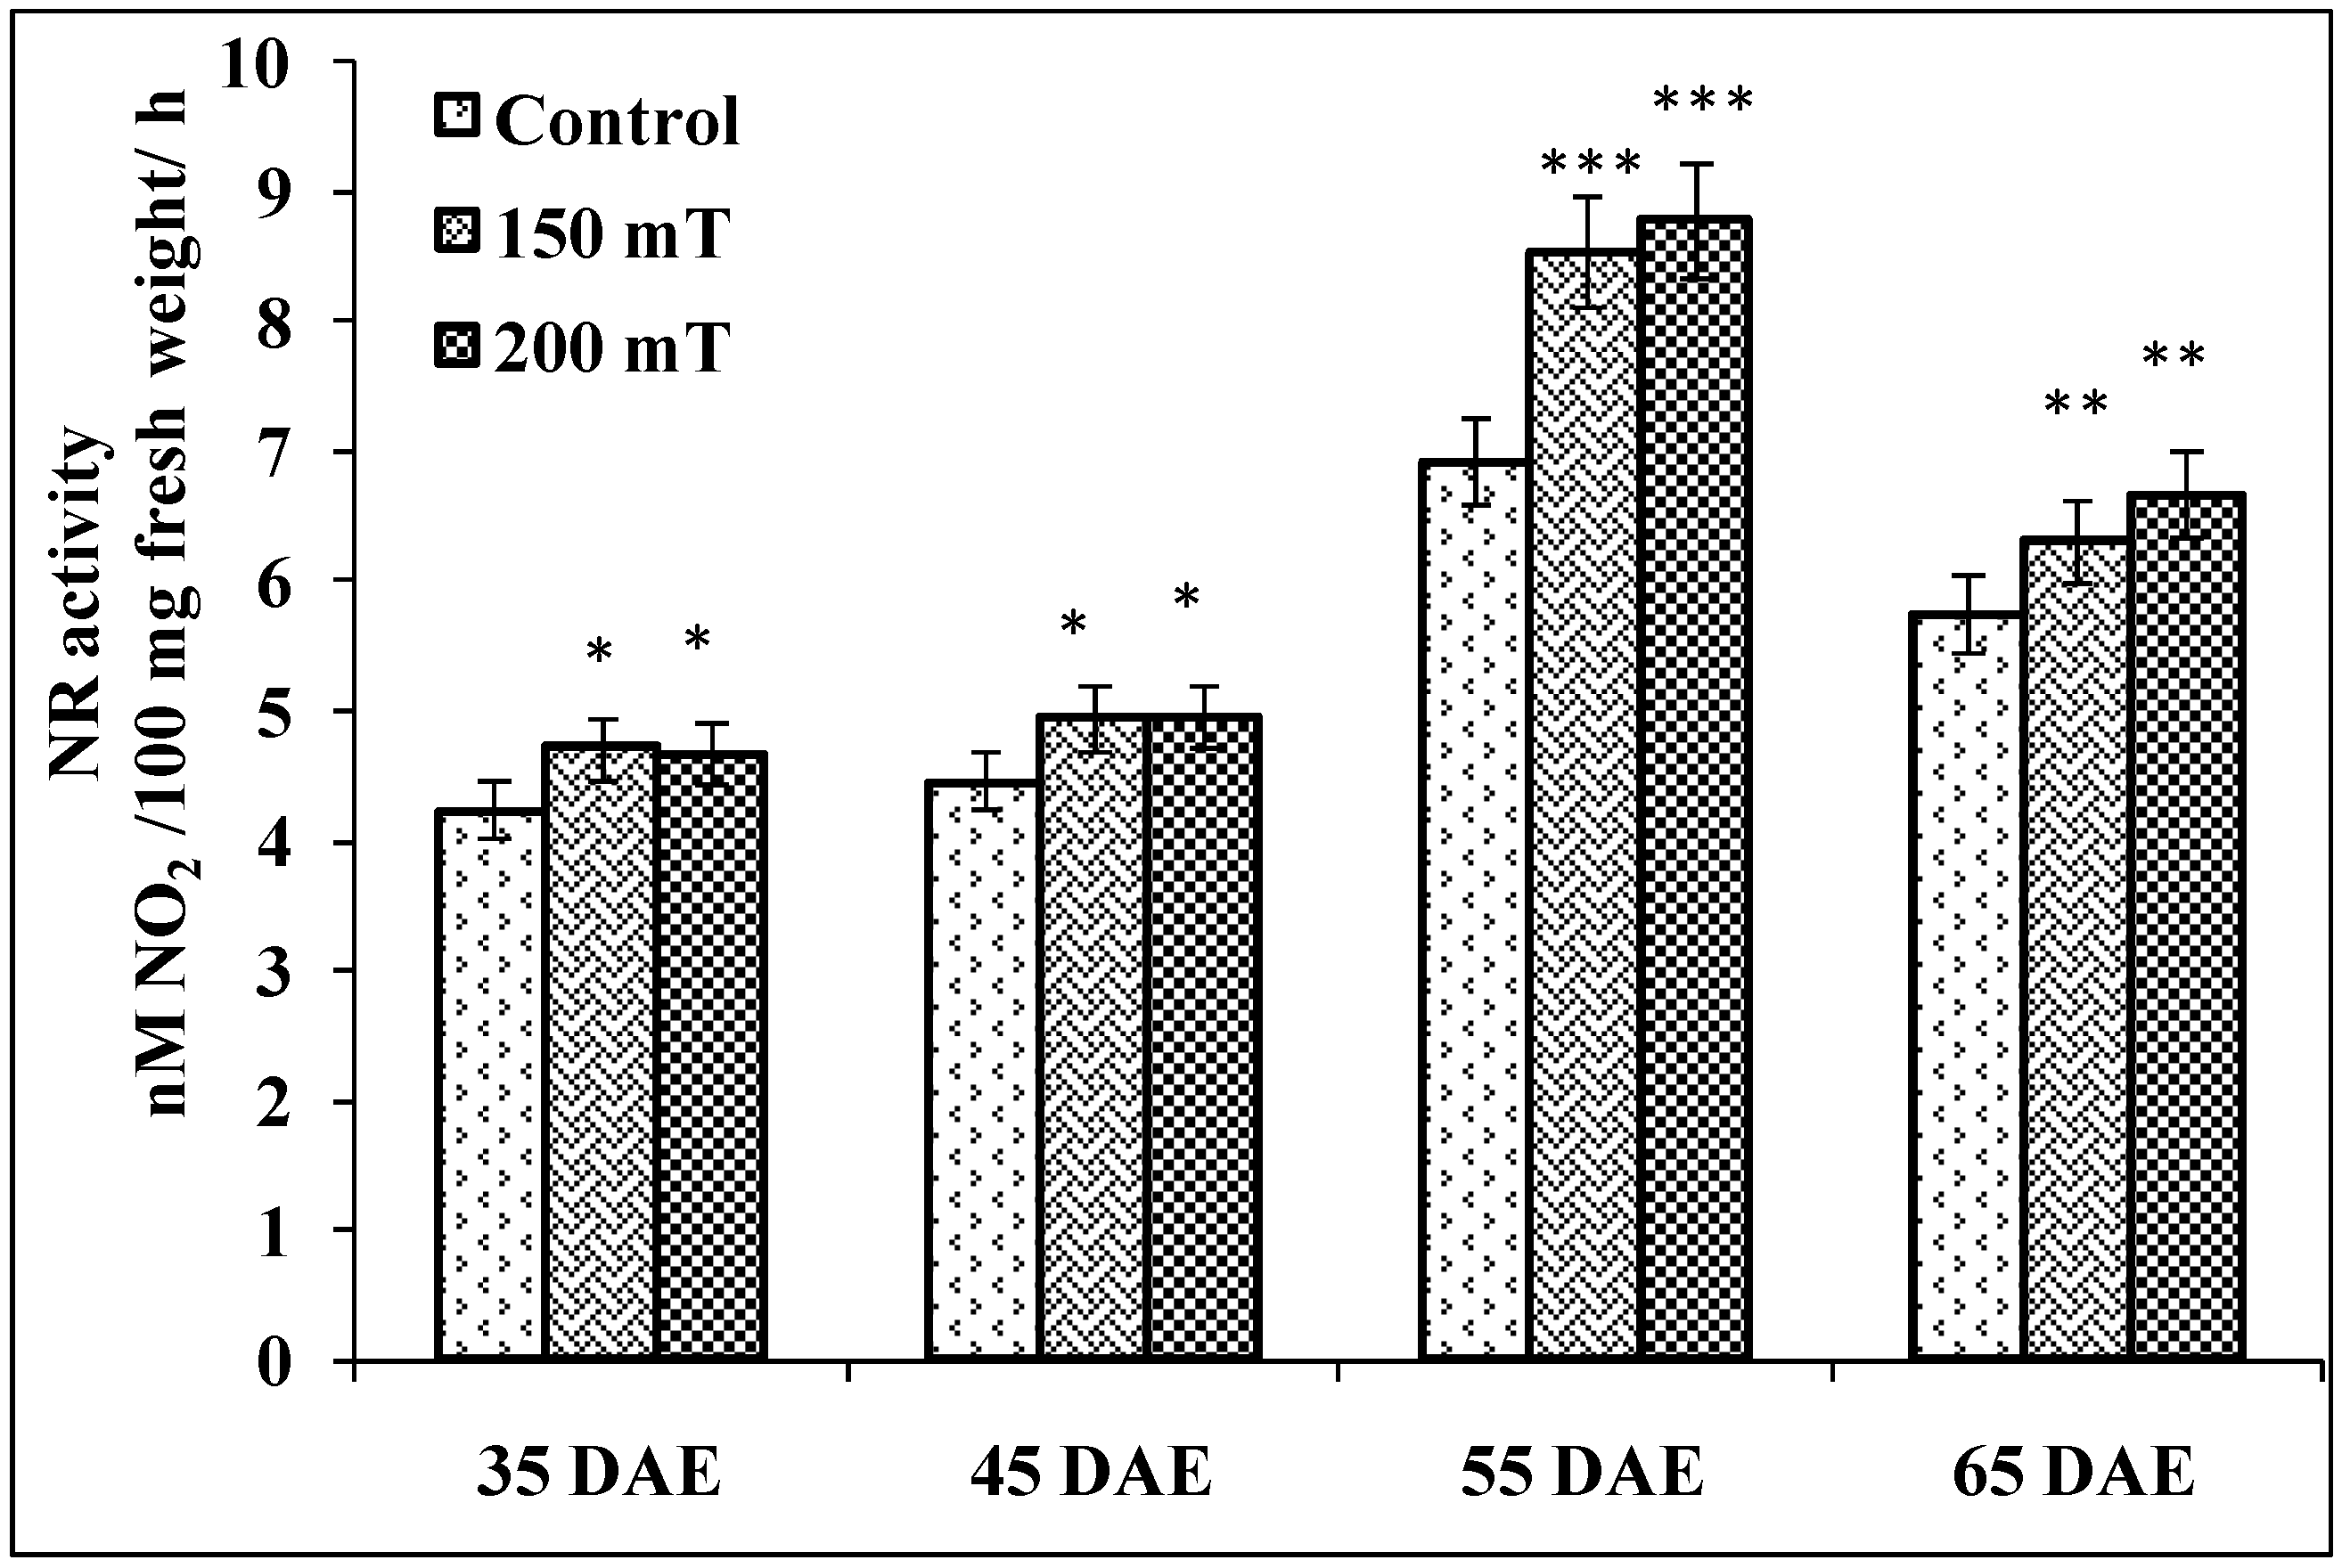
3.4.6. Nitrate Reductase Activity
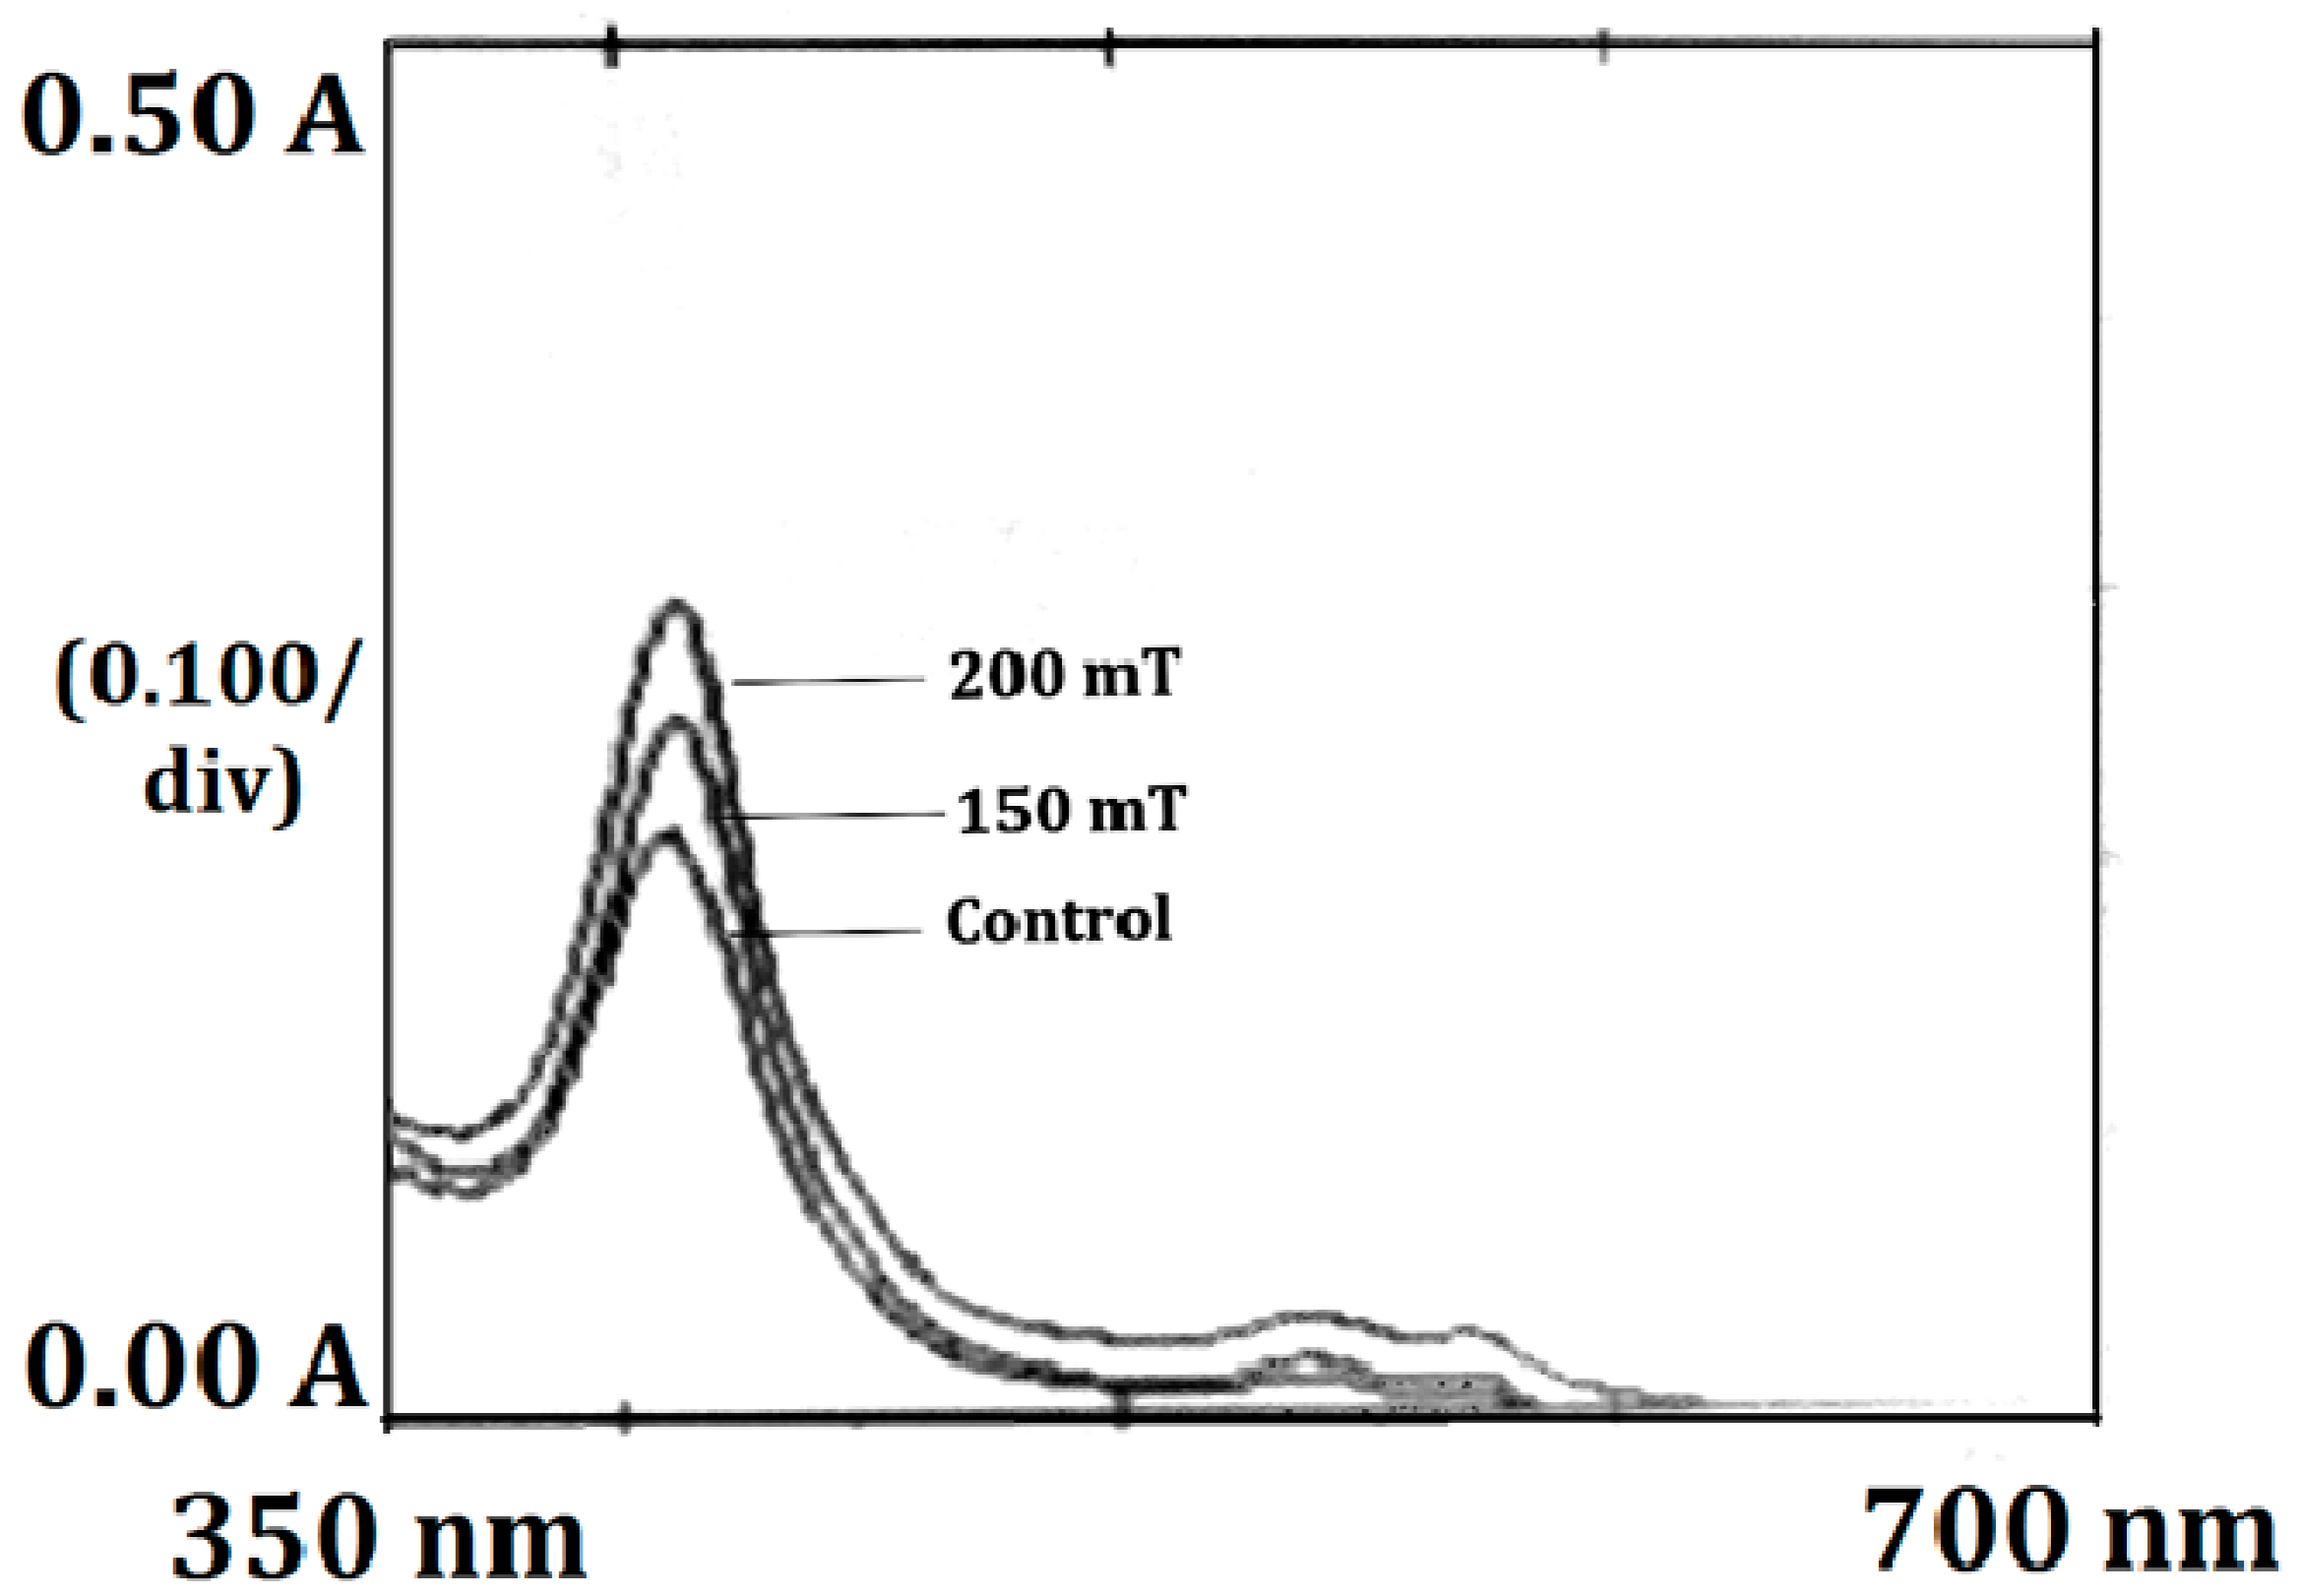
3.4.7. Leghemoglobin, Hemechrome and Total Protein Contents in Root Nodules
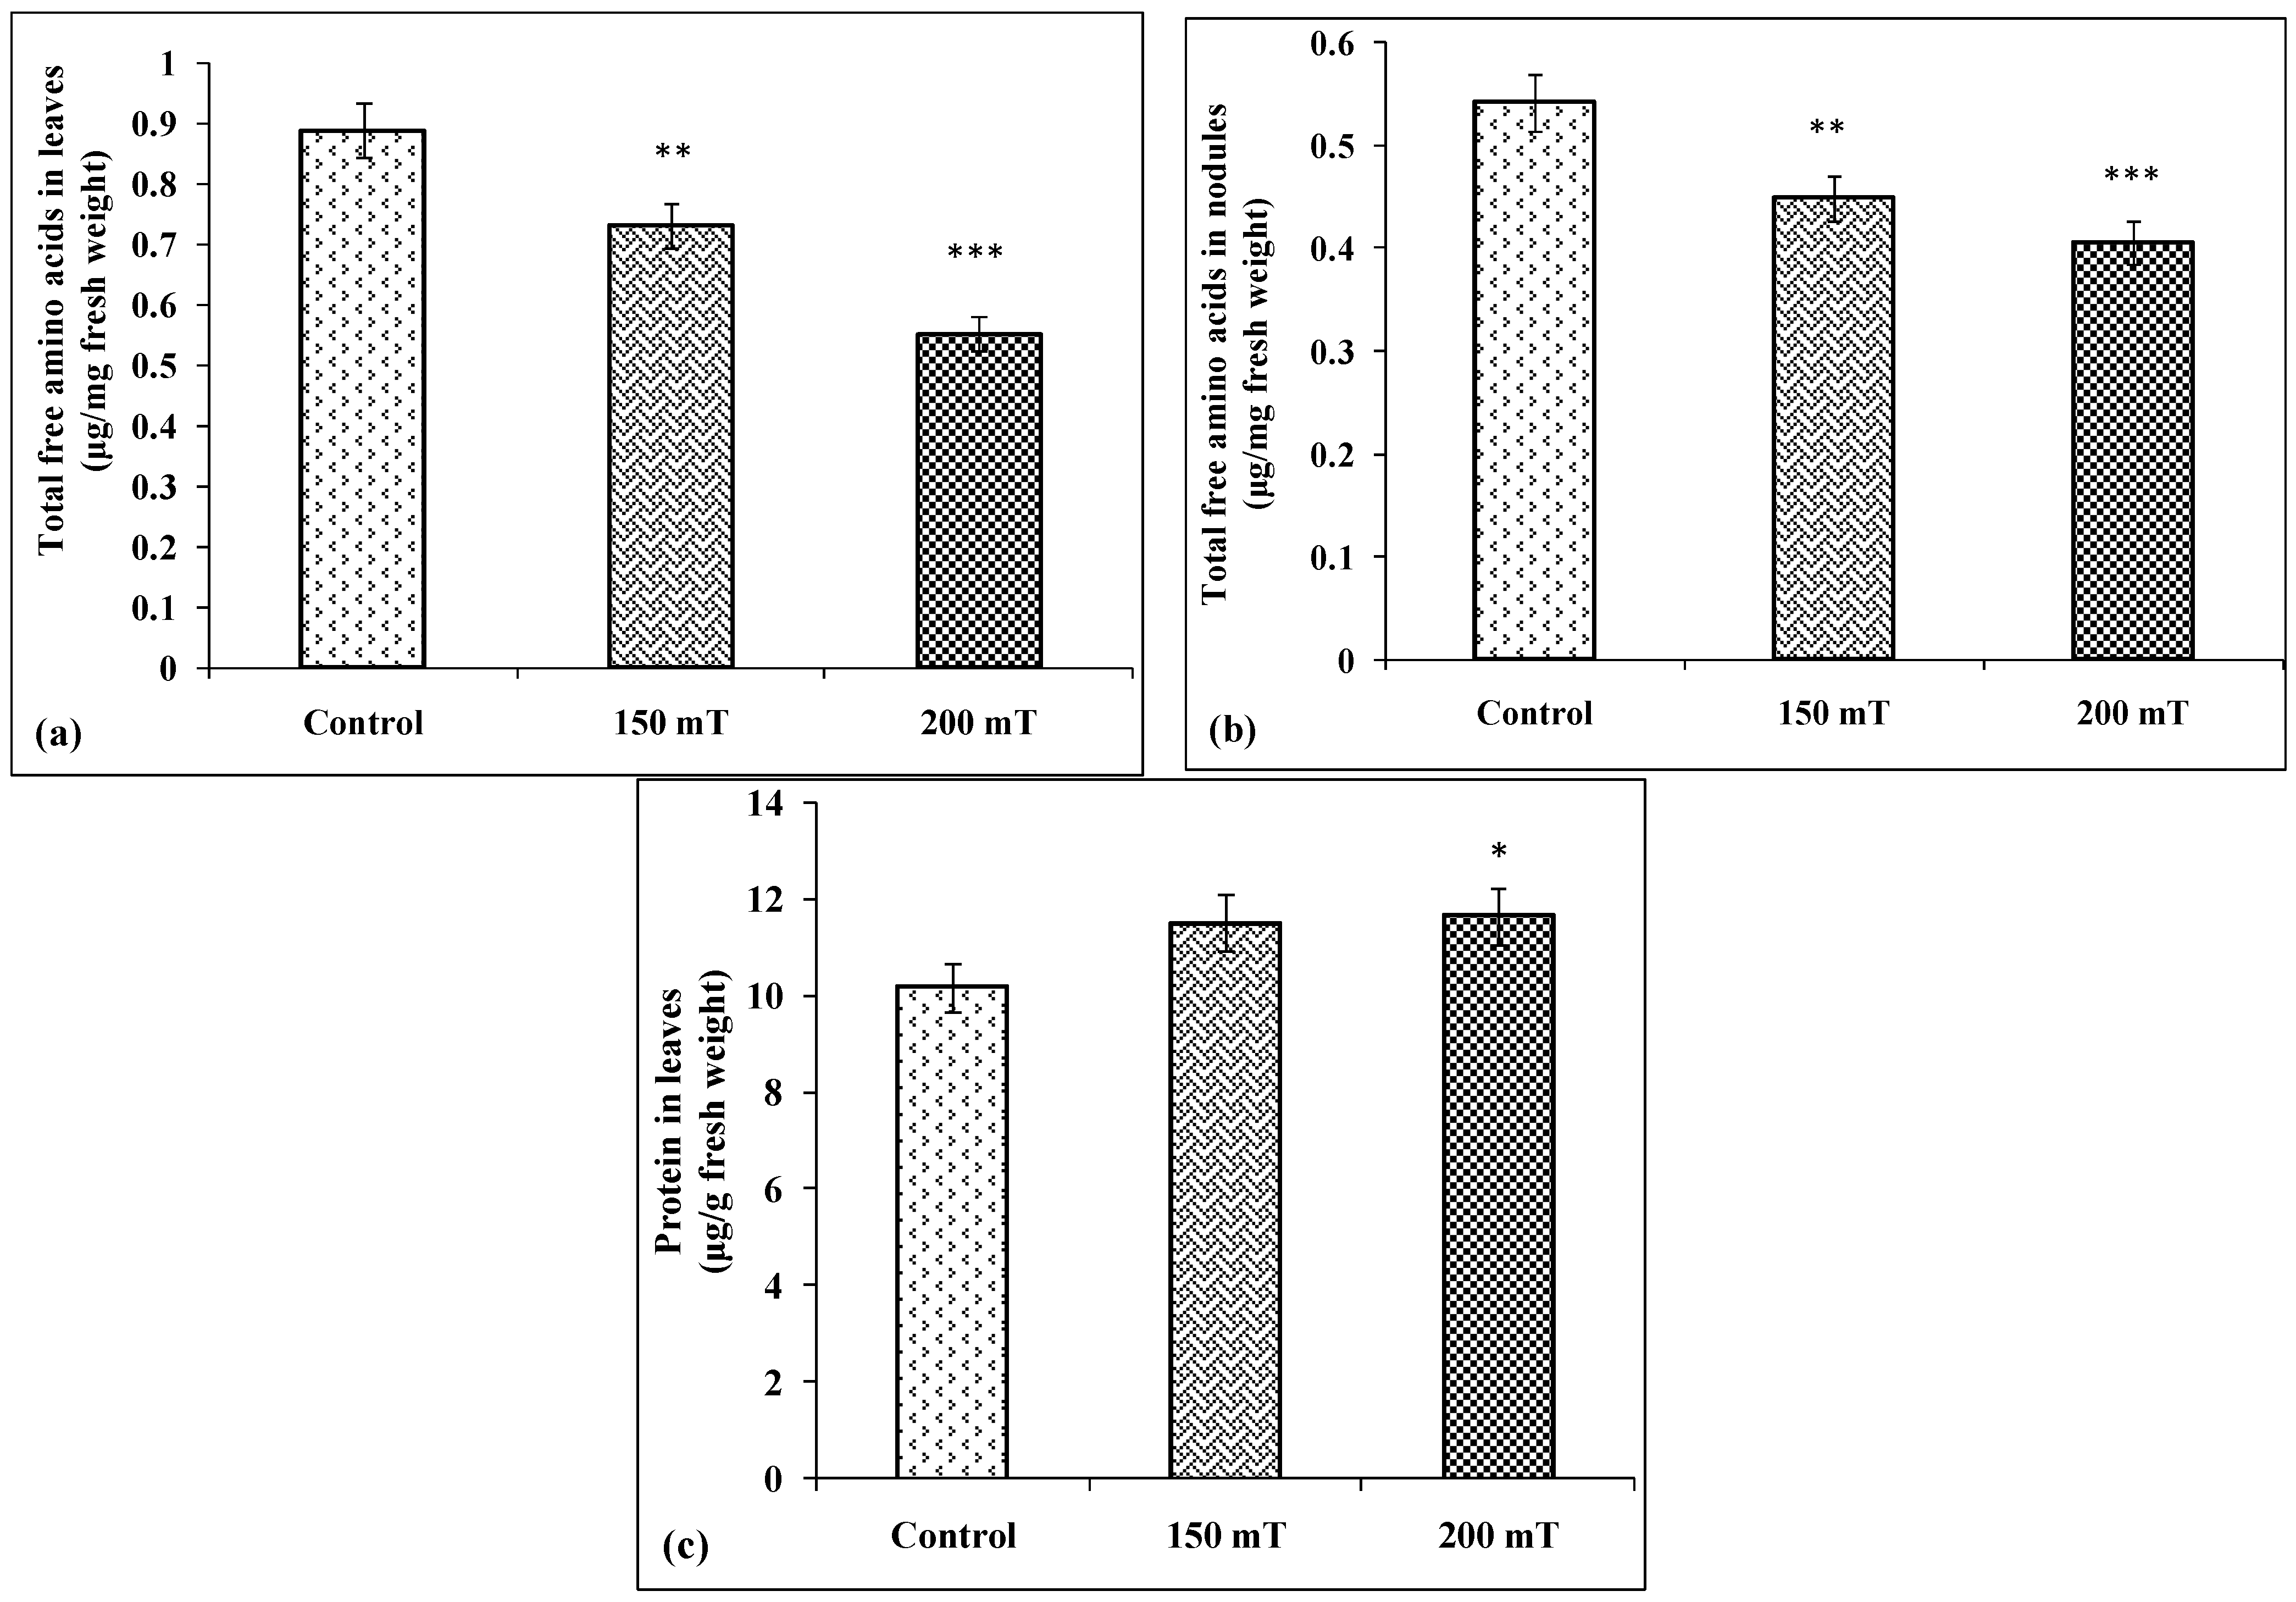
3.4.8. Total Free Amino Acids and Protein
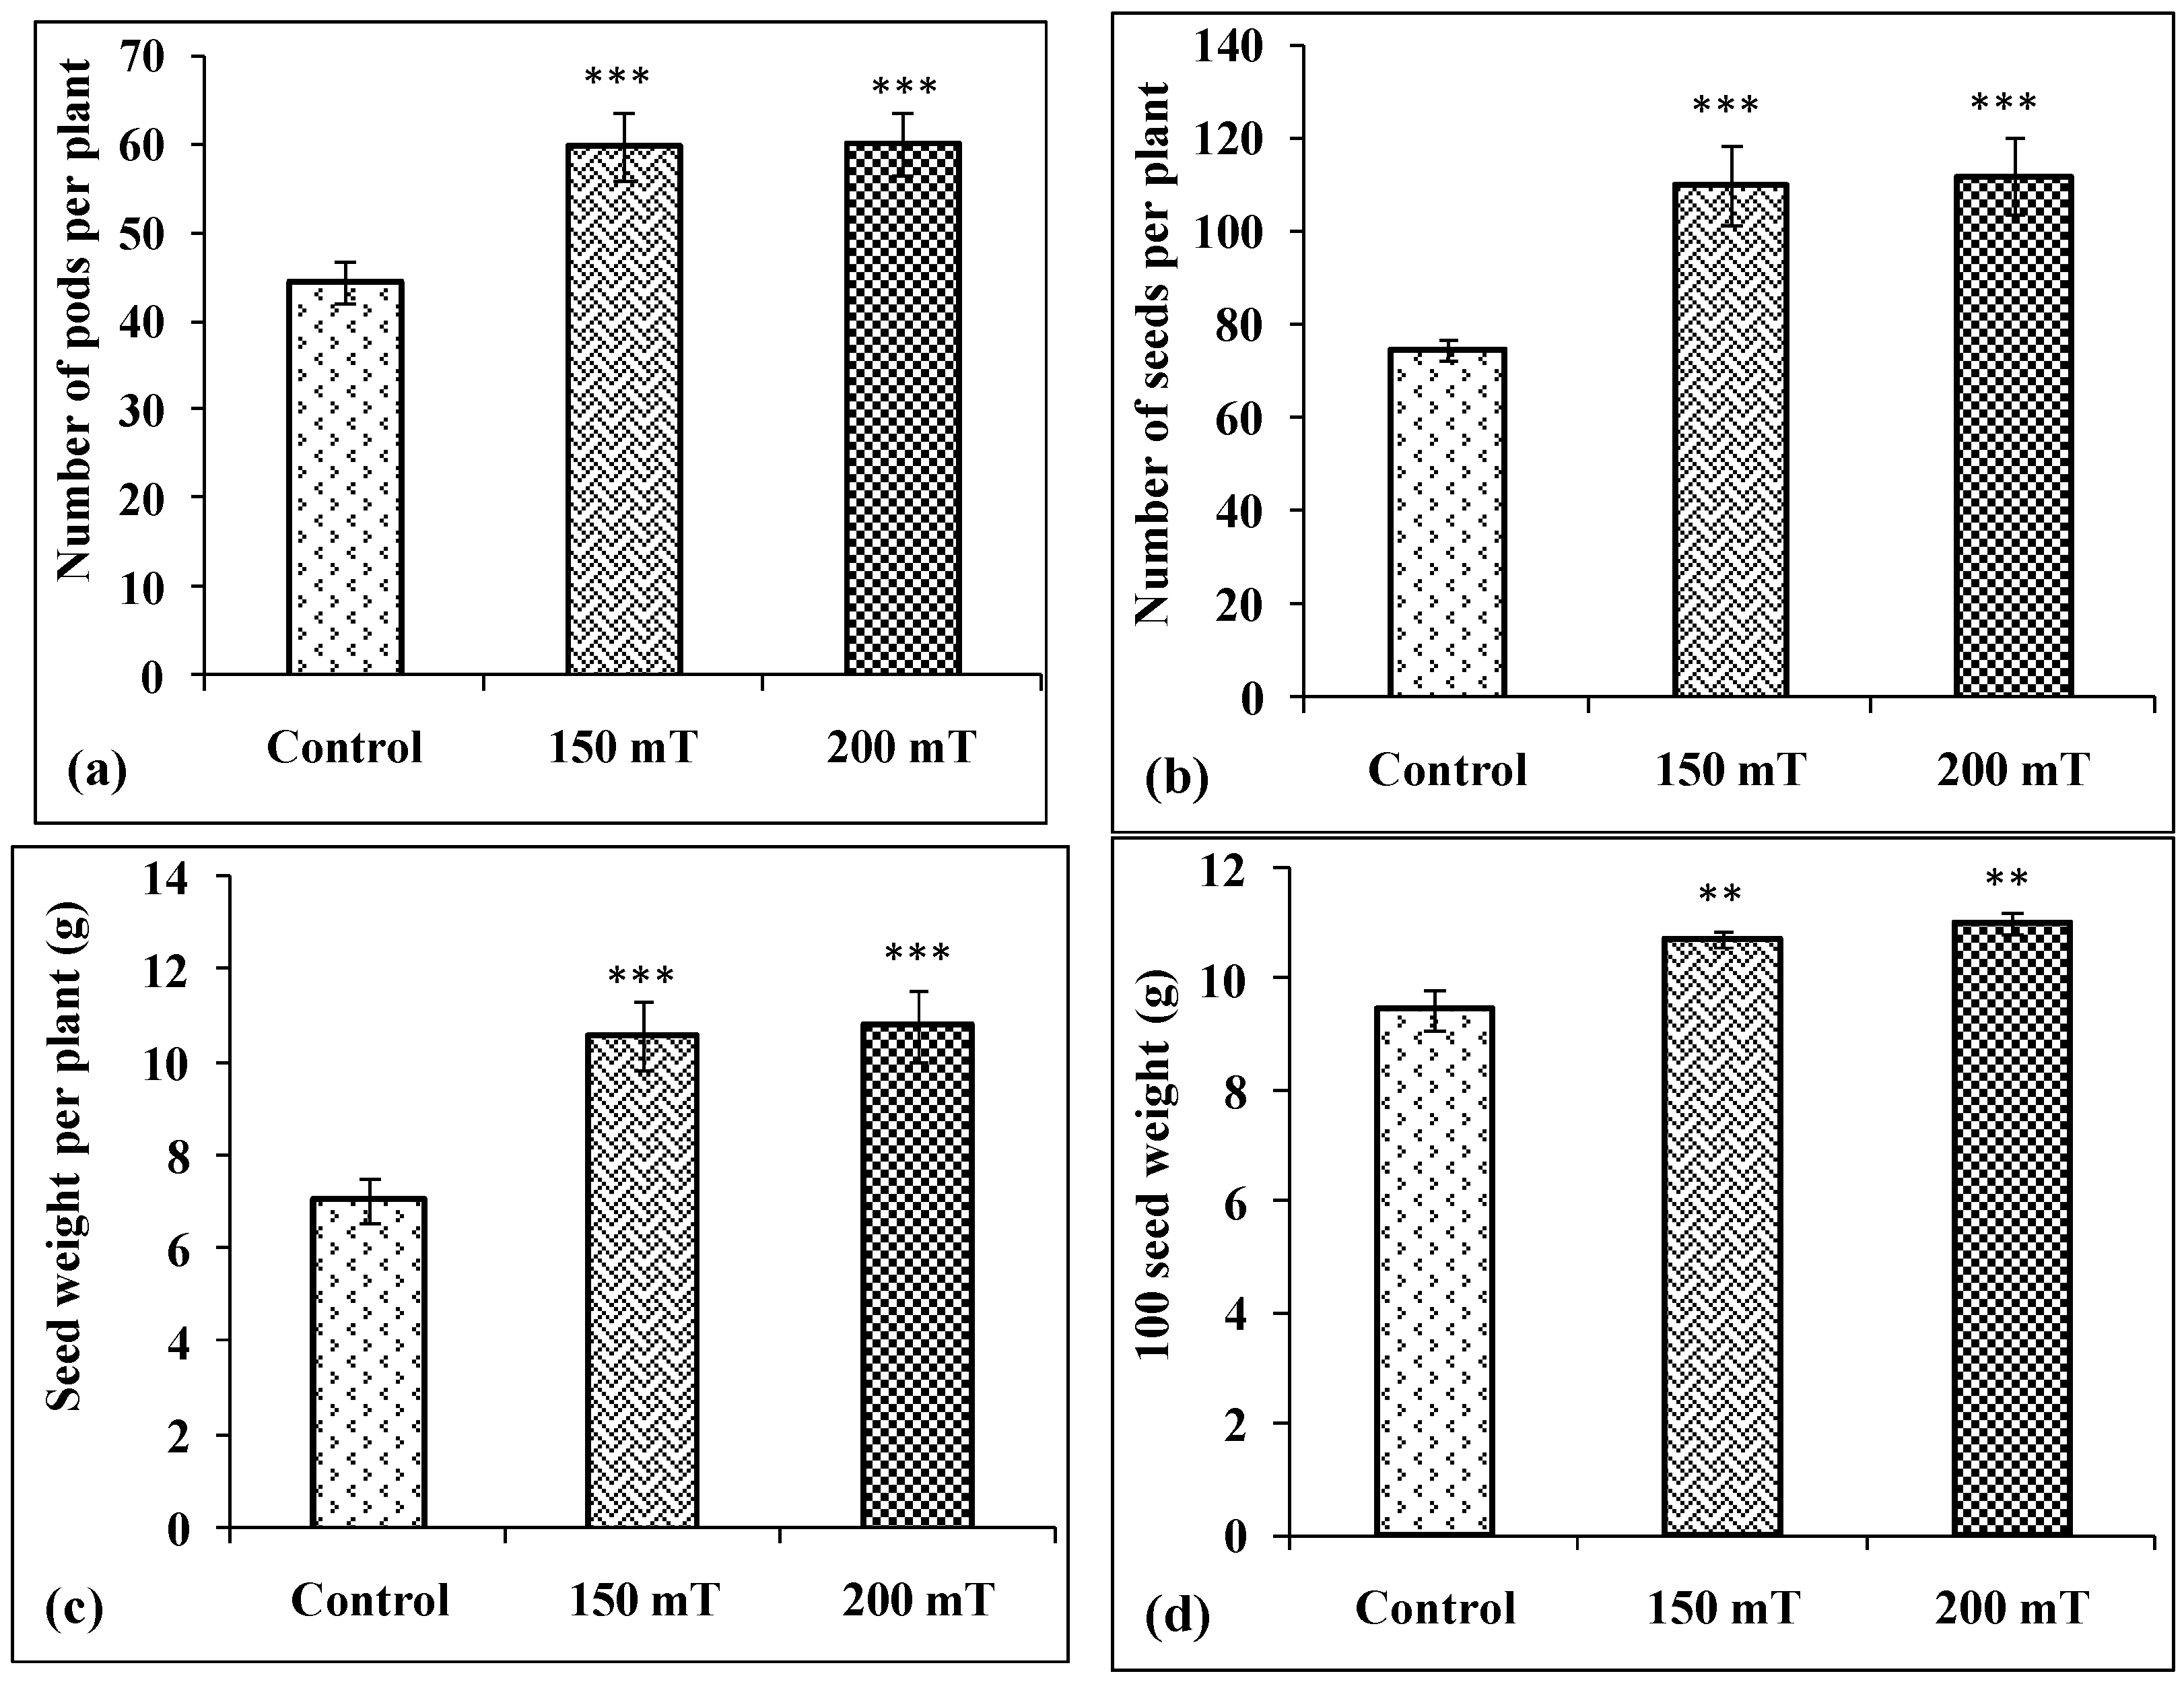
3.5. Yield and Its Attributes
3.5.1. Number of Pods per Plants
3.5.2. Number of Seeds per Plant
3.5.3. Seed Weight per Plant
3.5.4. Hundred Seed Weight
4. Discussion
5. Conclusions
Author Contributions
Funding
Institutional Review Board Statement
Informed Consent Statement
Data Availability Statement
Conflicts of Interest
References
- FAS USDA. Available online: https://apps.fas.usda.gov/psdonline/circulars/production.pdf (accessed on 21 December 2021).
- SOPA. Available online: http://www.sopa.org/statistics/soybean-production-by-state/ (accessed on 21 December 2021).
- Maffei, M.E. Magnetic field effects on plant growth, development, and evolution. Front. Plant Sci. 2014, 5, 445. [Google Scholar] [CrossRef]
- Sarraf, M.; Kataria, S.; Taimourya, H.; Santos, L.O.; Menegatti, R.D.; Jain, M.; Ihtisham, M.; Liu, S. Magnetic Field (MF) Applications in Plants: An Overview. Plants 2020, 9, 1139. [Google Scholar] [CrossRef] [PubMed]
- Radhakrishnan, R. Magnetic field regulates plant functions, growth and enhances tolerance against environmental stresses. Physiol. Mol. Biol. Plants 2019, 25, 1107–1119. [Google Scholar] [CrossRef]
- Himoud, M.S.; Lazim, S.K.; Al-Bahadliy, A.H. Effect of tillage depths and static magnetic seed treatment on growth parameters and yield of maize (Zea mays L.). Indian J. Ecol. 2022, 49, 18–23. [Google Scholar]
- Alexander, M.P.; Doijode, S.D. Electromagnetic field: A novel tool to increase germination and seedling vigor of conserved onion (Allium cepa L.) and rice (Oryza sativa L.) seeds with low viability. Plant Gen. Res. Newslett. 1995, 104, 1–5. [Google Scholar]
- Yinan, L.; Yuan, L.; Yongquing, Y.; Chunyang, L. Effect of seed pre-treatment by magnetic field on the sensitivity of cucumber (Cucumis sativus) seedlings to ultraviolet-B radiation. Environ. Exp. Bot. 2005, 54, 286–294. [Google Scholar]
- Cakmak, T.; Dumlupinar, R.; Erdal, S. Acceleration of germination and early growth of wheat and bean seedlings grown under various magnetic field and osmotic conditions. Bioelectromagnetics 2010, 31, 120–129. [Google Scholar] [CrossRef] [PubMed]
- Vashisth, A.; Nagarajan, S. Effect on germination and early growth characteristics in sunflower (Helianthus annuus) seeds exposed to static magnetic field. J. Plant Physiol. 2010, 167, 149–156. [Google Scholar] [CrossRef]
- Shine, M.B.; Guruprasad, K.N. Impact of pre-sowing magnetic field exposure of seeds to stationary magnetic field on growth, reactive oxygen species and photosynthesis of maize under field conditions. Acta Physiol. Plant. 2012, 34, 255–265. [Google Scholar] [CrossRef]
- Kataria, S.; Baghel, L.; Guruprasad, K.N. Acceleration of germination and early growth characteristics of soybean and maize after pre-treatment of seeds with static magnetic field. Int. J. Trop. Agri. 2015, 33, 985–992. [Google Scholar]
- Sarraf, M.; Deamici, K.M.; Taimourya, H.; Islam, M.; Kataria, S.; Raipuria, R.K.; Abdi, G.; Brestic, M. Effect of magnetopriming on photosynthetic performance of plants. Int. J. Mol. Sci. 2021, 22, 9353. [Google Scholar] [CrossRef]
- Shine, M.B.; Guruprasad, K.N.; Anjali, A. Enhancement of germination, growth and photosynthesis in soybean by pre-treatment of seeds with magnetic field. Bioelectromagnetics 2011, 32, 474–484. [Google Scholar] [CrossRef] [PubMed]
- Kataria, S.; Baghel, L.; Guruprasad, K.N. Alleviation of adverse effects of ambient UV stress on growth and some potential physiological attributes in soybean (Glycine max) by seed pretreatment with static magnetic field. J. Plant Growth Regul. 2017, 36, 550–565. [Google Scholar] [CrossRef]
- Kataria, S.; Jain, M.; Rastogi, A.; Brestic, M. Static magnetic field treatment enhanced photosynthetic performance in soybean under supplemental ultraviolet-B radiation. Photosyn. Res. 2021, 150, 263–278. [Google Scholar] [CrossRef] [PubMed]
- Kataria, S.; Baghel, L.; Jain, M.; Guruprasad, K.N. Magnetopriming regulates antioxidant defense system in soybean against salt stress. Biocatal. Agric. Biotechnol. 2019, 18, 101090. [Google Scholar] [CrossRef]
- Baghel, L.; Kataria, S.; Guruprasad, K.N. Effect of SMF pretreatment on growth, photosynthetic performance and yield of soybean under water stress. Photosynthetica 2018, 56, 718–730. [Google Scholar] [CrossRef]
- Hiscox, J.D.; Israelstam, G.F. A method for the extraction of chlorophyll from leaf tissue without maceration. Can. J. Bot. 1979, 57, 1332–1334. [Google Scholar] [CrossRef]
- Wellburn, A.R. The spectral determination of chlorophylls a and b, as well as total Carotenoids, using various solvents with spectrophotometers of different resolution. J. Plant Physiol. 1994, 144, 307–313. [Google Scholar] [CrossRef]
- Strasser, R.J.; Micheal, T.; Srivastava, A. The fluorescence transient as a tool to characterize and screen photosynthetic samples. In Probing Photosynthesis: Mechanisms, Regulation and Adaptation; Yunus, M., Pathre, U., Mohanty, P., Eds.; Taylor and Francis: London, UK, 2000; pp. 445–483. [Google Scholar]
- Strasser, R.J.; Micheal, T.; Srivastava, A. Analysis of the chlorophyll a fluorescence transient. In A Signature of Photosynthesis, Advances in Photosynthesis and Respiration; Papageorgiou, G.C., Govindjee, Eds.; Springer: Dordrecht, The Netherlands, 2004; pp. 321–362. [Google Scholar]
- Li, W.; Yu, L.; Yuan, D.; Xu, H.B.; Yang, Y. Bacteria biomass and carbonic anhydrase activity in some karst areas of Southwest China. J. Asian Earth Sci. 2004, 24, 145–152. [Google Scholar] [CrossRef]
- Maehly, A.C. Plant peroxidases. In Methods in Enzymology; Colowick, P.S., Kaplan, N.O., Eds.; Academic Press: New York, NY, USA, 1955; Volume II, pp. 271–285. [Google Scholar]
- Nakano, Y.; Asada, K. Purification of ascorbate peroxidase in spinach chloroplasts: Its inactivation in ascorbate-depleted medium and reactivation by mono dehydroascorbate radical. Plant Cell Physiol. 1987, 28, 131–140. [Google Scholar]
- Beauchamp, C.O.; Fridovich, I. Superoxide dismutase: Improved assays and an assay applicable to acrylamide gels. Anal. Biochem. 1971, 44, 276–287. [Google Scholar] [CrossRef] [PubMed]
- Aebi, H.E. Catalase. In Methods of Enzymatic Analysis, 3rd ed.; Bergmeyer, H.U., Ed.; Verlag Chemie: Weinhem, Germany, 1983; pp. 273–286. [Google Scholar]
- Arakawa, N.; Tsutsumi, K.; Sanceda, N.G.; Kurata, T.; Inagaki, C. A rapid and sensitive method for determination of ascorbic acid using 4,7-Diphenyl-l,10-bathophenanthroline. Agric. Biol. Chem. 1981, 45, 1289–1290. [Google Scholar]
- Kataria, S.; Dehariya, P.; Guruprasad, K.N.; Pandey, G.P. Effect of exclusion of ambient solar UV-A/B components on growth and antioxidant response of cotton (Gossypium hirsutum L.). Acta Biol. Crac. Ser. Bot. 2012, 54, 47–53. [Google Scholar] [CrossRef]
- Heath, R.L.; Parker, L. Photoperoxidation in isolated chloroplasts. I. Kinetics Stoichiometry of fatty acid peroxidation. Arch. Biochem. Biophys. 1968, 125, 189–198. [Google Scholar] [CrossRef]
- Jun, H.K.; Sarath, G.; Wagner, F.W. Detection and purification of modified leghemoglobins from soybean root nodules. Plant Sci. 1994, 100, 31–40. [Google Scholar] [CrossRef]
- Lowry, O.H.; Rosebrough, N.J.; Farr, A.L.; Randall, R.J. Protein measurement with the folin phenol reagent. J. Biol. Chem. 1951, 193, 265–275. [Google Scholar] [CrossRef]
- Appleby, C.A.; Bergersen, F.J. Preparation and experimental use of leghaemoglobin. In Methods of Evaluating Biological Nitrogen Fixation; Bergersen, F.J., Ed.; Wiley: Chichester, UK, 1980; pp. 315–335. [Google Scholar]
- Jaworski, E.K. Nitrate reductase assay in intact plant tissues. Biochem. Biophys. Res. Commun. 1971, 43, 1274–1279. [Google Scholar] [CrossRef]
- Noorudeen, A.M.; Kulandaivelu, G. On the possible site of inhibition of photosynthetic electron transport by UV-B radiation. Physiol. Plant 1982, 55, 161–166. [Google Scholar] [CrossRef]
- Troll, W.; Cannan, R.K. A modified photometric ninhydrin method for the analysis of amino and imino acids. J. Biol. Chem. 1953, 200, 803–811. [Google Scholar] [CrossRef]
- Bhardwaj, J.; Anand, A.; Nagarajan, S. Biochemical and biophysical changes associated with magnetopriming in germinating cucumber seeds. Plant Physiol. Biochem. 2012, 57, 67–73. [Google Scholar] [CrossRef]
- Bilalis, D.; Katsenios, N.; Efthimiadou, A.; Karkanis, A.; Efthimiadis, P. Investigation of pulsed electromagnetic field as a novel organic pre-sowing method on germination and initial growth stages of cotton. Electromagn. Biol. Med. 2011, 31, 143–150. [Google Scholar] [CrossRef] [PubMed]
- Vashisth, A.; Nagarajan, S. Exposure of seeds to static magnetic field enhances germination and early growth characteristics in chickpea (Cicer arietinum L.). Bioelectromagnetics 2008, 29, 571–578. [Google Scholar] [CrossRef] [PubMed]
- Dayal, S.; Singh, R.P. Effect of seed exposure to magnetic field on the height of tomato plants. Indian J. Agric. Sci. 1986, 56, 483–486. [Google Scholar]
- Faqenabi, F.; Tajbakhsh, M.; Bernoosi, I.; Saber-Rezaii, M.; Tahri, F.; Parvizi, S.; Izadkhah, M.; Gorttapeh, A.H.; Sedqi, H. The effect of magnetic field on growth, development and yield of safflower and its comparison with others treatments. J. Biol. Sci. 2009, 4, 174–178. [Google Scholar]
- Podlesny, J.; Pietruszewski, S.; Podlesna, A. Efficiency of the magnetic treatment of broad bean seeds cultivated under experimental plot conditions. Int. Agrophys. 2004, 18, 65–71. [Google Scholar]
- Bukhari, S.A.; Tanveer, M.; Mustafa, G.; Zia-Ud-Den, N. Magnetic field stimulation effect on germination and antioxidant activities of presown hybrid seeds of sunflower and its seedlings. J Food Qual. 2021, 2021, 5594183. [Google Scholar] [CrossRef]
- Vashisth, A.; Meena, N.; Krishnan, P. Magnetic field affects growth and yield of sunflower under different moisture stress conditions. Bioelectromagnetics 2021, 42, 473–483. [Google Scholar] [CrossRef]
- Shabrangy, A.; Ghatak, A.; Zhang, S.; Priller, A.; Chaturvedi, P.; Weckwerth, W. Magnetic field induced changes in the shoot and root proteome of barley (Hordeum vulgare L.). Front. Plant Sci. 2021, 12, 622795. [Google Scholar] [CrossRef]
- Aladjadjiyan, A. Study of the influence of magnetic field on some biological characteristics of Zea mays. J. Cent. Euro. Agric. 2002, 3, 89–94. [Google Scholar]
- Shabrangi, A.; Majd, A.; Sheidai, M.; Nabyouni, M.; Dorranian, D. Comparing effects of extremely low frequency electromagnetic fields on the biomass weight of C3 and C4 plants in early vegetative growth. InProgress In Electromagnetics Research Symposium Proceedings; The Electromagnetics Academy, Cambridge, USA, 2010; pp. 593–598.
- Grewal, H.S.; Maheshwari, B.L. Magnetic treatment of irrigation water and snow pea and chickpea seeds enhances early growth and nutrient contents of seedlings. Bioelectromagnetics 2011, 32, 58–65. [Google Scholar] [CrossRef]
- Lebedev, I.S.; Litvinenko, L.G.; Shiyan, L.T. After-effect of a permanent magnetic field on photochemical activity of chloroplasts. Sov. Plant Physiol. 1977, 24, 394–395. [Google Scholar]
- Saktheeswari, N.; Subrahmanyam, S. Effects of pulsed magnetic field on histology, biochemistry and magnetotropism of paddy (Oryza sativa). Bioelectromag. Biomed. 1989, 2, 37–44. [Google Scholar]
- Dhawi, F.; Al-Khayari, J.M. Magnetic fields induce changes in photosynthetic pigments content in date palm (Phoenix dactylifera L.) seedlings. Open Agri. J. 2009, 3, 1–5. [Google Scholar] [CrossRef]
- Atak, Ç.; Çelik, Ö.; Olgun, A.; Alikamanoğlu, S.; Rzakoulieva, A. Effect of magnetic field on peroxidase activities of soybean tissue culture. Biotechnology 2007, 21, 166–171. [Google Scholar] [CrossRef]
- Maxwell, K.; Johnson, G.N. Chlorophyll fluorescence-a practical guide. J. Exp. Bot. 2000, 51, 659–668. [Google Scholar] [CrossRef] [PubMed]
- Govindjee. Sixty-three years since Kautsky: Chlorophyll a fluorescence. Australian J. Plant Physiol. 1995, 22, 131–160.
- Strasser, R.J.; Srivastava, A.; Govindjee. Polyphasic chlorophyll a fluorescence transients in plants and cyanobacteria. Photochem. Photobiol. 1995, 61, 32–42. [Google Scholar] [CrossRef]
- Wise, R.R.; Naylor, R.A. Chilling enhanced photooxidation. Evidence for the role of singlet oxygen and superoxide in the breakdown of pigments and endogenous antioxidants. Plant Physiol. 1987, 83, 272–277. [Google Scholar] [CrossRef]
- Foyer, C.H.; Lopez-Delgado, H.; Dat, J.E.; Scott, I.M. Hydrogen peroxide and glutathione- associated mechanisms of acclimatory stress tolerance and signaling. Physiol. Plant 1997, 100, 241–254. [Google Scholar] [CrossRef]
- Shine, M.B.; Guruprasad, K.N.; Anjali, A. Superoxide radical production and performance index of Photosystem II in leaves from magnetoprimed soybean seeds. Plant Signal. Behav. 2011, 6, 1635–1637. [Google Scholar]
- Muraji, M.; Asai, T.; Wataru, T. Primary root growth rate of Zea mays seedlings grown in an alternating magnetic field of different frequencies. Bioelectrochem. Bioenerget. 1998, 44, 271–273. [Google Scholar] [CrossRef]
- Jin, Y.; Guo, W.; Hu, X.; Liu, M.; Xu, X.; Hu, F.; Lan, Y.; Lv, C.; Fang, Y.; Liu, M.; et al. Static magnetic field regulates Arabidopsis root growth via auxin signaling. Sci. Rep. 2019, 9, 14384. [Google Scholar] [CrossRef] [PubMed]
- Gurumoorthi, P.; Senthil Kumar, S.; Vadivel, V.; Janardhnan, K. Studies on agro botanical characters of different accessions of velvet bean collected from Western Ghats, South India. Trop. Subtrop. Agroecosystems 2003, 2, 105–115. [Google Scholar]
- Radhakrishnan, R.; Kumari, B.D.R. Influence of pulsed magnetic field on soybean (Glycine max L.) seed germination, seedling growth and soil microbial population. Indian J. Biochem. Biophys. 2013, 50, 312–317. [Google Scholar] [PubMed]
- Bhatnagar, D.; Deb, A.R. Some effect of pre-germination exposure of wheat seeds to magnetic fields: Effect on some physiological process. Seed Res. 1977, 5, 129–137. [Google Scholar]
- Galland, P.; Pazur, A. Magnetoreception in plants. J. Plant Res. 2005, 118, 371–389. [Google Scholar] [CrossRef]
- Kataria, S.; Jain, M.; Tripathi, D.K.; Singh, V.P. Involvement of nitrate reductase-dependent nitric oxide production in magnetopriming-induced salt tolerance in soybean. Physiol. Plant 2020, 168, 422–436. [Google Scholar] [CrossRef]
- Chen, Y.-p.; Li, R.; He, J.M. Magnetic field can alleviate toxicological effect induced by cadmium in mungbean seedlings. Ecotoxicology 2011, 20, 760–769. [Google Scholar] [CrossRef]
- Latef, A.A.H.A.; Dawood, M.F.; Hassanpour, H.; Rezayian, M.; Younes, N.A. Impact of the static magnetic field on growth, pigments, osmolytes, nitric oxide, hydrogen sulfide, phenylalanine ammonia-lyase activity, antioxidant defense system, and yield in lettuce. Biology 2020, 9, 172. [Google Scholar] [CrossRef]


| Measured Parameters | Control | 150 mT | 200 mT |
|---|---|---|---|
| Fo = F0–20µs | 164 ± 4.13 | 161 ± 7.18 | 162 ± 7.64 |
| FJ = F2ms | 671 ± 34.76 | 645 ±15.53 | 613 ± 54.34 |
| FI = F30ms | 739 ±16.03 | 794 ± 28.72 | 816 ± 21.94 * |
| FP = FM | 938 ± 19.47 | 1029 ± 14.25 | 1088 ± 21.93 * |
| Fv/Fm | 0.825 ± 0.003 | 0.844 ± 0.005 | 0.851 ± 0.009 |
| (dV/dt)o = Mo | 1.25 ± 0.043 | 1.04 ± 0.059 | 0.907 ± 0.106 * |
| TRo/CSm | 718 ± 14.15 | 814 ± 6.73 | 877 ± 31.66 |
| ETo/CSm | 267 ± 18.38 | 384 ± 6.95 * | 475 ± 74.02 ** |
| DIo/CSm | 219 ± 6.26 | 214 ± 10.96 | 210 ± 11.27 |
| PI | 0.922 ± 0.922 | 1.641 ± 0.146 ** | 2.329 ± 0.679 *** |
| Parameter | Control | 150 mT | 200 mT |
|---|---|---|---|
| Protein (mg/g fresh weight of nodules) | 5.2195 ± 0.0372 | 6.5975 ± 0.0902 (26.4%) ** | 6.779 ± 0.0894 (29.9%) ** |
| Leghemoglobin content (mg/g nodule fresh weight) | 0.3728 ± 0.0186 | 0.4608 ± 0.023 (23.6%) * | 0.472 ± 0.0236 (26.6%) ** |
| Hemechrome content (nmol/g fresh weight of nodules) | 0.0923 ± 0.0046 | 0.1077 ± 0.0053 (16.7%) * | 0.1111 ± 0.0055 (20.3%) * |
Disclaimer/Publisher’s Note: The statements, opinions and data contained in all publications are solely those of the individual author(s) and contributor(s) and not of MDPI and/or the editor(s). MDPI and/or the editor(s) disclaim responsibility for any injury to people or property resulting from any ideas, methods, instructions or products referred to in the content. |
© 2023 by the authors. Licensee MDPI, Basel, Switzerland. This article is an open access article distributed under the terms and conditions of the Creative Commons Attribution (CC BY) license (https://creativecommons.org/licenses/by/4.0/).
Share and Cite
Joshi-Paneri, J.; Sharma, S.; Guruprasad, K.N.; Kataria, S. Enhancing the Yield Potential of Soybean after Magneto-Priming: Detailed Study on Its Relation to Underlying Physiological Processes. Seeds 2023, 2, 60-84. https://doi.org/10.3390/seeds2010006
Joshi-Paneri J, Sharma S, Guruprasad KN, Kataria S. Enhancing the Yield Potential of Soybean after Magneto-Priming: Detailed Study on Its Relation to Underlying Physiological Processes. Seeds. 2023; 2(1):60-84. https://doi.org/10.3390/seeds2010006
Chicago/Turabian StyleJoshi-Paneri, Juhie, Sonika Sharma, Kadur. N. Guruprasad, and Sunita Kataria. 2023. "Enhancing the Yield Potential of Soybean after Magneto-Priming: Detailed Study on Its Relation to Underlying Physiological Processes" Seeds 2, no. 1: 60-84. https://doi.org/10.3390/seeds2010006