
Density-Based Optimization of the Laser Powder Bed Fusion Process Based on a Modelling Framework

Laboratory of Technology and Strength of Materials, Department of Mechanical Engineering & Aeronautics, University of Patras, 26504 Rion, Greece
*
Author to whom correspondence should be addressed.
Alloys 2023, 2(1), 55-76; https://doi.org/10.3390/alloys2010004
Submission received: 23 December 2022
/
Revised: 1 February 2023
/
Accepted: 17 February 2023
/
Published: 27 February 2023
(This article belongs to the Collection Feature Paper Collection of Advanced Research on Alloys)
Abstract
:One of the main challenges encountered in the Laser-based Powder Bed Fusion (L-PBF) Additive Manufacturing (AM) process is the fabrication of defect-free parts. The presence of defects severely degrades the mechanical performance of AM parts and especially their fatigue strength. The most popular and reliable method to assess the ability of the employed process parameters for the fabrication of full-density parts is the process windows map, also known as printability map. However, the experimental procedure for the design of the printability maps and the identification of the optimum-density process parameters is usually time-consuming and expensive. In the present work, a modelling framework is presented for the determination of a printability map and the optimization of the L-PBF process based on the prediction and characterization of melt-pool geometric features and the prediction of porosity of small samples of 316L SS and Ti-6Al-4V metal alloys. The results are compared with available experimental data and present a good correlation, verifying the modelling methodology. The suitability of the employed defect criteria for each material and the effect of the hatch-spacing process parameter on the optimum-density parameters are also presented.
1. Introduction
Additive Manufacturing (AM) methods are getting more and more integrated into industrial processes [1,2]. Expect for the fabrication of structural parts, AM methods are utilized in a wide variety of activities, such as the repair of damaged elements or the replacement of fractured high-value components [3,4]. The advantages of AM processes result from the layer-by-layer fabrication guided by the input digital model of the part. Among the AM processes, the Laser-based Powder Bed Fusion (L-PBF) process has been widely adopted in the aerospace, automotive, medical and other industrial sectors [5] due to its abilities to use a wide variety of popular metal alloys and to produce very intricate structures that combine high strength with low weight.
Despite their ongoing integration in the industry, metal AM technologies have still many challenges to tackle in order to take advantage of their full potential. In the case of L-PBF, one challenge is the minimization of the presence of defects which mostly are formed in three specific ways: transfer from the feedstock powder, the laser–powder–metal interaction during melting and post-processing treatments [6,7,8,9]. Defects have been recognized as one the main contributors to the variability in the mechanical properties of metal AM materials and affect detrimentally the fatigue and fracture behavior of AM materials, as they act as stress concentrators [10,11,12,13,14,15,16,17]. The main categories of internal defects found in L-PBF process are gas porosity, lack-of-fusion, keyhole porosity and balling [17,18,19]. The formation mechanism of these defects can be either systematic or stochastic [20]. Systematic defects are a consequence of the L-PBF process build plan; the geometrical features of the built part, the selection of process parameters combination and the scanning pattern. In contrast, the likelihood of formation of stochastic defects is not governed by conditions that can be systematically controlled. The formation mechanism of the mentioned internal defects can be either systematic or stochastic, except for the gas porosity defects, which are purely stochastic [20].
Gas pores are usually spherical and considered to originate either from the release of gas trapped in the powder during the gas atomization process or from gas bubble nucleation in the melt pool due to the high solubility of interstitial elements in the liquid phase coupled with rapid solidification [21,22,23,24]. Lack-of-fusion (LOF) porosity happens at the conduction mode, and it can be characterized as the insufficient penetration of the melt pool tracks into the previous layer due to inadequate energy input level or insufficient overlapping between melt tracks of the same layer [6,18]. Keyhole porosity can be attributed to instabilities due to high heat energy inputs that cause vaporization and the formation of deep V-shaped melt pools [22,25]. Balling is formed by the capillary instabilities of the melt pool and can be described as a periodic change in the size and shape of solidified track, known also as “beading-up” [26]. Regarding their morphology, LOF defects are usually characterized by irregular shapes with pronounced sharpness, while keyhole pores usually have a spherical shape with a larger size [27].
LOF, keyhole and balling defects are closely correlated to the molten pool behavior and characteristics. In particular, melt pool width, depth and length are the geometrical characteristics that are examined to assess the potential of porosity formation as a function of certain process parameter combinations and consequently the design of L-PBF printability maps [28]. Printability maps—known also as “process window maps” or “process maps” [29,30]—are diagrams of processing parameters that are used to identify the combinations of parameters that result in certain features of interest [31,32], on most occasions in the fabrication of full-density parts. For density-purposed printability maps, laser power (P), scan velocity(v), layer thickness (t) and hatch spacing (h) are the process parameters of interest of many studies and of the present work.
Since the L-PBF process has its origins in high-energy beam welding processes, the most common practice to determine a printability map for an AM metal material alloy is to make single laser scan experiments to determine the effect of process parameters on the morphology of scan tracks [32,33,34,35]. Then, the characterized set of process parameters is used for the fabrication of small samples to determine the amount and the type of resulting porosity [32,33]. These approaches are well-studied in literature and usually give a satisfactory characterization. However, they require sufficiently large numbers of experiments usually based on a statistical design and they are dependent of the properties of raw material feedstock. Furthermore, it is an expensive approach, as with a change of one factor, a new set of experiments must be conducted.
Modelling methods for the design of printability maps utilize both analytical and numerical approaches. Analytical modelling approaches include Rosenthal’s solution [36,37], the Eager–Tsai model [18,38] and the Carslaw and Jaeger moving-heat model [39,40,41]. These methods determine the melt pool characteristics from the estimation of temperature fields and based on the melt pool criteria they characterize the process parameter combinations. Recently, these methods have been utilized to predict the LOF and keyhole defects and to determine their thresholds, with promising results [39,40,41]. However, the accuracy of thermal solutions is limited, as they are based on assumptions that neglect the dimensions, the layer deposition and the thermal transfer phenomena that occur during the process. On the other hand, numerical modelling methods such computational fluid dynamics (CFD) and finite element methods are more accurate but less cost-efficient. CFD numerical schemes can be used to describe the melt pool and porosity formation [42] at the microlevel, based on the laser processing parameters, but their computational cost is huge [43,44]. Finite element-based models can be used for the prediction of melt pool dimensions in both single-scan tracks and small samples, providing useful insights into the driving mechanisms of porosity formation [45,46]. These models have been successfully implemented in the prediction of LOF defects and can provide directions for process optimization [47]. Nevertheless, their computational cost, considering the simulation of multiple sets, is also high. Moreover, all the aforementioned modelling approaches need experimental test campaigns to provide data in order to ensure their accuracy or to calibrate them.
The current work presents a modelling framework for the design of printability maps and the density-based optimization of the L-PBF process. The finite element-based modelling framework consists of two parts: a single laser scan and small-samples modelling. In the first part, the thermal modelling and simulation of a single laser scan is performed, and the melt pool dimensions are predicted as a function of the main L-PBF process parameters. Melt pools are characterized based on literature geometric criteria for LOF, keyhole and balling porosity formation. Then, the process map is designed and the full-density optimum region is determined. The set of process parameters in the optimum region is used for the thermal modelling of the fabrication of small samples. The resulting porosity is predicted and the boundaries between the optimum region and the LOF region in the process map are meticulously determined. The results of the modelling framework are compared with the available literature data for 316L SS and Ti-6Al-4V metal material alloys for validation purposes. Furthermore, for each material, the criteria of melt pool characterization and the variation of the optimum process parameters region with the hatch spacing are evaluated.
2. Materials and Methods
2.1. Modelling Framework
2.1.1. Framework Outline
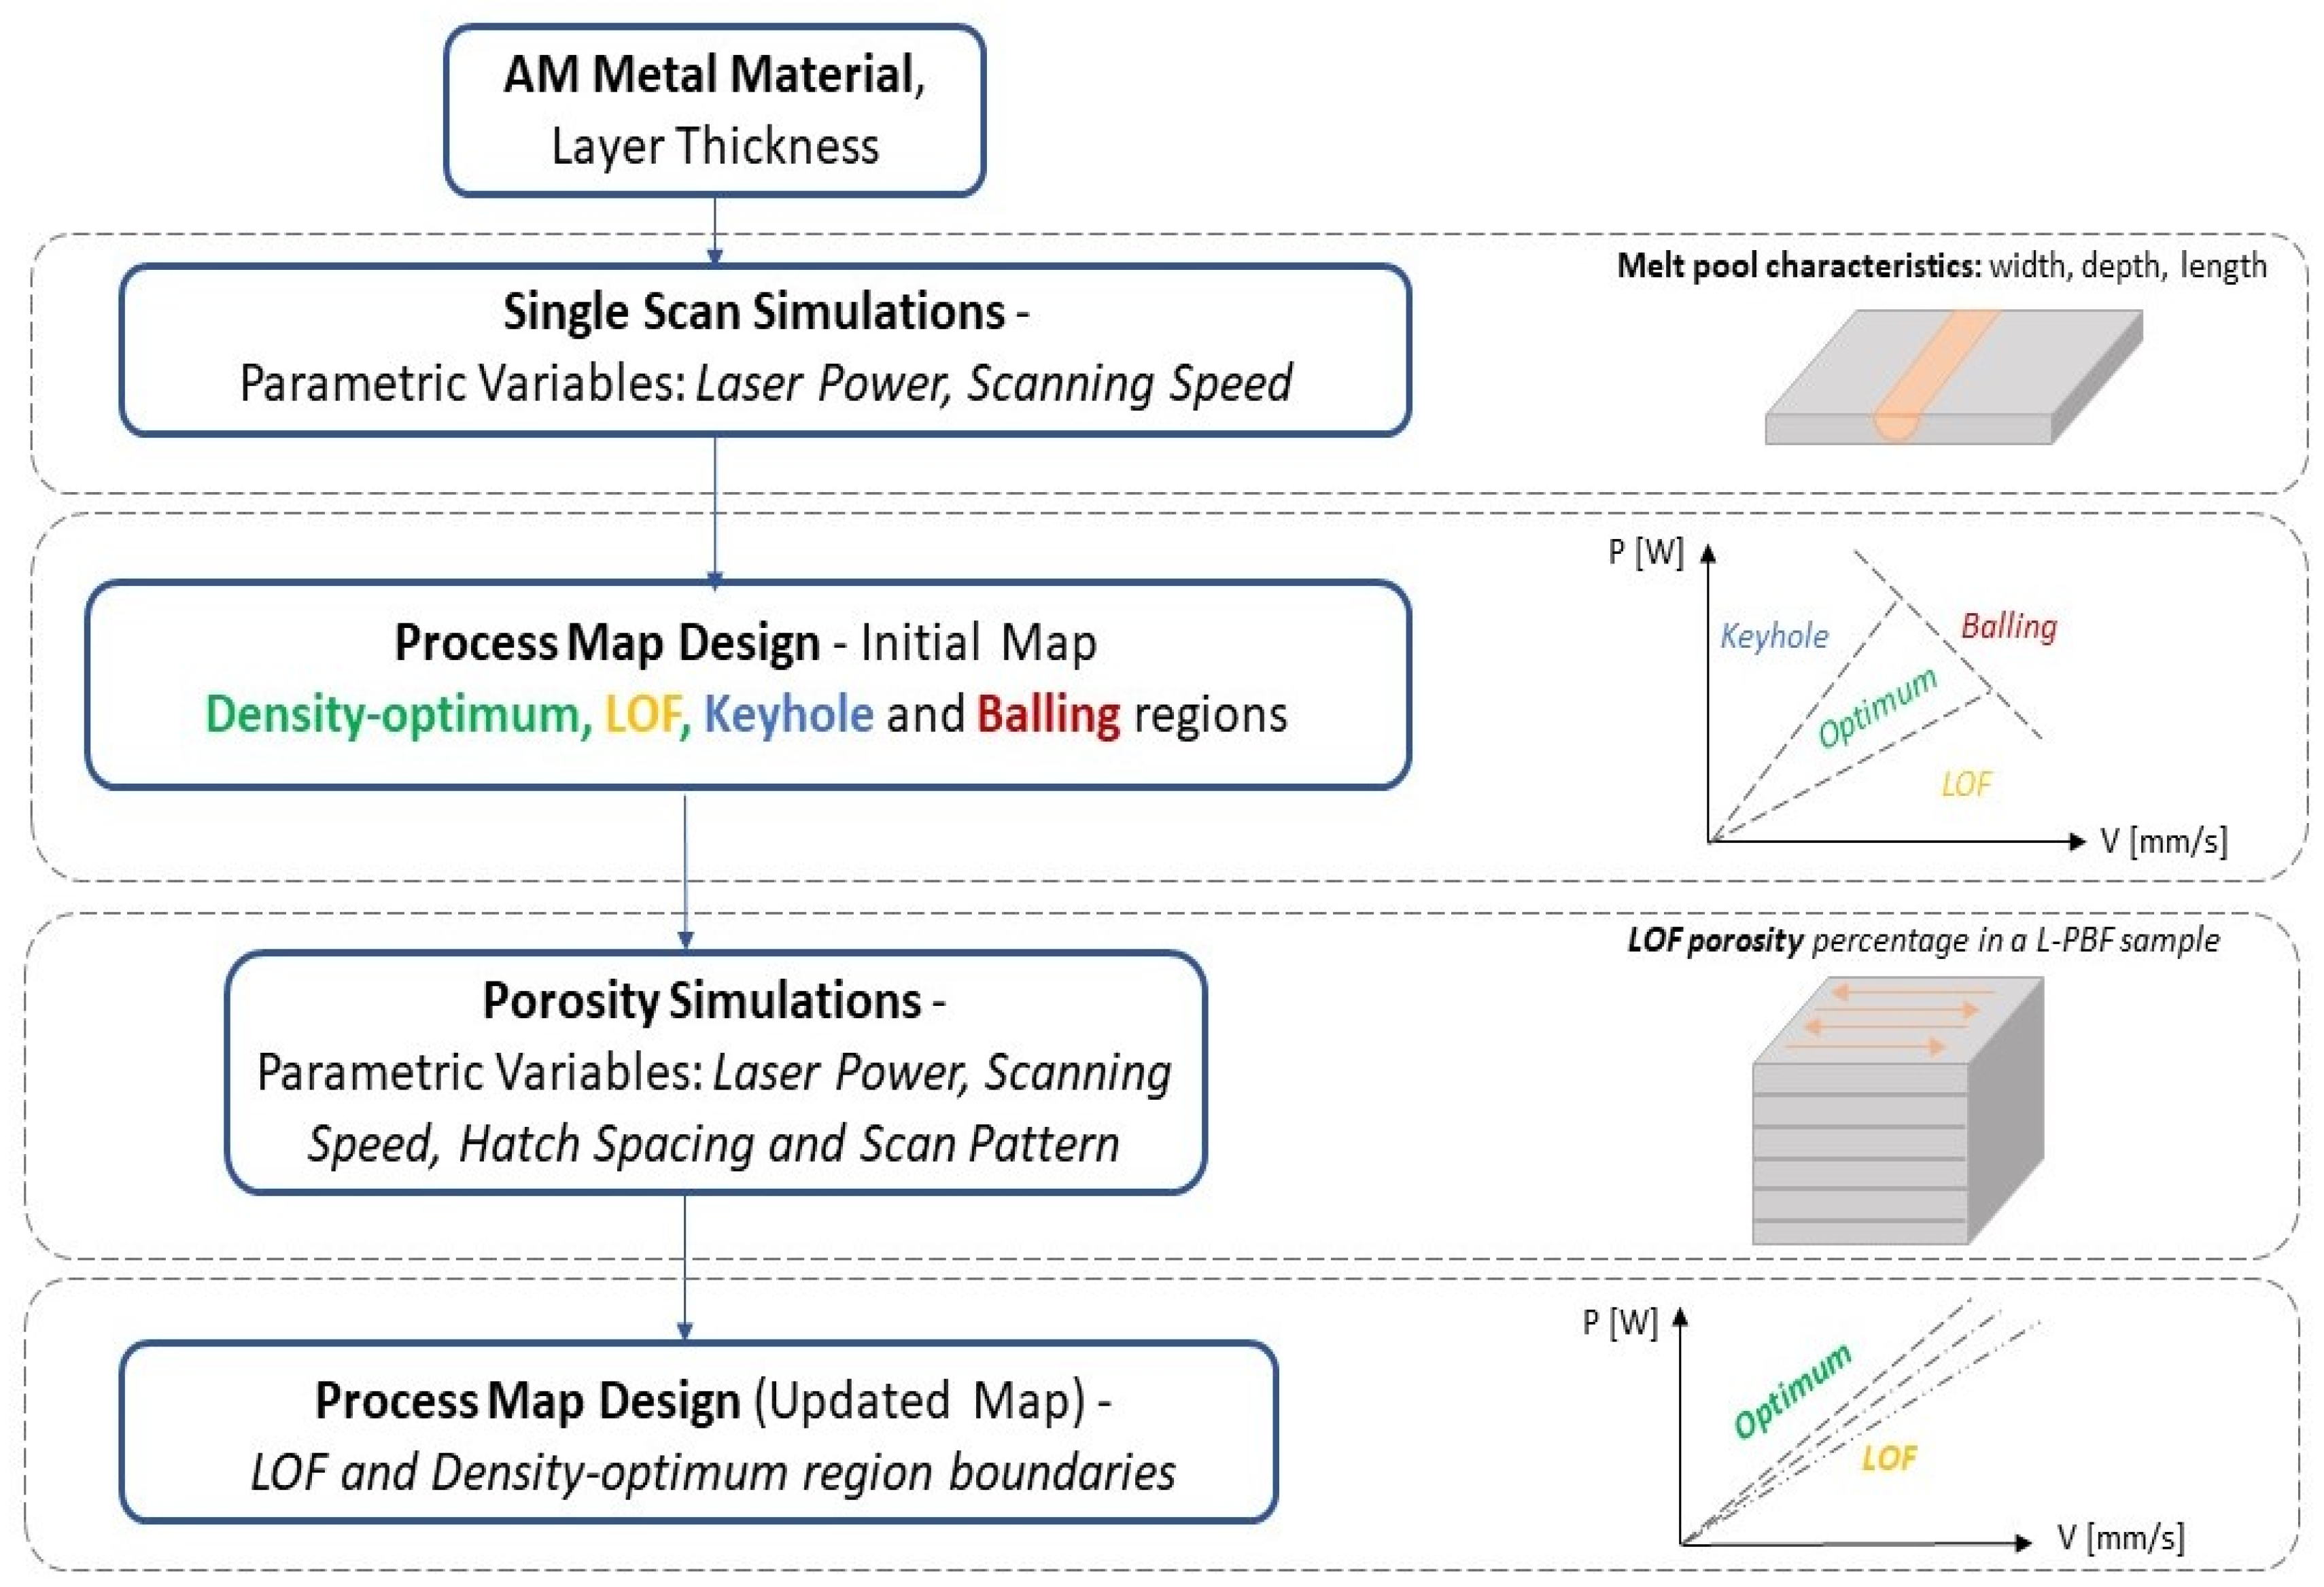
The flowchart of the proposed framework for the design of the printability map and optimization of the L-PBF process is presented in Figure 1. The optimization of the L-PBF process based on the presented modelling procedure aims at the determination of the main process parameters that lead to the formation of full-density materials and parts. The predicted melt pool characteristics as a function of process parameters are used as an index for defect formation, and the identified optimum process parameters are subsequently assessed via a detailed simulation of the L-PBF process for porosity formation in small samples. At the first step of analysis, the layer thickness and the material properties of the AM metal alloy of interest are used as inputs for the subsequent modelling procedures. The layer thickness is selected, based first on the required precision/performance relationship of the build part [48]. Nevertheless, according to the investigation of Gong et al. [9], the powder layer has little impact on the molten pool size and shape, which are the focus of interest in the present analysis. At the second step of analysis, single-bead parametric simulations are performed for various combinations of laser power-scanning speed parameters. The main outputs of these simulations are the melt pool dimensions (melt pool length, width and depth). Then, these characteristics are assessed by criteria found in the literature. Based on the melt pool size, these criteria can characterize the proneness of the utilized process parameters on the formation of various types of porosity or their ability to fabricate full-density parts. Then, the initial printability map of the metal alloy is designed. The optimum-density parameters are identified, as well as the regions of LOF, keyhole and balling porosity. At the next step of analysis, the optimum-density parameters are used as an input to the thermal simulation of the L-PBF process for the fabrication of small samples. This parametric simulation is aimed at the prediction of the percentage of LOF porosity in small samples. In this fashion, the optimum-density parameters are further evaluated in the production of full-density small samples and the printability map of the metal alloy is updated. Finally, a group of porosity simulations is performed with hatch spacing as a parametric variable. The effect of hatch spacing on the span of the region of optimum-density parameters is evaluated. More details for each analysis step are provided in the next sections. It should be mentioned that the proposed methodology for optimization focuses mainly on the process parameters which are related to the scan strategy of the L-PBF process, as these parameters have been highlighted as the most important for the formation of typical defects [6,8,9]. To include the effect of the rest of the process parameters would result to an unnecessary enormous increase of complexity and computational cost.
In the present work, the modelling and simulation of both single-bead and sample porosity are performed in ANSYS 2020R2 Additive Science Suite [49]. ANSYS Additive Science is a finite element-based software that can be used to perform thermal simulations that predict melt pool characteristics and porosity in AM metal materials. The software is used to predict only the LOF porosity in small samples, as the modelling of the keyhole and balling phenomena would need to model the flow in the melt pool region, a task that cannot be employed in an efficient modelling approach [43]. Ti-6Al-4V and 316L SS AM metal alloys have been studied in the present work. Ti-6Al-4V has been widely studied in AM and applied in many industrial sectors due to its high strength, low density, and corrosion-resistance biocompatibility [6,9,30,32,50]. Additive-manufactured Ti-6Al-4V alloy has been characterized by α-lath size, prior-β grain size/morphology microstructural features and irregular-shaped defects [30], while additive-manufactured 316L SS is an austenitic stainless steel with occasionally a small fraction of δ-ferrite due to Mo and Cr segregation at grain boundaries when relatively lower cooling rates are involved [51].
2.1.2. Single Laser Scan Modelling and Simulation
Experimental and numerical literature works have shown that the melt pool characteristics of a single track can be correlated with the formed porosity in bulk samples [32,33].
Despite the considerable differences of the process conditions between the single laser scanning and the multi-layered part fabrication, the melt tracks in the single laser scans can provide an insight into the melt pool behavior and its size as a function of the utilized process parameters. This is very helpful in the selection of the initial combination of process parameters, especially in the early stages of the scan strategy design. For this reason, the melt pool characteristics of a single laser scan have been considered as indicators for the determination of the regions of laser power-scanning speed printability maps [29,30,52,53]. In particular, melt pool width (W), depth (D), and length (L) of a single laser track can be utilized to identify the potential for the formation of defects in L-PBF parts. To predict these melt pool characteristics, single laser track modelling and simulation must be performed over a wide range of process parameters combination. For every process parameter combination, the resulting melt pool geometry is assessed by literature criteria and the regions in the process map are initially determined.
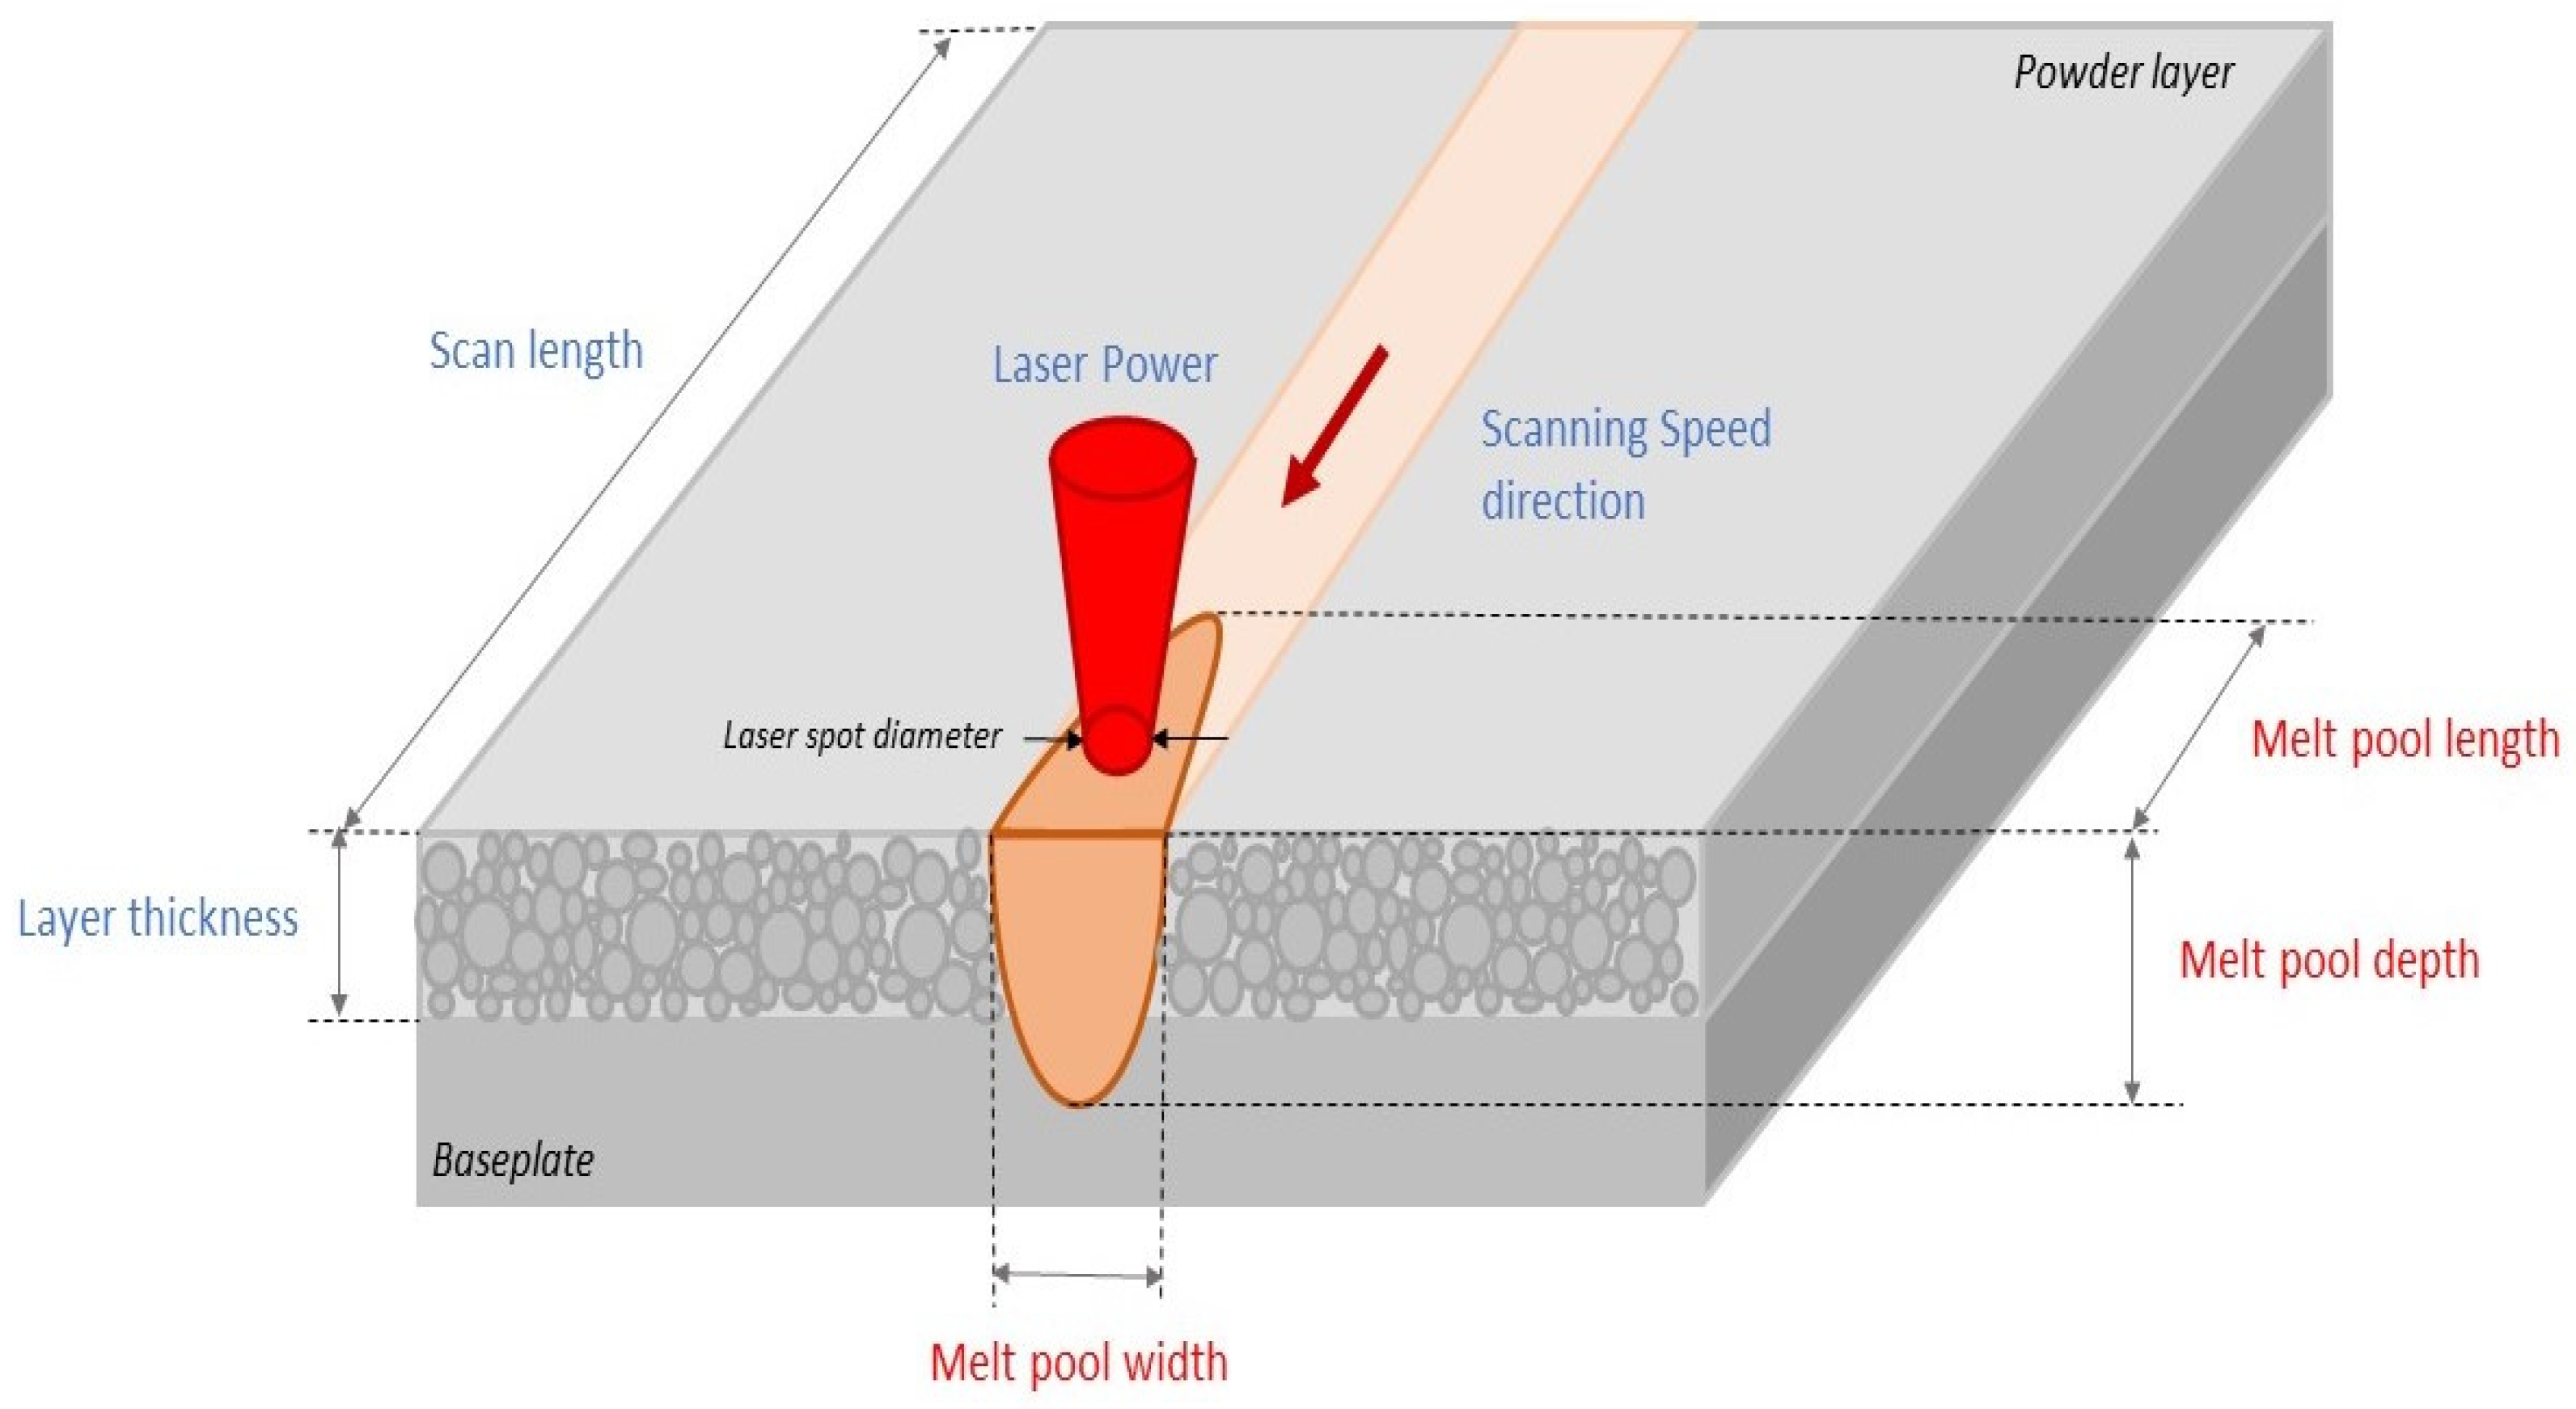
The main inputs of the finite element model of single bead simulation are the baseplate temperature, laser beam diameter, layer thickness as the constant values and the laser power and scanning speed as the parametric variables. Temperature-dependent thermal material properties of the software database are utilized for the simulation. The main outputs of the simulation are the melt pool dimensions: length, width and depth. The schematic description between the melt pool dimensions and the input laser parameters is presented in the Figure 2.
Compared with other literature modelling approaches of a single laser track, finite element modelling considers most of the process parameters and temperature-dependent material properties of metal alloys contrary to simplified thermal analytical models. Analytical models are usually utilized for a fast prediction based on assumptions that simplify the calculation of the thermal fields but may lead to melt pool prediction inaccuracies [18,19,20,21,22,23,24,25,26,27,28,29,30,31,32,33,34,35,36,37,38,39]. On the other hand, high-resolution models, such as CFD models, could be used to capture the formation mechanism of defects, but they are computationally expensive. Both of these approaches are not suitable for implementation in an efficient framework for the design of printability maps [52].
To begin with this step, the space of process parameters must be reduced from an infinite to a finite space by establishing the upper and lower bounds of scan velocity and laser power. The boundaries have been selected based on the examined process parameters space found in literature, which is based on the AM machine system capabilities. The upper and lower bounds of scan speed are 350 mm/s and 2000 mm/s, respectively, and the upper and lower bounds of laser power are 50 W and 700 W, respectively. To make the analysis as efficient as possible, the examined process parameter combinations are performed at the step 50 mm/s and 50 W for scanning speed and laser power, respectively. The resulting space of examined process parameters resembles a grid of laser power-scanning speed combinations which could be characterized as optimum-density, LOF, keyhole or balling-susceptible.
2.1.3. Criteria for Melt Pool Geometry Characterization
The predicted melt pool dimensions for every single bead simulation are assessed by criteria found in the literature, which describe the tendency to the formation of LOF, keyhole and balling porosity. The corresponding combination of laser power and scan velocity is then characterized depending on the result of the examined criteria. Most of the presented criteria are semi-empirical based on experimental observations and simple physical principles and they describe the thresholds of the melt pool dimensions beyond which the molten pool is susceptible to defect formation.
LOF porosity, also known as lack of penetration, results from incomplete fusion and is generally recognized as the outcome of inadequate penetration of energy in laser material processing, as presented in Figure 3. As a result, the melt pool depth is smaller than the powder layer thickness. Therefore, the criteria use melt pool depth and layer thickness as inputs. The proposed LOF criteria in the literature are D/t < 1 [28], D/t < 1.1 [52] and D/t < 1.5 [18]. These criteria describe the formation mechanism of LOF defects, denoting that when these equations are fulfilled the LOF defect is about to be formed.
Keyhole porosity, which is also known from laser welding, results from the high intensity laser power that melts the powder layer material and the subsequent rapid reach of vaporization temperature that generates a vapor flux on the vapor/liquid interface. The resulting recoil pressure, along with the large temperature gradient between the vapor zone and liquid zone, creates vortex flows inside the melt pool. Vortex flows around the vapor cavity opening close off this region, trapping vapor bubbles inside. The resulting porosity has the shape of a keyhole, hence the name of this kind of porosity. The formation mechanism of keyhole porosity is presented in Figure 4. The keyhole is associated with keyhole molten mode, which is characterized by large molten pool depth and high ratio of depth-to-width [53]. The proposed keyhole criteria are W ≤ 1.2 D [28], W ≤ 1.5 D [29] and W ≤ 2 D [6,8,18]. These criteria describe the formation mechanism of keyhole defects, denoting that when these equations are fulfilled the keyhole defect is about to be formed.
Balling occurs at high laser power and high scanning speed combinations, where melted liquids take the cohesive powder particles, turn them to spherical shapes and eject them from the surface of the processed layer, as presented in Figure 5. This phenomenon in commonly ascribed to the surface tension and liquid instabilities—also known as Marangoni convection and Plateau-Rayleigh capillary instabilities, respectively—of a steep melt pool shape because of quickly heated powder from the high-power energy input [19,53]. The proposed balling criterion is L/W < 2.3 [18,29]. This criterion ascribes as balling-susceptible the melt pools whose length is very long and therefore easier to be discontinued. It describes the balling defect prevention and refers to the threshold for the occurrence of balling behavior. If this equation is not satisfied, balling defects will be formed.
The summary of the criteria for each type of porosity is presented in Table 1. The capability of the presented criteria to determine the printability maps depends on each metal alloy and they are usually calibrated after the experimental measurements [29]. For this reason, different thresholds are utilized to assess their suitability for the printability map of each metal alloy and finally to choose the best-fitted criterion. The metal alloys examined in the literature with these criteria are also referred to in Table 1.
2.1.4. Porosity Simulation
After the design of the initial printability map, where the regions of the optimum process parameters and the process parameters that lead to the formation of LOF, keyhole and balling are indicated, parametric porosity simulations are performed. In porosity simulation, the L-PBF process for the fabrication of small samples is modelled and simulated. The main goal in porosity simulation is to estimate the total amount of LOF porosity in small samples fabricated with the process parameters that would be used in the fabrication of realistic components based on the preliminary deductions of the initial map. This is a detailed multi-layered analysis with multiple laser scan passes on each layer that considers the following process parameters of the L-PBF process: layer thickness, laser power, scan speed, hatch spacing and scan pattern. Here, except for the laser power and scanning velocity, hatch spacing and scan patterns can be also considered as parametric variables to assess their effect on the resulting porosity. Figure 6 schematically depicts the porosity simulation, its main inputs and outputs.
As this is an expensive computational analysis, the range of process parameters to be tested must be well chosen. For this reason, only the process parameters of the optimum-density and the LOF regions of the initial printability map are assessed. Specifically, this step can define with accuracy the boundaries between these regions of the printability map, as the analysis is capable only of the prediction and estimation of LOF porosity. Nevertheless, the boundary region between LOF and optimum parameters is the most desirable regarding the productivity of the L-PBF process because the maximum scanning speed for a specific laser power can be achieved minimizing at the same time the possibility of defect formation. Moreover, LOF pores are the most detrimental defects for the fatigue behavior of the L-PBF fabricated parts. Therefore, their elimination by the selection of well-defined optimum process parameters is of great importance, as the systematic causes of their formation can be prevented.
By the end of this step, the printability map is updated with the exact boundary between the optimum-density and the LOF region and finalized for the certain values of layer thickness, hatch spacing and the specific scan pattern.
2.1.5. Effect of Hatch Spacing on Porosity
Finally, the effect of hatch spacing on porosity can be also assessed with the present framework. In single laser tracks, hatch spacing is not included; thus, the initial map does not contain any information about its effect on the porosity. In samples porosity, hatch spacing is considered as constant without examining its influence on the process regions. However, its influence on the quality of the fabricated parts has been considered to be very significant. Hatch spacing, also known as scan spacing, is the distance between the center lines of two neighboring laser passes [54,55], as presented in Figure 6. Hatch spacing determines the overlap between two adjacent laser tracks; thus, it must be sufficient to avoid the formation of LOF pores on the plane of the processed layer. In addition, the hatch spacing size has a direct influence on the re-melting area of adjacent tracks, which in turn affects the LOF formation between the layers and also affects the resulting microstructure [56]. However, if hatch spacing size is very small, many laser scans will be performed in every layer of the part, leading to excessive production time and energy costs. Therefore, it is desirable to determine the maximum hatch spacing of the region of optimum process parameters [29]. The values of hatch spacing examined in the present analysis are 80, 100, 120 and 140 μm. These values lie within with the range proposed by Letenneur et al. [48] to achieve full-density parts.
2.2. Experimental Data
In order to validate the results of current analyses of the proposed framework, the characterization results are compared with the experimental results of the work of Liu et al. [50]. In their work, Liu et al. conducted three types of experiments (singe-track scanning, multi-track scanning and the fabrication of small samples) on Ti-6Al-4V and 316L SS materials. They used an EOS 290 system with a Yb-fiber laser with maximum laser power at 400 W and a laser spot size of 100 μm. Fourteen combinations of laser power and scanning speeds were used in the three sets of experiments to investigate the melt pool dimension and their relationship with the resulting porosity under varying process parameters. The layer thickness and the hatch spacing values were kept at 30 μm and 80 μm, respectively. For all the experiments the baseplate was heated to 100 °C. Laser scan followed a 0°- orientation with 90°-rotation on each layer scan pattern.
After their fabrication, the build samples were post-processed to facilitate the experimental observation. Cube samples were sectioned along the building direction and examined with an optical microscope to identify defects. It was found that LOF defects had an irregular shape and were placed at the boundaries of melt pools, while keyhole defects had a spherical shape and were placed near the depth of the melt pool. Near-dense parts were characterized as the parts with no visible pores and with relative density greater than 99.95%.
3. Results and Discussion
In this section, the predicted printability maps for both 316L SS and Ti-6Al-4V and the comparison with experimental results of the work Liu et al. [50] are presented. The comparison is performed in both the two steps of the analysis framework: the single laser scan and the sample porosity. The first step aims to assess the capability of a single laser scan and its relative criteria for the L-PBF process characterization, and the second step aims to investigate the ability of sample porosity simulation to improve the initial prediction of the optimum-density region and its LOF boundary. Furthermore, the effect of hatch spacing on the size of the optimum-density region is presented.
3.1. Single Laser Scan-based Printability Map
The prediction of melt pool characteristics of the 316L SS and Ti-6Al-4V metal alloys for the process parameters tested in the experimental procedure of Liu et al. [50] are presented in Table 2 and Table 3, respectively. These process parameters were used for validation purposes in the present work.
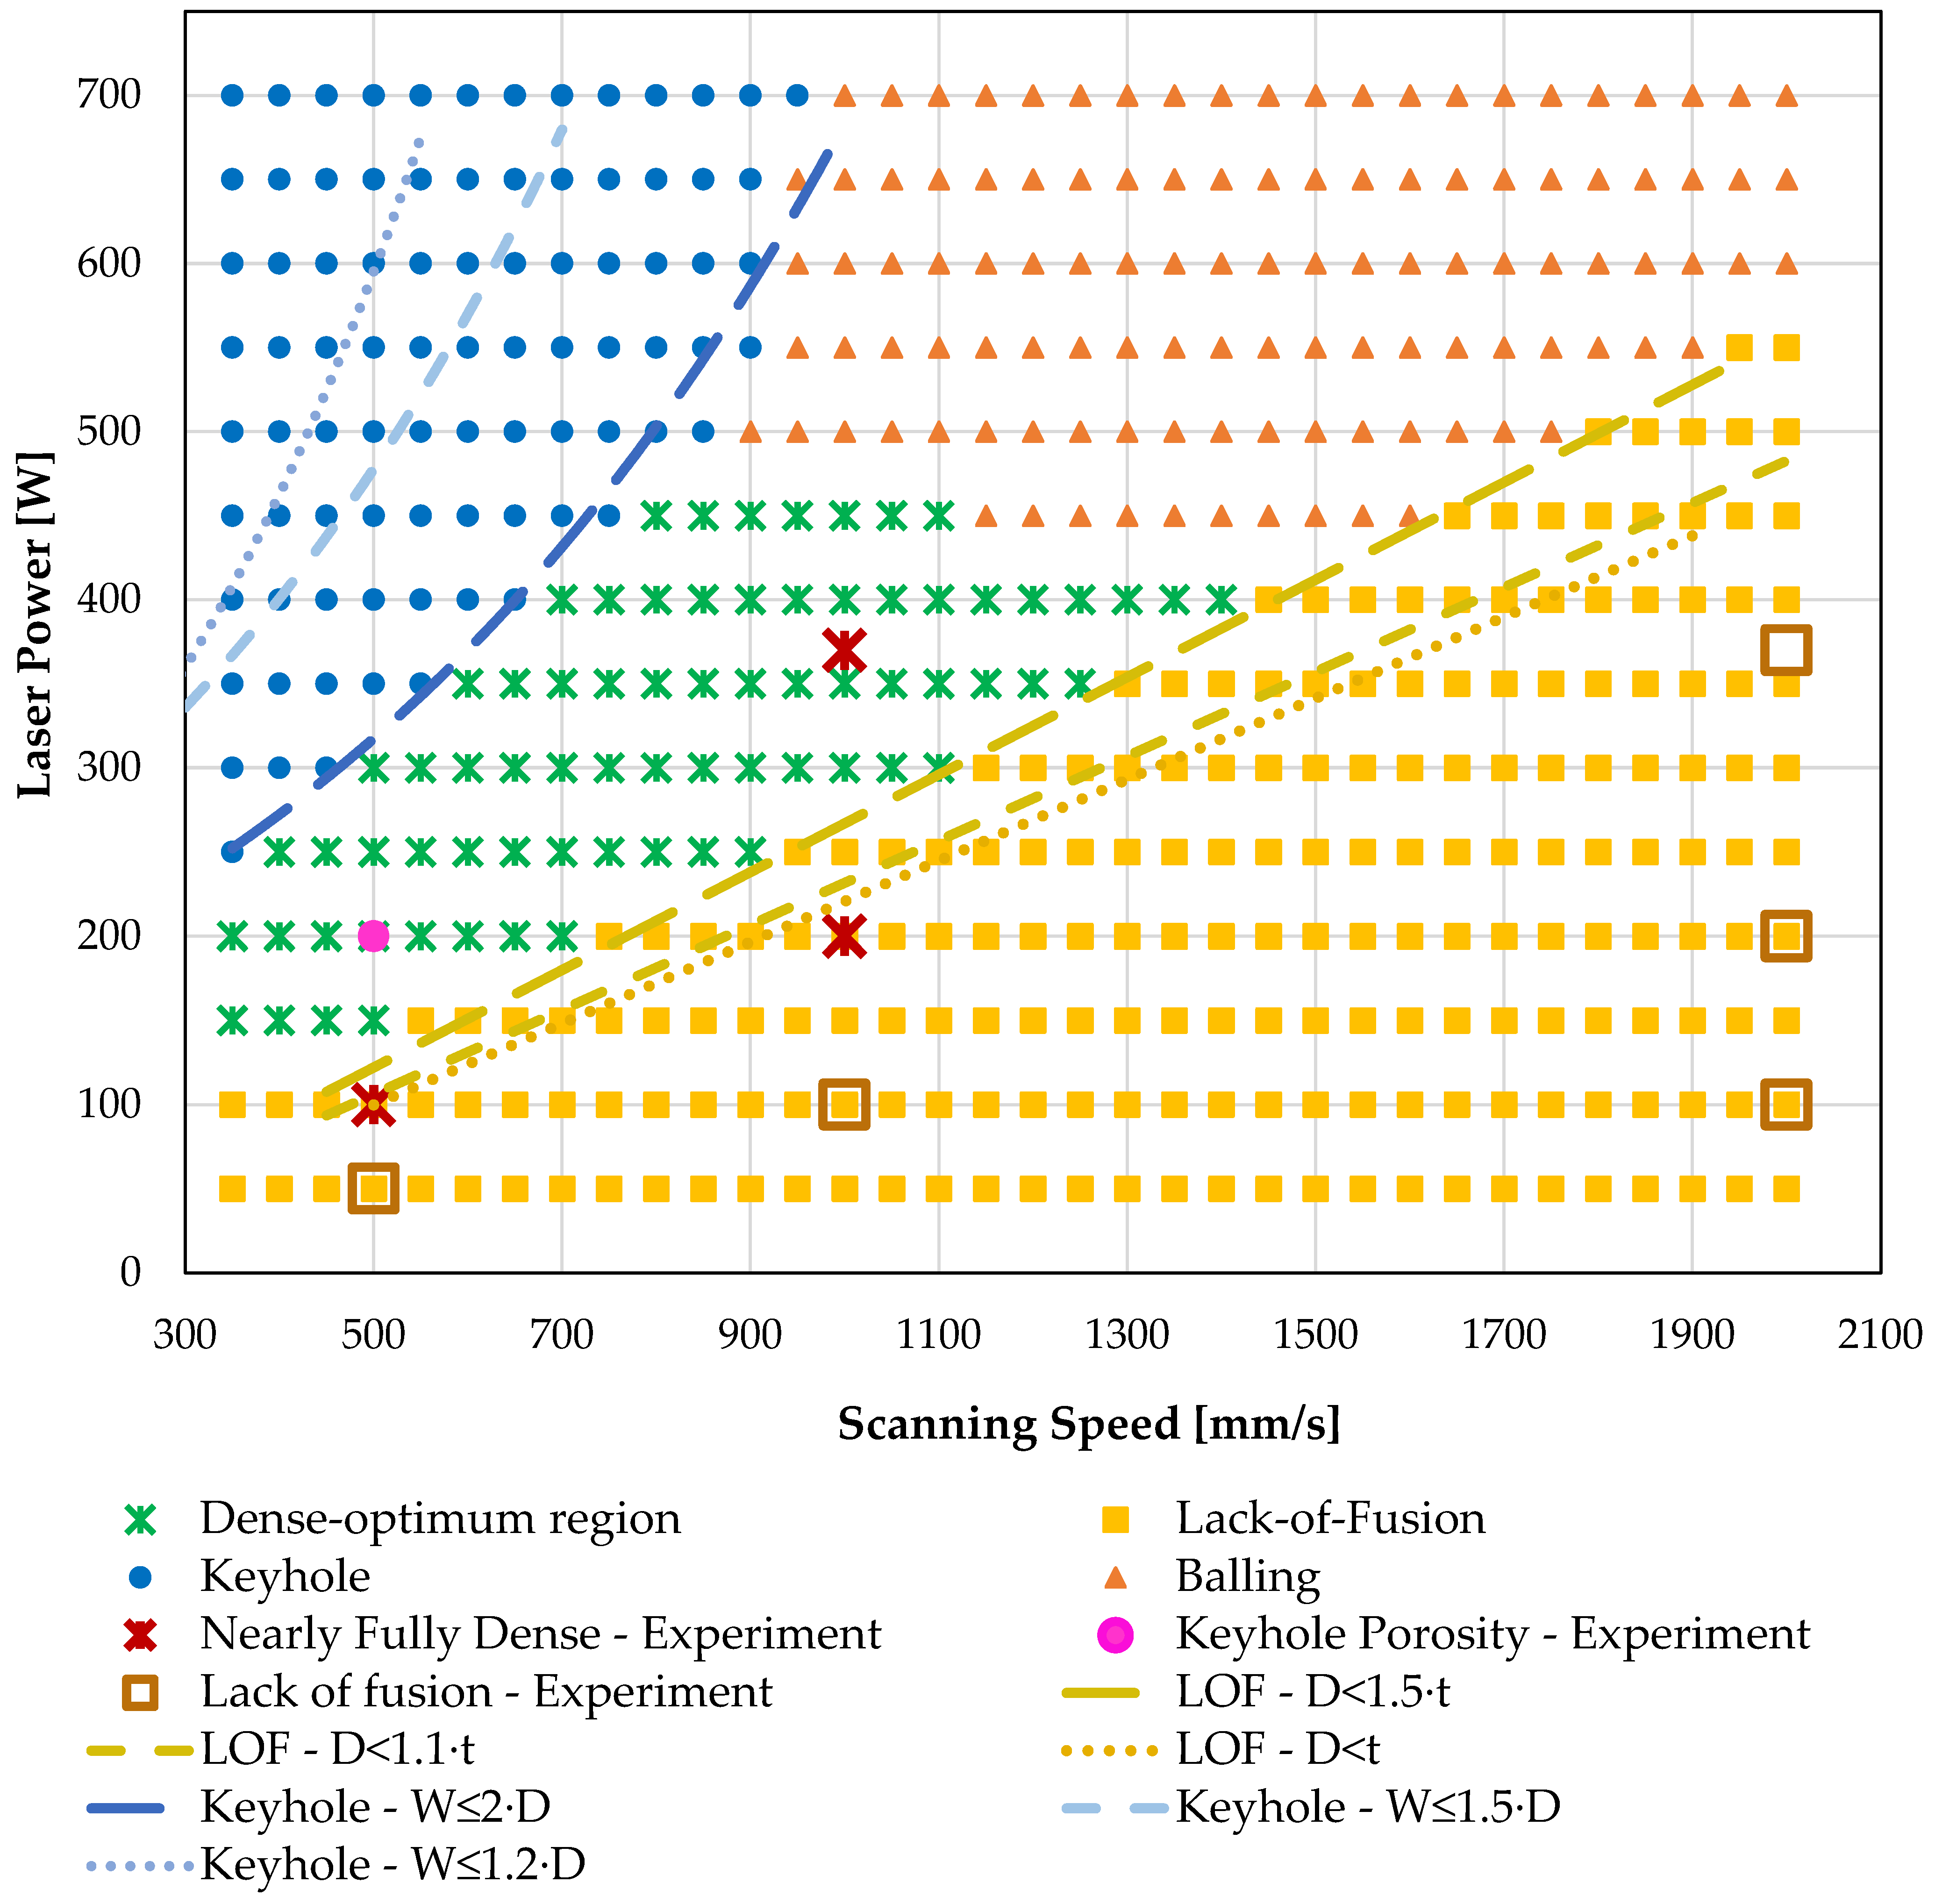
The predicted L-PBF process maps of the 316L SS and the Ti-6Al-4V metal alloys are presented in Figure 7 and Figure 8, respectively. The process maps have been designed according to the most conservative criteria for LOF (D ≤ 1.5⋅t) and keyhole (W ≤ 2·D) porosity. The variation of their boundaries according to the literature criteria of Table 1 are depicted by dotted lines indicating the potential change of the respective regions. As expected, the application of less conservative criteria for LOF and keyhole porosity would have as a result the increase of the optimum-density region. Experimentally characterized process parameters are also shown in Figure 7 and Figure 8 to illustrate clearly their position in the maps. Table 4 presents the one-to-one comparison of the experimental characterization of the process parameters with their respective predictive characterization.
For both materials the experimental characterization of the process parameters falls into the respective regions of the predicted printability maps for the majority of examined cases. In the printability map of the 316L SS (Figure 7), all the LOF experimentally characterized process parameters combinations are placed within the predicted LOF region. The predicted region of optimum-density combinations may be limited, as only one of the respective experimental characterizations is placed within the region. The employment of fewer conservative criteria would have as a result the inclusion of the set of 100 W-500 mm/s into the optimum region, while the set of 200 W-1000 mm/s would have been placed at the LOF-optimum boundary for the least conservative criterion. The biggest divergence is observed for the experimentally characterized keyhole process parameters which are placed in the optimum-density region. However, the formation of a keyhole defect for this process parameters combination (200 W-500 mm/s) may be stochastic because the presented experimental results of the work of Liu et al. [50] show only one pore with keyhole characteristics (regular spherical shape, placed in the depth of a steep melt pool) in the cube sample fabricated with the mentioned process parameters. It is not mentioned if any other keyhole defects are dispersed in the sample.
In the case of the Ti-6Al-4V process map (Figure 8), the experimental characterization agrees with the predicted characterizations except in the cases of the 200 W-2000 mm/s and 370 W-2000 mm/s combinations. The predicted melt pool depth for the combination of 200 W-2000 mm/s is 0.014 mm, or almost the half of the layer thickness; thus, in the LOF region far from the optimum region. However, in the experimental fabrication of small samples with this combination, the effect of the developed temperature fields during the process may have as a result the formation of a melt pool of a larger size, leading to an optimum-density part. The predicted melt pool for the combination of 370 W-2000 mm/s is very long, and the criterion of balling prevention is not satisfied; thus, this combination is characterized as balling-susceptible. However, since the balling phenomenon results from instabilities that occur during the process, the presented criterion might be very conservative, resulting in an over-prediction of the total balling region. Regarding the experimentally characterized LOF and keyhole combinations, all match with the respective predicted regions.
Another important feature of the presented diagrams is that the suitability of the LOF literature criteria for each type of defect depends on the examined material. The predicted LOF region for the 316L SS correlates better for the least conservative LOF criterion (D ≤ t), which agrees for NiNb5 studied in literature. The result presents a small divergence with the threshold presented in the work of Mukherjee et al. [52] (D ≤ 1.1·t) regarding the 316L SS alloy. The predicted Ti-6Al-4V correlates better for the most conservative one (D ≤ 1.5⋅t), a result that is suited to the findings of work of Mukherjee et al. [52] about the same alloy. On the other side, the most conservative keyhole criterion (W ≤ 2·D) seems to estimate better the keyhole region compared to the other ones, which agrees with previous studies about Ti-6Al-4V and 316L SS, while for NiNb5 the most suitable is W ≤ 1.5·D. However, the data of the work of Liu et al. [50] do not support the proper experimental characterization of the keyhole porosity threshold of 316L SS, and the observation regarding the keyhole threshold relies mainly on the data of Ti-6Al-4V. Furthermore, the current sets of experimentally examined process parameters do not result in any balling defects; thus, this predicted region cannot be verified in the present work. The balling occurs in the region of high laser power and scanning speeds; this region is avoided by default, both in practice and in research. Nevertheless, in the case of Ti-6Al-4V, it seems that there is an overprediction of the balling area; however, the lack of experimental data cannot confirm this observation. As the focus is placed on the prediction of LOF, keyhole and a nearly full-density region, in the present study the balling region has been designed to indicate the boundary of stable melt pool behavior. From this point, melt pool behavior may present instabilities that cannot be modelled with the current modelling procedures, which indicates the limits of this approach.
3.2. Sample Porosity Prediction—Updated Printability Map
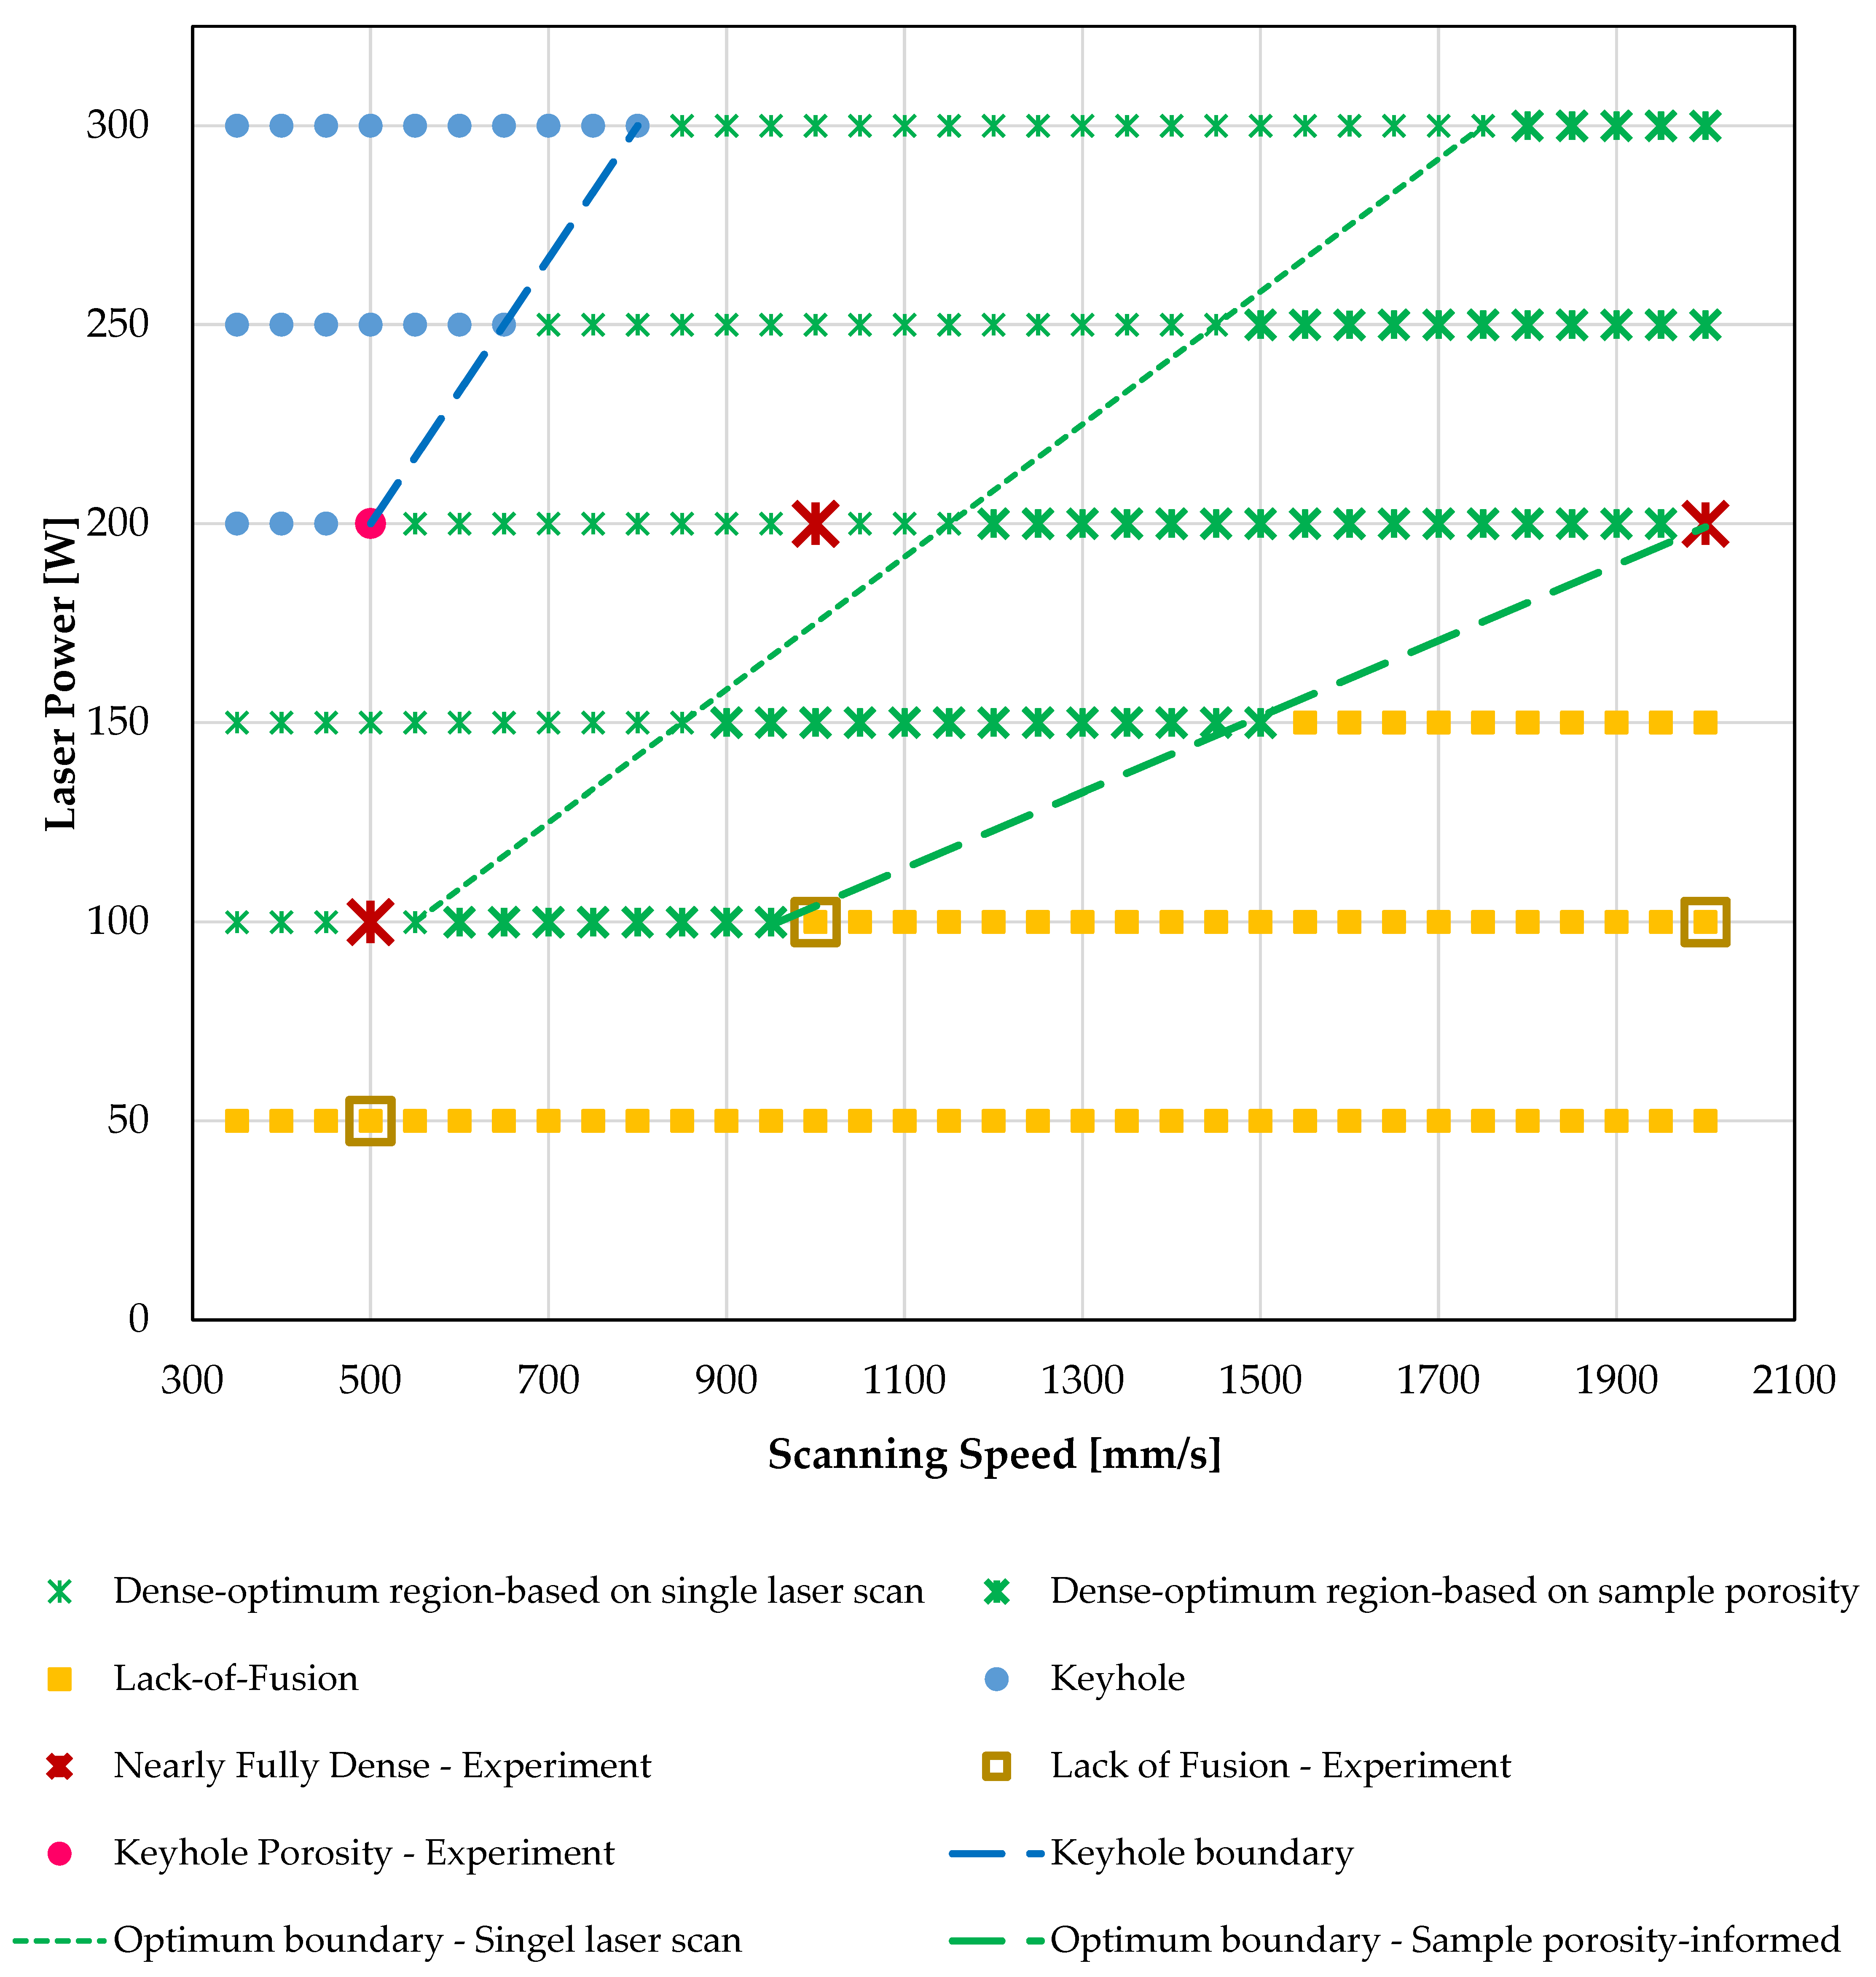
Figure 7 and Figure 8 presented the process maps for 316L SS and Ti-6Al-4V metal alloys, respectively, based on the results of the single laser scan analysis, which concerned the prediction of melt pool dimensions and the characterization of the melt pool according to geometry-based criteria. In this section, Figure 9 and Figure 10 present the process maps of 316L SS and Ti-6Al-4V metal alloys, updated with the results of the second step of the modelling methodology. In the second step of analysis, the optimum and the LOF process parameters defined at the first step of analysis are utilized for the L-PBF simulation of small samples to predict the percentage of LOF porosity. The results of the second step aim to assess the initial optimum and LOF parameters for the fabrication of defect-free multilayer parts built with all the scan strategy process parameters (laser power, scanning speed, layer thickness, hatch spacing, scan pattern). In Figure 9 and Figure 10, the boundary between the optimum-density and LOF region based on the initial single laser scan and the sample porosity analysis are also shown. In both printability maps of the metal alloys, the optimum-density region is extended to the side of the LOF region. Several of the combinations that were LOF-susceptible according to the single laser scan analyses have not presented any percentage of porosity in the analysis of the sample part. This trend may be attributed either to the residual heat from the processing of multiple layers and the resulting thermal fields or to the multiple laser scan passes in every layer that may lead to sufficient overlapping that close the potential pores.
Table 5 presents the updated one-to-one comparison of the experimental characterization of the process parameters with their respective predictive characterization. The extent of the updated optimum-density region has a result the inclusion of all the experimentally characterized optimum-density combinations without covering the experimentally characterized LOF or keyhole points. This denotes the importance of porosity simulations in the design of printability maps, as it could provide an insight into the tendency of process parameter combinations in the formation of full-density parts, providing a broader range of process parameters to be employed.
3.3. The Effect of Hatch Spacing Variation on the Process Map
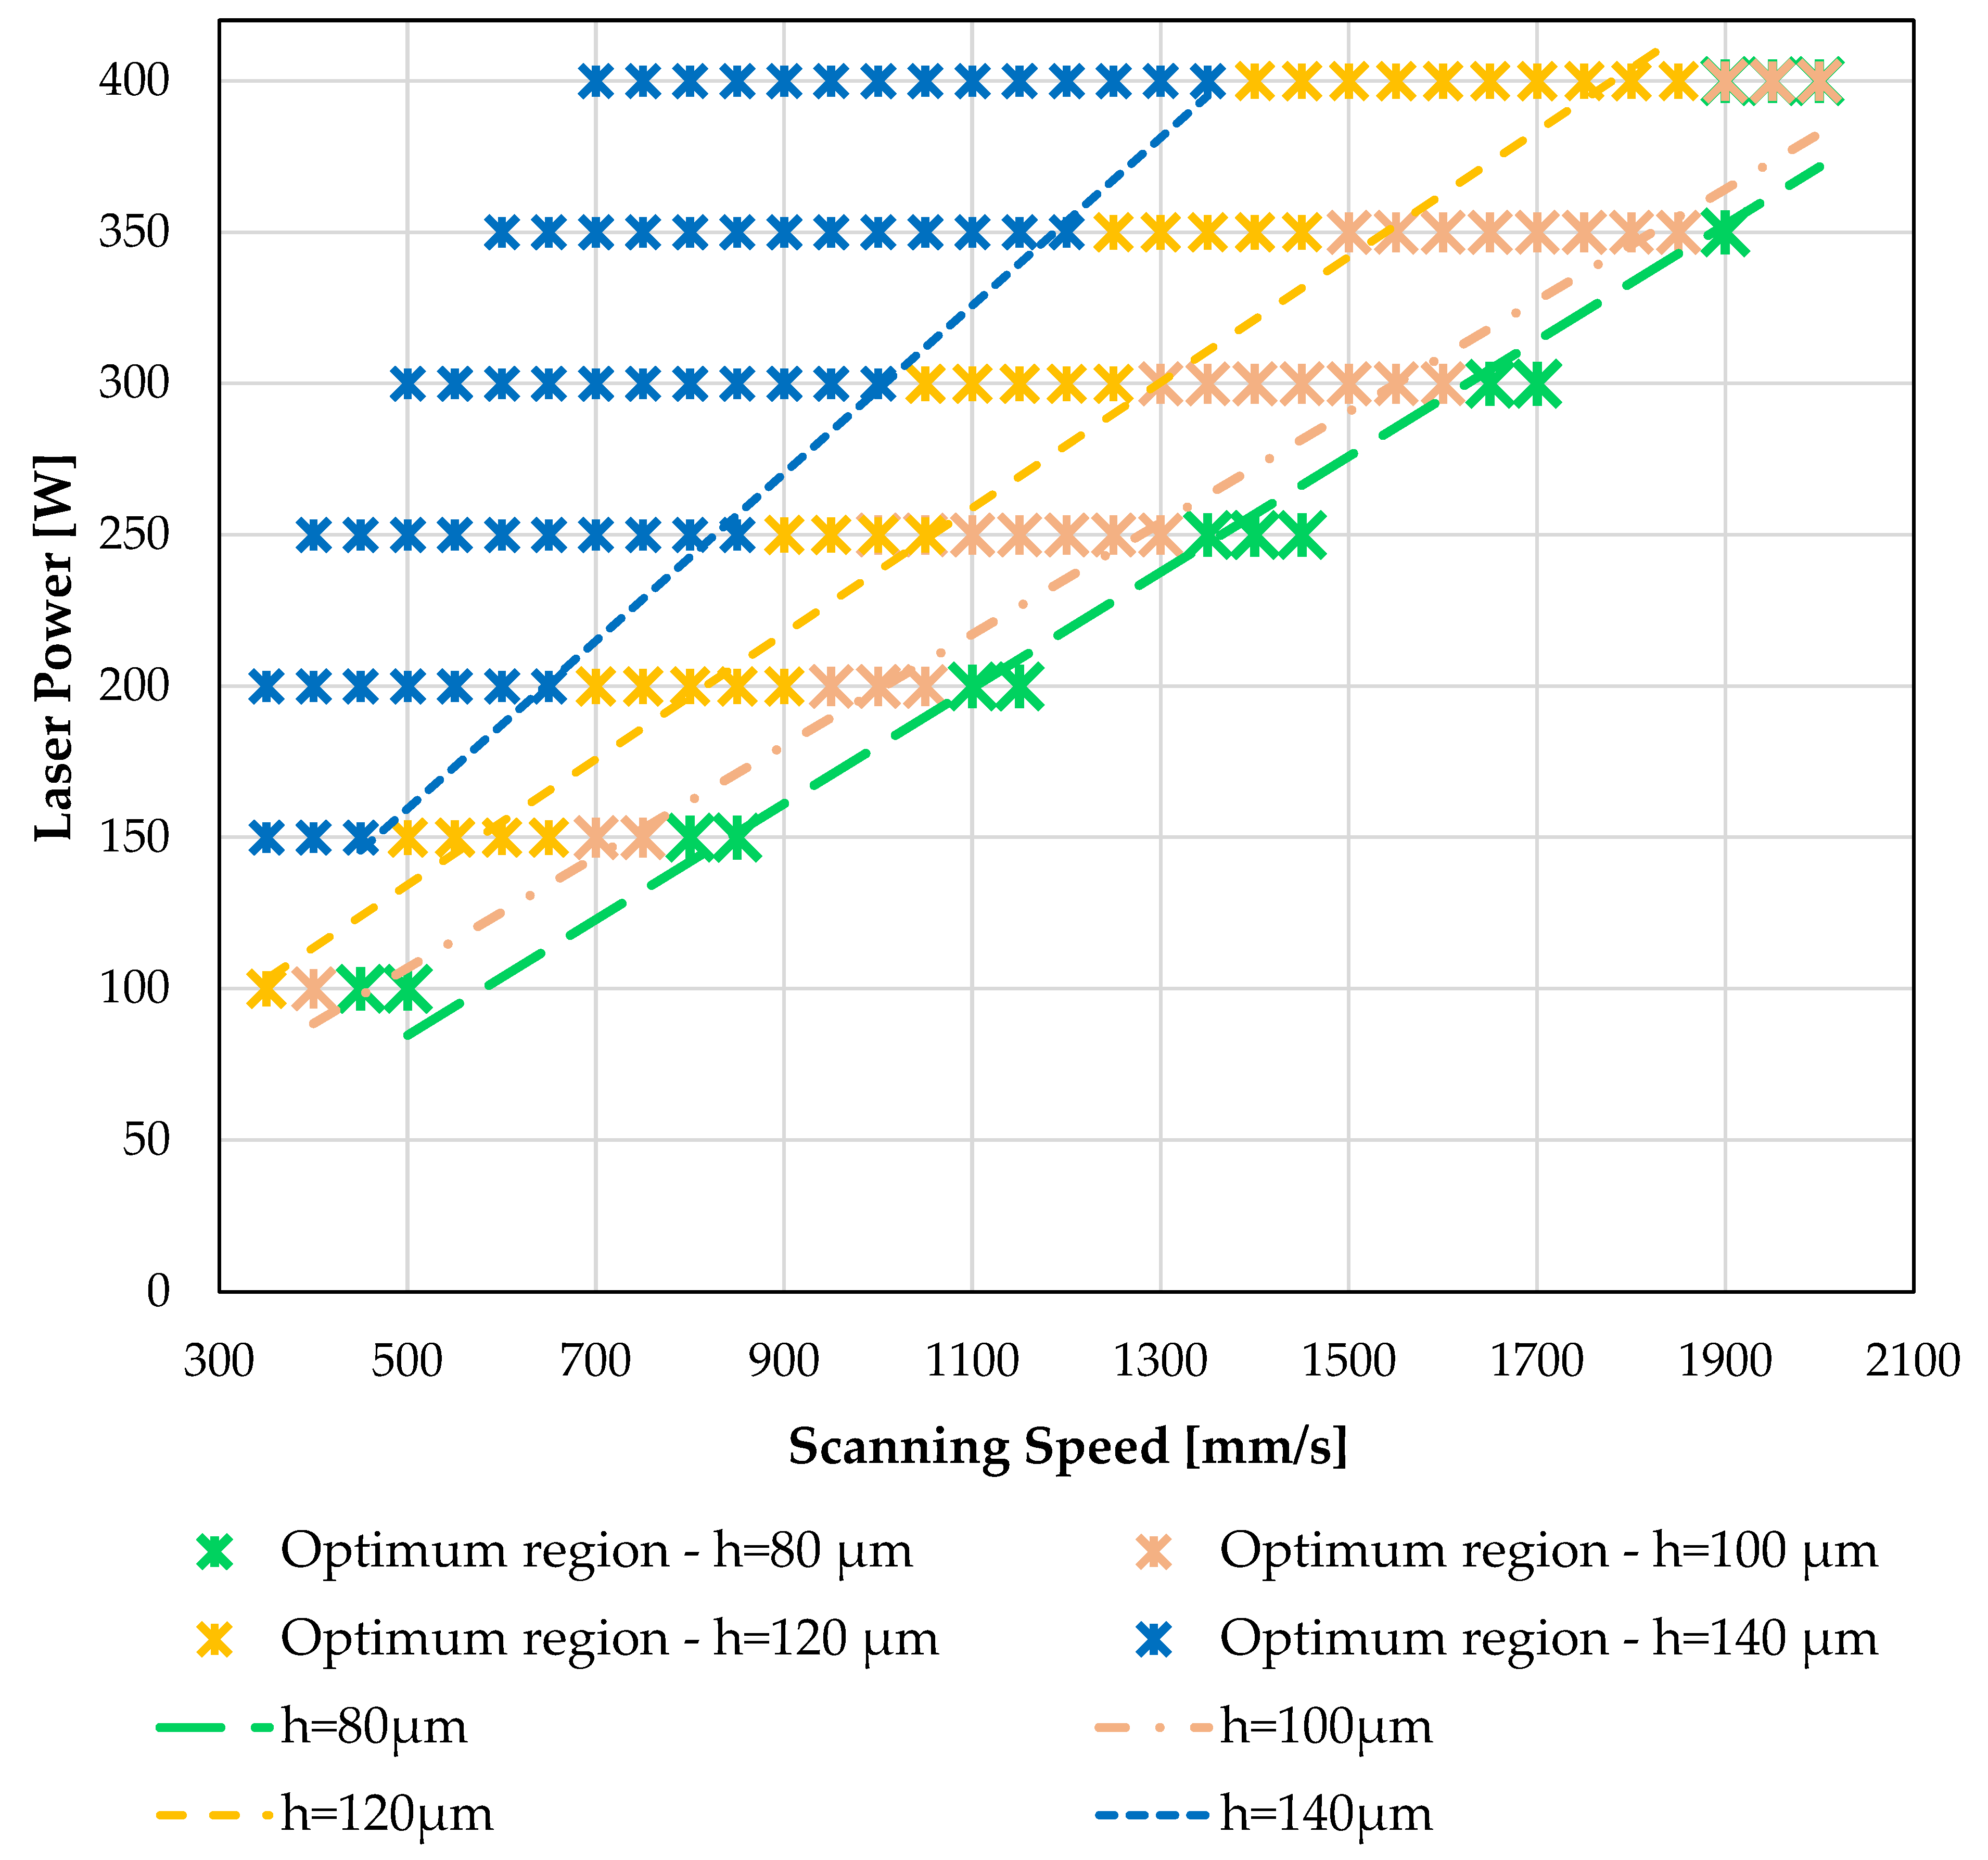
The variation of the optimum-density region of 316L SS and Ti-6Al-4V metal alloy process map for different values of hatch spacing process parameters is presented in Figure 11 and Figure 12, respectively. As expected, as the hatch spacing increases, the area of optimum-density region decreases. The most important characteristic in both diagrams are the boundaries between the optimum-density and LOF region for every hatch spacing value. These boundaries can provide the needful information for both design and manufacturing procedures to take advantage of the optimum-density combination of the L-PBF process parameters for certain values of hatch spacing. The selection of this combination can increase the productivity rate of the fabrication of a part, minimizing the overall porosity. However, more experimental data are needed to support this analysis to be more reliable.
4. Conclusions
In the current work, a modelling methodology for the design of L-PBF printability maps of metal alloys is proposed and examined. The finite element modelling methodology of the L-PBF process consists of two parts: single laser scan analysis and porosity analysis of small samples. In the single laser scan analysis, the characterization of the predicted melt pool according to geometry-based criteria for various combinations of process parameters is performed. Available literature criteria for LOF, keyhole and balling porosity are employed and assessed. The results of characterization are used for the design of an initial printability map of the examined metal alloys, where the optimum-density region and LOF, keyhole and balling regions are depicted. The initial optimization of the L-PBF parts is conducted. In the porosity analysis of small samples, the initial predicted optimum-density parameters are used for the simulation of the L-PBF fabrication of small samples to predict their overall porosity. This step aims to investigate the ability of optimum-density and LOF parameters to build parts with minimum porosity. The results are used to update the initial process maps and to design new boundaries. This methodology aims to reduce the experimental tests needed for the design of printability maps, providing an accurate prediction of the parameters that have as a result the formation of the L-PBF defects and near-full density parts. In addition, it may be also used to correlate the process parameters with the resulting microstructure and the mechanical properties of the examined metal materials. Thus, the variability between of the mechanical properties of AM metal parts may be reduced, providing a more consistent relationship between process parameters, material microstructure and mechanical properties [17,57].
The modelling methodology has been validated based on available experimental data from the literature for the 316L SS and Ti-6Al-4V AM metal alloys [50]. In general, the correlation between the predicted and the experimental characterization has been very satisfactory, verifying the presented methodology. The main conclusions can be summed up as follows:
- The suitability of LOF criteria depends on the examined material. In the case of 316L SS, the least conservative criterion describes the region better, while in the case of Ti-6Al-4V the most conservative criterion can estimate the LOF region better.
- The most conservative keyhole criterion seems to present better correlation with experimental characterization for Ti-6Al-4V. The experimental data of 316L SS are not adequate to characterize the threshold of keyhole formation. Future experimental work or correlation with the remaining literature experimental cases should be performed to identify the keyhole threshold in more detail and to support the modelling results.
- The optimum-density region of the process map based on single scan analysis seems to be restricted especially from the side of its boundary with the LOF region for both metals.
- The sample porosity prediction seems to be capable of resolving the previous issue, providing a better correlation with experimental characterization in both cases.
- The sample porosity analysis is limited to the laser power levels where the balling does not appear. This approach limits the investigation of the present analysis, as the unstable phenomena cannot be modelled; thus, the boundary between the optimum-density and balling cannot be explicitly designed.
As a future step, the development of efficient balling and keyhole modelling methods in order to provide the means to predict the tendency of process parameters for the formation of these defects is required. Additionally, the effect of different material properties of the metal alloys should be incorporated in the defect criteria for the next modelling efforts. Moreover, a good selection of experimental sets is needed to be combined with the modelling approach to evaluate the effect of hatch spacing on the variation of the optimum-density region. Lastly, the present framework is aimed to be combined with microstructural [58] and residual stresses [59,60] modelling approaches for the complete assessment of the build quality of L-PBF materials and parts.
Author Contributions
Conceptualization, H.O.P. and G.N.L.; methodology, H.O.P. and G.N.L.; software, H.O.P. and G.N.L.; validation, H.O.P. and G.N.L.; formal analysis, H.O.P. and G.N.L.; investigation, H.O.P. and G.N.L.; writing—original draft preparation, H.O.P.; writing—review and editing, H.O.P. and G.N.L.; visualization, H.O.P.; supervision, H.O.P. and G.N.L. All authors have read and agreed to the published version of the manuscript.
Funding
This research received no external funding.
Data Availability Statement
All data generated or analyzed during this study are included in this published article.
Conflicts of Interest
The authors declare no conflict of interest.
References
- Blakey-Milner, B.; Gradl, P.; Snedden, G.; Brooks, M.; Pitot, J.; Lopez, E.; Leary, M.; Berto, F.; du Plessis, A. Metal additive manufacturing in aerospace: A review. Mater. Des. 2021, 209, 110008. [Google Scholar] [CrossRef]
- du Plessis, A.; Razavi, S.M.J.; Benedetti, M.; Murchio, S.; Leary, M.; Watson, M.; Bhate, D.; Berto, F. Properties and applications of additively manufactured metallic cellular materials: A review. Prog. Mater. Sci. 2022, 125, 100918. [Google Scholar] [CrossRef]
- Shrivastava, A.; Mukherjee, S.; Chakraborty, S.S. Addressing the challenges in remanufacturing by laser-based material deposition techniques. Opt. Laser Technol. 2021, 144, 107404. [Google Scholar] [CrossRef]
- Keshavarz, M.K.; Gontcharov, A.; Lowden, P.; Chan, A.; Kulkarni, D.; Brochu, M. Turbine Blade Tip Repair by Laser Directed Energy Deposition Additive Manufacturing Using a Rene 142–MERL 72 Powder Blend. J. Manuf. Mater. Process 2021, 5, 21. [Google Scholar] [CrossRef]
- Lampeas, G.; Diamantakos, I.; Ptochos, E. Multifield modelling and failure prediction of cellular cores produced by selective laser melting. Fatigue Fract. Eng. Mater. Struct. 2019, 42, 1534–1547. [Google Scholar] [CrossRef]
- Gordon, J.V.; Narra, S.P.; Cunningham, R.W.; Liu, H.; Chen, H.; Suter, R.M.; Beuth, J.L.; Rollett, A.D. Defect structure process maps for laser powder bed fusion additive manufacturing. Addit. Manuf. 2020, 36, 101552. [Google Scholar] [CrossRef]
- Heiden, M.J.; Jensen, S.C.; Koepke, J.R.; Saiz, D.J.; Dickens, S.M.; Jared, B.H. Process and feedstock driven microstructure for laser powder bed fusion of 316L stainless steel. Materialia 2022, 21, 101356. [Google Scholar] [CrossRef]
- Cunningham, R.; Zhao, C.; Parab, N.; Kantzos, C.; Pauza, J.; Fezzaa, K.; Sun, T.; Rollett, A.D. Keyhole threshold and morphology in laser melting revealed by ultrahigh-speed x-ray imaging. Science 2019, 363, 849–852. [Google Scholar] [CrossRef]
- Gong, H.; Rafi, K.; Gu, H.; Starr, T.; Stucker, B. Analysis of defect generation in Ti-6Al-4V parts made using powder bed fusion additive manufacturing processes. Addit. Manuf. 2014, 1, 87–98. [Google Scholar] [CrossRef]
- Seifi, M.; Salem, A.; Satko, D.; Shaffer, J.; Lewandowski, J.J. Defect distribution and microstructure heterogeneity effects on fracture resistance and fatigue behavior of EBM Ti–6Al–4V. Int. J. Fatigue 2017, 94, 263–287. [Google Scholar] [CrossRef]
- Tammas-Williams, S.; Withers, P.J.; Todd, I.; Prangnell, P.B. The Influence of Porosity on Fatigue Crack Initiation in Additively Manufactured Titanium Components. Sci. Rep. 2017, 7. [Google Scholar] [CrossRef]
- Beretta, S.; Romano, S. A comparison of fatigue strength sensitivity to defects for materials manufactured by AM or traditional processes. Int. J. Fatigue 2017, 94, 178–191. [Google Scholar] [CrossRef]
- Masuo, H.; Tanaka, Y.; Morokoshi, S.; Yagura, H.; Uchida, T.; Yamamoto, Y.; Murakami, Y. Effects of Defects, Surface Roughness and HIP on Fatigue Strength of Ti-6Al-4V manufactured by Additive Manufacturing. Procedia Struct. Integr. 2017, 7, 19–26. [Google Scholar] [CrossRef]
- du Plessis, A.; Yadroitsava, I.; Yadroitsev, I. Effects of defects on mechanical properties in metal additive manufacturing: A review focusing on X-ray tomography insights. Mater. Des. 2019, 187, 108385. [Google Scholar] [CrossRef]
- Voisin, T.; Calta, N.P.; Khairallah, S.A.; Forien, J.B.; Balogh, L.; Cunningham, R.W.; Rollett, A.D.; Wang, Y.M. Defects-dictated tensile properties of selective laser melted Ti-6Al-4V. Mater. Des. 2018, 158, 113–126. [Google Scholar] [CrossRef]
- Liu, Q.C.; Elambasseril, J.; Sun, S.J.; Leary, M.; Brandt, M.; Sharp, P.K. The effect of manufacturing defects on the fatigue behaviour of Ti-6Al-4V specimens fabricated using selective laser melting. Adv. Mater. Res. Trans. Tech. Publ. 2014, 891–892, 1519–1524. [Google Scholar] [CrossRef]
- Sanaei, N.; Fatemi, A.; Phan, N. Defect characteristics and analysis of their variability in metal L-PBF additive manufacturing. Mater. Des. 2019, 182, 108091. [Google Scholar] [CrossRef]
- Sabzi, H.E.; Rivera-Díaz-del-Castillo, P.E.J. Defect Prevention in Selective Laser Melting Components: Compositional and Process Effects. Mater 2019, 12, 3791. [Google Scholar] [CrossRef] [PubMed] [Green Version]
- Teng, C.; Pal, D.; Gong, H.; Zeng, K.; Briggs, K.; Patil, N.; Stucker, B. A review of defect modeling in laser material processing. Addit. Manuf. 2017, 14, 137–147. [Google Scholar] [CrossRef]
- Snow, Z.; Nassar, A.R.; Reutzel, E.W. Invited Review Article: Review of the formation and impact of flaws in powder bed fusion additive manufacturing. Addit. Manuf. 2020, 36, 101457. [Google Scholar] [CrossRef]
- Iebba, M.; Astarita, A.; Mistretta, D.; Colonna, I.; Liberini, M.; Scherillo, F.; Pirozzi, C.; Borrelli, R.; Franchitti, S.; Squillace, A. Influence of Powder Characteristics on Formation of Porosity in Additive Manufacturing of Ti-6Al-4V Components. J. Mater. Eng. Perform. 2017, 26, 4138–4147. [Google Scholar] [CrossRef]
- Cunningham, R.; Narra, S.P.; Montgomery, C.; Beuth, J.; Rollett, A.D. Synchrotron-Based X-ray Microtomography Characterization of the Effect of Processing Variables on Porosity Formation in Laser Power-Bed Additive Manufacturing of Ti-6Al-4V. JOM 2017, 69, 479–484. [Google Scholar] [CrossRef]
- Aboulkhair, N.T.; Everitt, N.M.; Ashcroft, I.; Tuck, C. Reducing porosity in AlSi10Mg parts processed by selective laser melting. Addit. Manuf. 2014, 1–4, 77–86. [Google Scholar] [CrossRef]
- Guo, Q.; Zhao, C.; Escano, L.I.; Young, Z.; Xiong, L.; Fezzaa, K.; Everhart, W.; Brown, B.; Sun, T.; Chen, L. Transient dynamics of powder spattering in laser powder bed fusion additive manufacturing process revealed by in-situ high-speed high-energy X-ray imaging. Acta Mater. 2018, 151, 169–180. [Google Scholar] [CrossRef]
- Fabbro, R.; Chouf, K. Keyhole modeling during laser welding. J. Appl. Phys. 2000, 87, 4075–4083. [Google Scholar] [CrossRef]
- Gu, D.; Shen, Y. Balling phenomena during direct laser sintering of multi-component Cu-based metal powder. J. Alloys Compd. 2007, 432, 163–166. [Google Scholar] [CrossRef]
- Nudelis, N.; Mayr, P. A Novel Classification Method for Pores in Laser Powder Bed Fusion. Metals 2021, 11, 1912. [Google Scholar] [CrossRef]
- Zhang, B.; Seede, R.; Xue, L.; Atli, K.C.; Zhang, C.; Whitt, A.; Karaman, I.; Arroyave, R.; Elwany, A. An efficient framework for printability assessment in Laser Powder Bed Fusion metal additive manufacturing. Addit. Manuf. 2021, 46, 102018. [Google Scholar] [CrossRef]
- Johnson, L.; Mahmoudi, M.; Zhang, B.; Seede, R.; Huang, X.; Maier, J.T.; Maier, H.J.; Karaman, I.; Elwany, A.; Arróyave, R. Assessing printability maps in additive manufacturing of metal alloys. Acta Mater. 2019, 176, 199–210. [Google Scholar] [CrossRef]
- Luo, Q.; Yin, L.; Simpson, T.W.; Beese, A.M. Effect of processing parameters on pore structures, grain features, and mechanical properties in Ti-6Al-4V by laser powder bed fusion. Addit. Manuf. 2022, 56, 102915. [Google Scholar] [CrossRef]
- Beuth, J.; Fox, J.; Gockel, J.; Yang, R.; Qiao, H.; Soylemez, E.; Reeseewatt, P.; Anvari, A.; Narra, S.; Klingbeil, N. Process Mapping for Qualification Across Multiple Direct Metal Additive Manufacturing Processes. In Proceedings of the 2013 International Solid Freeform Fabrication Symposium, Austin, TX, USA, 14–16 August 2013. [Google Scholar]
- Dilip, J.J.S.; Zhang, S.; Teng, C.; Zeng, K.; Robinson, C.; Pal, D.; Stucker, B. Influence of processing parameters on the evolution of melt pool, porosity, and microstructures in Ti-6Al-4V alloy parts fabricated by selective laser melting. Prog. Addit. Manuf. 2017, 2, 157–167. [Google Scholar] [CrossRef] [Green Version]
- Kumar, P.; Farah, J.; Akram, J.; Teng, C.; Ginn, J.; Misra, M. Influence of laser processing parameters on porosity in Inconel 718 during additive manufacturing. Int. J. Adv. Manuf. Technol. 2019, 103, 1497–1507. [Google Scholar] [CrossRef]
- Bosio, F.; Aversa, A.; Lorusso, M.; Marola, S.; Gianoglio, D.; Battezzati, L.; Fino, P.; Manfredi, D.; Lombardi, M. A time-saving and cost-effective method to process alloys by Laser Powder Bed Fusion. Mater. Des. 2019, 181, 107949. [Google Scholar] [CrossRef]
- Wei, P.; Wei, Z.; Chen, Z.; Du, J.; He, Y.; Li, J.; Zhou, Y. The AlSi10Mg samples produced by selective laser melting: Single track, densification, microstructure and mechanical behavior. Appl. Surf. Sci. 2017, 408, 38–50. [Google Scholar] [CrossRef]
- Scime, L.; Beuth, J. Melt pool geometry and morphology variability for the Inconel 718 alloy in a laser powder bed fusion additive manufacturing process. Addit. Manuf. 2019, 29, 100830. [Google Scholar] [CrossRef]
- Tang, M.; Pistorius, P.C.; Beuth, J.L. Prediction of lack-of-fusion porosity for powder bed fusion. Addit. Manuf. 2017, 14, 39–48. [Google Scholar] [CrossRef]
- Rubenchik, A.M.; King, W.E.; Wu, S.S. Scaling laws for the additive manufacturing. J. Mater. Process. Technol. 2018, 257, 234–243. [Google Scholar] [CrossRef]
- Ning, J.; Wang, W.; Zamorano, B.; Liang, S.Y. Analytical modeling of lack-of-fusion porosity in metal additive manufacturing. Appl. Phys. A Mater. Sci. Process. 2019, 125, 1–11. [Google Scholar] [CrossRef]
- Wang, W.; Ning, J.; Liang, S.Y. Analytical Prediction of Balling, Lack-of-Fusion and Keyholing Thresholds in Powder Bed Fusion. Appl. Sci. 2021, 11, 12053. [Google Scholar] [CrossRef]
- Wang, W.; Ning, J.; Liang, S.Y. Analytical prediction of keyhole porosity in laser powder bed fusion. Int. J. Adv. Manuf. Technol. 2022, 119, 6995–7002. [Google Scholar] [CrossRef]
- Khorasani, M.; Ghasemi, A.H.; Leary, M.; Sharabian, E.; Cordova, L.; Gibson, I.; Downing, D.; Bateman, S.; Brandt, M.; Rolfe, B. The effect of absorption ratio on meltpool features in laser-based powder bed fusion of IN718. Opt. Laser Technol. 2022, 153, 108263. [Google Scholar] [CrossRef]
- Cook, P.S.; Murphy, A.B. Simulation of melt pool behaviour during additive manufacturing: Underlying physics and progress. Addit. Manuf. 2020, 31, 100909. [Google Scholar] [CrossRef]
- Körner, C.; Attar, E.; Heinl, P. Mesoscopic simulation of selective beam melting processes. J. Mater. Process. Technol. 2011, 211, 978–987. [Google Scholar] [CrossRef]
- Bayat, M.; Dong, W.; Thorborg, J.; To, A.C.; Hattel, J.H. A review of multi-scale and multi-physics simulations of metal additive manufacturing processes with focus on modeling strategies. Addit. Manuf. 2021, 47, 102278. [Google Scholar] [CrossRef]
- Luo, Z.; Zhao, Y. A survey of finite element analysis of temperature and thermal stress fields in powder bed fusion Additive Manufacturing. Addit. Manuf. 2018, 21, 318–332. [Google Scholar] [CrossRef] [Green Version]
- Bruna-Rosso, C.; Demir, A.G.; Previtali, B. Selective laser melting finite element modeling: Validation with high-speed imaging and lack of fusion defects prediction. Mater. Des. 2018, 156, 143–153. [Google Scholar] [CrossRef] [Green Version]
- Letenneur, M.; Kreitcberg, A.; Brailovski, V. Optimization of Laser Powder Bed Fusion Processing Using a Combination of Melt Pool Modeling and Design of Experiment Approaches: Density Control. J. Manuf. Mater. Process. 2019, 3, 21. [Google Scholar] [CrossRef] [Green Version]
- Ansys Additive User’s Guide (Print and Science) 2020 R2; Ansys Inc.: Canonsburg, PA, USA, 2020.
- Liu, B.; Fang, G.; Lei, L.; Yan, X. Predicting the porosity defects in selective laser melting (SLM) by molten pool geometry. Int. J. Mech. Sci. 2022, 228, 107478. [Google Scholar] [CrossRef]
- Fergani, O.; Brotan, V.; Bambach, M.; Pérez-Prado, M.T. Texture evolution in stainless steel processed by selective laser melting and annealing. Mat. Sc. Technol. 2018, 34, 2223–2230. [Google Scholar] [CrossRef]
- Mukherjee, T.; Zuback, J.S.; De, A.; DebRoy, T. Printability of alloys for additive manufacturing. Sci. Rep. 2016, 6, 19717. [Google Scholar] [CrossRef] [Green Version]
- DebRoy, T.; Wei, H.L.; Zuback, J.S.; Mukherjee, T.; Elmer, J.W.; Milewski, J.O.; Beese, A.M.; Wilson-Heid, A.; De, A.; Zhang, W. Additive manufacturing of metallic components—Process, structure and properties. Prog. Mater. Sci. 2018, 92, 112–224. [Google Scholar] [CrossRef]
- Du, L.; Qian, G.; Zheng, L.; Hong, Y. Influence of processing parameters of selective laser melting on high-cycle and very-high-cycle fatigue behaviour of Ti-6Al-4V. Fatigue Fract. Eng. Mater. Struct. 2021, 44, 240–256. [Google Scholar] [CrossRef]
- Yap, C.Y.; Chua, C.K.; Dong, Z.L. An effective analytical model of selective laser melting. Virtual Phys. Prototyp. 2016, 11, 21–26. [Google Scholar] [CrossRef]
- Carter, L.N.; Martin, C.; Withers, P.J.; Attallah, M.M. The influence of the laser scan strategy on grain structure and cracking behaviour in SLM powder-bed fabricated nickel superalloy. J. Alloys Compd. 2014, 615, 338–347. [Google Scholar] [CrossRef]
- Jia, H.; Sun, H.; Wang, H.; Wu, Y.; Wang, H. Scanning strategy in selective laser melting (SLM): A review. Int. J. Adv. Manuf. Technol. 2021, 113, 2413–2435. [Google Scholar] [CrossRef]
- Barrionuevo, G.O.; Ramos-Grez, J.A.; Walczak, M.; Sánchez-Sánchez, X.; Guerra, C.; Debut, A.; Haro, E. Microstructure simulation and experimental evaluation of the anisotropy of 316 L stainless steel manufactured by laser powder bed fusion. Rapid Prototyp. J. 2022, 57, 133–164. [Google Scholar] [CrossRef]
- Psihoyos, H.O.; Lampeas, G.N. Efficient thermomechanical modelling of Laser Powder Bed Fusion additive manufacturing process with emphasis on parts residual stress fields. AIMS Mater. Sci. 2022, 9, 455–480. [Google Scholar] [CrossRef]
- Shaikh, M.Q.; Berfield, T.A.; Atre, S.V. Residual stresses in additively manufactured parts: Predictive simulation and experimental verification. Rapid Prototyp. J. 2022, 28, 1895–1905. [Google Scholar] [CrossRef]
Figure 1.
Flowchart of the modelling framework for the optimization of the L-PBF process.

Figure 2.
Schematic description of single scan processing. Input variables are the AM metal material properties, layer thickness, baseplate temperature, laser power, and scanning speed; the output is melt pool dimensions (width, depth, length).
Figure 2.
Schematic description of single scan processing. Input variables are the AM metal material properties, layer thickness, baseplate temperature, laser power, and scanning speed; the output is melt pool dimensions (width, depth, length).

Figure 3.
Schematic description of LOF porosity formation mechanism.

Figure 4.
Schematic description of keyhole porosity formation mechanism.

Figure 5.
Schematic description of balling porosity formation mechanism.

Figure 6.
Schematic description of sample-porosity simulation. Input variables are the AM metal material properties, layer thickness, hatch spacing, baseplate temperature, laser power, scanning speed and the dimensions of the sample. Output is the overall porosity of the sample part.
Figure 6.
Schematic description of sample-porosity simulation. Input variables are the AM metal material properties, layer thickness, hatch spacing, baseplate temperature, laser power, scanning speed and the dimensions of the sample. Output is the overall porosity of the sample part.

Figure 7.
The predicted process map of 316L SS metal alloy based on the modelling framework and its correlation with experimental characterization [50].
Figure 7.
The predicted process map of 316L SS metal alloy based on the modelling framework and its correlation with experimental characterization [50].

Figure 8.
The predicted process map of Ti-6Al-4V metal alloy based on the modelling framework and its correlation with experimental characterization [50].
Figure 8.
The predicted process map of Ti-6Al-4V metal alloy based on the modelling framework and its correlation with experimental characterization [50].

Figure 9.
The updated 316L SS optimum-density region based on the porosity simulation.

Figure 10.
The updated Ti-6Al-4V optimum-density region based on the porosity simulation.

Figure 11.
The variation of optimum-density region of the process map of 316L SS for the values of 80, 100, 120 and 140 μm of the hatch spacing process parameter.
Figure 11.
The variation of optimum-density region of the process map of 316L SS for the values of 80, 100, 120 and 140 μm of the hatch spacing process parameter.

Figure 12.
The variation of optimum-density region of the process map of Ti-6Al-4V for the values of 80, 100, 120 and 140 μm of the hatch spacing process parameter.
Figure 12.
The variation of optimum-density region of the process map of Ti-6Al-4V for the values of 80, 100, 120 and 140 μm of the hatch spacing process parameter.


Table 1.
Summary of the proposed criteria for the melt pool characterization.
| Type of Porosity | Criterion | References | Examined Metals |
|---|---|---|---|
| Lack of Fusion | D < t | [28] | NiNb5 |
| D < 1.1∙t | [52] | Ti-6Al-4V, IN718 | |
| D < 1.5∙t | [18,52] | Ti-6Al-4V, 316L SS | |
| Keyhole | W ≤ 1.2∙D | [28,29] | NiNb5 |
| W ≤ 1.5∙D | [28,29] | NiNb5 | |
| W ≤ 2∙D | [6,8,18] | Ti-6Al-4V, 316L SS | |
| Balling | L/W < 2.3 | [18,29] | IN718, NiNb5 |
Note: L: melt pool length, D: melt pool depth, W: melt pool width, t: layer thickness.
Table 2.
Representative predicted melt pool characteristics for 316L SS.
| Laser Power [W] | Scan Speed [mm/s] | Melt Pool Depth (D) [mm] | Melt Pool Width (W) [mm] | Melt Pool Length (L) [mm] |
|---|---|---|---|---|
| 50 | 500 | 0.005 | 0.005 | 0.095 |
| 100 | 500 | 0.015 | 0.081 | 0.181 |
| 100 | 1000 | 0.007 | 0.007 | 0.146 |
| 100 | 2000 | 0.006 | 0.008 | 0.171 |
| 200 | 500 | 0.084 | 0.150 | 0.361 |
| 200 | 1000 | 0.023 | 0.097 | 0.217 |
| 200 | 2000 | 0.004 | 0.004 | 0.27 |
| 350 | 1000 | 0.073 | 0.138 | 0.537 |
| 350 | 2000 | 0.01 | 0.073 | 0.302 |
Table 3.
Representative predicted melt pool characteristics for Ti-6Al-4V.
| Laser Power [W] | Scan Speed [mm/s] | Melt Pool Depth (D) [mm] | Melt Pool Width (W) [mm] | Melt Pool Length (L) [mm] |
|---|---|---|---|---|
| 50 | 500 | 0.009 | 0.066 | 0.153 |
| 100 | 500 | 0.051 | 0.132 | 0.282 |
| 200 | 500 | 0.087 | 0.176 | 0.391 |
| 100 | 1000 | 0.012 | 0.081 | 0.165 |
| 200 | 2000 | 0.014 | 0.08 | 0.180 |
| 350 | 1000 | 0.083 | 0.159 | 0.418 |
| 100 | 2000 | 0.004 | 0.004 | 0.254 |
| 200 | 2000 | 0.014 | 0.08 | 0.172 |
| 350 | 2000 | 0.048 | 0.115 | 0.237 |
Table 4.
Correlation between the experimental and the predicted characterization of process parameters based on single laser-scan analysis.
Table 4.
Correlation between the experimental and the predicted characterization of process parameters based on single laser-scan analysis.
| 316L SS | Ti-6Al-4V | ||||||
|---|---|---|---|---|---|---|---|
| Laser Power [W] | Scanning Speed [mm/s] | Experimental Characterization [50] | Prediction (Single Laser Scan) | Experimental Characterization [50] | Prediction (Single Laser Scan) | ||
| 50 | 500 | LOF | ✓ | LOF | LOF | ✓ | LOF |
| 100 | 500 | Dense-optimum | ✕ | LOF | Dense-optimum | ✓ | Dense-optimum |
| 100 | 1000 | LOF | ✓ | LOF | LOF | ✓ | LOF |
| 100 | 2000 | LOF | ✓ | LOF | LOF | ✓ | LOF |
| 200 | 500 | Keyhole | ✕ | Dense-optimum | Keyhole | ✓ | Keyhole |
| 200 | 1000 | Dense-optimum | ✕ | LOF | Dense-optimum | ✓ | Dense-optimum |
| 200 | 2000 | LOF | ✓ | LOF | Dense-optimum | ✕ | LOF |
| 370 | 1000 | Dense-optimum | ✓ | Dense-optimum | Keyhole | ✓ | Keyhole |
| 370 | 2000 | LOF | ✓ | LOF | Dense-optimum | ✕ | Balling |
Table 5.
Updated correlation between the experimental and the predicted characterization of process parameters based on the porosity simulations.
Table 5.
Updated correlation between the experimental and the predicted characterization of process parameters based on the porosity simulations.
| 316L SS | Ti-6Al-4V | ||||||
|---|---|---|---|---|---|---|---|
| Laser Power [W] | Scanning Speed [mm/s] | Experimental Characterization [50] | Prediction (Single Laser Scan) | Experimental Characterization [50] | Prediction (Single Laser Scan) | ||
| 50 | 500 | LOF | ✓ | LOF | LOF | ✓ | LOF |
| 100 | 500 | Dense-optimum | ✓ | LOF | Dense-optimum | ✓ | Dense-optimum |
| 100 | 1000 | LOF | ✓ | LOF | LOF | ✓ | LOF |
| 100 | 2000 | LOF | ✓ | LOF | LOF | ✓ | LOF |
| 200 | 500 | Keyhole | ✕ | Dense-optimum | Keyhole | ✓ | Keyhole |
| 200 | 1000 | Dense-optimum | ✕ | LOF | Dense-optimum | ✓ | Dense-optimum |
| 200 | 2000 | LOF | ✓ | LOF | Dense-optimum | ✕ | LOF |
| 370 | 1000 | Dense-optimum | ✓ | Dense-optimum | Keyhole | ✓ | Keyhole |
| 370 | 2000 | LOF | ✓ | LOF | Dense-optimum | ✕ | Balling |
Disclaimer/Publisher’s Note: The statements, opinions and data contained in all publications are solely those of the individual author(s) and contributor(s) and not of MDPI and/or the editor(s). MDPI and/or the editor(s) disclaim responsibility for any injury to people or property resulting from any ideas, methods, instructions or products referred to in the content. |
© 2023 by the authors. Licensee MDPI, Basel, Switzerland. This article is an open access article distributed under the terms and conditions of the Creative Commons Attribution (CC BY) license (https://creativecommons.org/licenses/by/4.0/).
Share and Cite
MDPI and ACS Style
Psihoyos, H.O.; Lampeas, G.N. Density-Based Optimization of the Laser Powder Bed Fusion Process Based on a Modelling Framework. Alloys 2023, 2, 55-76. https://doi.org/10.3390/alloys2010004
AMA Style
Psihoyos HO, Lampeas GN. Density-Based Optimization of the Laser Powder Bed Fusion Process Based on a Modelling Framework. Alloys. 2023; 2(1):55-76. https://doi.org/10.3390/alloys2010004
Chicago/Turabian StylePsihoyos, Harry O., and George N. Lampeas. 2023. "Density-Based Optimization of the Laser Powder Bed Fusion Process Based on a Modelling Framework" Alloys 2, no. 1: 55-76. https://doi.org/10.3390/alloys2010004