
Perfluoropolyether-Based Micellar Aggregates Coatings for Corrosion Resistance Enhancement of Copper-Based Alloys

 , ,
, ,  ,
,
Abstract
:1. Introduction
2. Materials and Methods
2.1. PTFE Solutions for Dip-Coating
2.2. Metallic Substrates
2.3. Dip-Coating Process
2.4. Waterdrop Contact Angle (CA) Assessment to Estimate the Surface Hydrophobicity
2.5. Sample Preparation and Salt Spray Chamber Test
2.6. Metallographic Preparation
3. Results
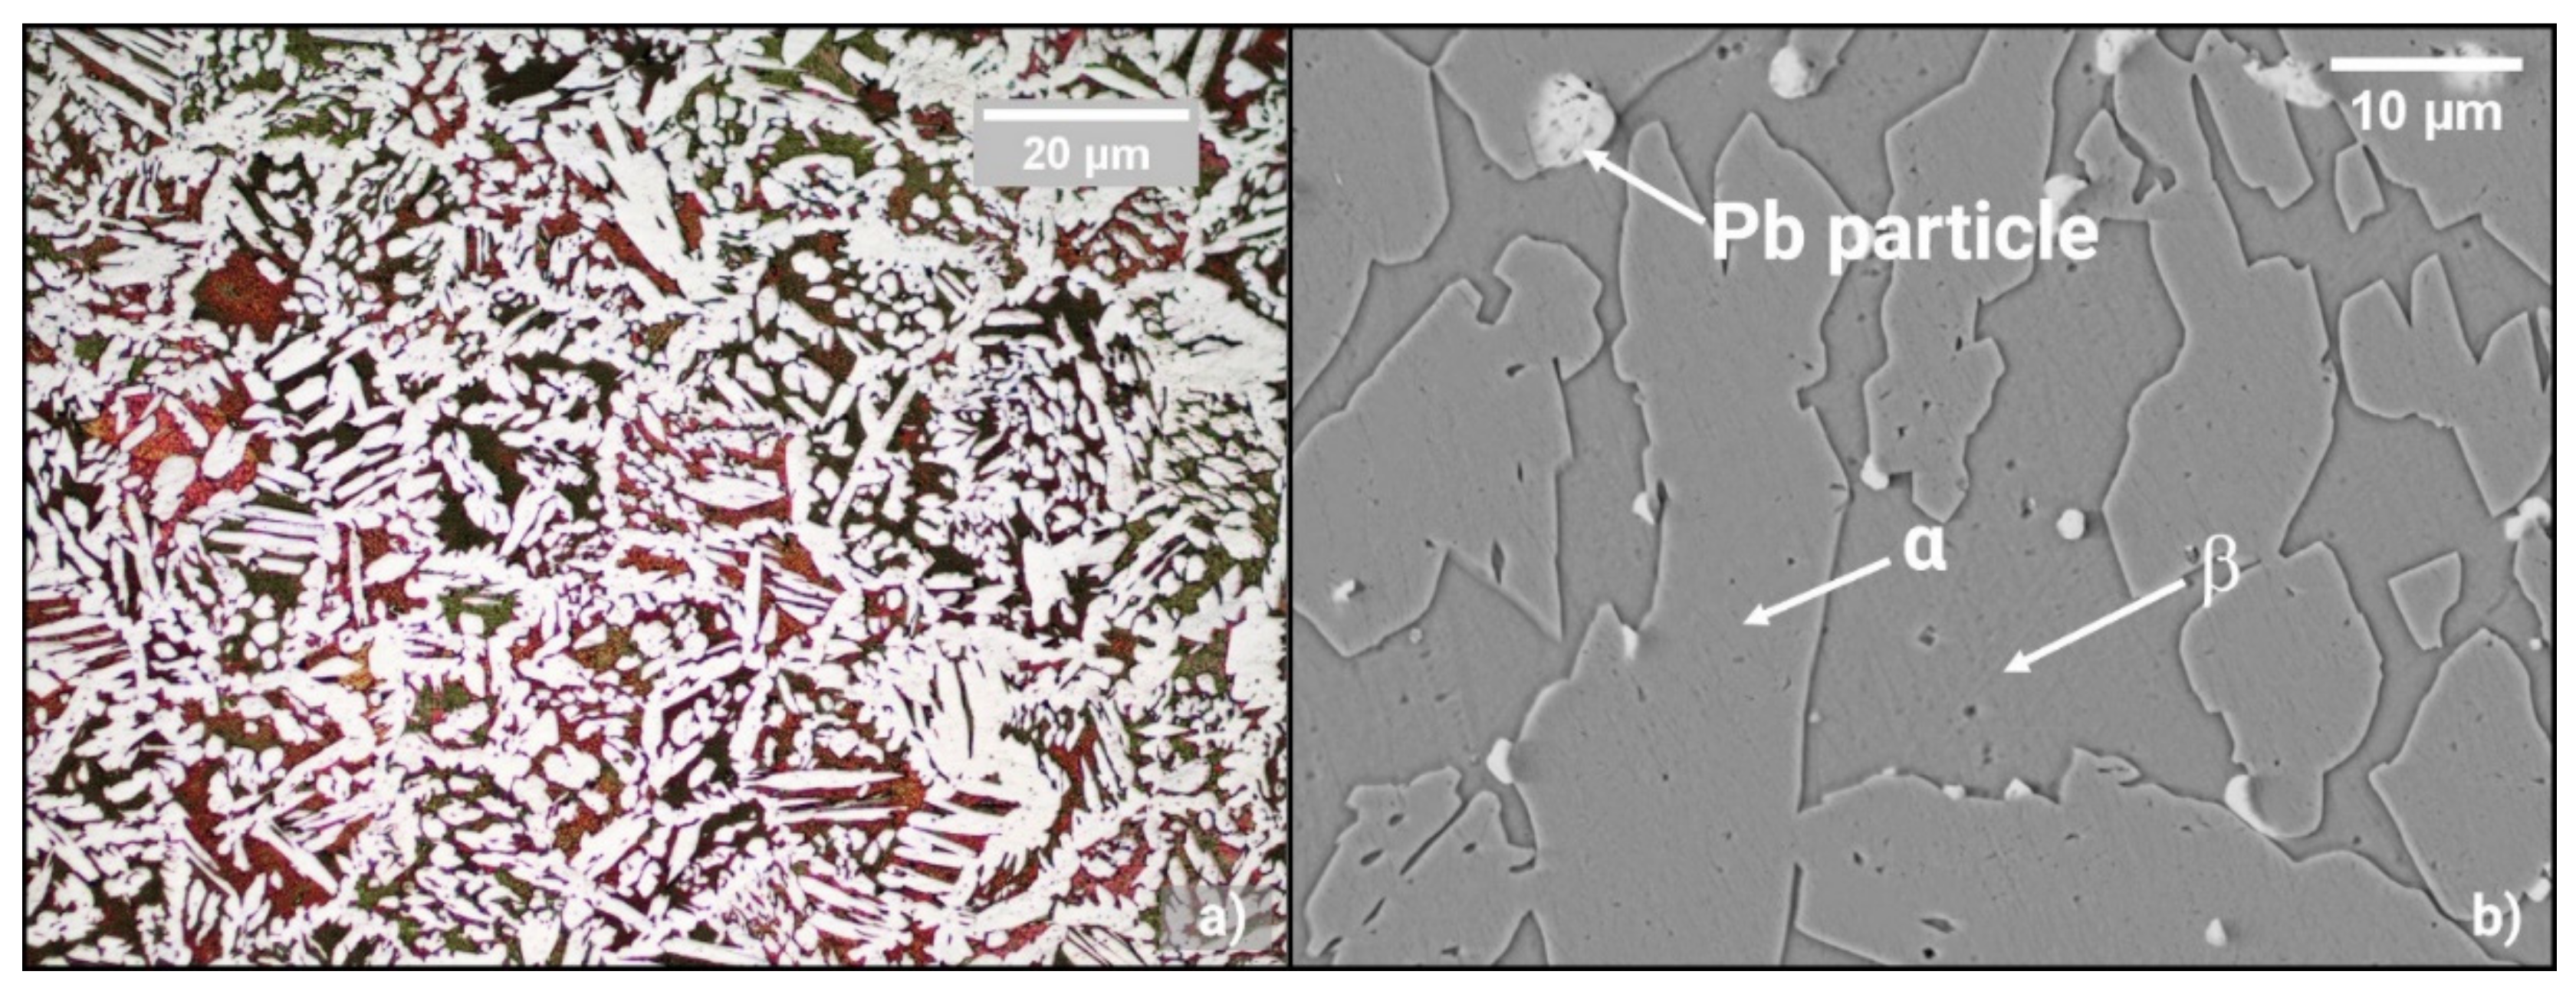
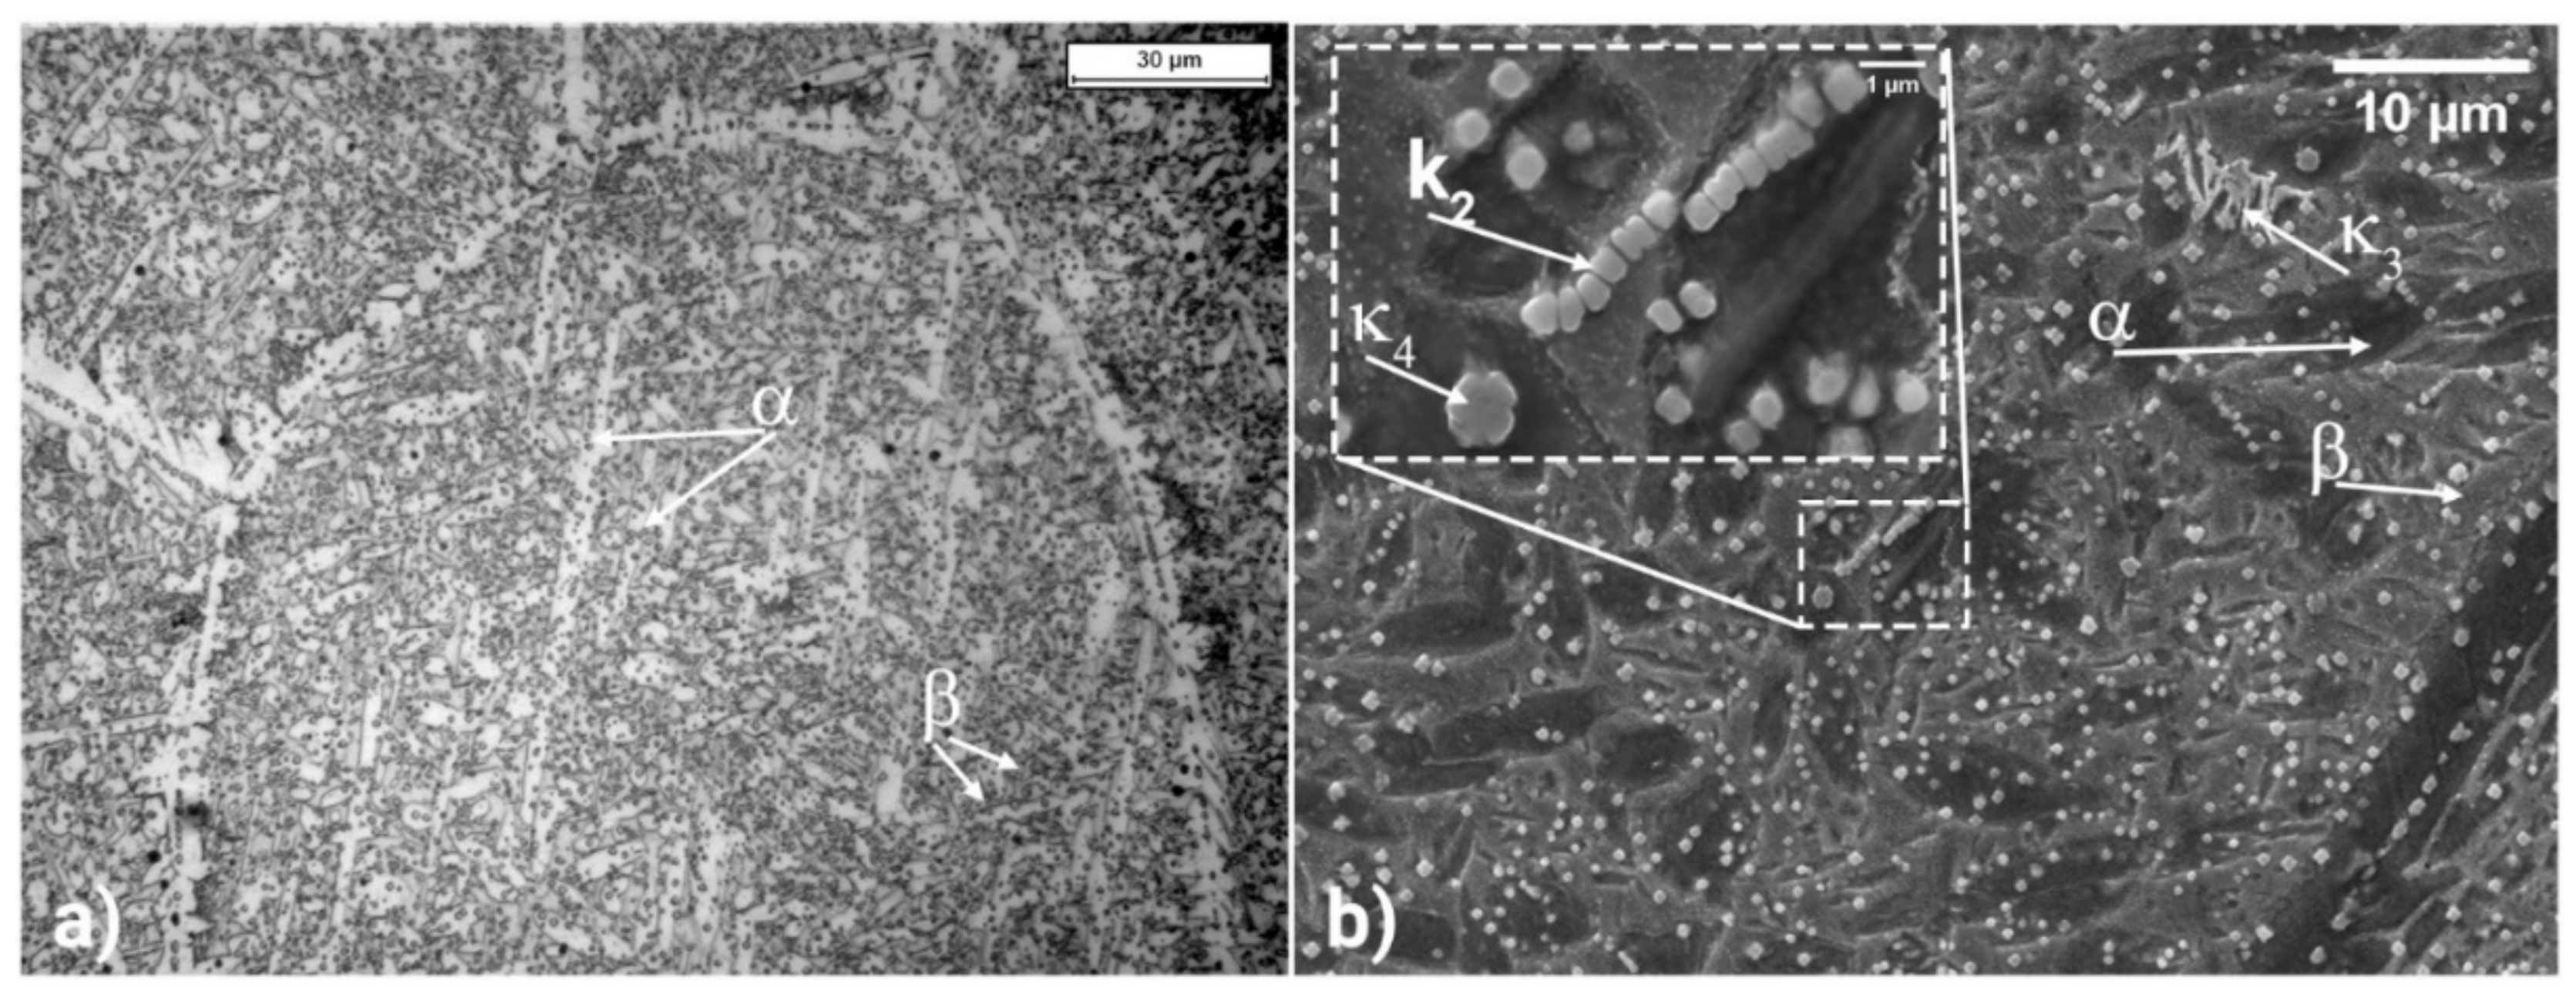
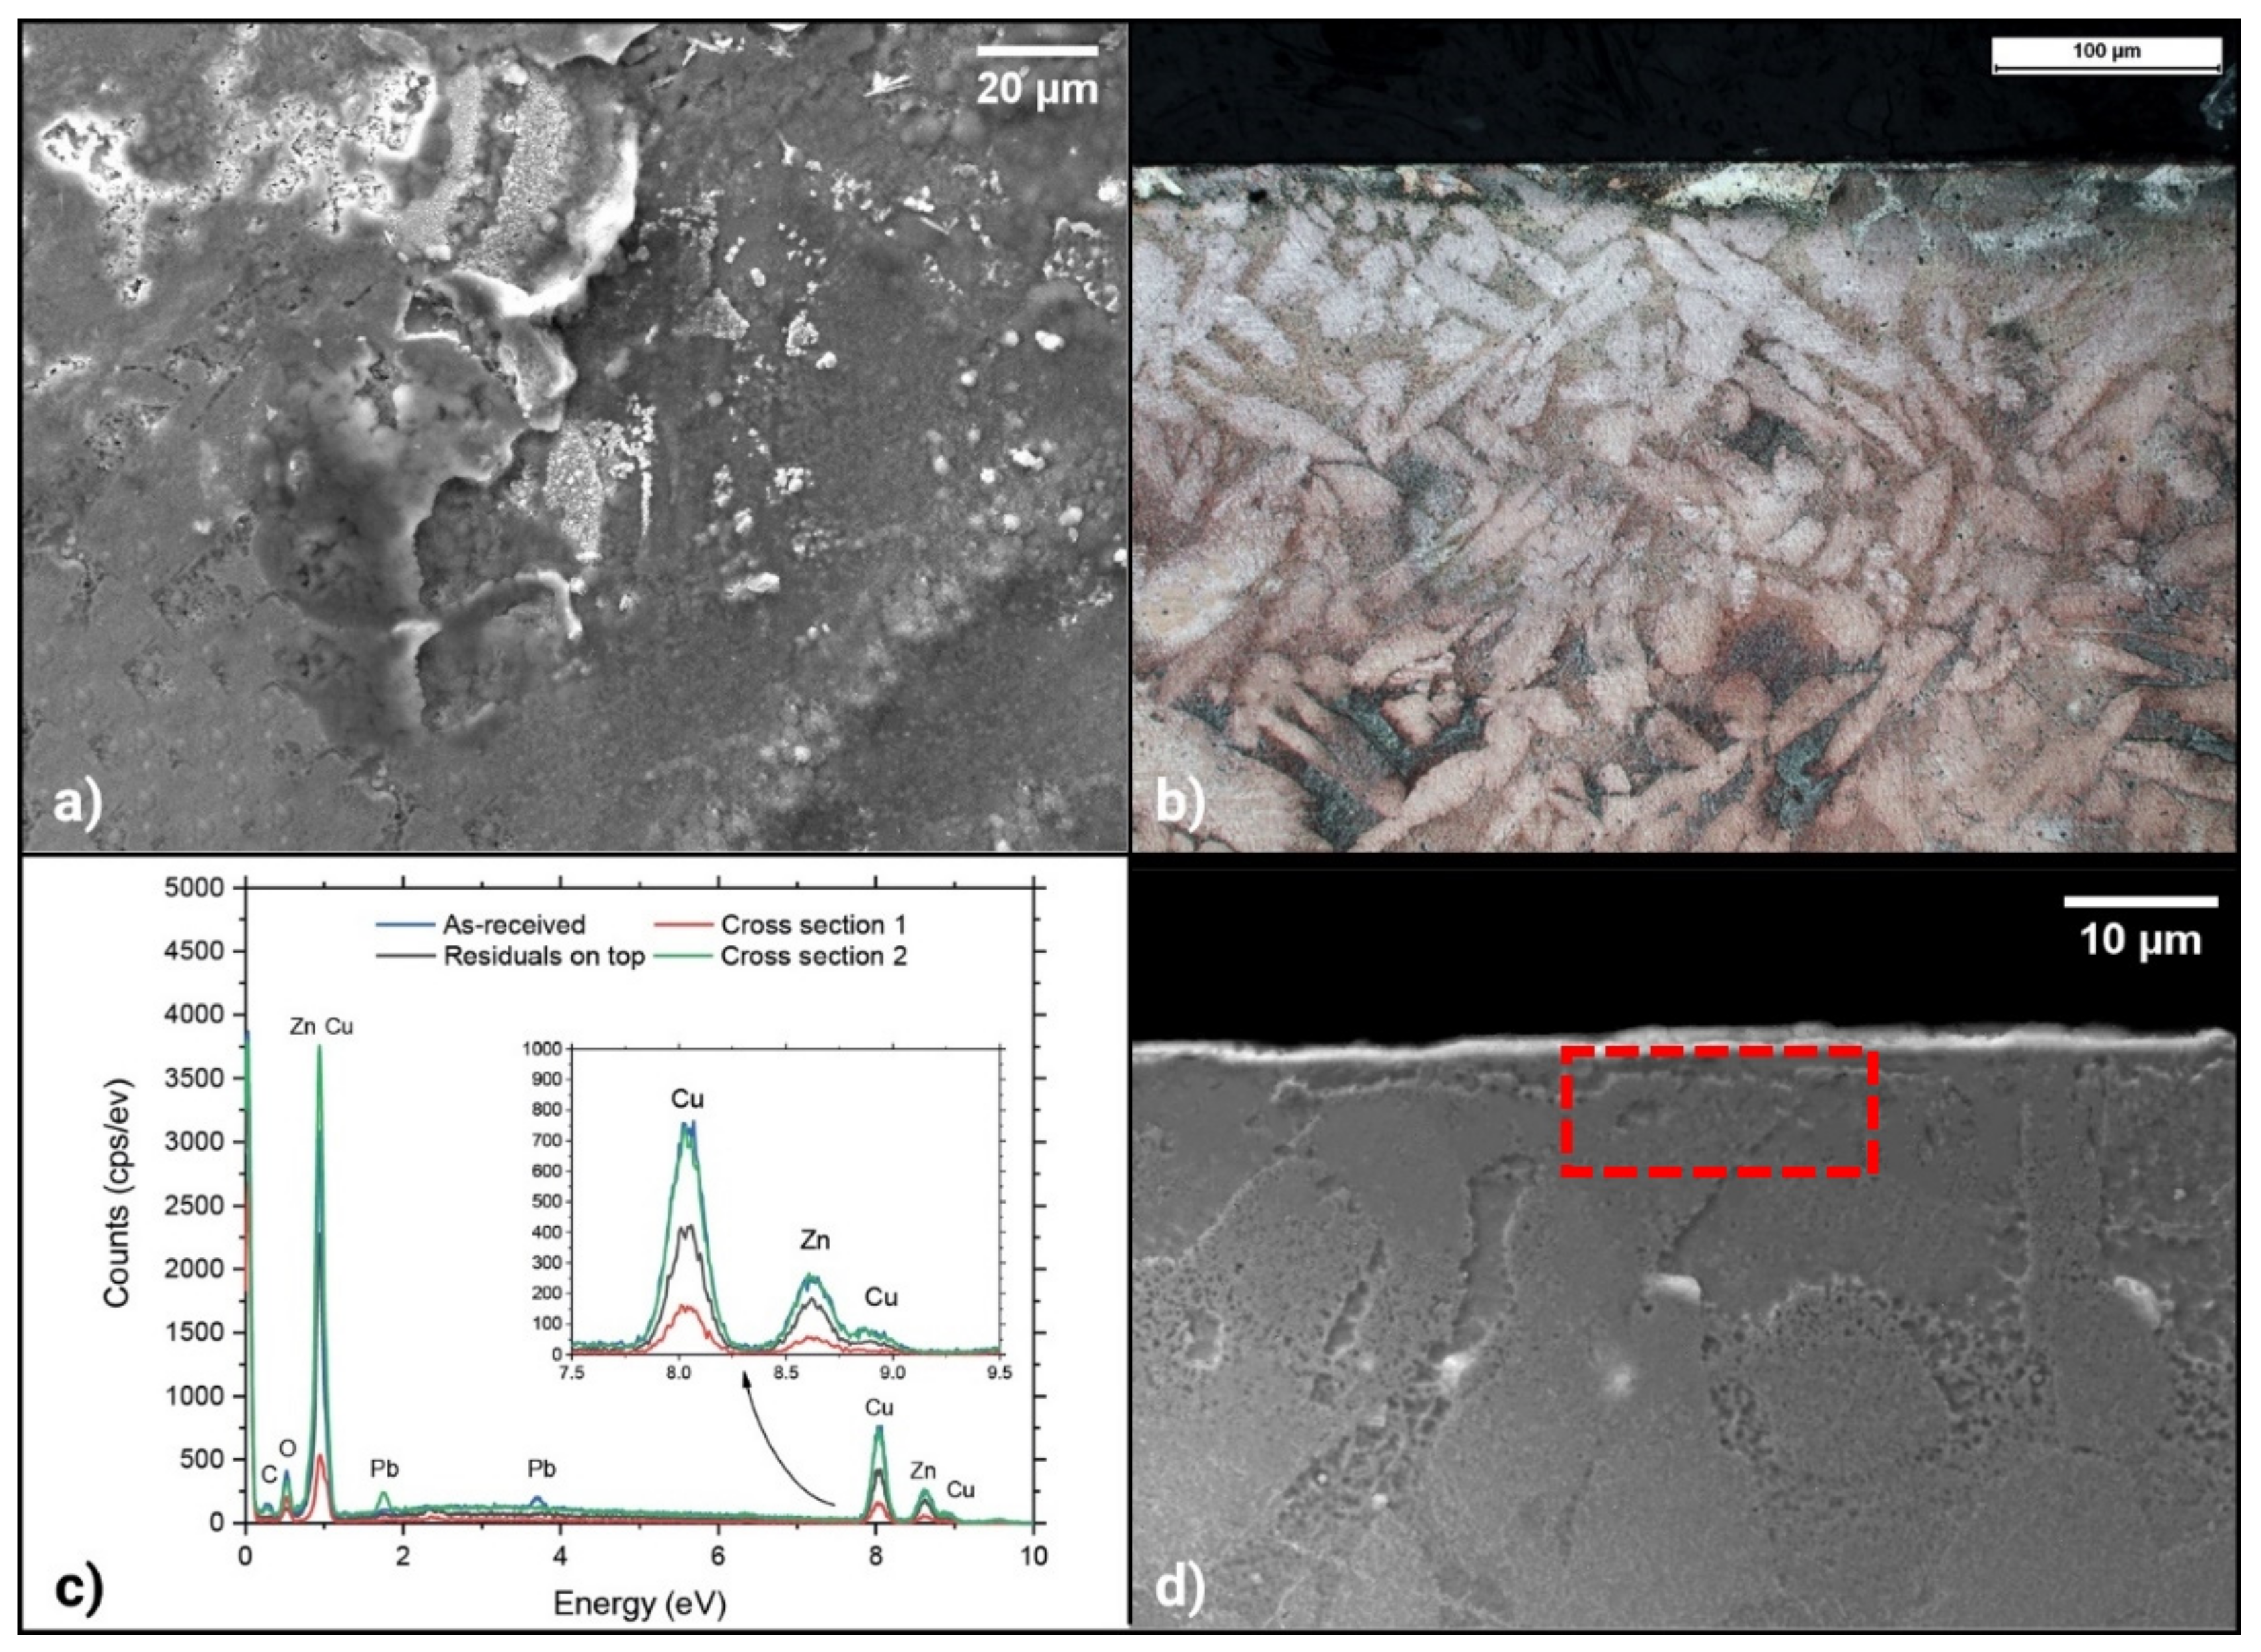
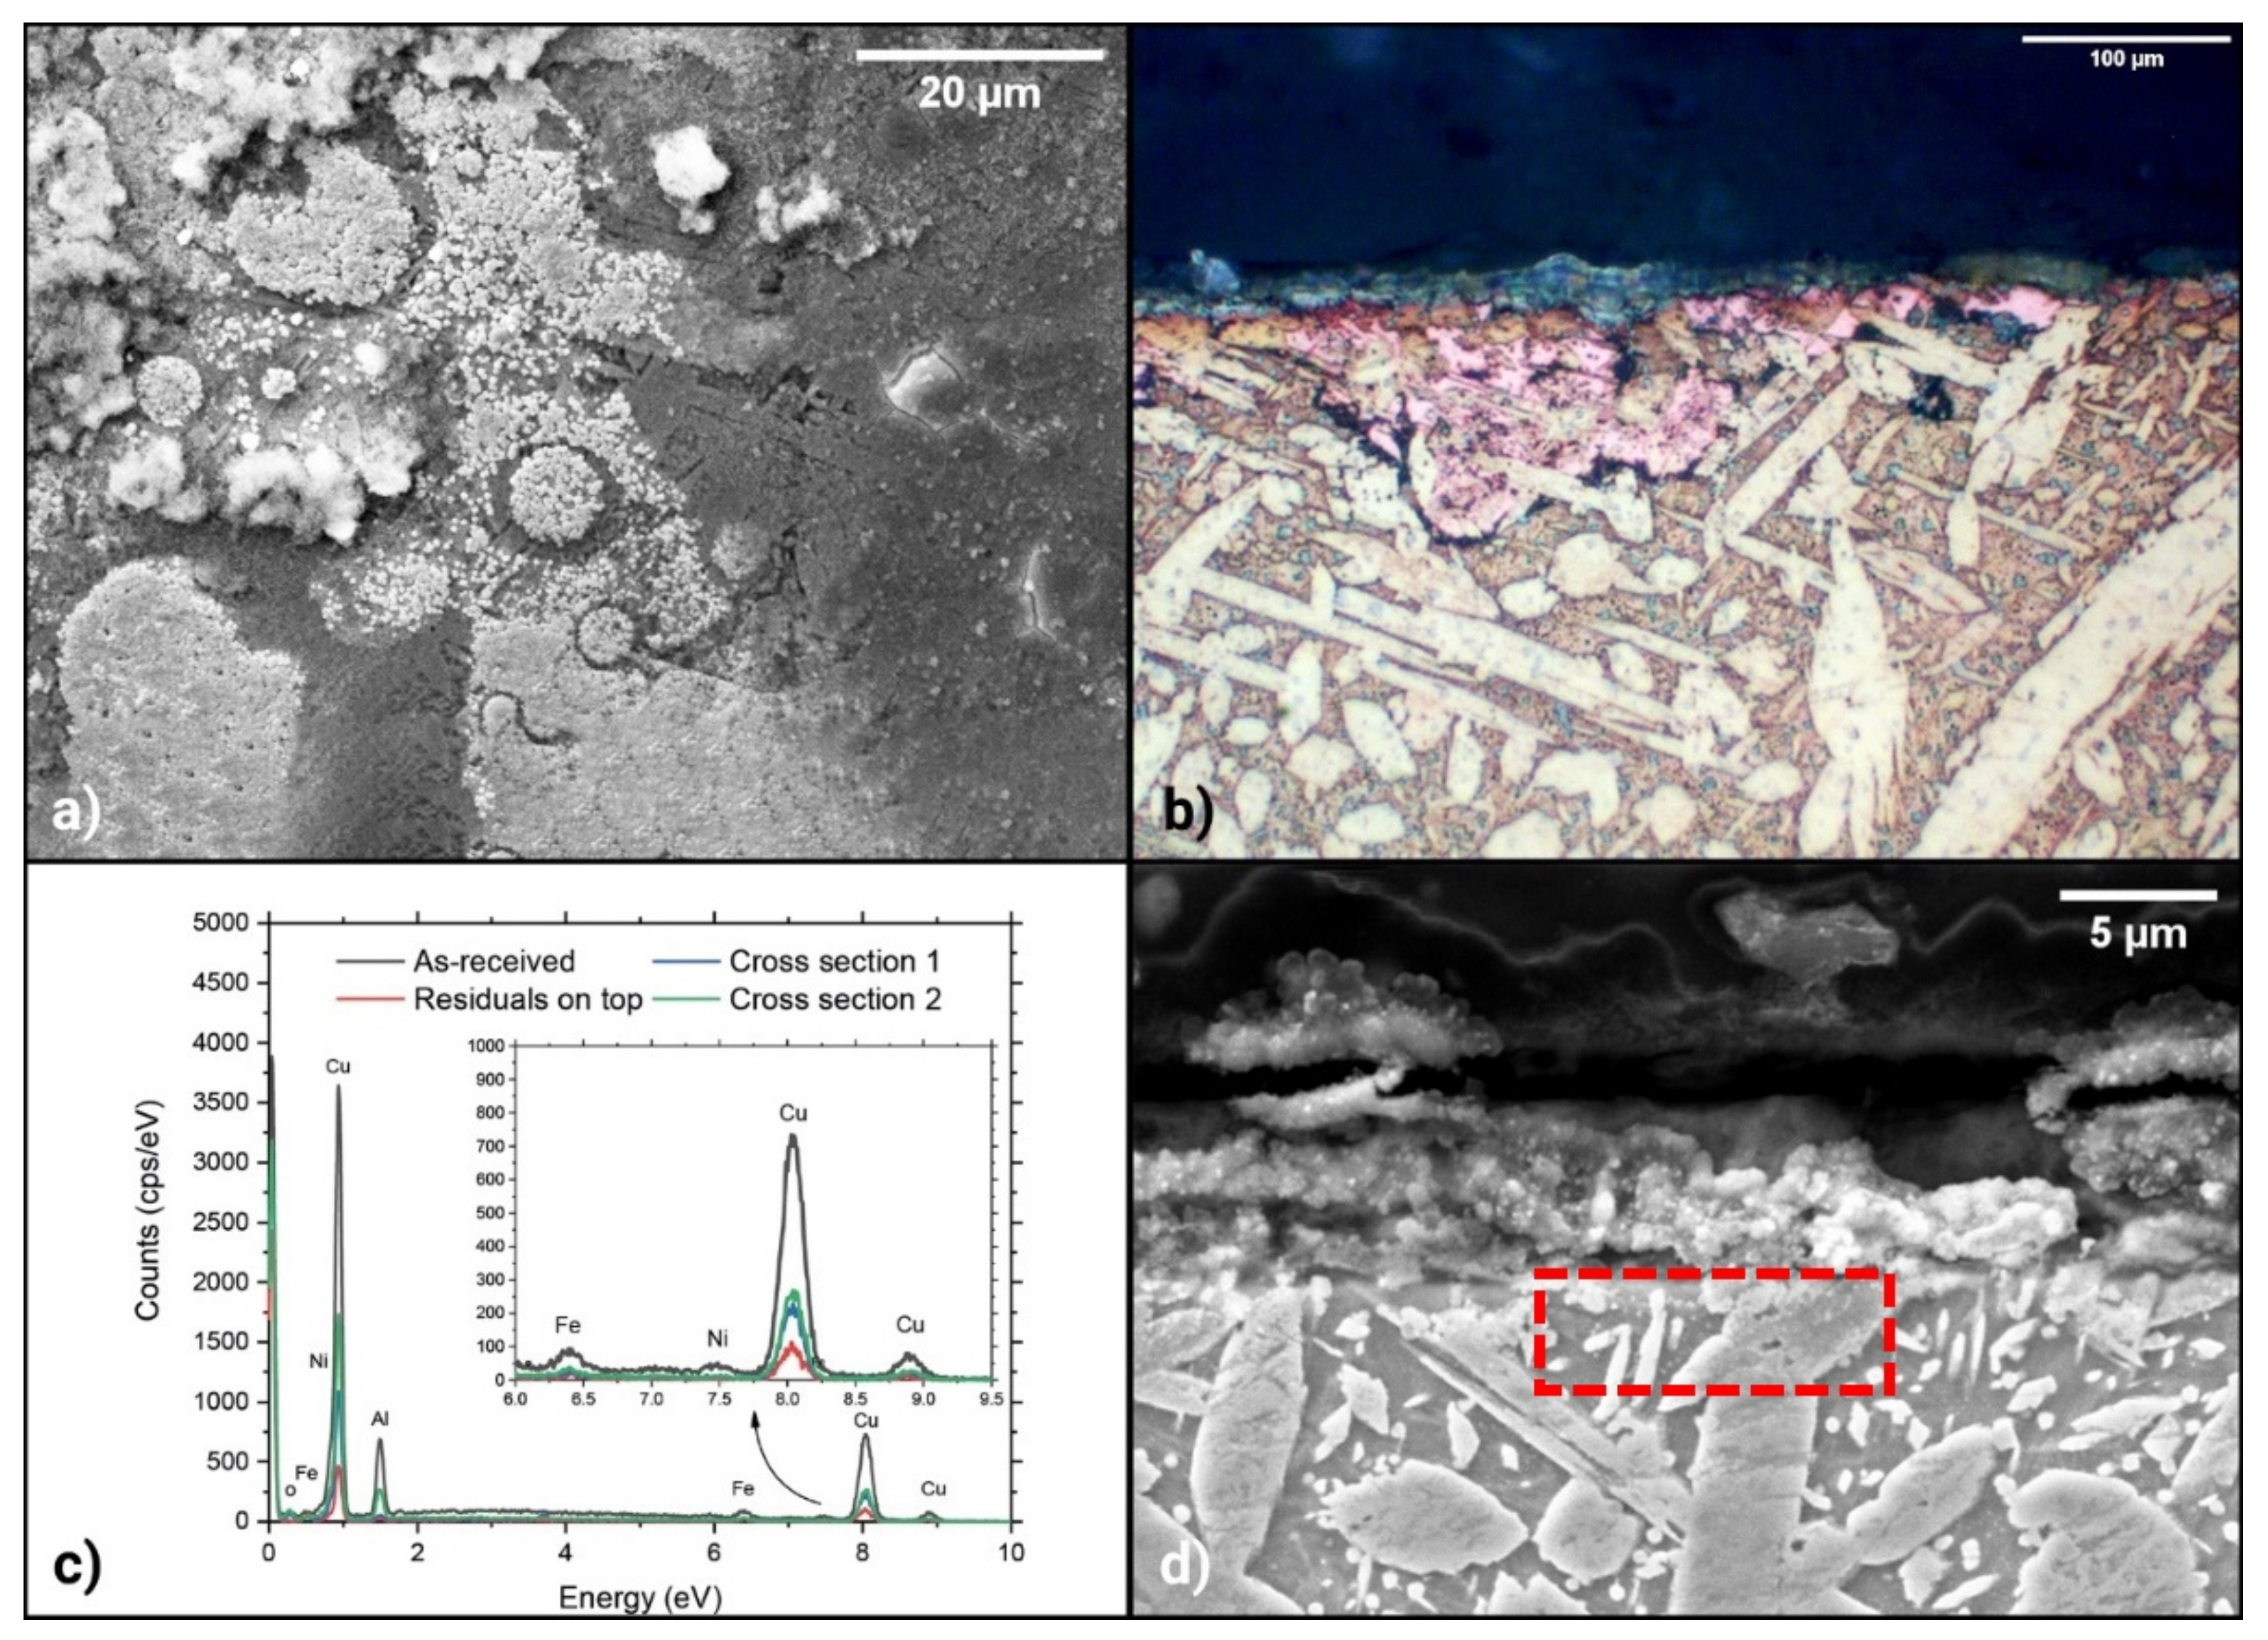
3.1. Core Microstructure of Metallic Substrates
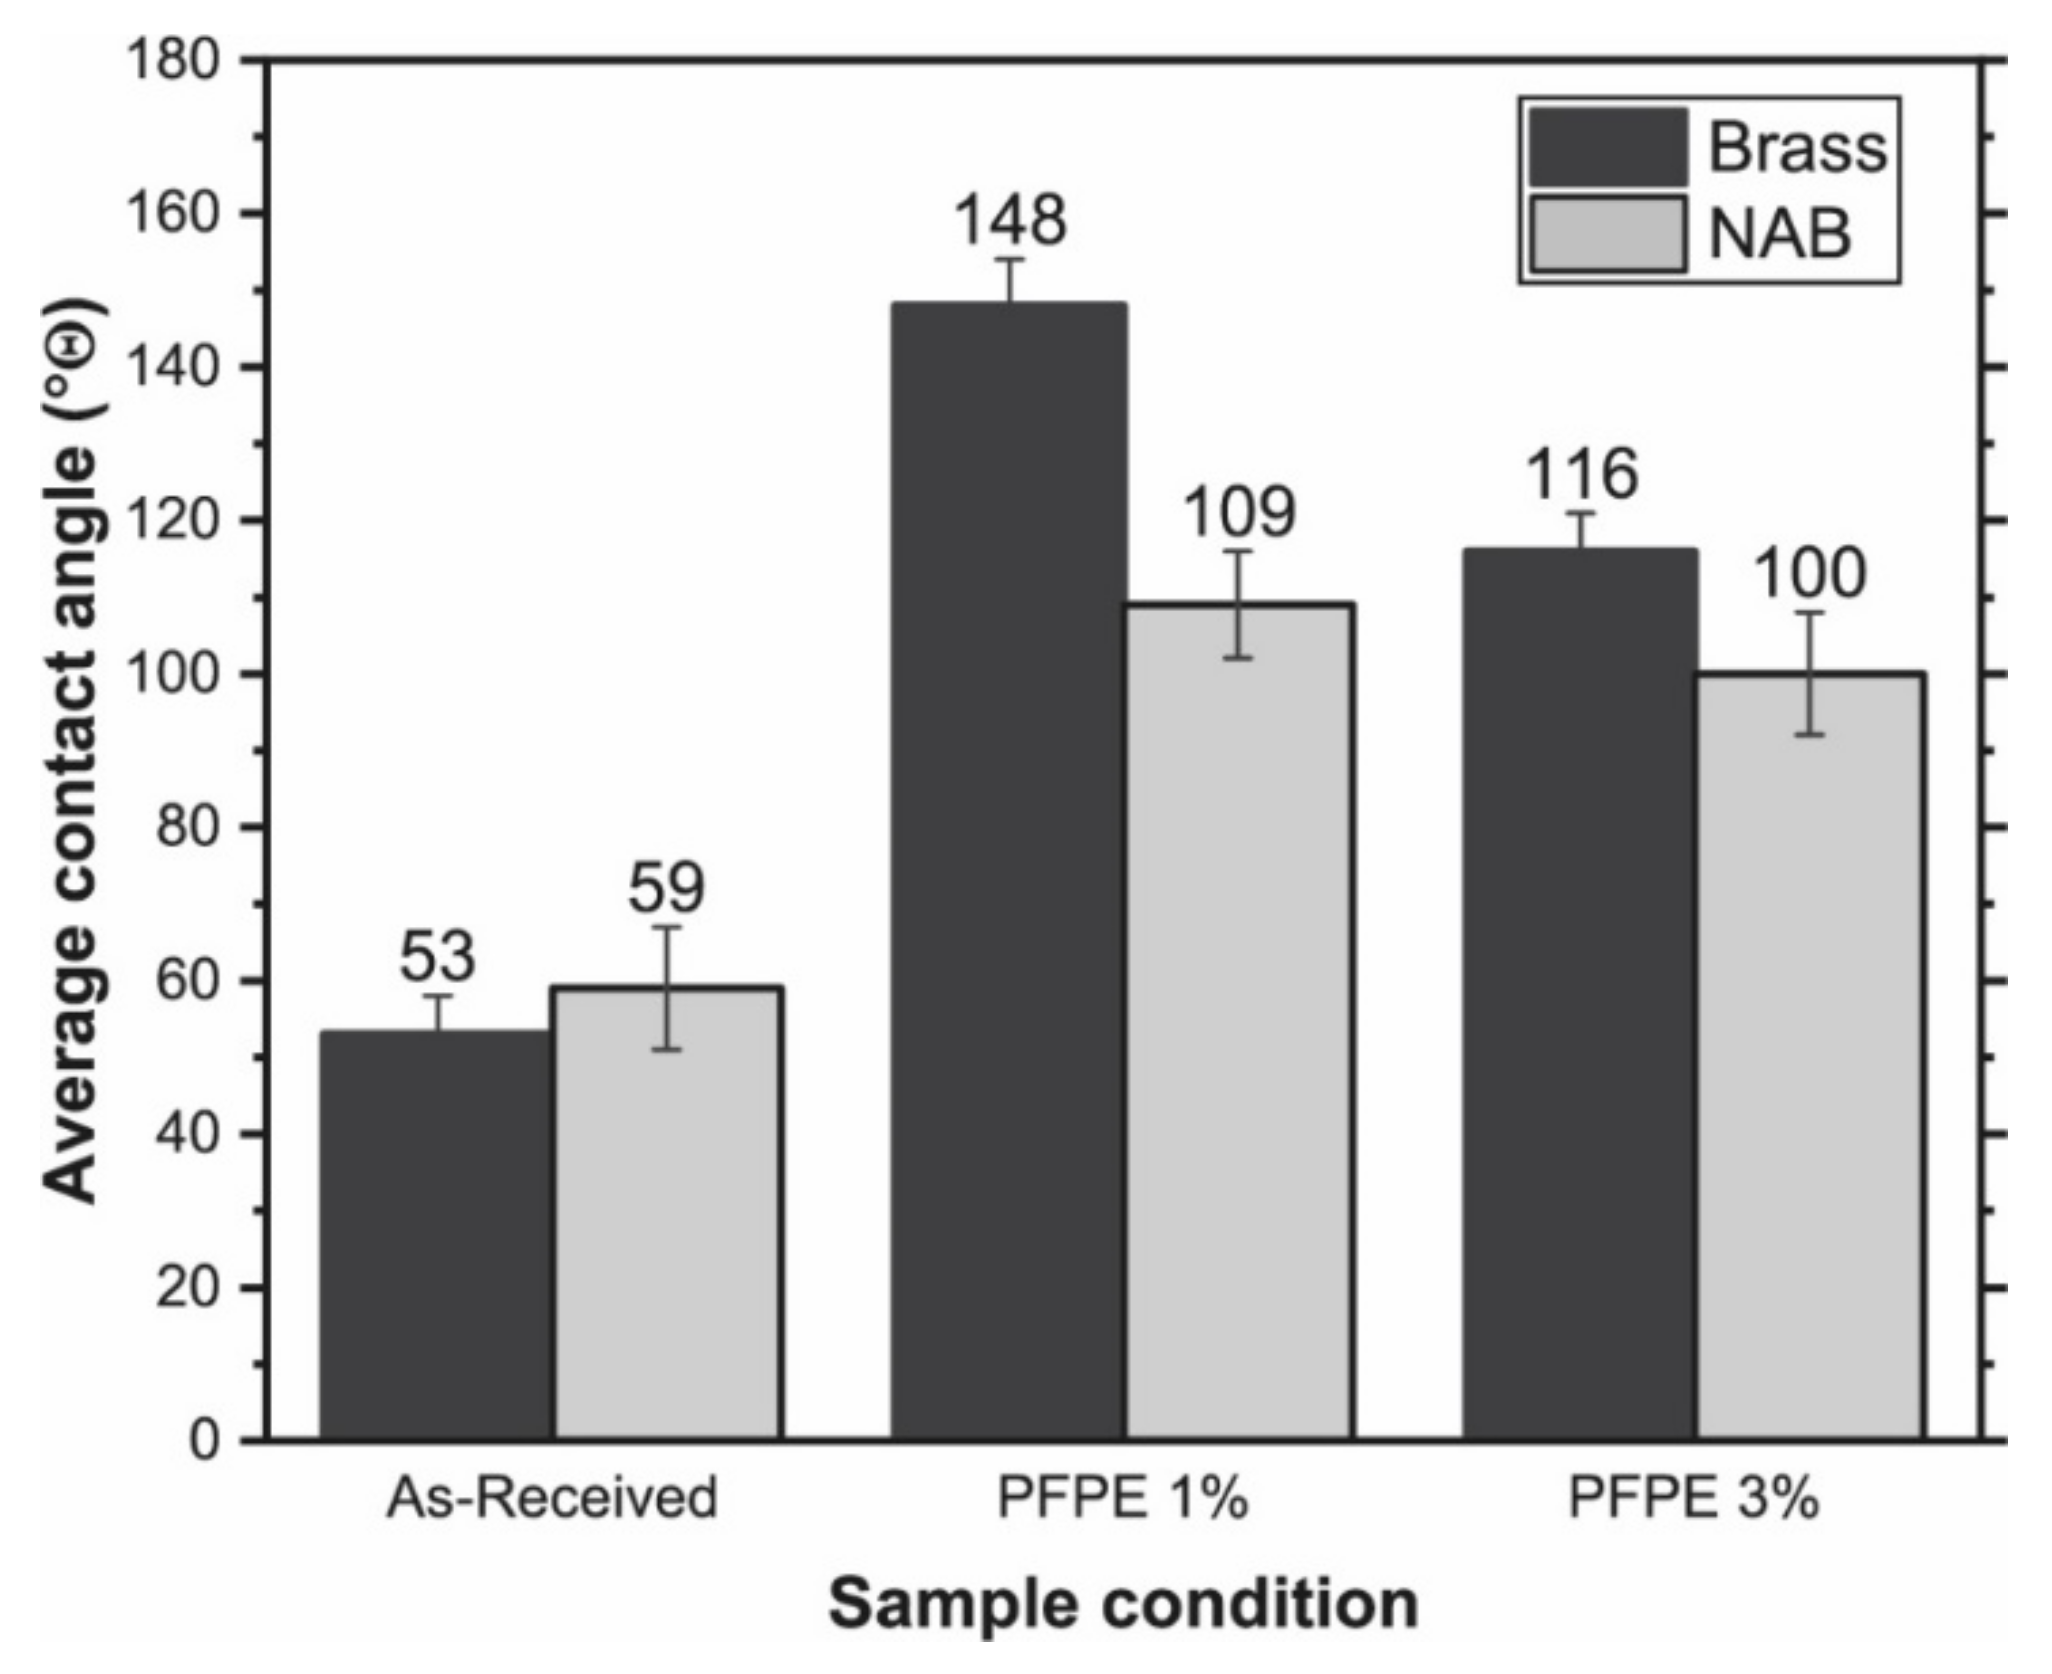
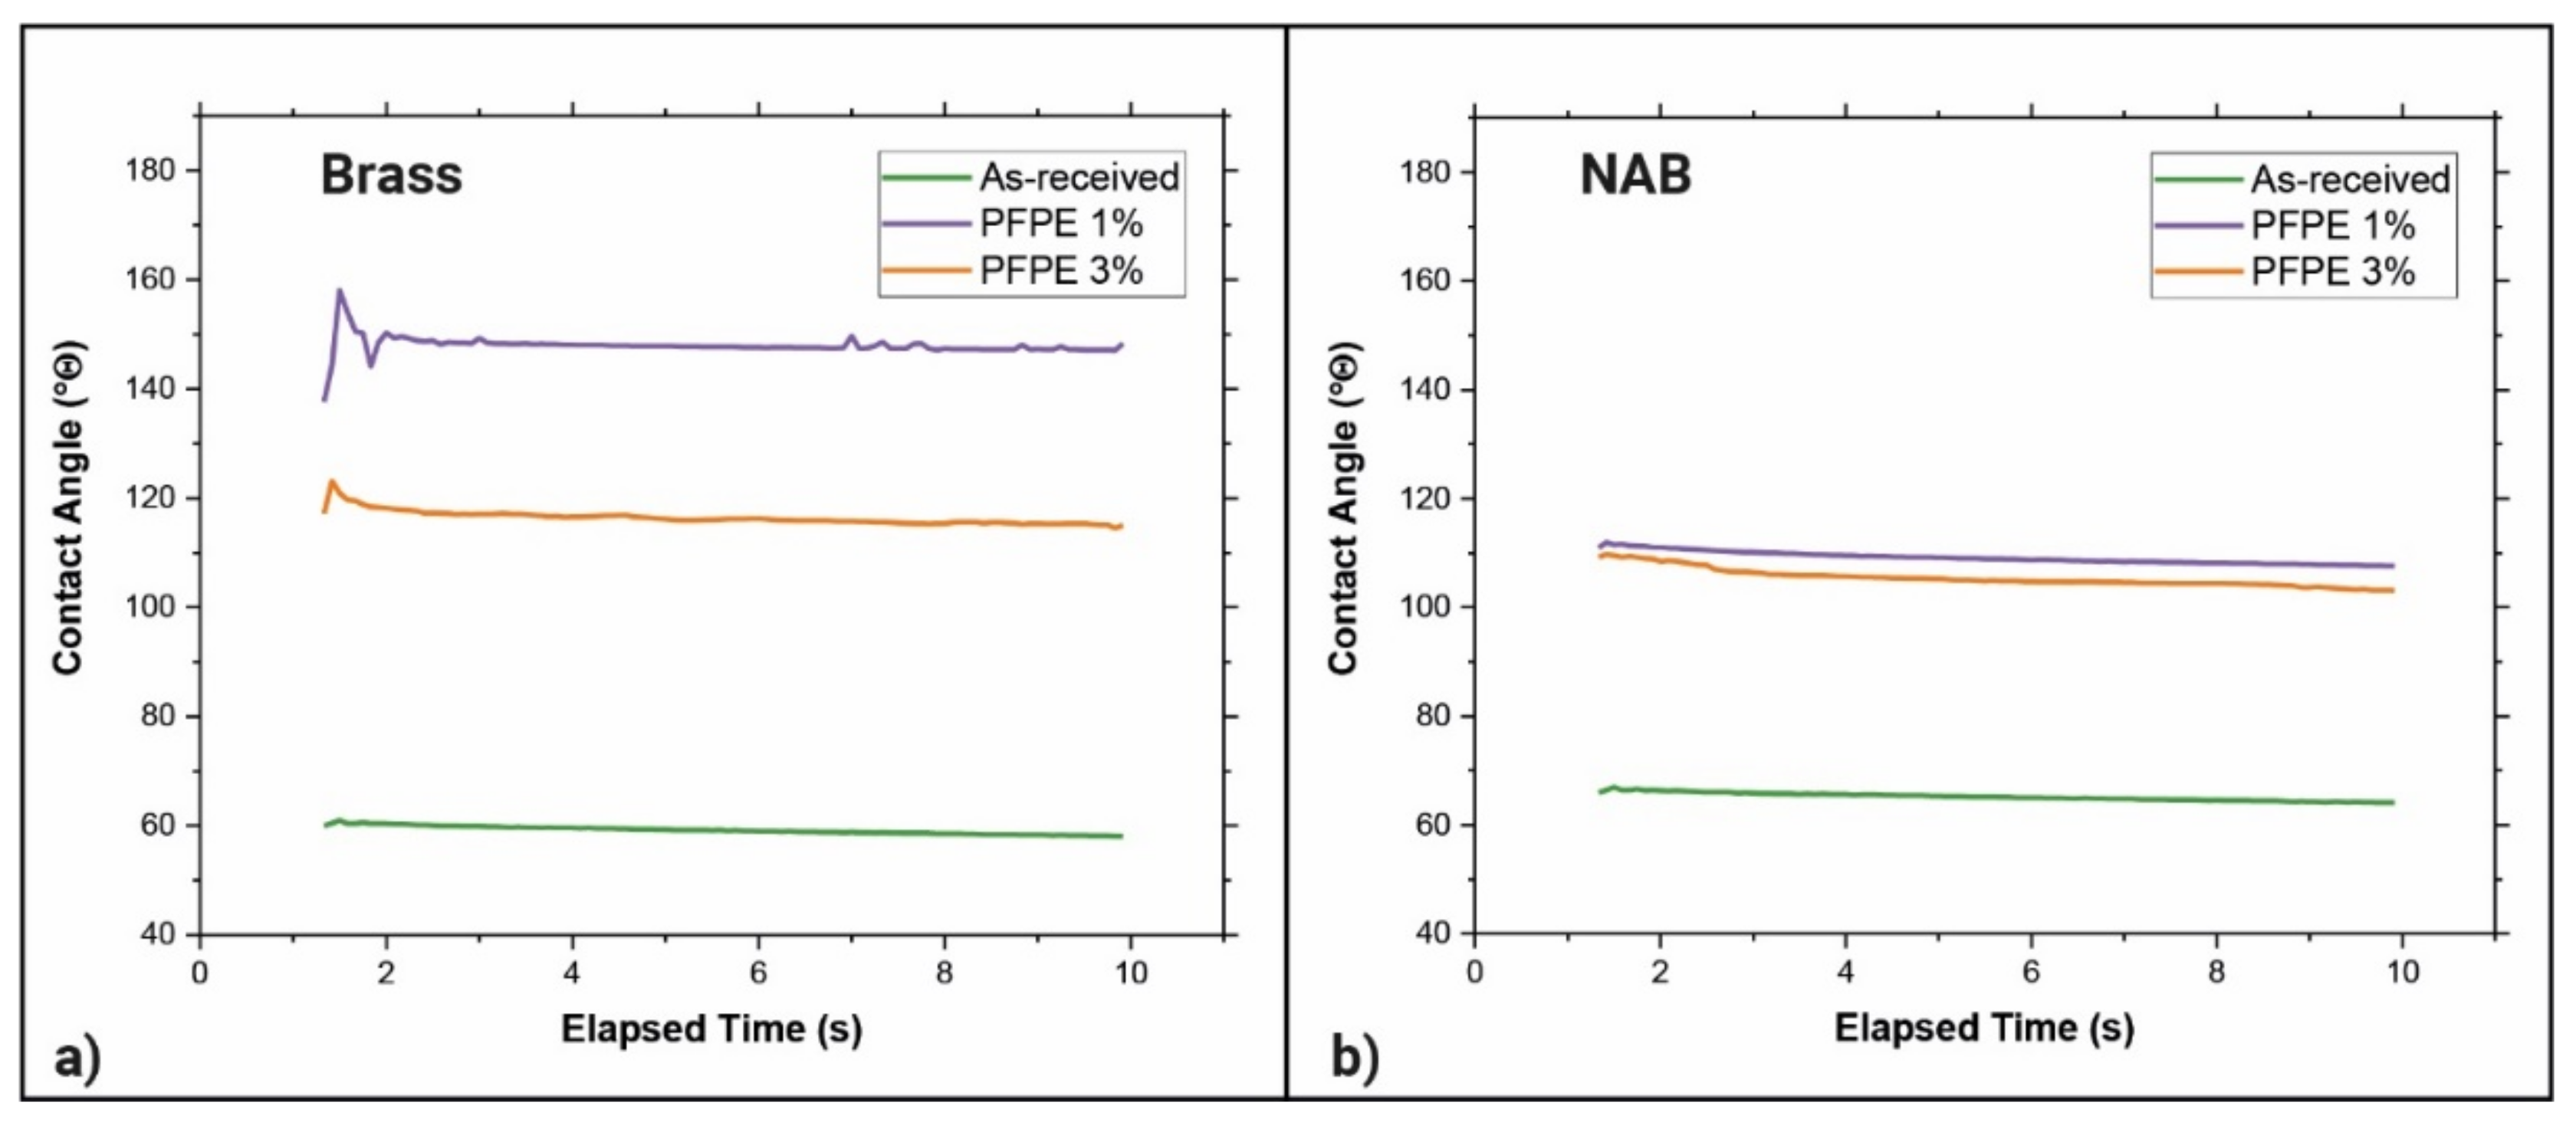
3.2. Surface Wettability and Contact Angle Assessment
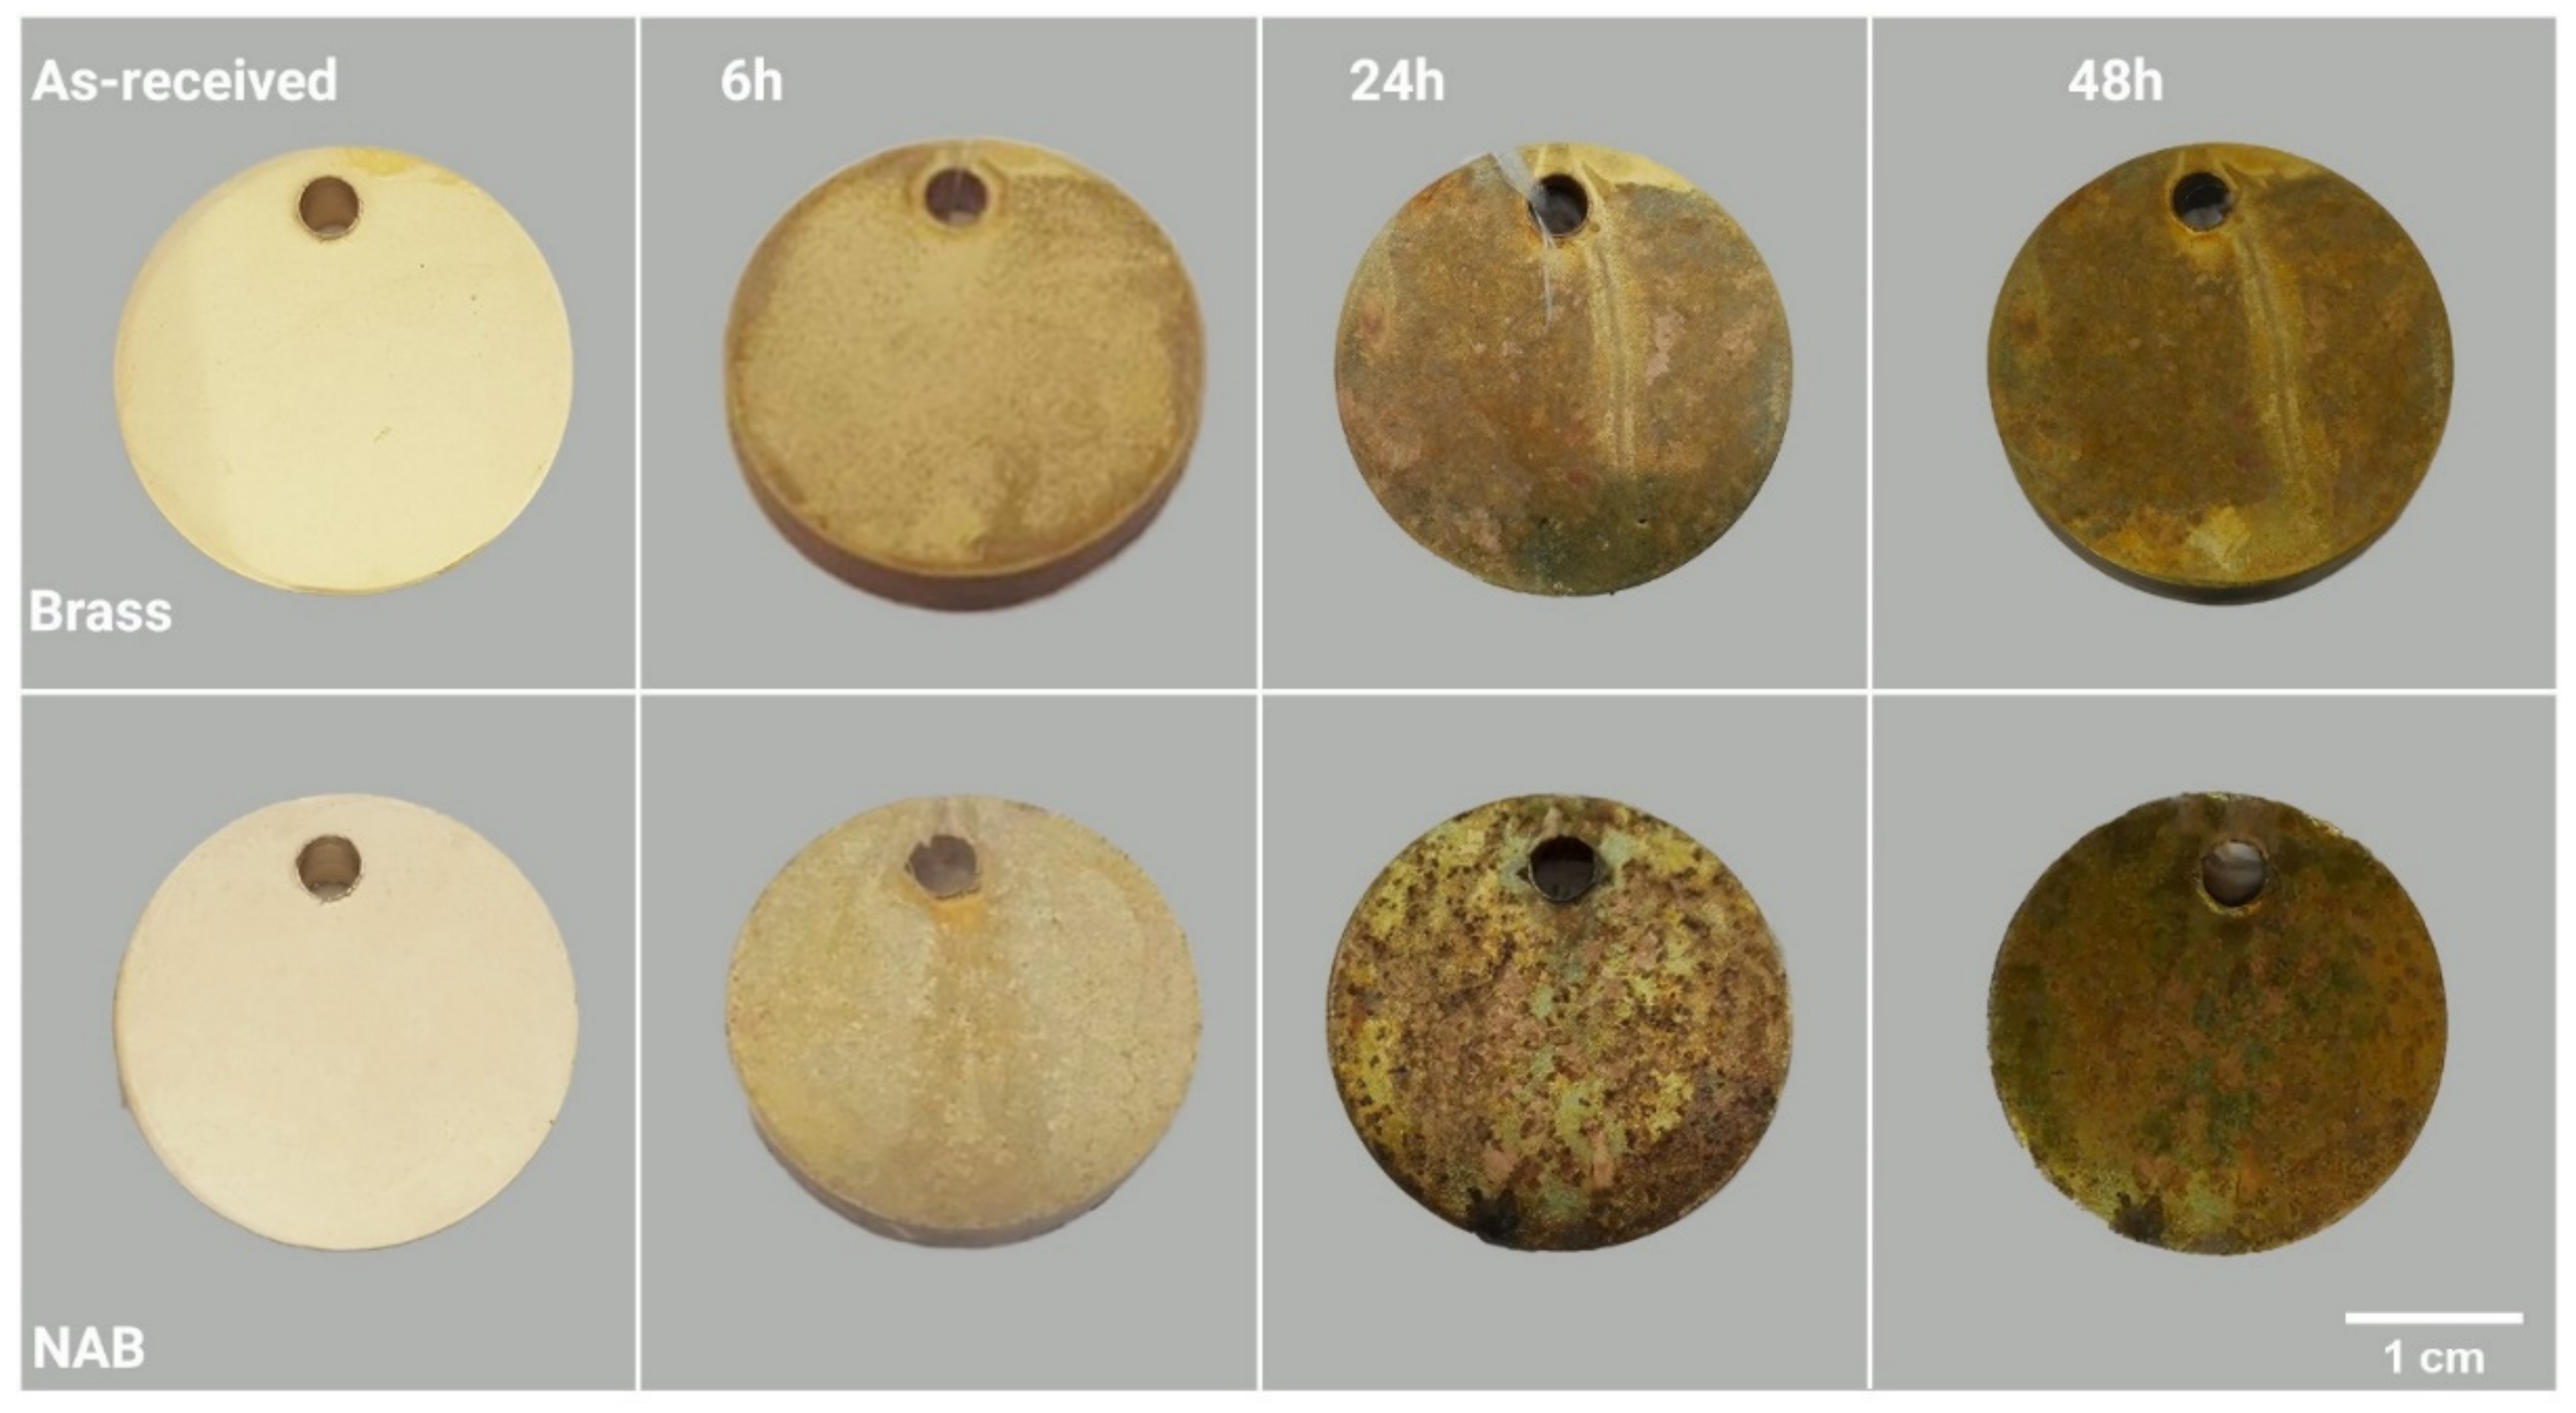
3.3. Corrosion of Un-Coated Samples
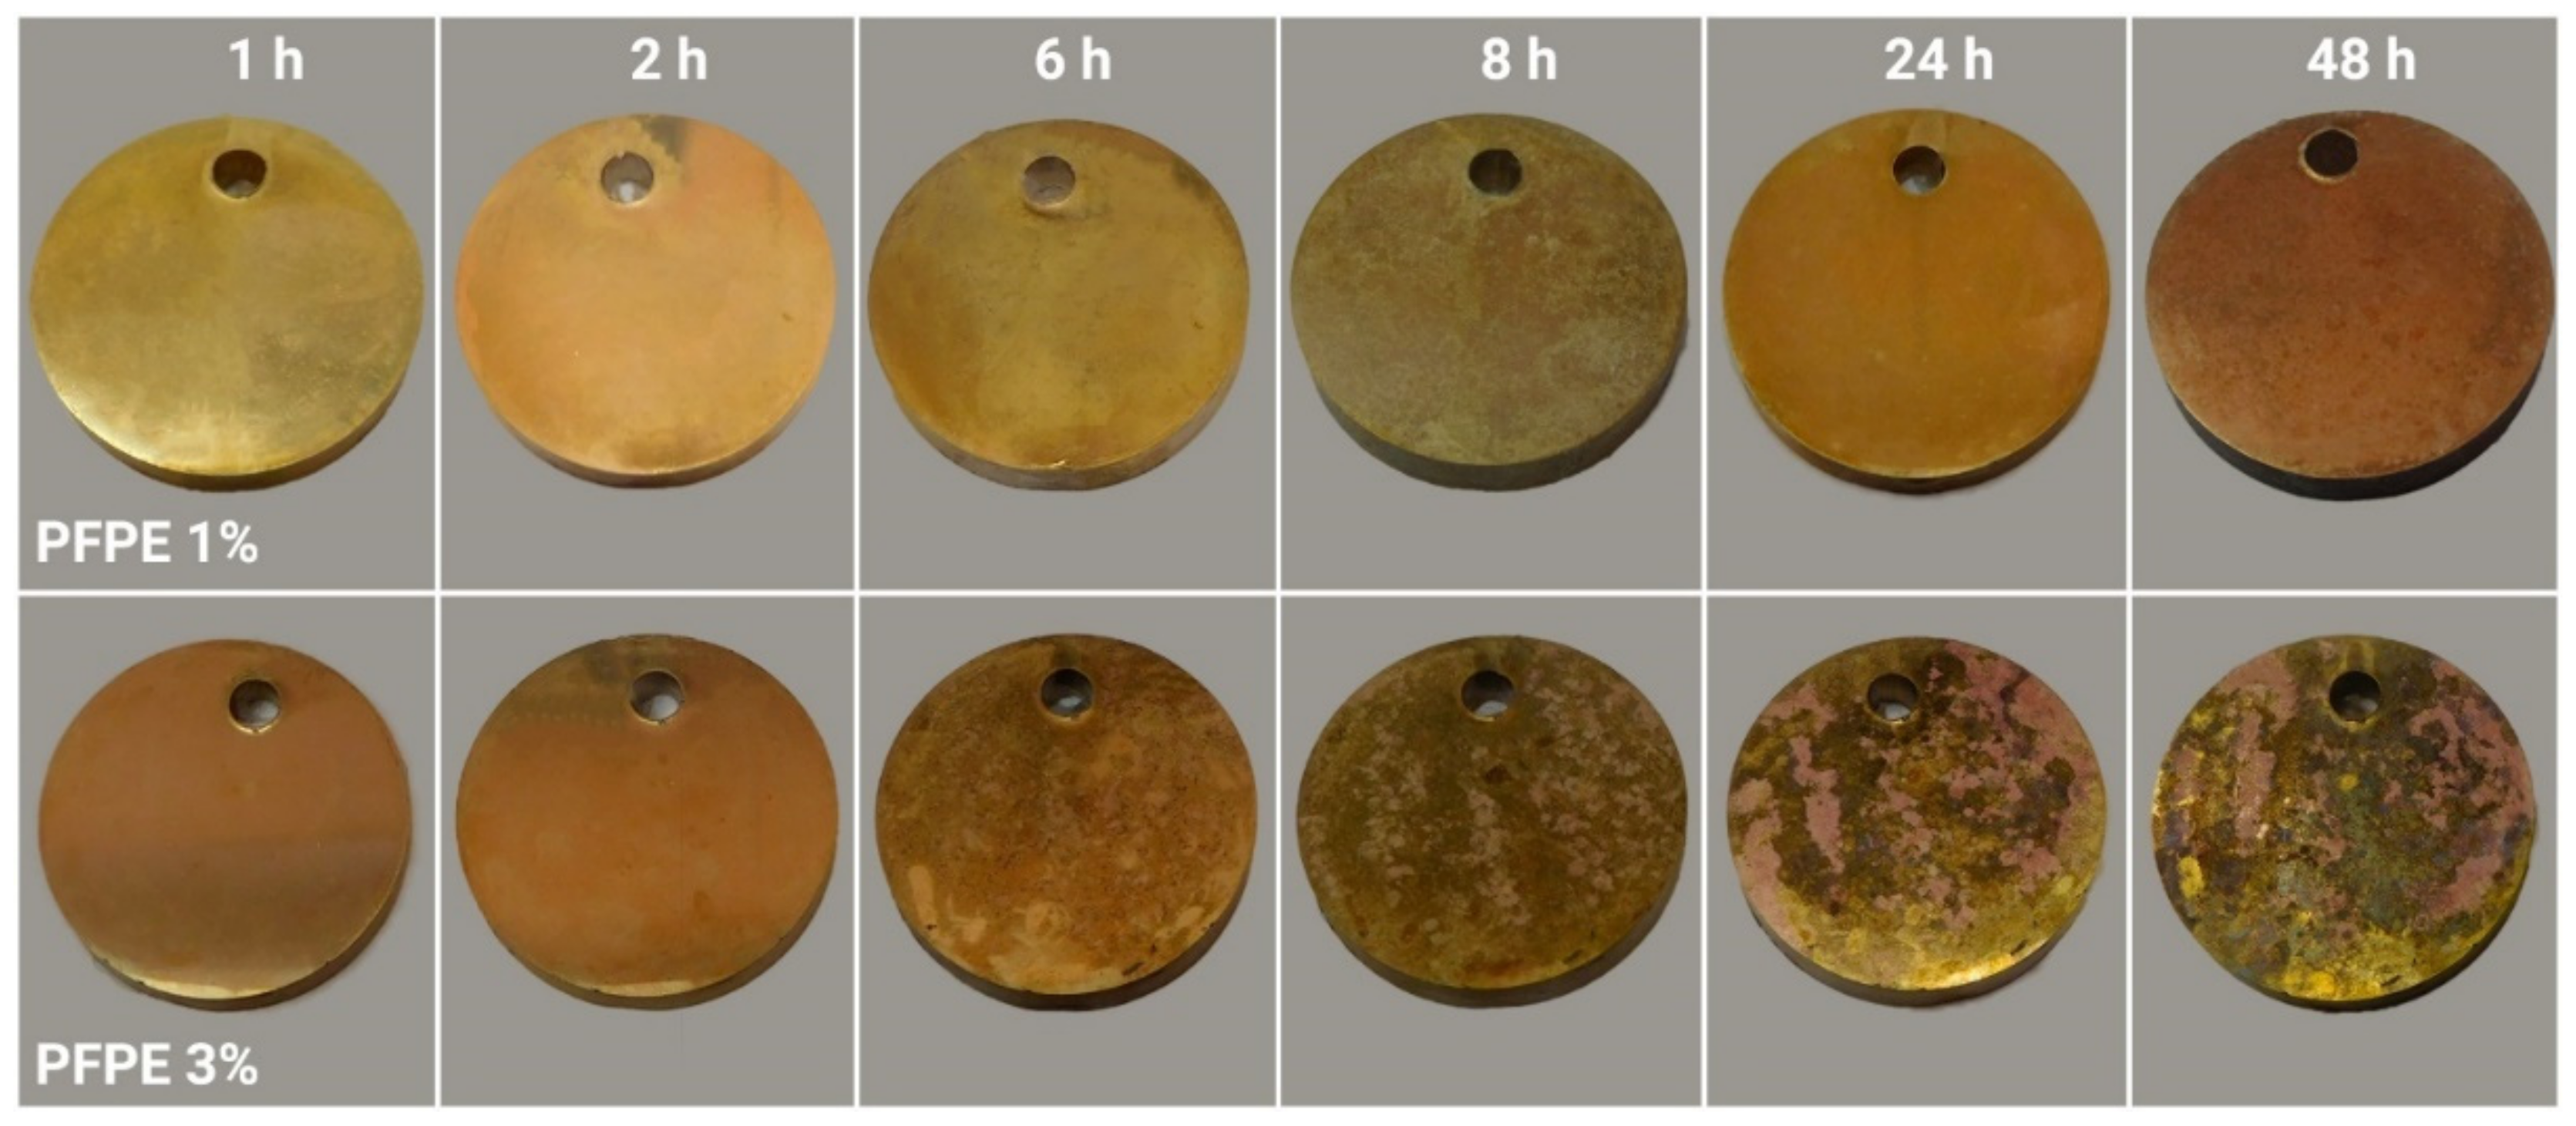
3.4. Corrosion of Coated Samples
4. Discussion
5. Conclusions
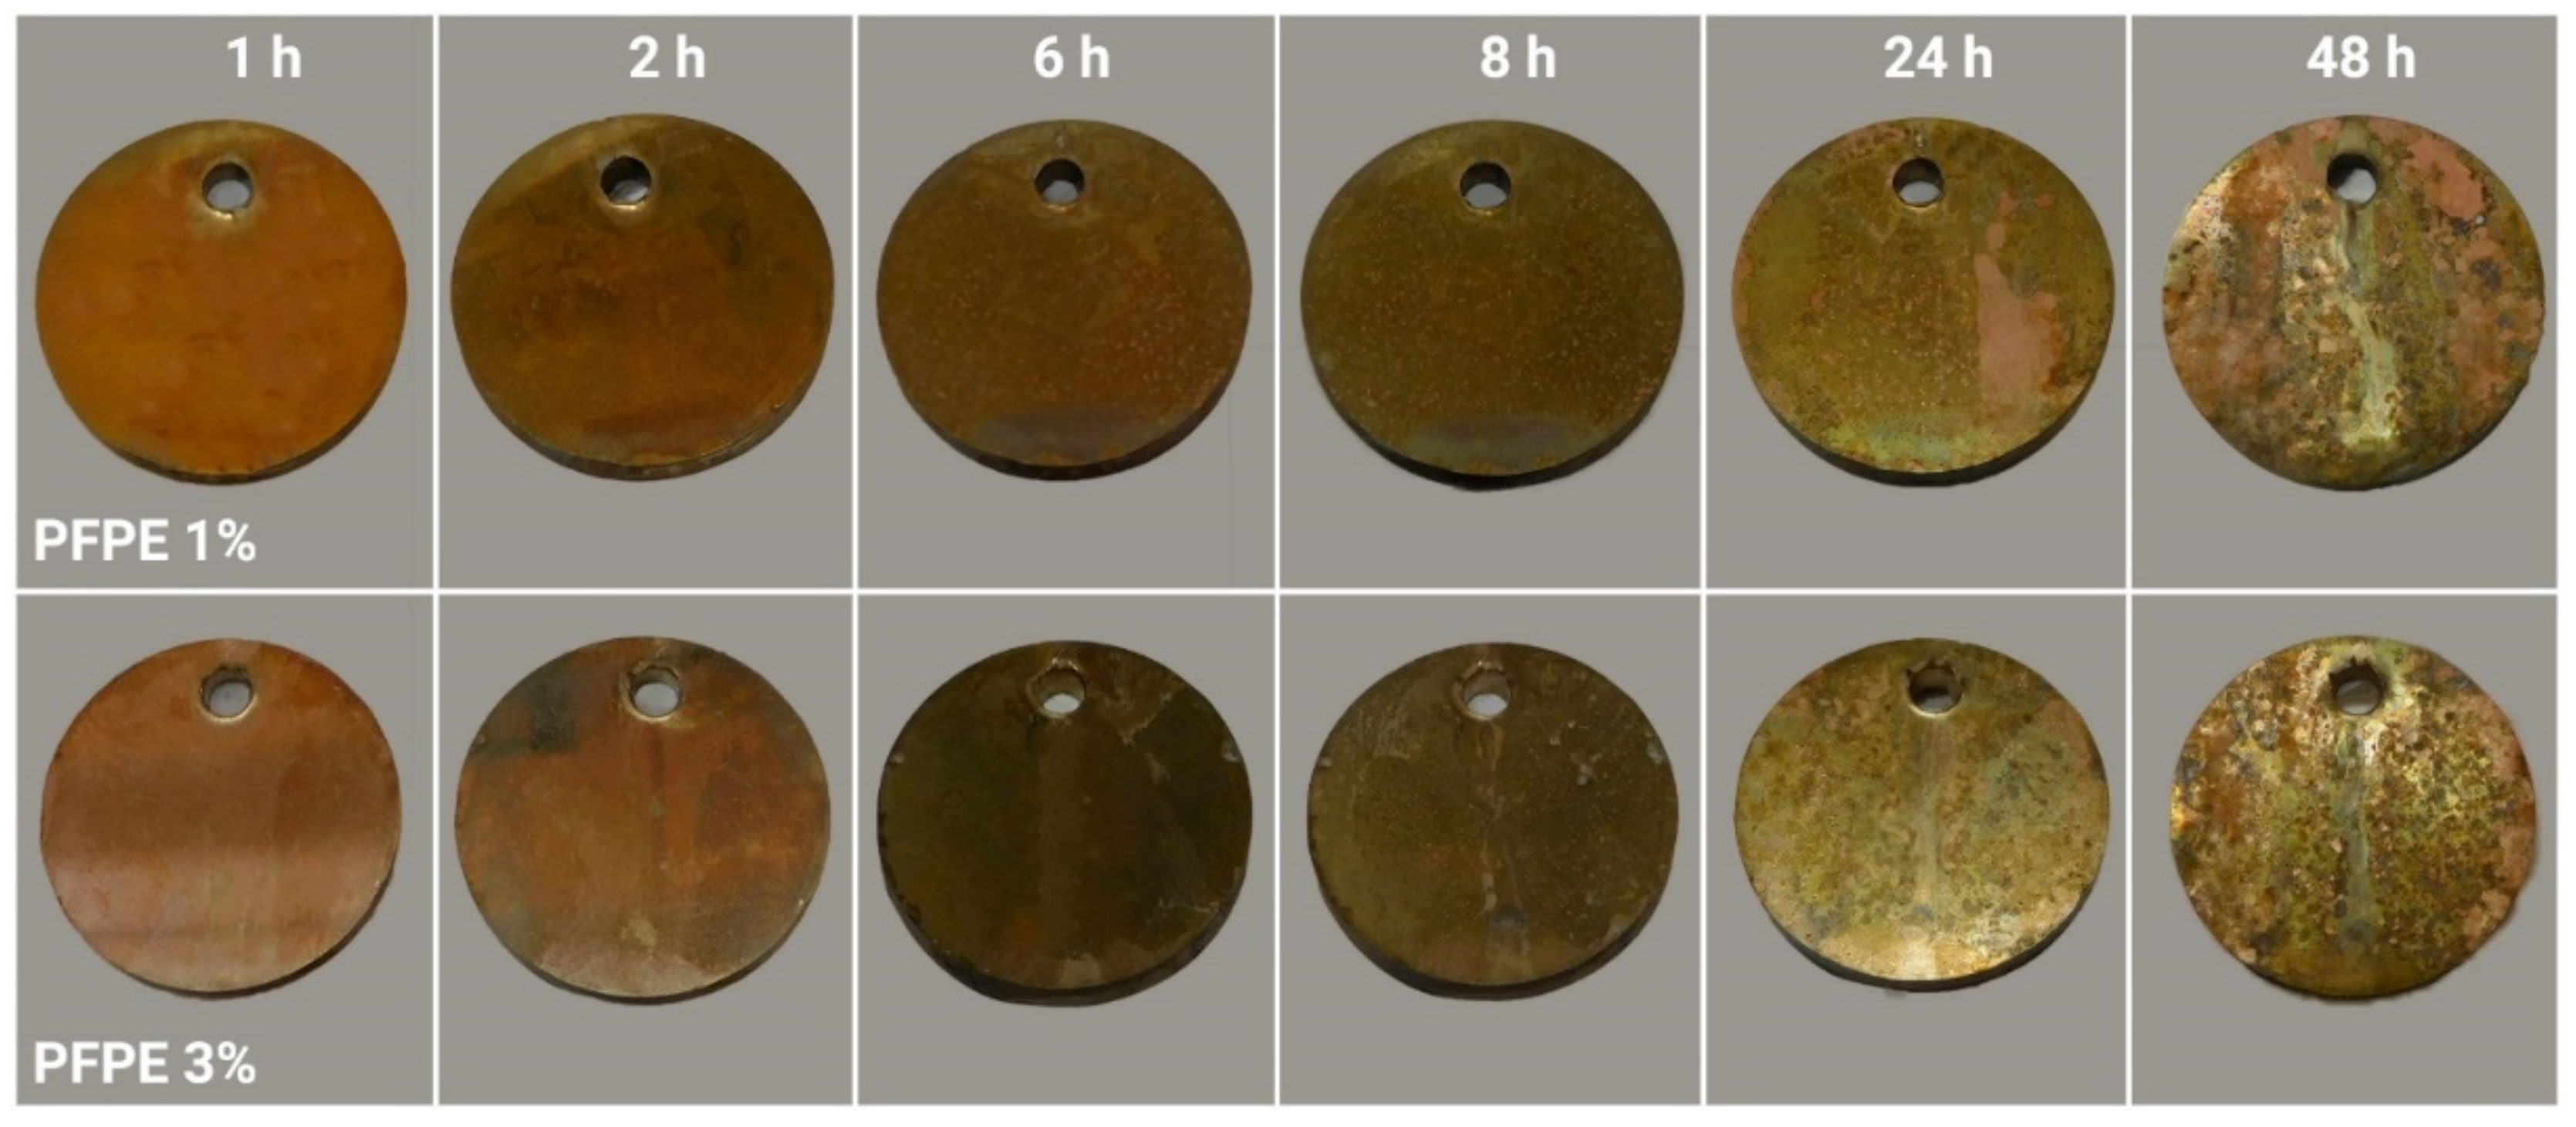
- Lower polymer concentration in the dip-coating emulsion always leads to better adhesion of the coating to the substrates, hence, leading to higher protection and a slower corrosion process. Brass showed evident corrosion signs after 6 h when protected with the PFPE 3%; conversely, PFPE 1% allows a surviving time of 24 h without evident sign of corrosion. Similarly, NAB remains protected for only 2 or 6 h with PFPE 3% and PFPE 1%, respectively.
- Brass can be effectively protected by PFPE 1% coating, but a slight change in the material coloration must be taken into account.
- NAB is poorly protected by PFPE, irrespective of the polymer concentration of the coating emulsion chosen. This is particularly true when PFPE 3% is used, which shows corrosion signs after only 2 h.
Author Contributions
Funding
Data Availability Statement
Acknowledgments
Conflicts of Interest
References
- Martini, G.; Ottaviani, M.F.; Ristori, S.; Lenti, D.; Sanguineti, A. Aggregation of Perfluorinated Polymers in Aqueous Solution Studied by ESR. Colloids Surf. 1990, 45, 177–184. [Google Scholar] [CrossRef]
- Marchionni, G.; Ajroldi, G.; Pezzin, G. Molecular Weight Dependence of Some Rheological and Thermal Properties of Perfluoropolyethers. Eur. Polym. J. 1988, 24, 1211–1216. [Google Scholar] [CrossRef]
- Chittofrati, A.; Lenti, D.; Sanguineti, A.; Visca, M.; Gambi, C.; Senatra, D.; Zhen, Z. Perfluorinated Surfactants at the Perfluoropolyether-Water Interface. Colloids Surf. 1989, 41, 45–59. [Google Scholar] [CrossRef]
- Monduzzi, M.; Chittofrati, A.; Visca, M. Perfluoropolyether Water/Oil Microemulsions: A H NMR Self-Diffusion Study of Water. Langmuir 1992, 8, 1278–1284. [Google Scholar] [CrossRef]
- Oldani, V.; del Negro, R.; Bianchi, C.L.; Suriano, R.; Turri, S.; Pirola, C.; Sacchi, B. Surface Properties and Anti-Fouling Assessment of Coatings Obtained from Perfluoropolyethers and Ceramic Oxides Nanopowders Deposited on Stainless Steel. J. Fluor. Chem. 2015, 180, 7–14. [Google Scholar] [CrossRef]
- Ye, Z.; Chen, Y.; Yang, X.; Hu, W.; Ye, H. Development of Perfluoropolyether Modified Raspberry Paticles with Fine Hierarchical Structure and Their Application in Superhydrophobic Surface. Colloids Surf. A Physicochem. Eng. Asp. 2017, 514, 251–259. [Google Scholar] [CrossRef]
- Sansotera, M.; Navarrini, W.; Gola, M.; Dotelli, G.; Stampino, P.G.; Bianchi, C.L. Conductivity and Superhydrophobic Effect on PFPE-Modified Porous Carbonaceous Materials. Int. J. Hydrog. Energy 2012, 37, 6277–6284. [Google Scholar] [CrossRef]
- Gola, M.; Sansotera, M.; Navarrini, W.; Bianchi, C.L.; Gallo Stampino, P.; Latorrata, S.; Dotelli, G. Perfluoropolyether-Functionalized Gas Diffusion Layers for Proton Exchange Membrane Fuel Cells. J. Power Source 2014, 258, 351–355. [Google Scholar] [CrossRef]
- Sansotera, M.; Bianchi, C.L.; Lecardi, G.; Marchionni, G.; Metrangolo, P.; Resnati, G.; Navarrini, W. Highly Hydrophobic Carbon Black Obtained by Covalent Linkage of Perfluorocarbon and Perfluoropolyether Chains on the Carbon Surface. Chem. Mater. 2009, 21, 4498–4504. [Google Scholar] [CrossRef]
- Talaeemashhadi, S.; Sansotera, M.; Gambarotti, C.; Famulari, A.; Bianchi, C.L.; Antonio Guarda, P.; Navarrini, W. Functionalization of Multi-Walled Carbon Nanotubes with Perfluoropolyether Peroxide to Produce Superhydrophobic Properties. Carbon 2013, 59, 150–159. [Google Scholar] [CrossRef]
- Marchese, G.; Bassini, E.; Parizia, S.; Manfredi, D.; Ugues, D.; Lombardi, M.; Fino, P.; Biamino, S. Role of the Chemical Homogenization on the Microstructural and Mechanical Evolution of Prolonged Heat-Treated Laser Powder Bed Fused Inconel 625. Mater. Sci. Eng. A 2020, 796, 14007. [Google Scholar] [CrossRef]
- Bassini, E.; Vola, V.; Lorusso, M.; Ghisleni, R.; Lombardi, M.; Biamino, S.; Ugues, D.; Vallillo, G.; Picqué, B. Net Shape HIPping of Ni-Superalloy: Study of the Interface between the Capsule and the Alloy. Mater. Sci. Eng. A 2017, 695, 55–65. [Google Scholar] [CrossRef]
- Wharton, J.A.; Barik, R.C.; Kear, G.; Wood, R.J.K.; Stokes, K.R.; Walsh, F.C. The Corrosion of Nickel-Aluminium Bronze in Seawater. Corros. Sci. 2005, 47, 3336–3367. [Google Scholar] [CrossRef]
- Kenworthy, L.; O’Driscoll, W.G. Dezincification of Brasses. Anti-Corros. Methods Mater. 1955, 2, 247–249. [Google Scholar] [CrossRef]
- Davies, D.D. A Note on the Dezincification of Brass and the Inhibiting Effect OF Elemental Additions; Copper Development Association Inc.: New York, NY, USA, 1993. [Google Scholar]
- Lorimer, G.W.; Hasan, F.; Iqbal, J.; Ridley, N. Observation of Microstructure and Corrosion Behaviour of Some Aluminium Bronzes. Br. Corros. J. 1986, 21, 244–248. [Google Scholar] [CrossRef]
- Krogstad, H.N.; Johnsen, R. Corrosion Properties of Nickel-Aluminium Bronze in Natural Seawater—Effect of Galvanic Coupling to UNS S31603. Corros. Sci. 2017, 121, 43–56. [Google Scholar] [CrossRef]
- Wu, Z.; Cheng, Y.F.; Liu, L.; Lv, W.; Hu, W. Effect of Heat Treatment on Microstructure Evolution and Erosion-Corrosion Behavior of a Nickel-Aluminum Bronze Alloy in Chloride Solution. Corros. Sci. 2015, 98, 260–270. [Google Scholar] [CrossRef]
- Tao, S.; Zhang, C.; Zhang, J.; Jiao, Y.; Li, M.; Lin, W.; Ran, L.; Clement, B.; Lyu, M.; Gentle, I.; et al. A Hydrophobic and Fluorophilic Coating Layer for Stable and Reversible Aqueous Zinc Metal Anodes. Chem. Eng. J. 2022, 446, 136607. [Google Scholar] [CrossRef]
- Schröder, S.; Ababii, N.; Lupan, O.; Drewes, J.; Magariu, N.; Krüger, H.; Strunskus, T.; Adelung, R.; Hansen, S.; Faupel, F. Sensing Performance of CuO/Cu2O/ZnO:Fe Heterostructure Coated with Thermally Stable Ultrathin Hydrophobic PV3D3 Polymer Layer for Battery Application. Mater. Today Chem. 2022, 23, 100642. [Google Scholar] [CrossRef]
- Wang, J.; Hu, H.; Zhang, J.; Li, L.; Jia, L.; Guan, Q.; Hu, H.; Liu, H.; Jia, Y.; Zhuang, Q.; et al. Hydrophobic Lithium Diffusion-Accelerating Layers Enables Long-Life Moisture-Resistant Metallic Lithium Anodes in Practical Harsh Environments. Energy Storage Mater. 2022, 52, 210–219. [Google Scholar] [CrossRef]
- Nardi, J.A.; Strauss, J.A.; Fardo, F.M.; Ferreira, L.C.; Martini, E.M.A.; Horowitz, F. Wettability and Anticorrosion of Thin PTFE-like/Alumina Coatings on Carbon Steel. Prog. Org. Coat. 2020, 148, 105823. [Google Scholar] [CrossRef]
- Xu, K.; Sun, W.; Wang, L.; Yang, Z.; Li, B.; Ma, Y.; Zhao, L.; Zhang, C.; Ma, S.; Han, H.; et al. Corrosion Protection Properties of Janus PTFE Coatings in Highly Corrosive H2SO4 Solutions. Corros. Sci. 2022, 207, 110553. [Google Scholar] [CrossRef]
- Eshaghi, A.; Mesbahi, M.; Aghaei, A.A. Transparent Hierarchical Micro-Nano Structure PTFE-SiO2 Nanocomposite Thin Film with Superhydrophobic, Self-Cleaning and Anti-Icing Properties. Optik 2021, 241, 166967. [Google Scholar] [CrossRef]
- Lin, L.; Emrich, S.; Kopnarski, M.; Schlarb, A.K. Lubrication Performance of a Polyetheretherketone (PEEK) and Polytetrafluoroethylene (PTFE) Blend within a Steel/Steel Tribosystem. Wear 2021, 484–485, 203997. [Google Scholar] [CrossRef]
- Zhang, B.; Xu, W.; Zhu, Q.; Guan, F.; Zhang, Y. Nepenthes Pitcher-Inspired Lubricant-Infused Slippery Surface with Superior Anti-Corrosion Durability, Hot Water Repellency and Scratch Resistance. J. Ind. Eng. Chem. 2022, 107, 259–267. [Google Scholar] [CrossRef]
- Sianesi, D.; Zamboni, V.; Fontanelli, R.; Binaghi, M. Perfluoropolyethers: Their Physical Properties and Behaviour at High and Low Temperatures. Wear 1971, 18, 85–100. [Google Scholar] [CrossRef]
- Bracco, G.; Holst, B. Surface Science Techniques; Springer: Berlin/Heidelberg, Germany, 2013; Volume 51. [Google Scholar] [CrossRef]
- Oddy, A.; Scott, D.A. Metallography and Microstructure of Ancient and Historic Metals. Stud. Conserv. 1992, 37, 282. [Google Scholar] [CrossRef]
- Pantazopoulos, G.; Vazdirvanidis, A. Characterization of the Microstructural Aspects of Machinable a-b Phase Brass. Microsc. Anal. 2008, 22, 13–16. [Google Scholar]
- Wright, R.N. Relevant Aspects of Copper and Copper Alloy Metallurgy. In Wire Technology; Butterworth-Heinemann: Oxford, UK, 2016. [Google Scholar]
- Richardson, I. Guide to Nickel Aluminium Bronze for Engineers; Copper Development Association: New York, NY, USA, 2016. [Google Scholar]
- Konen, R.; Fintov, S. Copper and Copper Alloys: Casting, Classification and Characteristic Microstructures. In Copper Alloys—Early Applications and Current Performance—Enhancing Processes; Books on Demand: Norderstedt, Germany, 2012. [Google Scholar]
- Yasuda, T.; Okuno, T.; Yasuda, H. Contact Angle of Water on Polymer Surfaces. Langmuir 1994, 10, 2435–2439. [Google Scholar] [CrossRef]
- Srivastava, A.; Balasubramaniam, R. Microstructural Characterization of Copper Corrosion in Aqueous and Soil Environments. Mater. Charact. 2005, 55, 127–135. [Google Scholar] [CrossRef]
- Núñez, L.; Reguera, E.; Corvo, F.; González, E.; Vazquez, C. Corrosion of Copper in Seawater and Its Aerosols in a Tropical Island. Corros. Sci. 2005, 47, 461–484. [Google Scholar] [CrossRef]
- Sherif, E.S.M.; Erasmus, R.M.; Comins, J.D. Corrosion of Copper in Aerated Synthetic Sea Water Solutions and Its Inhibition by 3-Amino-1,2,4-Triazole. J. Colloid Interface Sci. 2007, 309, 470–477. [Google Scholar] [CrossRef]
- Stoffyn-Egli, P.; Buckley, D.E.; Clyburne, J.A.C. Corrosion of Brass in a Marine Environment: Mineral Products and Their Relationship to Variable Oxidation and Reduction Conditions. Appl. Geochem. 1998, 13, 643–650. [Google Scholar] [CrossRef]
- Luo, Q.; Qin, Z.; Wu, Z.; Shen, B.; Liu, L.; Hu, W. The Corrosion Behavior of Ni-Cu Gradient Layer on the Nickel Aluminum-Bronze (NAB) Alloy. Corros. Sci. 2018, 138, 8–19. [Google Scholar] [CrossRef]
- Schneller, T.; Waser, R.; Kosec, M.; Payne, D. Chemical Solution Deposition of Functional Oxide Thin Films; Springer Science & Business Media: Berlin/Heidelberg, Germany, 2013; ISSN 9783211993118. [Google Scholar]


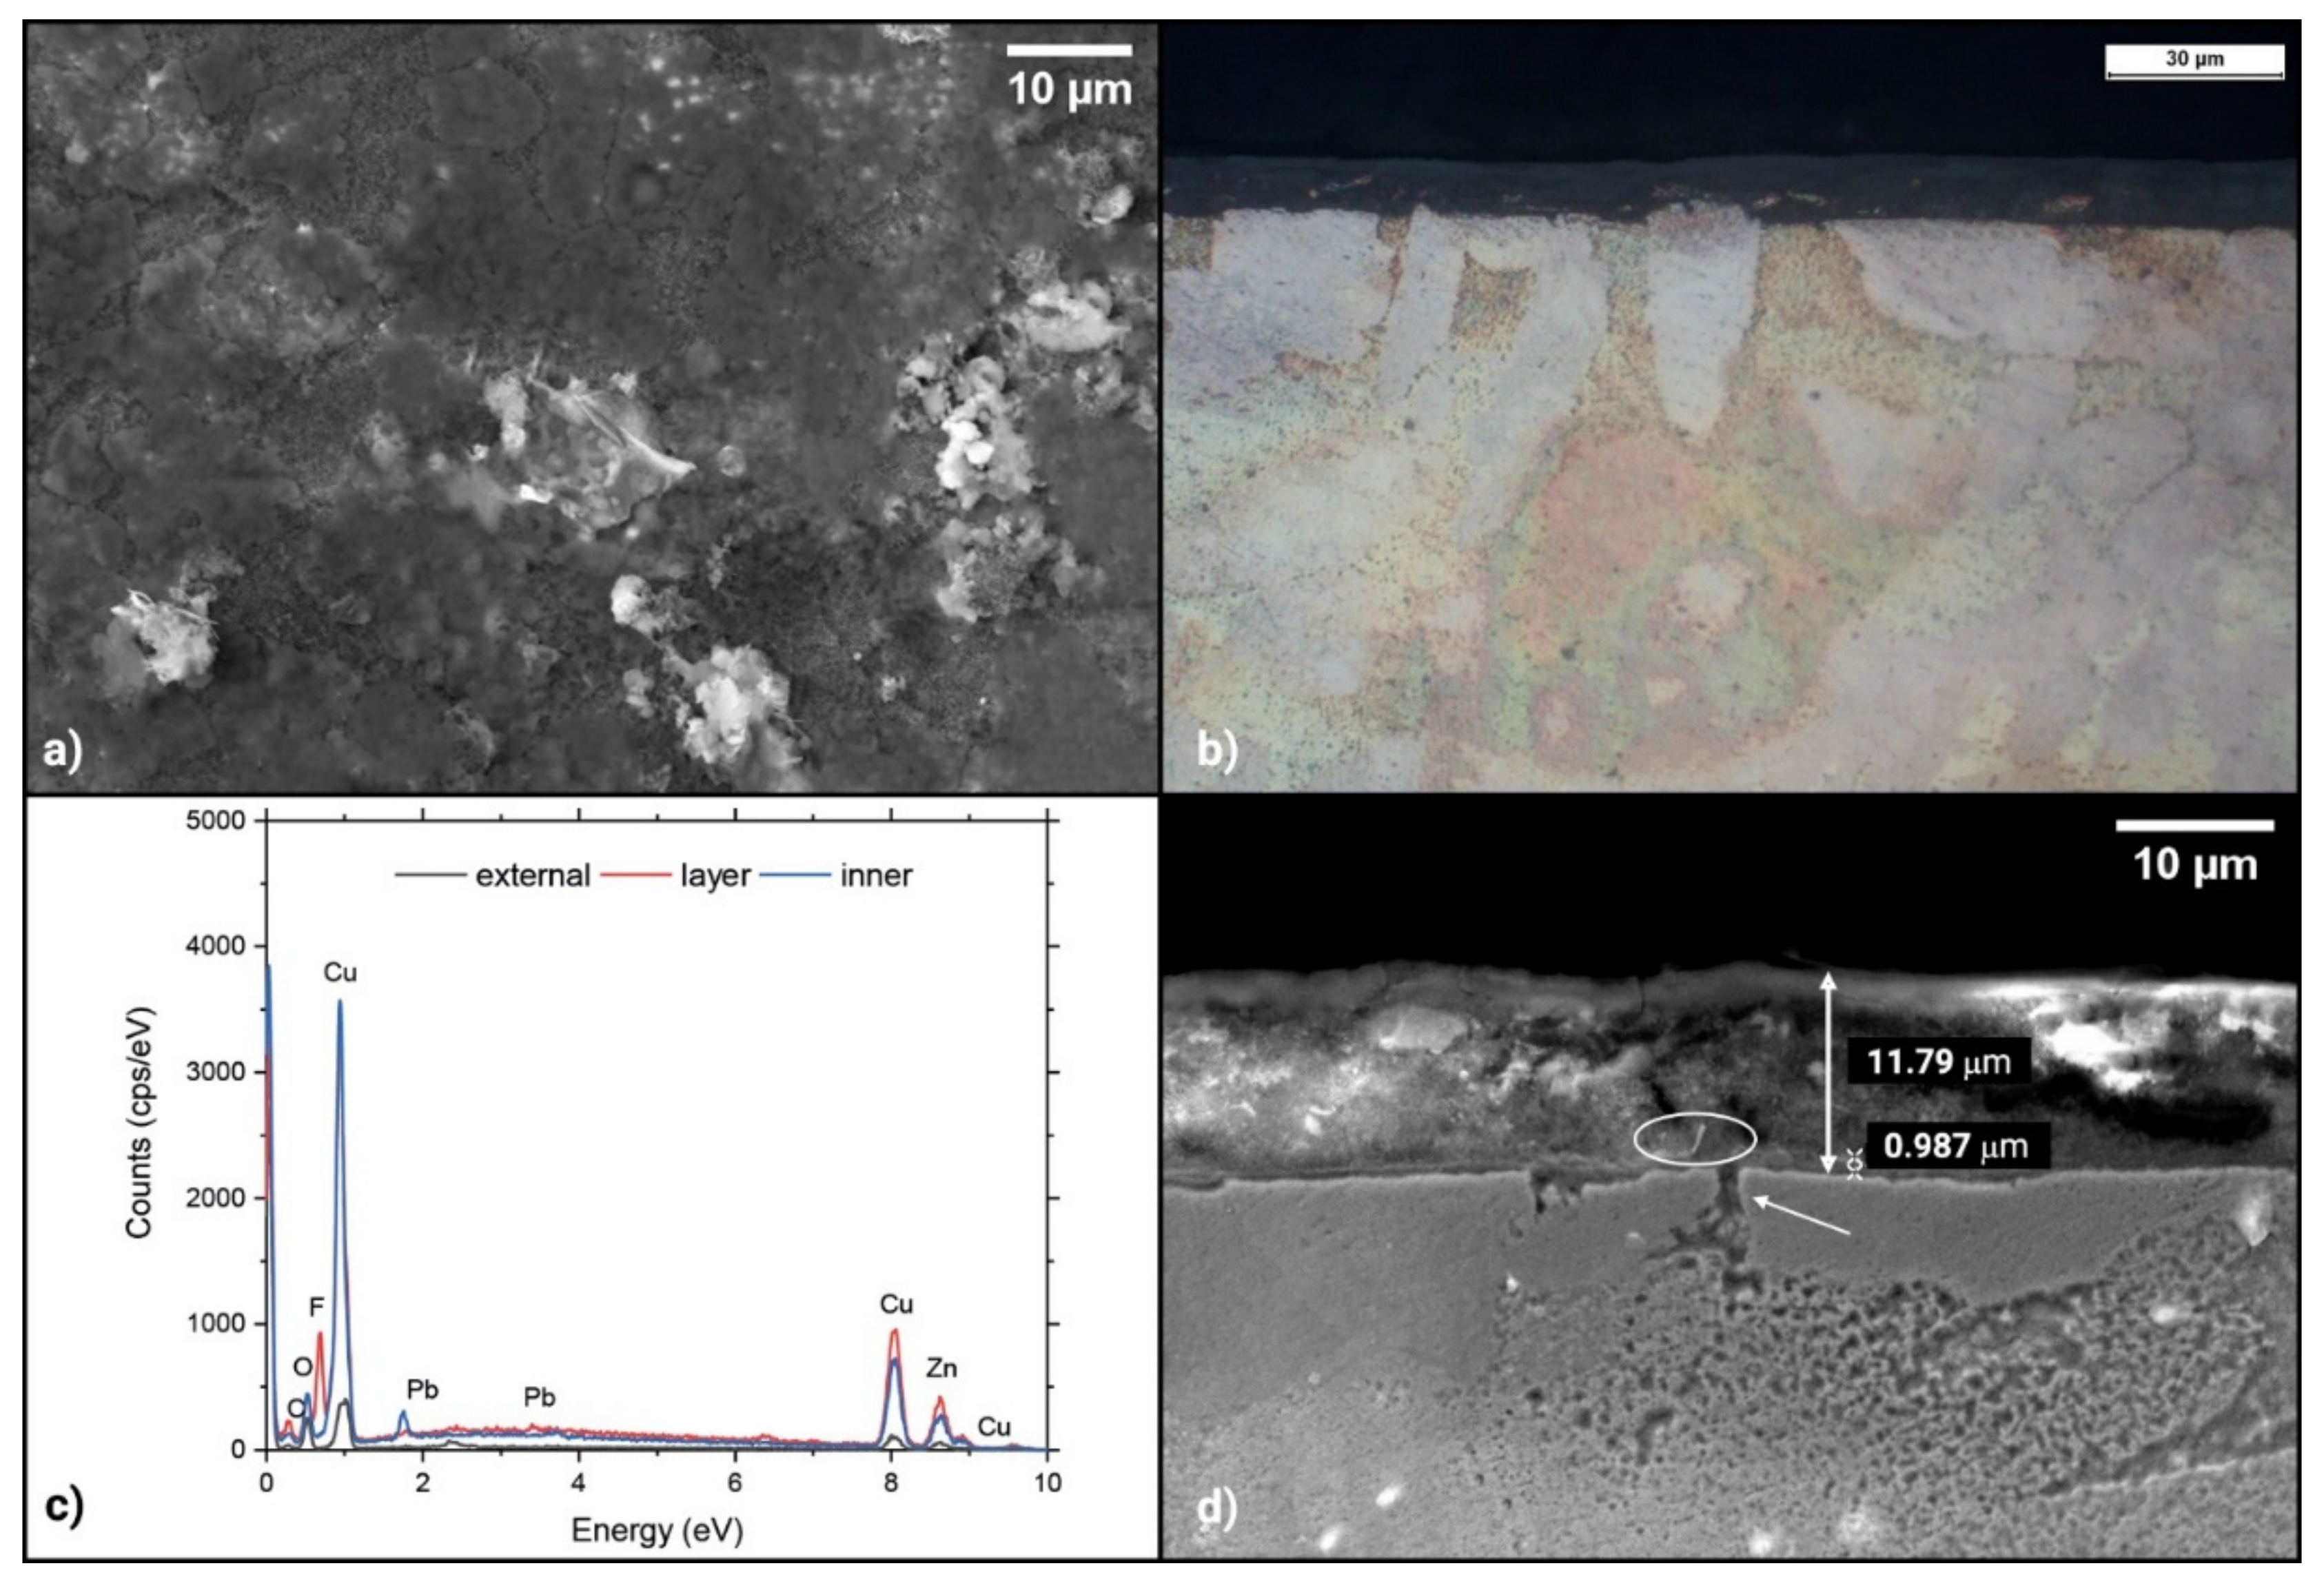
| Elements | Cu | Zn | O | Pb |
|---|---|---|---|---|
| w% | 57.34 | 29.68 | 8.04 | 3.82 |
| Dev. St. | 1.17 | 0.98 | 0.79 | 1.02 |
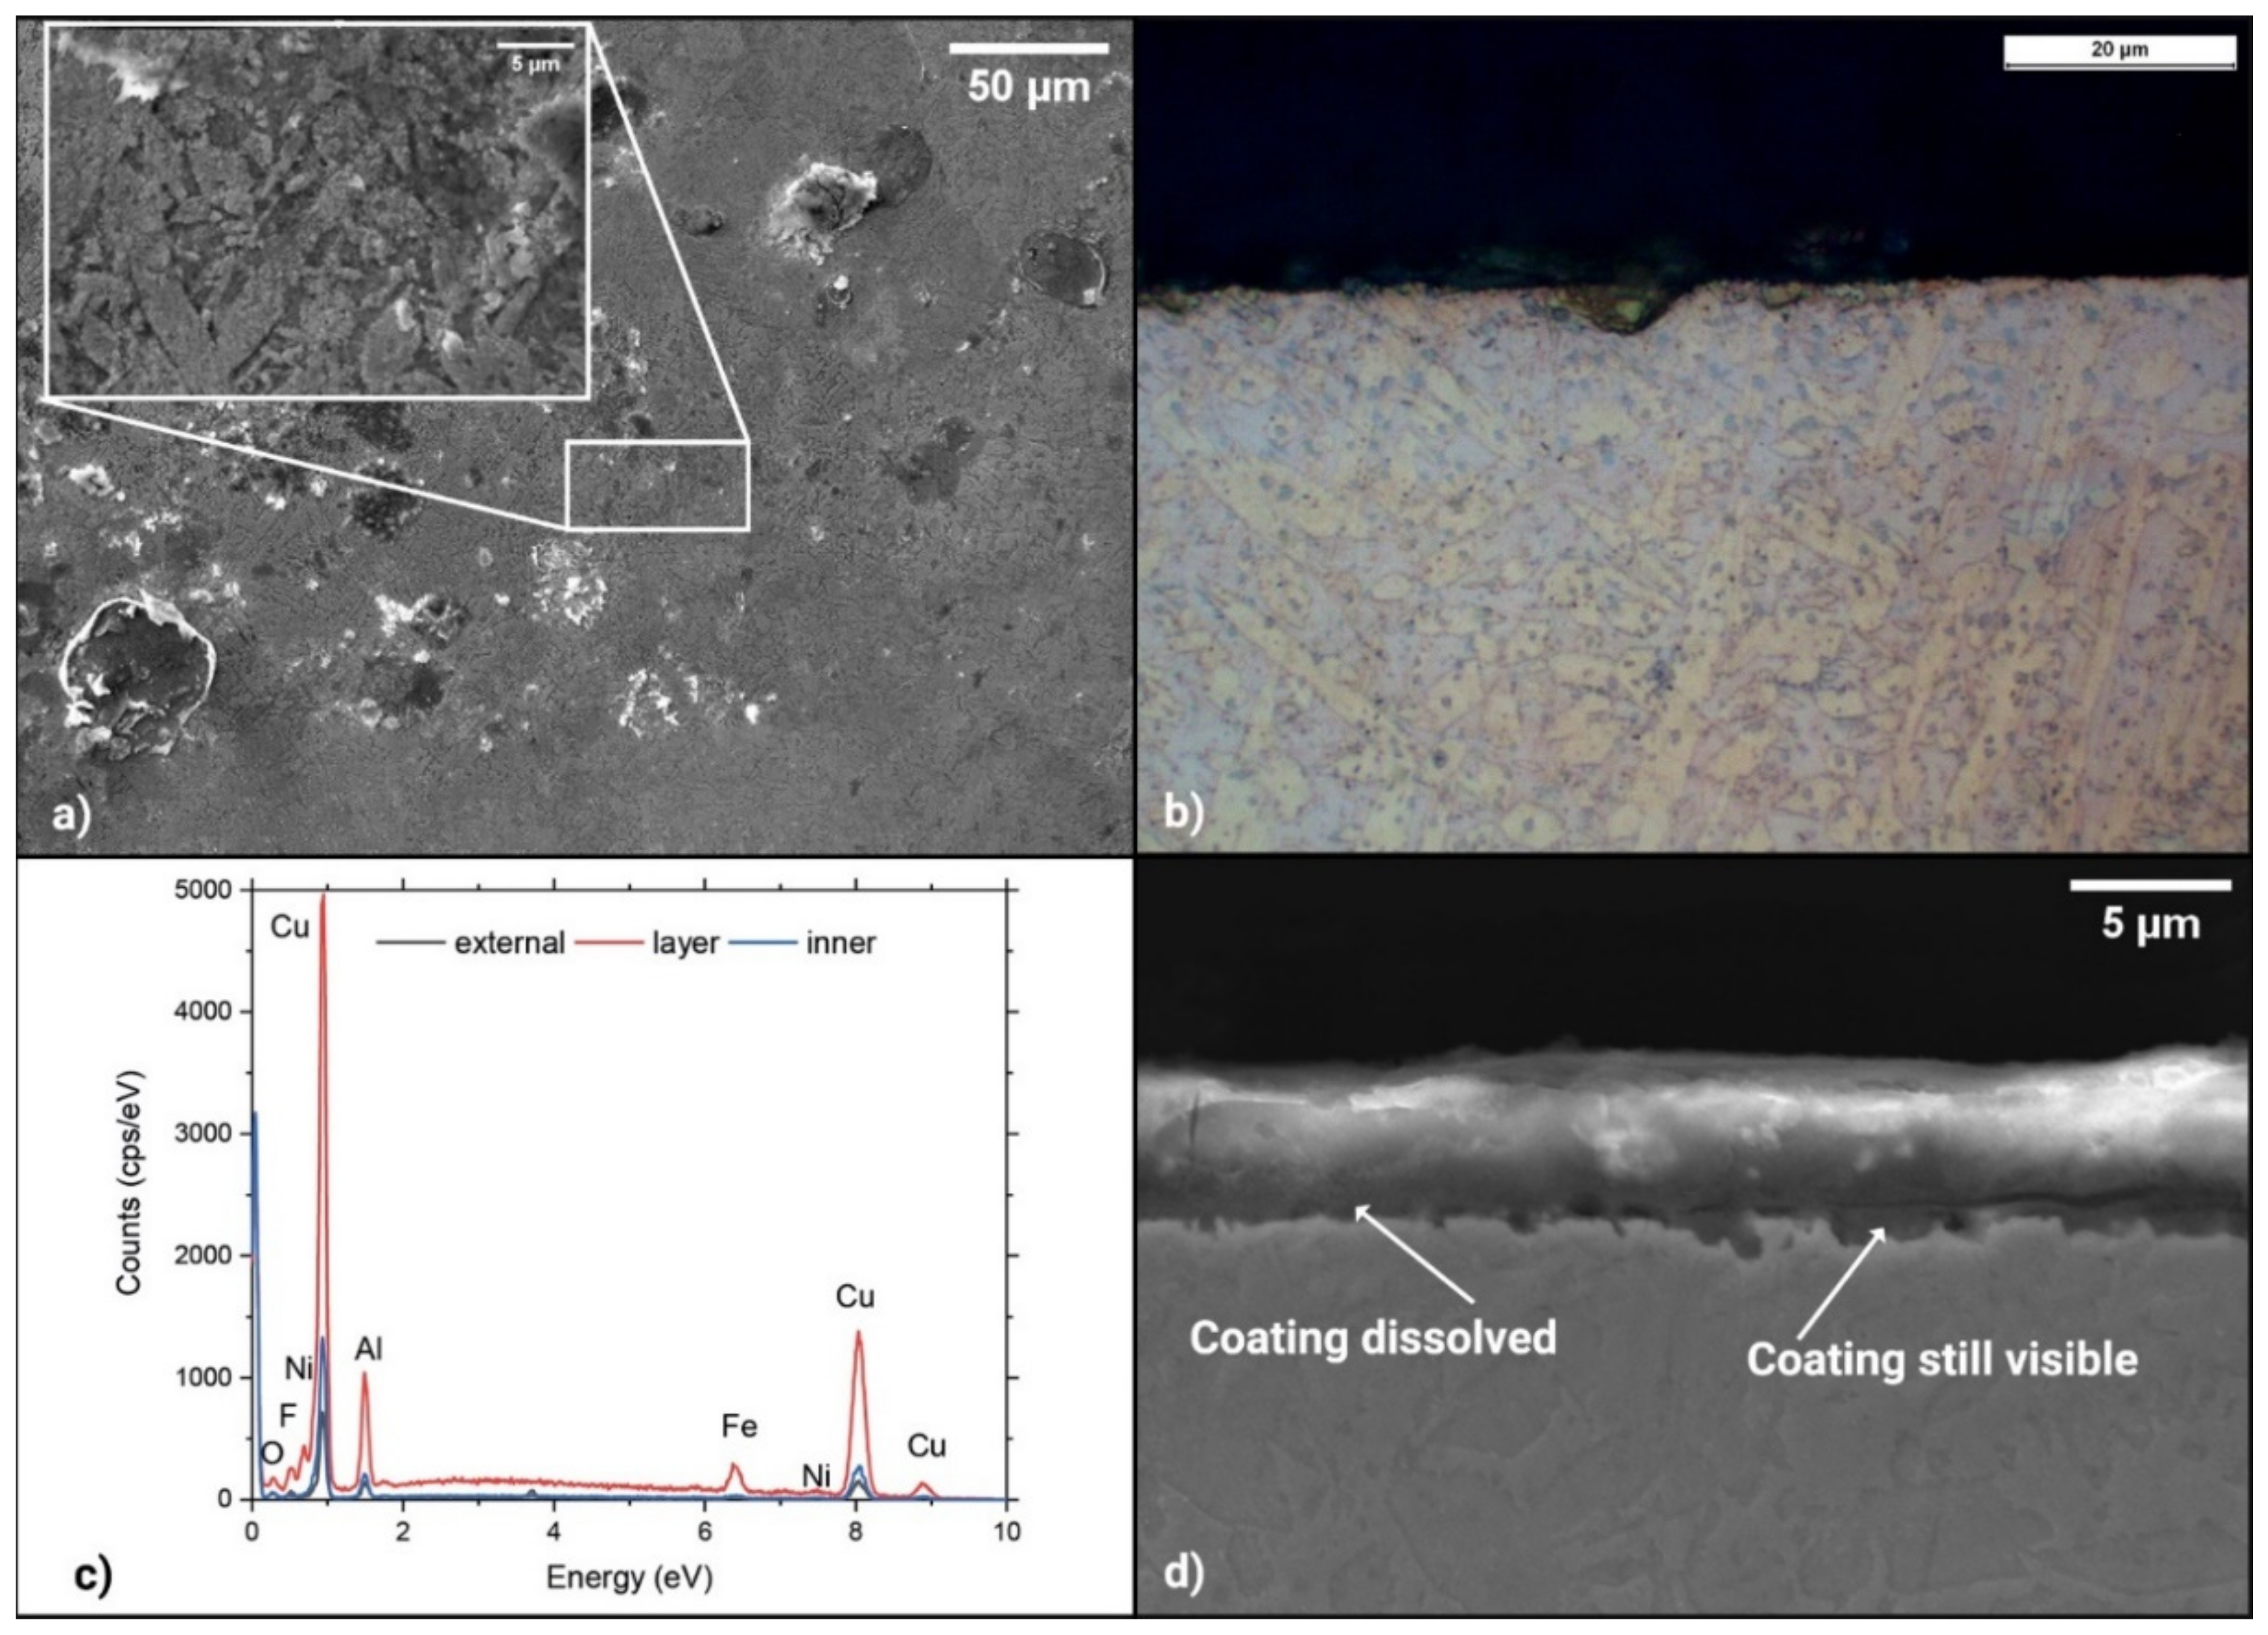
| Elements | Cu | Al | Fe | Ni | Si |
|---|---|---|---|---|---|
| w% | 73.07 | 18.79 | 4.15 | 1.23 | 0.76 |
| Dev. St. | 0.63 | 0.48 | 0.32 | 0.32 | 0.28 |
| Brass | NAB | |||
|---|---|---|---|---|
| PFPE 1% | PFPE 3% | PFPE 1% | PFPE 3% | |
| Average layer thickness [µm] | 0.85 | 0.91 | 0.78 | 0.94 |
| Deviation from average [µm] | 0.11 | 0.23 | 0.24 | 0.29 |
| Substrates | As-Received | PFPE 1% | PFPE 3% |
|---|---|---|---|
| Brass | 1.7 ± 0.9 | 1.3 ± 0.7 | 5.9 ± 0.8 |
| NAB | 2.3 ± 0.4 | 1.7 ± 0.7 | 7.2 ± 0.3 |
Publisher’s Note: MDPI stays neutral with regard to jurisdictional claims in published maps and institutional affiliations. |
© 2022 by the authors. Licensee MDPI, Basel, Switzerland. This article is an open access article distributed under the terms and conditions of the Creative Commons Attribution (CC BY) license (https://creativecommons.org/licenses/by/4.0/).
Share and Cite
Bassini, E.; Gobber, F.S.; Fracchia, E.; Zenaro, C.; Boccaleri, E. Perfluoropolyether-Based Micellar Aggregates Coatings for Corrosion Resistance Enhancement of Copper-Based Alloys. Alloys 2022, 1, 196-211. https://doi.org/10.3390/alloys1020012
Bassini E, Gobber FS, Fracchia E, Zenaro C, Boccaleri E. Perfluoropolyether-Based Micellar Aggregates Coatings for Corrosion Resistance Enhancement of Copper-Based Alloys. Alloys. 2022; 1(2):196-211. https://doi.org/10.3390/alloys1020012
Chicago/Turabian StyleBassini, Emilio, Federico Simone Gobber, Elisa Fracchia, Chiara Zenaro, and Enrico Boccaleri. 2022. "Perfluoropolyether-Based Micellar Aggregates Coatings for Corrosion Resistance Enhancement of Copper-Based Alloys" Alloys 1, no. 2: 196-211. https://doi.org/10.3390/alloys1020012