Article

Powder Production via Atomisation and Subsequent Laser Powder Bed Fusion Processing of Fe+316L Steel Hybrid Alloy

1
Chair of Materials Science, Paderborn University, Warburger Straße 100, 33098 Paderborn, Germany
2
Direct Manufacturing Research Center, Paderborn University, Mersinweg 3, 33098 Paderborn, Germany
3
Indutherm Erwärmungsanlagen GmbH, Brettener Strasse 32, 75045 Walzbachtal, Germany
*
Author to whom correspondence should be addressed.
Powders 2023, 2(1), 59-74; https://doi.org/10.3390/powders2010005
Submission received: 28 September 2022 / Revised: 5 January 2023 / Accepted: 6 January 2023 / Published: 16 January 2023
(This article belongs to the Special Issue Feature Papers in Powders)

Abstract

:
The current investigation shows the feasibility of 316L steel powder production via three different argon gas atomisation routes (closed coupled atomisation, free fall atomisation with and without hot gas), along with subsequent sample production by laser powder bed fusion (PBF-LB). Here, a mixture of pure Fe and atomised 316L steel powder is used for PBF-LB to induce a chemical composition gradient in the microstructure. Optical microscopy and μ-CT investigations proved that the samples processed by PBF-LB exhibit very little porosity. Combined EBSD-EDS measurements show the chemical composition gradient leading to the formation of a local fcc-structure. Upon heat treatment (1100 °C, 14 h), the chemical composition is homogeneous throughout the microstructure. A moderate decrease (1060 to 985 MPa) in the sample’s ultimate tensile strength (UTS) is observed after heat treatment. However, the total elongation of the as-built and heat-treated samples remains the same (≈22%). Similarly, a slight decrease in the hardness from 341 to 307 HV1 is observed upon heat treatment.

1. Introduction

Laser beam melting of 316L stainless steel is a well-established additive manufacturing process, which is suitable not only for rapid prototyping purposes but also for the production of small-batch parts in the automotive, aerospace, oil, and medical industries [1,2,3]. In addition to this technique’s obvious advantages, such as low material waste, geometrical freedom in terms of part complexity, toolless manufacturing, and high digitalisation of the process, the process allows tailoring of the material properties during fabrication. Thus, high-end complex components with extended functionality and a property profile adapted to the specific application case can be manufactured, which can barely be realised using conventional manufacturing techniques [4,5].
The properties of the alloys can be tailored in different ways such as by (1) the variations of component structure/porosity; (2) processing parameters, and (3) chemical composition. In this regard, the variation of the chemical composition presents high potential not only in terms of modification of properties on a macro-scale, which is via a graded change in alloy composition with height or/and within the cross-section of the manufactured part.
Fe-Mn alloys have gained a significant amount of attention as biodegradable materials for medical applications. The previous studies on mechanically mixed and subsequently sintered powders of pure iron and pure manganese have proved the efficiency of mechanical alloying processing for medical purposes without the necessity to produce investigated alloys via casting [6,7]. Furthermore, the segregations of alloying elements, with higher or lower standard reduction potential, induce the formation of electrochemical cells and thus facilitate degradation [7,8,9]. Similarly, the presence of phase boundaries along with numerous grain boundaries also favours degradability. Here, such boundaries act as the sites for the occurrence of galvanic coupling between the grains and phases and grain boundaries/phase boundaries occur, and thus, the dissolution of the material begins [10].
The mechanical mixing of powders allows the production of components with the desired chemical composition using available powder. Thus, there is no necessity to go through the whole process chain (casting the melt, production of powder by atomisation) to locally modify the chemical composition. The mixing of pure iron and manganese/iron-manganese powders and their subsequent processing by LPBF-LB is a promising way to manufacture components with improvement in degradability in comparison to the standard as-cast and atomised Fe-Mn alloys. Here, both manganese segregations (as the main alloying element) and the formation of local ferrite-austenite grain boundaries may significantly induce the degradation. Due to the unavailability of manganese/iron-manganese powder, the available 316L powder was used in this preliminary investigation, as it also has a high number of alloying elements and exhibits austenite phase formation similar to Fe-Mn alloys.
Indeed, stainless steel and iron are used for biomedical applications. However, the use of these alloys is restricted due to the slow degradation period [11,12] and the risk of release of toxic ions during healing [12]. Much attention is paid to the corrosion resistance of stainless-steel materials [13], pointing out that pure iron is more degradable, while corrosion resistance is poor. Therefore, 316L is considered to be a material where all the alloying elements balance biocompatibility, degradation, mechanical properties and corrosion resistance.
Therefore, the objective of the present investigation is to explore the potential of the mechanical mixing of powders and their subsequent consolidation by LPBF-LB into a material with graded chemical composition and modified phase content.

2. Materials and Methods

2.1. Powder Production and Subsequent Processing

For the production of the required metal powder from 316L steel, the AU3000 gas atomiser (Indutherm Erwärmungsanlagen GmbH, Walzbachtal, Germany) was used in combination with ceramic crucibles of a capacity of 3.4 L for atomisation. Before melting the raw metal, a vacuum is created inside the unit. Inert gas is then introduced to prevent oxidation of the metal when it is inductively heated to the molten state. In addition, the particle size and particle size distribution can be adjusted by varying the atomising gas pressure, atomising gas temperature and melt flow [14].
The material used for the atomisation experiments was 316L steel. The chemical composition of 316L steel (in wt.%) is presented in Table 1. As 316L steel has chromium (Cr) content of up to 17%, argon was used as protective gas. Before the metal is placed in the crucible, its surface is cleaned with isopropanol to remove any surface impurities. The crucible is made of an aluminium-oxide-based ceramic material. This crucible material allows both good thermal resistance at high temperatures (up to 1850 °C) and simultaneously does not react with the molten steel. Once the metal is heated to a liquid state and the set superheat temperature is reached, the atomisation step can be performed.
Before each melting step during atomisation, the crucible containing the raw material was evacuated 3 times up to a pressure of 50 mbar, and after each evacuation cycle, filled with protective gas (argon grade of 4.6). This allowed the removal of ambient air from the melting unit and thus prevented the oxidation of the metal during the heating stage. To prevent cracking during melting, the crucible is canned inside the melting unit using a crucible backfill mass. Furthermore, the heating of the melt is performed at a rate of 25 K/min to avoid thermal shock during the heating stage. With the help of the measures mentioned above, the crucible can withstand 3 to 5 melting processes.
To obtain metallic powder particles with a size of fewer than 200 μm, a two-stage fluid atomisation method was applied. The molten metal stream is crushed by the shearing of the high-velocity gas stream. Depending on the atomiser nozzle design, two modes of operation can be used, free-fall atomisation (FFA) and close-coupled atomisation (CCA) [15,16]. The relevant data of the FFA and CCA powder atomisation routes are summarised in Table 2.
For the FFA route (Table 2), the molten metal reaches the atomisation zone after a free fall of 50 to 100 mm. Due to the impingement of a second inert gas stream, the molten metal is sheared into smaller droplets. The primary gas nozzle is located at the exit of the melt. The primary inert gas and the melt move in parallel and in the same direction. In this way, the primary inert gas directs the melt to the atomisation zone while suppressing the circulation effect created by the second inert gas flow. FFA is suitable for metals with high melt viscosity due to its circulation-inhibiting effect [15,16]. For atomising via FFA, the temperature of the 316L steel melt before atomisation was 1595 °C. The diameter of the crucible outlet was 2.5 mm. The pressure and temperature of the atomisation gas were set to 20 bar and 370 °C, resulting in gas flow during the atomisation of 160 Nm3/h.
For CCA (Table 2), the inert gas flow nozzle is closer to the melt outlet. This makes it possible to create a strong inert gas circulation at the outlet. The circulating inert gas flow pre-compresses the melt to form the melt film and entrains it in front of the inert gas flow nozzle. At the nozzle, the melt film is broken into fine droplets by the strong impact and shear forces of the inert gas. The atomisation area of the CCA is closer to the nozzle than that of the FFA and has more concentrated energy to break up the melt, so it can produce a finer powder. However, there is an increased risk of nozzle clogging, as the surface that is cooled by the high-pressure inert gas stream tends to solidify the melt. To avoid this, the melt is superheated by 100 to 300 °C. At the beginning of atomisation, the melt flows out before the inert gas preheats the surrounding surfaces. The use of the CCA route allows better handling of melts with a high temperature and a high surface tension [15,16,17]. CCA-atomisation was performed with both “cold” and preheated atomisation gas. In the case of atomisation with hot gas, the gas was heated up to the required temperature using a specific pipe system with heating elements integrated into the atomisation unit. The temperature of the atomisation gas is controlled via thermocouples. The temperature of the 316L steel melt, as well as the diameter of the crucible outlet before both CCA-atomisation amounted to 1695 °C and 2.5 mm. The pressure and the temperature of atomisation gas during atomisation with cold gas were set to 26 bar and 20 °C, resulting in a gas flow during the atomisation of 575 Nm3/h. The pressure and the temperature of the atomisation gas during atomisation with the preheated gas were set to 26 bar and 370 °C, respectively, resulting in a gas flow during the atomisation of 405 Nm3/h.
Independent of the atomisation modus (CCA or FFA), a total of two collection containers are used where the large powder particles and residues are collected in the container directly below the atomisation nozzle, while another container below the cyclone, which separates the mixture of atomisation gas and (typically) fine particles, collects the rest of the powder. At the end of the atomisation process, the powder is removed from the containers after a short cooling.
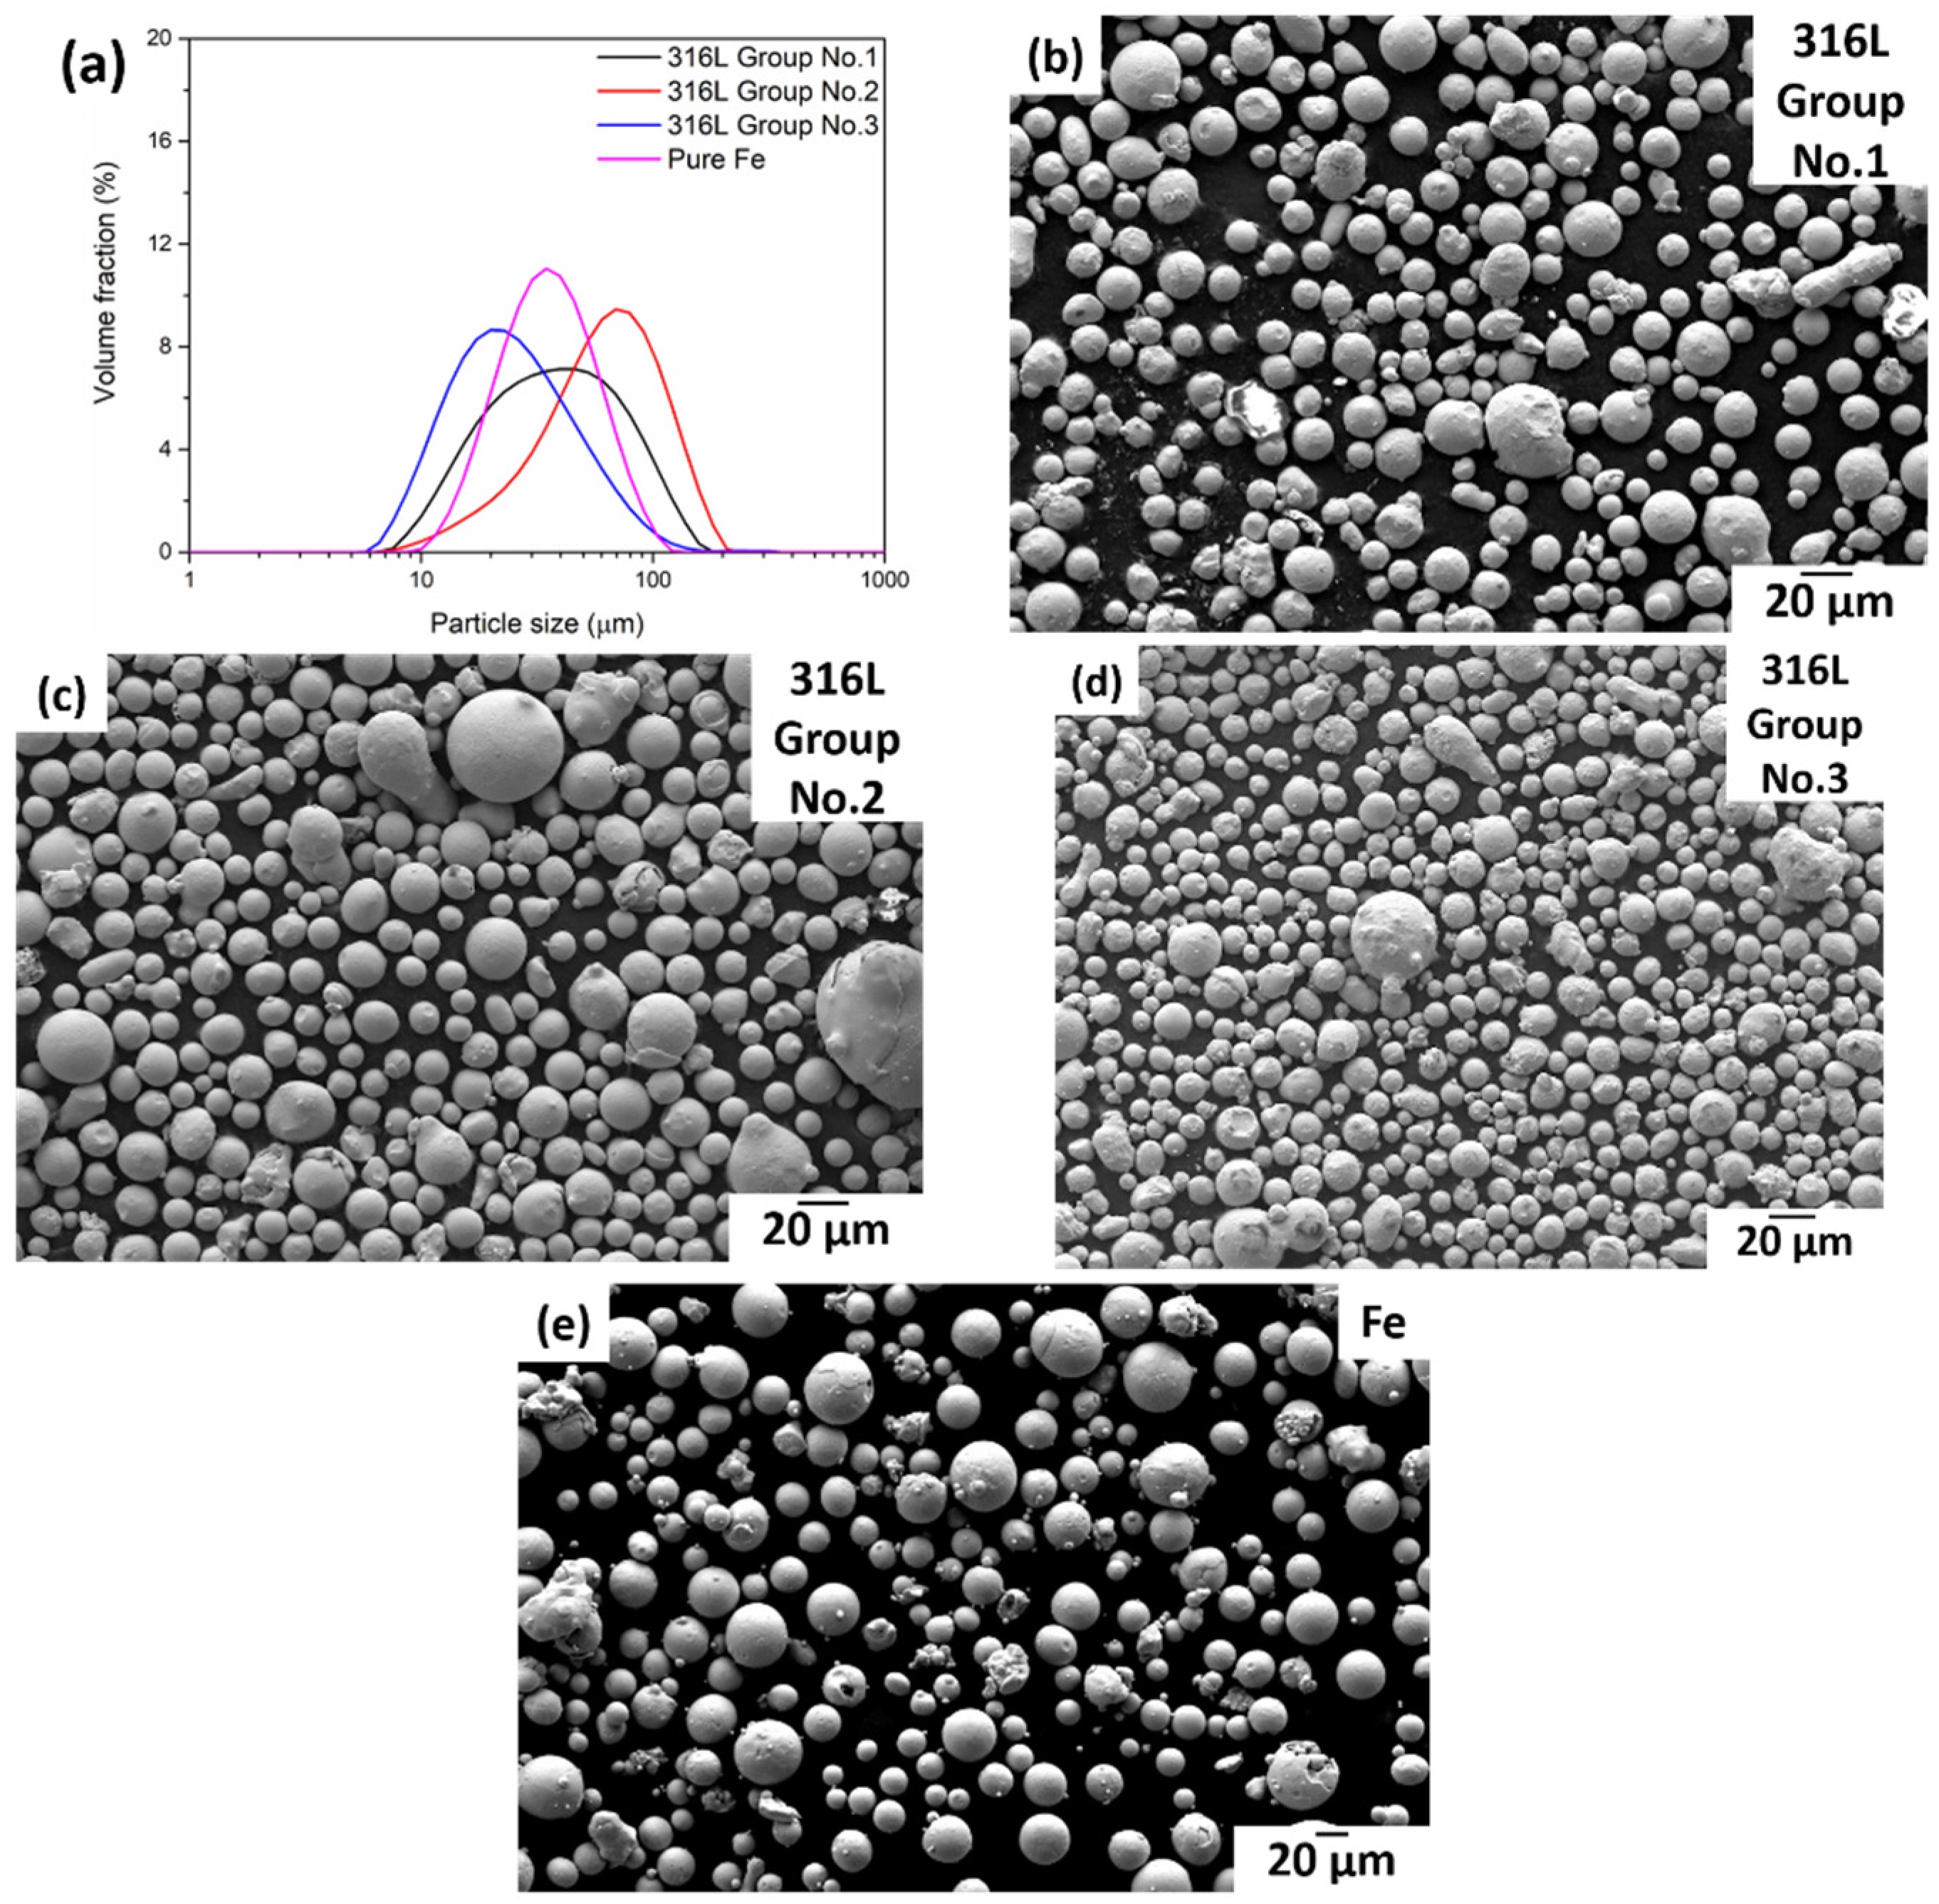
Sieving of the powder particles is undertaken in the next step. The powder particles are sieved with a 100 μm sieve using an AS450 sieving machine from Retsch GmbH to filter out larger powder particles and slags, which are not suitable/too large for the subsequent laser-beam melting. After the powder is sieved, it is further classified using the air classifier AC1000G from Indutherm Erwärmungsanlagen GmbH. During this process, the powder is transported through the vibrating chute at a uniform speed. Afterwards, the powder mixed with inert gas passes the first powder container, and large particles fall into this container, whereas fine particles are streamed with the inert gas to the specific cyclone, where they are separated from the inert gas with a rotating wheel and fall in the second container. Depending on the pressure and flow rate of the inert gas, as well as the rotating velocity of the wheel, the desirable threshold of the mean particle size, which should be separated from the whole powder batch, can be easily adjusted.
Pure iron (Fe) powder was delivered by M4P Materials Solutions GmbH.
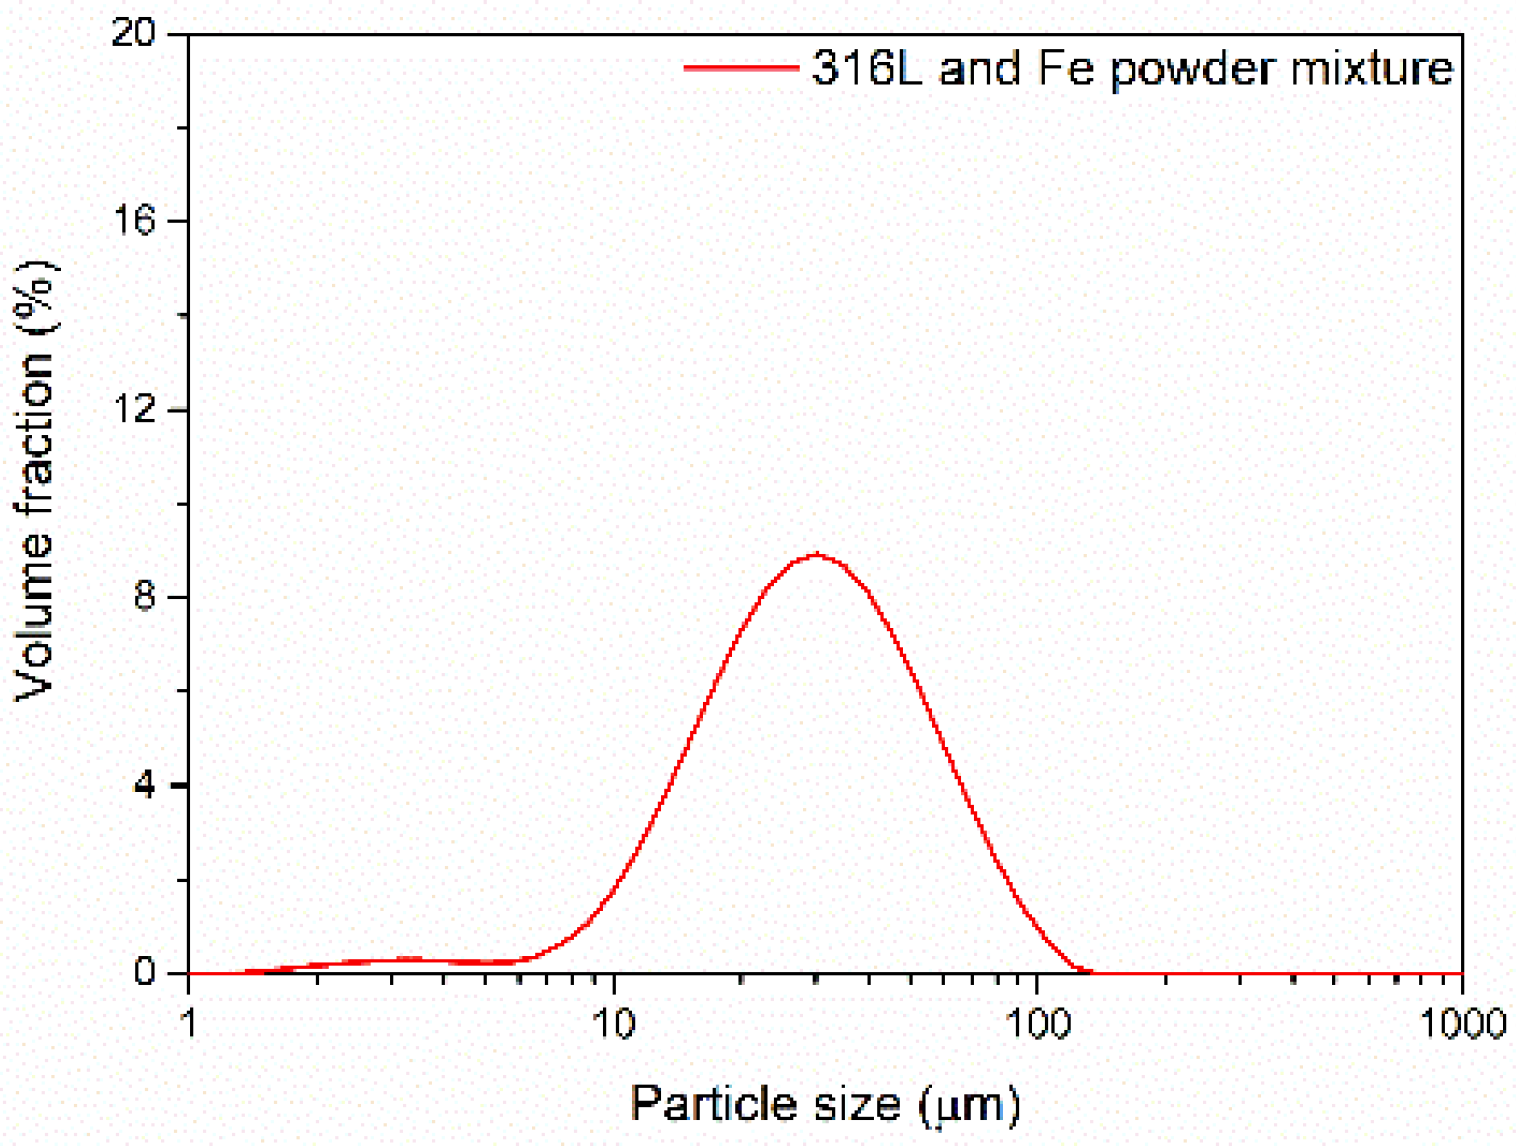
Before the consolidation of the powders, equal quantities of pure Fe powder and the produced 316L steel powder were first selected for mixing (6.45 kg each). The hybrid (mixed) powders were mixed in a drum wheel mixer for one hour to distribute them evenly. The evenly mixed powder was thoroughly dried in a vacuum dryer.
The hybrid (mixed) powders were placed in plastic cans with a volume of 10 L and mixed in a Drum Hoop Mixer JEL RRM (versatile free fall mixer) from J. Engelsmann AG to distribute them evenly. The rotation speed of the mixer was constant and amounted to 32 rpm. The total mixing duration was set to 60 min. The evenly mixed powder was thoroughly dried in a vacuum dryer.

2.2. Particle Size Analysis

To analyse the particle size distribution of the powders, the Mastersizer 2000 from Malvern Panalytical was used. Mastersizer 2000 uses laser diffraction to measure the particle size distribution. In detail, by measuring the light scattered by the laser beam as it passes through dispersed particles, Mastersizer 2000 allows the particle size and size distribution of powders to be measured. Large particles produce a small scattering angle relative to the laser beam, while the opposite is true for small particles. Particle size distribution was analysed following “ISO 13320:2020 Particle size analysis—Laser diffraction methods”.

2.3. Laser Powder Bed Fusion Processing

Laser powder bed fusion (PBF-LB) of the mixed (hybrid) powders is performed using an SLM 250HL machine (SLM Solutions GmbH, chamber volume 250 × 250 × 250 mm3). At the beginning of PBF-LB, the protective argon gas is continuously introduced into the build chamber to reduce the oxygen content to less than 0.2%. The laser used in SLM 250HL is a ytterbium laser, with a maximum power of 400 W. The PBF-LB processing parameters applied in the current investigation are 400 W laser power, 700 mm/s laser scan speed, 0.1 mm hatch distance, 50 μm layer thickness, 200 °C build platform temperature, and 67° hatch rotation. These parameters were selected based on previous experience with PBF-LB of 316L powders as well as following the recommendation of the company SLM Solutions GmbH, the manufacturer of the PBF-LB machine used in the experiment, for processing the 316L steel. As the chosen parameter set allowed the manufacturing of samples with an acceptable level of relative density (more than 99.5% [18]), no further parameter studies were performed to adapt the parameter set.

2.4. Heat Treatment

Following the PBF-LB processing, the samples from the Fe+316L hybrid alloy (produced from the mixture of pure Fe and 316L steel powder) were cut off from the building platform using a band saw and divided into two batches. Afterwards, one batch of samples remained in as-built condition for the analysis. The second batch was heat-treated at 1100 °C for 14 h under a protective argon atmosphere. Before the heat treatment, the samples were sealed with 1.4841 steel foil to isolate them from the ambient air and thus prevent oxidation. Once the sealed samples were placed in the furnace, the argon gas flow was reduced from 30 to 5 L/min and supplied throughout the process until the end of the heat treatment to ensure the presence of a protective atmosphere during the entire heat-treatment process.

2.5. Optical Emission Spectrometer Measurements

The sample preparation for chemical composition analysis was performed following DIN EN ISO 14284 (2022-01-00). The chemical composition of the as-built samples was analysed employing the Q4 Tasman optical emission spectrometer (OES, Bruker Q4 Tasman). The instrument uses an electrical spark generated by a tungsten electrode tip. The electric spark applies energy to the atoms on the surface of the sample, causing them to be excited or vaporised. During this process, different atoms emit specific wavelength spectra that can be analysed to determine the chemical composition of the sample and its contents.

2.6. Microstructure and Porosity Analysis

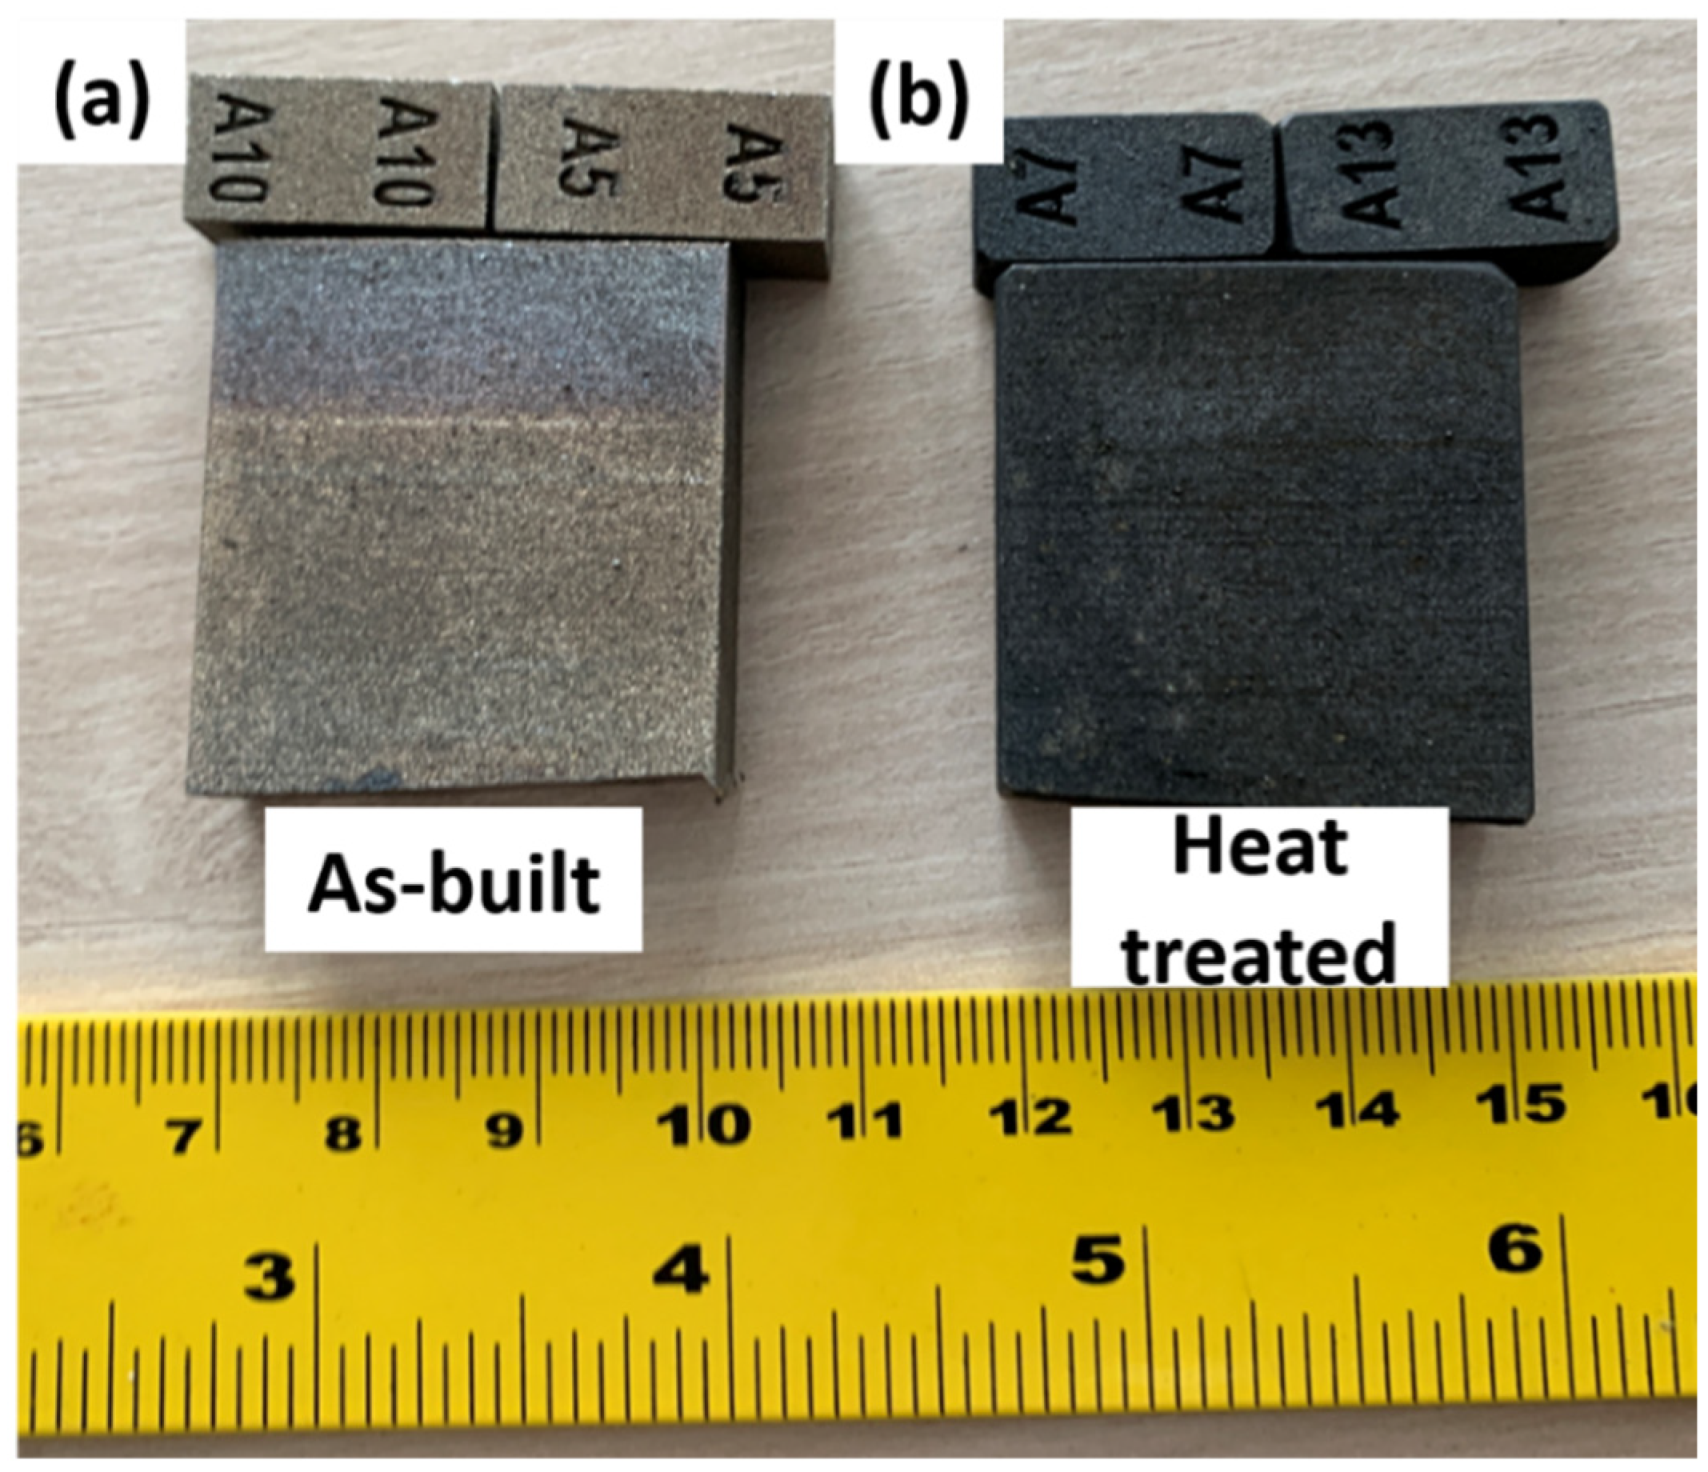
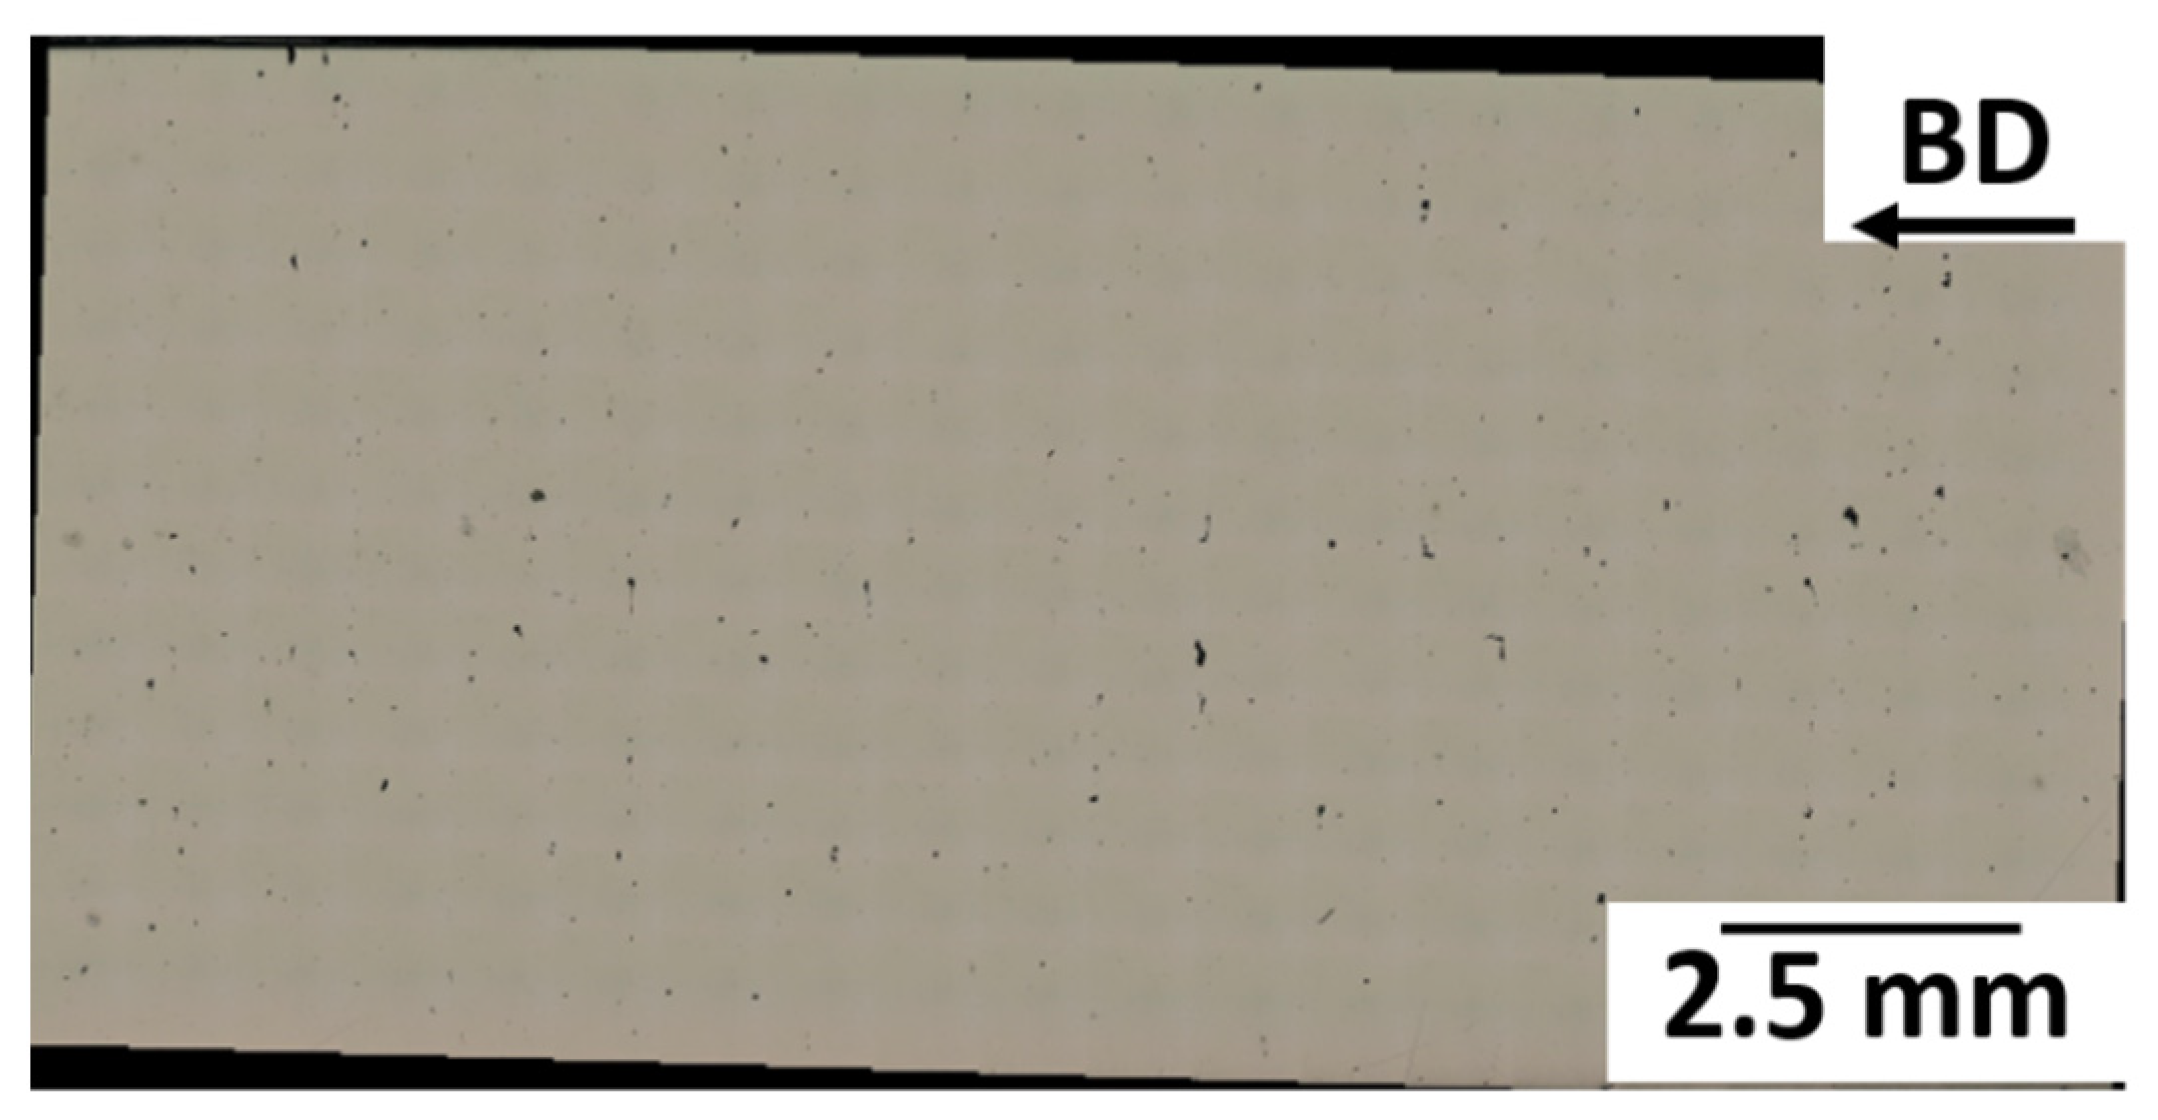
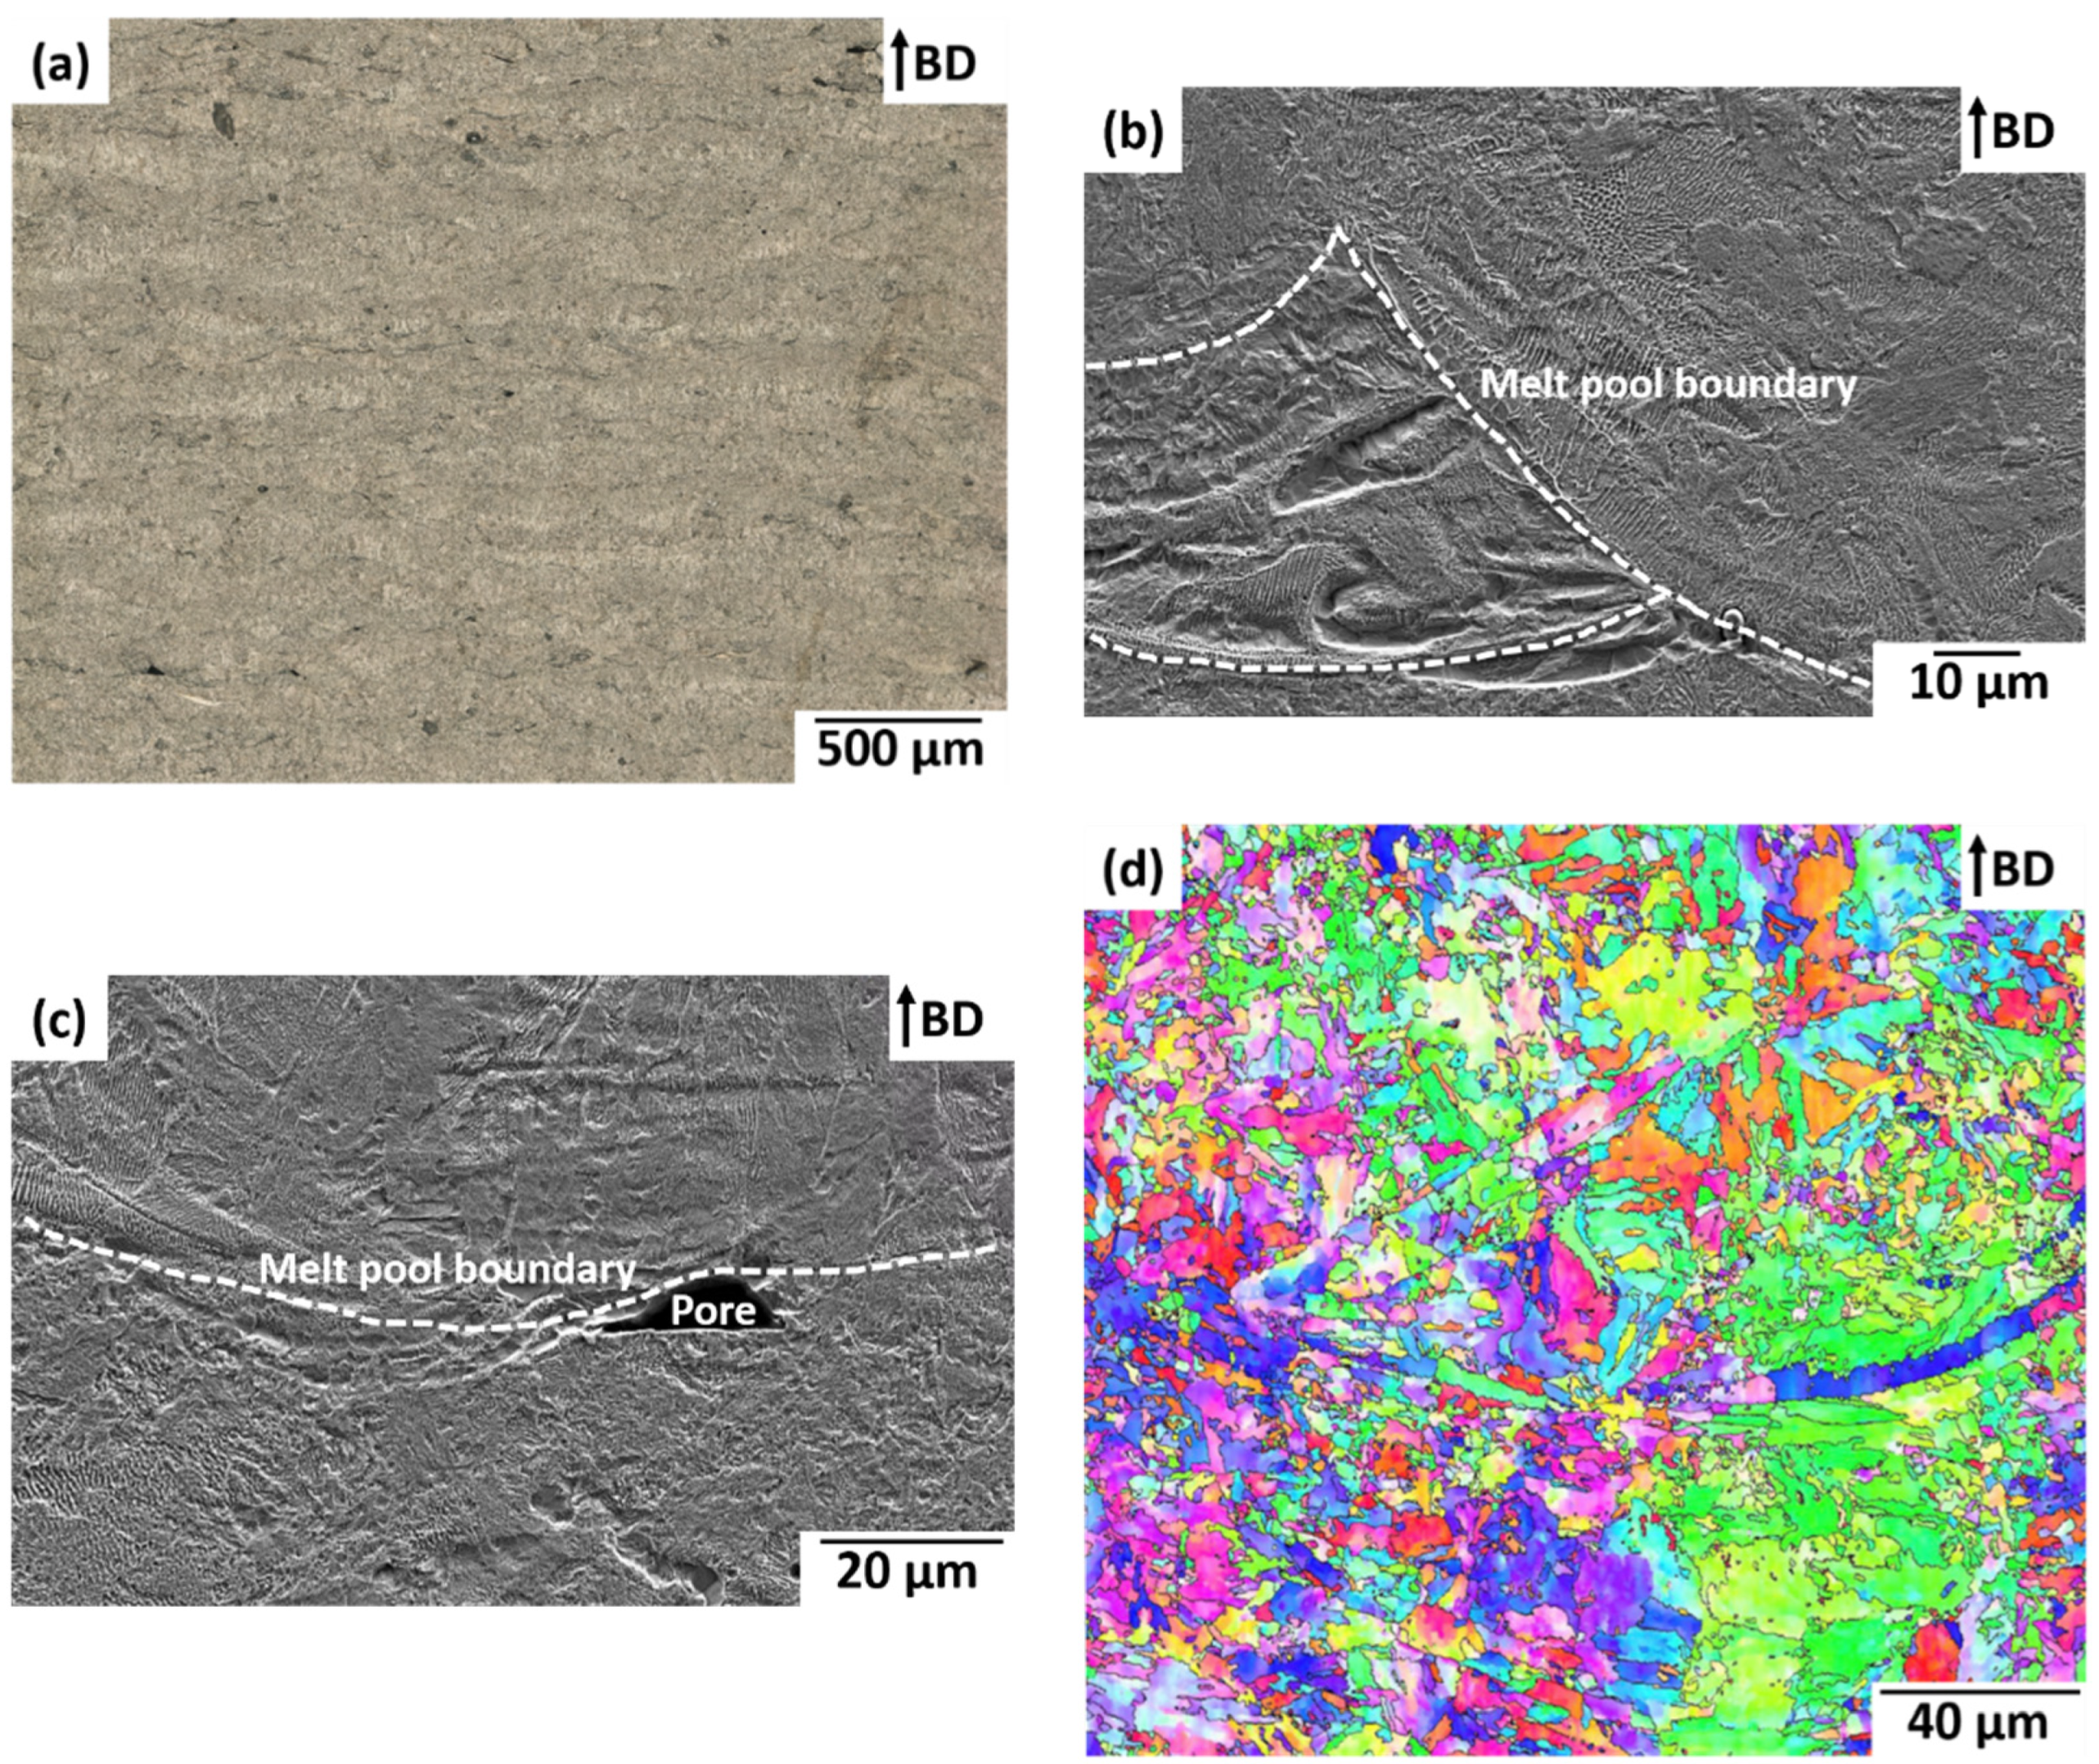
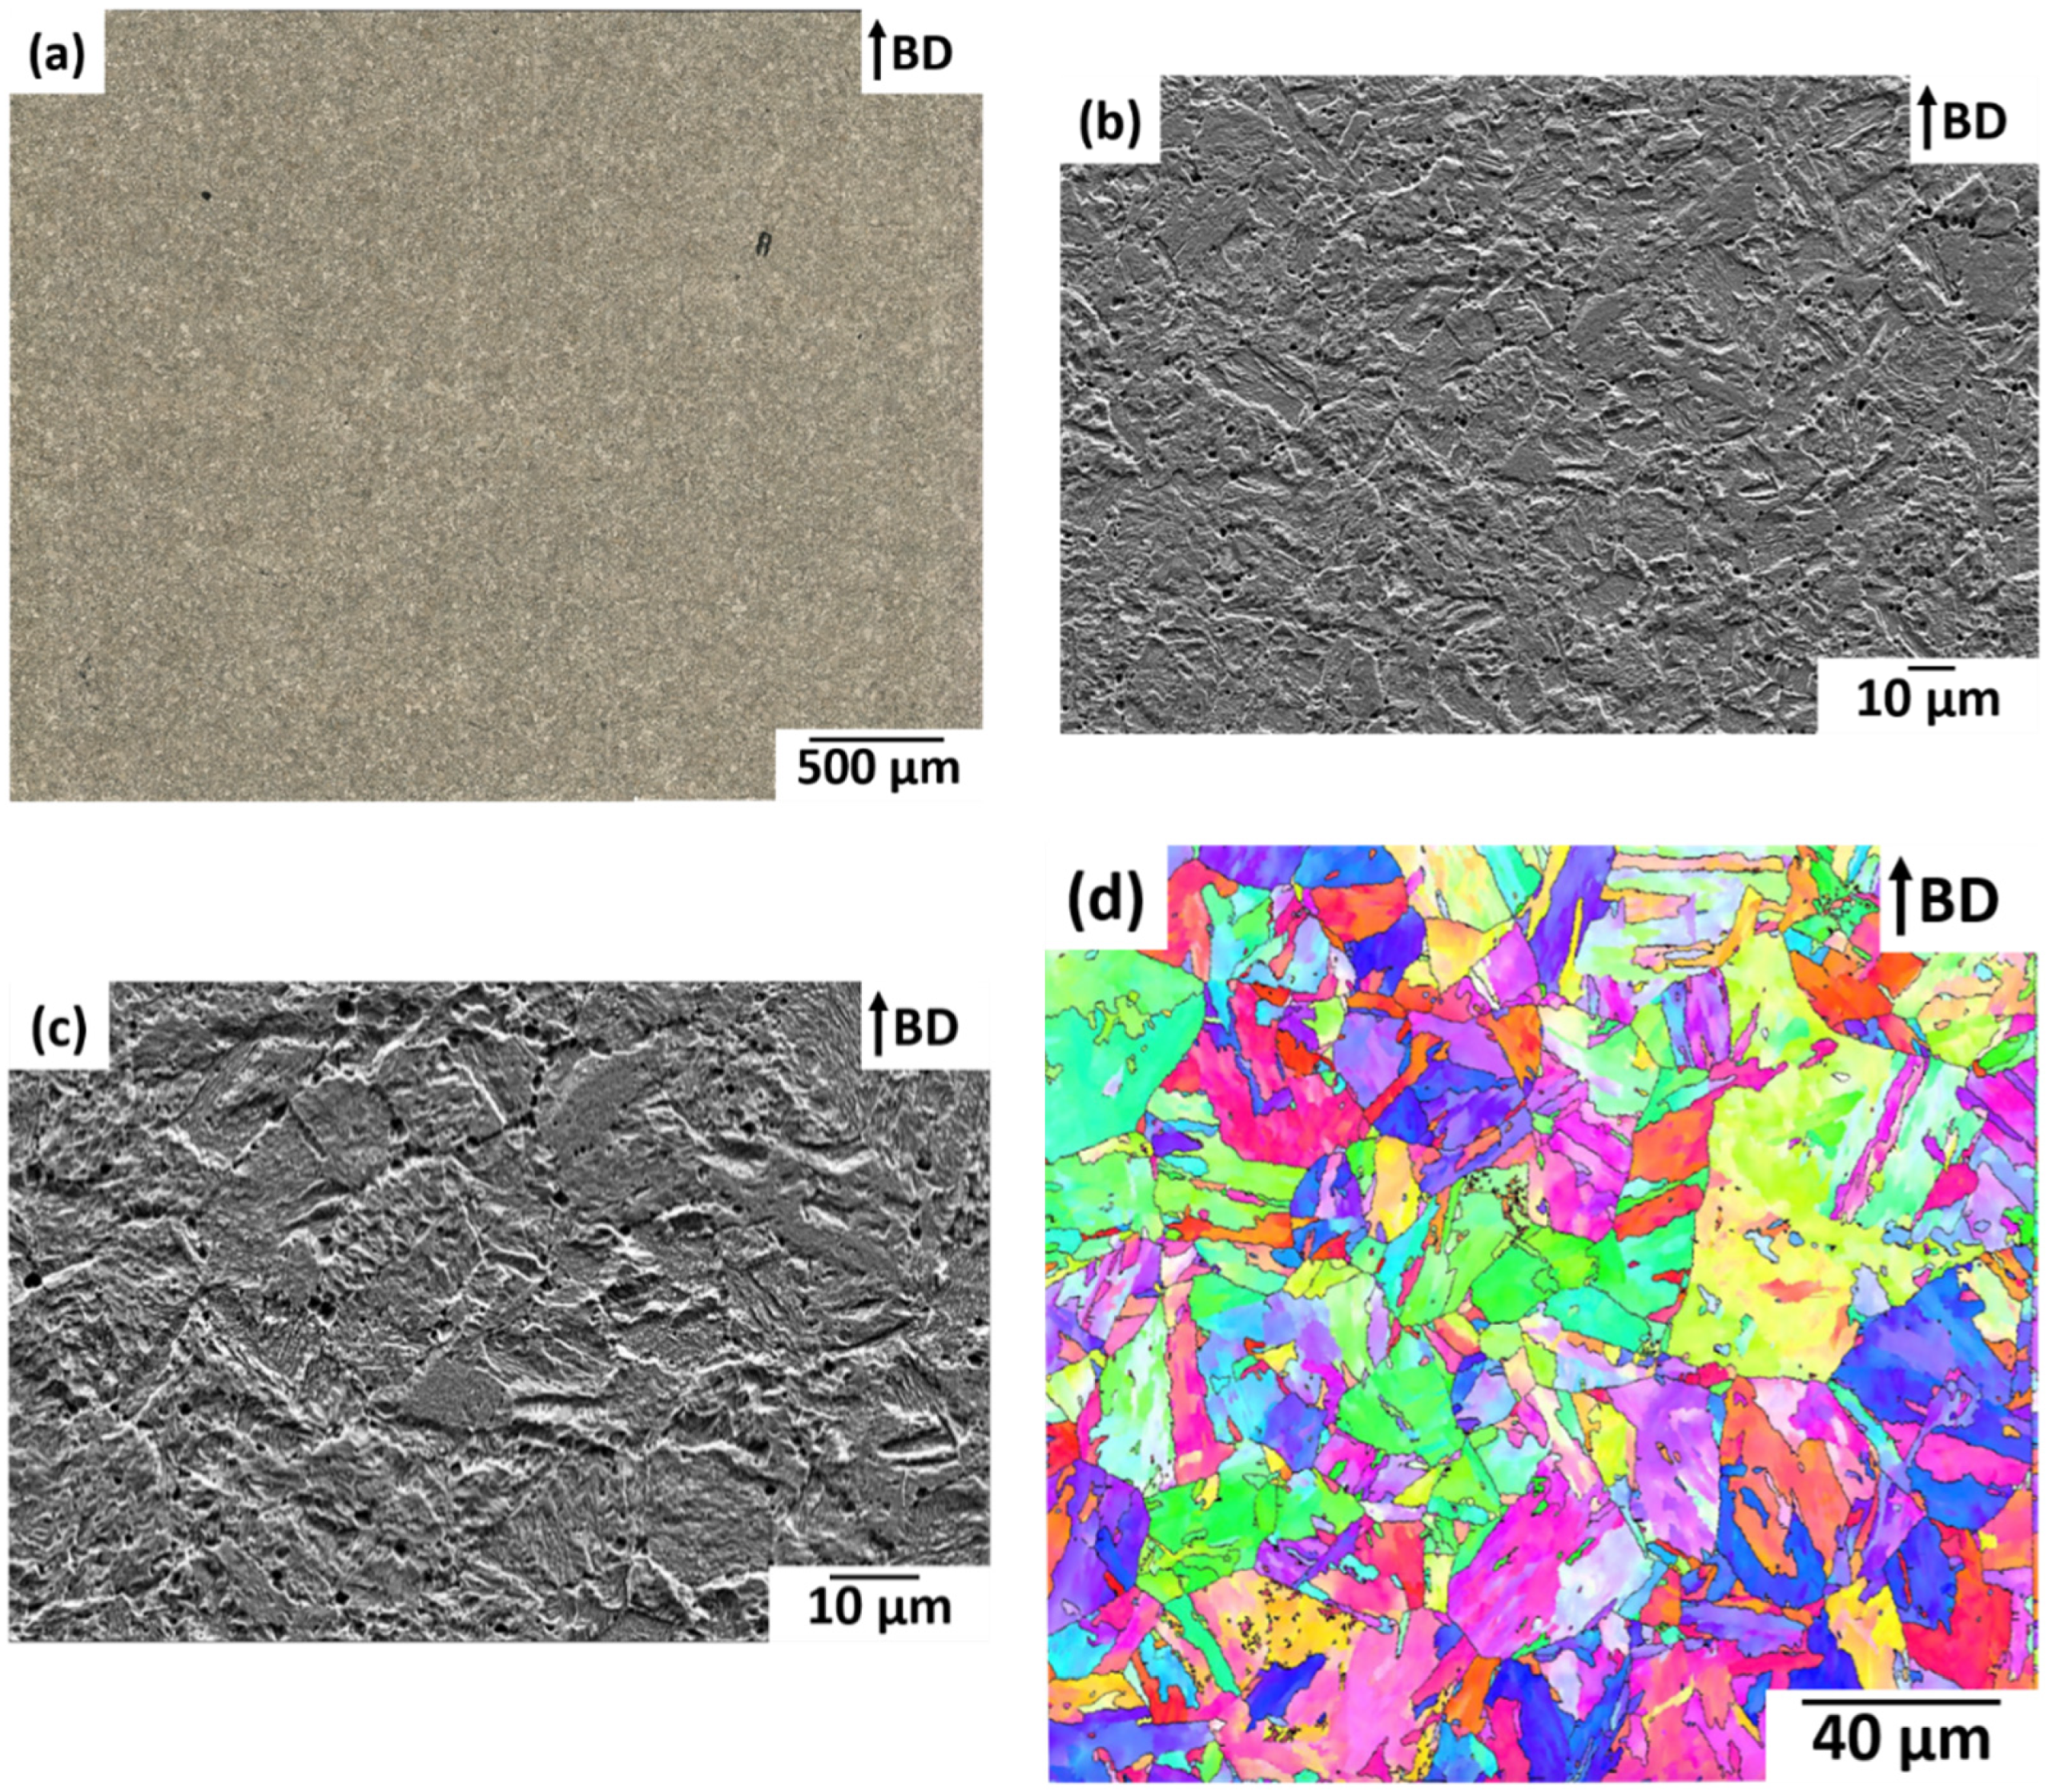
Before examining the microstructure of the as-built and heat-treated samples, the sample surface was polished with abrasive paper. Subsequently, the sample surface was polished with 3 and 1 µm abrasive paste. The polished samples were analysed with a Keyence VHX5000 confocal optical microscope. The polished surface is perpendicular to the build direction. The area of the fine pores on this polished surface was determined by the image contrast, and subsequently, the porosity and relative density were calculated.
To analyse the microstructure of the ground and polished samples, the samples were immersed into the V2A-etchant (mixed solution of hydrochloric acid, nitric acid and distilled water) for 1 min.
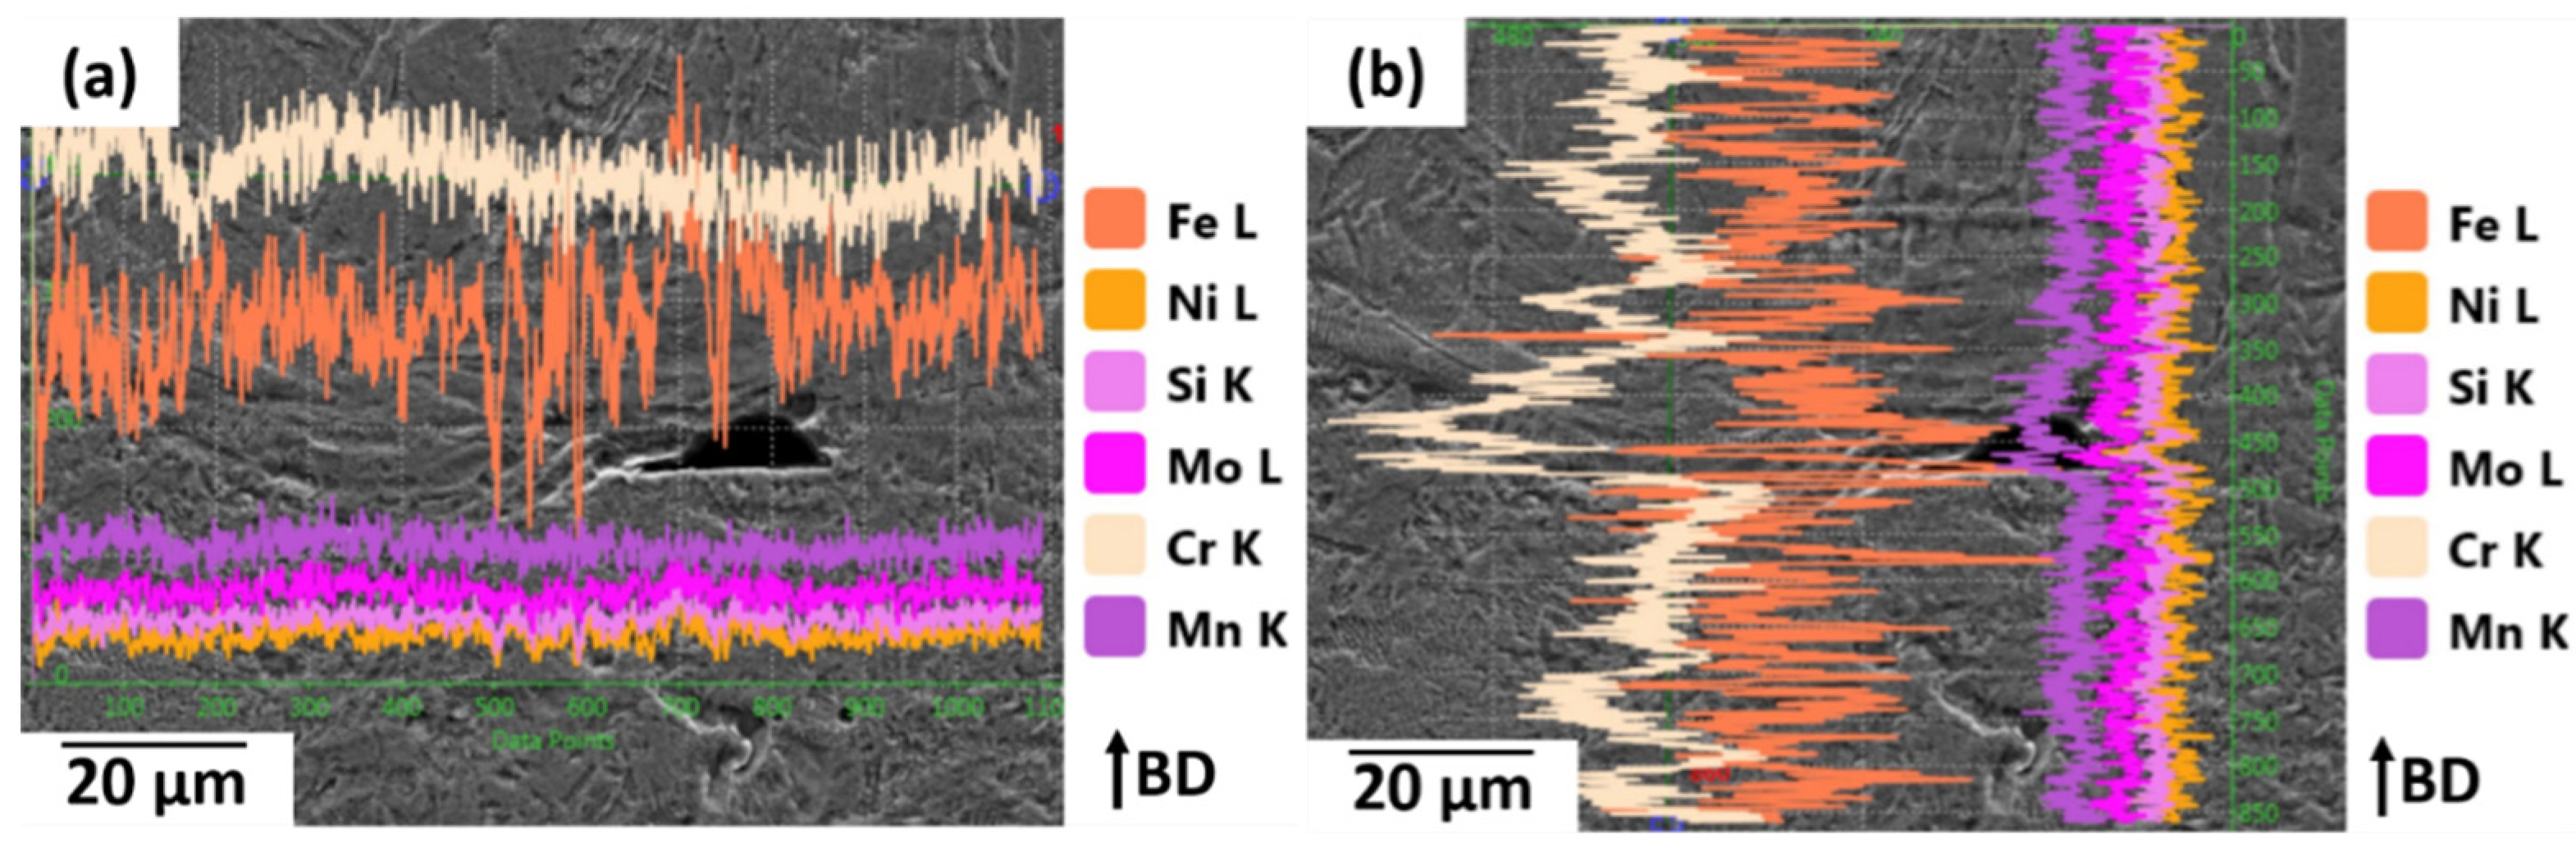
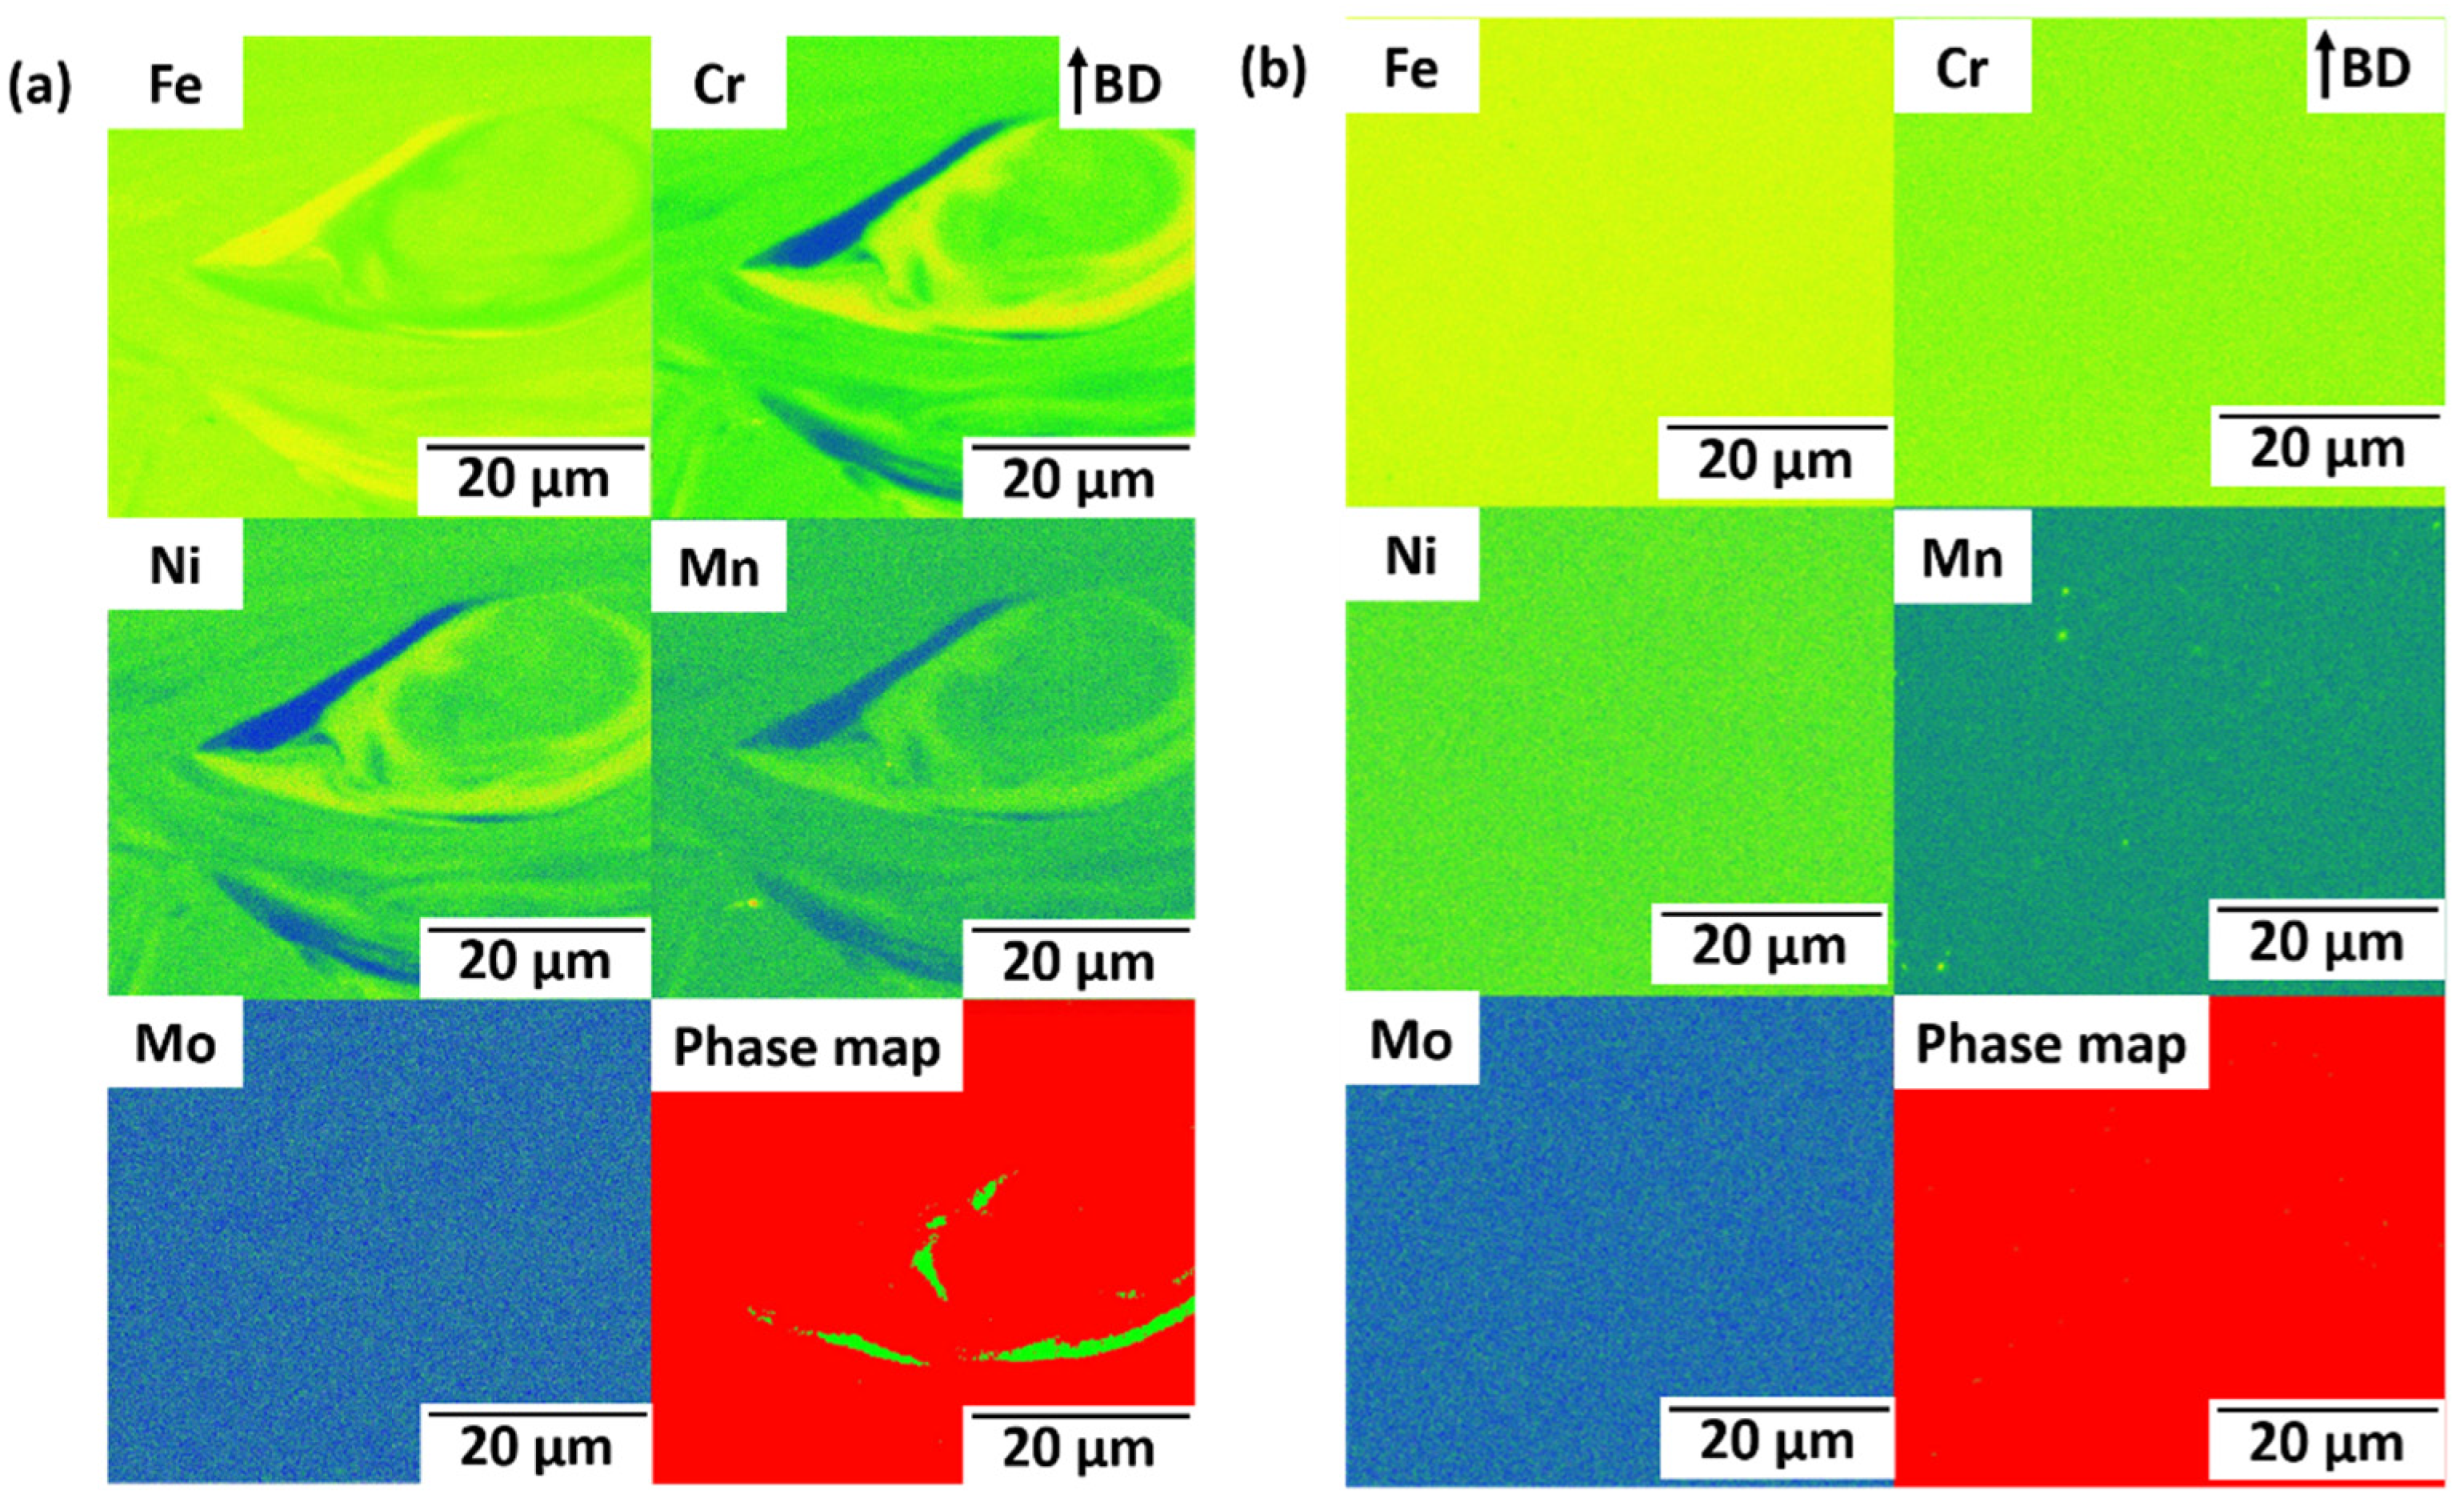
Microstructural investigations were performed using a scanning electron microscope (SEM) Ultra Plus from Zeiss operating at 10 kV accelerating voltage. The corresponding energy dispersive spectroscopy (EDS) line scans were performed with an accelerating voltage of 20 kV at a distance of 8.5 mm. Electron backscattering diffraction (EBSD) of the as-built and heat-treated sample was performed using a step size of 0.1 μm with an accelerating voltage of 20 kV.
In addition to each EBSD scan, an EDS mapping was performed to investigate local differences in the chemical composition. Both EDS- and EBSD-detectors used in this study are from EDAX.
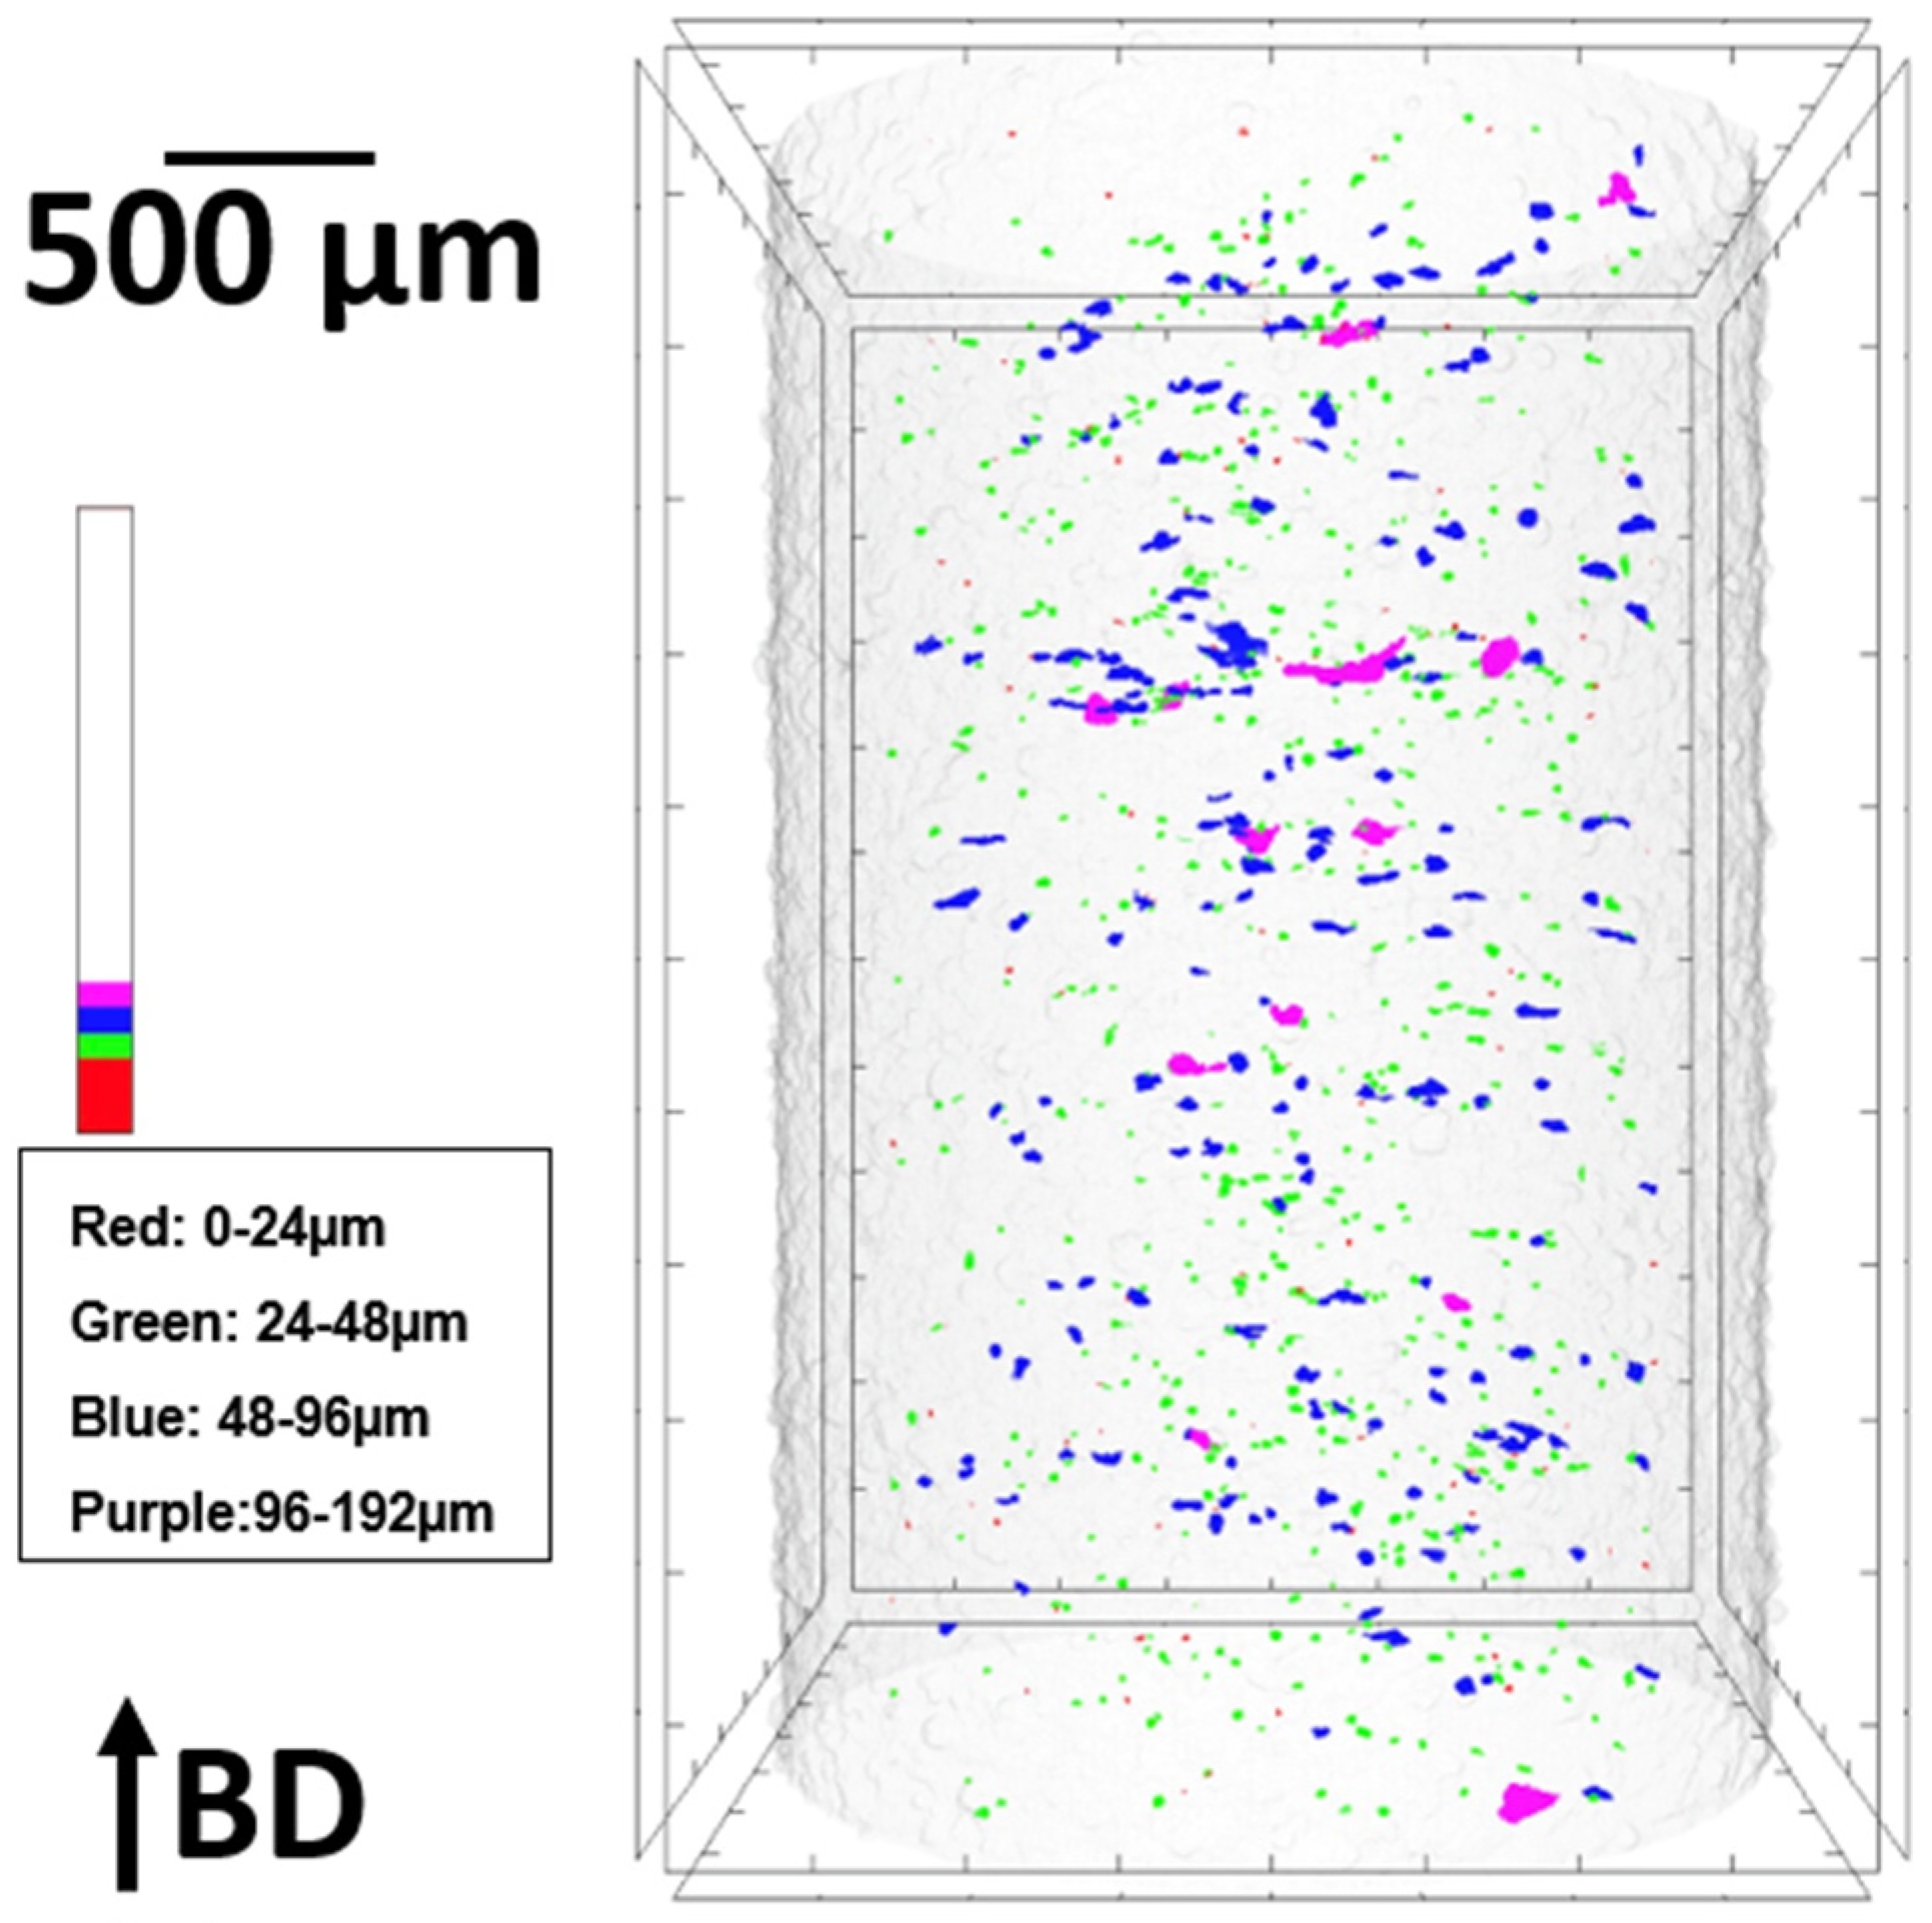
The volumetric porosity was analysed on cylindrical specimens with a diameter of 4 mm using the micro-CT desktop scanner SkyScan 1275 from Bruker (µ-CT) with a source power of 10 W and a 1.0 mm copper filter. The samples were examined with a rotation step of 0.4° and a voxel size of 7 µm. The reconstruction of the sample projections to transverse cross-sections was completed with the software NRecon. Afterwards, the software DataViewer was used to define the volume of interest and align it properly with a coordinate system. Subsequently, the cross-sections of the volume of interest were processed in the software CTAn to distinguish defects from the solid material and finally assembled into a volume and captured with the software CTVox.

2.7. Hardness and Tensile Properties

Hardness measurements were performed according to DIN EN ISO 6507-1, Metallische Werkstoffe—Härteprüfung nach Vickers—Teil 1: Prüfverfahren (ISO 6507-1:2005); Deutsche Fassung EN ISO 6507-1:2005. The macro-hardness measurements were conducted on one sample from each batch with a load of 1 and 10 kg, respectively. Twelve tests were carried out on the polished surface along the building direction. For tensile testing, the samples have a gauge length of 10 mm (length), 3 mm (width) and 1.5 mm (thickness). These tests were carried out using an MTS 858 Table Top System to measure the 0.2% yield strength (YS), ultimate tensile strength (UTS), and elongation at fracture (Elt). Five tensile dog bone specimens were cut off by wire erosion, with the longer side of the samples parallel to the build platform. The samples were tested at a crosshead speed of 0.01 mm/s until at least three specimens from each group exhibited similar load-displacement curves, which were subsequently used to determine the average mechanical properties. Tensile tests are performed following ASTM E8/E8M-22 Standard Test Methods for Tension Testing of Metallic Materials. The geometry of the dog-bone samples used in the tests was non-standardised as the available powder quantity was not sufficient to build specimens with the dimensions required in the standard. Nevertheless, the specimen’s geometry was chosen following the ASTM as proportional miniature dog-bone samples as common in the AAM community

3. Results

3.1. Powder Morphology and Characteristics

The analysis of the outer particle diameter was performed automatically based on the results of laser diffraction measurements (Mastersizer 2000). The analysis of the particle shape was performed qualitatively based on SEM images of the particles, and no further calculations were conducted to quantitatively characterize the parameters of the particle shape, i.e., aspect ratio, area, perimeter or circularity.
Figure 1 shows the powder particle size distribution and the corresponding powder morphology of the 316L steel powder produced by three argon gas atomisation routes. Table 3 presents the powder characteristics for the (1) CCA, cold gas 20 °C, (2) FFA, hot gas 370 °C and (3) CCA, hot gas 370 °C atomisation. All powders are spherical in shape for the three atomisation processes (Figure 1b–d). For the CCA, hot gas 470 °C, and FFA, hot gas 220 °C, atomisation, most of the powder particles are not uniformly distributed in the 10–100 μm size range. However, for the “cold gas 20 °C atomisation routes”, most of the powder particles are between 10 and 100 μm (Figure 1b), with only very few powder particles with a size > 100 μm. Thus, the CCA, cold gas 20 °C atomised powders were selected for mixing with pure Fe in the next step.
The mixed powder required for PBF-LB processing is obtained after thorough mechanical mixing of 50% of Fe powder and 50% of 316L powder with the particle size distribution, as shown in Figure 2, and the powder particle size distribution characteristics mentioned in Table 4. The particle size distribution of the hybrid powder shows a Gaussian distribution with a powder particle size between 10 and 100 μm.

3.2. As-Built and Heat-Treated Samples

Figure 3 shows the images of the as-built and heat-treated samples. Three as-built samples are selected for heat treatment (1100 °C, 14 h). The light-coloured samples (Figure 3a) are untreated, while the dark-coloured sample (Figure 3b) on the right is heat-treated.

3.3. Porosity and Relative Density

Figure 4 provides an overview of the as-built sample via an optical micrograph where the black regions represent pores. The total area of the pores is 2.9 × 105 µm2, which compared with a total area of 1.40 × 108 µm2 results in a calculated porosity of 0.21% and a relative density of 99.79%. Nearly 25% of the pore diameter is between 5 and 10 μm.
Figure 5 shows the three-dimensional distribution of the pores in the cylindrical sample, with the different colours representing the different pore sizes. As can be observed in Figure 5, most of the pore sizes are between 10 and 50 µm. The total volume of the cylindrical sample subjected to the µ-CT is 4.5 × 1010 µm3, with a total pore volume of 5.2 × 107 µm3, so a porosity of 0.116% and relative density of 99.884% is detected. Table 5 compares the porosity and relative density measured from optical microscopy and μ-CT.

3.4. Microstructural Analysis

3.4.1. As-Built Sample

For the as-built sample, a layered optical microstructure of the as-built sample is seen (Figure 6a). The layered microstructure is typical for PBF-LB-processed alloys. Figure 6b,c show a zoomed-in SEM microstructure of the as-built sample. Here it is observed that boundary lines between the additive layers are almost horizontal, while the boundary lines between the tracks are always curved. In addition, the pores appear next to the boundary lines and the pores have a narrow shape. From the EBSD micrograph (Figure 6d), it is observed that the grains are of unequal sizes and shapes along with a random distribution of the grain orientation. According to the EBSD data analysis, most of the grains have a size between 1 and 10 μm. For a grain size of 3 μm, the area fraction of grains is 0.1, while the average grain diameter is 3.5 μm.

3.4.2. Heat-Treated Sample

Figure 7 shows the microstructure of a heat-treated sample (1100 °C, 14 h). From the optical micrograph in Figure 7a, it can be observed that the grain structure changed significantly since no layered grain can be detected. Only a small number of pores are visible in the optical micrograph as well. Figure 7b,c shows an SEM image of the cross-section of the heat-treated sample, where the formerly graded structure is no longer present. Additionally, layer and track boundaries are no longer visible. The grains are evenly distributed and exhibit nearly the same size. The large, narrow pores are no longer visible, too. For the zoomed-in SEM micrograph (Figure 7b,c) numerous fine, round pores are observed, but their distribution is homogeneous. Comparing the EBSD micrographs of as-built (Figure 6d) and heat-treated (Figure 7d) samples, the grain size increases significantly after heat treatment, and the grain orientation appears randomly. Most of the grain sizes are between 1 and 10 μm with an area fraction of 0.15. There are numerous grains between 4 and 20 μm. The average grain diameter is 7.96 μm. Hence, the grain size of the heat-treated sample is significantly higher compared to the as-built sample.

3.5. Hardness Analysis

For the hardness tests, 12 points, which are aligned along the previous building direction, are used for both the as-built and heat-treated samples (Figure 8). The distance between each point on the as-built sample is 2 mm, while the test points on the heat-treated sample are at a distance of 1.5 mm. The hardness results obtained at HV1 (1 kg load) and HV10 (10 kg load) are shown in Figure 8. From Figure 8, it can be seen that the hardness of the specimens is almost uniformly distributed and is not related to the location of the test points. However, the hardness of the specimens decreases significantly after the applied heat treatment. For a 1 kg load, the original average hardness of the specimen is 341 HV1, while the average hardness after heat treatment is 307 HV1. Under a 10 kg load, the average hardness of the as-built sample is 342 HV10, while the average hardness after heat treatment is 325 HV10.

3.6. Chemical Composition Analysis

The chemical composition of the as-built and heat-treated sample measured by OES is presented in Table 6. The chemical composition of the as-built and heat-treated samples remained almost the same. However, the Cr-content in the PBF-LB processed alloys is significantly lower than the raw materials, which were used for atomisation.
The SEM micrograph image (Figure 9a) shows the distribution of various elements along the horizontal and vertical lines. It is observed that the distribution of elements at the boundary between the scanning track varies in the horizontal direction. Here, chromium (Cr), silicon (Si), and manganese (Mn) decrease significantly at the boundary, while the content of iron (Fe), nickel (Ni), and molybdenum (Mo) increases. The remaining areas show small variations in the distribution of elements in the horizontal direction. The most striking feature is an enrichment of Fe at the boundaries but a decrease in Cr.
Figure 9b shows the distribution of the elements along the vertical direction (BD). In conjunction with Figure 9a, it is observed that there is also a significant decrease in Cr, Mn and Si while simultaneously an increase in Fe, Ni, and Mo at the boundary between the layers. Along with the BD, there is an enrichment of Cr, Si, and Mn within each layer, while an enrichment of Fe, Ni, and Mo is observed at the boundaries between the layers.
The chemical composition distribution map in the as-built (Figure 10a) and heat-treated sample (Figure 10b) is presented in Figure 10. The enrichment sites for Fe in Figure 10a are the opposite of those for Cr. However, the enrichment areas for Ni, Mn, and Mo are the same as those for Cr, although the results for Ni and Mo in the chemical composition map do not agree with each other. Another result of Figure 10a is that the Ni and Mo content is inversely proportional to the Cr content. From Figure 10a, it is concluded that a high amount of Ni and Mn has accumulated in the region where the fcc-structure is present. In the following Figure 10b, the chemical composition distribution map of the heat-treated samples is shown, where no variation of the chemical composition is visible (i.e., all elements are uniformly distributed). From the EBSD phase maps, the as-built sample contains 98% α and 2% γ, while the heat-treated sample contains only α. After heat treatment, the concentration of Mn (γ-stabiliser) becomes homogenous, leading to the disappearance of the fcc-structure.
Figure 11 shows the tensile properties of the as-built and heat-treated samples, while Table 7 summarises the calculated mechanical properties. Both samples show ≈20% elongation and reach UTS, quickly followed by a largely localised elongation. The YS of both samples is similar, whereas the UTS of both samples is different. The mechanical properties of the 316L steel samples are similar to those reported in the literature [19].

4. Discussion

The main objective of this work is to prove the processability of samples possessing a microstructure with chemical composition grading by PBF-LB using a mechanically mixed powder of Fe and 316L steel in equal proportions. The choice of powder and the physical properties of the resulting samples are, therefore, of particular importance. Here, it is to be pointed out that the in-house-produced 316L steel powders have similar characteristics to that of industrially produced pure Fe powders (Figure 1).
In Figure 1, the average particle size of powder atomised by hot gas (370 °C) is larger than that of cold gas (20 °C) since the FFA-nozzle is located farther away from the actual atomisation area than CCA-nozzle. During close-coupled atomisation, gas jets hit the melt with higher velocity resulting in finer powder than in the case of free-fall atomisation. Although hot-gas free-fall atomisation allows refinement of the particle size in comparison with cold-gas free-fall atomisation, the chosen temperature of the preheated gas is not high enough to overcome the effect of the remote position of the FFA-nozzle and the resulting lower velocity of gas jets in comparison with the CCA-nozzle [16]. Therefore, the powder atomised via CCA with cold gas is still finer than in the case of FFA with hot gas (see particle size distribution in Figure 1).
The microstructure has (i) elemental enrichment/redistribution at certain locations within the microstructure, (ii) the presence of additive layers (which is expected in AM due to the layer-wise building manner), and (iii) graded chemical composition. As can be seen in the SEM micrographs of the as-built samples, the PBF-LB-produced samples exhibit elemental enrichment at certain locations within the microstructure where the boundaries between the additive layers are visible. Such distributions of phases and alloying elements were also observed by Hengsbach et al. in inline additively manufactured functionally graded multi-material consisting of 316L and H13 [19]. However, after heat treatment (1100 °C, 14 h), the graded structure decreased, and the shape of the grains changed greatly. As seen in Figure 7d, the EBSD map indicates that residual stresses are relieved during the heat treatment process, and the grains recrystallise, causing new grains to form and grow [20,21,22].
The as-built sample not only has a microstructure showing the presence of additive layers but also has a graded chemical composition, as presented in Section 3.6. Here, it is seen that Fe, Ni and Mo are enriched at the boundary between the layers, while Mn, Si and Cr are found within the layers. The enrichment of the various elements between the different layers allows the graded chemical composition of the microstructure. The main cause of this phenomenon is the temperature gradient within the melt pool during PBF-LB. The occurrence of the temperature gradient leads to a gradient distribution in the surface tension of the melt pool. According to the Marangoni effect, the melt with a low surface tension flows to the area with a high surface tension. In addition, the presence of Mn, Si and Cr reduces the surface tension of the molten Fe. The temperature in the middle of the molten pool is higher than at the bottom of the molten pool, which is the reason for the accumulation of these elements in the additive layers [23,24,25,26].
After the sample is heat-treated at 1100 °C for 14 h, the elements are uniformly distributed in the sample, while the layered chemical composition completely decreases. At high temperatures, diffusion of elements from high to low concentrations occurs until equilibrium is reached. Moreover, due to the dilution of the Mn enriched in the region in the sample, no fcc-grains are present. Diffusion annealing, as a common heat treatment, homogenises the chemical element distribution within the sample and leads to recrystallisation [27]. Furthermore, according to the results of the OES analysis (Section 3.6), the total elemental content of the sample is essentially unchanged before and after heat treatment. Hence, it can be assumed that the presence of additive layers, as well as the graded chemical composition, does not affect the total element content.
Thus, the mechanical mixing of ferritic (pure iron) and austenitic (316L) powders allows producing a material with graded chemical and phase composition on the micro-scale. These findings present a basis for future research on the materials of mixed powders of pure iron and manganese/iron-manganese alloys. Such alloys should exhibit increased degradation compared to standard iron-manganese steels, which are discussed as biodegradable materials. A disadvantage of mixed austenitic-ferritic material is the presence of a ferritic phase disabling the application of magnetic resonance imaging (MRI). However, the advantage of degradability might prevail over the disadvantage of disabled MRI, and this concern has to be addressed in further research.

5. Conclusions

In the present investigation, a mixed (hybrid) alloy with an elemental enrichment at certain locations within the microstructure is produced by PBF-LB using a powder mixture of pure Fe and 316L steel in equal amounts. The powders produced after CCA with cold gas are used for mixing with equal amounts of Fe powders as most of the powder particle size is between 10 and 100 μm. From the experimental results, it is concluded that the sample exhibits a graded structure in chemical composition. The presence of additive layers is due to layer-by-layer additive processing. The boundary lines between the additive layers are observed via SEM, where the preferred formation of pores is shown.
The experimental results show that the hybrid alloy with an elemental enrichment at certain locations within the microstructure can achieve a relative density of 99.8%. Moreover, its hardness is similar in the build direction, and there are no areas with an abrupt change in hardness. The graded chemical composition is due to the influence of the Marangoni effect. Different elements are enriched in each layer of the structure or at the boundaries between these layers. This results in a chemical composition gradient. However, the local enrichment of some elements leads to a local appearance of the fcc-structure. After heat treatment, it is also clear that the layered microstructure completely disappears due to the recrystallisation of the hybrid alloy and a uniform chemical composition distribution is achieved.

Author Contributions

Conceptualization, A.A., S.P. and K.-P.H.; methodology, A.A.; software, A.A.; validation, A.A., W.Z. and A.K.; formal analysis, A.A., W.Z. and A.K.; investigation, A.A., W.Z. and A.K.; resources, A.A. and K.-P.H.; data curation, A.A., W.Z. and A.K.; writing—original draft preparation, S.P; writing—review and editing, A.A. and K.-P.H.; visualization, A.A. and K.-P.H.; supervision, A.A., K.-P.H., M.S., J.T.K., F.H. and J.F.-B.; project administration, M.S; funding acquisition, M.S. All authors have read and agreed to the published version of the manuscript.

Funding

The work was performed within the scope of the project “Innovative Alloying Concepts for Additive Manufacturing” granted by the European Regional Development Fund (EFRE) as well as the Ministry of Economic Affairs, Innovation, Digitalization and Energy of the State of North Rhine-Westphalia.

Institutional Review Board Statement

Not applicable to this investigation as no experiments are performed on animal or human subjects.

Informed Consent Statement

Not applicable to this investigation as no experiments are performed on human subjects.

Data Availability Statement

The data presented in this study are available on request from the corresponding author. The data are not publicly available as it forms part of an ongoing study.

Acknowledgments

The authors would like to acknowledge the help received from Anja Puda for performing the metallographic preparation of the samples.

Conflicts of Interest

The authors declare no conflict of interest.

References

  1. Huang, G.; Wei, K.; Deng, J.; Liu, M.; Zeng, X. High-power laser powder bed fusion of 316L stainless steel: Defects, microstructure, and mechanical properties. J. Manuf. Process. 2022, 83, 235–245. [Google Scholar] [CrossRef]
  2. Ahmed, N.; Barsoum, I.; Haidemenopoulos, G.; Al-Rub, R.K.A. Process parameter selection and optimization of laser powder bed fusion for 316L stainless steel: A review. J. Manuf. Process. 2022, 75, 415–434. [Google Scholar] [CrossRef]
  3. Leicht, A.; Fischer, M.; Klement, U.; Nyborg, L.; Hryha, E. Increasing the Productivity of Laser Powder Bed Fusion for Stainless Steel 316L through Increased Layer Thickness. J. Mater. Eng. Perform. 2021, 30, 575–584. [Google Scholar] [CrossRef]
  4. Babu, S.S.; Love, L.; Dehoff, R.; Peter, W.; Watkins, T.R.; Pannala, S. Additive manufacturing of materials: Opportunities and challenges. MRS Bull. 2015, 40, 1154–1161. [Google Scholar] [CrossRef] [Green Version]
  5. Murr, L.E.; Gaytan, S.M.; Medina, F.; Lopez, H.; Martinez, E.; MacHado, B.I.; Hernandez, D.H.; Martinez, L.; Lopez, M.I.; Wicker, R.B.; et al. Next-generation biomedical implants using additive manufacturing of complex, cellular and functional mesh arrays. Philos. Trans. R. Soc. A Math. Phys. Eng. Sci. 2010, 368, 1999–2032. [Google Scholar] [CrossRef] [PubMed] [Green Version]
  6. Dehestani, M.; Trumble, K.; Wang, H.; Wang, H.; Stanciu, L.A. Effects of microstructure and heat treatment on mechanical properties and corrosion behavior of powder metallurgy derived Fe–30Mn alloy. Mater. Sci. Eng. A 2017, 703, 214–226. [Google Scholar] [CrossRef]
  7. Dargusch, M.S.; Dehghan-Manshadi, A.; Shahbazi, M.; Venezuela, J.; Tran, X.; Song, J.; Liu, N.; Xu, C.; Ye, Q.; Wen, C. Exploring the Role of Manganese on the Microstructure, Mechanical Properties, Biodegradability, and Biocompatibility of Porous Iron-Based Scaffolds. ACS Biomater. Sci. Eng. 2019, 5, 1686–1702. [Google Scholar] [CrossRef] [PubMed]
  8. Krüger, J.T.; Hoyer, K.-P.; Huang, J.; Filor, V.; Hernan Mateus-Vargas, R.; Oltmanns, H.; Meißner, J.; Grundmeier, G.; Schaper, M. FeMn with Phases of a Degradable Ag Alloy for Residue-Free and Adapted Bioresorbability. J. Funct. Biomater. 2022, 13, 185. [Google Scholar] [CrossRef] [PubMed]
  9. Tonna, C.; Wang, C.; Mei, D.; Lamaka, S.V.; Zheludkevich, M.L.; Buhagiar, J. Biodegradation behaviour of Fe-based alloys in Hanks’ Balanced Salt Solutions: Part I. material characterisation and corrosion testing. Bioact. Mater. 2022, 7, 426–440. [Google Scholar] [CrossRef] [PubMed]
  10. Perez, N. Electrochemistry and Corrosion Science. Electrochem. Corros. Sci. 2004, 189–246. [Google Scholar] [CrossRef]
  11. Liu, B.; Zheng, Y.F. Effects of alloying elements (Mn, Co, Al, W, Sn, B, C and S) on biodegradability and in vitro biocompatibility of pure iron. Acta Biomater. 2011, 7, 1407–1420. [Google Scholar] [CrossRef] [PubMed]
  12. Lee, M.K.; Lee, H.; Park, C.; Kang, I.G.; Kim, J.; Kim, H.E.; Jung, H.D.; Jang, T.S. Accelerated biodegradation of iron-based implants via tantalum-implanted surface nanostructures. Bioact. Mater. 2022, 9, 239–250. [Google Scholar] [CrossRef] [PubMed]
  13. Morsiya, C. A review on parameters affecting properties of biomaterial SS 316L. Aust. J. Mech. Eng. 2020, 20, 803–813. [Google Scholar] [CrossRef]
  14. Gas-Atomiser AUG 500–25000 | Blue Power Casting Systems GmbH. Available online: https://www.bluepower-casting.com/produkte/metallpulver-herstellung/gas-atomiser/ (accessed on 18 September 2022).
  15. Smirnov, M.A.; Kaplan, M.A.; Sevostyanov Udo, M.A. Receiving finely divided metal powder by inert gas atomization. IOP Conf. Ser. Mater. Sci. Eng. 2018, 347, 012033. [Google Scholar] [CrossRef] [Green Version]
  16. Henein, H.; Uhlenwinkel, V.; Fritsching, U.; Uhlenwinkel, V. Metal Sprays and Spray Deposition; Springer International Publishing: Cham, Switzerland, 2017; ISBN 9783319526898. [Google Scholar]
  17. Ciftci, N.; Ellendt, N.; Soares Barreto, E.; Mädler, L.; Uhlenwinkel, V. Increasing the amorphous yield of {(Fe0.6Co0.4)0.75B0.2Si0.05}96Nb4 powders by hot gas atomization. Adv. Powder Technol. 2018, 29, 380–385. [Google Scholar] [CrossRef]
  18. Froes, F.; Boyer, R. Additive Manufacturing for the Aerospace Industry, 1st ed.; Elsevier: Amsterdam, The Netherlands, 2019. [Google Scholar]
  19. Hengsbach, F.; Koppa, P.; Holzweissig, M.J.; Aydinöz, M.E.; Taube, A.; Hoyer, K.P.; Starykov, O.; Tonn, B.; Niendorf, T.; Tröster, T.; et al. Inline additively manufactured functionally graded multi-materials: Microstructural and mechanical characterization of 316L parts with H13 layers. Prog. Addit. Manuf. 2018, 3, 221–231. [Google Scholar] [CrossRef]
  20. Bobbio, L.D.; Otis, R.A.; Borgonia, J.P.; Dillon, R.P.; Shapiro, A.A.; Liu, Z.K.; Beese, A.M. Additive manufacturing of a functionally graded material from Ti-6Al-4V to Invar: Experimental characterization and thermodynamic calculations. Acta Mater. 2017, 127, 133–142. [Google Scholar] [CrossRef]
  21. El-Galy, I.M.; Saleh, B.I.; Ahmed, M.H. Functionally graded materials classifications and development trends from industrial point of view. SN Appl. Sci. 2019, 1, 1378. [Google Scholar] [CrossRef] [Green Version]
  22. Bleckmann, C.-E. Die Härterei: Einrichtung und Betrieb; Springer: Berlin/Heidelberg, Germany, 1968. [Google Scholar]
  23. Teng, X.; Zhang, G.; Liang, J.; Dong, Z.; Li, W.; Zhang, Q.; Yuan, P.; Gu, D.; Yuan, P.; Gu, D. Molten pool behaviour and its physical mechanism during selective laser melting of TiC/AlSi10Mg nanocomposites: Simulation and experiments. J. Phys. D Appl. Phys. 2015, 48, 035303. [Google Scholar] [CrossRef]
  24. Poprawe, R. Lasertechnik für die Fertigung; Springer Vieweg: Berlin/Heidelberg, Germany, 2005. [Google Scholar]
  25. Kruth, J.P.; Levy, G.; Klocke, F.; Childs, T.H.C. Consolidation phenomena in laser and powder-bed based layered manufacturing. CIRP Ann. 2007, 56, 730–759. [Google Scholar] [CrossRef]
  26. Dubberstein, T. Beiträge zu den Thermophysikalischen Eigenschaften Flüssiger Metallschmelzen. Ph.D. Thesis, Technischen Universität Bergakademie Freiberg, Freiberg, Germany, 2015. [Google Scholar]
  27. Bleckmann, C.-E. Die Härterei: Einrichtung und Betrieb; Springer: Berlin/Heidelberg, Germany, 2013; ISBN 9783642862809. [Google Scholar]
Figure 1. (a) Powder particle size distribution for CCA, cold gas 20 °C (group No. 1), FFA, hot gas 220 °C (group No. 2) and CCA hot gas 470 °C (group No. 3) and SEM micrographs of the atomised 316L powder of (b) CCA, cold gas 20 °C (group No. 1), (c) FFA, hot gas 370 °C (group No. 2), (d) CCA hot gas 370 °C (group No. 3) and (e) industrially produced pure Fe powder.
Powders 02 00005 g001
Figure 2. Powder particle size distribution of the mixed hybrid powder (50% Fe+ 50% 316L steel).
Powders 02 00005 g002
Figure 3. Image showing the (a) as-built and (b) heat-treated samples.
Powders 02 00005 g003
Figure 4. Optical micrograph of the as-built sample showing pores (black regions). BD is the build direction.
Powders 02 00005 g004
Figure 5. μ-CT image presenting the 3D pore distribution of the as-built sample (red: 0–24 µm, green: 24–48 µm, blue: 48–96 µm, purple: 96–192 µm). BD is the build direction.
Powders 02 00005 g005
Figure 6. (a) Optical micrograph, (b,c) SEM micrograph and (d) EBSD micrograph of the as-built sample.
Powders 02 00005 g006
Figure 7. (a) Optical micrograph, (b,c) SEM micrograph and (d) EBSD micrograph of the heat-treated sample.
Powders 02 00005 g007
Figure 8. Hardness variation with measurement distance for the as-built and heat-treated samples for (a) 1 kg and (b) 10 kg loads.
Powders 02 00005 g008
Figure 9. Microstructures showing the (a) horizontal and (b) vertical compositional line profile analysis superimposed on the SEM micrograph for the as-built sample. BD is the build direction.
Powders 02 00005 g009
Figure 10. Elemental chemical mapping showing the distribution of Fe, Cr, Ni, Mn, Mo and α/γ (phase map) for the (a) as-built and (b) heat-treated samples. In the phase map, the red colour represents α, and the green colour represents γ.
Powders 02 00005 g010
Figure 11. Engineering stress–strain curve of the as-built and heat-treated samples.
Powders 02 00005 g011
Table 1. Chemical composition of 316L steel (in wt.%).
CSiMnCrMoNiFe
0.0170.3751.4717.282.01210.868.046
Table 2. Relevant data of different atomisation routes used for powder production.
FFACCA ColdCCA Hot
Suitable for metals with a high melt viscositySuitable for melts with high temperature and high surface tensionSuitable for melts with high temperature and high surface tension
The primary and secondary flow of inert gas is usedMore energy is used to break the melt so finer-sized powder producedMore energy is used to break the melt so finer-sized powder produced
Higher risk of nozzle cloggingLower risk of nozzle clogging
The atomisation gas is not heated (20 °C). Gas pressure is 26 bar.The atomisation gas is heated to 370 °C. Gas pressure is 26 bar.
Table 3. Particle size distribution of the 316L steel powder produced by three argon gas atomisation routes and industrially produced pure Fe powder.
SampleGroup No.Powder Characteristicsd10 (μm)d50 (μm)d90 (μm)
316L1CCA, cold gas 20 °C14.2835.1182.26
2FFA, hot gas 220 °C23.3258.53112.82
3CCA, hot gas 470 °C10.7122.0952.33
Pure Fe-Industrially produced17.1432.0660.57
Table 4. Particle size distribution of unmixed and mixed (hybrid) powders.
Powderd10 (μm)d50 (μm)d90 (μm)
Unmixed 316L powder23.3258.53112.82
Mixed (hybrid) powder
(50% Fe+ 50% 316L steel)
13.87 31.25 65.79
Table 5. Porosity and relative density of the as-built sample.
Sample ShapeMeasuring TechniquePorosity (%)Relative Density (%)
SquareOptical microscopy0.21099.790
Cylindricalμ-CT0.11699.884
Table 6. Chemical composition (in wt.%) of the as-built and heat-treated samples compared to the raw materials.
Sample CSiMnCrMoNiFe
As-Built 0.00850.1620.6968.4440.9745.34583.75PBF-LB processed alloys
Heat treated 0.00830.1620.6818.2750.9835.31983.99
Fe <0.0010.0018<0.004<0.00790.0032<0.002599.96
316L steel 0.0150.3061.40617.001.96510.6767.57
Table 7. Tensile properties of the as-built and heat-treated samples.
SampleYield Stress (MPa)Ultimate Tensile Stress (MPa)Elongation (%)
As-built790106022
Heat-treated78098521
Disclaimer/Publisher’s Note: The statements, opinions and data contained in all publications are solely those of the individual author(s) and contributor(s) and not of MDPI and/or the editor(s). MDPI and/or the editor(s) disclaim responsibility for any injury to people or property resulting from any ideas, methods, instructions or products referred to in the content.

