Article

Multiple-Instance Regression for Metal Powder Hall Flow Rate Prediction Using Augmented Particle Size and Shape Data

1
Department of Computer Science, Worcester Polytechnic Institute, Worcester, MA 01609, USA
2
Department of Mechanical & Materials Engineering, Worcester Polytechnic Institute, Worcester, MA 01609, USA
3
Department of Chemical Engineering, Worcester Polytechnic Institute, Worcester, MA 01609, USA
*
Author to whom correspondence should be addressed.
Powders 2023, 2(1), 189-204; https://doi.org/10.3390/powders2010013
Submission received: 27 October 2022 / Revised: 7 March 2023 / Accepted: 8 March 2023 / Published: 14 March 2023
(This article belongs to the Special Issue Powders for Cold Spray Coatings)

Abstract

:
This study investigates the relationship between metallic powders and their flowability behavior (captured in terms of Hall flow rates using Hall flowmeters). Due to the many trait dependencies of powder flowability, which have made the formulation of a physical and mechanistic generalizable model difficult to resolve, this study seeks to develop an alternative data-driven framework based on powder size and shape characteristics for Hall-flow-rate predictions. A multiple-instance regression framework was both developed for processing multiple-instance powder data and compared with standard machine learning models. Data augmentation was found to improve the overall performance of the framework, although the limited dataset was a constraint. Still, the study contributes to ongoing efforts to identify traditional, associative, and generalizable patterns between powder properties and resultant flowability behaviors. The findings show promise for real-world applications with a larger dataset, such that this initial application of multiple instance regression frameworks for metal powder Hall-flow-rate predictions as a function of powder particle size and shape data can be scrutinized in full.

1. Introduction

Modern metal additive manufacturing (AM) has been under intense research and development since the 1980s. Across the powder-based metal AM technological landscape, mechanical properties and structural behaviors of printed components depend on powder properties (particle- and powder-level traits) and AM processing parameters. For example, the solid-state metal AM technology known as cold spray AM (CSAM) can be tuned in terms of processing parameters (such as carrier gas species, carrier gas temperature, carrier gas pressure, powder feed rate, nozzle geometry, standoff distance, and many others). However, keeping with CSAM for the time being, powder properties known to maintain a particle-level influence upon resultant part properties include moisture content, surface oxide–hydroxide chemistry, elastic modulus, ultimate tensile strength, and hardness, among others.
In addition to the powder-particulate properties listed, which have been fundamentally tethered to structures–mechanics linkages in the illustrative metal AM case of CSAM, metal-powder-based AM component performance, quality, and properties are also affected by powder flowability, rheology, size distributions, and shape characteristics. This is true in the case of CSAM, laser powder-bed fusion, directed energy deposition, electron beam powder-bed fusion, laser-engineered net shaping, and other powder-based metal AM methods. While said powder-flow-related properties are known to influence resultant printed material properties, contemporary understanding lacks a mechanistic framework with predictive and quantifiable capabilities.
As detailed by many previous researchers, the complexity underlying granular physics and particle flow phenomena and the exact mechanism(s) at play are why such a mechanistic framework is lacking. Like prior attempts, this work turns to the formulation of a data-driven framework for quantifying the feature impact of powder-level properties (rather than particle-level properties) upon flowability metrics in the realm of metal AM applications. Without a framework, powder metallurgists will continue relying on Edisonian trial-and-error approaches as well as optimization of suitable powder feedstocks specifically tailored to metal AM flowability requirements and specifications.

1.1. Data-Driven Insights

Previous work has explored how data-driven analysis can unveil insights into processing–structure–properties–performance (PSPP) linkages and relations within AM and traditional substrate manufacturing methods. In an ideal scenario, high-throughput first-principles calculations would be hybridized with machine learning techniques and data analysis algorithms—as was the case in a study on accelerated development of new B-N solids according to brittleness/ductility criteria in [1]. That said, much of the data-driven work to date is less focused on identifying physically significant and symbolically representative mathematical models; instead, it is more dedicated to the correlational analysis and trend identification with a “black-box” model formulation for implementation and application. For further discussion surrounding the physics-driven vs. data-driven approaches to PSPP relation explorations in metal AM specifically, see Kouraytem et al. [2].
That said, a data-driven model that can rapidly and adequately address aspects of our collective lack of understanding (in terms of a framework for powder-level properties with flowability in the context of metal AM) can begin by considering powder size and shape descriptors. While future work ought to explore and more fully examine the myriad of factors influencing powder-flow behavior (many of which are excluded in the initial data-driven model introduced herein, and therefore, such exclusion is conceded as a limitation to the present effort), such as moisture content, temperature, pressure, particle–particle tribology, surface chemistry, blended powders, material density, etc., such factors are beyond the scope of this exploration. Stated otherwise, prior work is invoked that demonstrated notable data-driven model performance when flowability-related metrics were analyzed in terms of strictly powder size and shape information.
Conceding that ignorance of other factors will prevent ideal model performance, one must note that proper training of data-driven models requires a dataset that is large enough and accompanies a wide enough variety of metallic powders with distinctive features. Unfortunately, experimental development of such a database within a single laboratory, particularly in non-computational materials science and engineering R&D, remains cumbersome due to the amount of effort, expertise, labor, materials, and the respective financial resources required to collect high-quality data in reasonable time [3]. Furthermore, without a large enough dataset, data-driven models suffer from poor accuracy, minimal generalizability, and a high inconsistency rate [4].
That said, one may consider previous work reported in [5], which explored a decision tree classification model that was used to predict powder Hall flow rates (HFRs) based on individual particulate constituents (and their size and shape data distributions) for a given feedstock powder concerning HFR thresholds initially proposed by the thermal spray community and subsequently acknowledged within CSAM. Said model did produce favorable results, identifying powder particulate class correctly 77% of the time on unseen powders, but had one significant flaw. In the interest of applying data-driven analysis techniques to powder metallurgy and powder-based metal AM, the authors of the prior study conceded that the premise of the previous decision tree classification model was based on the naïve assumption that the properties of individual particulates could be used to predict powder HFRs. This approach, unfortunately, disregards the collective nature of powders, which comprise many individual particulates, when predicting HFRs and, as a result, does not consider entirely relevant information for data-driven HFR model formulation.
Consequently, the prior approach needed to be expanded to factor in the properties of individual particulates and how they interact, if one hopes to predict flowability in a generalized fashion correctly, let alone CSAM relations specifically. While such expansion is considered hereafter, one must note that the present exploration considers powder particle size and shape data and therefore does not achieve a fully developed data-driven solution, which would include additional powder and particulate properties, such as moisture content, satellite defect densities, surface oxidation, friction, and the like. Regardless, success using microscopy-based data and computer visualization, PSD metrics as feature variables, or both, has previously been achieved with appreciable accuracy when electing to ignore non-size or shape properties of known theoretical import.

1.2. Influence of Powder Flowability in CSAM

Before moving forward with the remainder of the present article, the utility of predicating flowability behavior for CSAM applications is demonstrated to justify the current effort. Kroeger et al. [6] examined funnel-based flow rates for spherical metallic AM feedstock. Kroeger et al., in part, focused on identifying the funnel-based flow rate characteristics of spherical metallic powders for optimized usage in AM processes. Consequently, a general relationship was presented through linear regression analysis applied to HFRs ( f h ) as a function of apparent density. Using the following relation, wherein
f h = 1.0928 ρ a p p 0.9077 ,
an R2 of 0.9847 was achieved when the HFRs or Hall-centric mass-flow rates were expressed in units of g/s and the apparent density was expressed in g/cm3. Invoking this relationship to estimate the apparent density of metallic feedstock powders, considered herein for CSAM applications, a simple exploration of downstream effects on deposit quality and processing parameter variation can be computationally demonstrated with the web-based cold spray simulation software, KSS by “Kinetic Spray Solutions GmbH”, http://www.kinetic-spray-solutions.com/ (accessed 1 March 2023).
For demonstrative purposes, one may assume an HFR value of 2 g/s. Solving for ρ a p p via the above expression yields an approximate value of 2.6608 g/cm3. Using KSS version 1.4.2 and the predefined powder material denoted “steel 316L, austenitic”—which has the designation “316L Carpenter −177 + 53 µm (Test)”; the description “Carpenter Heat 8-0203”; a D10, D50 and D90 of 60, 115, and 160 µm, respectively; and a correction factor (cd-value) of 1.0 in KSS’s Powder Database—we can assume a bulk material density of 7.93 g/cm3 and therefore a powder packing density, i.e., a ratio of apparent-to-bulk densities, of 0.34. Increasing the assumed HFR from 2 g/s to 6 g/s, all else remaining constant, the approximate ρ a p p becomes 6.3211 g/cm3, such that the ratio becomes 0.80. Since this ratio is used to estimate “the volume flow of powder generated by the powder feeder that is translated to a feed rate”, the simulation tool for 1D gas-particle dynamics maintained and developed by KSS can be used to simply vary the ratio term, which is a function of apparent density and therefore a function of the HFR metric.
Assuming a K4000-47 cold spray system with a D24WC nozzle, a starting position for the powder injection site relative to the start of the converging section of the nozzle to be −0.050 m, a stand-off distance of 0.100 m, a PF 4000 Lochscheibe powder feeder, and a rotation feeder disk of 8.0 rpm, the federate of the powder is calculated to be 67.90 g/min when the HFR is 2 g/s and 159.76 g/min when the HFR is 6 g/s. In such cases, the “mass load gas”-calculated value, which captures the percentage of powder mass in the total mass flow rate, increases from 3.7% to 8.6%, and the following window of deposition, as shown in Figure 1, Figure 2, Figure 3 and Figure 4. The processing parameters were nitrogen at a pressure of 40 bar, a gas temperature of 600 °C, a gas volume flow rate of 88.9 Nm3/h, a carrier gas identified as “Stickstoff” with a carrier gas and particle temperature of 20 °C, an injection speed of 15 m/s and fraction in the overall gas mixture of 0.05.
One can demonstrate the consequence of this change in powder-load factor through analysis of kinematic simulation, wherein the shape of the substrate was assumed to be rectangular and the calculated deposition efficiency was 12.2%. The height and width were both 100 mm, the gun travel speed was 111.575 mm/s, the line distance was 2.6 mm, the overspray per line pass was 12.8 mm, the number of layers was 1, the time between layers was 0 s, and the overspray lines were 2.0. All else constant, kinematic analysis suggests that the total coating thickness would be 60 µm. The powder on the substrate would be 38.5 g when the mass of powder fed was 44.1 g for the lower HFR value, and 140 µm in total coating thickness. The powder on the substrate would be 91.8 g when the mass of powder fed was 103.5 g when the higher HFR demonstrative powder was utilized for computational inspection. A simple change in HFR also leads to an increased production cost from EUR 358.2/h of processing when the HFR is lower to EUR 633.8/h when the HFR is higher, all else equal.

1.3. Present Contributions

Herein, three multiple-instance regression (MIR) frameworks are proposed and compared (in terms of model performance) with one another during the present exploration of metallic AM powder HFR predictions using powder size and shape data. In doing so, the present study:
  • Developed the first (to our knowledge) known data augmentation technique that derives multiple-instance data utilizing an aggregated label for instances in mixed samples for powder-based metal AM applications;
  • Introduced the first usage (to our knowledge) of MIR for processing powder-based data in metal AM; and
  • Developed a comparative study of various MIR frameworks to determine the most promising framework for addressing said problem.

2. Problem Setting

2.1. Powder Flowability through the Lens of HFRs

When HFRs capture powder flowability, Hall flowmeters measure the time required for 50 g of powder to flow through a Hall flowmeter funnel [7]. In the specific data set of powders considered herein, HFRs ranged from “no flow” to 40.7 s per 50 g. The lower the HFR, the more readily a powder freely flows, whereas a powder more resistant to flowing under Hall flowmeter conditions will achieve a higher HFR value. Unfortunately, several powders utilized within metal AM processing are not free-flowing and therefore do not flow through the Hall flowmeter funnel regardless of the time permitted. These powders are labeled with an HFR of 0, which indicates that the powder cannot flow through a Hall flowmeter according to ASTM-based standard practice.

2.2. Data Analysis for Predicting HFRs

Recent advancements have enabled data-driven modeling aimed toward the procurement of a better understanding of the relationship between the morphological traits of microparticulates within a powder and the parent powder’s flowability. For example, using linear regression models, Kudo et al. [8] found a relationship between the diameter and shape of granulated lactose with its flowability. Similarly, Kiani et al. used the Pearson correlation method to relate powder properties to powder flowability [9]. Both studies achieved promising results and further validated the relationship between powder flowability and said powders’ particle level size, shape, and morphological characteristics. Unfortunately, neither approach could fully capture the complexity of accurately predicting powder flowability in such a manner.
In contrast, Zhang et al. [10] introduced an approach to predict flowability using a computer vision approach, and the resulting regression model produced outperformed previous attempts. However, despite promising results, the computer vision technique is not widely accessible and can only capture a powder profile, leading to potentially incorrect results when powder particles are not uniform. Accordingly, the need for a complete and accessible data-driven, statistical, or machine-learning approach for predicting a powder flowability metric remains.

3. Proposed Frameworks and Approaches

3.1. Processing Using Multiple-Instance Learning

The experimental data set comprised a set of 46 powders. Each powder particle was labeled with a set of 29 features, presented here in Table 1. These particles, collectively and individually, contribute to the overall HFR of the powder; however, if left unprocessed, their features remain too complex to gain valuable insights for prediction. Figure 5 presents the particle feature distributions across all experimentally tested powders considered. The red vertical lines in each distribution plot below indicate outlier regions’ upper and lower bounds. Data preprocessing was performed to remove these outliers with the Cleaning on Demand with a Recommender System (CODeRS) toolkit developed by Vieira and Schuliger [11]. When considering Table 1, one may note that the 29 features include size, shape/form, surface roughness, and intensity measurements that are partly calculated using combinations of other Microtrac metrics. While this is a limitation of the present work, feature reduction was not pursued in this initial study since just the base features alone may not have been enough to capture the complex interactions in a Hall flowmeter.
Multiple-instance learning [12] is an emerging form of supervised machine learning in which each sample consists of multiple non-labeled instances that contribute to the overall label of the sample. This form of machine learning aims to develop a model that can predict the label of the sample (or bag) based on its instances. Recent literature focuses on developing algorithms for multiple-instance classification (MIC) applications [13,14,15], where each bag is labeled based on the presence of a positive instance. Accordingly, most of the standard multiple-instance data sets studied to date, such as images and videos, are used in classification applications, which explains the popularity of MIC research. In contrast, there is a lack of research regarding MIR applications.
As a result, the typical way of dealing with an MIR problem is to utilize primary-instance regression (PIR) [16], a technique based on MIC applications in which the label of the bag is based on a single or primary instance within the bag. Although its implementation is simple, the strategy remains inadequate since it disregards much of the information from multiple instances. Furthermore, implementing it in the real world is also highly unreasonable since it requires the primary instance to be known in each bag. As a result, three different MIR frameworks were compared to determine the best method for extracting valuable information from each powder. These methods included aggregated MIR, instance MIR, and pruning MIR.

3.1.1. Aggregated MIR

Aggregated MIR [17] is a form of MIR that compacts the instances in a sample into a single set of features using an aggregate operator. Each powder was aggregated into a single set of the sample’s features utilizing the average operation. Then, for each feature, the average value amongst all particles in the powder is calculated to derive the single feature value. This strategy for processing captures a broad feature set of each powder, thus allowing analysis of the relationship between the characteristics on the powder level and its HFR.

3.1.2. Instance MIR

The Instance MIR framework treats each instance as its sample and trains a model where the labels are the instance’s bag label [18,19]. Recent literature utilizes this framework as a baseline for proposed MIR solutions due to its simplistic implementation and similarities to traditional machine learning applications [20,21]. This method was implemented herein by labeling each particle with the HFR of its powder and consolidating all particles into a single data set. From there, a classification model was trained to calculate the predicted powder label using a majority vote of predictions across all particles in the powder. In contrast to aggregated MIR, instance-MIR processing emphasizes the impact of each particle’s contribution to the overall powder flowability or HFR. As a result, Instance MIR allows one to analyze the relationship between individual particles and the overall powder flowability.

3.1.3. Pruning MIR

In pruning MIR [21], noisy instances are removed from each bag, and instance MIR is used to process those remaining; that is, those deemed most important. Said approach was expanded further herein through the usage of auto-encoders. More specifically, each powder was encoded into lower-dimensional space. From here, a classification model was trained on the resultant encoding(s) to predict powder HFRs. Like instance MIR, the pruning MIR framework analyzes each particle’s contribution to the powder’s overall HFR. However, by removing noisy or unimportant instances, said framework can more easily determine a less complex relationship between particle characteristics and powder HFR.
The present is the first attempt to utilize and compare MIR frameworks to predict HFR for metal AM and CSAM-based applications within the materials science, processing, and engineering community.

3.2. Target Variable Engineering

We utilize the HFR as the target variable for our developed models. However, to produce an accurate classification model, feature engineering was required. HFRs ranged from 0 to 40.7 in the present data set. As previously mentioned, an HFR of 0 indicates that the powder could not flow, placing it in the “low flow” category. Unfortunately, from a regression standpoint, this designation of “no flow” breaks the continuity of the flowability feature. One solution was to label all “no flow” powders with the maximum labeled HFR. However, this strategy does not accurately depict such powders, especially when real-world or test samples achieve a higher HFR than the maximum value in the training data set. Thus, the present work describes how a technique was developed that preserves the distinction of such powders from the rest of the continuum. Utilizing such a technique, the present work replaced all non-zero HFRs with their inverse as defined by 1 / f where f represents the HFR of the powder. All “no flow” powders sustain their HFR of 0. This technique transforms the HFR into a continuous data domain that preserves the proper distance between each HFR.

3.3. Class Balancing

When training a classification model, the classes must be balanced, or at least as balanced as possible [22]. When classes are not balanced, and most of the data fall under one class (the majority class), the model becomes biased towards the majority class and less accurately representative of the minority class [23]. For example, in the data set used herein, there were 17 “high flow” powders and 29 “low flow” powders, and because of this imbalance, any trained classification model would more likely than not predict “low flow”, even in instances of high HFR. To counteract such an imbalance and associated bias, under-sampling [22] was implemented on the majority class such that powders were randomly selected until an equal number of powders found in the minority class had been selected. While this reduced the training set’s overall size, it mitigated potential bias and improved the overall robustness of the model.

3.4. Proposed Strategy for Powder and Particle Data Augmentation

One needs an extensive data set to build a robust and accurate model. However, materials science and engineering lack well-curated and accessible experimental datasets, which are readily produced or can be sourced from openly shared repositories [24]. As a result, research on developing data augmentation techniques for the field remains an active point of interest. For example, in 2020, Ma et al. developed a data augmentation strategy [3] to compensate for the lack of high-quality data collected during characterization. Ma et al.’s technique produces new images based on simulations coupled with integrating authentic images into the training data set, to improve the accuracy of microstructural image segmentation models for instance. Furthermore, Ohno developed a technique using variational auto-encoders (VAEs) as generative models [25], which can provide additional data for regression-based analyses and regression model applications across the domain of materials science and engineering.
Nevertheless, data augmentation techniques for applications in MIR, such as the prediction of HFRs for a bag of particles, are scarce, if not uniquely considered to date herein. Furthermore, normal data augmentation strategies cannot be expanded to work for multiple-instance data due to the nature of labeling in multiple-instance data. Since the labels of instances in multiple-instance data are not directly linked to the instance itself, but rather the bag as a whole, current data augmentation methods which generate new data based on the instance–label pairs will not accurately augment this form of data which is due primarily to the lack of literature covering techniques for MIRs in general. A recent study developed a technique for augmenting bagged data [26]; however, the technique is only applicable to image-based data and classification tasks. Thus, data augmentation strategies for MIR applications in domains such as powder-specific materials science and engineering remained necessary.
A data augmentation strategy for synthesizing new powder data was implemented herein. “Virtual Powders” were generated to overcome data-set size constraints by collecting a random percentage of particles from two to three powders per virtual powder generation step. Then, the HFR of the virtual powder was computed by adding together the respective inversely transformed HFRs (HFR to 1/HFR) of the underlying powders multiplied by their sampled percentage. Said strategy was adopted to make machine learning more applicable to fields such as powder-centric materials science research that struggle to produce large data sets and inherently contain multiple instances. To assess the validity and accuracy of this technique, we completed a real-time experiment in which varying percentages of powders were mixed and measured. Naïve Ti and Cu powders were mixed in controlled ratios and experimentally found to result in HFRs comparable to those calculated using this augmentation technique, as shown in Figure 6. This experimentation, however, was purely a proof of concept. Therefore, we plan to further validate this technique experimentally in the future. Still, the trend holds with prior work observing similar phenomena. Therefore, future work ought to consider exploring the present observations and findings in the present work by way of applying alternative virtual sample-data generation using methods such as those of Shen and Qian [27].

3.5. Hall Flow Prediction Using Classification

As previously mentioned, each powder in the training set consisted of multiple particles, each with its features. This characteristic was exploited by utilizing aggregated multiple-instance regression (MIR) to process each powder. This processing strategy allowed the exploration of the relationship between the general characteristics of a powder and its HFR. Following processing, the data were fed into two separate models for HF-rate prediction.
To compare how well the three chosen MIR frameworks extract valuable insights from powder data, the accuracy of a Hall flow classification model was calculated on three different data sets, each processed using a different MIR framework. To ensure consistency across tests, a decision tree classification model was utilized for each data set that predicts whether the powder would flow easily (“high flow”) or with difficulty (“low flow”). A classification model was built using the Decision Tree Classifier from Scikit-Learn [28]. To verify over-fitting to a specific subset of the data, K-fold cross validation [29] was implemented, and to validate the robustness of each model on real-world data, a hold-out test set was utilized. Model performance was measured using accuracy and F1-scores.

4. Results and Evaluation
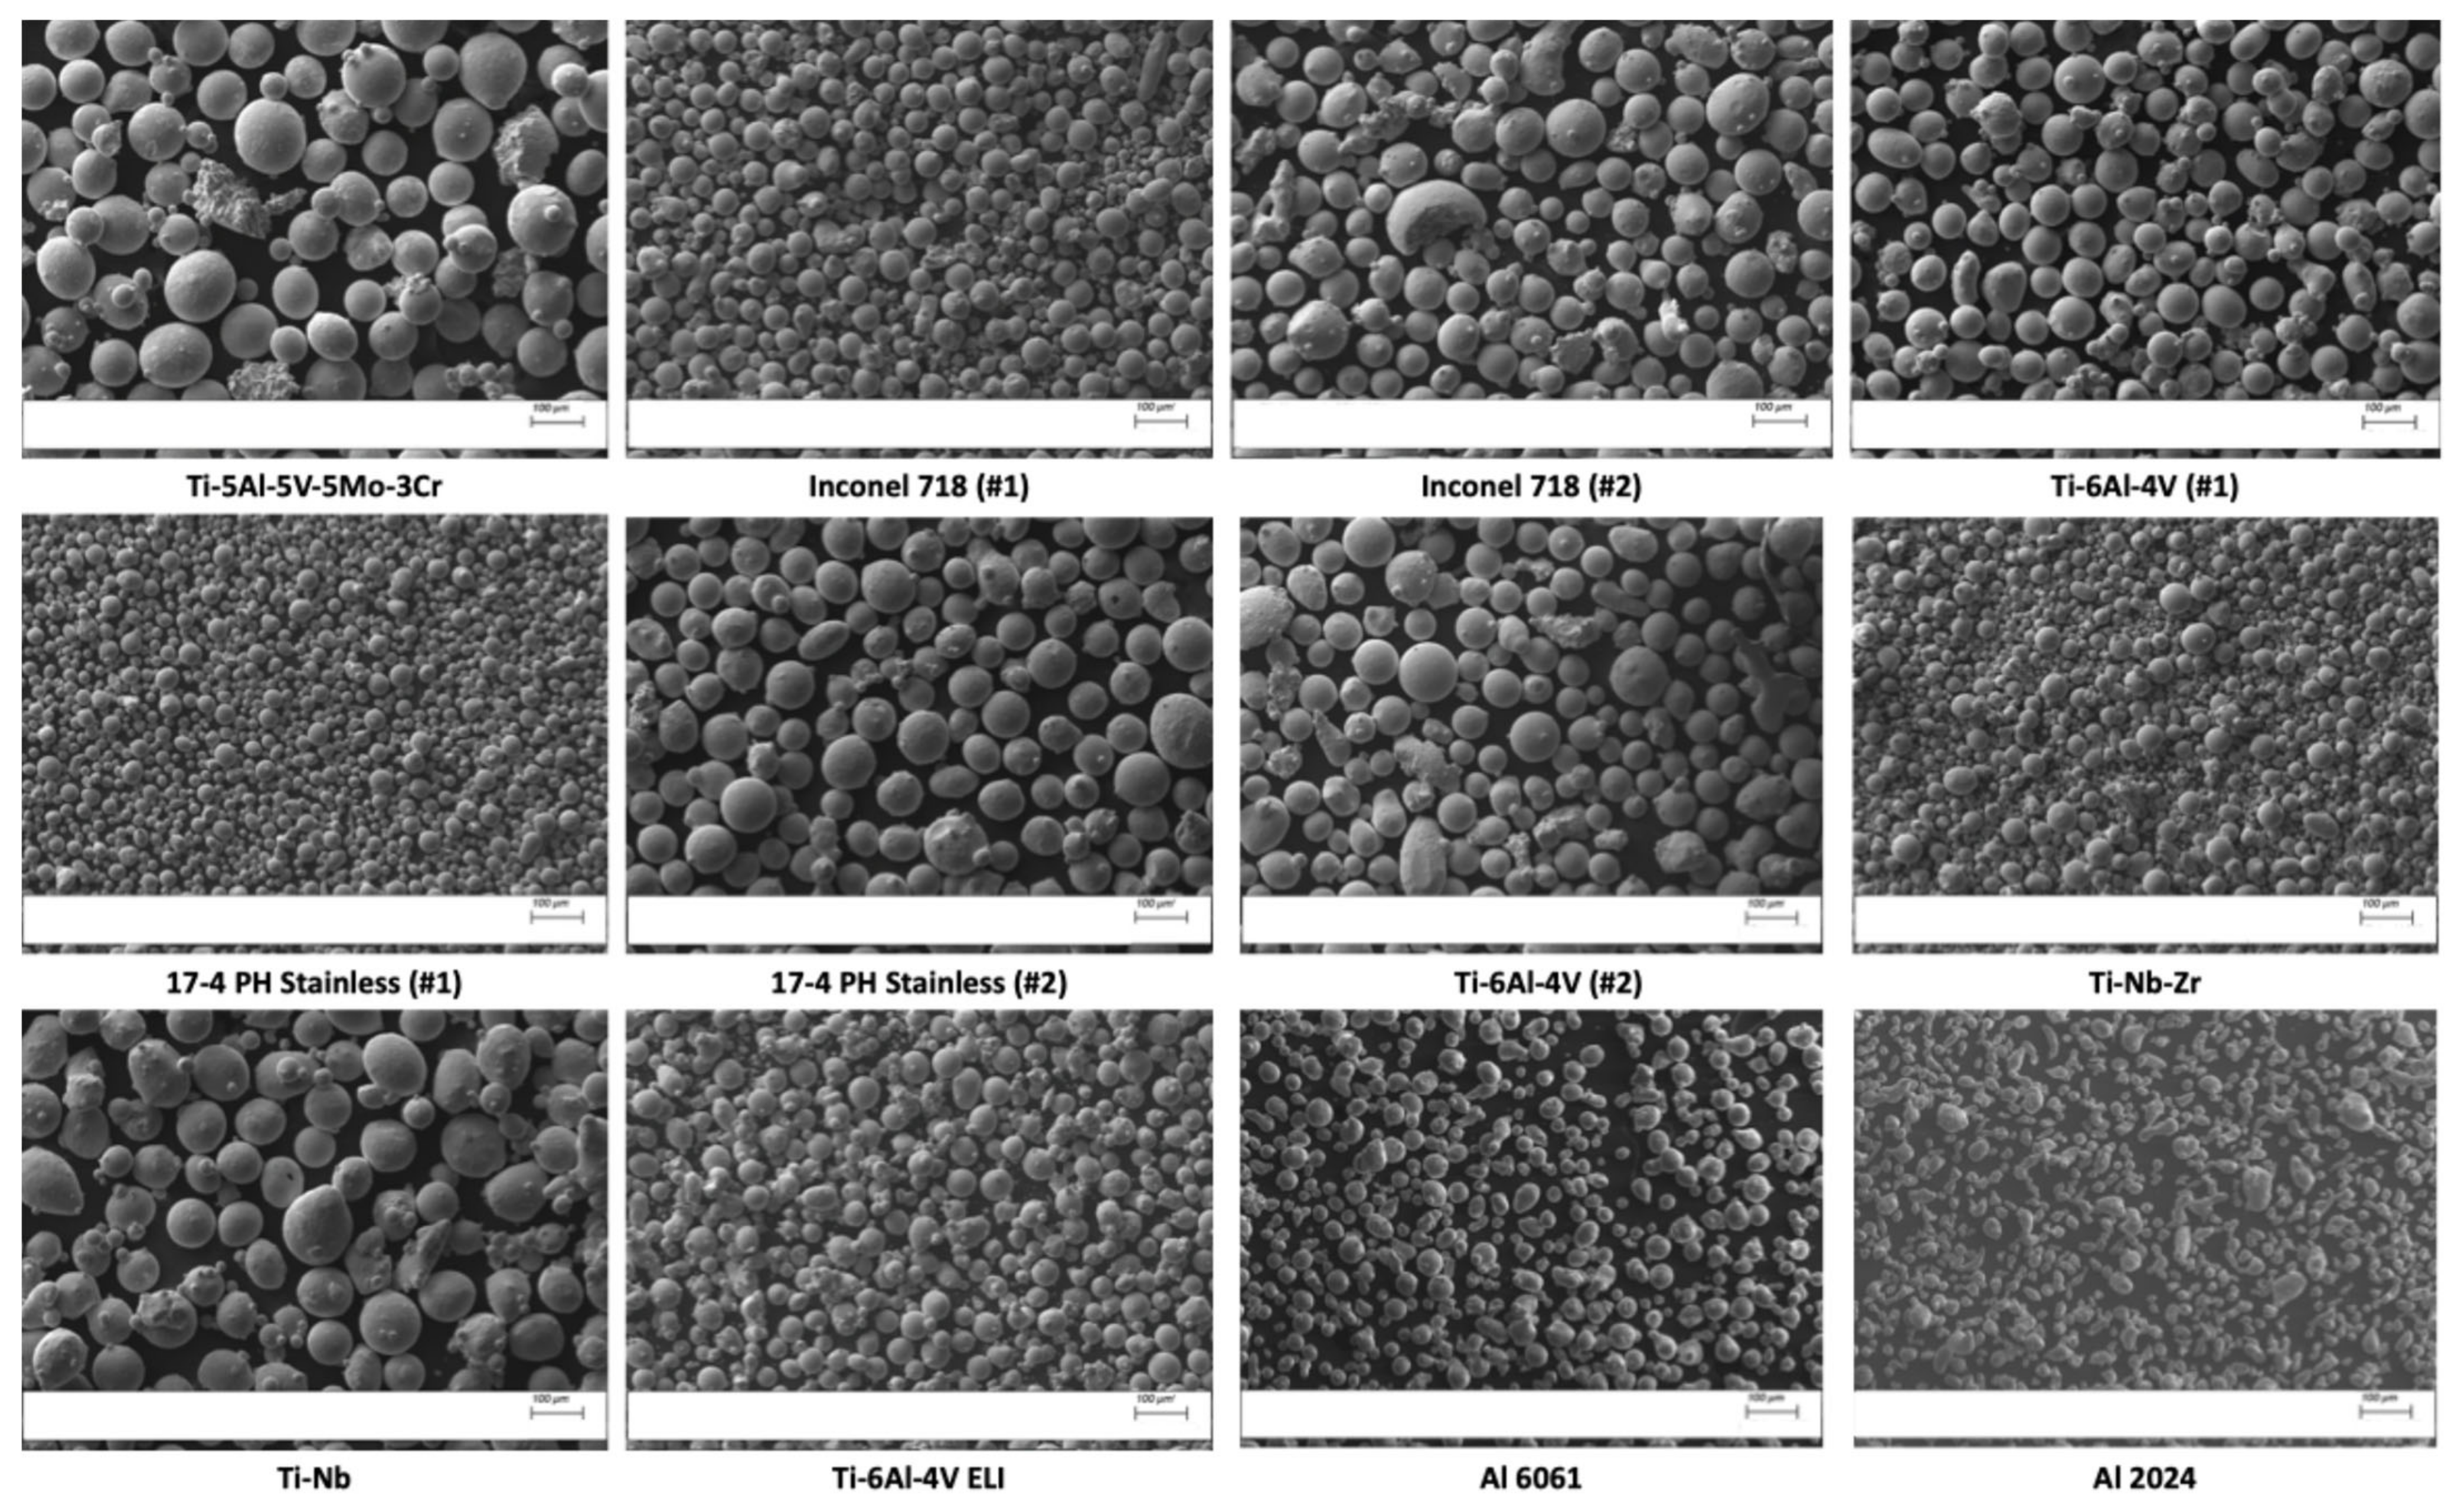
The following section presents the results of the three selected multiple-instance regression frameworks: aggregated, instance, and pruning. Each model’s prediction results were compared for the optimal MIR technique. In addition to comparing model performance, this section evaluates the consistency and determination of the previously introduced data augmentation strategies.

4.1. Dataset

The raw data set consisted of 46 metal powders, each measured and collected at the Cote Research Lab in the Department of Mechanical and Materials Engineering of Worcester Polytechnic Institute (Worcester, MA, USA). Each powder contained a number of particles ranging from 301 to 79,934 particles. Using a Microtrac analyzer, we measured the morphology of each particle using measurements such as surface area, convexity, and sphericity. Then, we measured the HFRs of each powder by timing how quickly 50 g of each powder could flow through a funnel. A few of the vendors mentioned above provided the HFRs of their powder, so we refrained from measuring the HFRs again, depending on the vendor.
More specifically, Praxair Surface Technologies (Indianapolis, IN, USA), Kymera International (Raleigh, NC, USA), H.C. Starck Tungsten LLC (Newton, MA, USA), Raymor Industries Inc. (Boisbriand, Canada), MolyWorks (Cloverdale, CA, USA), Powders on Demand of Solvus Global (Worcester, MA, USA), and Valimet Inc. (Stockton, CA, USA) supplied the metal AM feedstock powders studied herein. Such powders included gas-atomized Fe–Mn–Al, commercially pure Ti, Al, Cu, Ti–6Al–4V, Inconel 718, pure refractory metals, 17–4 PH stainless-steel, alloyed Al powders, Ti–Nb–Zr, among other metallurgical feedstock systems. Figure 7 presents SEM micrographs at the same magnification for 12 powders included in this study for illustrative purposes.

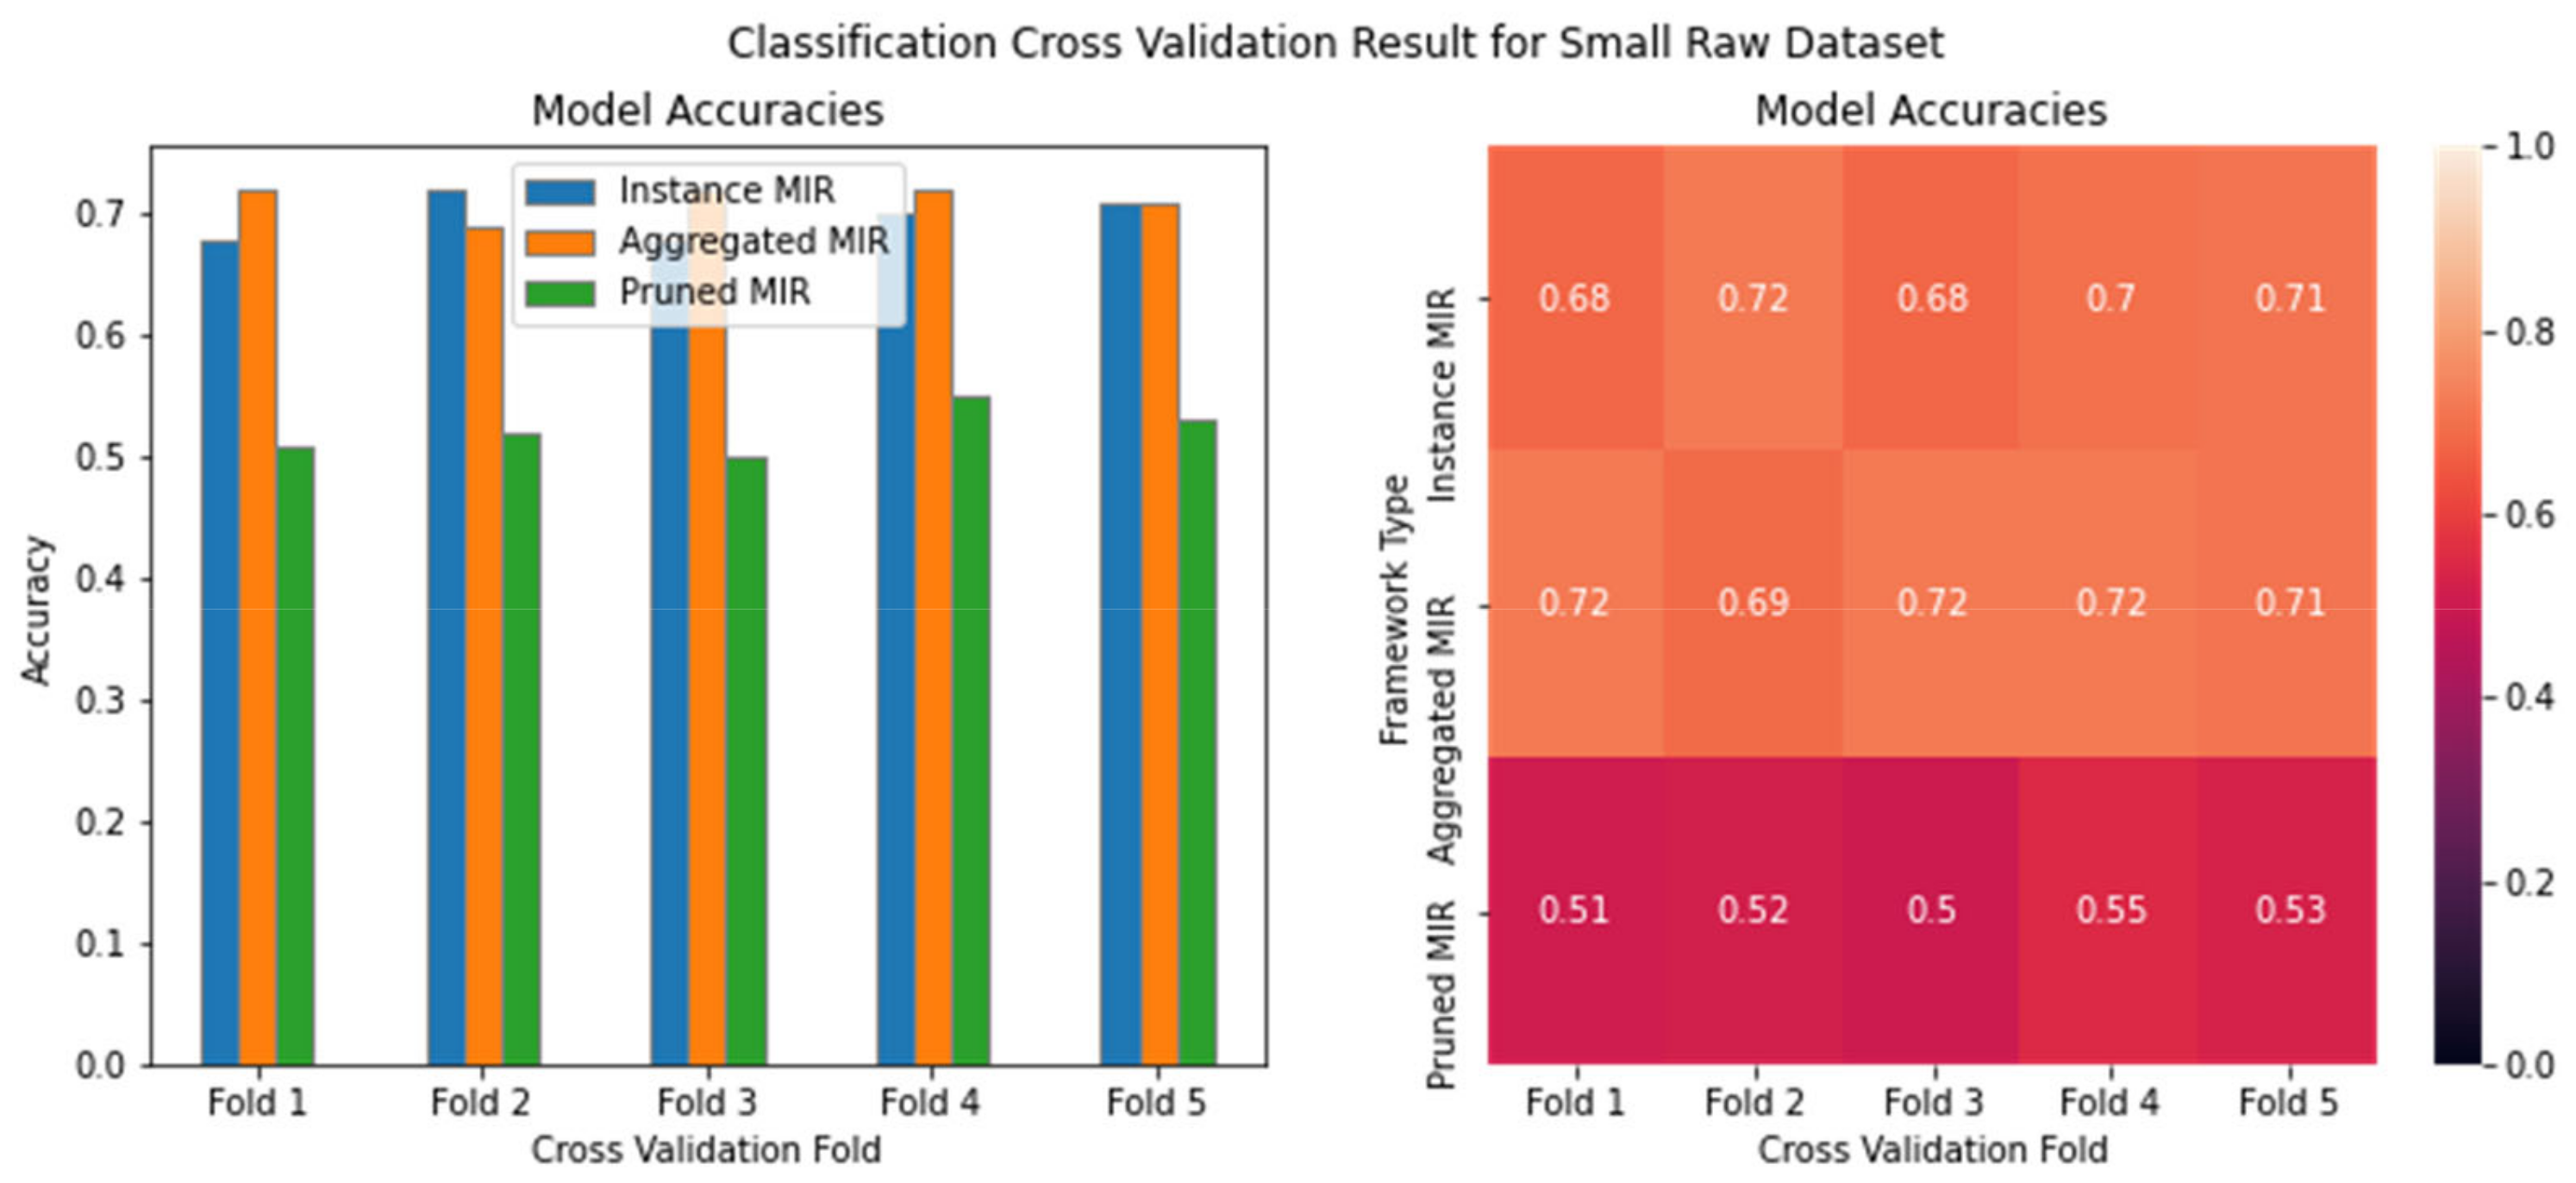
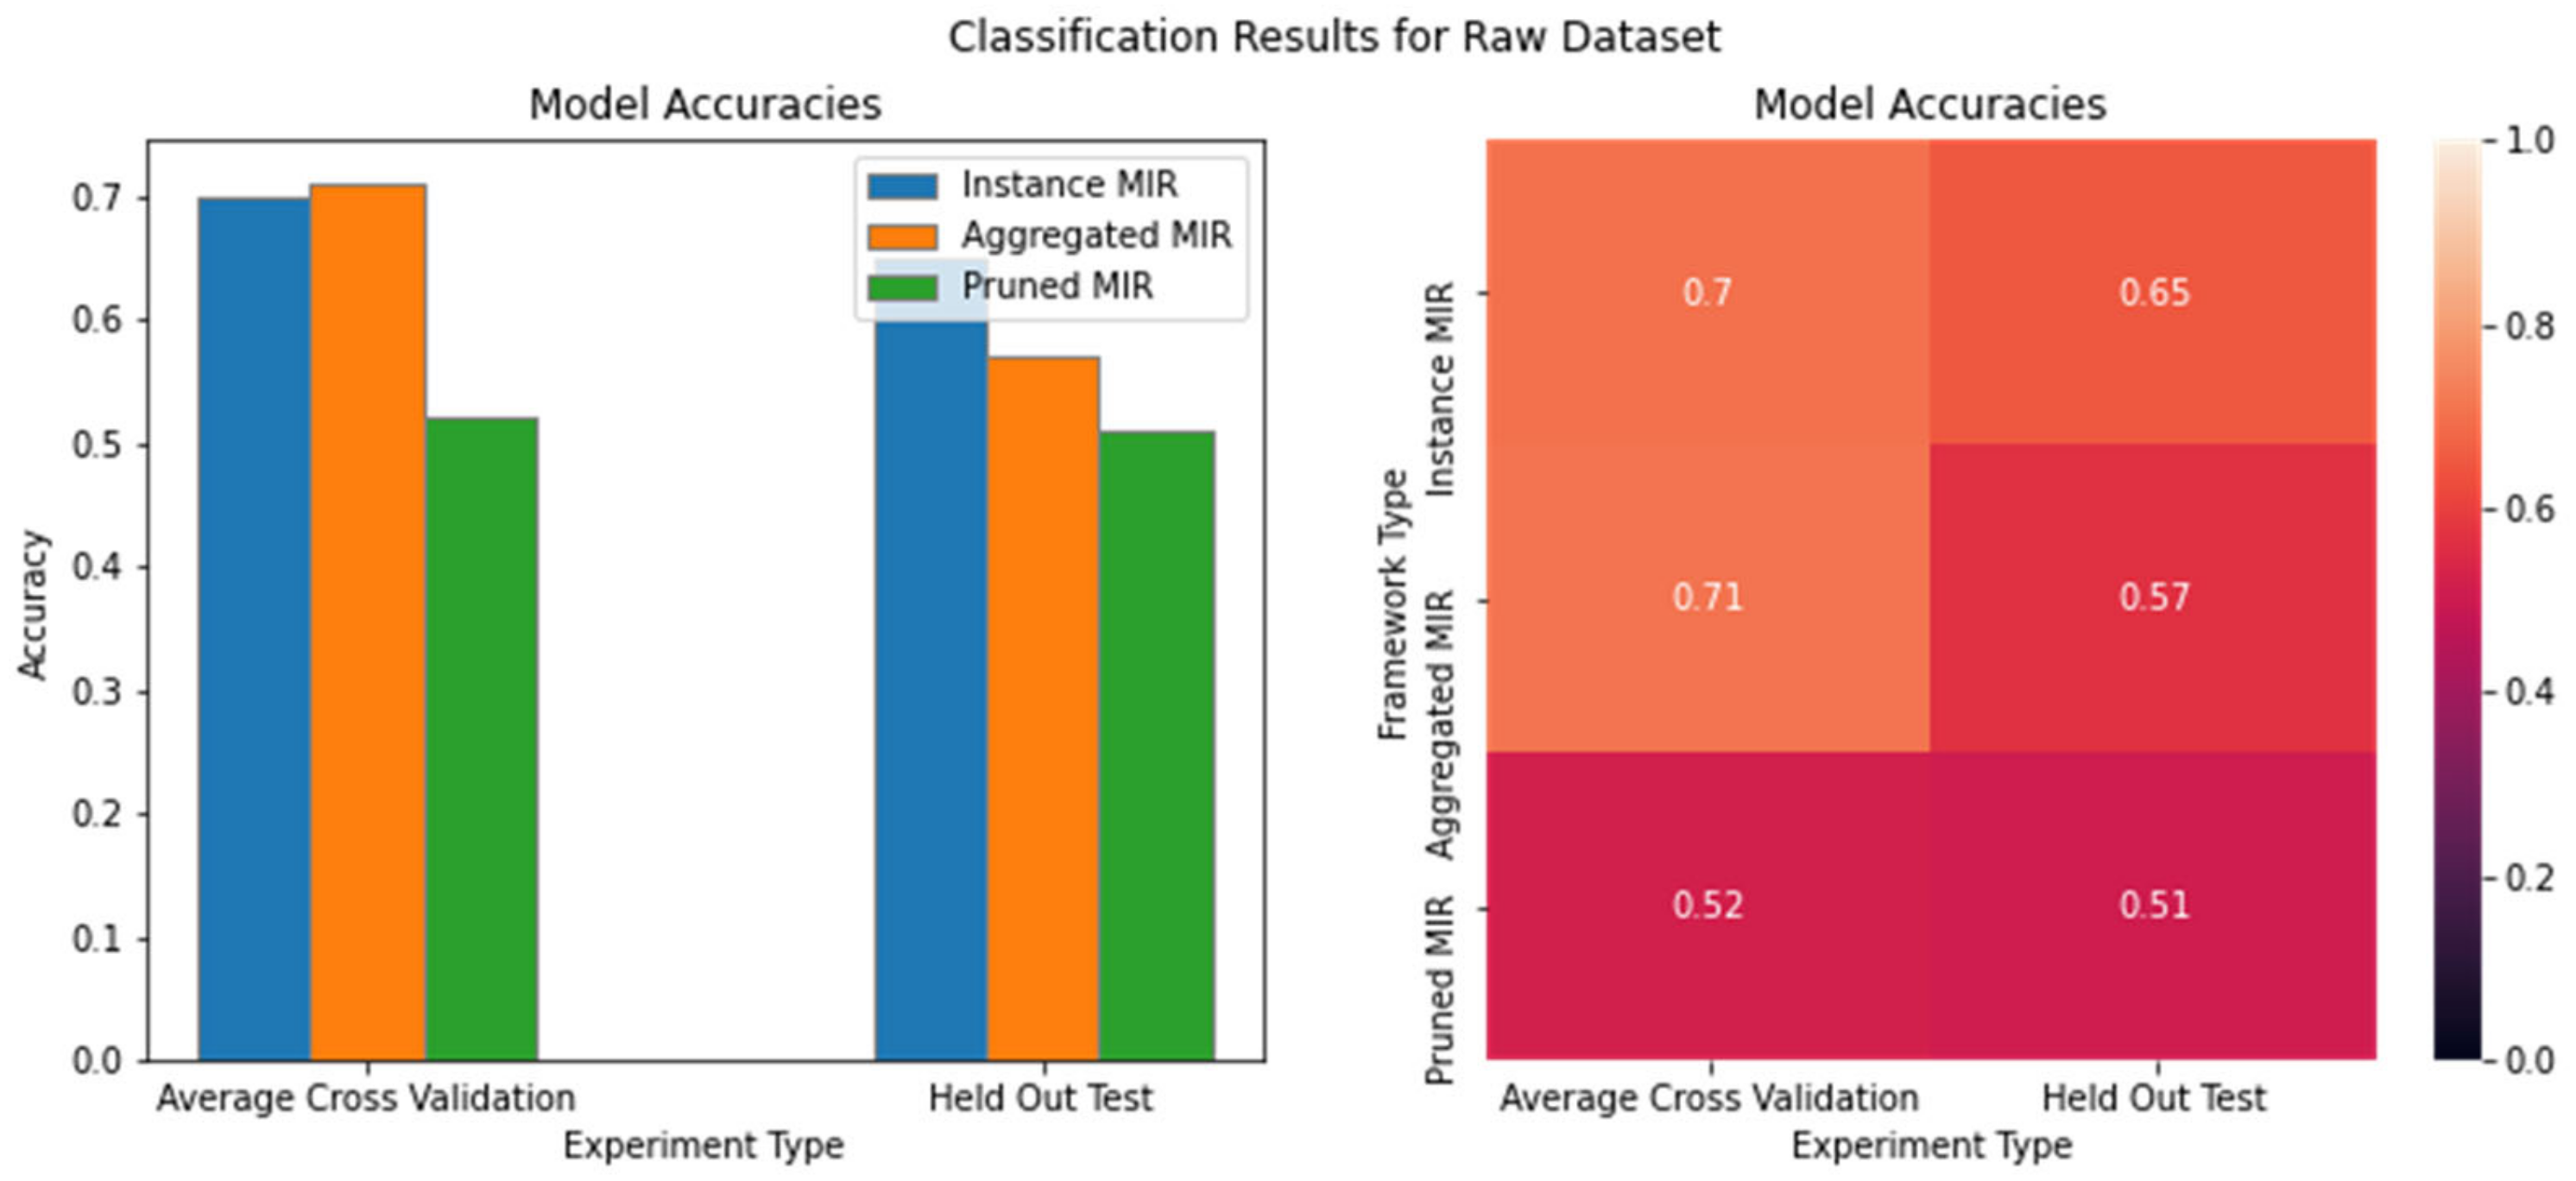
4.2. MIR Classification Results

To compare the performance of each MIR framework, they were tested on two data sets. First, results were calculated after training on the raw data. Then, data augmentation was implemented to improve each model’s overall robustness and consistency. After augmentation, the data set encompassed 4009 powders in training and 1378 powders in test, as opposed to 35 training powders and 11 test powders in the raw data. Model performance was then calculated using 5-fold cross validation, comparing F1-scores, as seen in Figure 8.
Each fold of cross validation, as can be seen in Figure 8 and Figure 9, shows average performance across all folds. Aggregate MIR performed the best with 71% accuracy, with instance MIR shortly behind at 70%, and pruning MIR performing the worst at 52%. Compared with a held-out test set, these measures dropped to 65%, 57%, and 51%, respectively. Interestingly, the model’s initial performance in cross validation on raw data is inversely correlated with the decrease in performance on hold-out data. For example, pruning MIR (which performed the worst) had only a decrease of 1%, whereas instance MIR (performed second of three) had a reduction of 5%, and aggregate MIR (performed the best) had a reduction of 14%.

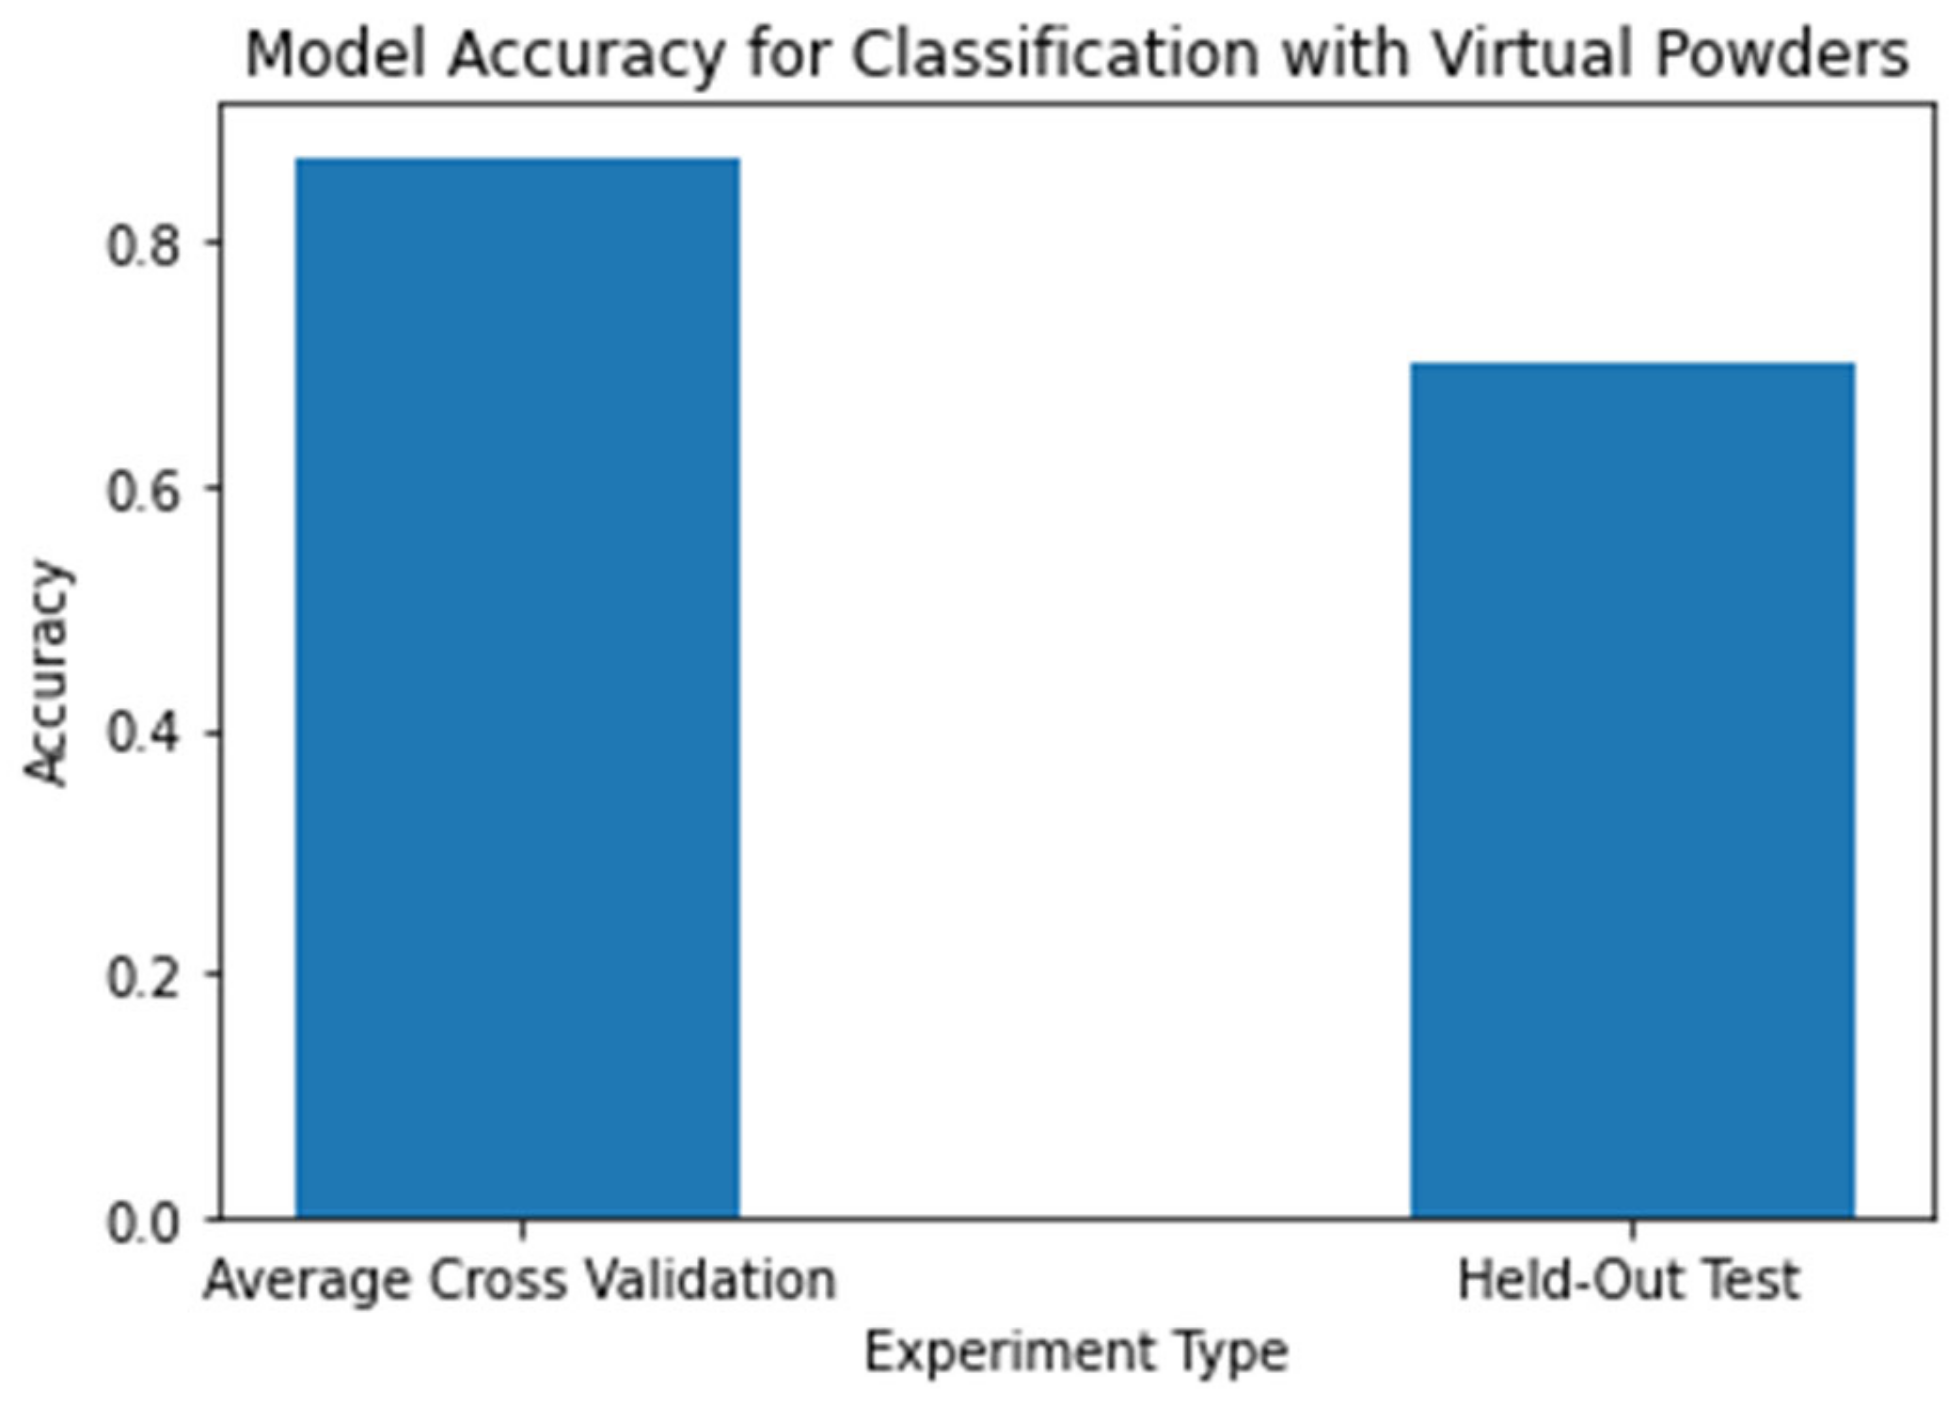
4.3. Data Augmentation Evaluation

Performance was then calculated on an augmented data set, shown in Figure 10, with an F1-score of 86% on average cross validation and 70% on the held-out set. The augmentation of a dataset by creating virtual powders improved performance on the validation and held-out test set. In addition to improved performance, since the augmentation led to a more extensive training set, specific instances of noise in the data set have less impact, making a more robust model.
In addition to assessing the performance of our MIR frameworks in this context, the augmentation strategy’s determinism was evaluated. To perform this, 100 models were trained on raw and augmented data, each with a slightly different training set. These slight variations demonstrate the increased robustness of the augmented set compared to raw data. As shown in Figure 11, results trained on raw data varied from about 10% to 90%, with a range of approximately 80%. In contrast, results trained on the augmented data set ranged from 70% to 80%, with a variation of only 10%. This reduction in variation by eight-fold is an example of the improved robustness of the model, such that minor changes cause a significantly smaller change in performance. It is important to note that while 90% was achieved with the raw data, that simply means that in that specific trial, relationships within the validation set were primarily encompassed by the training set. However, that only represents its ability to predict on the validation set and not real-world data, hence the usage of cross validation to measure performance.

5. Discussion

Based upon the results outlined above, the proposed multiple instance regression (MIR) frameworks performed better than the random choice, with aggregate and instance MIR performing notably better. However, the previously proposed decision tree model [5] could not predict Hall flow accurately enough for real-world applications. Performance was improved through data augmentation, but not enough to be applicable in real-world settings. This section provides further insight into why these models did not perform better, improvements that can be made, and the applications of each MIR framework and MIR technique.
As previously mentioned, our aggregated-MIR and instance-MIR frameworks performed with 57% and 65% accuracy on a held-out test set of the raw data. These results were obtained after a process of optimization, and for these methods, results cannot be improved much further using the same data set. While these results did not perform well enough for usage in real-world applications, we hypothesize this is a result of the data set itself and not the MIR framework. Evidence for this can be seen through the proposed augmentation strategy. By artificially increasing the size of the data set, performance on held-out data increased to 70%. By improving the underlying dataset, it is likely that improved results can be observed on raw data and subsequently on the augmented version of the improved data set.
Due to the high performance on a held-out test set, it is possible that powders in the set we utilized in our initial experiments were more like each other than the different powders we added to our set. As a result, the HFR of a powder may be more easily predicted when given a specific type of material, such as a gas-atomized Al alloy, versus a ball-milled refractory metal powder. Therefore, future work will be dedicated to clustering powders by characteristics and deriving distinct predictive models for each cluster.
Research into convolutional neural networks (CNNs) has shown they can identify and quantify these satellites, as well as other morphological characteristics [30,31]. This identification tool will be integrated into the MIR framework to build a more in-depth predictive tool using a broader set of measured features to improve performance. Additionally, HFRs may not be the best predictor of a powder’s flowability. We discovered through experimentation on this topic that some powders that do not flow using the HFR test appear to flow easily using other tests and in CSAM applications. Future works will determine powder features that could capture particle interactivity and a more consistent and accurate flowability measurement to predict.

6. Conclusions

CSAM has been widely adopted due to its ability to be optimized using powder engineering. However, domain experts have not been able to fully quantify the impacts of a powder’s characteristics, namely flowability, on a powder’s performance in CSAM. Machine learning can be utilized to quantify this impact. Nevertheless, the contribution of each particle to a powder’s flowability cannot be fully understood using traditional machine-learning techniques. Thus, we explored the performance of three multiple-instance regression frameworks in processing powder data for flowability classification. Our aggregated, instance, and pruning MIR frameworks resulted in 57%, 65%, and 51% accuracy on a held-out test set.
Additionally, we developed a data augmentation technique for multiple-instance data due to the lack of techniques and data available in materials science applications. Our data augmentation strategy resulted in consistent classification results compared to the raw, small data set. In the future, we will expand upon this research by exploring the usage of mixture models to predict the flowability of a powder better. We also plan to study the impacts of the interaction of particles on powder flowability and derive a more accurate measure of flowability.

Author Contributions

Conceptualization, A.S. and B.C.S.; Methodology, A.S.; Software, A.S., Validation: A.S. and B.C.S.; Formal Analysis, A.S. and B.C.S.; Investigation, A.S. and B.C.S.; Resources, A.S. and S.P.; Data Curation, A.S. and B.C.S.; Writing—original draft preparation, A.S., S.P. and B.C.S.; Writing—review and editing, A.S., S.P., B.C.S., D.L.C. and R.N.; Visualization, A.S. and S.P.; Supervision, D.L.C. and R.N.; Project Administration, D.L.C. and R.N.; Funding Acquisition, D.L.C. and R.N. All authors have read and agreed to the published version of the manuscript.

Funding

This work was funded by DEVCOM Army Research Laboratory, grant number W911-NF1920108, and the National Science Foundation, grant number DMR200035.

Institutional Review Board Statement

Not applicable.

Informed Consent Statement

Not applicable.

Data Availability Statement

Not applicable.

Acknowledgments

The authors wish to thank Christopher J. Massar, Jack A. Grubbs, Brent Ditzler, and Michelle Barboza, each of which is affiliated with WPI, for their assistance in materials characterization and data acquisition efforts.

Conflicts of Interest

The authors declare no conflict of interest.

References

  1. Zheng, Z.; Xu, T.; Legut, D.; Zhang, R. High-throughput informed machine learning models for ultrastrong B-N solids. Comput. Mater. Sci. 2022, 215, 111789. [Google Scholar] [CrossRef]
  2. Kouraytem, N.; Li, X.; Tan, W.; Kappes, B.; Spear, A.D. Modeling process–structure–property relationships in metal additive manufacturing: A review on physics-driven versus data-driven approaches. J. Physics Mater. 2021, 4, 032002. [Google Scholar] [CrossRef]
  3. Ma, B.; Wei, X.; Liu, C.; Ban, X.; Huang, H.; Wang, H.; Xue, W.; Wu, S.; Gao, M.; Shen, Q.; et al. Data augmentation in microscopic images for material data mining. NPJ Comput. Mater. 2020, 6, 125. [Google Scholar] [CrossRef]
  4. Zhang, Y.; Ling, C. A strategy to apply machine learning to small datasets in materials science. NPJ Comput. Mater. 2018, 4, 25. [Google Scholar] [CrossRef] [Green Version]
  5. Valent, R.C.; Ostapenko, A.; Sousa, B.C.; Grubbs, J.; Massar, C.J.; Cote, D.B.; Neamtu, R. Classifying Powder Flowability for Cold Spray Additive Manufacturing Using Machine Learning. In Proceedings of the 2nd International Workshop on Big Data Tools, Methods, and Use Cases for Innovative Scientific Discvery, IEEE BigData Conference, Atlanta, GA, USA, 10–13 December 2020; pp. 2919–2928. [Google Scholar]
  6. Kroeger, J.; Poirié, T.; Moghimian, P.; Marion, F.; Larouche, F. Flow rate ranges for spherical metallic powders for additive manufacturing. Prog. Addit. Manuf. 2021, 7, 411–418. [Google Scholar] [CrossRef]
  7. Standard Test Methods for Flow Rate of Metal Powders Using the Hall Flowmeter Funnel. Available online: https://www.astm.org/b0213-20.html (accessed on 21 February 2023).
  8. Kudo, Y.; Yasuda, M.; Matsusaka, S. Effect of particle size distribution on flowability of granulated lactose. Adv. Powder Technol. 2019, 31, 121–127. [Google Scholar] [CrossRef]
  9. Kiani, P.; Bertoli, U.S.; Dupuy, A.D.; Ma, K.; Schoenung, J.M. A Statistical Analysis of Powder Flowability in Metal Additive Manufacturing. Adv. Eng. Mater. 2020, 22, 2000022. [Google Scholar] [CrossRef]
  10. Zhang, J.; Habibnejad-Korayem, M.; Liu, Z.; Lyu, T.; Sun, Q.; Zou, Y. A Computer Vision Approach to Evaluate Powder Flowability for Metal Additive Manufacturing. Integr. Mater. Manuf. Innov. 2021, 10, 429–443. [Google Scholar] [CrossRef]
  11. Vieira, C.; Schuliger, A. Cleaning on Demand with a Recommender System (CODeRS); Worcester Poly-Technic Institute: Worcester, MA, USA, 2022; Available online: https://digital.wpi.edu/concern/student_works/9306t271v?locale=en (accessed on 21 February 2023).
  12. Dietterich, T.G.; Lathrop, R.H.; Lozano-Pérez, T. Solving the multiple instance problem with axis-parallel rectangles. Artif. Intell. 1997, 89, 31–71. [Google Scholar] [CrossRef] [Green Version]
  13. Maron, O.; Lozano-Pérez, T. A Framework for Multiple-Instance Learning. Adv. Neural Inf. Process Syst. 1997, 10, 570–576. [Google Scholar]
  14. Chen, Y.; Bi, J.; Wang, J. MILES: Multiple-Instance Learning via Embedded Instance Selection. IEEE Trans. Pattern Anal. Mach. Intell. 2006, 28, 1931–1947. [Google Scholar] [CrossRef]
  15. Yang, C.; Dong, M.; Fotouhi, F. Region based image annotation through multiple-instance learning. In Proceedings of the 13th ACM International Conference on Multimedia, Hilton, Singapore, 6–11 November 2005; pp. 435–438. [Google Scholar] [CrossRef]
  16. Ray, S.; Page, D. Multiple Instance Regression. In Proceedings of the 18th International Conference on Machine Learning, Williamstown, MA, USA, 28 June–1 July 2001. [Google Scholar]
  17. Zhang, Y.; Charoenphakdee, N.; Wu, Z.; Sugiyama, M. Learning from aggregate observations. Adv. Neural Inf. Process. Syst. 2020, 33, 7993–8005. [Google Scholar]
  18. Trabelsi, M.; Frigui, H. Robust fuzzy clustering for multiple instance regression. Pattern Recognit. 2019, 90, 424–435. [Google Scholar] [CrossRef] [Green Version]
  19. Wang, Z.; Lan, L.; Vucetic, S. Mixture Model for Multiple Instance Regression and Applications in Remote Sensing. IEEE Trans. Geosci. Remote. Sens. 2011, 50, 2226–2237. [Google Scholar] [CrossRef]
  20. Wagstaff, K.L.; Lane, T.; Roper, A. Multiple-Instance Regression with Structured Data. In Proceedings of the IEEE International Conference on Data Mining Workshops, ICDM Workshops 2008, Pisa, Italy, 15–19 December 2008; pp. 291–300. [Google Scholar] [CrossRef]
  21. Wang, Z.; Radosavljevic, V.; Han, B.; Obradovic, Z.; Vucetic, S. Aerosol Optical Depth Prediction from Satellite Observations by Multiple Instance Regression. In Proceedings of the Society for Industrial and Applied Mathematics–8th SIAM International Conference on Data Mining 2008, Proceedings in Applied Mathematics, Atlanta, GA, USA, 24–26 April 2008; Volume 1, pp. 165–176. [Google Scholar] [CrossRef] [Green Version]
  22. Lin, W.-C.; Tsai, C.-F.; Hu, Y.-H.; Jhang, J.-S. Clustering-based undersampling in class-imbalanced data. Inf. Sci. 2017, 409–410, 17–26. [Google Scholar] [CrossRef]
  23. Fernández, A.; García, S.; Galar, M.; Prati, R.C.; Krawczyk, B.; Herrera, F. Learning from Imbalanced Data Sets. IEEE Trans. Knowl. Data Eng. 2018, 21, 1263–1284. [Google Scholar] [CrossRef]
  24. Horton, M.K.; Woods-Robinson, R. Addressing the critical need for open experimental databases in materials science. Patterns 2021, 2, 100411. [Google Scholar] [CrossRef]
  25. Ohno, H. Auto-encoder-based generative models for data augmentation on regression problems. Soft Comput. 2019, 24, 7999–8009. [Google Scholar] [CrossRef]
  26. Li, Z.; Zhao, W.; Shi, F.; Qi, L.; Xie, X.; Wei, Y.; Ding, Z.; Gao, Y.; Wu, S.; Liu, J.; et al. A novel multiple instance learning framework for COVID-19 severity assessment via data augmentation and self-supervised learning. Med. Image Anal. 2021, 69, 101978. [Google Scholar] [CrossRef]
  27. Shen, L.; Qian, Q. A virtual sample generation algorithm supporting machine learning with a small-sample dataset: A case study for rubber materials. Comput. Mater. Sci. 2022, 211, 111475. [Google Scholar] [CrossRef]
  28. Pedregosa, F.; Varoquaux, G.; Gramfort, A.; Michel, V.; Thirion, B.; Grisel, O. Scikit-learn: Machine Learning in Python. J. Mach. Learn. Res. 2011, 12, 2825–2830. Available online: http://jmlr.org/papers/v12/pedregosa11a.html (accessed on 20 February 2023).
  29. Anguita, D.; Ghelardoni, L.; Ghio, A.; Oneto, L.; Ridella, S. The ‘K’ in K-fold Cross Validation. Available online: http://www.i6doc.com/en/livre/?GCOI=28001100967420 (accessed on 20 February 2023).
  30. Price, S.E.; Gleason, M.A.; Sousa, B.C.; Cote, D.L.; Neamtu, R. Automated and Refined Application of Convolutional Neural Network Modeling to Metallic Powder Particle Satellite Detection. Integr. Mater. Manuf. Innov. 2021, 10, 661–676. [Google Scholar] [CrossRef]
  31. Price, S.; Neamtu, R. Identifying, Evaluating, and Addressing Nondeterminism in Mask R-CNNs. In Lecture Notes in Computer Science, Proceedings of the Pattern Recognition and Artificial Intelligence: Third International Conference, ICPRAI 2022, Paris, France, 1–3 June 2022; Springer: Berlin/Heidelberg, Germany, 2022; Volume 13363 LNCS, pp. 3–14. [Google Scholar] [CrossRef]
Figure 1. The calculated window of deposition and impact conditions for the cold spray processing parameter set for the demonstratively varied HFRs and thereafter calculated apparent densities. The different symbol sizes correspond to the legend within the figure and increase as the particle diameter increases.
Powders 02 00013 g001
Figure 2. Gas pressure across the nozzle for the aforementioned computational cold spray processing parameters explored with the KSS software.
Powders 02 00013 g002
Figure 3. Gas and particle temperature as a function of particle size across the nozzle axis for the same set of processing parameters explored with the KSS analysis tool detailed above.
Powders 02 00013 g003
Figure 4. Gas and particle velocity as a function of particle size across the nozzle axis for the same set of processing parameters explored with the KSS analysis tool detailed above.
Powders 02 00013 g004
Figure 5. A total of 20 of the 29 feature value distributions across all 46 lab-tested metallic powders. The features not presented (due to their limited value as a visual considering the nature of their distributions and skew) included the volume, area, CHull area, curvature, surface area, CHull surface area, fiber length, fiber width, and transparency.
Powders 02 00013 g005
Figure 6. Normalized inverse flowability for Ti and Cu blended powders as a function of percent Ti within the mixture.
Powders 02 00013 g006
Figure 7. SEM micrographs of twelve of the powders studied and characterized. These twelve were selected as they show material alloy class diversity—wherein alloy classes ranged from Al, Ti, steels, and Nis, among others not shown, and various compositions within each class are present too.
Powders 02 00013 g007
Figure 8. Cross-validation results for classification models trained on raw data.
Powders 02 00013 g008
Figure 9. Accuracy measurements for classification models trained on virtual powders.
Powders 02 00013 g009
Figure 10. Accuracy measurements for classification models trained on augmented powders.
Powders 02 00013 g010
Figure 11. Classification consistency scores for the model trained on raw data and the virtual dataset.
Powders 02 00013 g011
Table 1. The 29 features assessed for each of the powders characterized herein.
FeatureUnitDescriptionGroup
DaμmArea equivalent diameterSize
DpμmPerimeter equivalent diameterSize
FLengthμmFeret lengthSize
FWidthμmFeret widthSize
ELengthμmLegendre ellipse lengthSize
EWidthμmLegendre ellipse widthSize
Areaμm2Projected 2D areaSize
Volumeμm3Calculated from DaSize
PerimeterμmProjected 2D perimeterSize
Surface Areaμm2Spherical surface area from DaSize
CHull Areaμm2Area of the convex Hull in 2DSize
CHull Surface Areaμm2Spherical area parameterSize
Fiber LengthμmFunction of area and perimeterSize
Fiber WidthμmFunction of area and fiber widthSize
Sphericityn/aMeasure of the proximity to a circleShape/form
Circularityn/aSensitive measure of the proximity to a circleShape/form
Roundnessn/aShape indicator in relation to proximal circleShape/form
Extentn/aFunction of area, FLength and FWidthShape/form
Ellipse Ration/aMeasure of overall formShape/form
W/L Aspect Ration/aRatio of FWidth to FLengthShape/form
L/W Ration/aRatio of FLength to FWidthShape/form
Ellipticityn/aDegree of deviation from a circularityShape/form
Angularityn/aMorphological characteristicShape/form
Compactnessn/aFunction of area and FLengthShape/form
Convexityn/aMeasure of surface roughnessSurface roughness
Solidityn/aMeasure of surface roughnessSurface roughness
Concavityn/aMeasure of surface roughnessSurface roughness
Transparencyn/aLight intensity via longest vertical lineIntensity
Curvaturen/aMiddle 50% of the line from transparencyIntensity
Disclaimer/Publisher’s Note: The statements, opinions and data contained in all publications are solely those of the individual author(s) and contributor(s) and not of MDPI and/or the editor(s). MDPI and/or the editor(s) disclaim responsibility for any injury to people or property resulting from any ideas, methods, instructions or products referred to in the content.

