1. Introduction
Spiral jet mills are used for fine and colloid grinding when particle sizes of <<10 μm are required [
1,
2]. Despite their enormously high energy requirements, they are applied in numerous applications, especially in the pharmaceutical, pigment, and food industries [
3]. In order to reduce the energy consumption of this type of mill, it is essential to understand the processes taking place inside the mill and their influencing parameters more precisely.
Spiral jet mills consist of a flat cylindrical grinding chamber with several nozzles arranged at an inclined angle through which the grinding gas is accelerated to very high velocities. The arrangement of the nozzles and the central product outlet lead to the formation of a spiral flow inside the mill. Due to the enormously high flow velocities (>100 m s
−1) and turbulence intensities, the comminution of the particles mainly takes place in the nozzle jet in the outer region of the grinding chamber, which is therefore also referred to as the “comminution zone”. However, as a consequence of the spiral flow, the mill is simultaneously equipped with an integrated static classifier system, which ensures that coarse particles remain in the comminution zone due to the high centrifugal force while the fine particles leave the grinding chamber with the gas flow through the product outlet. On its way out of the comminution zone to the outlet, the flow first slows down before it is accelerated again in the inner region of the mill due to the decreasing radii, whereby this region is also designated as the “classifying zone” [
2,
4,
5].
The comminution process is thus superimposed by a classification process so that the product’s achievable fineness is not only determined by the grinding efficiency but also by the classifying efficiency [
2,
4,
5,
6]. While the comminution is mainly dependent on the nozzle parameters (number, angle, diameter, type) [
7,
8,
9], the classification process, on the other hand, is predominantly influenced by the product outlet diameter and the shape of the outlet [
4,
10]. In addition to these geometrical parameters, both processes also show a considerable dependency on the operational parameters, such as the grinding gas flow rate and the material loading [
9,
11,
12].
According to Muschelknautz et al. [
4] and Rodnianski et al. [
3], the product outlet diameter directly influences the cut-size particle diameter, which is used to characterize the classification process in spiral jet mills. Additionally, the cut-size diameter also significantly depends on the circumferential and radial velocities, which are also influenced by the product outlet diameter. In order to obtain a high classifying efficiency and thus a small cut-size diameter, a high circumferential velocity, and a low radial velocity, as well as a small outlet diameter, are necessary at the same time [
3,
4]. Although the impact on the cut-size diameter is well known, there has been little work dealing in detail with the product outlet diameter and its influence on the flow conditions and the comminution effect of spiral jet mills.
In addition to the solid feed, the grinding gas flow rate is one of the most critical operational parameters influencing the achievable fineness of the product since the kinetic energy introduced into the mill directly depends on this parameter. For this reason, the grinding gas flow rate has already been investigated in numerous works that consistently stated a decrease in particle size with increasing grinding gas flow rate [
8,
9,
12,
13,
14].
In order to improve the efficiency of spiral jet mills, it is necessary to have a comprehensive and holistic knowledge of the flow conditions within the mill and their influencing parameters. One approach to obtain this information represents the numerical simulation of fluid flow and particle motion using standard methods, such as computational fluid dynamics (CFD) and the discrete element method (DEM). With the help of these methods, some parameters and their influence on the flow profiles inside the grinding chamber have already been investigated [
15,
16,
17,
18,
19]. However, there is hardly any published work to date in which the flow conditions within a spiral jet mill have been determined by experimental methods, which is essential for the verification and validation of simulation data on the one hand and the reliable scale-transfer and design of energy-efficient sustainable mills for industrial use on the other hand. Hagendorf [
20] developed a method for studying the flow profiles of spiral jet mills using pressure measurements, but this method has the disadvantage that the pressure sensors can influence the flow. Another approach for the experimental determination of velocity fields is particle image velocimetry (PIV). This non-invasive laser optical measurement method was first applied in a spiral jet mill by Luczak et al. [
7,
21,
22] and has already been used to obtain some critical information about fluid and particle flow.
This work also deals with the experimental investigation of the flow conditions in spiral jet mills applying particle image velocimetry in order to gain further and more detailed knowledge about fluid flow and its influencing parameters. In addition to the grinding gas flow rate, the product outlet diameter is also investigated, the influence of which has hardly been described in the literature so far.
2. Materials and Methods
The experimental investigation of the flow conditions of the spiral jet mill is performed using the non-invasive laser optical particle image velocimetry (PIV), which allows the velocity fields to be determined at different levels within the grinding chamber.
One requirement for applying this measurement method is the optical accessibility of the apparatus, which is usually not given for industrial mills due to the metal material, primarily stainless steel. For this reason, an experimental scale-down model of an industrial spiral jet mill with a grinding chamber diameter of 190 mm and a grinding chamber height of 24 mm has been developed, successfully put into operation, and already used for various parameter studies in previous work [
7,
21,
23,
24,
25,
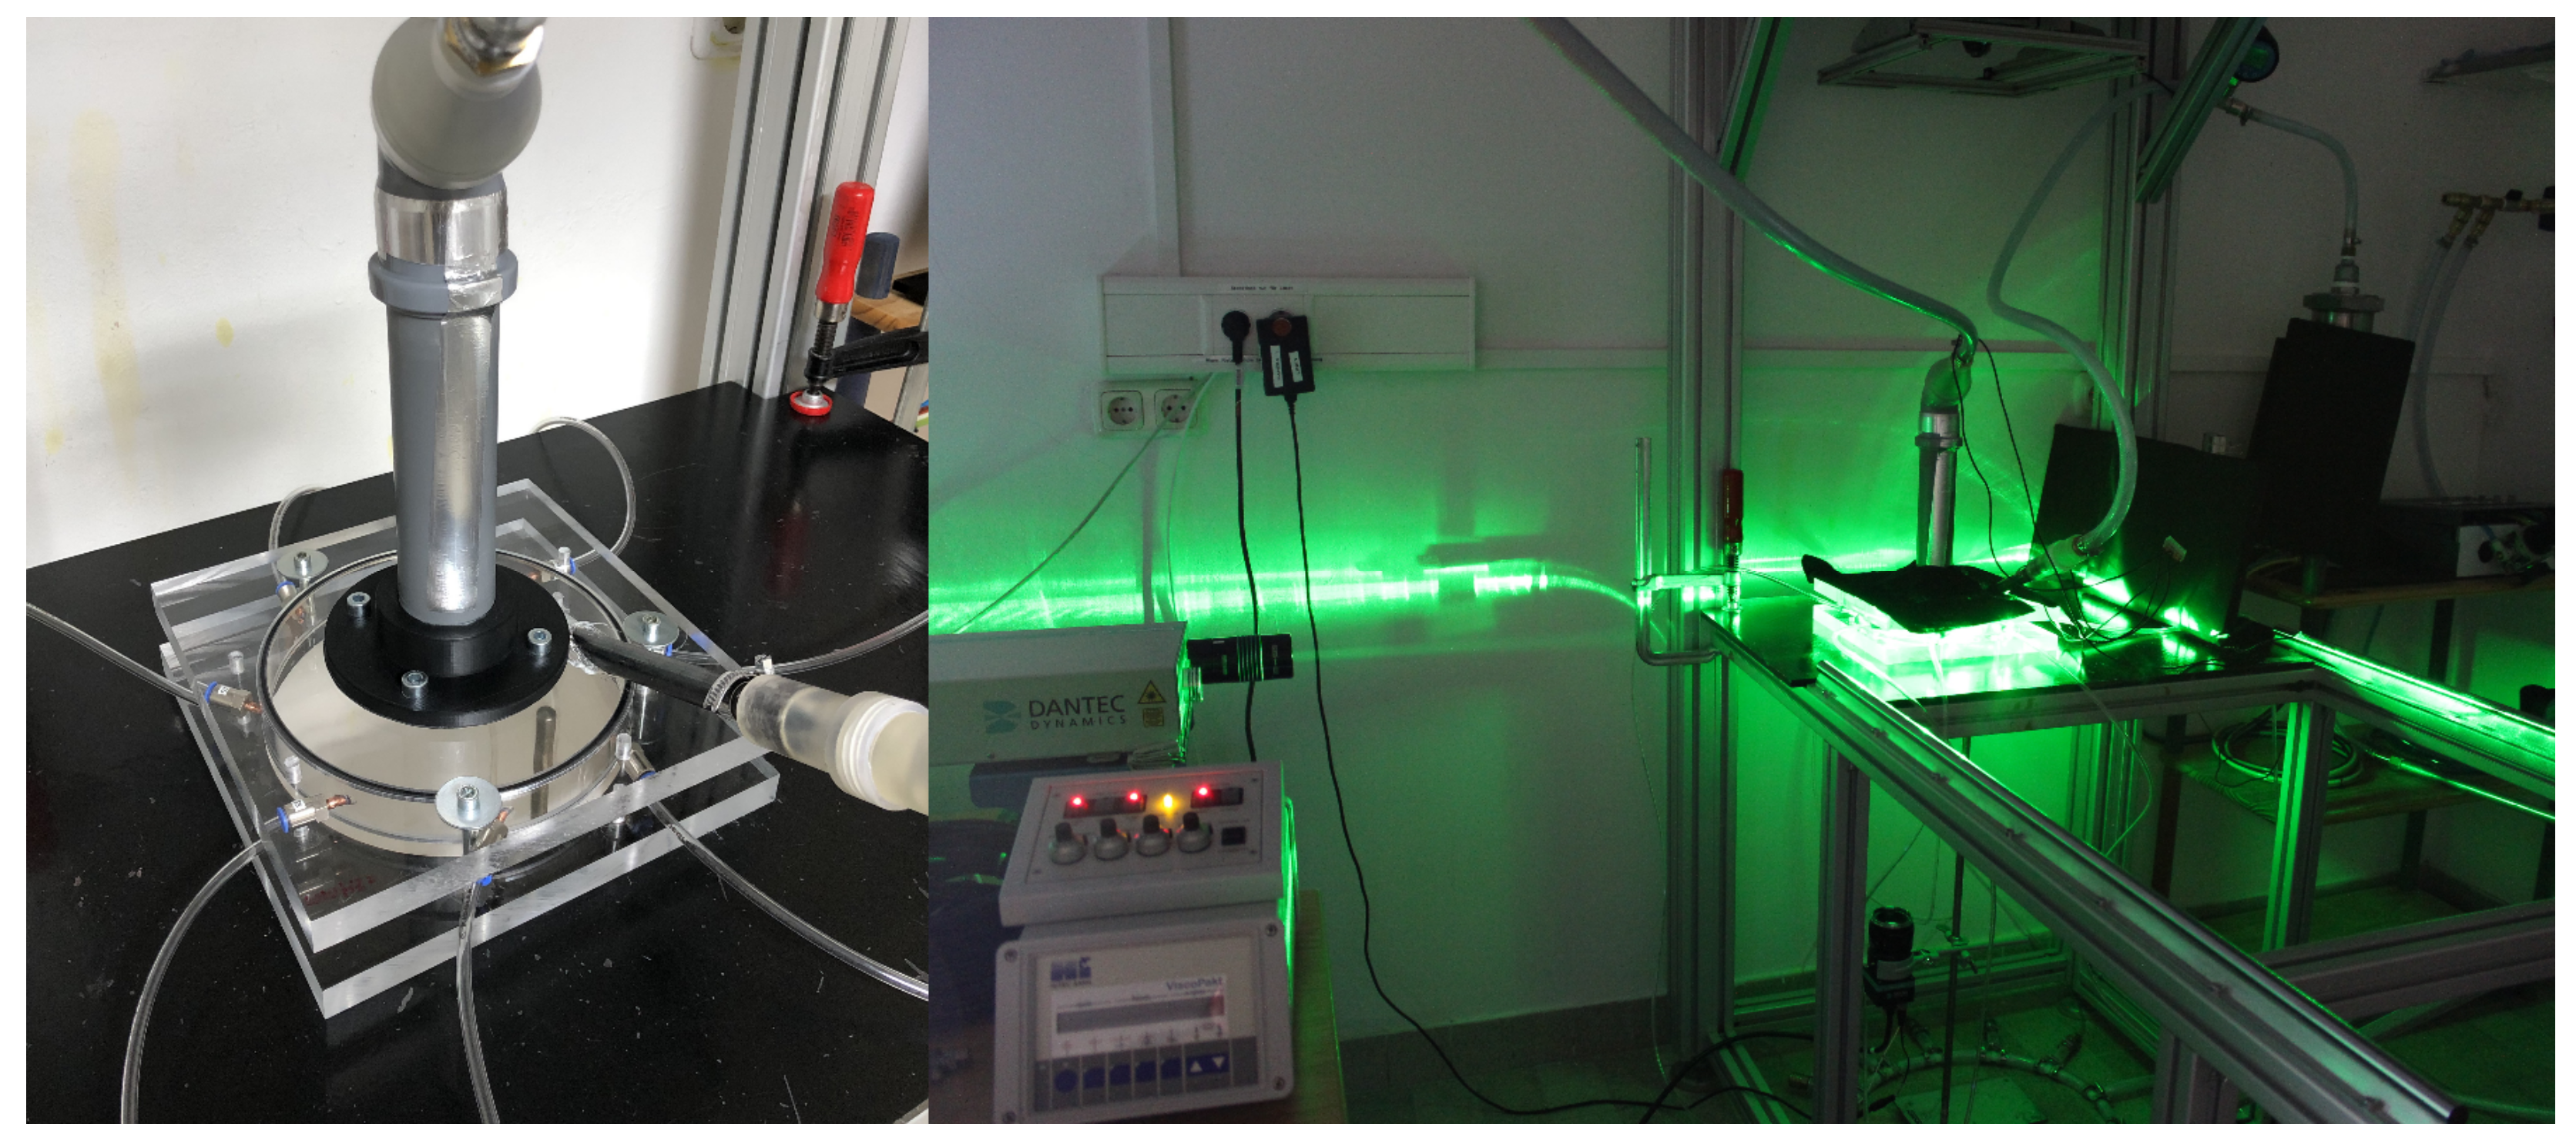
26]. The model is made of polymethyl methacrylate (PMMA) and is, therefore, almost entirely optically accessible (see
Figure 1 left). Due to the modular design of the top and bottom covers as well as the grinding ring in between, not only operational but also geometrical parameters can quickly and flexibly be varied and investigated with this spiral jet mill by exchanging the individual mill components.
In the context of this work, the influence of the product outlet diameter (do) and the grinding gas flow rate (mtotal) is considered. The outlet diameter is modified in five steps in the range between 16 and 48 mm, whereas the total grinding gas mass flow rate is changed between 23.5 kg h−1 and 28.0 kg h−1. The other parameters are kept constant except for the gas pressure at the injector and grinding nozzles, which depends on the gas flow rate. All measurements are performed with eight convergent cylindrical nozzles with a minimum diameter (dn) of 0.8 mm, arranged at a radial grinding nozzle angle (α) of 40° evenly distributed over the grinding ring.
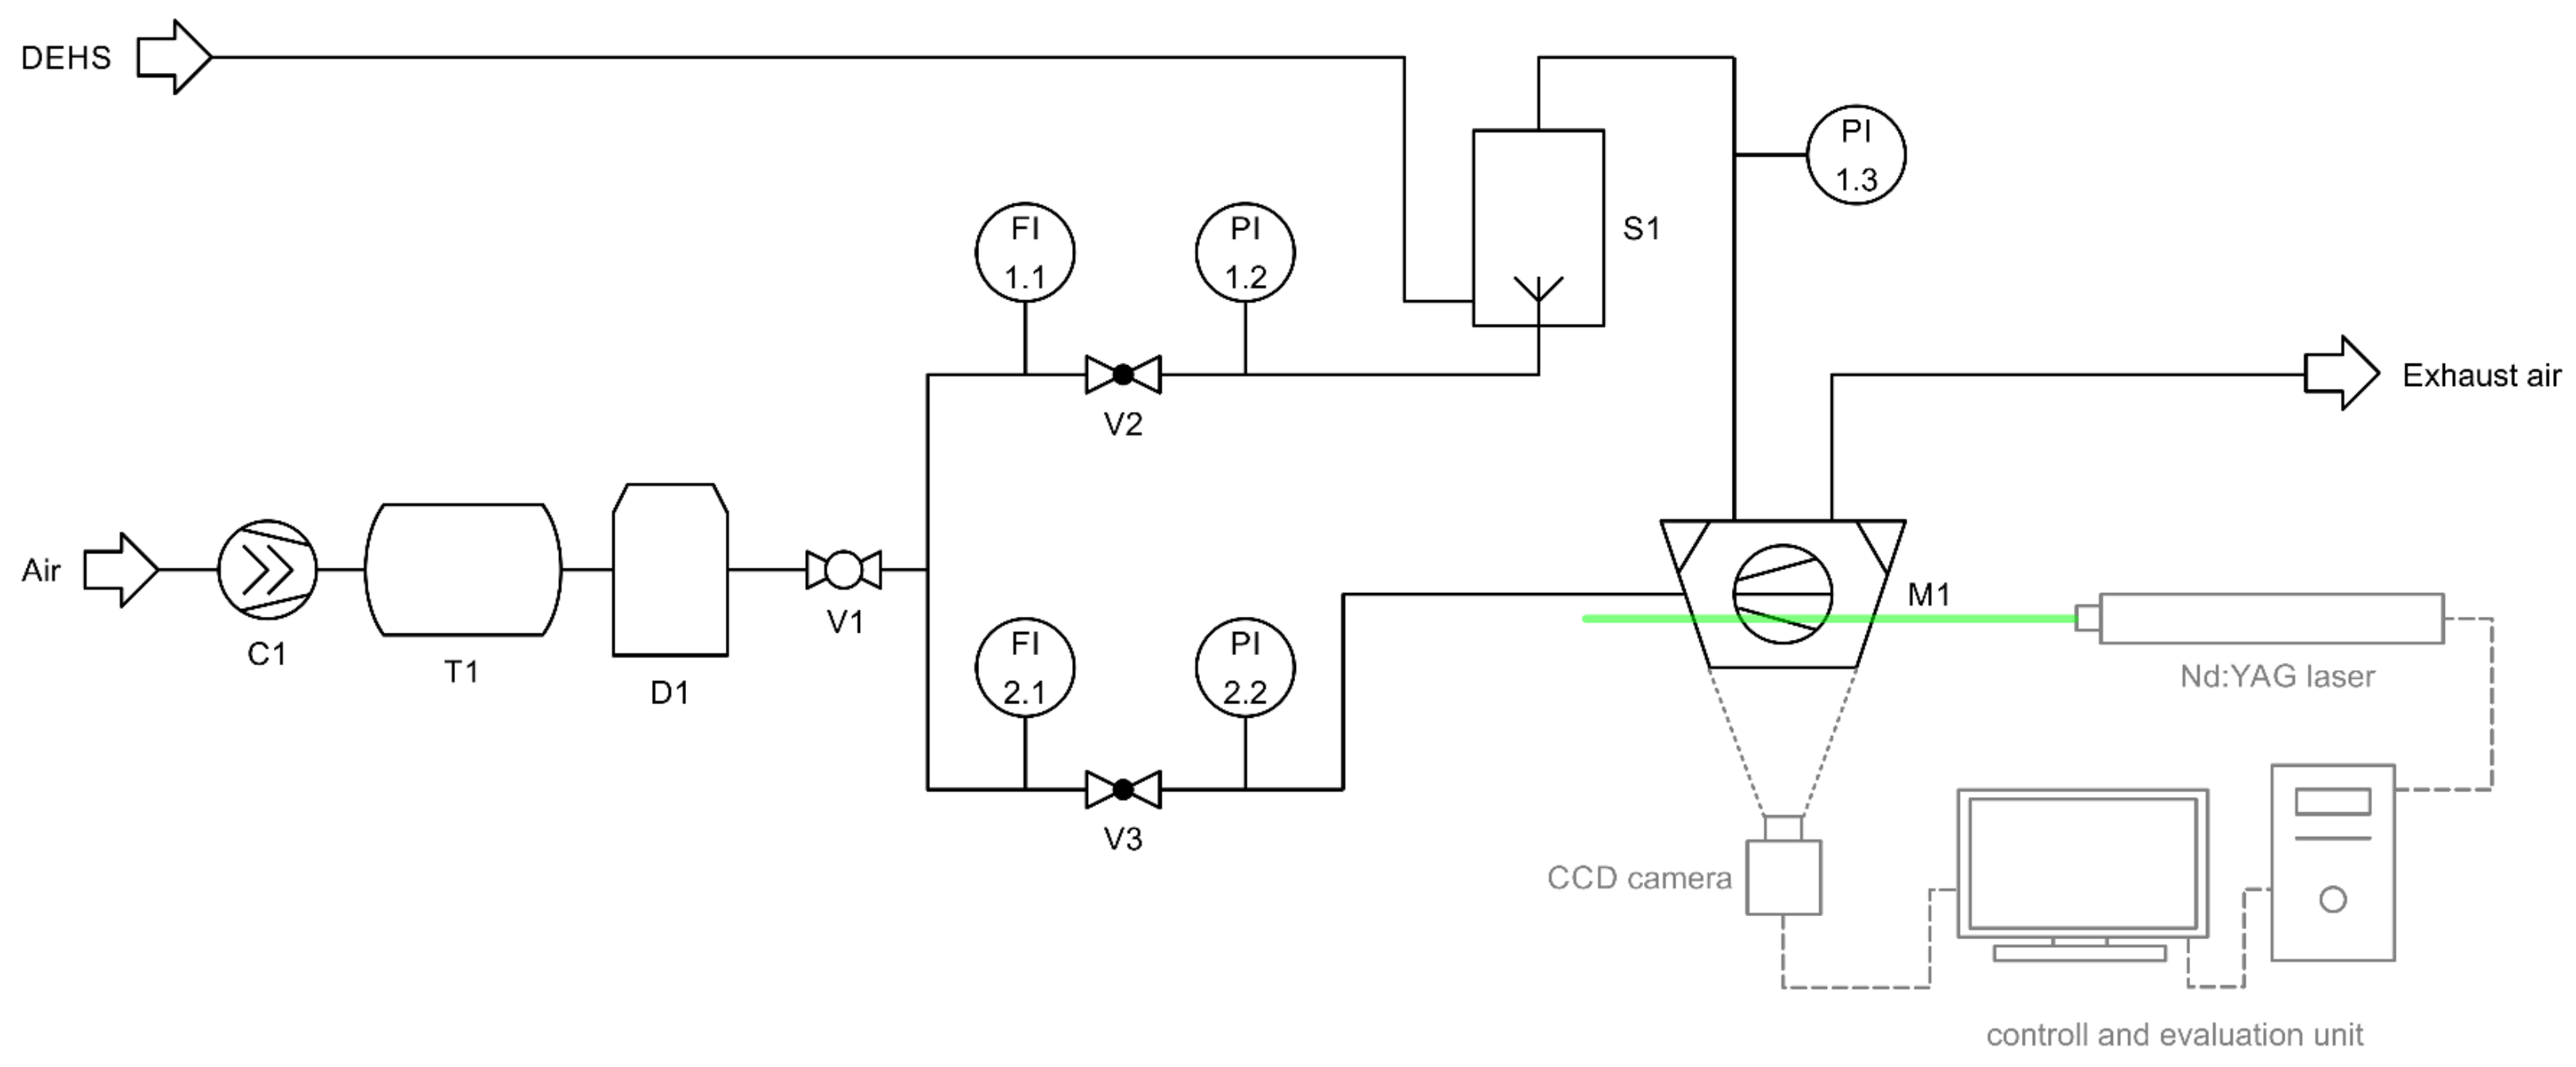
The test facility used for the PIV investigations in the spiral jet mill is shown in the flow diagram in
Figure 2. A screw compressor with a pressure vessel and integrated refrigeration dryer (RSDK-B 2.2 with RKT 0035, Renner GmbH Kompressoren, Güglingen, Germany) generates the compressed air used as the grinding gas. The gas line is then divided into two separate gas flows to supply compressed air to both the grinding ring’s nozzles and the injector system. A calorimetric flow sensor (Inline Flow Sensor VA 520, CS Instruments GmbH & Co. KG, Tannheim, Germany) and a digital pressure gauge (Baroli 05, BD Sensors GmbH, Thierstein, Germany) are integrated into each of the two lines to enable the precise setting of the respective gas mass flow rates (m
n and m
inj) and pressures (p
n and p
seed) using pressure reducing devices (DM 1/2 W, Schneider Druckluft GmbH, Reutlingen, Germany).
The grinding gas flow is evenly divided among the eight grinding nozzles, while the injector flow is completely fed to a liquid droplet seeder (LS-10e, SCITEK Consultants Ltd., Derby, UK), which generates an aerosol of very fine diethyl hexyl sebacate (DEHS, Palas GmbH, Karlsruhe, Germany) droplets dispersed in compressed air. The DEHS droplets are used as tracer material for the investigation of the net grinding gas flow without solid feed since they follow the flow within the mill almost without slip and have a long lifetime due to the small particle size, which is predominantly in the range of 0.2 and 0.3 µm [
27]. Downstream from the seeder, another digital pressure gauge (Baroli 05, BD Sensors GmbH, Thierstein, Germany) is installed, which measures the pressure of the aerosol (p
inj) before it is fed to the injector of the spiral jet mill and distributed within the grinding chamber. After leaving the mill, the compressed air enriched with DEHS droplets gets to the exhaust air system. The mass flow rates and pressure values set during the measurements can be taken from
Table 1.
Following the grinding gas flow inside the spiral jet mill, the tracer particles are illuminated by a double-pulsed Nd:YAG laser with a wavelength of 532 nm (DualPower Nano L 135-15, Litron Lasers Ltd., Rugby, UK), which has the shape of a thin horizontal light sheet. Simultaneously, double images of the visible cross-section of the grinding chamber are taken from below with a CCD camera (FlowSenseEO 4M, Dantec Dynamics A/S, Skovlunde, Denmark) (see
Figure 1;
Figure 2 right).
Assuming a darkened apparatus or a dark measuring room, only the particles exposed within the laser light sheet are therefore visible on the images, enabling the flow profiles to be determined at different horizontal levels. In order to be able to map the flow inside the spiral jet mill as completely as possible, the velocity profiles are measured not only at the nozzle level but also 3 mm below the mill cover and 3 mm above the mill bottom. At the cover and bottom level, the time between the laser pulses and hence between the two single images of a double image (∆t) is 5 µs. In order to determine the appreciably higher velocities in the nozzle jet region, the measurements at the nozzle level are carried out at a lower setting for ∆t. While a ∆t of 1 µs is selected for the detailed observation of the nozzle jet, a compromise between the high velocities in the nozzle jet and the significantly lower velocities in the inner region of the mill has to be made for the visualization of the entire cross-section of the grinding chamber; this is done with ∆t = 3 µs.
From the displacement of the tracer particles within a double image, the spatially resolved velocity vectors can be calculated using the DynamicStudio software (Dantec Dynamics A/S, Skovlunde, Denmark). In order to obtain a statistically valid averaged flow profile of the spiral jet mill in steady state, 300 double images with a trigger rate of 7 Hz are recorded per measurement. Two to three repeated measurements are performed for each parameter setting, and the respective mean values and standard deviations are calculated to ensure the reproducibility of the results.
Based on the determined flow profiles, conclusions can thus be drawn about the size of the comminution and classifying zones, as well as the characteristics of the nozzle jet, which allow the influence of the considered parameters to be assessed.
3. Results
In this section, the results of the PIV investigations are presented and discussed. First, the measurement method is optimized concerning the image quality in order to increase the informative value of the determined velocity fields. This is followed by the individual results of the parameter study on the product outlet diameter and the grinding gas flow rate.
The two-dimensional coordinate system (x, y) of the flow profiles is positioned so that the product outlet of the mill is located at point (0, 0). The position of the grinding nozzle is marked at nozzle level in the upper right corner. Due to the shadowing of the laser light behind the nozzles, the flow profile at this level, unlike at the cover and bottom level, cannot be determined over the entire grinding chamber cross-section, but only in the area between the nozzles.
3.1. Optimization of the Measurement Method
The outlet diameter of a spiral jet mill mainly influences the flow conditions around the product outlet, which is why the velocities in this region are particularly important. Therefore, several optimization steps with regard to the optical properties of the grinding chamber (as described in the following) are carried out to improve the image quality of the PIV measurements and hence the significance of the calculated velocity fields before the parameter investigations take place.
Figure 3 shows an example of the velocity fields of the net grinding gas flow on all three levels before optimization for an outlet diameter of 24 and 48 mm and a total grinding gas mass flow rate of 28.0 kg h
−1. These results have been obtained in previous work [
28]. The flow profiles show several white and dark blue areas where the velocity vectors cannot be determined correctly. This applies especially to the area around the product outlet at cover and nozzle level (cf.
Figure 3 above) since intense and, in some cases, large-area reflections of the laser light occur at the edges of the discharge cone in the mill cover, making correct image evaluation impossible in this area. However, also in the outer region of the mill, reflections of the laser light at the edges and end faces of the grinding ring result in areas where the flow in the grinding chamber cannot be followed and which are therefore partially blanked out (cf. nozzle level in
Figure 3 below).
Another problem that severely limits the quality and informative value of the velocity fields are the dark blue horizontal stripes on all three levels, which are caused by the material characteristics of the grinding ring. The ring is made of a PMMA tube, which has minor grooves due to the extrusion manufacturing process and, therefore, a striped structure on which the laser light is refracted. This creates stripes on the captured double images suggesting a lower flow velocity compared to reality. This is a problem, especially with slow flows in the inner region of the mill (cf.
Figure 3 below). In addition, when looking at the product outlet, especially at the cover and bottom level at higher velocities, it is noticeable that the velocity fields are not circularly symmetrical as expected but are slightly distorted (cf.
Figure 3 above).
All these aspects limit the informative value of the flow profiles and complicate or even prevent their further evaluation, e.g., concerning the mean velocity in the mill or the size of the comminution and classifying zones. For this reason, during optimization, it is essential to reduce or, in the best case, avoid the reflections of the laser light, the horizontal stripes, and the distortion in order to visualize the entire velocity field of the grinding gas flow in the spiral jet mill.
For this purpose, both the discharge cone in the mill cover and the end faces of the grinding ring are first painted with matte black paint, which is intended to prevent reflections of the laser light. In addition, all other reflective components in the immediate surrounding of the mill, such as the metallic grinding nozzles, are also painted with the same color to prevent any possibility of reflection. The grinding ring’s striped structure is indeed removed by first roughening it thoroughly and then polishing it again until it is completely transparent.
Figure 3 shows the result of these simple but effective optimization steps directly compared to the previous state. At all three levels at both outlet diameters, the complete flow profile of the grinding gas flow can now be determined almost without disturbing reflections, stripes, and distortions. Especially in the area around the product outlet, which is of great importance for the following parameter study, a massive improvement of the results can be achieved so that a further quantitative evaluation of the flow profiles can also be carried out.
The velocity fields now clearly show the circularly symmetrical tangential spiral flow with two areas of increased flow velocity in the outer area of the mill (comminution zone) and around the product outlet (classifying zone). In between, there is a flow-calmed area with lower velocities. After entering the mill, the nozzle jet is immediately deflected by the tangential spiral flow before merging it completely. The highest velocities of v > 100 m s−1 can be identified inside the nozzle jet.
3.2. Velocity Fields of the Parameter Study
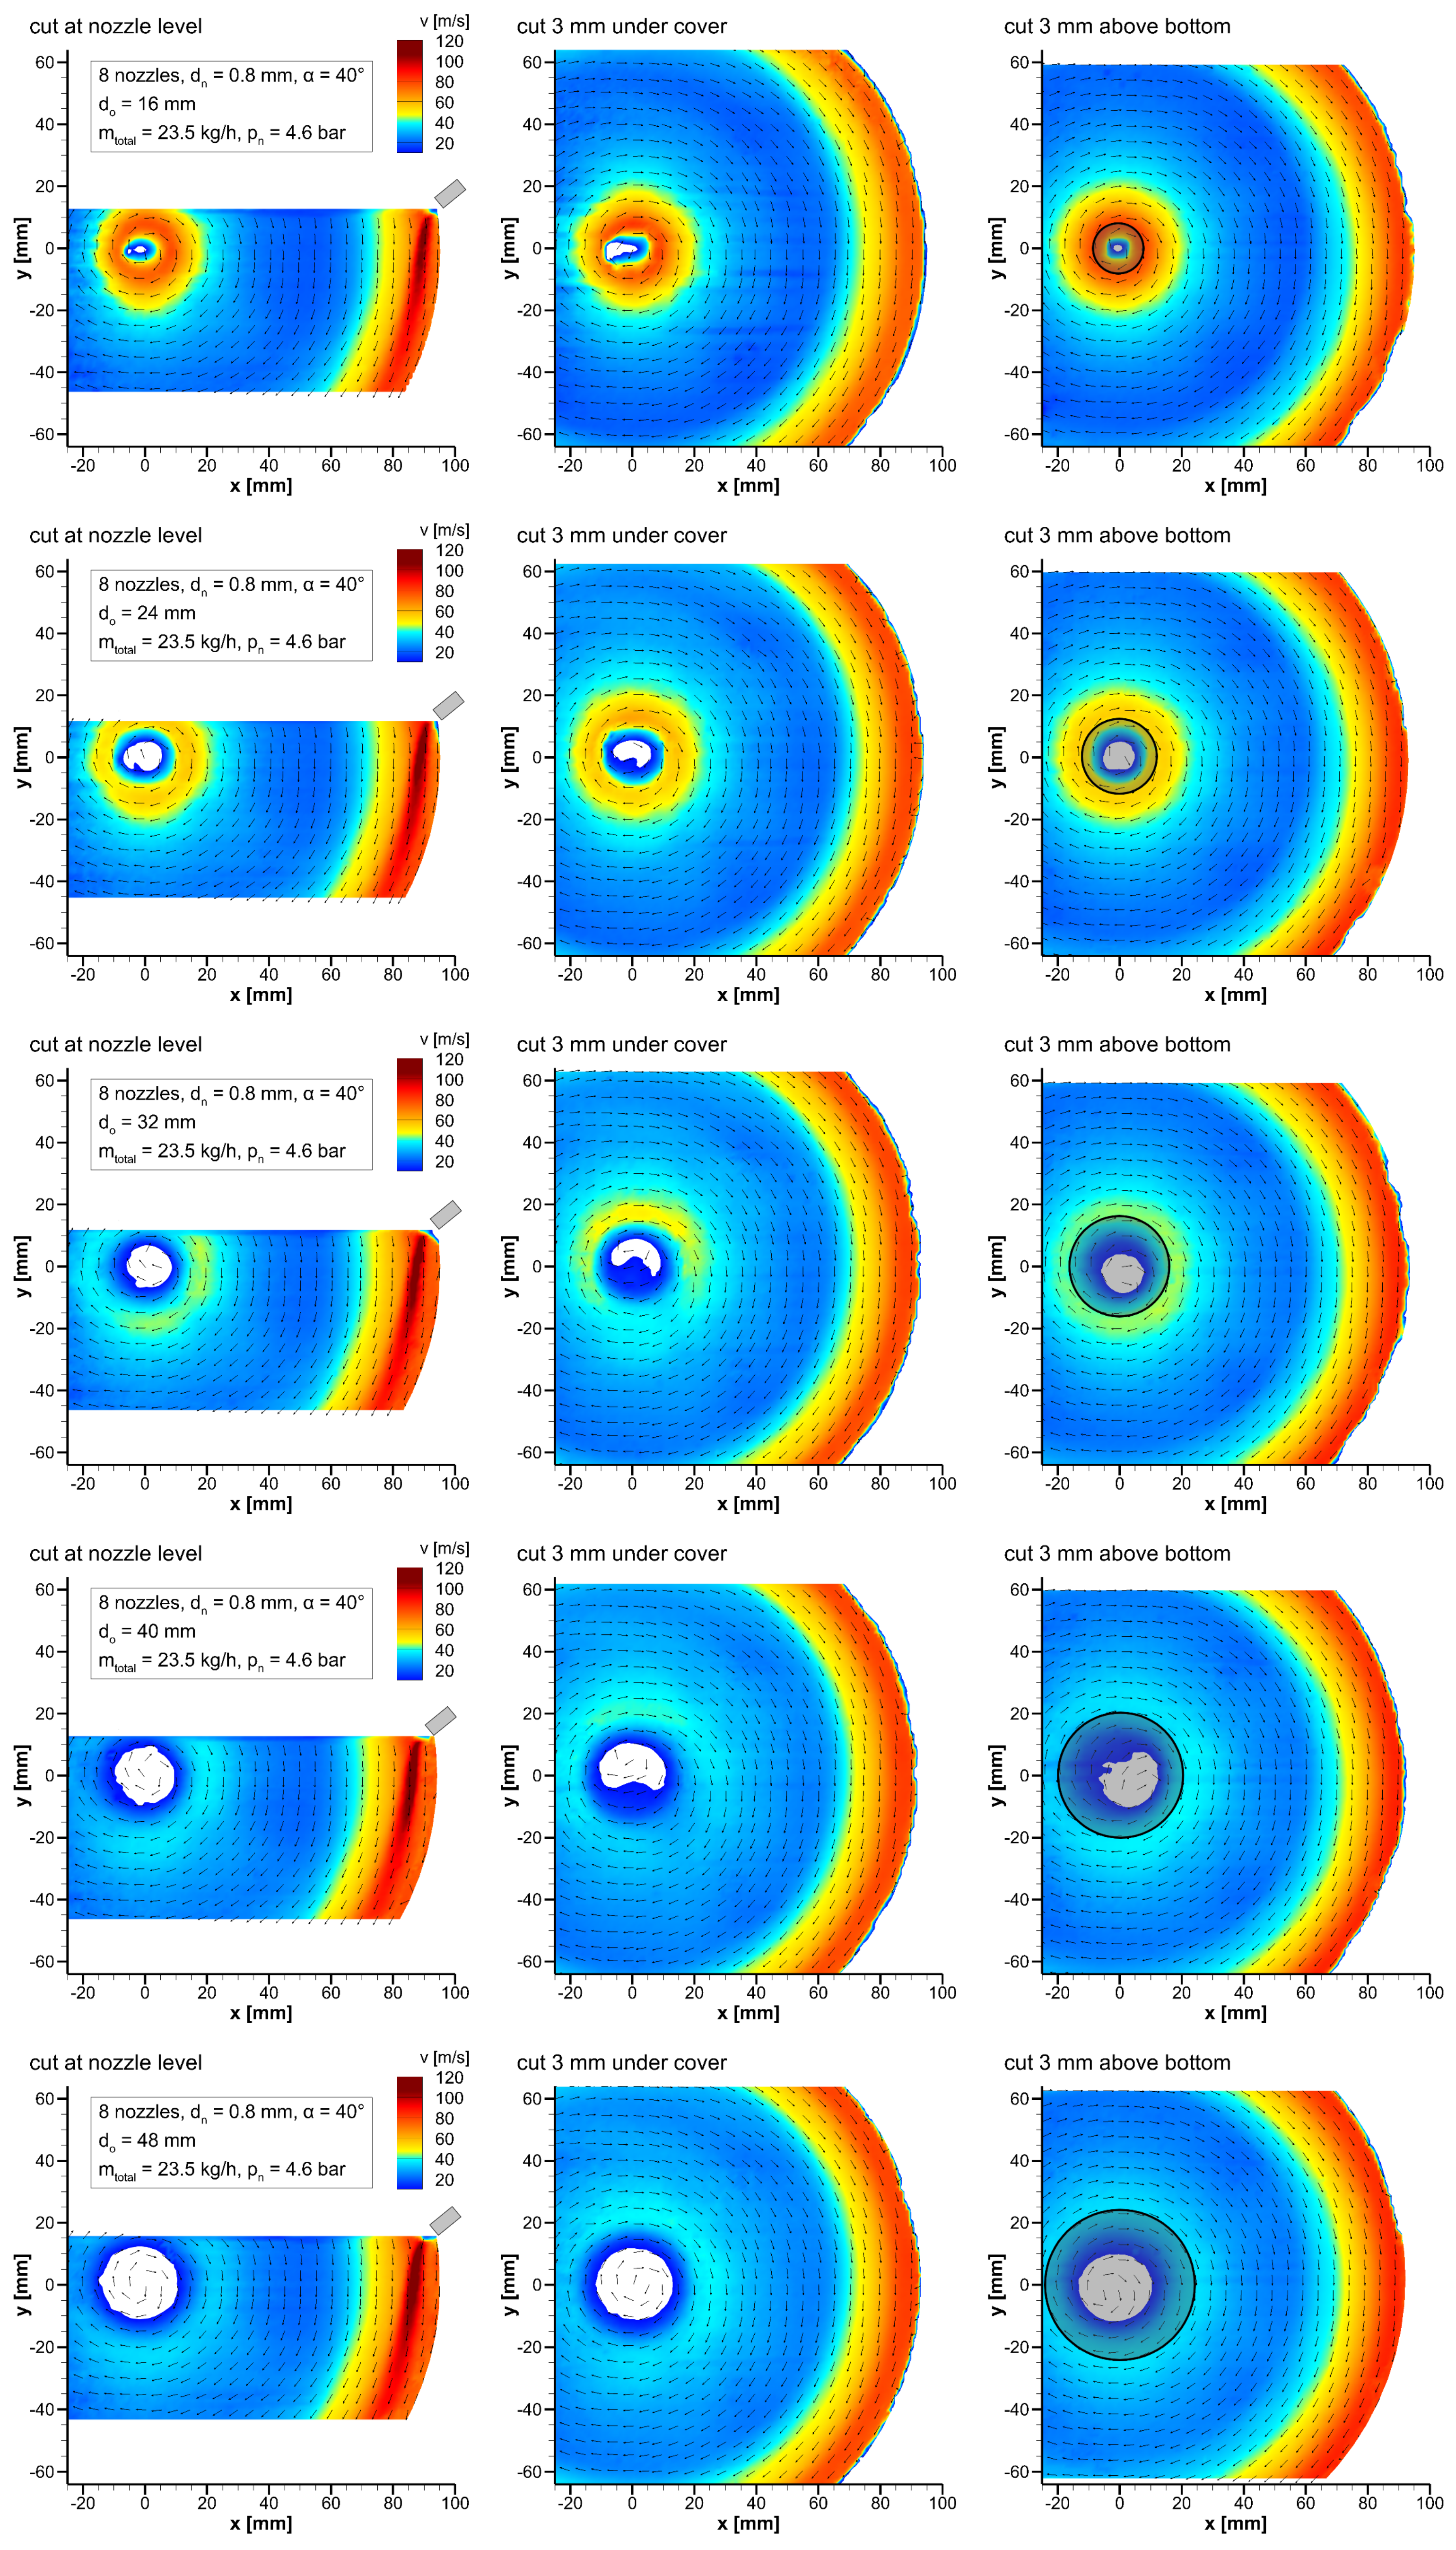
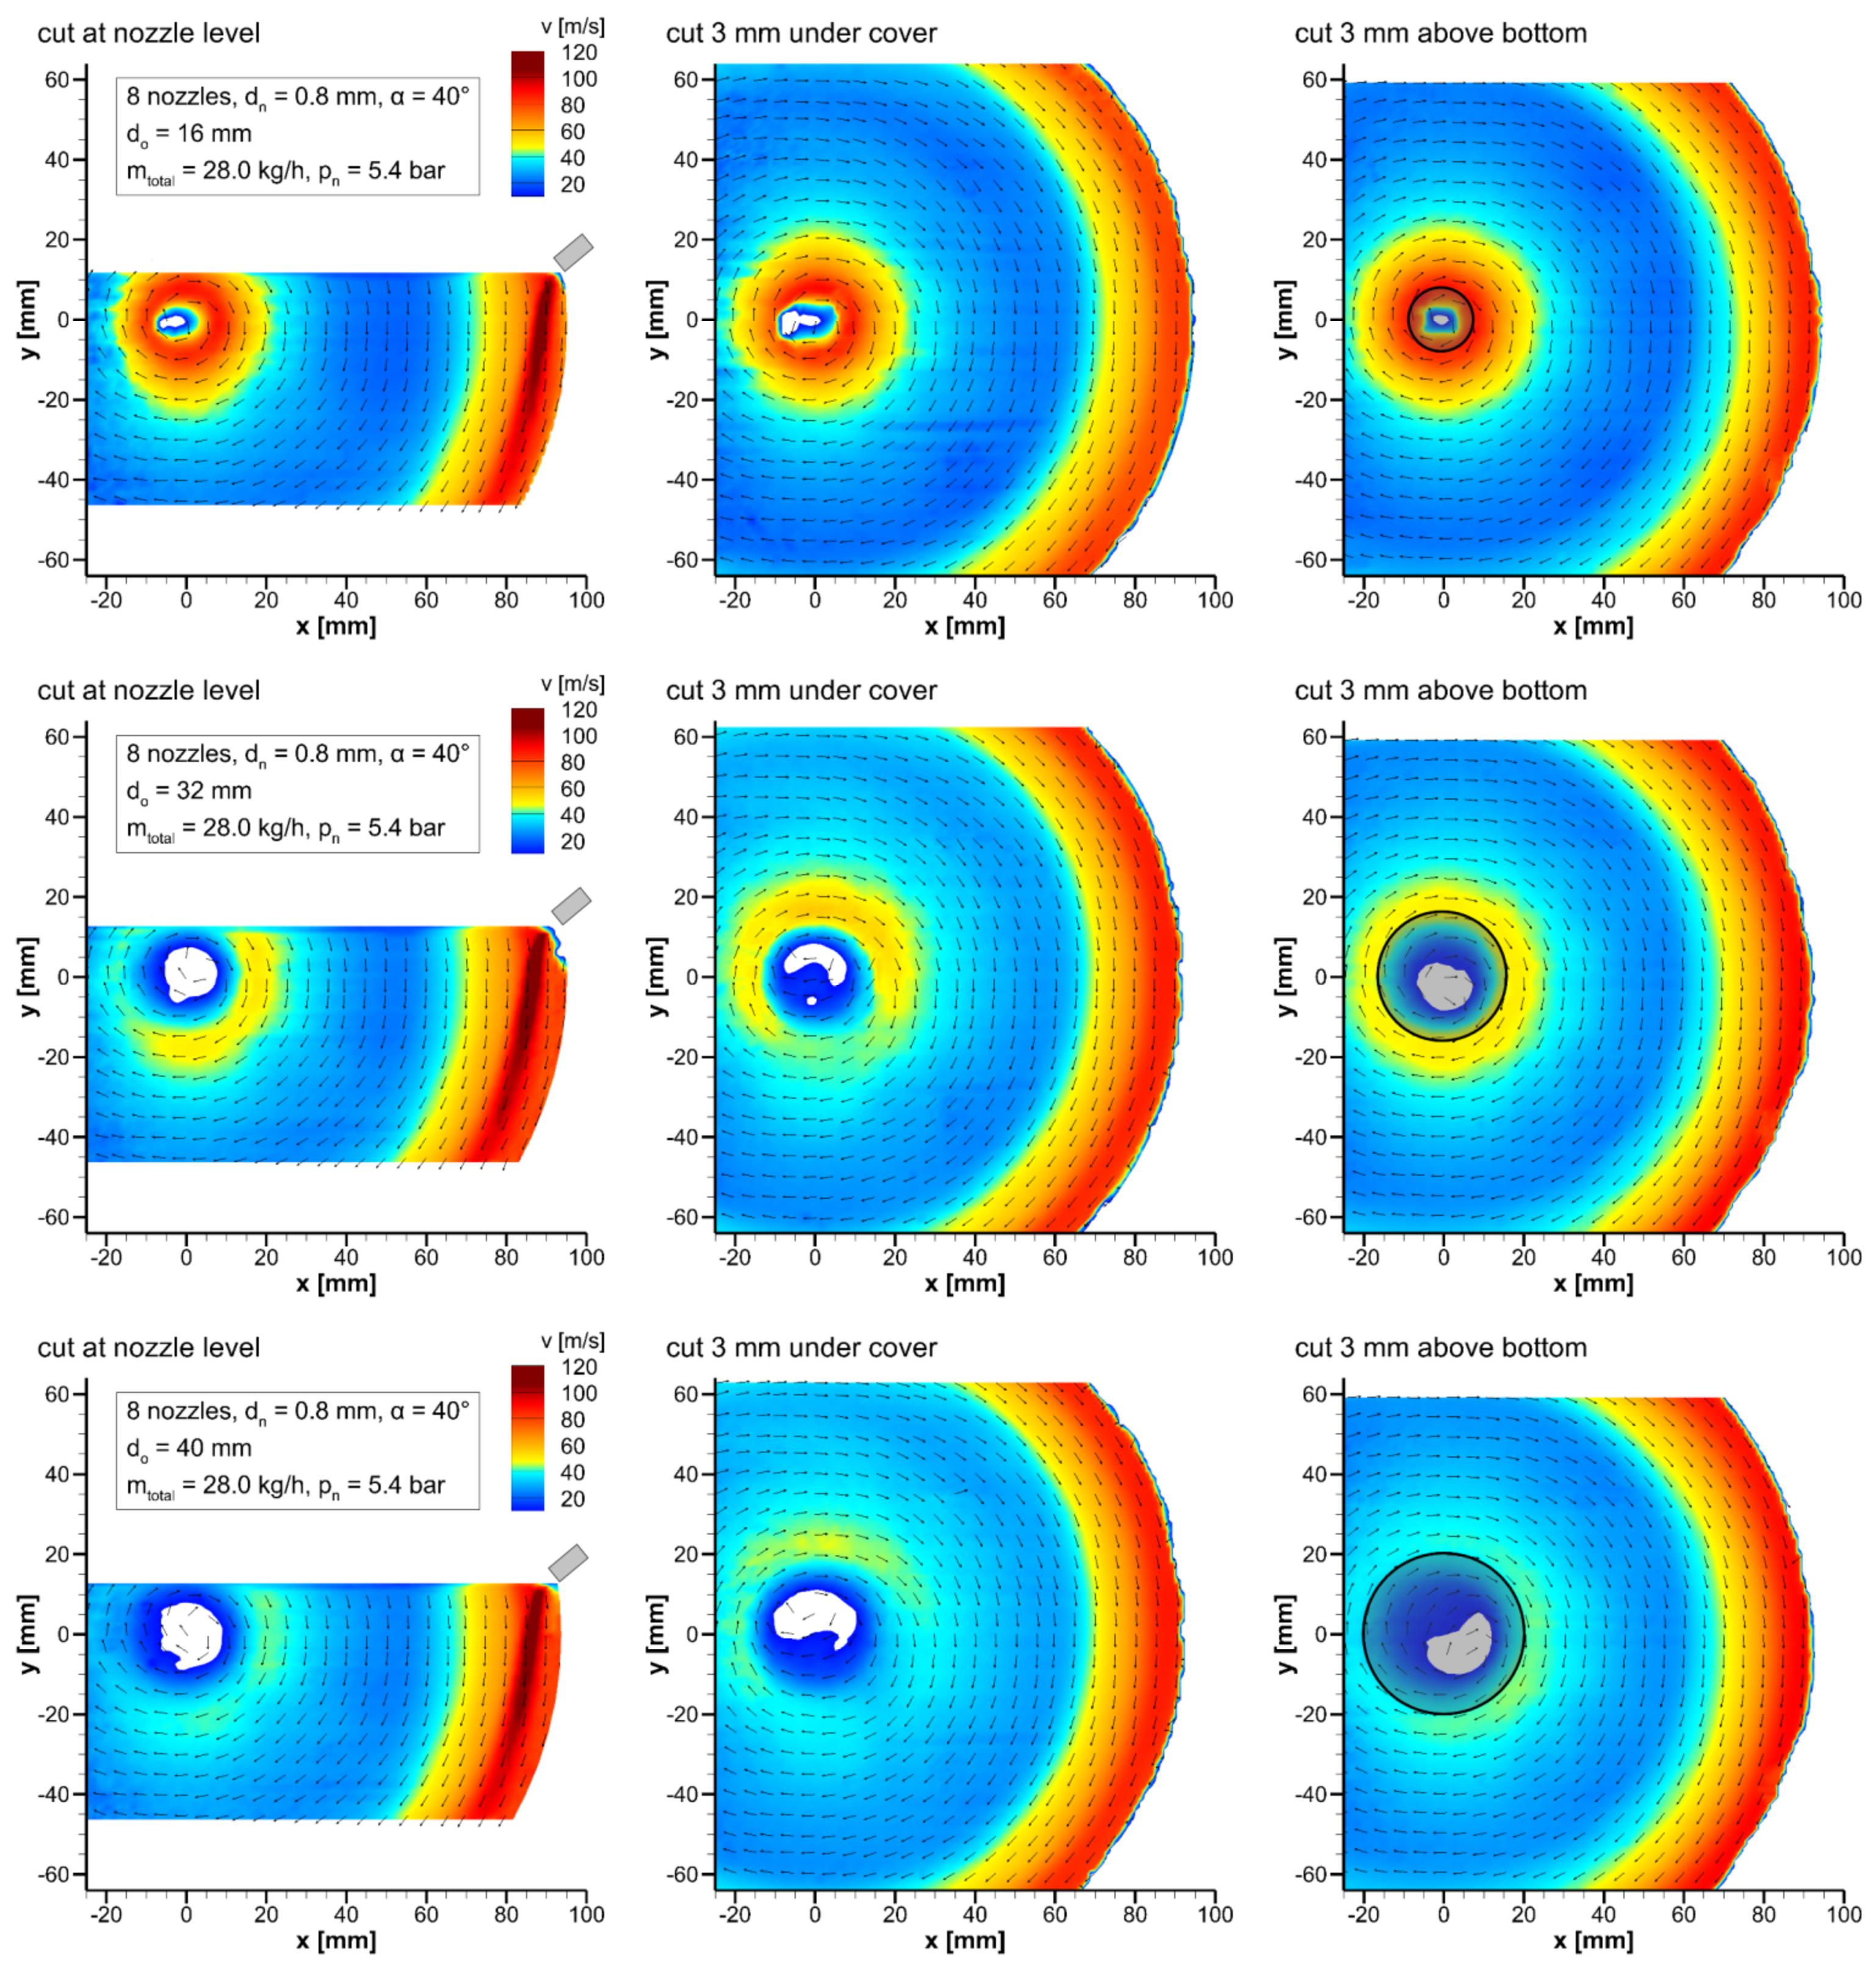
First, the influence of the product outlet diameter on the velocity fields of the net grinding gas flow is considered; the results are shown in
Figure 4 for all three levels of the investigated diameters d
o = 16, 24, 32, 40, and 48 mm and a total grinding gas mass flow rate of m
total = 23.5 kg h
−1. Except for the nozzle jet, no significant differences can be seen between the three levels for the same outlet diameter. Only below the cover, due to the proximity to the product outlet through which the entire grinding gas leaves the mill, slightly increased flow velocities result in some cases in the inner area compared to the levels further down.
While hardly any visible differences between the various outlet diameters can be seen in the comminution zone, there is an apparent increase in velocity with decreasing outlet diameter at all levels in the classifying zone. This corresponds to the expectations that can be established according to the continuity equation or the law of conservation of mass. The same volume of grinding gas has to leave the mill through a smaller product outlet cross-section during the same period so that its velocity increases enormously in this area. The increased velocities in the area of the product outlet with small outlet diameters simultaneously cause an increase in the circumferential velocity, which leads to a decrease in the cut-size particle diameter and thus positively influences the classifying process.
However, a closer look at the flow-calmed area and the comminution zone also reveals differences in the form of a slight tendency towards higher velocities with increasing outlet diameter. This is also visible in the nozzle jet, whose size appears to enlarge with increasing outlet diameter. These differences are most clearly seen in the velocity fields of the smaller outlet diameters. This indicates that due to the smaller product outlet cross-section, through which the entire grinding gas has to leave the mill, an increasing pressure builds up inside the grinding chamber as the outlet diameter decreases. This overpressure resulting from the backpressure of the grinding gas not only causes the flow to be slowed down in the flow-calmed area and the comminution zone but also prevents the nozzle jet from spreading out completely. In contrast, with the larger outlet diameters, the pressure inside the mill is so low that the flow can build up, and the nozzle jet can form completely.
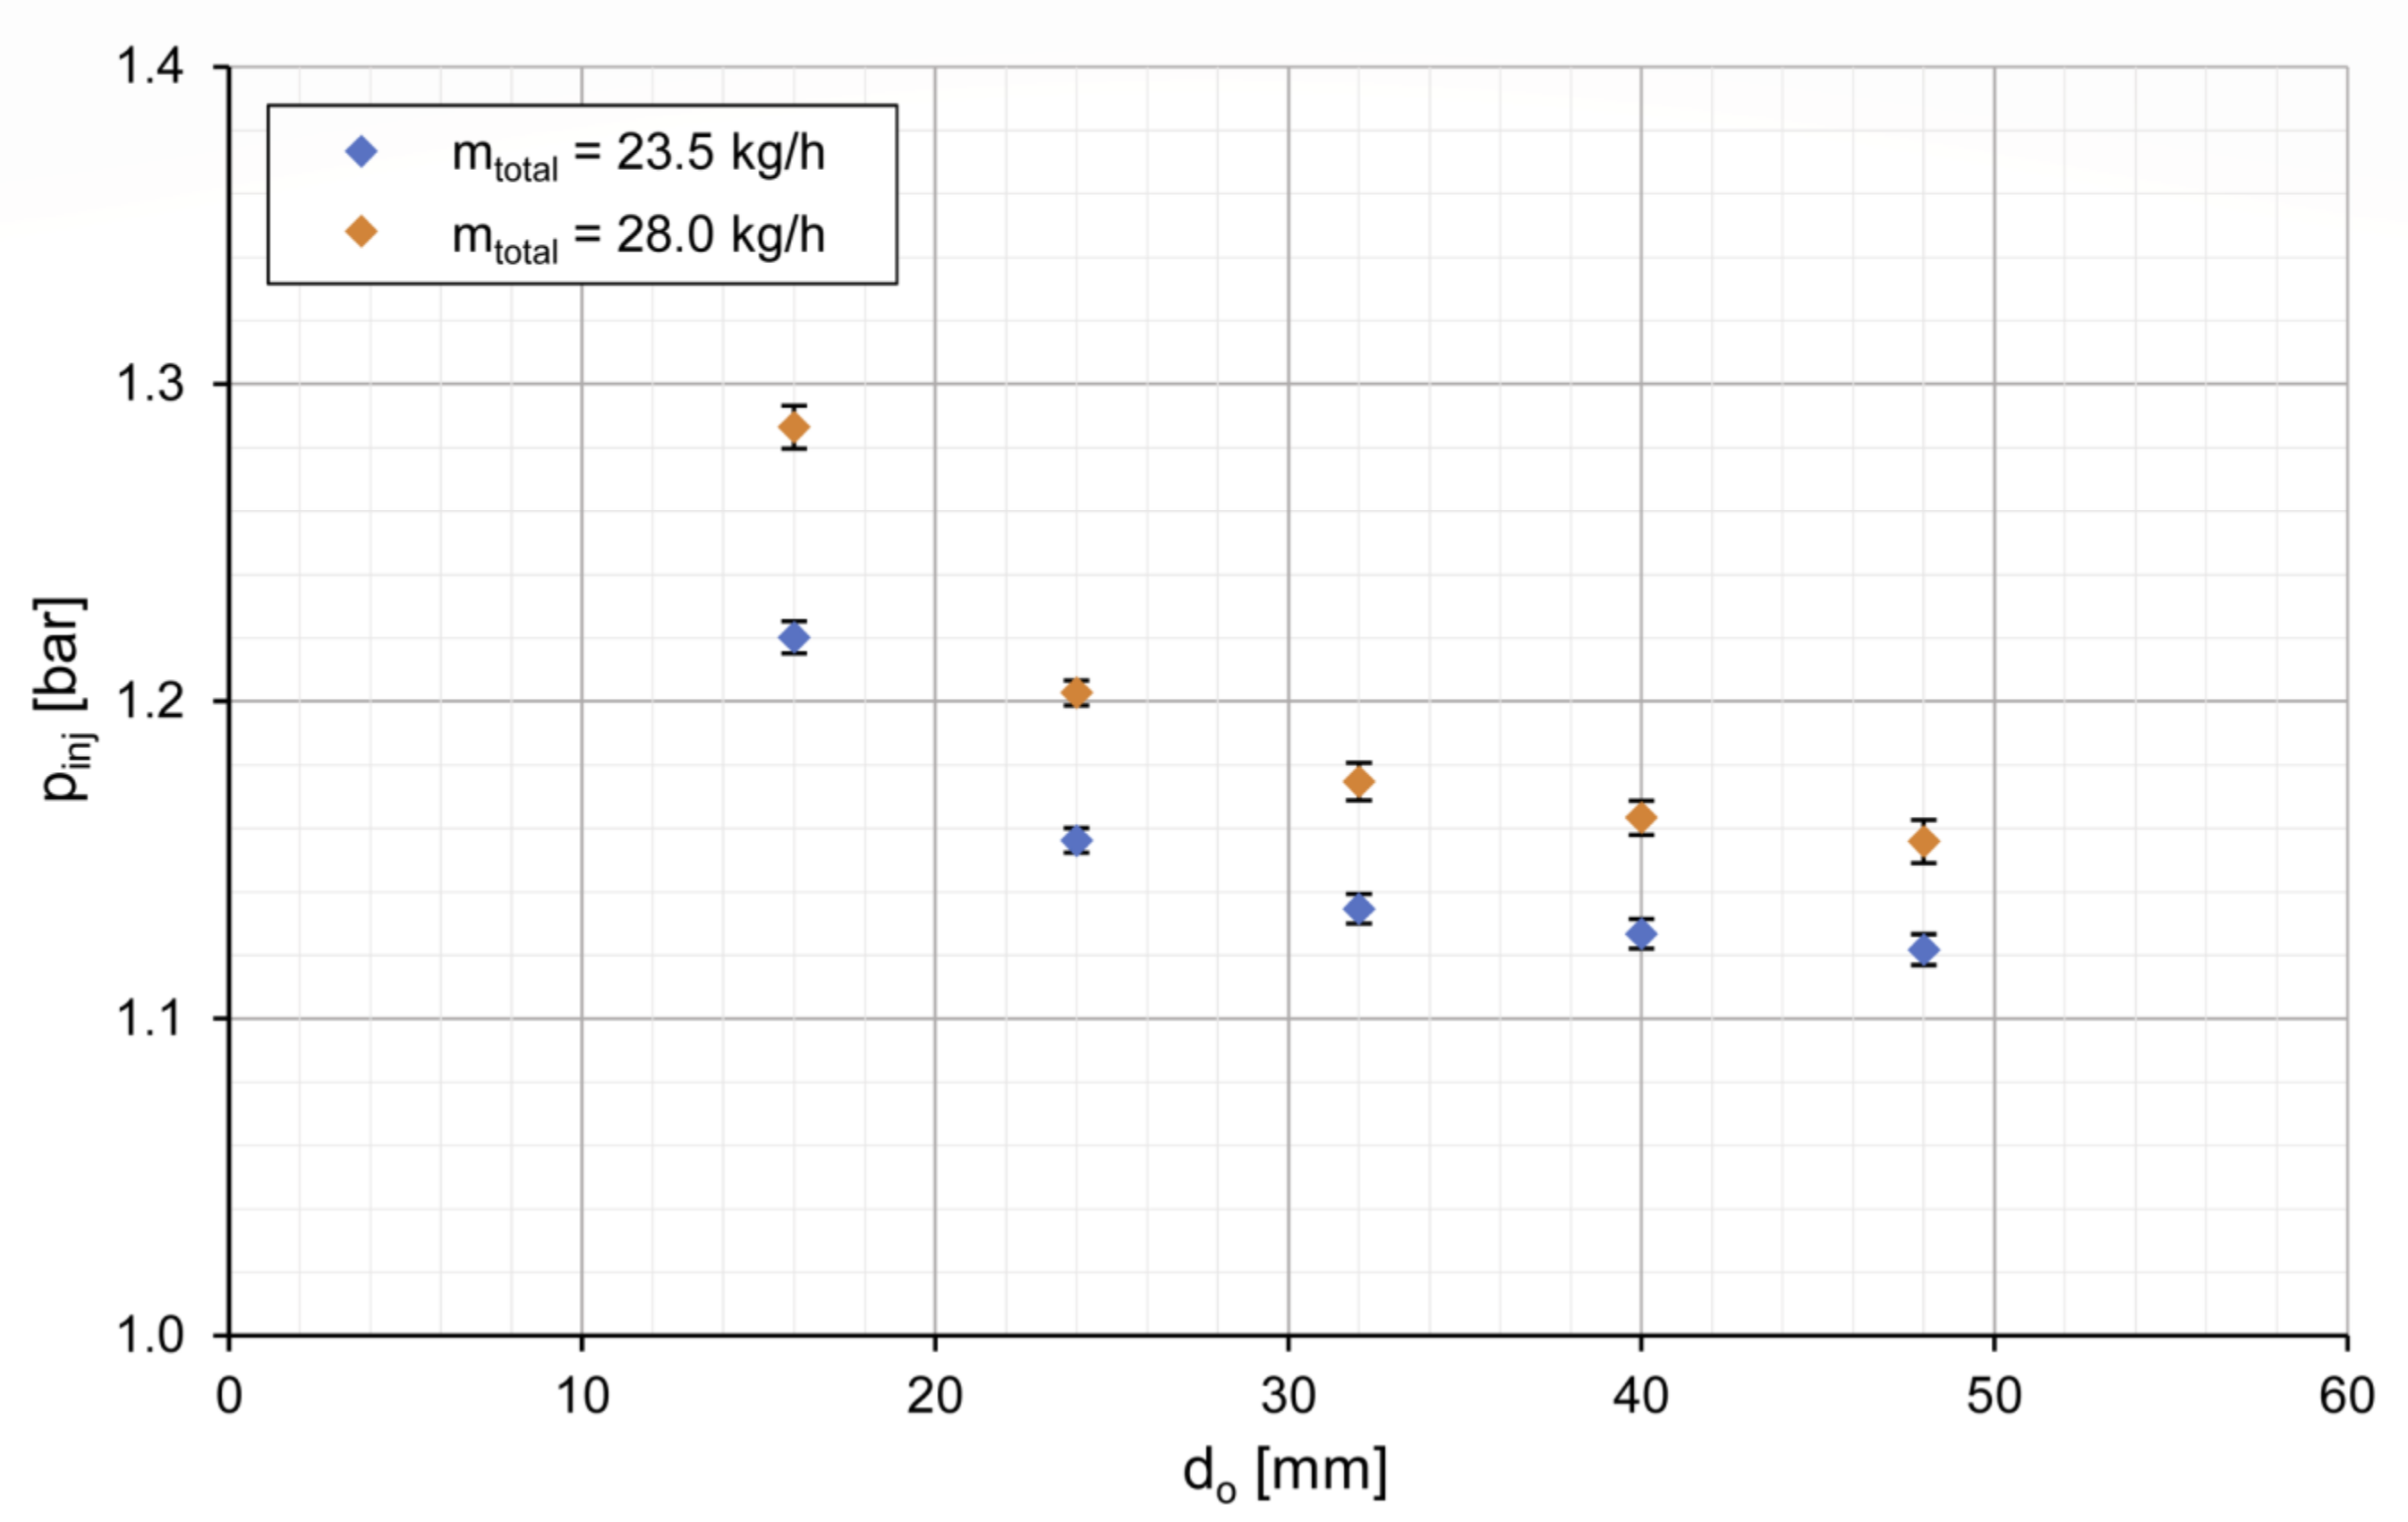
The effect of the outlet diameter on the pressure inside the grinding chamber also appears in the injector gas pressures (see
Table 1) since the overpressure in the mill continues up to this measuring point. For this reason,
Figure 5 shows the correlation of the injector gas pressure, serving as an indicator for the backpressure of the grinding gas and, thus, the overpressure inside the grinding chamber and the product outlet diameter. The increasingly rising injector gas pressure with decreasing outlet diameter confirms the assumption that an overpressure builds up within the mill, decelerating the flow in general and restricting the complete formation of the nozzle jet. In contrast, due to the significantly lower overpressure, larger outlet diameters lead to increased velocities in the comminution zone and the nozzle jet, resulting in a positive influence on the comminution process in total.
Figure 3 and
Figure 6 show the velocity fields of the net grinding gas flow for the same outlet diameters at a higher total grinding gas mass flow rate of m
total = 28.0 kg h
−1. As expected, compared to the lower gas flow rate (cf.
Figure 4), an apparent overall increase in flow velocity can be seen in the entire mill. This leads to an enlarged comminution and classifying zone as well as to a decrease in the size of the flow-calmed region. In addition, a closer look at the nozzle jets reveals both an increase in the maximum velocity in the jet core and an enlargement of the nozzle jets. The increase in the grinding gas flow rate, therefore, positively influences both the comminution and the classifying process within the spiral jet mill.
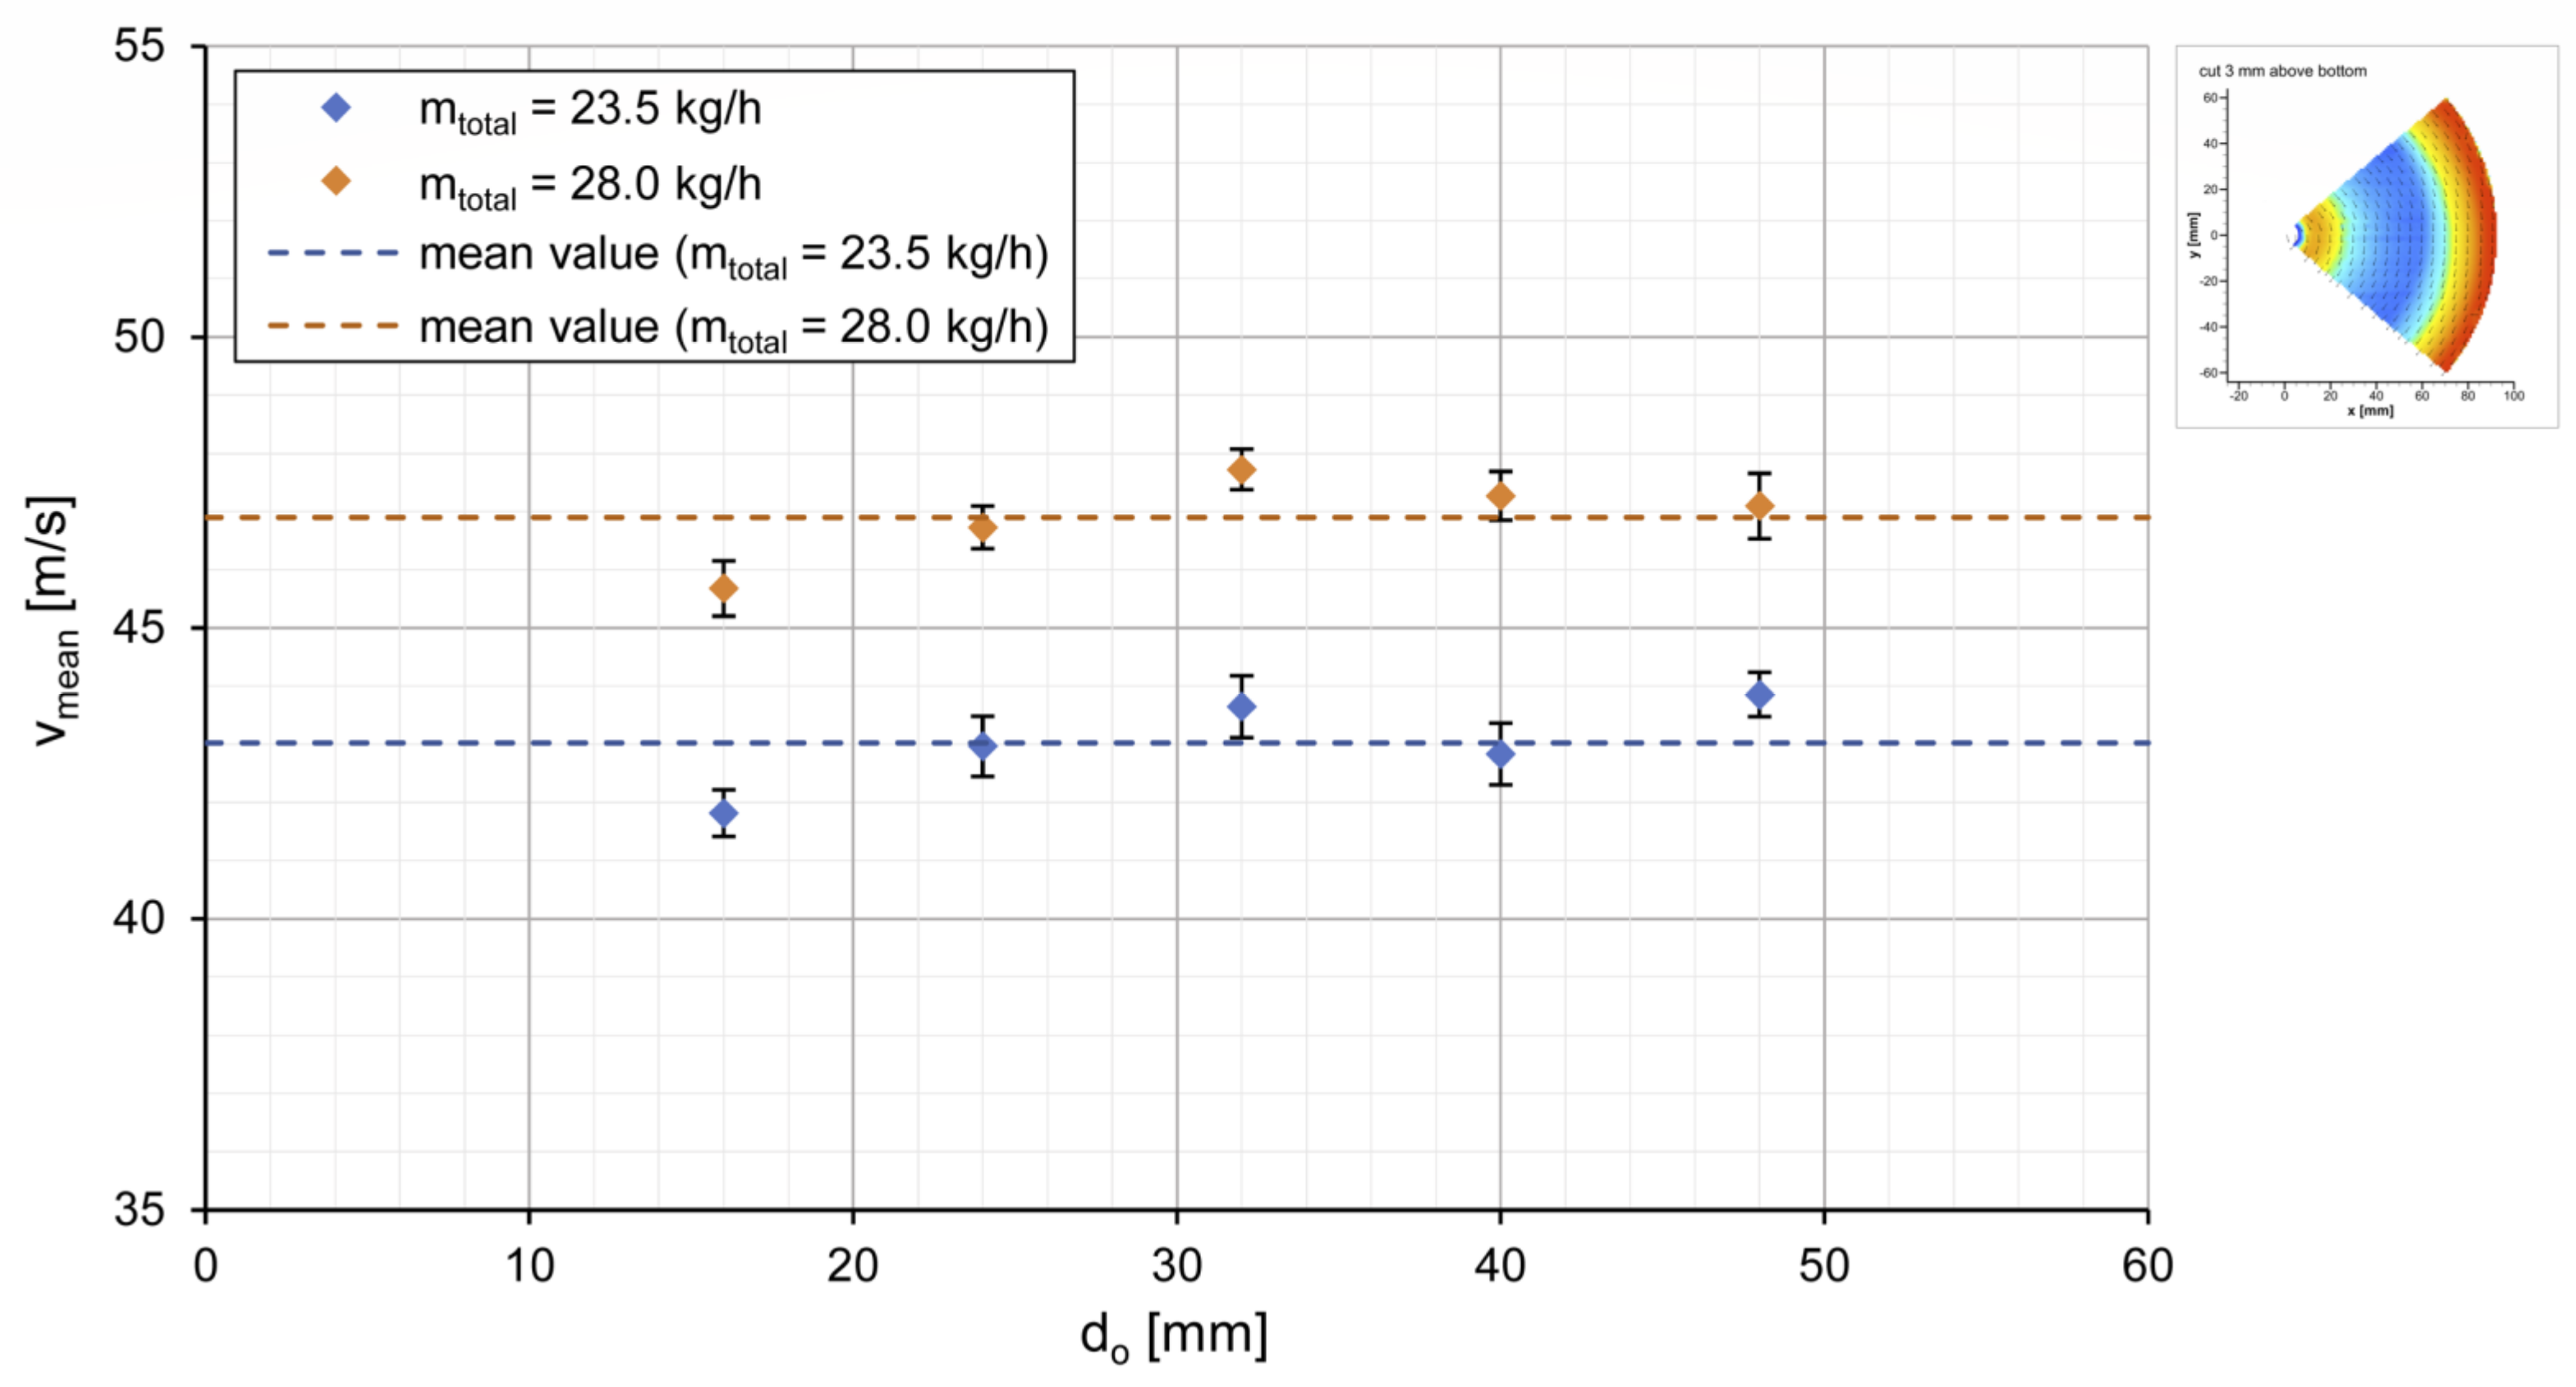
In order to assess the influence of the product outlet diameter and gas flow rate on the flow velocity in the spiral jet mill in more detail,
Figure 7 shows the mean velocity of the grinding gas flow (v
mean) as a function of the outlet diameter for both flow rates. The mean flow velocity is determined in the largest possible visible area of the mill cross-section, i.e., in the pie slice between 40° and −40° to the horizontal radius (r) for y = 0. Due to the better image quality and the more excellent circular symmetry of the classifying zone, the flow profile at the bottom level is used for this purpose.
Taking into account the error bars resulting from the standard deviation for a triple measurement, except for the value for do = 16 mm, no clear correlation between the mean flow velocity and the outlet diameter can be seen. The increased velocity in the flow-calmed area and the comminution zone appears to compensate for the decreased velocity in the classifying zone as the outlet diameter increases, so the mean flow velocity remains nearly constant. Only in the case of the smallest diameter of do = 16 mm, a slight reduction in the mean velocity is noticeable compared to the other outlet diameters due to the slowed-down flow in the outer area of the mill. This applies to both grinding gas flow rates. With a 19% increase in the gas mass flow rate from 23.5 kg h−1 to 28.0 kg h−1, there is an overall gain in the mean flow velocity from 43.0 ± 0.8 m s−1 to 46.9 ± 0.8 m s−1, which corresponds to an increase of 9%. Even if the value for do = 16 mm was disregarded due to the great overpressure, no significant difference would result, and the 9% increase in velocity would remain unchanged (gain in the mean flow velocity from 43.3 ± 0.5 m s−1 to 47.2 ± 0.4 m s−1).
3.3. Radial Velocity Profiles and Division of the Spiral Jet Mill into Zones
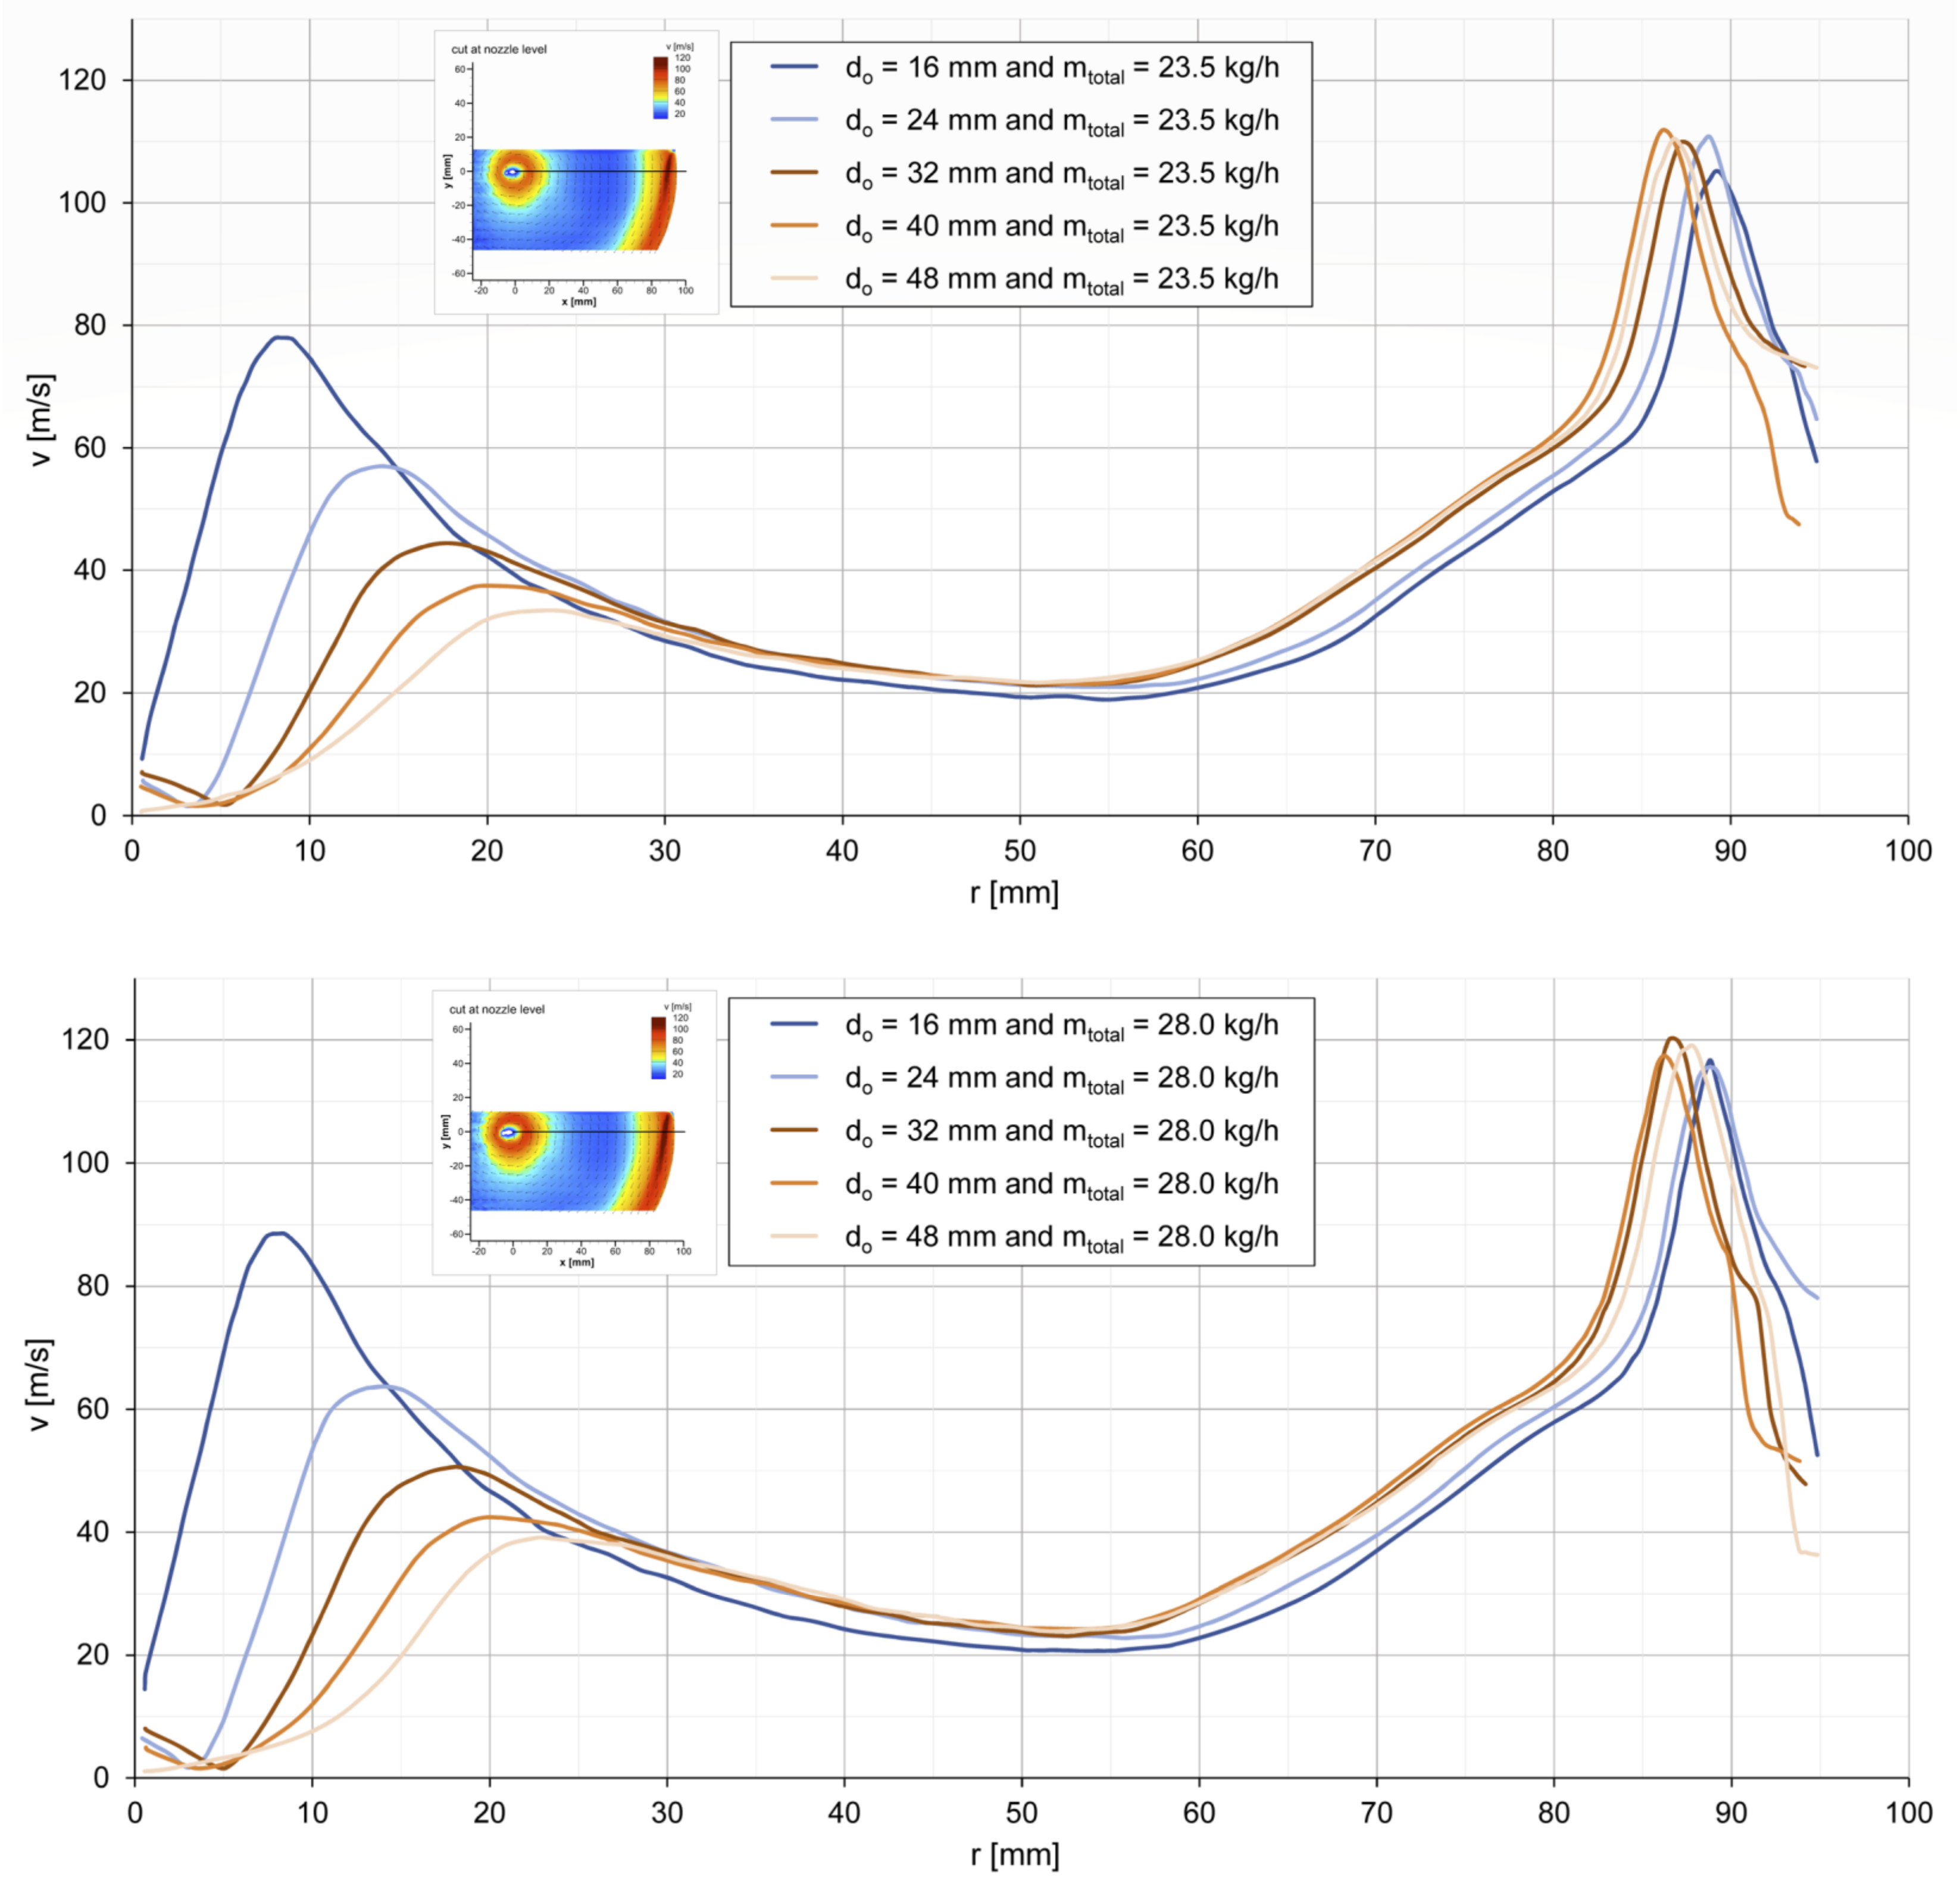
So as to enable a direct and quantitative comparison of the location-dependent velocities, the radial velocity profiles at nozzle level on the horizontal radius for y = 0 are extracted from the determined flow fields and shown for both grinding gas flow rates (see
Figure 8). The selected position ensures that the influence of the parameters on the nozzle jet is also mapped.
Again, it can be clearly seen that the maximum velocity in the classifying zone decreases with increasing outlet diameter. While at a gas flow rate of m
total = 23.5 kg h
−1, velocities of up to 78 m s
−1 are achieved at d
o = 16 mm, the maximum velocity at d
o = 48 mm is only 33 m s
−1, which corresponds to a decrease of 58% (cf.
Figure 8 above). At m
total = 28.0 kg h
−1, with a reduction from 89 m s
−1 to 39 m s
−1, a roughly equal decrease of 56% in the maximum velocity in the classifying zone can be obtained (cf.
Figure 8 below). However, despite a uniform increase in diameter, the velocity reduction decreases continuously for both grinding gas mass flow rates. Due to the increasing product outlet diameter, the radial position of the maximum velocity also shifts towards greater radii, although this shift also decreases with a uniform increase in diameter.
However, as can be seen in the area of larger radii in
Figure 8, the considered parameters have not only an influence on the properties of the classifying zone but also on the comminution zone and the nozzle jet, as well as on the area between these two zones.
The velocity in the flow-calmed area is approximately between 20 and 30 m s−1 for both gas flow rates. A closer look at the curves, however, reveals that the velocity in both the flow-calmed area and the comminution zone is slightly below the larger diameters for the lowest outlet diameters of do = 16 and 24 mm. This can also be explained by the overpressure building up inside the grinding chamber and the resulting deceleration of the gas flow. The increased overpressure also causes the maximum in the comminution zone, i.e., the position of the nozzle jet, to shift further to greater radii in the direction of the grinding chamber wall for these two outlet diameters compared to the other ones. In addition, the maximum velocity in the comminution zone for an outlet diameter of do = 16 mm also tends to be below the value for the larger outlet diameters. This indicates that the nozzle jet is also unable to form completely due to the high overpressure in the grinding chamber. While at a gas flow rate of mtotal = 28.0 kg h−1, velocities of up to 120 m s−1 are reached, the maximum velocity at mtotal = 23.5 kg h−1 is just 112 m s−1, whereas for an outlet diameter of do = 16 mm only a maximum of 117 or 105 m s−1 is achieved.
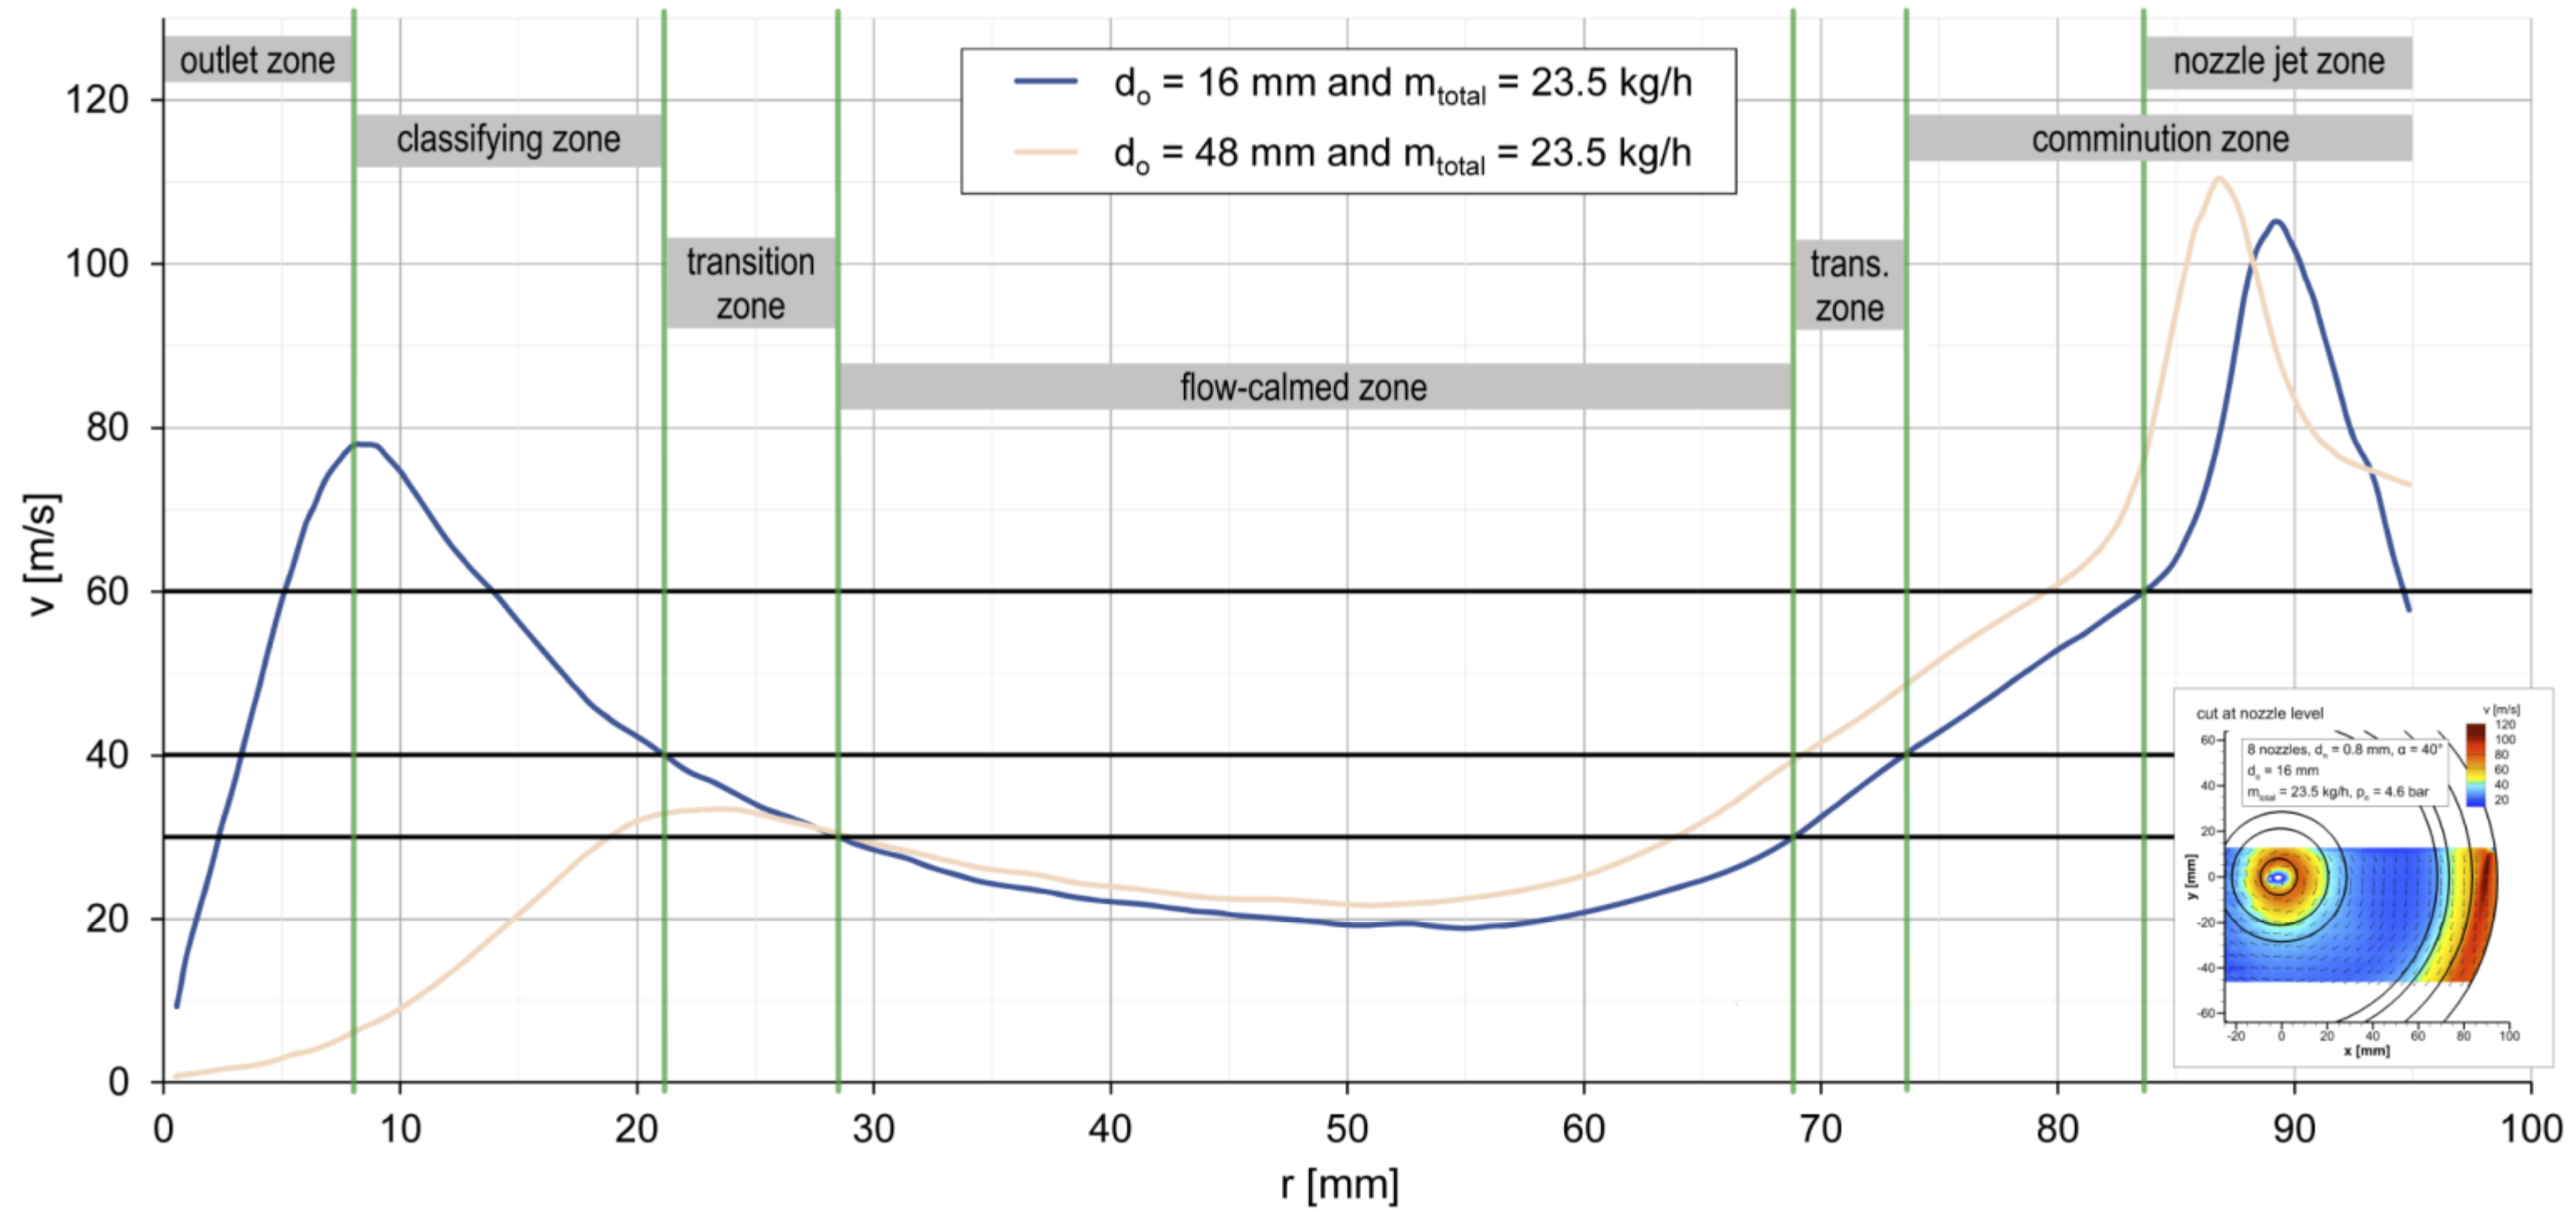
Before the influence of the parameters on the different areas within the grinding chamber is considered in more detail, the spiral jet mill is first divided into different zones in order to enable a more precise quantitative evaluation of the mentioned comminution and classifying zones.
Figure 9 shows the exemplary division of the radial velocity profile of net grinding gas flow for a product outlet diameter of d
o = 16 mm and a grinding gas mass flow rate of m
total = 23.5 kg h
−1. The grinding chamber can be basically divided into seven zones.
The “outlet zone” is equal to the product outlet cross-section of the mill. In the boundary area between the outlet zone and the following classifying zone, the maximum velocity of the fluid flow in the inner area of the mill is obtained. While the “flow-calmed zone” is characterized by comparatively low velocities of up to 30 m s
−1, the respective adjoining “transitions zones” can be identified by the almost linear increase of the velocity. The “comminution zone” and the “classifying zone” are defined by a velocity of v ≥ 40 m s
−1 marking the two zones of the spiral jet mill with the increased flow velocity. Moreover, the comminution zone can be further divided into the “nozzle jet zone”, characterized by a stronger ascent in velocity, forming a kink at approximately v = 60 m s
−1. In this area, the direct influence of the appreciably higher flow velocities of the nozzle jet appears. Depending on the product outlet diameter, the different zones can shift to other positions or disappear entirely, as can be seen from the exemplary velocity profile for an outlet diameter of d
o = 48 mm (cf.
Figure 9).
3.4. Parameter Influences on the Classifying Zone
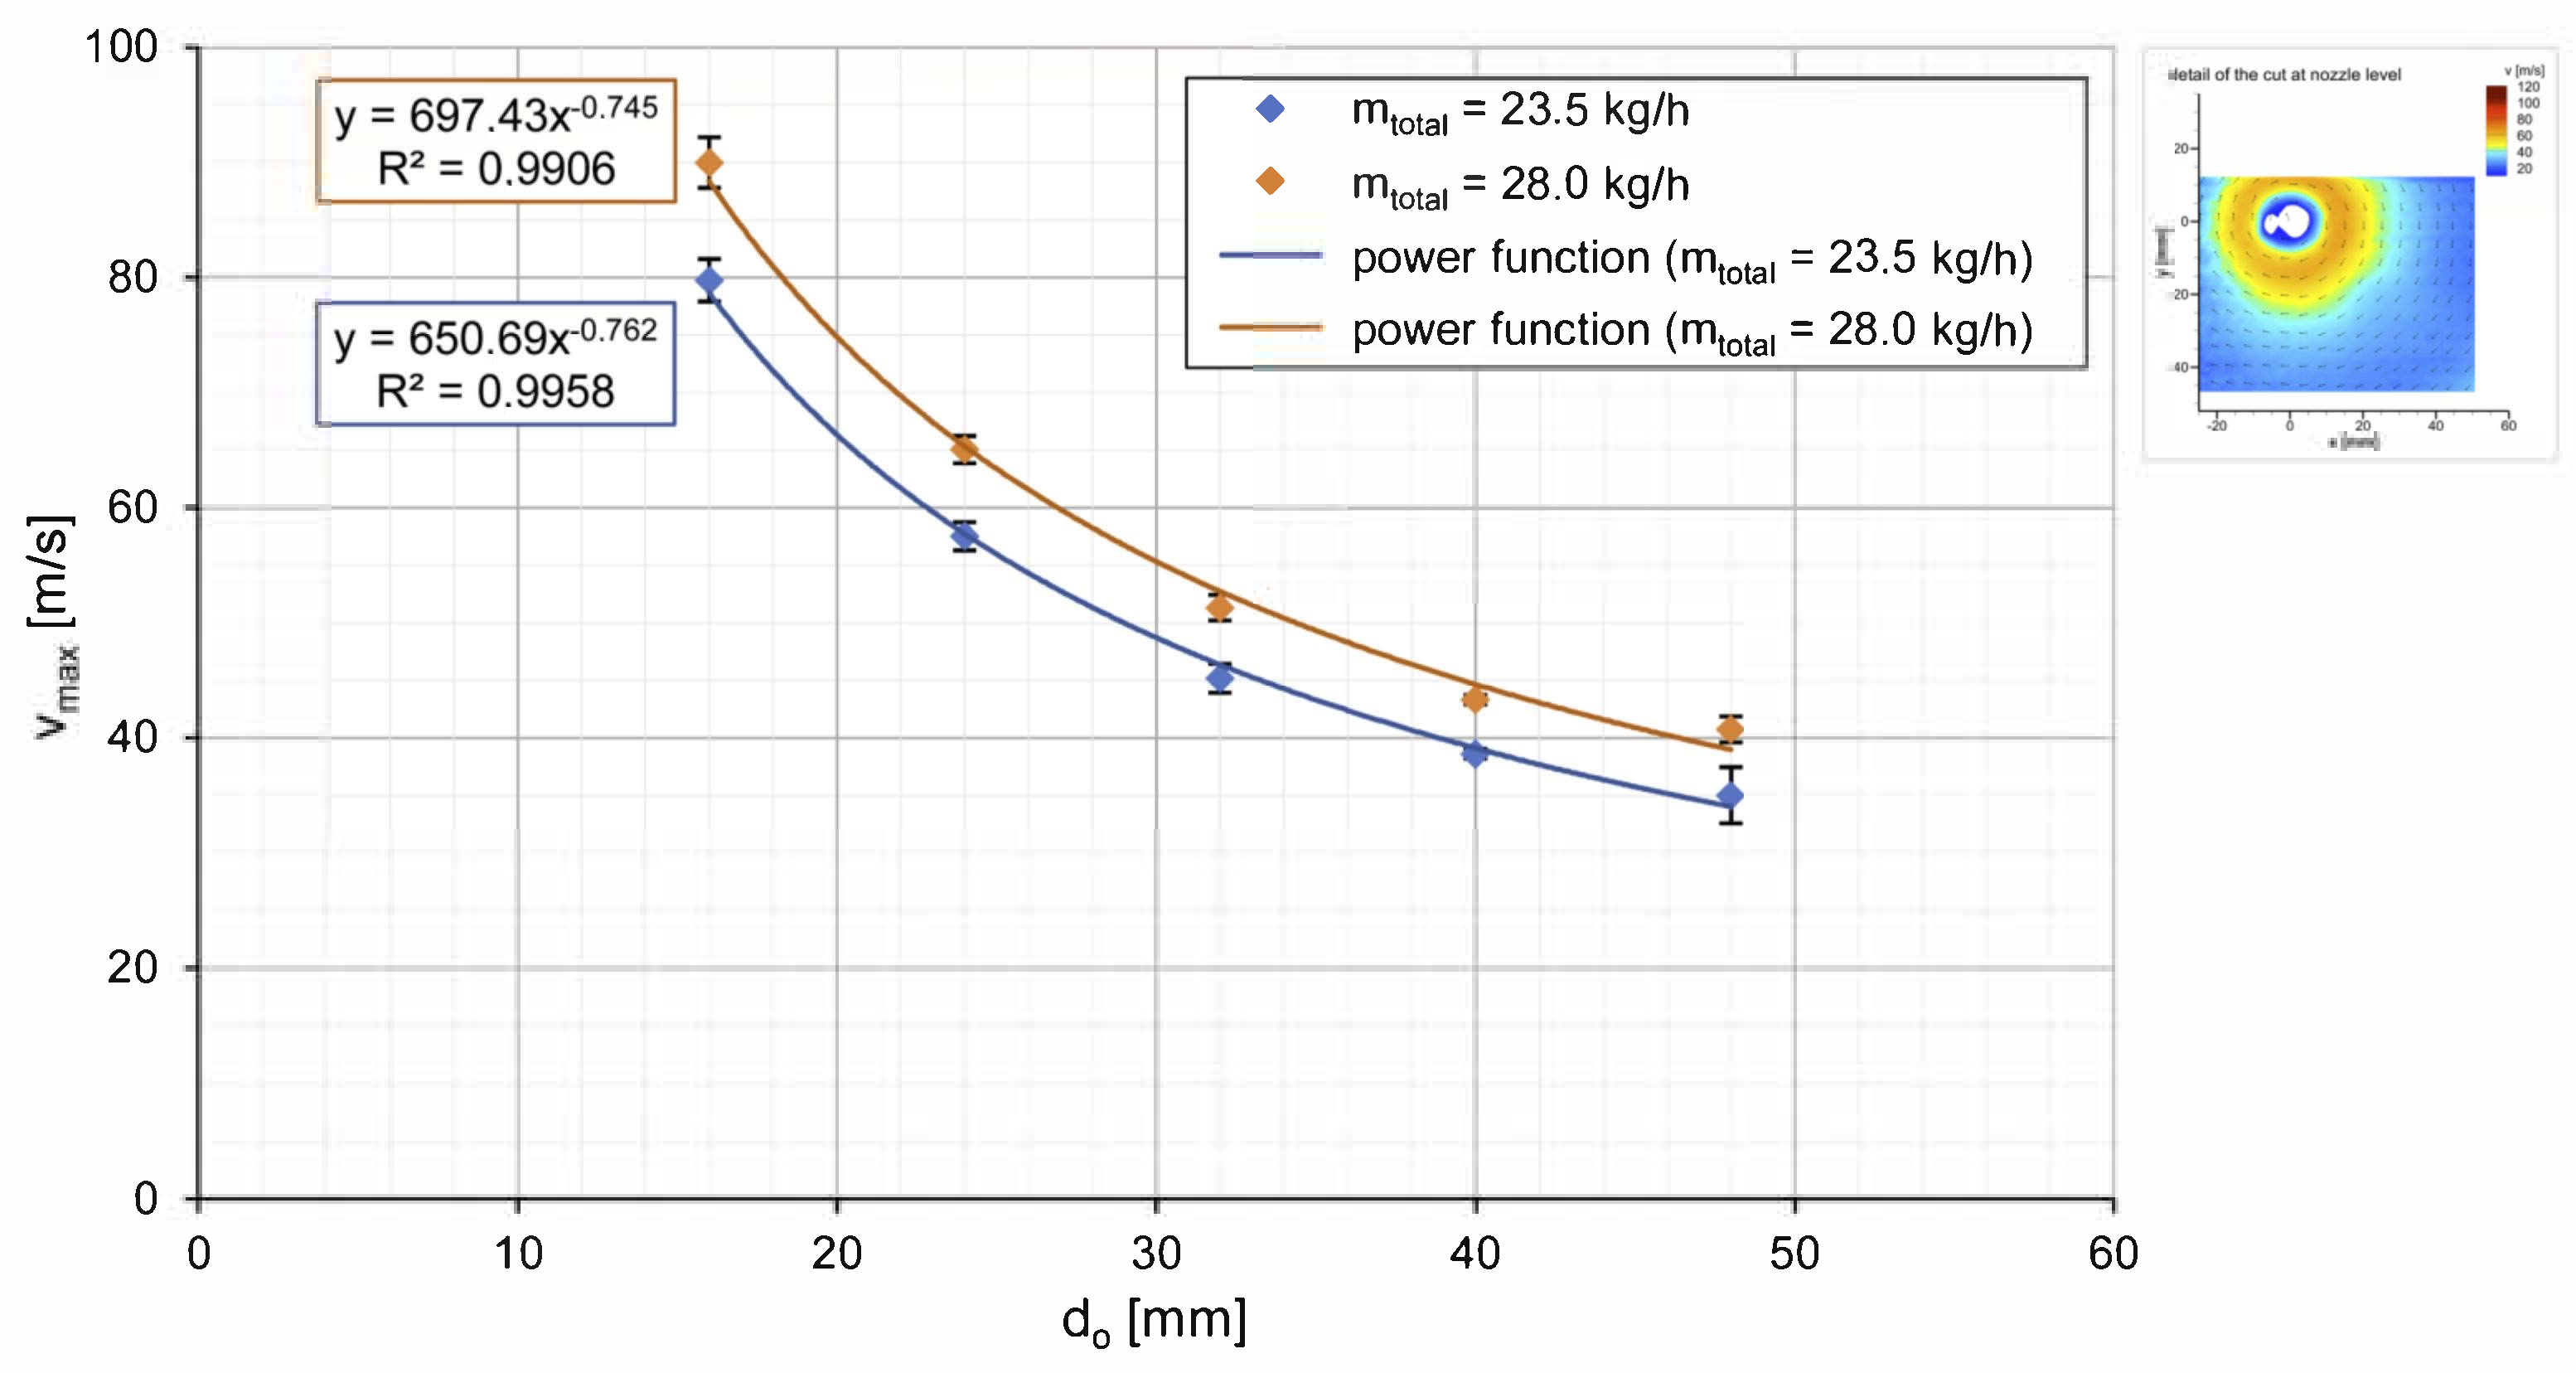
In order to describe the influence of the considered parameters on the flow profiles in the classifying zone more precisely, the maximum velocity of the grinding gas flow (v
max) in the inner area of the mill (r < 50 mm) at the nozzle level is examined and plotted against the product outlet diameter for both gas flow rates in
Figure 10, taking into account the standard deviations of the triple measurements. As could already be seen from the radial velocity profiles (cf.
Figure 8), the change in maximum velocity decreases with increasing outlet diameter. The measured values for both gas flow rates can be described by a monotonically decreasing power function with a correlation coefficient of R
2 > 0.99. A change in the grinding gas flow rate results in a parallel curve shift, evident from the very similar exponent of about −0.75.
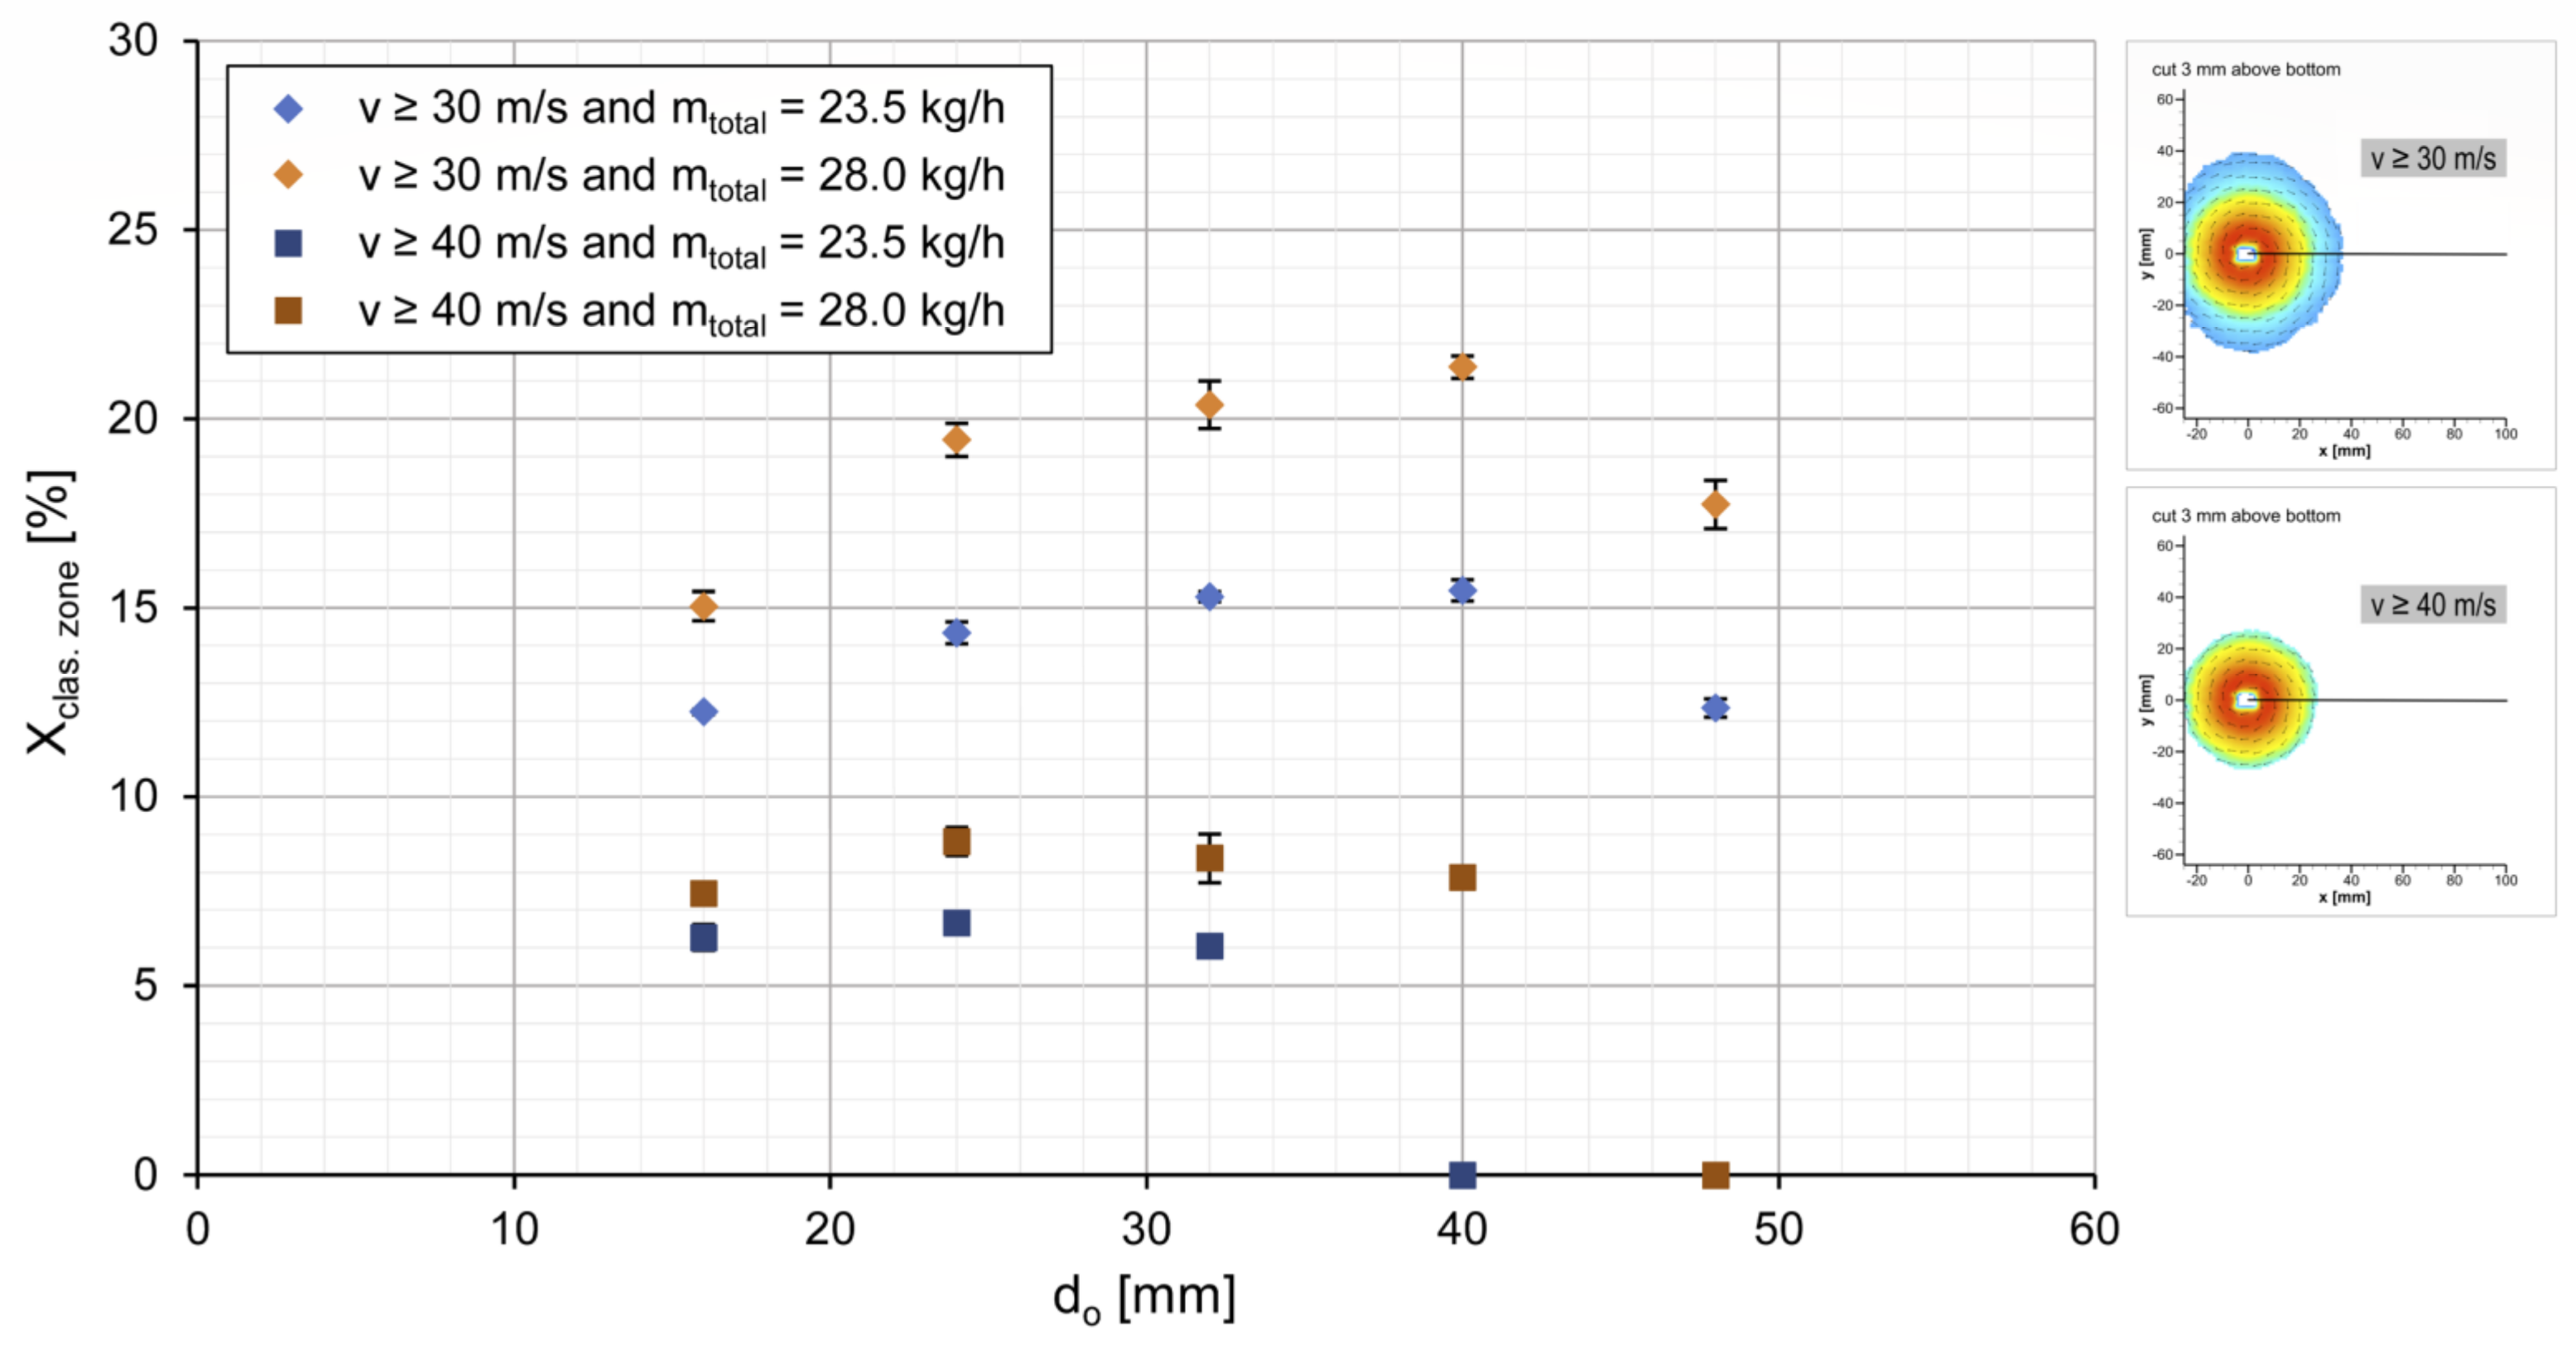
Concerning the efficiency of the classifying process, not only the maximum velocity in the product outlet area but also the size of the classifying zone is of interest. For this reason,
Figure 11 shows the fraction of the classifying zone in the total mill cross-section (X
clas. zone) as a function of the outlet diameter for two velocity sections (v ≥ 30 m s
−1 and 40 m s
−1, cf.
Figure 9), taking into account the standard deviations of the triple measurements. The area of the classifying zone is determined by the circular area of the horizontal radius at y = 0 for the respective velocity. Since the radial velocity profiles for an outlet diameter of d
o = 40 and 48 mm do partially not reach the defined border of v = 40 m s
−1 of the classifying zone (cf.
Figure 8), a second velocity section of v ≥ 30 m s
−1 including the transition zone is shown to map the whole variation range of the product outlet diameter.
Considering the data for a velocity of v ≥ 30 m s−1, it can be seen that the fraction of the classifying zone increases continuously with increasing outlet diameter up to a maximum of 21% for mtotal = 28.0 kg h−1 and 16% for mtotal = 23.5 kg h−1, respectively, for an outlet diameter of do = 40 mm before subsequently decreasing again. The course of the measured values results from the superposition of two opposing processes. On the one hand, the velocity in the area of the product outlet and, thus, the size of the classifying zone increases with declining outlet diameter due to the implications of the continuity equation. On the other hand, the backpressure of the grinding gas simultaneously increases the overpressure inside the grinding chamber with decreasing product outlet cross-section, decelerating the flow in the inner area of the mill and thus reducing the size of the classifying zone.
When looking at the data for the velocity section of v ≥ 40 m s−1, the same trend is obtained, with the exception that the maximum value shifts to a smaller outlet diameter of do = 24 mm due to the higher velocity that is only achieved in the closer surroundings of the product outlet. The maximum fraction of the classifying zone in the grinding chamber cross-section is only 9% for mtotal = 28.0 kg h−1 and 7% for mtotal = 23.5 kg h−1. Moreover, it can be seen that the flow velocity in the inner area of the mill is consistently below 40 m s−1 for an outlet diameter of do = 40 and 48 mm and a gas mass flow rate of mtotal = 23.5 kg h−1, resulting in a classifying zone fraction of 0% for the velocity section under consideration. The same applies to the higher gas flow rate of mtotal = 28.0 kg h−1 and the largest outlet diameter of do = 48 mm. This implies that if the product outlet cross-section is too large, a classifying zone can no longer be developed since the grinding gas is only slightly accelerated before it leaves the mill due to the implications of the continuity equation. This fact is an important finding with respect to the aim of improving the performance of the classifying process and, thus, the overall efficiency of industrial spiral jet mills.
3.5. Parameter Influences on the Comminution Zone and the Grinding Nozzle Jet
As mentioned in
Section 3.3, while analyzing the radial velocity profiles, the examined parameters affect not only the flow conditions in the classifying zone but also the properties of the comminution zone and the nozzle jet. However, since the determined velocity profiles (cf.
Figure 8) strongly depend on the positioning of the coordinate system in the flow fields, the characteristics of the comminution zone and the nozzle jet will be considered in more detail in the following.
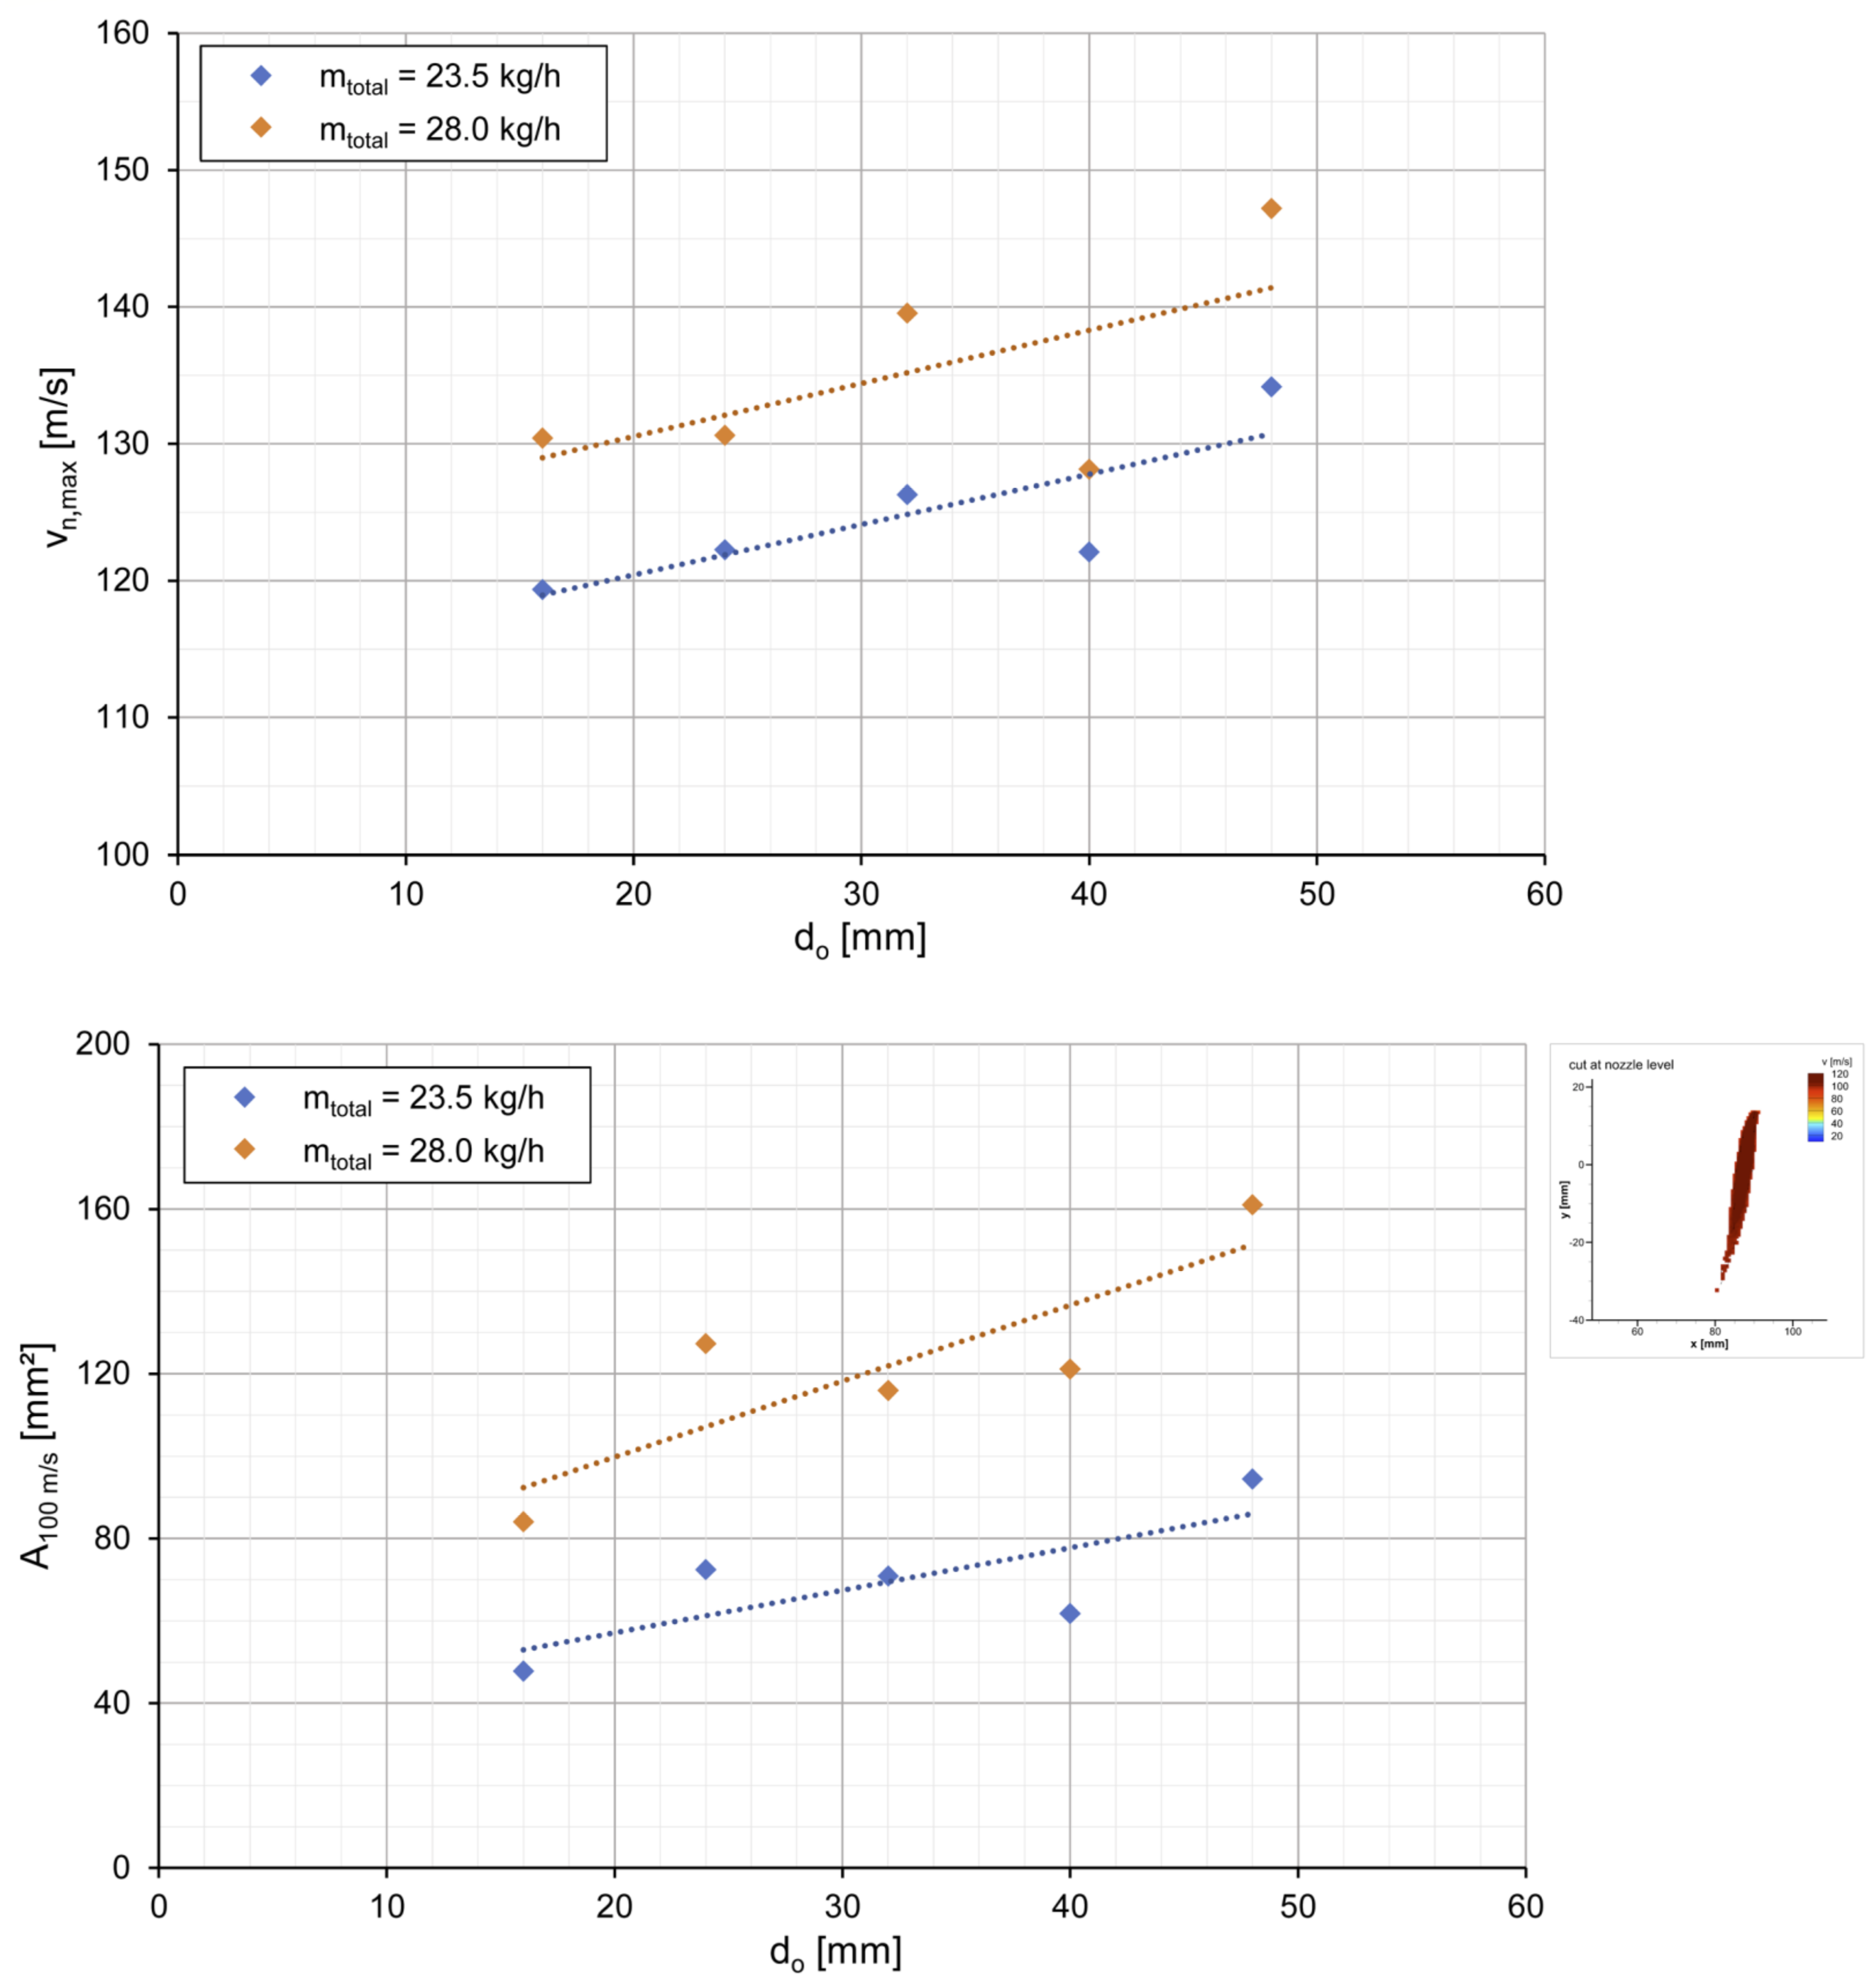
Figure 12 shows the maximum velocity in the nozzle jet (v
n,max) as well as the nozzle jet area for a velocity of v ≥ 100 m s
−1 (A
100 m/s) as a function of the product outlet diameter for both grinding gas flow rates. The section of v ≥ 100 m s
−1 is selected as a compromise between high flow velocities that only occur in the immediate area of the nozzle jet (cf.
Figure 8) and the measurement error that increases as the velocity ascends so that higher velocity sections are not appropriate to assess this nozzle jet property.
The maximum velocity ascends with increasing outlet diameter for both flow rates. Whereas with do = 16 mm, only velocities of up to 119 m s−1 at mtotal = 23.5 kg h−1 and 134 m s−1 at mtotal = 28.0 kg h−1 are achieved, the maximum velocity with an outlet diameter of do = 48 mm is 130 m s−1 at mtotal = 23.5 kg h−1 and 147 m s−1 at mtotal = 28.0 kg h−1. This corresponds in each case to an increase of about 13%. The increase in the grinding gas flow rate causes an average increase of the maximum velocity of about 9%.
The same trend is reflected by the size of the nozzle jet, which also ascends with increasing product outlet diameter. By enlarging the diameter from do = 16 mm to do = 48 mm, the nozzle jet area in the velocity section under consideration can also be extended from 48 mm2 to 95 mm2 at mtotal = 23.5 kg h−1 and from 84 mm2 to 161 mm2 at mtotal = 28.0 kg h−1, which corresponds to an increase of about 94%. The increase in gas mass flow rate causes an average increase of the nozzle jet size of about 75%.
These results also agree with the tendency towards higher velocities in the comminution zone with increasing outlet diameter, which were already apparent in the velocity fields (cf.
Figure 3,
Figure 4, and
Figure 6). Furthermore, this confirms the assumption that the increasing overpressure within the grinding chamber with decreasing outlet diameter not only leads to an overall deceleration of the flow but also prevents the complete formation of the nozzle jet, which is highly relevant for an effective comminution process. This results in a lower maximum velocity and a smaller nozzle jet area. In contrast, with larger product outlet diameters, the nozzle jet can accelerate unhinderedly and develop its full size, resulting in higher maximum velocities and nozzle jet areas.
However, the absolute values for the maximum velocity and the area of the nozzle jet for v ≥ 100 m s−1 have to be considered with caution since determining such high velocities with simultaneously high spatial resolution is complicated and depends on many factors. The determined values are, therefore, subject to a certain error and only represent a trend.
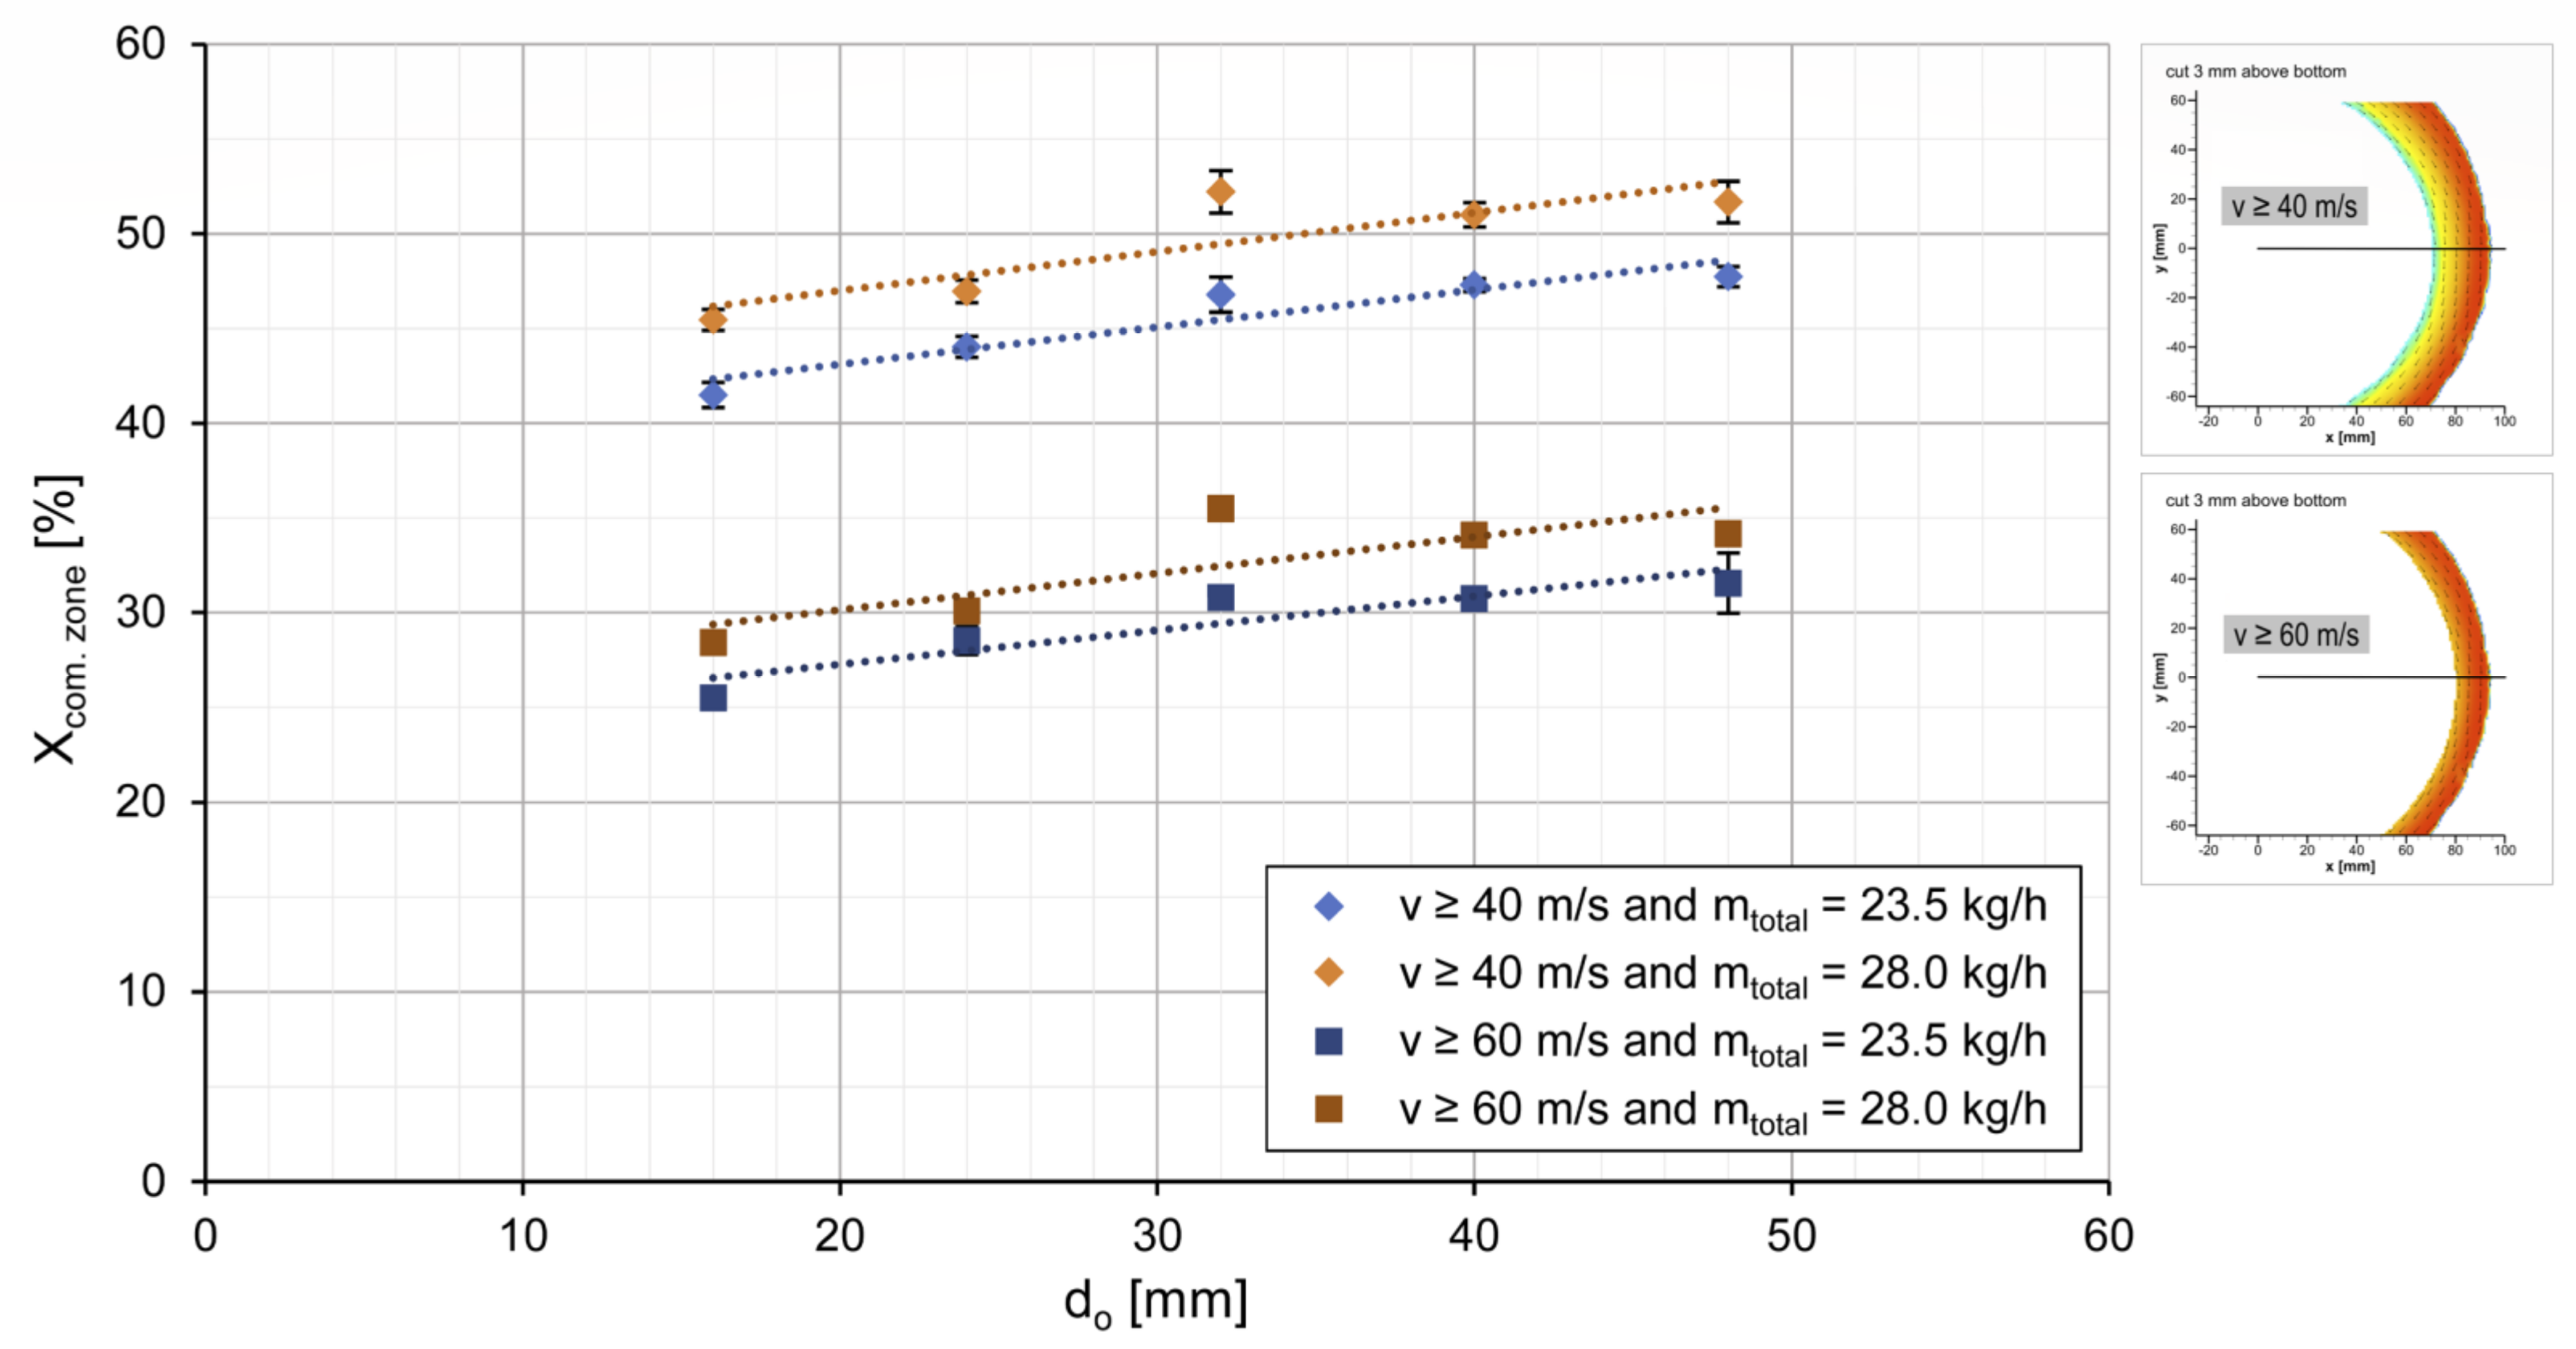
Concerning the efficiency of the comminution process, in addition to the properties of the grinding nozzle jet, the size of the comminution zone in the outer area of the mill is also of particular interest. For this reason,
Figure 13 shows the fraction of the comminution zone in the total mill cross-section (X
com. zone) as a function of the outlet diameter for the two characteristic velocity sections of the overall comminution zone and the more specific nozzle jet zone (v ≥ 40 m s
−1 and 60 m s
−1, cf.
Figure 9). The area of the comminution zone is determined analogously to the classifying zone (cf.
Figure 11) via the circular area of the horizontal radius at y = 0 for the respective velocity.
In the range under examination, the considered data reveal an enlargement of the comminution zone with increasing outlet diameter for both gas flow rates and velocity sections. When the diameter is changed from do = 16 mm to do = 48 mm, an ascent of about 14% can be achieved for v ≥ 40 m s−1 and an increase of about 22% for v ≥ 60 m s−1. The change in gas flow rate from mtotal = 23.5 kg h−1 to mtotal = 28.0 kg h−1 also results in an average increase in the fraction of the comminution zone in the grinding chamber cross-section of about 8 to 10%.
These results are also consistent with the correlation between the nozzle jet characteristics and the outlet diameter. Due to the acceleration of the flow, the tendency of increasing nozzle jet velocities not only leads to higher velocities in the outer area of the grinding chamber but also results in an increase in the size of the comminution zone. This fact is a relevant insight with regard to the aim of enhancing the efficiency and the comminution performance of industrial jet mill processes.
4. Conclusions
Within the scope of this work, the experimental measurement method for the complex and challenging determination of flow profiles within spiral jet mills based on particle image velocimetry was optimized to such an extent that the entire velocity field of the grinding gas flow can now be determined for all three considered levels (cover, bottom and nozzle level) almost without any restrictions, which enables a further quantitative evaluation of the flow profiles.
Both the product outlet diameter and the grinding gas flow rate significantly influence the flow conditions of the grinding gas in the spiral jet mill.
The smaller the outlet diameter is, the greater the velocity in the inner region of the grinding chamber and the better the classifying efficiency of the spiral jet mill becomes. However, if the outlet diameter is too small and depicts a “bottleneck”, an overpressure builds up in the grinding chamber due to the excessive backpressure of the grinding gas, leading to an overall deceleration of the flow. At the same time, this grinding gas backpressure also restricts the complete formation of the nozzle jets, as a result of which both the maximum velocity and the nozzle jet area decrease as the outlet diameter is reduced. Moreover, this also causes a decline in flow velocity in the outer region of the mill and, thus, a reduction in the size of the comminution zone. Accordingly, the grinding efficiency becomes worse the smaller the outlet diameter becomes. This indicates an optimum between the opposing comminution and classifying processes, which is in the range of the considered product outlet diameters.
In addition, there is a clear correlation between the flow conditions inside the spiral jet mill and the grinding gas flow rate. The ascent of the gas flow rate leads to an increase in the flow velocities in all zones and also in the nozzle jet. At the same time, this causes an enlargement of the comminution and classifying zones as well as a decrease in the size of the flow-calmed region. Both the comminution and the classifying efficiency thus improve as the grinding gas flow rate increases. However, this also leads directly to an increase in energy consumption, so the necessary gas mass flow rate always has to be adapted to the respective comminution task.
Therefore, the extensive investigations presented in this work not only represent a significant step in the further development of a sophisticated but extraordinarily precise and accurate measurement method for determining the velocity and flow fields in spiral jet mills; they also provide essential findings for the sustainable optimization of the associated comminution processes with the aim of reducing energy consumption, securing scale-up considerations, increasing grinding efficiency as well as enabling reproducibility of the comminution results and thus ensuring advanced product quality. This opens up significant potential for improvement of industrial jet mill processes, which are widely used in many industries and illustrate the application proximity and relevance of this paper.
In the future, PIV investigations of the particle motion of the grinding material will be carried out in order to investigate the influence of the solid particles on the fluid flow. In order to describe a more precise dependency of the flow profile on the grinding gas flow rate, further values of the mass flow rate are also to be considered. For a more precise description of the optimum between the comminution and classifying process, experimental grinding experiments are also planned for the same operating points investigated in this work. Moreover, it is to be examined whether the overpressure that builds up in the grinding chamber depending on the product outlet diameter and the operational parameters can be used as a criterion for setting optimal operating conditions of a spiral jet mill using a pressure measurement that is flush with the inside of the mill cover without disturbing the flow field. This could lead to design and operating recommendations as a guide for industrial users.


