Article

Stability of Silica Nanofluids at High Salinity and High Temperature

Department of Mechanical Engineering, Pontifícia Universidade Católica do Rio de Janeiro, Rio de Janeiro 100190, Brazil
*
Authors to whom correspondence should be addressed.
Powders 2023, 2(1), 1-20; https://doi.org/10.3390/powders2010001
Submission received: 17 November 2022 / Revised: 6 December 2022 / Accepted: 8 December 2022 / Published: 28 December 2022

Abstract

:
Nanoparticles have shown great potential in many sectors of the oil and gas industry, including enhanced oil recovery (EOR). They can be used to improve water flooding by altering the wettability of the porous medium, reducing the interfacial tension, blocking pores, or preventing asphaltene precipitation. Ensuring the stability of nanofluids injected into reservoirs is essential and a great challenge. However, high temperature favors particle collisions and high salinity (ionic strength) decreases electrostatic repulsion between particles. Therefore, nanofluids are extremely unstable at reservoir conditions. In this paper, we investigated the effects of electrolytes (brine and seawater) and temperature (up to 80 °C) on the stability of silica nanofluids. The nanofluids are characterized by dynamic light scattering (size), turbidity (stability), and zeta potential (electrostatic repulsions). One solution to increase the stability is to compensate for the loss of repulsive forces due to salts in the solution through increased electrostatic and/or steric repulsions by changing the pH of the base fluid. At high ionic strength (42 g/L NaCl and seawater), the stability of 0.1 and 0.5 wt% silica nanofluids at basic pH is about one day, regardless of temperature. In contrast, at pH 1.5, the nanofluids have a stability of at least three weeks at 80 °C. The results obtained with base fluids containing divalent cations confirmed their more destabilizing effect. This study confirmed that it is possible to stabilize silica nanofluids beyond one month at reservoir conditions just by lowering the pH near the isoelectric point.

Graphical Abstract

1. Introduction

Laboratory- and pilot-scale studies have shown that nanotechnology has great potential in many sectors of the oil and gas industry, including enhanced oil recovery (EOR) [1,2]. Nanofluids can be used to improve the water injection process by altering the wettability of the porous medium, reducing the interfacial tension between the oil and the injected fluid, diverting the flow to unswept areas, or preventing asphaltene precipitation [2,3,4]. Currently, ensuring the stability of nanofluids is critical and a great challenge for many operations [5]. The formulation of the nanofluid (particle type, concentration, dispersants, etc.) must ensure stability (dispersion, low particle agglomeration) and absence of chemical changes from the preparation to flow in the reservoir [6].
A nanofluid is a colloidal dispersion of nanoparticles (solid phase) in a base fluid (liquid phase). Its stability is determined by the nature of the interactions between the particles. Because the surface-to-volume ratio of the particles is so high, short-range forces, such as van der Waals attraction, and surface forces govern every interaction [7]. Due to their Brownian motion, nanoparticles that come into contact with one another tend to stay together due to attractive forces, unless a longer-range repulsive force acts to keep the particles apart. Classical DLVO theory solely takes electrostatic repulsion into account, while the system may also be subject to steric repulsion and solvation forces [8,9].
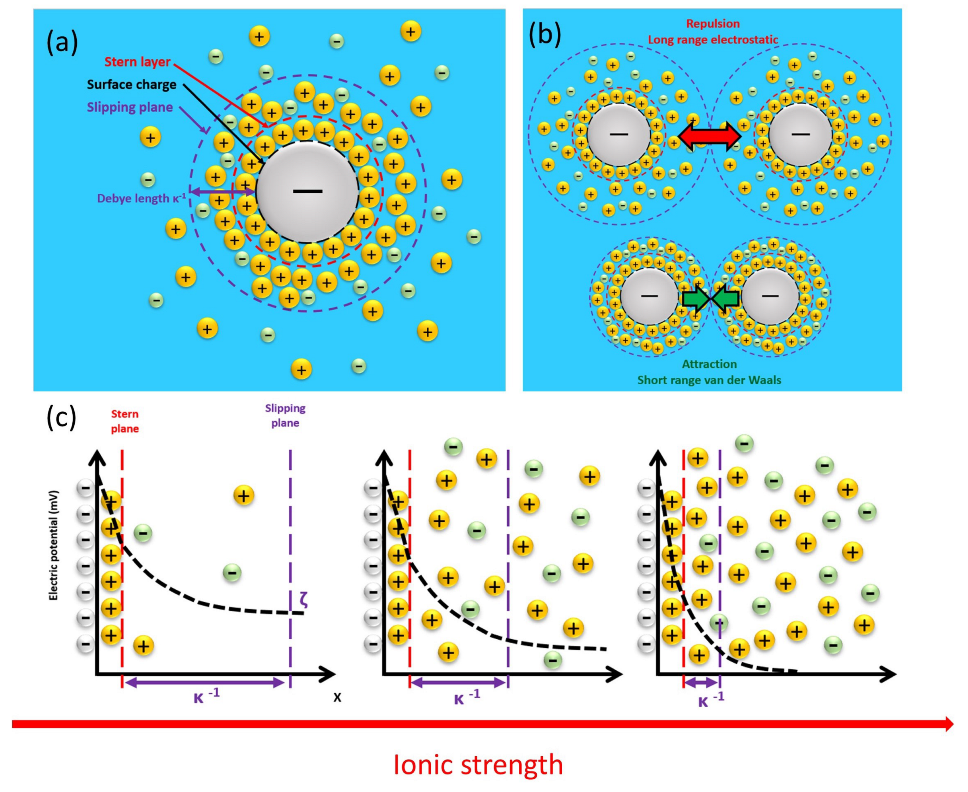
Electrostatic repulsion is the result of the interaction between the electrical double layers surrounding the nanoparticles. When a charged surface is exposed to a liquid, a structure known as the electrical double layer appears on its surface (Figure 1a). The first layer, called the Stern layer, is composed of counterions adsorbed onto the surface due to chemical interactions. The second layer is composed of ions attracted to the surface charge via Coulomb forces, thus electrically screening the first layer. This second layer is loosely associated with the surface and is therefore called the diffuse layer. With increasing distance from the nanoparticle, the high concentration of counterions within the diffuse layer progressively decreases until equilibrium is reached with the ion concentration in the bulk of the solvent. When the separation of the charged nanoparticles becomes less than twice the double-layer extension, the electrical double layers begin to overlap and repulsion occurs as the individual double layers can no longer expand without restriction [10]. The length of the electric double layer κ 1 is called the Debye length. A larger nanoparticle surface charge and a longer Debye length lead to an increased stability of the nanoparticles in aqueous solution (Figure 1b) [11,12].
However, the Debye length decreases as the ionic strength increases due to the high concentration of ions adsorbed on the particle surface and the compression of the layer (Figure 1c) [
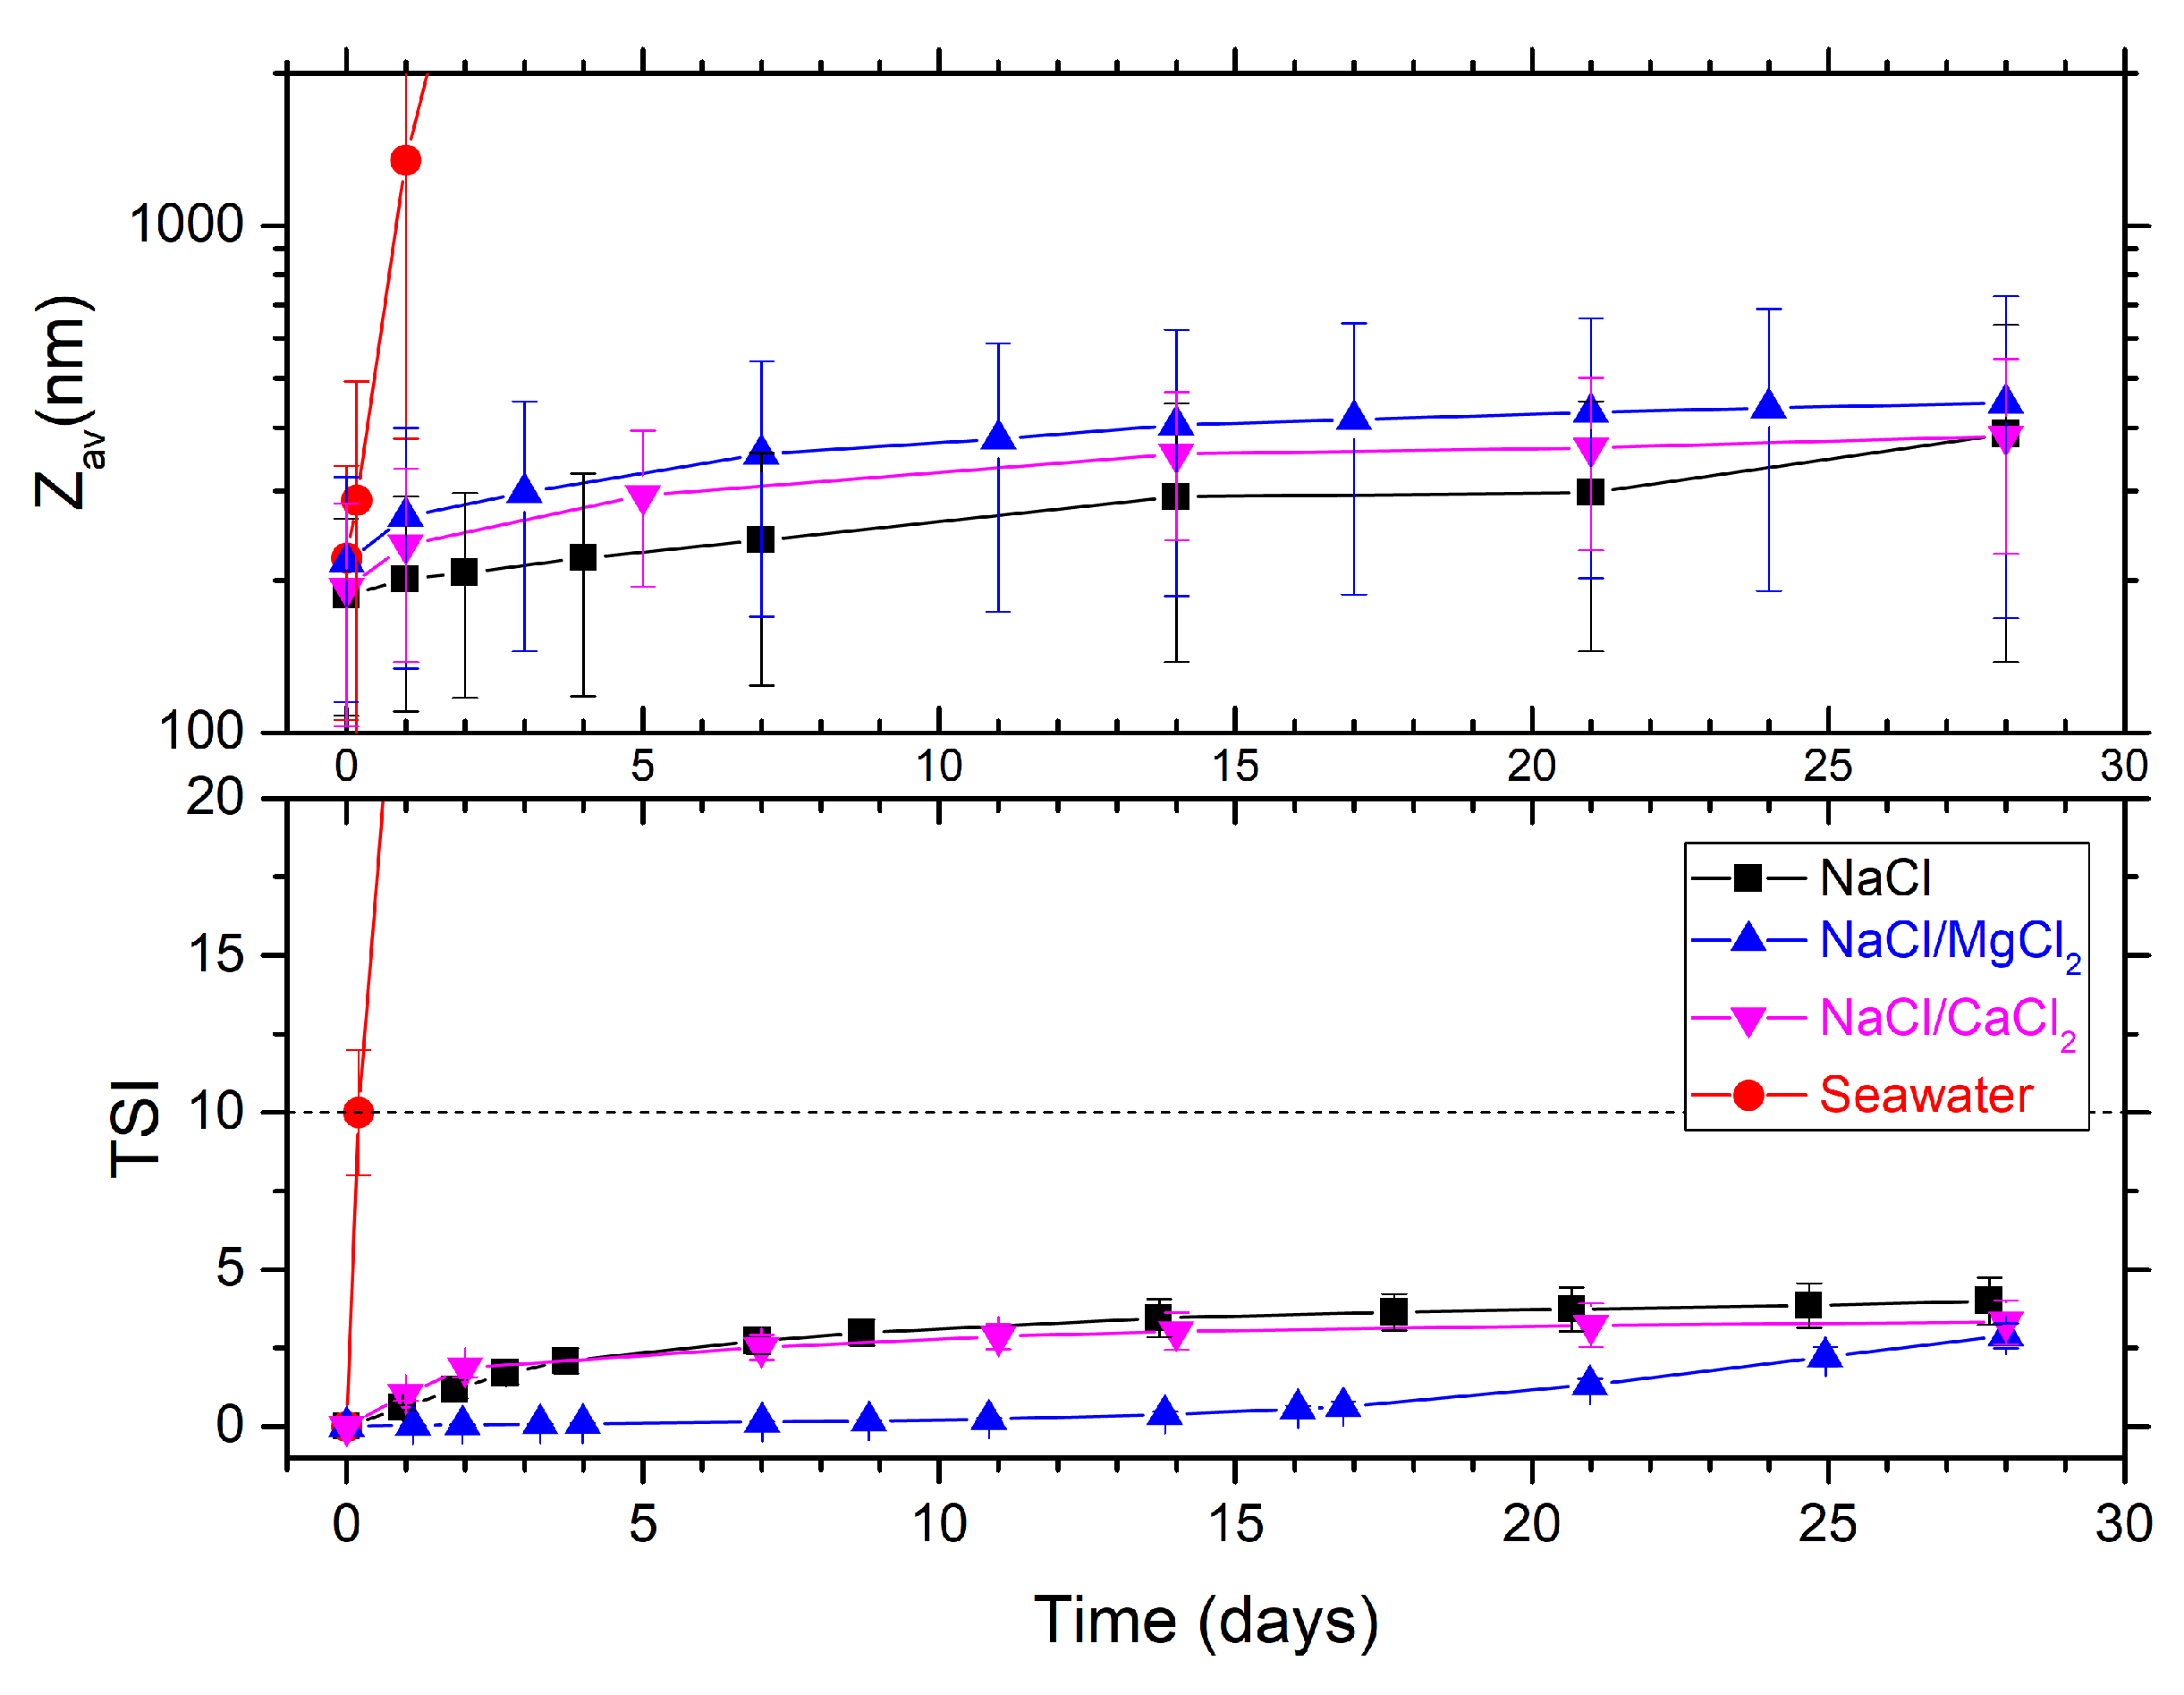
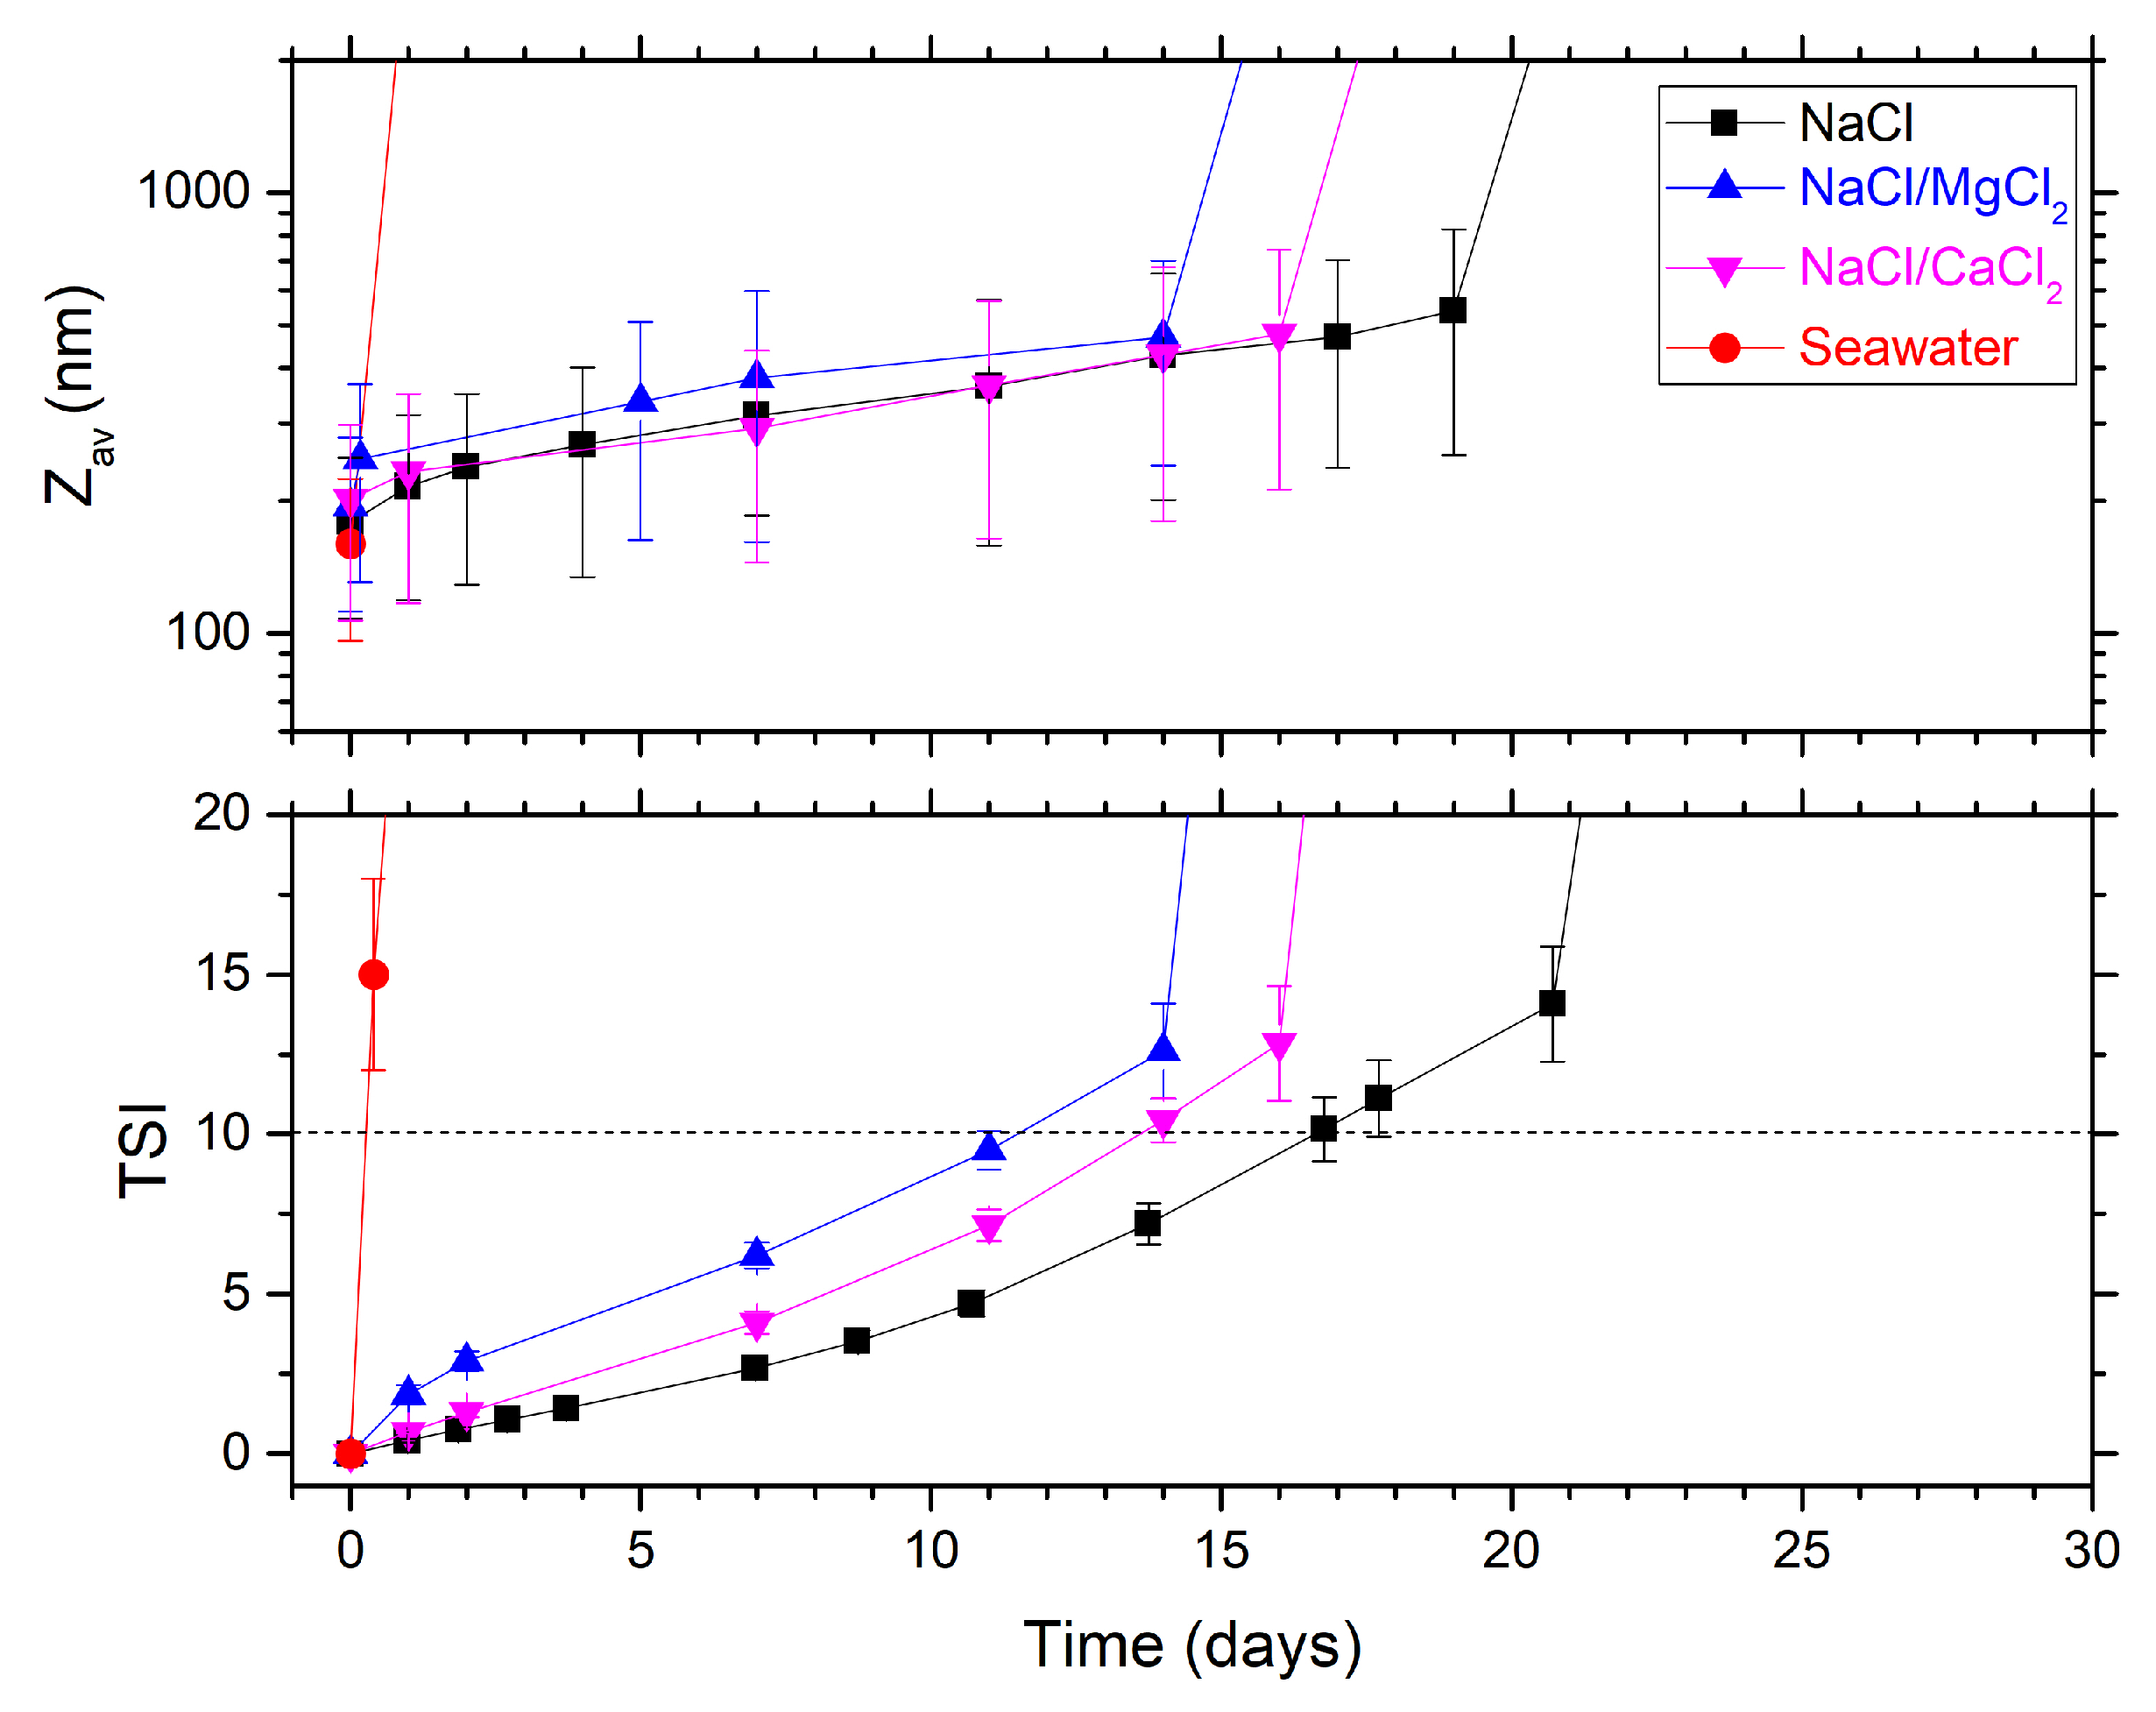
13]. The counterions in electrolytes have a screening effect, which reduces the electrostatic repulsion by offsetting the surface charges. The type of salt and its divalence are key parameters for the stability of the nanofluids: multivalent salts have a stronger shielding effect than monovalent salts. For example, nanoparticles in contact with seawater are always more unstable than N a C l brine because it contains monovalent and multivalent salts ( M g 2 + , C a 2 + , S r 2 + , …).
Although silica nanoparticles have been extensively studied and their efficacy in EOR processes is well established [14,15,16], the applications of hydrophilic silica nanoparticles are constrained because of the ease with which they aggregate due to their highly energetic hydrophilic surfaces [17]. Moreover, the reservoir conditions of high temperature and high salinity (ionic strength) favor nanofluid instability. Although Brownian motion is independent of the nature of the particle, it depends on the size of the particles and the viscosity of the base fluid. The motion becomes faster at higher temperature, favoring collisions between particles, and at high salinity, the repulsive forces are not strong enough to prevent aggregation. For successful EOR application, the long-term stability of nanoparticles under harsh reservoir conditions is essential.
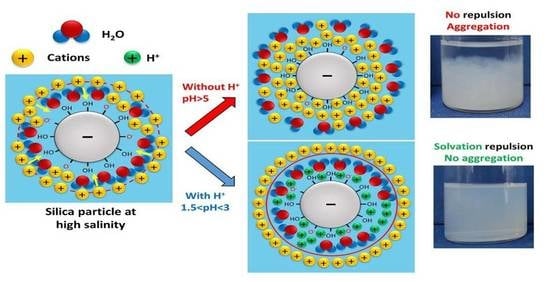
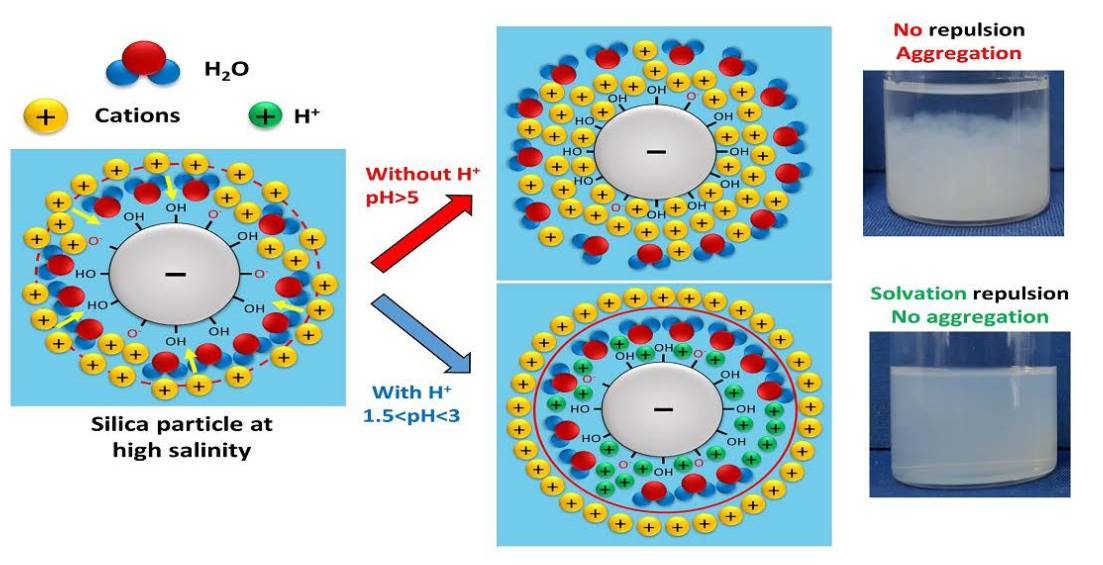
One solution to increase the stability of nanofluids at reservoir conditions is to compensate for the loss of repulsive forces due to electrolytes in the solution by increasing electrostatic and steric repulsions through the modification of the pH of the base fluid. The protonation/deprotonation capacity of a nanoparticle’s surface is a crucial factor in the charge transfer between the particle and the solvent in an aqueous solution. The relative basicity or acidity of the solvent to the particle dictates the direction of proton transfer [18,19]. For silica nanoparticles, there are two protonation reactions:
S i O H S i O + H +
S i O H 2 + S i O H + H +
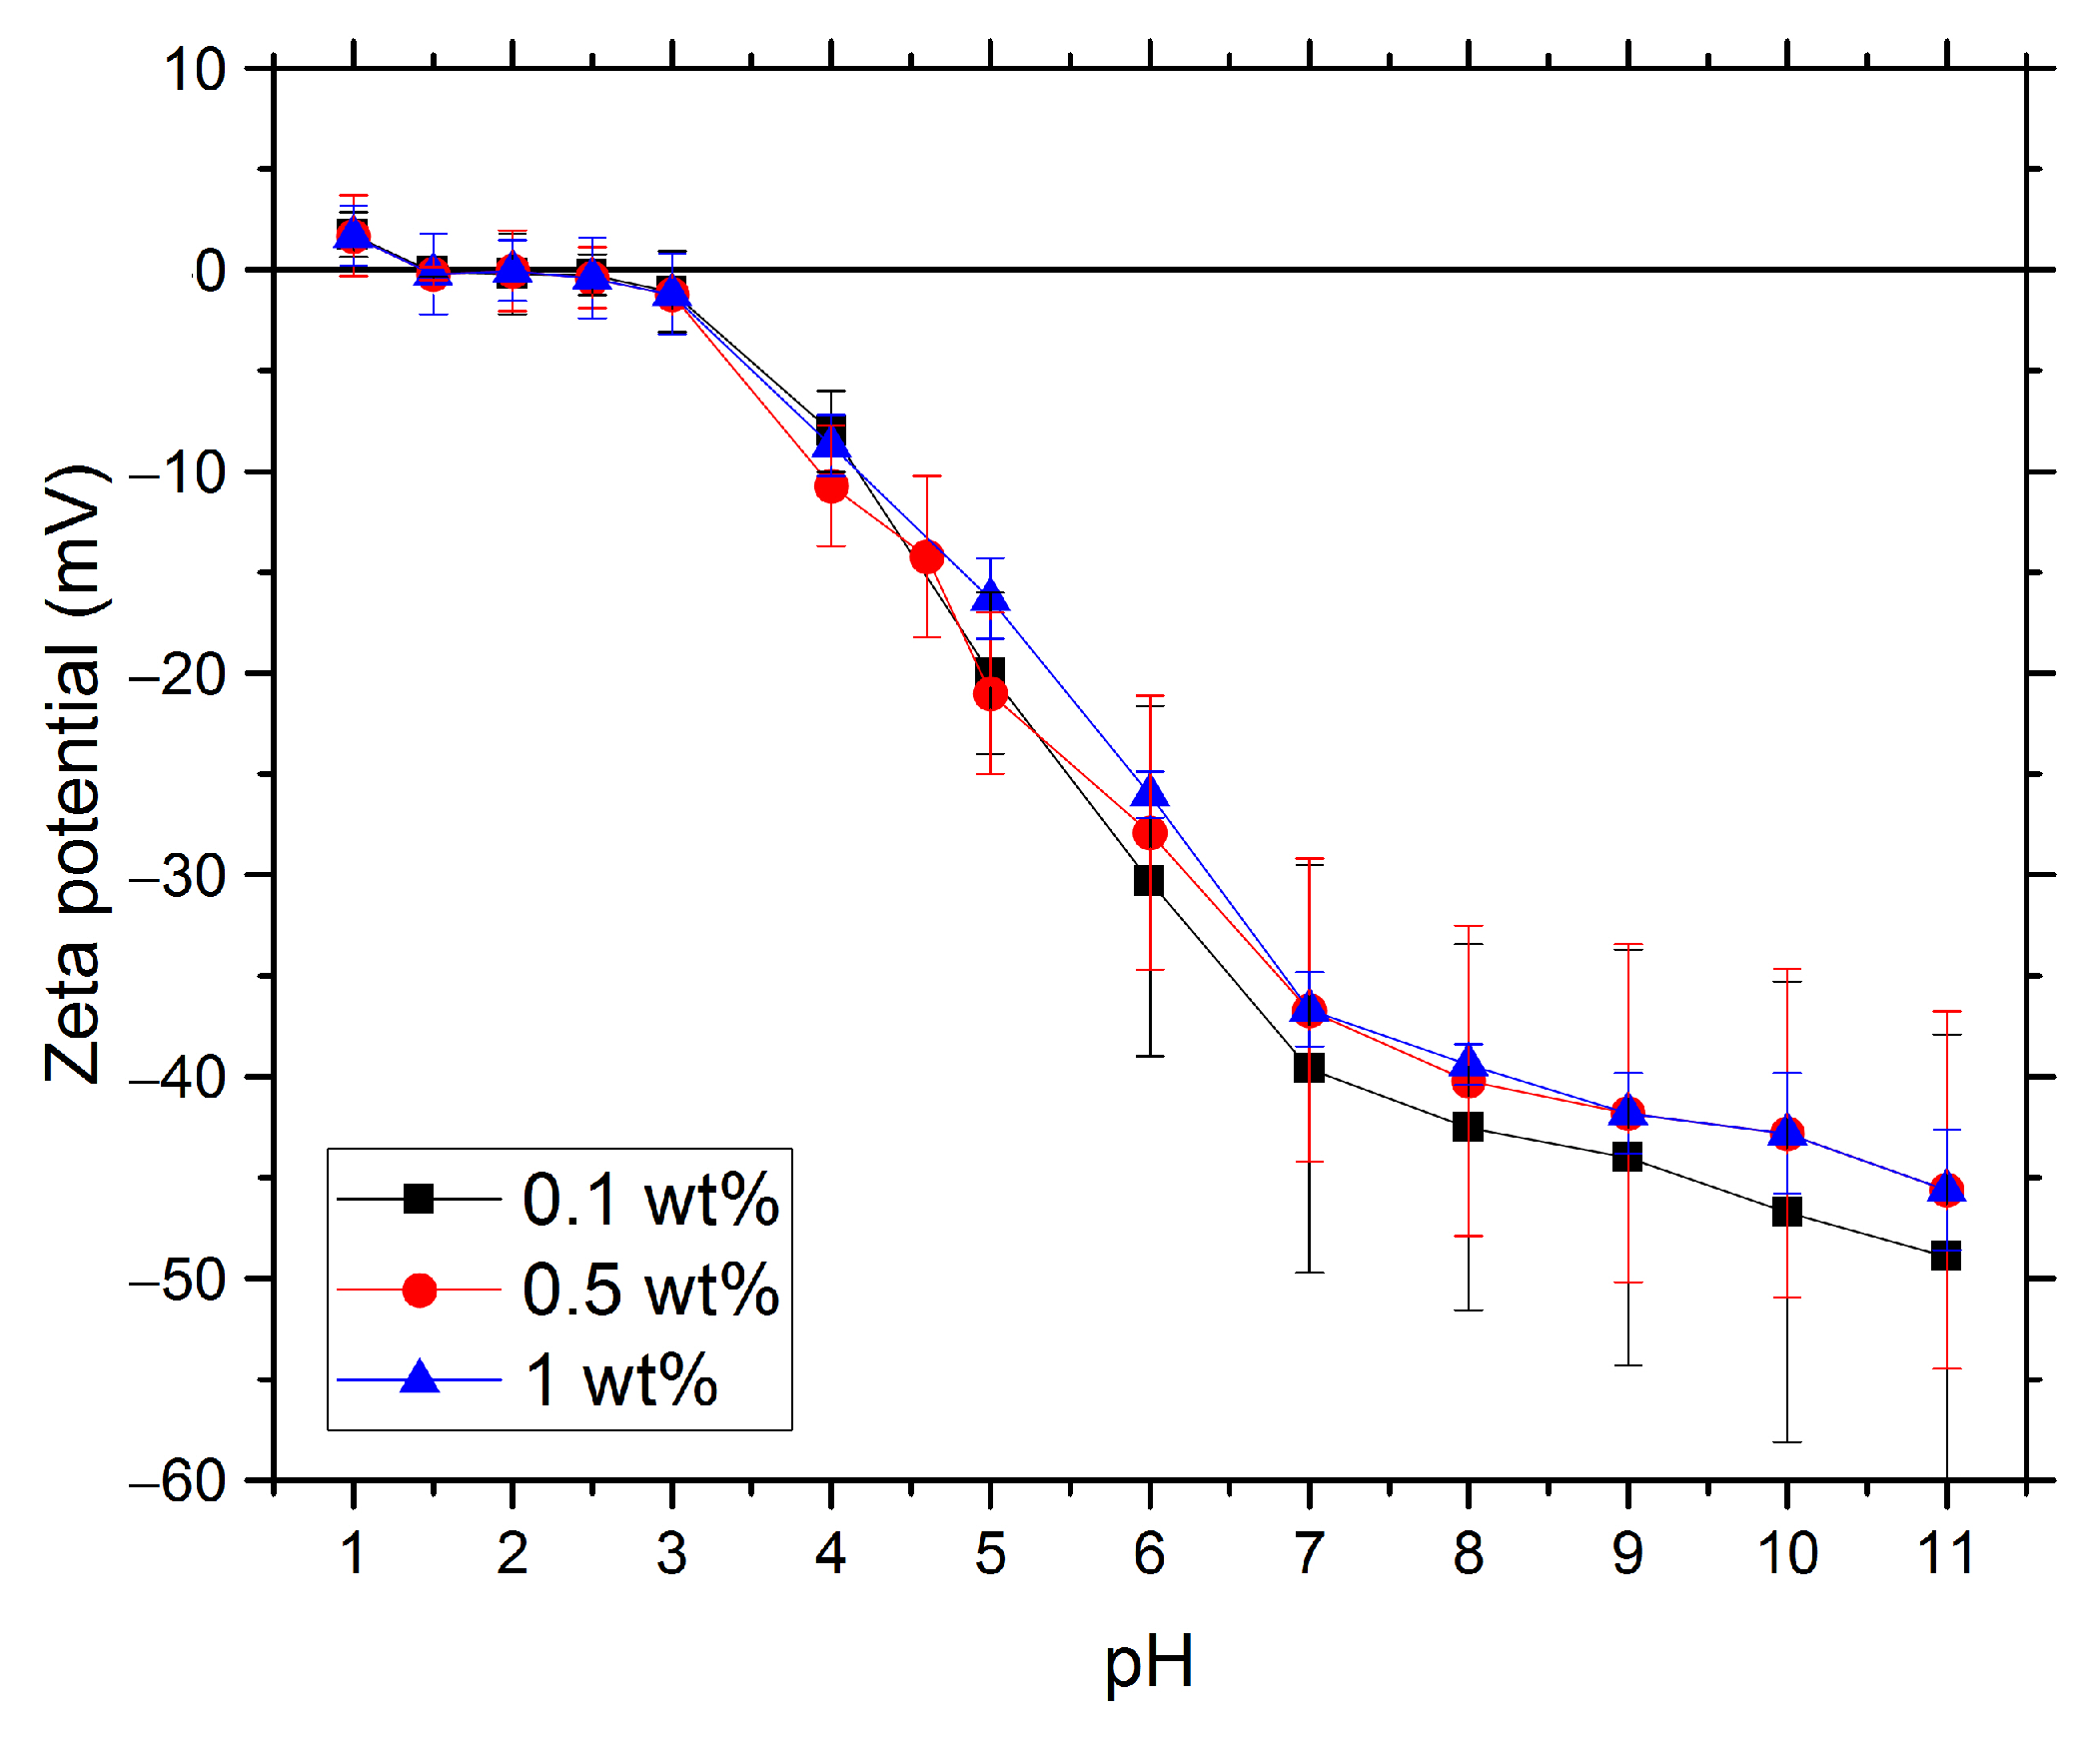
For each system, there is a pH value at which the potential at the slipping plane (close to the Stern layer), called the zeta potential (ZP), which surrounds the particle, takes a value of zero. This pH is known as the isoelectric point (IEP) and is measured by electrophoretic light scattering [19]. Consequently, to prepare electrostatically repelling suspensions, pH values away from the IEP are required. The IEP of hydrophilic silica is between 2 and 3.5 [9,20,21,22,23]. Above the IEP, the zeta potential is negative, and as the pH increases towards 8, it decreases rapidly as S i O groups appear on the particle surface. As the pH increases from 8 to 12, the changes in zeta potential are less pronounced due to the large amount of ions present in the solution. The zeta potential of the suspension in these pH ranges varied between −30 and −70 mV, which is low enough to electrostatically stabilize the systems in the absence of electrolytes.
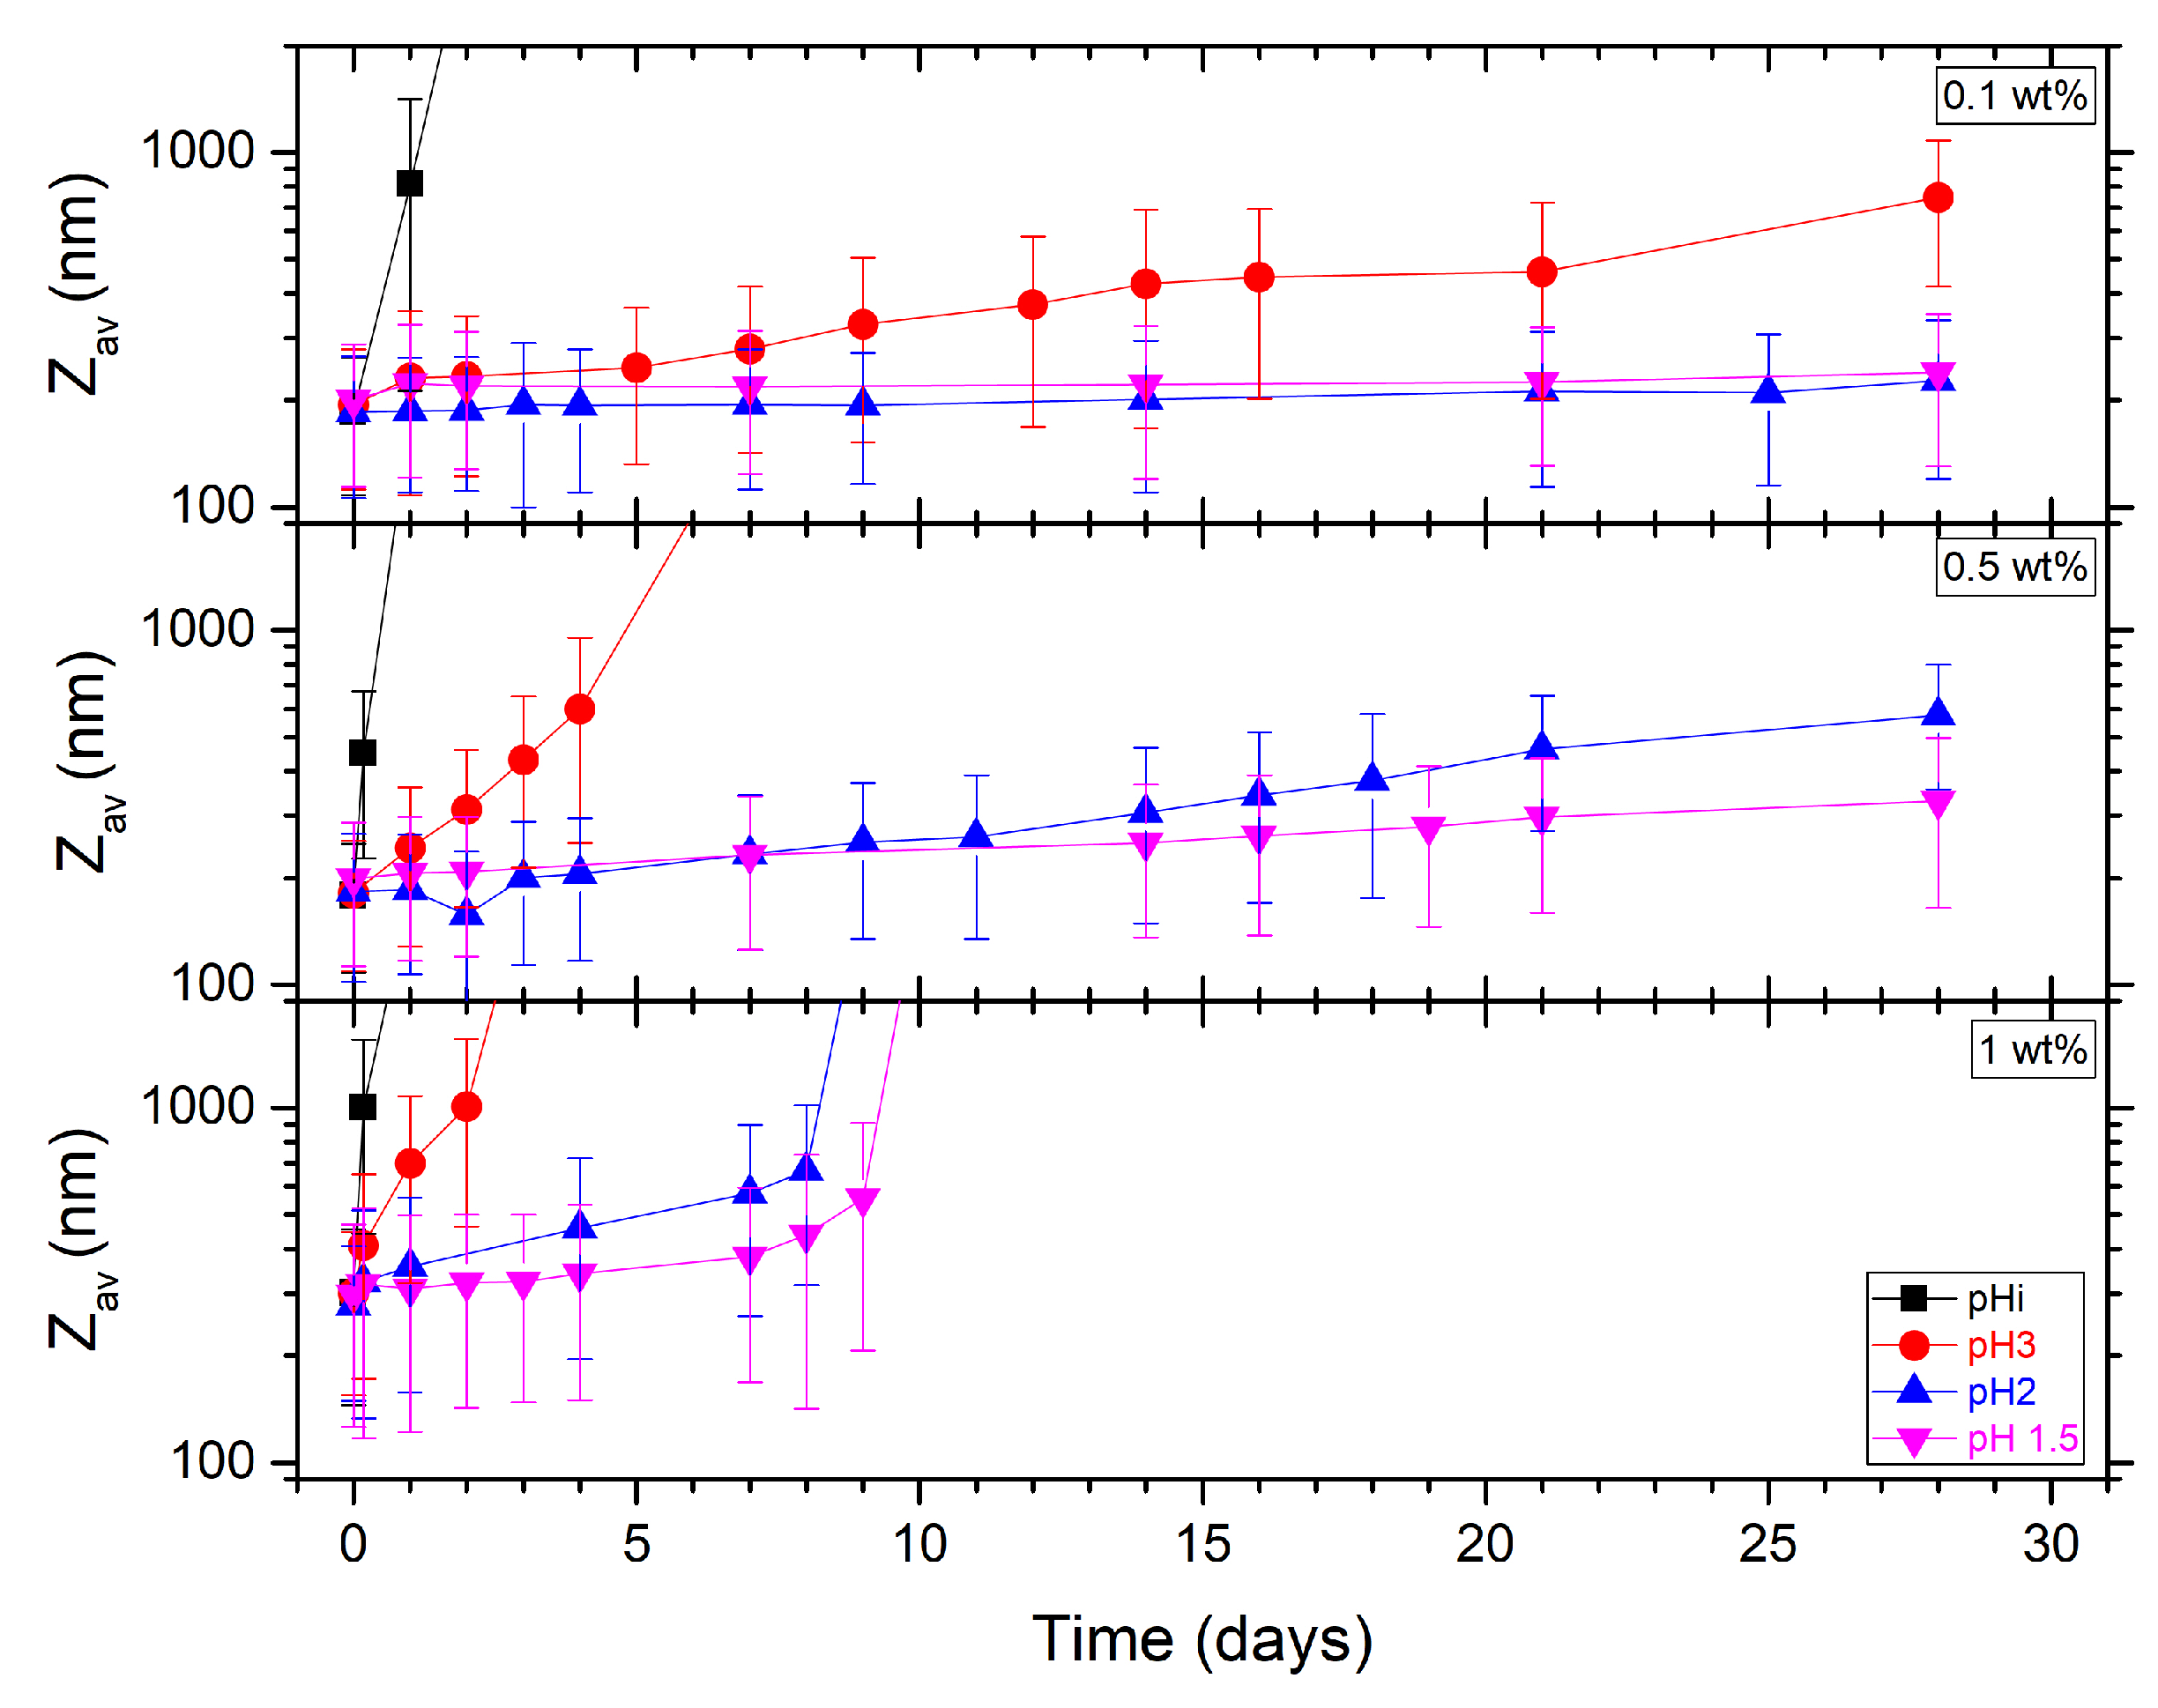
For this particular system of hydrophilic silica, some authors [9,20,22,24,25] have noticed an abnormal stability at low pH values close to the IEP, which contrasts with that predicted by the classical DLVO theory [26]. This means that there is another short-range repulsive force that is not accounted for in the theory. This force appears as a consequence of the particle hydration due to the ability of silanol groups ( S i O H ) to form hydrogen bonds with water [27]. The hydration force, which acts as a potent short-range repulsive force between two polar surfaces separated by a thin layer of water, diminishes nearly exponentially at decay lengths of around 1 nm [28]. This repulsion can be considerable for hydrophilic nanoparticles in the presence of electrolytes [29,30].
The effectiveness of silica nanofluids for EOR applications relies on their dispersibility and ability to resist agglomeration during transport through the reservoir for long periods of time at extreme salinities (>10,000 ppm) and high temperatures (up to 150 °C) [5]. Studies have shown that silica nanoparticles are extremely unstable in seawater and concentrated ionic solutions containing divalent ions, such as M g 2 + , C a 2 + , and B a 2 + [9,23]. Recently, Sofla et al. proposed a theory based on “ H + protection”, which consists of the addition of H C l to stabilize silica nanoparticles in seawater at 25 °C [9]. The results of this study demonstrate that the size of the nanoparticles in seawater directly relates to their concentration, which is inverse to the H C l content.
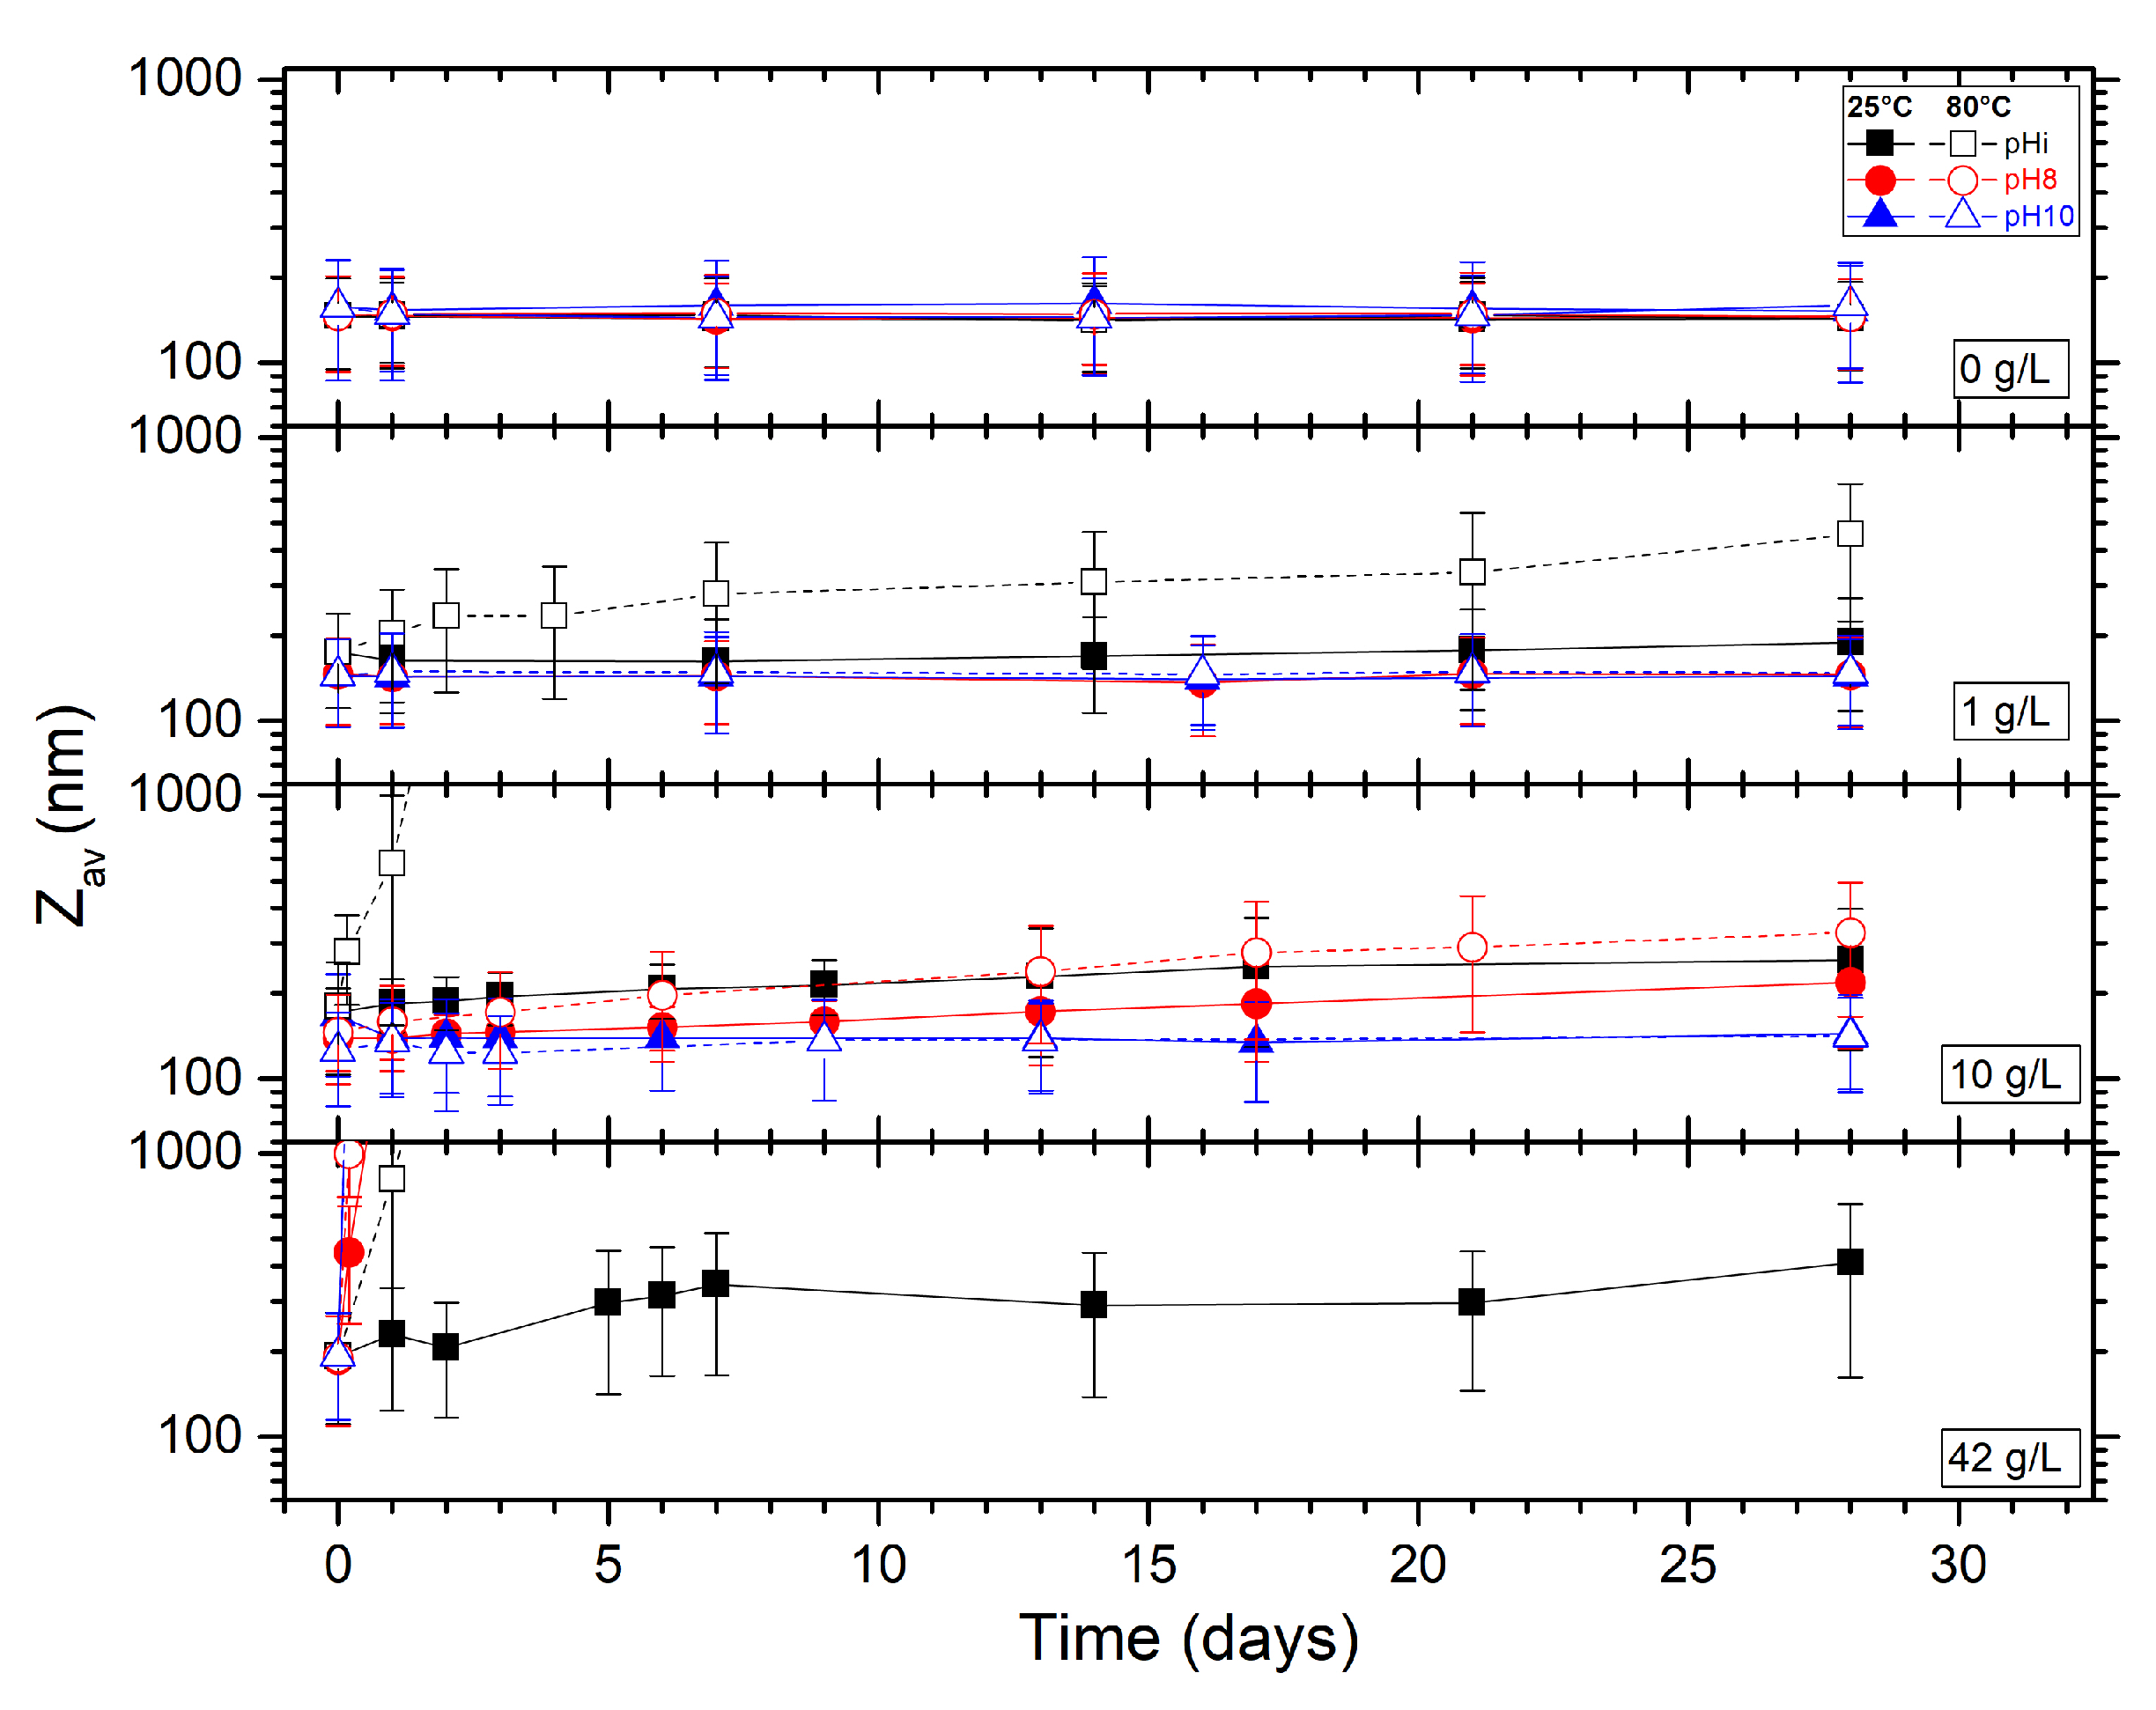
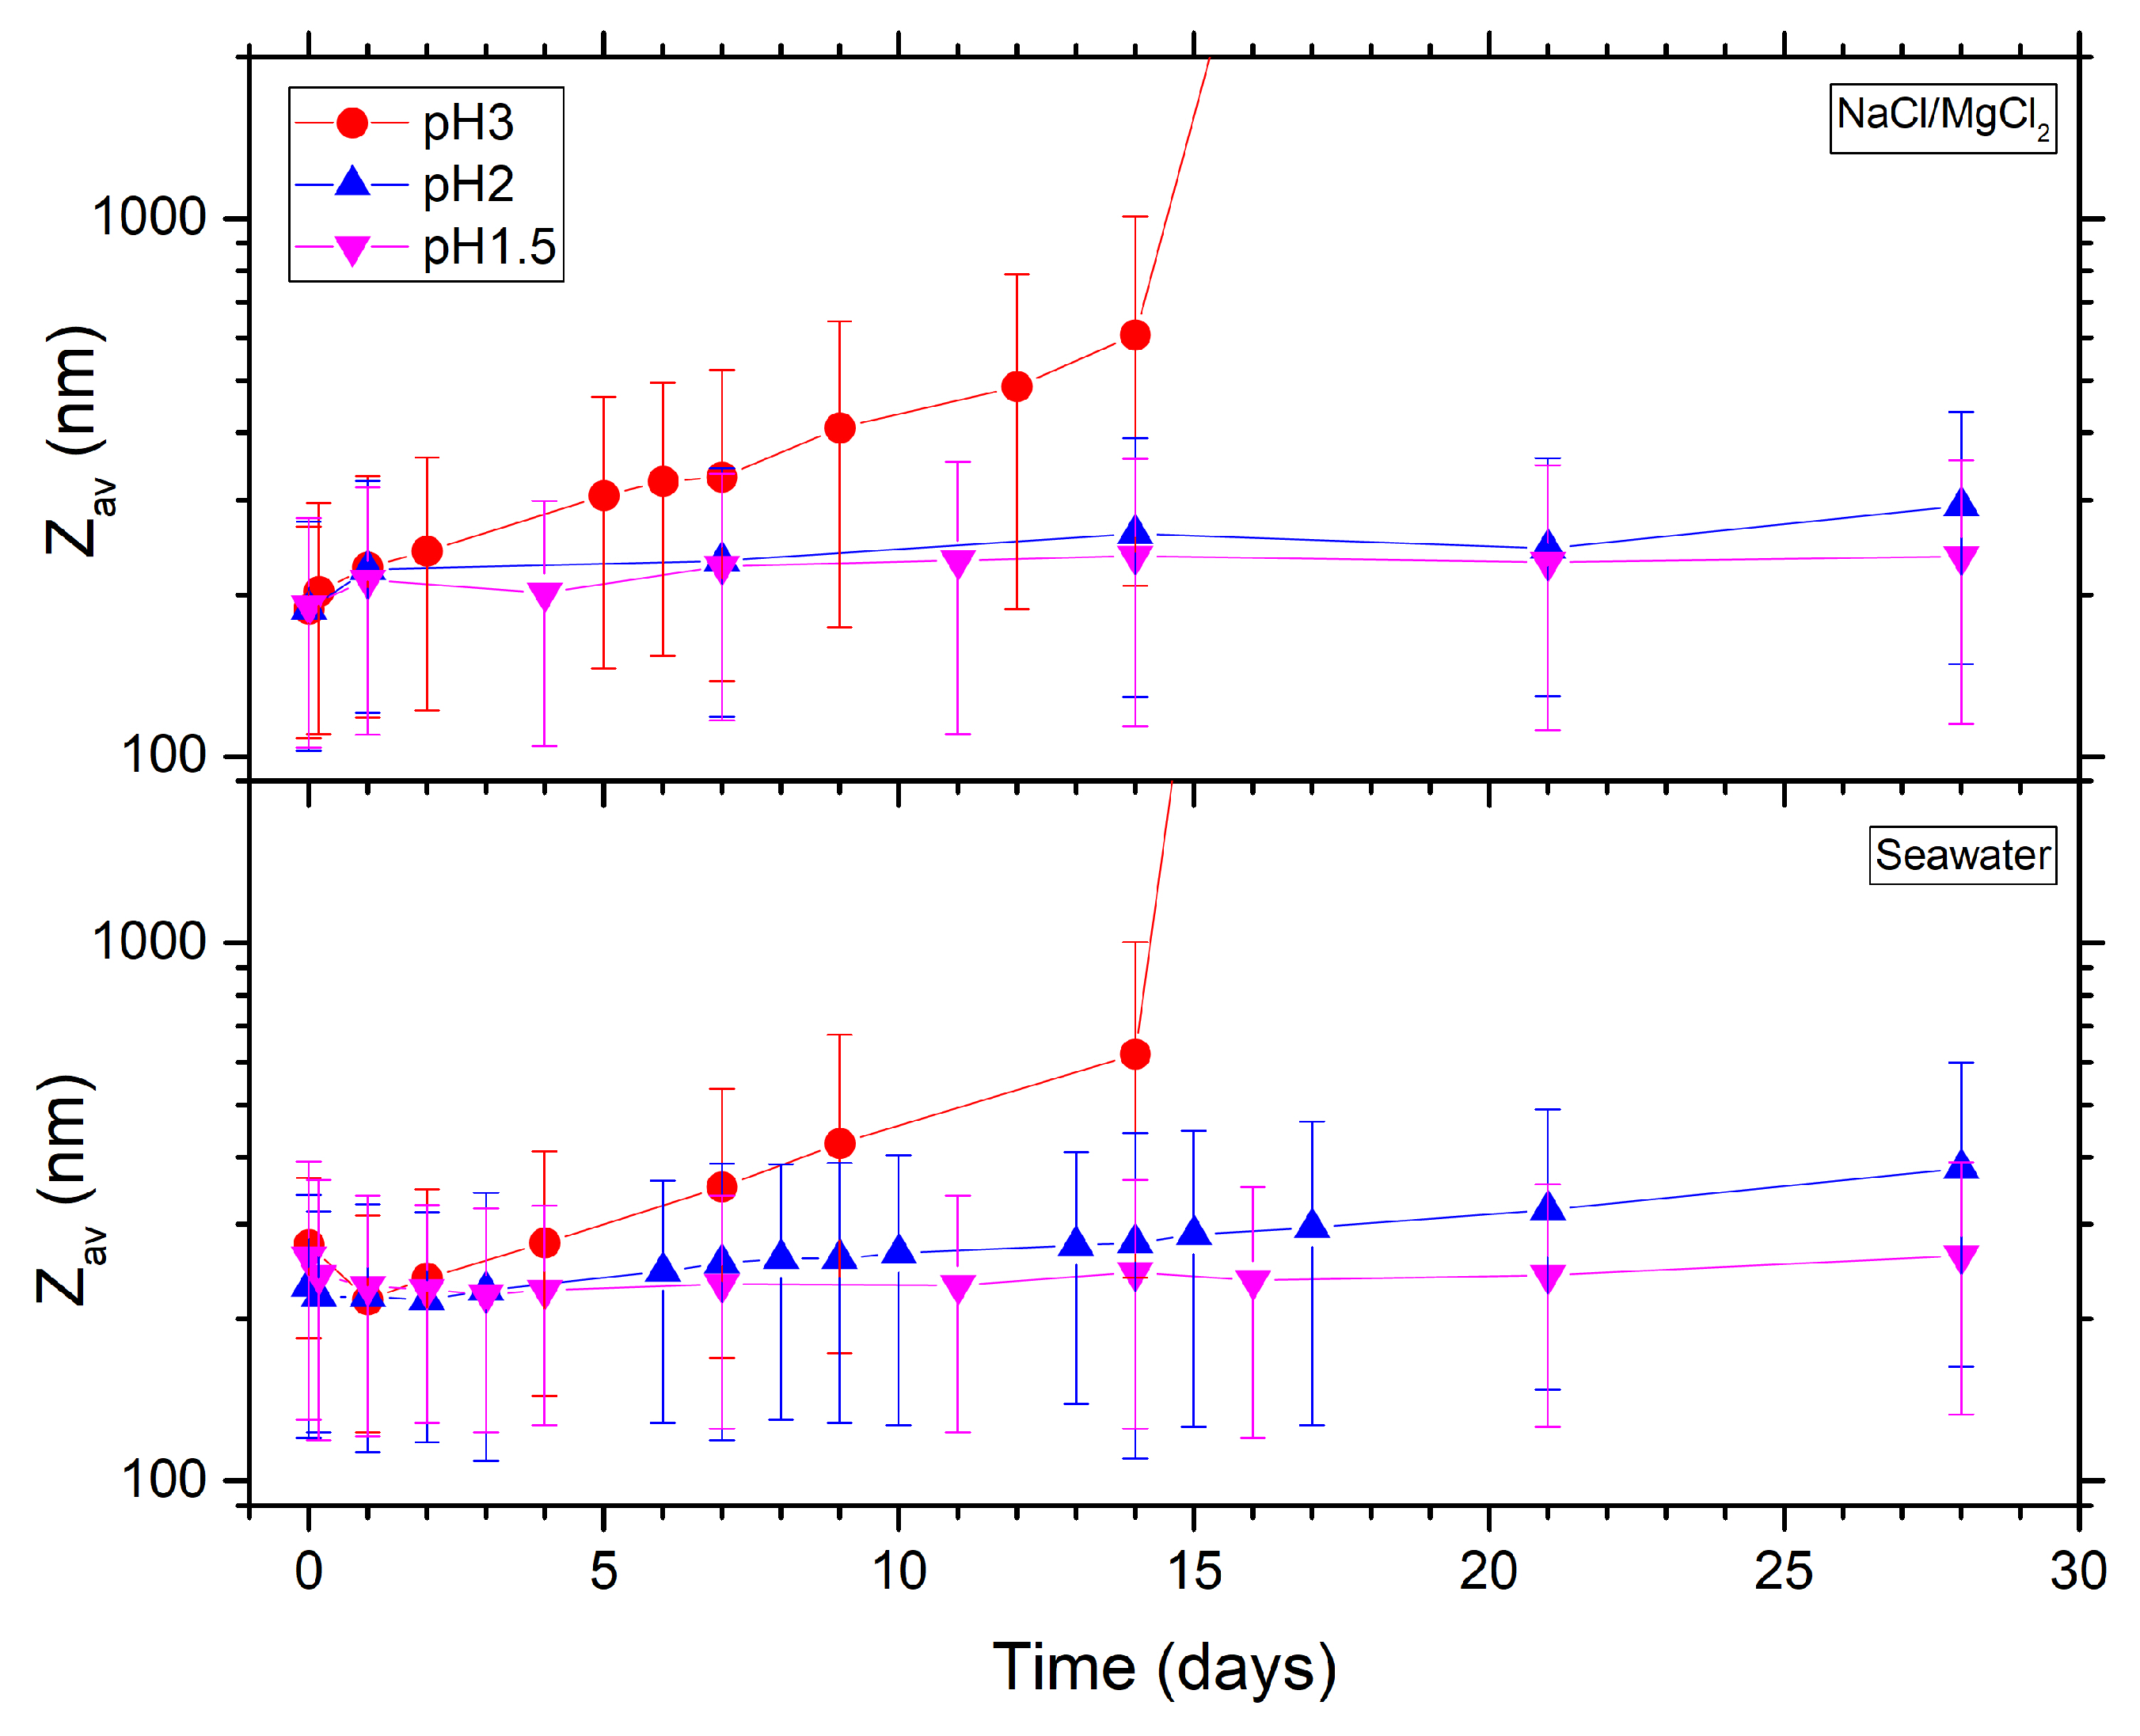
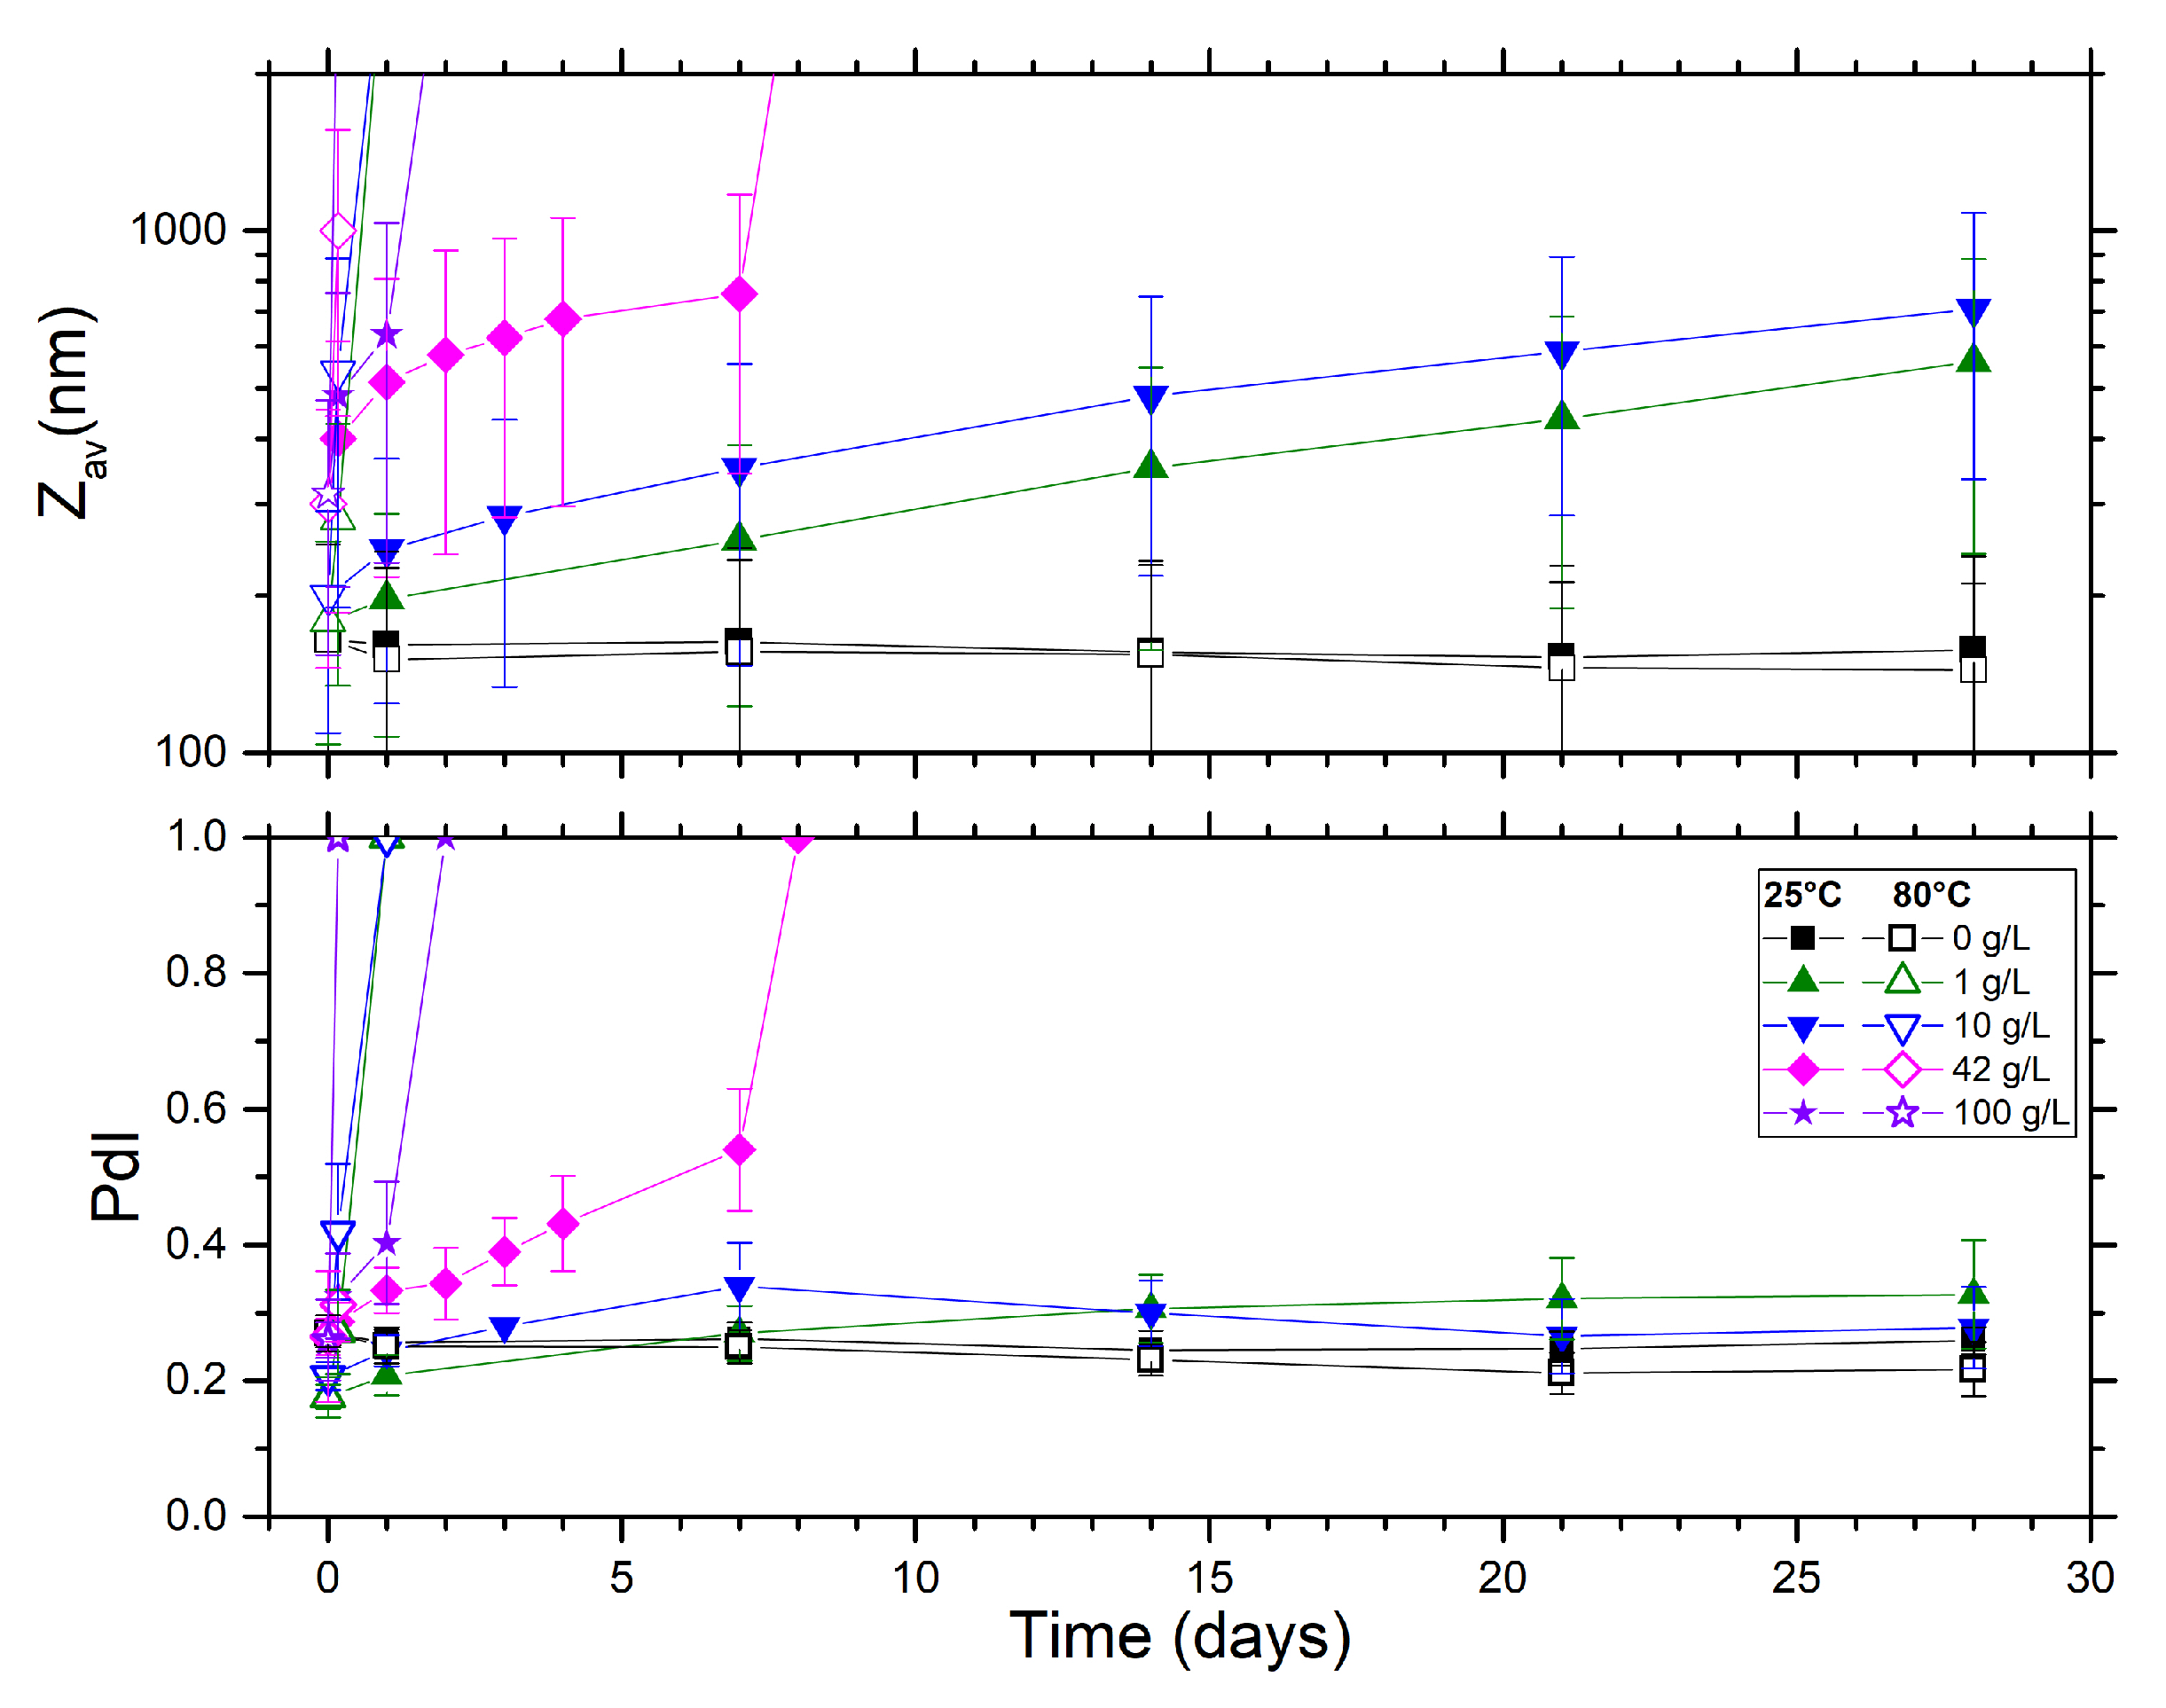
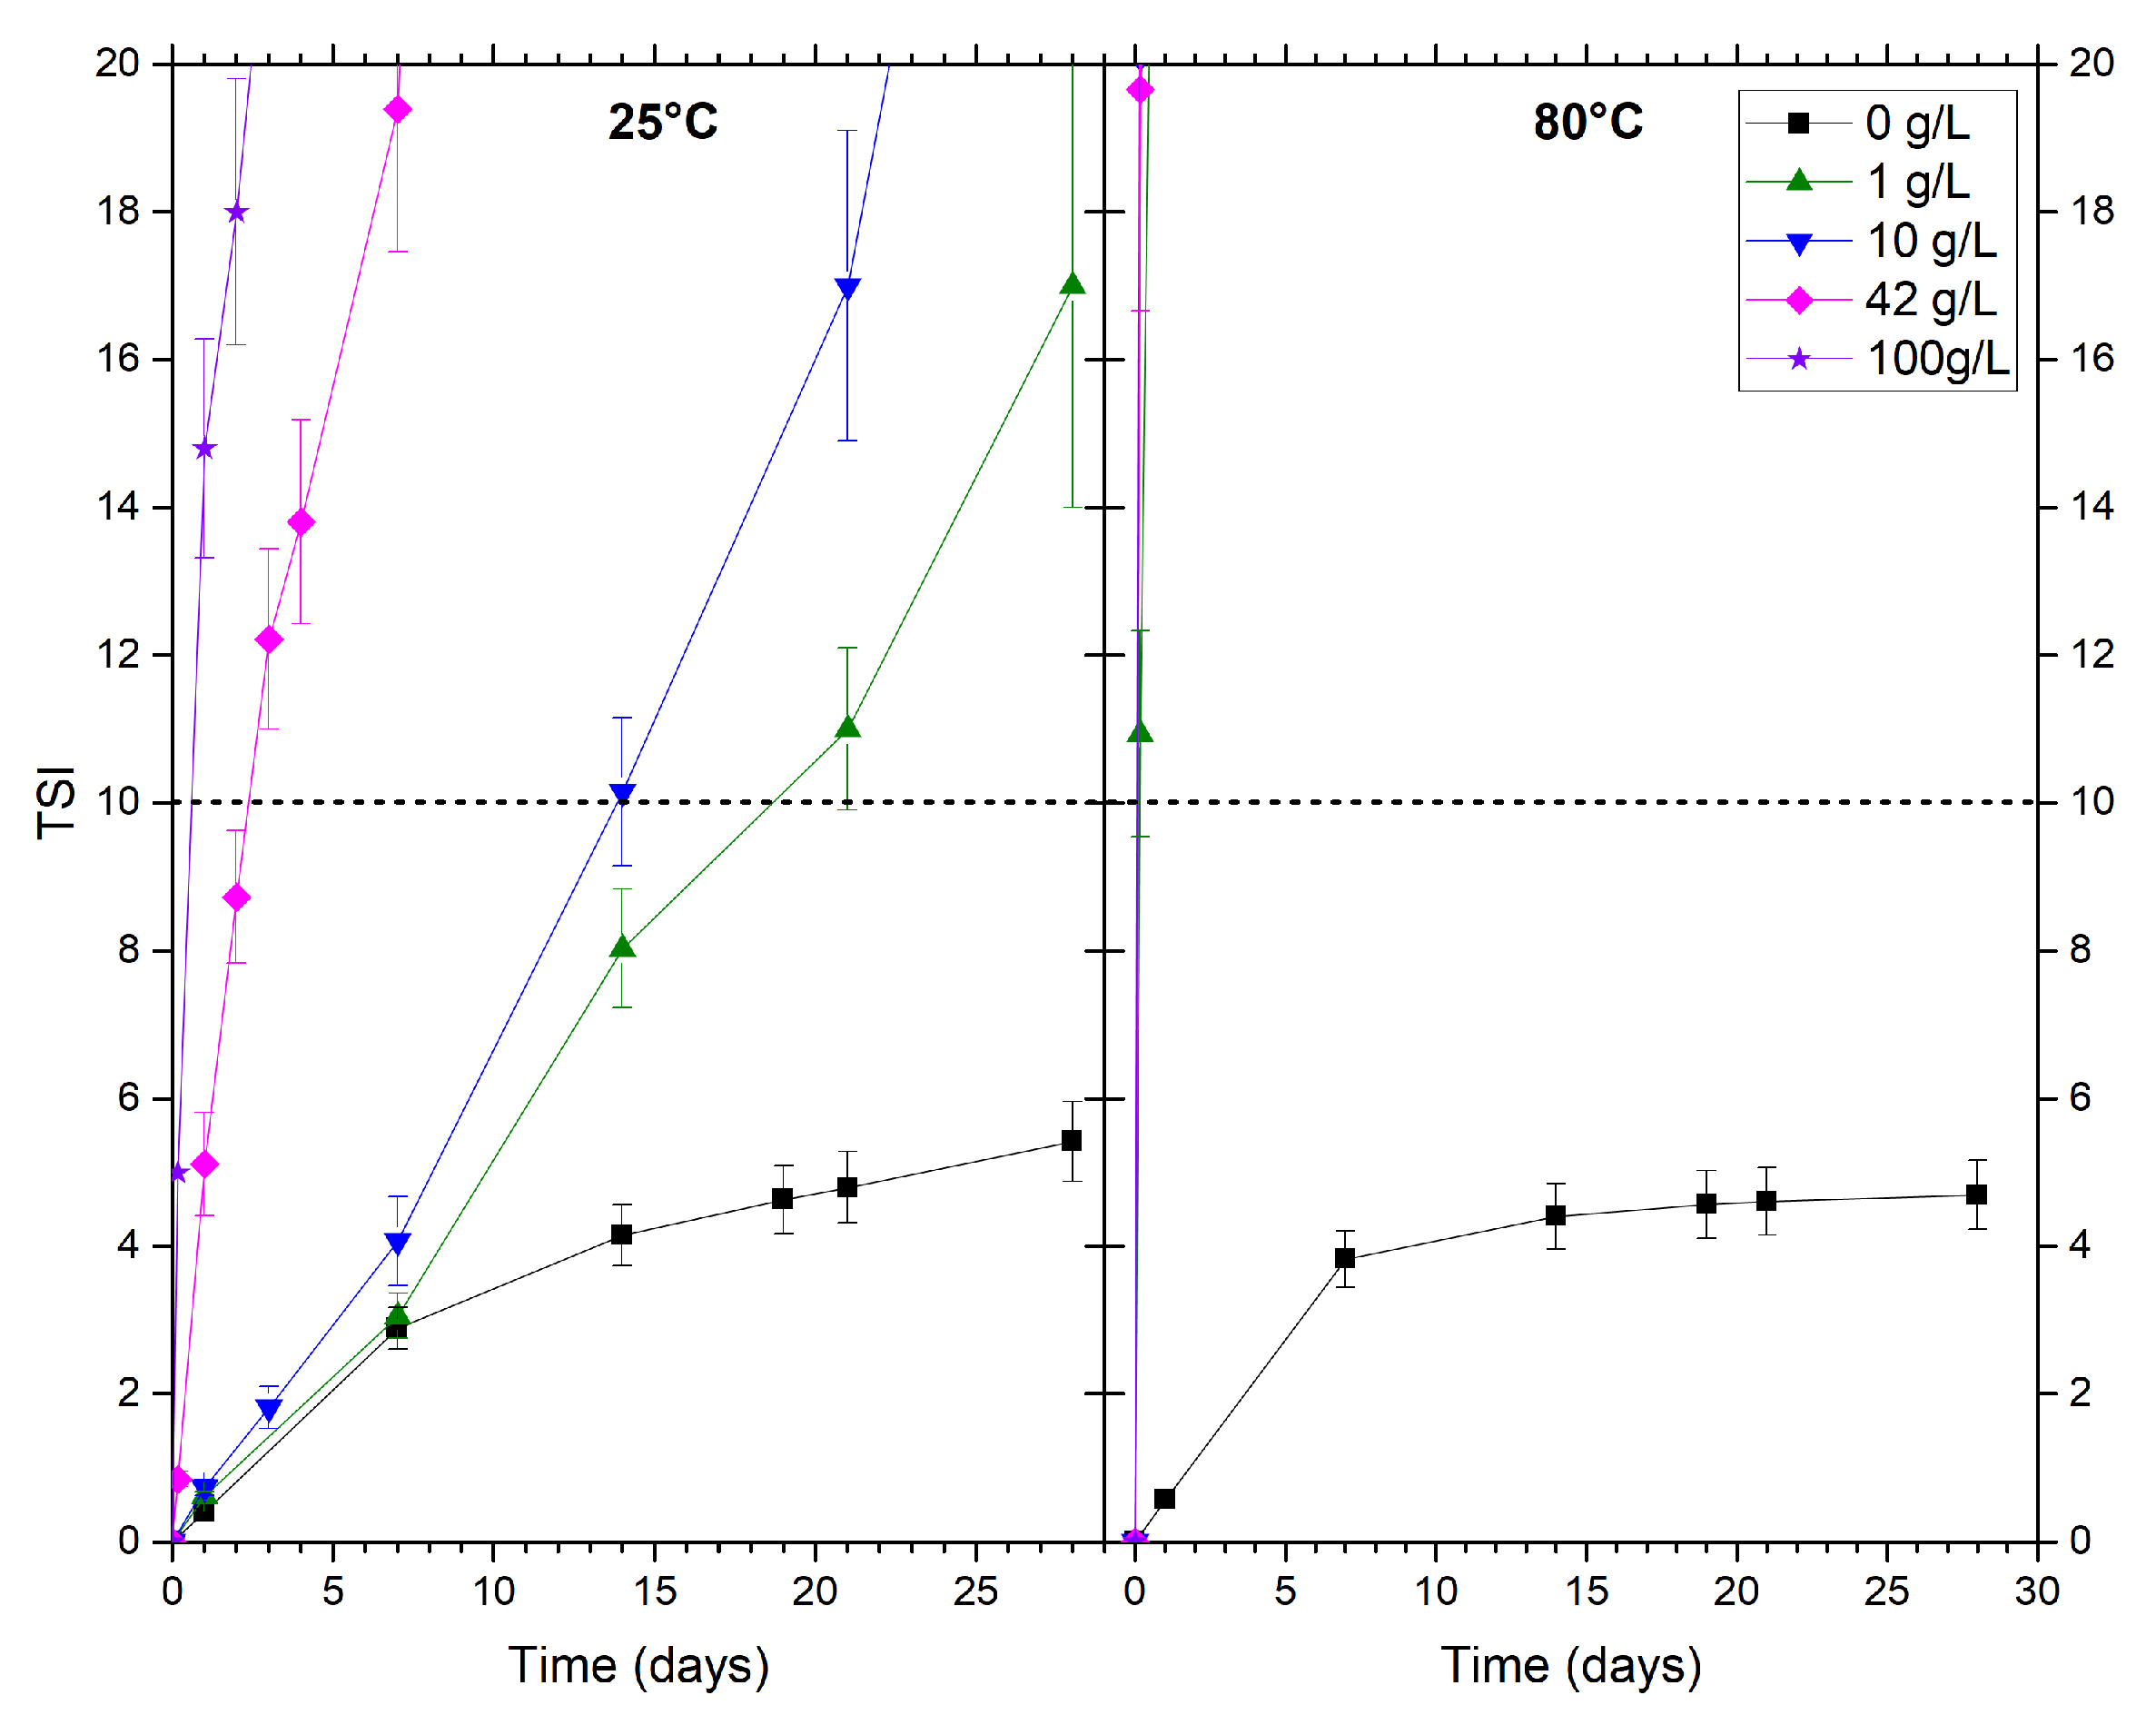
In this article, we investigated the stability of the silica nanofluid at different concentrations at reservoir conditions (high salinity and high temperature) as a function of base fluid pH. We compared the evolution of nanoparticle size and turbidity over time for monovalent and mixed ionic solutions as a function of time.

2. Material & Methods

2.1. Nanofluids

The nanofluids were made of hydrophilic fumed silica S i O 2 (AEROSIL® 200, Evonik, Essen, Germany) [31] (see Table A1 for more information) dispersed in Direct-Q® water ( 18.2 M Ω   · cm at 25 °C) containing different salts, such as N a C l , M g C l 2 , and C a C l 2 (ACS reagent, ⩾99%, Sigma-Aldrich, Sao Paulo, Brasil). We also used the salt composition of substitute seawater from ASTM D1141-98 (2013) (Table 1) [32]. The pH was measured with a PC700 Oaklon pH-meter and changed with the addition of N a O H (reagent grade, ⩾98%, pellets, Sigma-Aldrich, Sao Paulo, Brasil) and H C l (ACS reagent, 37%, Sigma-Aldrich, Sao Paulo, Brazil).
Sonication was performed for 40 min at 30% amplitude (caloric energy density, E V , c a l 731 J/mL) with a 1 probe (titanium alloy) connected to the Q700 module (Qsonica, Newtown, USA). The protocol is identical to the one used in our recently published paper [33]. The primary particle size of silica S i O 2 AEROSIL® 200 is about 12 nm; however, it can be seen that even in the best-dispersed nanofluid, the particle size is 15 times the primary particle size. One of the reasons for this behavior is the process used to produce fumed silica fuses the particles together and it is impossible to breakdown particles that small. This means that particles form stable aggregates of sintered primary particles in aqueous suspension even after the ultrasonic treatment.
The procedures to obtain nanofluids at different salinities and/or pH are shown in Figure A1. The addition of salts to the base fluid can be performed before or after the centrifugation process. However, high salinity may influence the aggregation of nanoparticles during or just after the sonication process. Unless otherwise specified, salts were added after sonication (Procedure A in Figure A1) to allow better characterization of the nanofluids. Thus, the size and stability of the nanofluids at time 0 were determined under optimal stability conditions. The seawater preparation process is more complex and requires several dilutions; therefore, in order to avoid the nanoparticle concentration of the nanofluid being affected by this process, the nanoparticles were mixed with the seawater before sonication (Procedure B in Figure A1). If the pH needed to be adjusted, this was always performed before bringing the nanoparticles and salt ions into contact.
After preparation, the nanofluids were stored in a heating cabinet at 25 or 80 °C.

2.2. Characterization of Nanofluids

2.2.1. pH

The initial pH (pHi) of nanofluids was measured just after preparation. As it can be seen in Table 2, it depends mainly on the initial silica concentration.

2.2.2. Stability

The nanofluids were scanned with a Turbiscan LAB analyzer (Formulaction Inc., Toulouse, France) at 25 °C and the stability was given by the dimensionless turbidity scan index (TSI) (see Hutin and Carvalho [33] for more details on the method and calculations). For ease of reading the data and interpreting the results, we divided the TSI scale into two parts: TSI < 10 nanofluid is considered stable and TSI > 10 is considered unstable.

2.2.3. Size Distribution and Z a v

The Zetasizer Nano-ZS90 (Malvern Panalytical Ltd., Malvern, UK) was used to measure the particle size distribution using the dynamic light scattering (DLS) technique at 25 °C in disposable polystyrene cuvettes. The following assumptions were made in the analysis: the dispersant is assumed to be water with a viscosity equal to 0.888 mPa·s at 25 °C and a refractive index of 1.33, and the refractive index of the material ( S i O 2 ) was selected to be 1.46 with an absorption of 0.01. Each sample was measured at least 5 times.
The intensity-weighted mean hydrodynamic size ( Z a v ) and the polydispersity index ( P d I ) are obtained from the cumulant analysis of the measured correlation curve [34,35]. These two parameters are indicators of the stability of the nanofluid since the samples in which there is an increase are unstable in contrast to those in which the values are stable or similar over time. The corresponding standard deviation σ of a Gaussian distribution with a Z a v mean and a P d I is calculated as [36]:
σ = Z a v P d I
For broader distributions, where the polydispersity is over 0.4, cumulants cannot identify individual modes in a population and it is unwise to rely on the Z a v . In this case, it is more accurate to refer to the intensity-weighted size distribution to determine the peak positions.

2.2.4. Zeta Potential

Zeta potential (ZP) measurements were carried out through the evaluation of electrophoretic mobility at 25 °C using the same Zetasizer as the DLS, but with a DTS1060 folded capillary cell from Malvern. After filling the cell with the sample, it was ensured that no air bubbles were present in the solution. Between each measurement, the cell was rinsed with water and ethanol. At least three measurements per sample were made and the average was reported.
We observed that measuring electrophoretic mobility at high ionic strength causes significant Joule heating at the electrodes, which favors aggregation of nanoparticles and causes the apparition of gas bubbles. We used the diffusion barrier technique [37] according to the procedure described in Ref. [38] for samples with an ionic strength greater than 0.1 mol/L. This technique reduces the uncertainty of the measured electrophoretic mobility by separating the sample from the electrodes with a buffer solution.

3. Results and Discussion

In all the plots presented next, the lines between the experimental data in the figures are to guide the eye.

3.1. Characterization of Nanofluids and Criteria for EOR

In most publications [5,9,39,40], the initial concentration set to maximize the effects of nanofluids for EOR is in the range of 0.1 to 0.5 wt% (1000 to 5000 ppm). Indeed, the nanoparticle stability inversely depends on the nanoparticle concentration and a compromise must be found between stability and liquid performance as an EOR agent. We chose to study the nanofluid behavior of samples containing from 0.1 to 1 wt% silica nanoparticles in order to investigate if the size of the nanoparticles can be controlled at higher particle concentrations.
EOR imposes size criteria for an efficient use of nanofluids in porous media. To freely flow through the porous media, the nanoparticles must not block pore throats via log-jamming, hence their size should be substantially smaller than the diameter of the pore throats. The pore throat size depends on the type of reservoir: larger than 2 μ m for conventional oil reservoirs [41], 4–7 μ m for coarse sandstones [42], and 0.01–100 μ m for carbonates [43]. Log-jamming is complicated to predict as it depends on many parameters [44]; therefore, it is challenging to determine a precise nanoparticle size to prevent it. Moreover, nano-aggregates need to keep a small size to have a high surface-to-volume ratio, which gives them different interesting properties to improve oil recovery [5,40]. In the literature, a mean size of 100 nm is often defined as the limit size criterion for nanofluids [5,9], and this is because nanoparticles are defined as a particle with a size (at least in one dimension) between 1 and 100 nm [45]. However, as we discussed before, if Z a v is larger than 100 nm that does not mean that there are not considerable populations of smaller nanoparticles present. In addition, the hydrodynamic size falls between the smallest and the largest dimension of a non-spherical object: an aggregate with a dimension of 10 × 10 × 900 nm may show a Z a v above 100 nm; however, the particles have at least one dimension in the nano range. For all these reasons, we decided not to refer to an average size in particular as a criterion but rather to study the evolution of Z a v in comparison with the most stable samples. We used the critical value of 0.4 for the P d I to state that the sample is unstable and no more suitable for the EOR process.
The characterization of the nanofluids was completed with the study of stability through the turbidity of the sample. The analysis of the backscattering (BS) or transmission (T) signal allows to identify if the nanoparticles aggregate and segregate. Figure A2 shows an example of a transmission profile, with the vertical axis showing the intensity of the light transmission in percent and the horizontal axis representing the sample height in the tube. The results are also given in terms of delta transmission ( Δ T ), which is the difference between the percent of transmission at time t and time 0. Due to their nanometric size after the sonication, nanoparticles are first subjected to Brownian motion. This free movement promotes the aggregation of the particles, resulting first in size increase. When the diameter of the nanoaggregates is large enough, about 1 μ m, sedimentation predominates over Brownian motion and phase separation begins. As the aggregation process always precedes that of phase separation, we focused on the study of the instability of the nanofluid by studying the flocculation zone as shown in Figure A2. The stability of the dispersion is quantified by TSI. A high TSI value (>10) indicates instability and high aggregation, while a low TSI value denotes stability and minimal particle agglomeration.

3.2. Influence of Salinity and Temperature on Nanofluid Stability

The stability of nanoparticles in solution depends, among other things, on the type and concentrations of salts. The ionic strength, related to the amount of electrolytes in nanofluids, can be used as a parameter to compare the nanofluid of different compositions. The ionic strength of seawater (ASTM D1141-98), about 7.2 × 10 1 mol/L, was taken as a reference to stay close to the harsh conditions of an oil reservoir. We started by investigating the effect of ionic strength with one monovalent salt and N a C l concentrations from 1 to 100 g/L (Table 3) at initial pH (pHi). Nanofluids containing 42 g/L N a C l have the same ionic strength as seawater.
For 0.1 wt% silica (Figure 2), no remarkable changes in the evolution of the nanoparticles size with time were observed up to a concentration of 10 g/L at 25 °C. For these N a C l concentrations, the electrostatic repulsion between particles is strong enough to maintain an almost constant particle size over a month. For higher salt concentrations, especially at 100 g/L, Z a v increased from day 0 until reaching micrometer sizes after 1 week. Because the silica nanoparticles are negatively charged at pHi, the N a + cations are attracted by the particles. In this case, the concentration of cations is high enough to offset the surface charges of the silica particles, thus decreasing the electrostatic repulsion and promoting aggregation under the effect of the van der Waals attraction forces. This effect was confirmed by the values of TSI presented in Figure 3. At 80 °C, only the salt-free nanofluid maintained stability over the period of one month. The nanofluid containing 1 g/L remained stable for 20 days, while all other nanofluids with higher salinities were already unstable after one day.
Increasing temperature has the effect of increasing the kinetic energy and the collision frequency of nanoparticles; therefore, high temperatures promote aggregation and negatively affect the stability of nanofluids. The stability of the nanofluid depends on the volume occupied by the particles relative to the total volume. At low concentration (0.1 wt%), the distances between the particles are quite large compared with their radius and they can therefore move freely, driven by Brownian motion. The increase in nanoparticle concentration (0.5 and 1 wt%) favors the hydrodynamic interactions as well as the collision probability, thus promoting aggregation (Figure A3 and Figure A5) and instability (Figure A4 and Figure A6). Since there was only one type of cation present in the prior nanofluids, N a C l , the stability only depended on the N a + concentration. To confirm that the instability is indeed related to the types of cations, we compared three nanofluids (Table 4) at pHi that have the same ionic strength but different compositions (Table 1). Fluids n°2 ( N a C l + M g C l 2 ) and n°3 ( N a C l + C a C l 2 ) mimic the composition of seawater by maintaining the proportions of monovalent (72%) and divalent (28%) cations to ionic strength.
Since Z a v and P d I presented the same trends over time, we will only report Z a v in the following results unless there is a different behavior to highlight. At 25 °C and with 0.1 wt% of silica, the nanoparticles aggregated more in the presence of a divalent salt ( M g 2 + or C a 2 + ) than with a monovalent salt ( N a + ) as can be seen in Figure 4. However, the nanofluids remained stable for at least one month and there was no significant difference in size between the three nanofluids after one month. For a higher silica concentration of 0.5 wt% (Figure 5), the number of days that the dispersion remained stable was smaller and depended on the salt composition. The base fluid containing only N a C l had the best stability performance (about 18 days), while the stability was about 15 days in the presence of C a C l 2 and about 13 days in the presence of M g C l 2 . These results are in agreement with the literature [9,23] and confirm that divalent ions are screening the charge of silica nanoparticles more effectively than monovalent ions. These results support the literature [9,23] by demonstrating that divalent ions shield silica nanoparticle charges more efficiently than monovalent ions. Moreover, as observed by Metin et al. [23], we confirmed that M g 2 + is more effective in destabilizing the silica particles than C a 2 + . However, the results showed a very different behavior with 0.1 and 0.5 wt% when the base fluid was synthetic seawater. In both cases, the nanofluids had a stability of less than one day. One could have expected that seawater would give a similar behavior to nanofluids n°2 and n°3 because their composition is closer than that of nanofluid n°1. This behavior can have two explanations: either there are other salts (monovalent or divalent) that are more destabilizing that compose synthetic seawater or the pH of the base fluid strongly influences the stability. ASTM D1141-98 requires that the pH of synthetic seawater after mixing the various salts be set at 8.2. Although the addition of silica nanoparticles decreases the pH, it will always remain significantly higher than the pHi of nanofluids n°1, 2, and 3 (Table 2). The effect of pH on stability is discussed in the following sections to better understand this behavior.
The size results obtained for these nanofluids at 80 °C have not been reported here because the aggregation of the particles is very fast (less than 12 h) and therefore does not allow a correct estimation by the DLS method. Moreover, the study of the turbidity of the different nanofluids confirmed a stability lower than 12 h, whatever the salt composition of the base fluids. Because of the high instability at 80 °C, it was not possible to differentiate the behavior of nanofluids according to their salt composition.
The results of this section confirmed that the stability of silica nanoparticles is mainly governed by particle concentration, electrolytes, and temperature. The stability of silica nanofluids at high salinity and high temperature (typical conditions of oil reservoirs) is at best a few hours, which is insufficient for their use in EOR.

3.3. Improving Nanofluid Stability at High Salinity and High Temperature

Since the charge density and potential of the particles vary on pH and ionic strength, the zeta potential (ZP) is helpful for assessing the electrical double-layer repulsive forces between particles in suspensions. Figure 6 shows the ZP of three different nanoparticle concentrations as a function of pH in a N a C l solution with a concentration of 0.1 g/L. ZP varies from positive to negative as pH increases because of surface deprotonation and does not depend on nanoparticle concentration. At a pHi between 4 and 5 (see Table 2), ZP is negative and varies from −10 to −20 mV. The addition of N a O H favors deprotonation, which results in a more negative charge density, and ZP decreases as S i O groups appear at the particle surface. Beyond pH 7, ZP slightly decreases from −40 to −50 mV. The addition of H C l favors protonation, increasing ZP from negative to positive values. The isoelectric point (IEP) was found to be between pH 2 and 3. The effect of adding salt (up to 42 g/L N a C l ) on ZP with 1 wt% nanoparticles is reported in Figure 7. ZP becomes less negative with increasing N a C l concentration. At pHi, ZP is close to the IEP for a concentration of 42 g/L N a C l ; in general, increasing N a C l concentration shifts the IEP to a higher value. At pH < pHi, there is no significant change in ZP values; however, it is complicated to clearly determine IEP because the values of ZP increase little and remain close to 0. At pH > pHi, the effect of salt concentration is more obvious because ZP increases sharply. The addition of the electrolyte produces a screening effect on negatively charged silica particles at pHi, meaning that the counterions N a + offset the surface charges and lessen electrostatic repulsion. This effect is reinforced as the ionic strength (concentration in electrolytes) increases. At these ZP values, if there are no other repulsive forces, the particles easily agglomerate as they approach each other due to Brownian motion. Consequently, pH values distant from pHi are needed to prepare better stable suspensions. As decreasing the pH brings ZP closer to zero, the solution to improve stability through electrostatic repulsion forces increases the pH beyond 7, as shown in Figure 7.

3.3.1. Basic pH

We studied the effect of basic pH on the time evolution of Z a v (Figure 8) and on the suspension stability (Table 5) of nanofluids containing from 0 to 42 g/L N a C l at 25 and 80 °C. Without salt (0 g/L), there is no difference in Z a v with time at pHi and basic pH. The addition of a small amount of salt, 1 g/L N a C l , results in a difference in behavior at 80 °C; furthermore, we noticed that Z a v increases at pHi and the stability measured by TSI is about 21 days, while the nanofluids at pH 8 and at pH 10 are still stable after 28 days. At 10 g/L, all the nanofluids are stable for more than 28 days at 25 °C, even if there is a slight increase in Z a v for pHi and pH 8 compared with pH 10. At 80 °C, only pH 8 and 10 are stable for 28 days, which confirms the stabilizing effect of basic pH, as the suspension at pHi is stable for only 2 days. At 42 g/L and 80 °C, Z a v increases sharply well above 400 nm, P d I is close to 1 a few hours after sonication, and all nanofluids have a stability of one day or less. At high salt concentration, the range of the repelling electrostatic forces between particles is small, and even slight changes in the electrostatics of silica particles cannot provide the requisite repulsion to stabilize silica nanofluids. All negatively charged proton donors O at the surface of the particle are bound by the counterion N a + . The electric double layer is dominated by van der Waals attraction, which leads to instability and the aggregation of silica nanoparticles. Moreover, the high temperature favors contact, which accelerates the aggregation and sedimentation of the particles. We can conclude that the critical salt concentration at basic pH is between 10 and 42 g/L.
The results obtained at 25 °C are unexpected, as the nanofluid at pHi is much more stable (28 days) than nanofluids at basic pH (1 day or less). ZP presented in Figure 7 is about −22 mV at pH 10, whereas it is about −3.5 mV at pHi; therefore, if we consider that the only repulsion forces present are electrostatic, the nanofluid at pH 10 should be more stable than at pHi. However, it has been shown that the DLVO theory does not take into account the hydration force results from the ability of silanol ( S i O H ) groups to form hydrogen bonds with water. This hydration layer acts as a steric repulsion mechanism and its strength depends on the quantity of silanol groups on the surface of the particle. The deprotonation and substitution of silanol protons by electrolyte cations when the pH increases lead to destabilization of the nanofluid by removing hydrogen-bonding sites (dehydration) (Figure 9). Therefore, by increasing the pH, the steric mechanism given by the hydration layer is lost and the electrostatic force alone is not sufficient to prevent aggregation. The hydration repulsion force is maximum at the IEP (ZP = 0), at which the electrostatic repulsion forces are zero, and it is then impossible to maximise both forces to improve stability. This explains well the behavior previously observed for seawater in Figure 4 and Figure 5. Since the initial pH of seawater is about 8.2, the hydration repulsion force is weak and the high salt concentration shields for electrostatic repulsion. In Figure 8, we can note that the nanofluid with 42 g/L N a C l at pH 8 has the same behavior as seawater in Figure 4.
The results obtained with pHi and pH 8 at 80 °C confirmed that an intermediate pH (5 < pH < 8) is not the solution for obtaining long stability at reservoir conditions. As some authors [29,30] have shown, the hydration repulsion energy can be considerable in the case of hydrophilic nanoparticles at high ionic strength; therefore, a decrease in pH to approach the IEP is tested in the next section.

3.3.2. Acid pH

Cations must be kept to a minimum in the electrical double layer of particles in order to promote the stabilization silica nanofluids. According to the literature [46,47], H + has a very high affinity for neutralizing negatively charged surfaces. In order to lower the concentration of counter ions in the electrical double layer of silica nanoparticles, Sofla et al. [9] showed that sufficient H + ions in solution can establish a protective layer around silica nanoparticles (Figure 10).
In this section, we focus on the reservoir conditions, i.e., an ionic strength of 7·10 1 mol/L and temperature of 80 °C. We first investigated the effect of acid pH on the behavior of three different concentrations of nanofluids (0.1, 0.5, and 1 wt%) containing 42 g/L N a C l (Figure 11 and Table 6). The results show that 0.1 and 0.5 wt% nanofluids are much more stable at pH 2 and 1.5 than at their own pHi. There is no significant difference in stability at these two pHs up to 28 days of study. However, Z a v is lower at pH 1.5 after 28 days for 0.5 wt% nanofluids, so we can assume that the stability of pH 1.5 will be higher than that of pH 2 for longer periods. pH 3 strongly improves the stability for 0.1 wt%; however, when the nanoparticle concentration increases, it becomes ineffective in preventing aggregation and stabilizing the nanofluid. Lowering the pH below 3 is a good way to promote the stability of nanofluids containing 0.1 and 0.5 wt%; however, the challenge is more difficult for a higher concentration of 1 wt%. The best stability achieved is about one week at pH 1.5, which is not enough time for injecting the nanoparticle suspension into an oil reservoir.
Since the results obtained at acidic pH for brine of an ionic strength equivalent to seawater were interesting in terms of stability, we studied the effect of salt composition on stability for the two lowest concentrations of nanoparticles (0.1 and 0.5 wt%).
For a nanofluid with 0.1 wt% at pH 3, the stability is less with seawater and N a C l / M g C l 2 (Figure 12 and Table 7) compared with N a C l (Figure 11). However, there is no difference in stability at pH 2 and 1.5 (Table 7) regardless of salt composition; likewise, Z a v remains constant for one month (Figure 12). Normally, divalent cations are much more destabilizing than monovalent cation [9,23]; however, the protective layer formed by H + seems to reduce the concentration of counter ions in the electrical double layer enough to avoid dehydration and thus agglomeration.
For 0.5 wt% (Figure 13 and Table 7), the stability is the same for brine at pH 3. For systems with very short time stabilities, the amount of salt is more important than the salt composition. pH 2 allows to maintain a stability for about 20 days for the N a C l / M g C l 2 , while it is about 15 days for the seawater. The best solution is pH 1.5, which remains stable for both concentrations for more than 20 days.
The results obtained with base fluids containing divalent cations confirmed their more destabilizing effect. However, by setting the pH to values between 1.5 and 2, sufficient stability is maintained for the injection of nanofluids containing up to 0.5 wt% of silica. In addition, it is possible to mimic the behavior of seawater with just a monovalent salt ( N a C l ) and a divalent salt ( M g C l 2 ) in proportions corresponding to those of seawater.

4. Final Remarks

This study was focused on investigating the possibility of stabilizing silica nanofluids at reservoir conditions, i.e., high salinity and high temperature. In the absence of any surfactant or polymer, van der Waals attraction outweighs the electrical double layer, causing silica nanoparticles to aggregate, thus leading to unstable suspensions.
A simple solution that was considered and tested was to adjust the pH of the base fluid. However, increasing the pH to basic values to increase the negative charge of the silica particles and thus maximize the electrostatic repulsive force does not work at high ionic strengths. The results showed that working at an acidic pH close to IEP intensifies the hydration repulsion between the silica particles and stabilizes them even in seawater at 80 °C. The concentration of nanoparticles is another important parameter to take into account: the higher the concentration, the less stable the nanofluid will be over time.
The results presented here define the conditions at which silica nanofluids are stable and can be injected in a reservoir as an enhanced oil recovery agent.

Author Contributions

Conceptualization, A.H.; methodology, A.H., N.L., and F.L.; validation, A.H.; investigation, A.H., N.L., and F.L.; writing—original draft preparation, A.H.; writing—review and editing, A.H. and M.C.; visualization, A.H.; supervision, A.H. and M.C.; project administration, A.H. and M.C.; funding acquisition, M.C. All authors have read and agreed to the published version of the manuscript.

Funding

This research was carried out in association with the ongoing R&D project registered as ANP n° 21223-3, “Escoamento com dispersões de micro e nano partículas aplicadas a EOR e à entrega de químicos” (PUC-Rio/Shell Brasil/ANP), sponsored by Shell Brasil Petróleo Ltda under the ANP R&D levy as “Compromisso de Investimentos com Pesquisa e Desenvolvimento”.

Institutional Review Board Statement

Not applicable.

Informed Consent Statement

Not applicable.

Data Availability Statement

Not applicable.

Conflicts of Interest

The authors declare no conflict of interest.

Abbreviations

The following abbreviations are used in this manuscript:
EOREnhanced Oil Recovery
ZPZeta Potential
IEPIsoelectric Point
TSITurbidity Scan Index
DLSDynamic Light Scattering
Z a v Intensity-weighted mean hydrodynamic size
PdIPolydispersity Index

Appendix A. Supporting Information

Appendix A.1. AEROSIL® 200

Table A1. Properties of AEROSIL® 200.
Refractive index1.46
Specific surface area175–225 m 2 /g
Specific weight2.2 g/cm 3
Heat capacity Cp at 50 °C0.85 J · g 1 · K 1
Heat of wetting of water−150 × 10 7 J · m 2
pH value in 4% dispersion3.7–4.5

Appendix A.2. Procedures for Preparation of Nanofluids

Figure A1. Preparation of nanofluids with salts (Procedure A) and with seawater (procedure B). The pH adjustment in each procedure depends on the systems studied.
Powders 02 00001 g0a1

Appendix A.3. Transmission Profile from Turbidity Scanning

Figure A2. Transmission (T) profile of a silica nanofluid as a function of time.
Powders 02 00001 g0a2

Appendix A.4. Zav and Stability of 0.5 wt% Silica Nanofluids at Initial pH

Figure A3. Effect of NaCl concentration and temperature on the evolution of Z a v and P d I as a function of time for 0.5 wt% silica nanofluids at initial pH.
Powders 02 00001 g0a3
Figure A4. Effect of NaCl concentration and temperature on the evolution of TSI as a function of time for 0.5 wt% silica nanofluids at initial pH.
Powders 02 00001 g0a4

Appendix A.5. Zav and Stability of 1 wt% Silica Nanofluids at Initial pH

Figure A5. Effect of NaCl concentration and temperature on the evolution of Z a v and P d I as a function of time for 1 wt% silica nanofluids at initial pH.
Powders 02 00001 g0a5
Figure A6. Effect of NaCl concentration and temperature on the evolution of TSI as a function of time for 1 wt% silica nanofluids at initial pH.
Powders 02 00001 g0a6

References

  1. El-Diasty, A.I.; Aly, A.M. Understanding the mechanism of nanoparticles applications in enhanced oil recovery. In Proceedings of the Society of Petroleum Engineers—SPE North Africa Technical Conference and Exhibition 2015, NATC 2015, Cairo, Egypt, 15 September 2015; pp. 944–962. [Google Scholar] [CrossRef]
  2. Agi, A.; Junin, R.; Gbadamosi, A. Mechanism governing nanoparticle flow behaviour in porous media: Insight for enhanced oil recovery applications. Int. Nano Lett. 2018, 8, 49–77. [Google Scholar] [CrossRef] [Green Version]
  3. Hendraningrat, L.; Shidong, L.; Torsæter, S.; Torsæter, O. A glass micromodel experimental study of hydrophilic nanoparticles retention for EOR project. In Proceedings of the Society of Petroleum Engineers—SPE Russian Oil and Gas Exploration and Production Technical Conference and Exhibition 2012, Moscow, Russia, 16–18 October 2012; Volume 1, pp. 124–146. [Google Scholar] [CrossRef]
  4. Kazemzadeh, Y.; Shojaei, S.; Riazi, M.; Sharifi, M. Review on application of nanoparticles for EOR purposes: A critical review of the opportunities and challenges. Chin. J. Chem. Eng. 2019, 27, 237–246. [Google Scholar] [CrossRef]
  5. Sun, X.; Zhang, Y.; Chen, G.; Gai, Z. Application of Nanoparticles in Enhanced Oil Recovery: A Critical Review of Recent Progress. Energies 2017, 10, 345. [Google Scholar] [CrossRef] [Green Version]
  6. Lee, S.; Choi, S.U.S.; Li, S.; Eastman, J.A. Measuring Thermal Conductivity of Fluids Containing Oxide Nanoparticles. J. Heat Transf. 1999, 121, 280–289. [Google Scholar] [CrossRef]
  7. Endres, S.C.; Ciacchi, L.C.; Mädler, L. A review of contact force models between nanoparticles in agglomerates, aggregates, and films. J. Aerosol Sci. 2021, 153, 105719. [Google Scholar] [CrossRef]
  8. Song, S.; Peng, C. Thickness of solvation layers on nano-scale silica dispersed in water and ethanol. J. Dispers. Sci. Technol. 2005, 26, 197–201. [Google Scholar] [CrossRef]
  9. Jafari Daghlian Sofla, S.; James, L.A.; Zhang, Y. Insight into the stability of hydrophilic silica nanoparticles in seawater for Enhanced oil recovery implications. Fuel 2018, 216, 559–571. [Google Scholar] [CrossRef]
  10. Tadros, T. Electrostatic Repulsion and Colloid Stability. In Encyclopedia of Colloid and Interface Science; Springer: Berlin/Heidelberg, Germany, 2013; p. 363. [Google Scholar] [CrossRef]
  11. French, R.A.; Jacobson, A.R.; Kim, B.; Isley, S.L.; Penn, L.; Baveye, P.C. Influence of ionic strength, pH, and cation valence on aggregation kinetics of titanium dioxide nanoparticles. Environ. Sci. Technol. 2009, 43, 1354–1359. [Google Scholar] [CrossRef] [PubMed]
  12. Bukar, N.; Zhao, S.S.; Charbonneau, D.M.; Pelletier, J.N.; Masson, J.F. Influence of the Debye length on the interaction of a small molecule-modified Au nanoparticle with a surface-bound bioreceptor. Chem. Commun. 2014, 50, 4947–4950. [Google Scholar] [CrossRef]
  13. Smith, A.M.; Lee, A.A.; Perkin, S. The Electrostatic Screening Length in Concentrated Electrolytes Increases with Concentration. J. Phys. Chem. Lett. 2016, 7, 2157–2163. [Google Scholar] [CrossRef] [Green Version]
  14. Zhang, H.; Nikolov, A.; Wasan, D. Enhanced oil recovery (EOR) using nanoparticle dispersions: Underlying mechanism and imbibition experiments. Energy Fuels 2014, 28, 3002–3009. [Google Scholar] [CrossRef]
  15. Taborda, E.A.; Franco, C.A.; Lopera, S.H.; Alvarado, V.; Cortés, F.B. Effect of nanoparticles/nanofluids on the rheology of heavy crude oil and its mobility on porous media at reservoir conditions. Fuel 2016, 184, 222–232. [Google Scholar] [CrossRef]
  16. Li, K.; Wang, D.; Jiang, S. Review on enhanced oil recovery by nanofluids. Oil Gas Sci. Technol. 2018, 73, 37. [Google Scholar] [CrossRef] [Green Version]
  17. Ma, X.; Lee, N.H.; Oh, H.J.; Hwang, J.S.; Kim, S.J. Preparation and characterization of silica/polyamide-imide nanocomposite thin films. Nanoscale Res. Lett. 2010, 5, 1846–1851. [Google Scholar] [CrossRef] [PubMed] [Green Version]
  18. Hunter, R.J. Zeta Potential in Colloid Science; Elsevier: Amsterdam, The Netherlands, 1981. [Google Scholar] [CrossRef]
  19. Birdi, K.S. Handbook of Surface and Colloid Chemistry; CRC Press: Boca Raton, FL, USA, 2008. [Google Scholar] [CrossRef]
  20. Savarmand, S.; Carreau, P.J.; Bertrand, F.; Vidal, D.J.E.; Moan, M. Rheological properties of concentrated aqueous silica suspensions: Effects of pH and ions content. J. Rheol. 2003, 47, 1133–1149. [Google Scholar] [CrossRef]
  21. Choi, H.H.; Park, J.; Singh, R.K. Nanosized CuO Encapsulated Silica Particles Using an Electrochemical Deposition Coating. Electrochem. Solid-State Lett. 2004, 7, 2003–2005. [Google Scholar] [CrossRef]
  22. Chen, S.; Øye, G.; Sjöblom, J. Rheological properties of aqueous silica particle suspensions. J. Dispers. Sci. Technol. 2005, 26, 495–501. [Google Scholar] [CrossRef]
  23. Metin, C.O.; Lake, L.W.; Miranda, C.R.; Nguyen, Q.P. Stability of aqueous silica nanoparticle dispersions. J. Nanoparticle Res. 2011, 13, 839–850. [Google Scholar] [CrossRef]
  24. Chen, S.; Øye, G.; Sjöblom, J. Effect of pH and salt on rheological properties of aerosil suspensions. J. Dispers. Sci. Technol. 2007, 28, 845–853. [Google Scholar] [CrossRef]
  25. Amiri, A.; Øye, G.; Sjöblom, J. Influence of pH, high salinity and particle concentration on stability and rheological properties of aqueous suspensions of fumed silica. Colloids Surf. A Physicochem. Eng. Asp. 2009, 349, 43–54. [Google Scholar] [CrossRef]
  26. Szilagyi, I.; Sadeghpour, A.; Borkovec, M. Destabilization of colloidal suspensions by multivalent ions and polyelectrolytes: From screening to overcharging. Langmuir 2012, 28, 6211–6215. [Google Scholar] [CrossRef] [PubMed]
  27. Bizmark, N.; Ioannidis, M.A.; Henneke, D.E. Irreversible adsorption-driven assembly of nanoparticles at fluid interfaces revealed by a dynamic surface tension probe. Langmuir 2014, 30, 710–717. [Google Scholar] [CrossRef] [PubMed]
  28. Park, S.J.; Seo, M.K. (Eds.) Chapter 1—Intermolecular Force. In Interface Science and Composites; Interface Science and Technology; Elsevier: Amsterdam, The Netherlands, 2011; Volume 18, pp. 1–57. [Google Scholar] [CrossRef]
  29. Grasso, D.; Subramaniam, K.; Butkus, M.; Strevett, K.; Bergendahl, J. A review of non-DLVO interactions in environmental colloidal systems. Rev. Environ. Sci. Biotechnol. 2002, 1, 17–38. [Google Scholar] [CrossRef]
  30. Liu, H.H.; Lanphere, J.; Walker, S.; Cohen, Y. Effect of hydration repulsion on nanoparticle agglomeration evaluated via a constant number Monte-Carlo simulation. Nanotechnology 2015, 26, 45708. [Google Scholar] [CrossRef]
  31. Li, X.; Peng, H.; Tian, B.; Gou, J.; Yao, Q.; Tao, X.; He, H.; Zhang, Y.; Tang, X.; Cai, C. Preparation and characterization of azithromycin—Aerosil 200 solid dispersions with enhanced physical stability. Int. J. Pharm. 2015, 486, 175–184. [Google Scholar] [CrossRef]
  32. D1141-98: Standard Practice for the Preparation of Substitute Ocean Water; ASTM International: West Conshohocken, PA, USA, 2013.
  33. Hutin, A.; Carvalho, M.S. Effect of contamination from direct sonication on characterization of nanofluid stability. Powder Technol. 2022, 399, 117157. [Google Scholar] [CrossRef]
  34. Koppel, D.E. Analysis of macromolecular polydispersity in intensity correlation spectroscopy: The method of cumulants. J. Chem. Phys. 1972, 57, 4814–4820. [Google Scholar] [CrossRef]
  35. ISO 22412; Particle Size Analysis—Dynamic Light Scattering (DLS). ISO: Geneva, Switzerland, 2017.
  36. Raval, N.; Maheshwari, R.; Kalyane, D.; Youngren-Ortiz, S.R.; Chougule, M.B.; Tekade, R.K. Chapter 10—Importance of Physicochemical Characterization of Nanoparticles in Pharmaceutical Product Development. In Basic Fundamentals of Drug Delivery; Tekade, R.K., Ed.; Advances in Pharmaceutical Product Development and Research; Academic Press: Cambridge, MA, USA, 2019; pp. 369–400. [Google Scholar] [CrossRef]
  37. Austin, J.; Fernandes, D.; Ruszala, M.; Hill, N.; Corbett, J. Routine, ensemble characterisation of electrophoretic mobility in high and saturated ionic dispersions. Sci. Rep. 2020, 10, 4628. [Google Scholar] [CrossRef] [Green Version]
  38. Malvern. The Diffusion Barrier Technique, Practical Aspects and Data Interpretation; Zetasizer Nano Application Note MRK1651-02. Available online: https://www.materials-talks.com/diffusion-barrier-method-the-practical-details/ (accessed on 24 November 2015).
  39. Liu, Z.; Bode, V.; Hadayati, P.; Onay, H.; Sudhölter, E.J. Understanding the stability mechanism of silica nanoparticles: The effect of cations and EOR chemicals. Fuel 2020, 280, 118650. [Google Scholar] [CrossRef]
  40. Ali, J.A.; Kolo, K.; Manshad, A.K.; Mohammadi, A.H. Recent advances in application of nanotechnology in chemical enhanced oil recovery: Effects of nanoparticles on wettability alteration, interfacial tension reduction, and flooding. Egypt. J. Pet. 2018, 27, 1371–1383. [Google Scholar] [CrossRef]
  41. Nelson, P.H. Pore-throat sizes in sandstones, tight sandstones, and shales. AAPG Bull. 2009, 93, 329–340. [Google Scholar] [CrossRef]
  42. Lindquist, W.B.; Venkatarangan, A.; Dunsmuir, J.; Wong, T.F. Pore and throat size distributions measured from synchrotron X-ray tomographic images of Fontainebleau sandstones. J. Geophys. Res. Solid Earth 2000, 105, 21509–21527. [Google Scholar] [CrossRef] [Green Version]
  43. Miaomiao, L.; Benbiao, S.C.T.; Xianyu, M. Relationship between pore throat and permeability of porous carbonate reservoir in the Middle East. Arab. J. Geosci. 2022, 15, 15. [Google Scholar] [CrossRef]
  44. Foroozesh, J.; Kumar, S. Nanoparticles behaviors in porous media: Application to enhanced oil recovery. J. Mol. Liq. 2020, 316, 113876. [Google Scholar] [CrossRef]
  45. ISO/TS 80004-2. Nanotechnologies—Vocabulary—Part 2: Nano-Objects; ISO: Geneva, Switzerland, 2015.
  46. Tombácz, E.; Szekeres, M. Surface charge heterogeneity of kaolinite in aqueous suspension in comparison with montmorillonite. Appl. Clay Sci. 2006, 34, 105–124. [Google Scholar] [CrossRef]
  47. Korpany, K.V.; Majewski, D.D.; Chiu, C.T.; Cross, S.N.; Blum, A.S. Iron Oxide Surface Chemistry: Effect of Chemical Structure on Binding in Benzoic Acid and Catechol Derivatives. Langmuir 2017, 33, 3000–3013. [Google Scholar] [CrossRef] [PubMed]
Figure 1. (a) Ion distribution in the proximity of a negatively charged particle. (b) Interaction between particles with long and short Debye length. (c) Effect of ionic concentration on Debye length.
Powders 02 00001 g001
Figure 2. Effect of N a C l concentration and temperature on the time evolution of Z a v and P d I for 0.1 wt% silica nanofluids at initial pH.
Powders 02 00001 g002
Figure 3. Effect of N a C l concentration and temperature on the time evolution of TSI for 0.1 wt% silica nanofluids at initial pH.
Powders 02 00001 g003
Figure 4. Effect of salt composition on Z a v and TSI as a function of time for 0.1 wt% pHi silica nanofluids at 25 °C.
Powders 02 00001 g004
Figure 5. Effect of salt composition on Z a v and TSI as a function of time for 0.5 wt% pHi silica nanofluids at 25 °C.
Powders 02 00001 g005
Figure 6. Zeta potential as a function of pH for 0.1, 0.5, and 1 wt% silica nanofluids with 0.1 g/L N a C l .
Powders 02 00001 g006
Figure 7. Zeta potential as a function of pH for 1 wt% silica nanofluids with different N a C l concentrations (g/L).
Powders 02 00001 g007
Figure 8. Z a v as a function of time for 0.1 wt% nanofluids at different N a C l concentrations (g/L), temperatures, and for pH ≥ pHi.
Powders 02 00001 g008
Figure 9. Schematic diagram of ion distribution for silica nanoparticles at initial and basic pH.
Powders 02 00001 g009
Figure 10. Schematic diagram of ion distribution for silica nanoparticles at acid pH.
Powders 02 00001 g010
Figure 11. Z a v as a function of time for 0.1, 0.5, and 1 wt% nanofluids for pH ≤ pHi at 42 g/L N a C l and 80 °C.
Powders 02 00001 g011
Figure 12. Z a v as a function of time for 0.1 wt% N a C l /MgCl 2 and seawater nanofluids for pH ≤ pHi at 80 °C.
Powders 02 00001 g012
Figure 13. Z a v as a function of time for 0.5 wt% N a C l /MgCl 2 and seawater nanofluids for pH ≤ pHi at 80 °C.
Powders 02 00001 g013
Table 1. Main composition of ASTM D1141-98 substitute seawater.
CompoundConcentration (g/L)
NaCl24.53
MgCl 2 5.2
Na 2 SO 4 4.09
CaCl 2 1.16
KCl0.695
NaHCO 3 0.695
KBr0.101
H 3 BO 3 0.027
SrCl 2 0.025
NaF0.003
Table 2. Initial pH of silica nanofluid as a function of initial A200 concentration.
Silica ConcentrationpHi
0.1 wt%4.91 ± 0.26
0.5 wt%4.57 ± 0.38
1 wt%4.20 ± 0.16
Table 3. Ionic strength of N a C l base fluids.
NaCl (g/L)Ionic Strength (mol/L)
11.7 × 10 2
101.7 × 10 1
427.2 × 10 1
1001.7
Table 4. Composition of base fluids.
Base Fluid
142 g/L NaCl
230.1 g/L NaCl + 6.2 g/L MgCl 2
330.1 g/L NaCl + 7.2 g/L CaCl 2
Table 5. Stability in days (according to TSI < 10) of 0.1 wt% nanofluids at different N a C l concentrations, temperatures, and for pHi ≥ 10.
[NaCl] (g/L)pHipH 8pH 10
25 °C80 °C25 °C80 °C25 °C80 °C
0>28>28>28>28>28>28
1>2821 ± 2>28>28>28>28
10>282 ± 0.5>28>28>28>28
4228 ± 1<11 ± 0.5<1<1<1
Table 6. Stability in days (according to TSI < 10) for 0.1, 0.5, and 1 wt% nanofluids as a function of pH ≤ pHi at 42 g/L N a C l and 80 °C.
pH0.1 wt%0.5 wt%1 wt%
pHi<1<1<1
326 ± 24 ± 11.5 ± 0.5
2>28>287 ± 1.5
1.5>28>288 ± 1
Table 7. Stability in days (according to TSI < 10) of 0.1 and 0.5 wt% seawater nanofluids as a function of pH ≤ pHi at 80 °C.
pH0.1 wt%0.5 wt%
NaCl/MgCl 2 SeawaterNaCl/MgCl 2 Seawater
pHi<1<1< 1< 1
316 ± 212 ± 24 ±13 ± 1
2> 28> 2820 ±315 ± 1
1.5> 28> 2824 ±321 ± 3
Disclaimer/Publisher’s Note: The statements, opinions and data contained in all publications are solely those of the individual author(s) and contributor(s) and not of MDPI and/or the editor(s). MDPI and/or the editor(s) disclaim responsibility for any injury to people or property resulting from any ideas, methods, instructions or products referred to in the content.

