

Assessment of Winter Urban Heat Island in Ljubljana, Slovenia


Abstract
:1. Introduction
- Greater absorption of solar radiation due to repeated reflection from buildings and a larger area receiving radiation (building walls);
- Lower sky view factor that prevents effective night-time cooling of the urban surface. Tall buildings result in a less visible sky, which hinders effective longwave radiation from the surface to the sky;
- Greater absorption of radiation and delayed emission due to buildings and paved urban surfaces;
- A greater proportion of absorbed heat is used for conversion to sensible heat and less for latent heat. This is due to fewer water surfaces and greater dryness of the urban surface;
- Release of heat by human activities: industry, transport, heating, etc., to some extent, human metabolism can also contribute.
- To present the temperature characteristics of the winter UHI in Ljubljana during radiation weather conditions using mobile measurements in a dense spatial network, since such a study has not been conducted before. In this way, much more accurate data were obtained on a denser spatial scale, and thus a more accurate picture of the winter UHI under radiation conditions. Our study also differs from previous studies of the UHI in Ljubljana, in that our results are based on a combination of mobile measurements in a dense spatial network (combination of car and bicycle measurements) and climatological measurements at stationary stations.
- To compare the temperature profiles of the UHI obtained by mobile measurements in 2000 and 2022 to assess the change in UHI intensity over 22 years.
- To combine the UHI intensity data with the urban population data to provide information on how many urban residents are exposed to the winter effect of the UHI in the radiation type of weather and to what extent. Winter UHI causes less cold stress, and fewer cold-related diseases; it also results in lower mortality of people exposed to cold (homeless people) [23], lower energy consumption for heat generation [24], and different ecological conditions in the city compared to the rural environment, such as a longer growing season, better conditions for insect life in winter, etc.
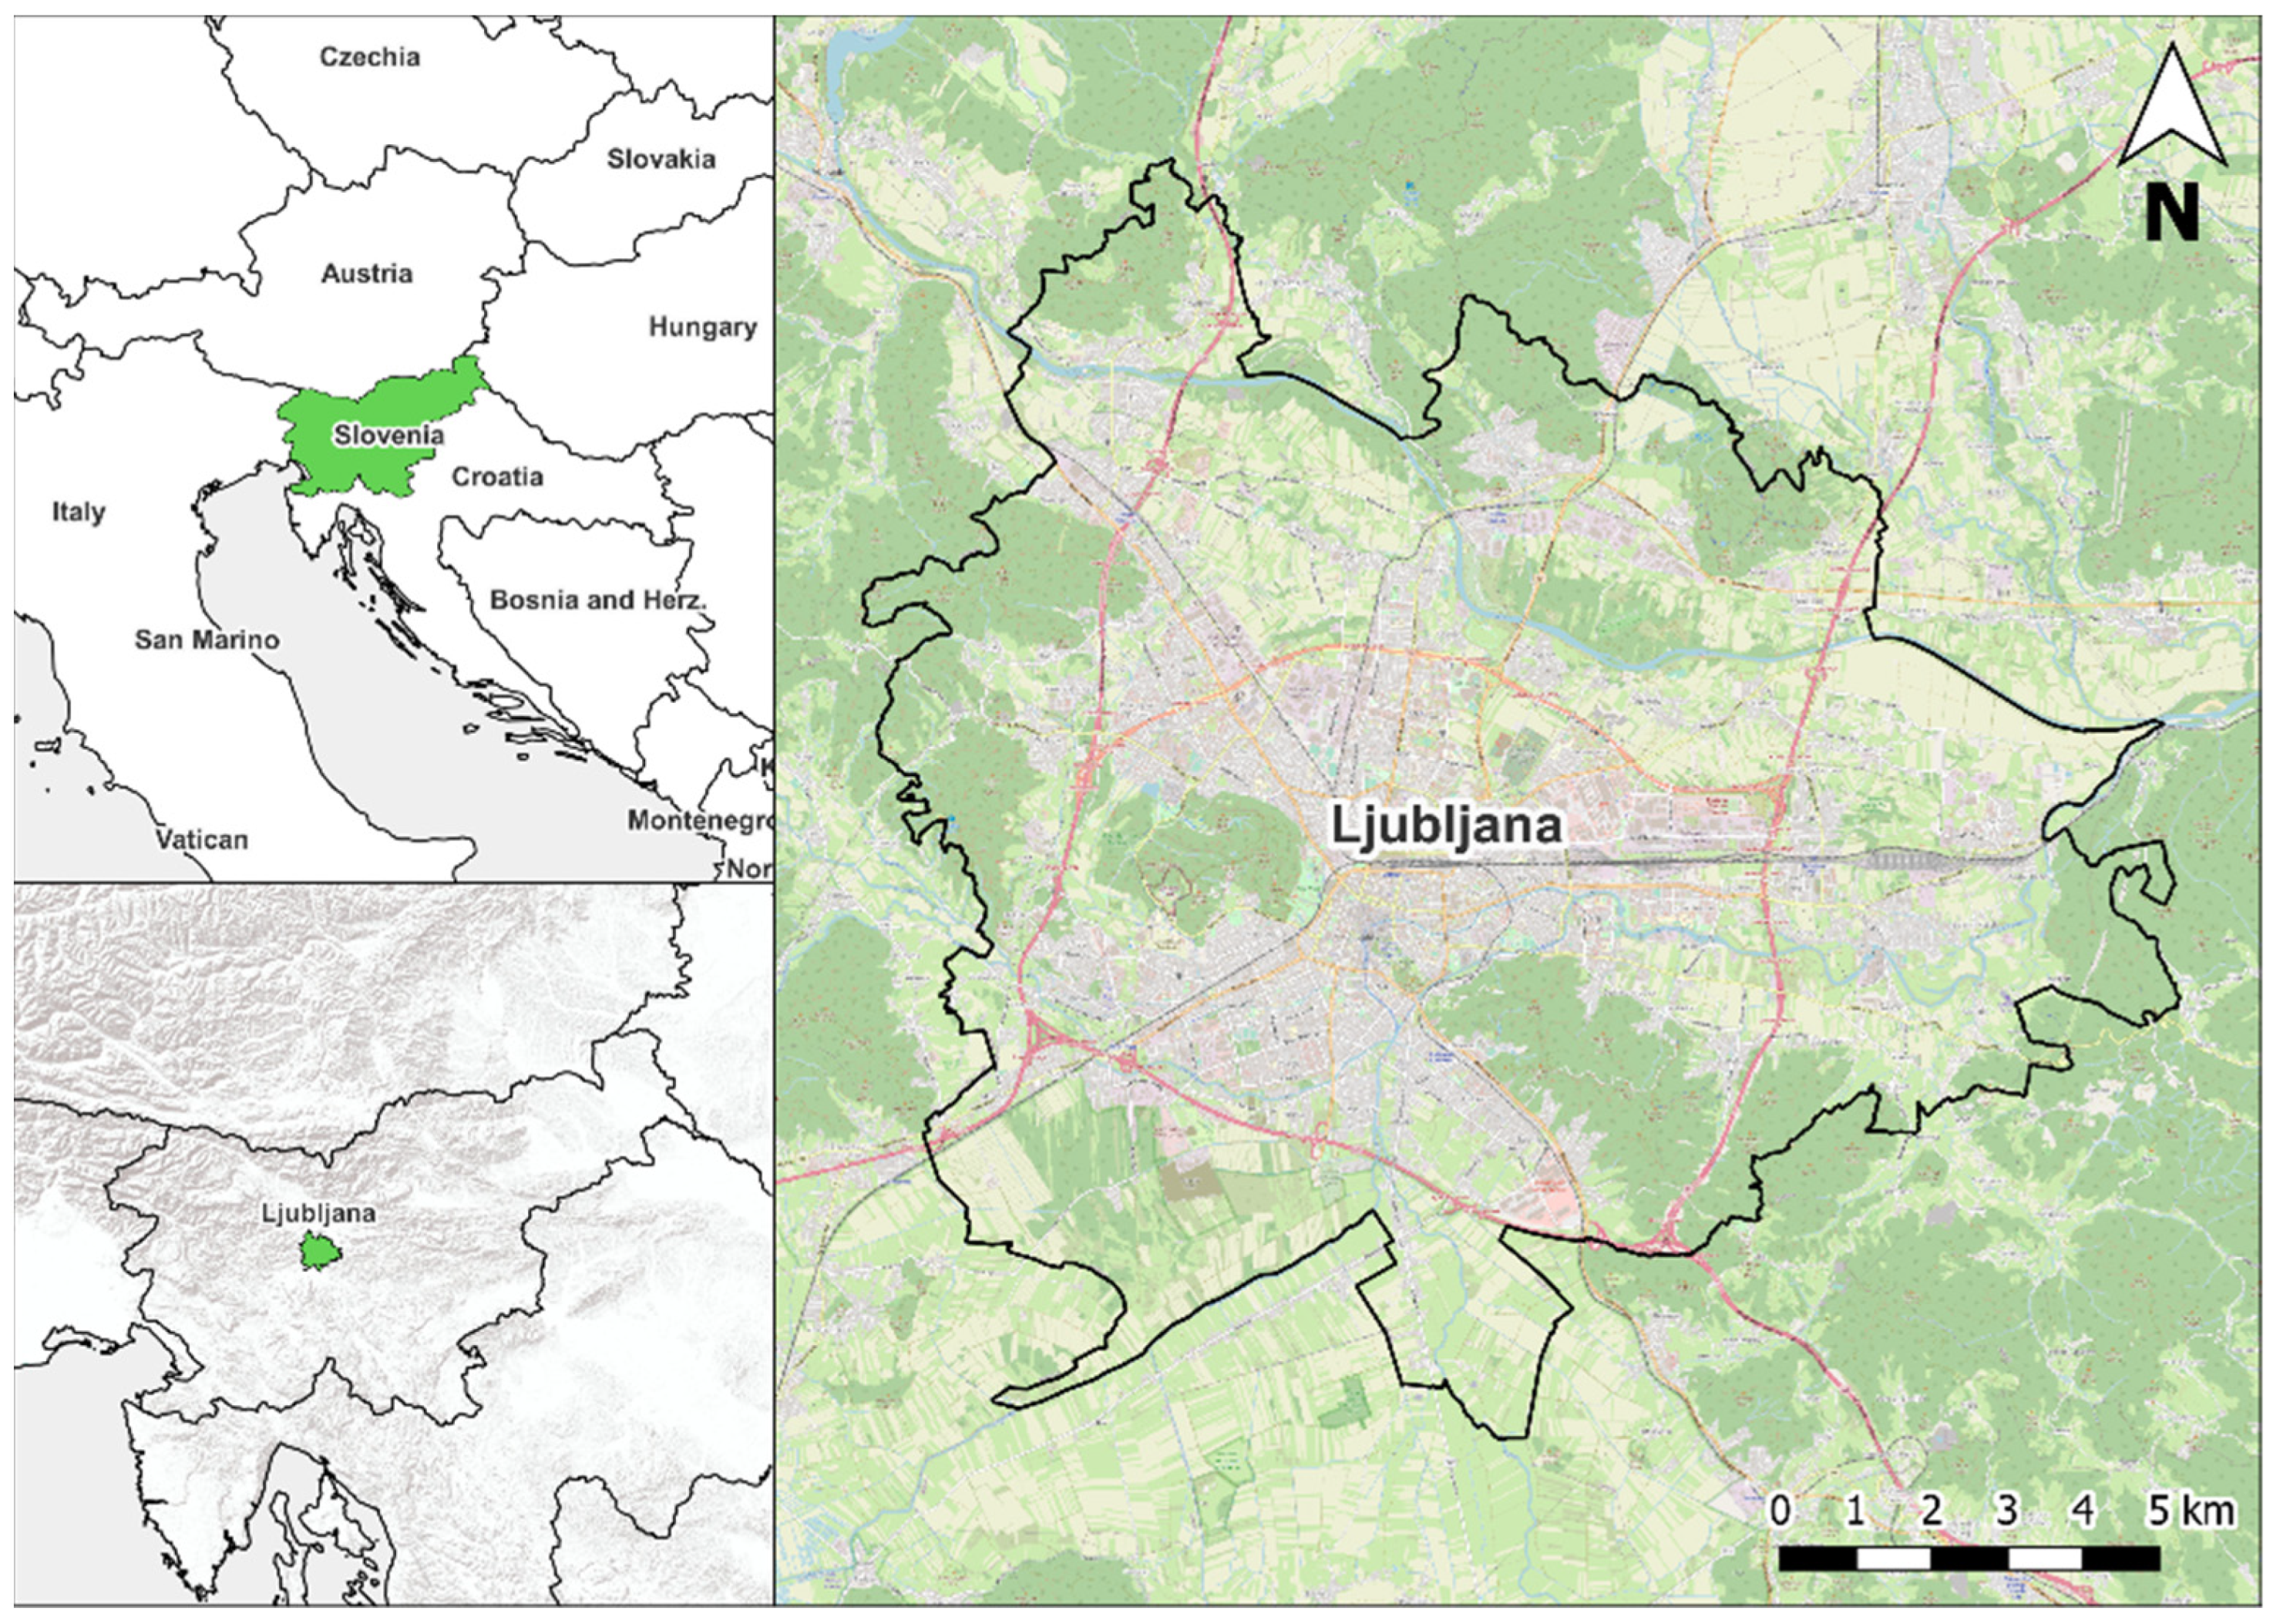
2. Study Area and Methods
2.1. Study Area
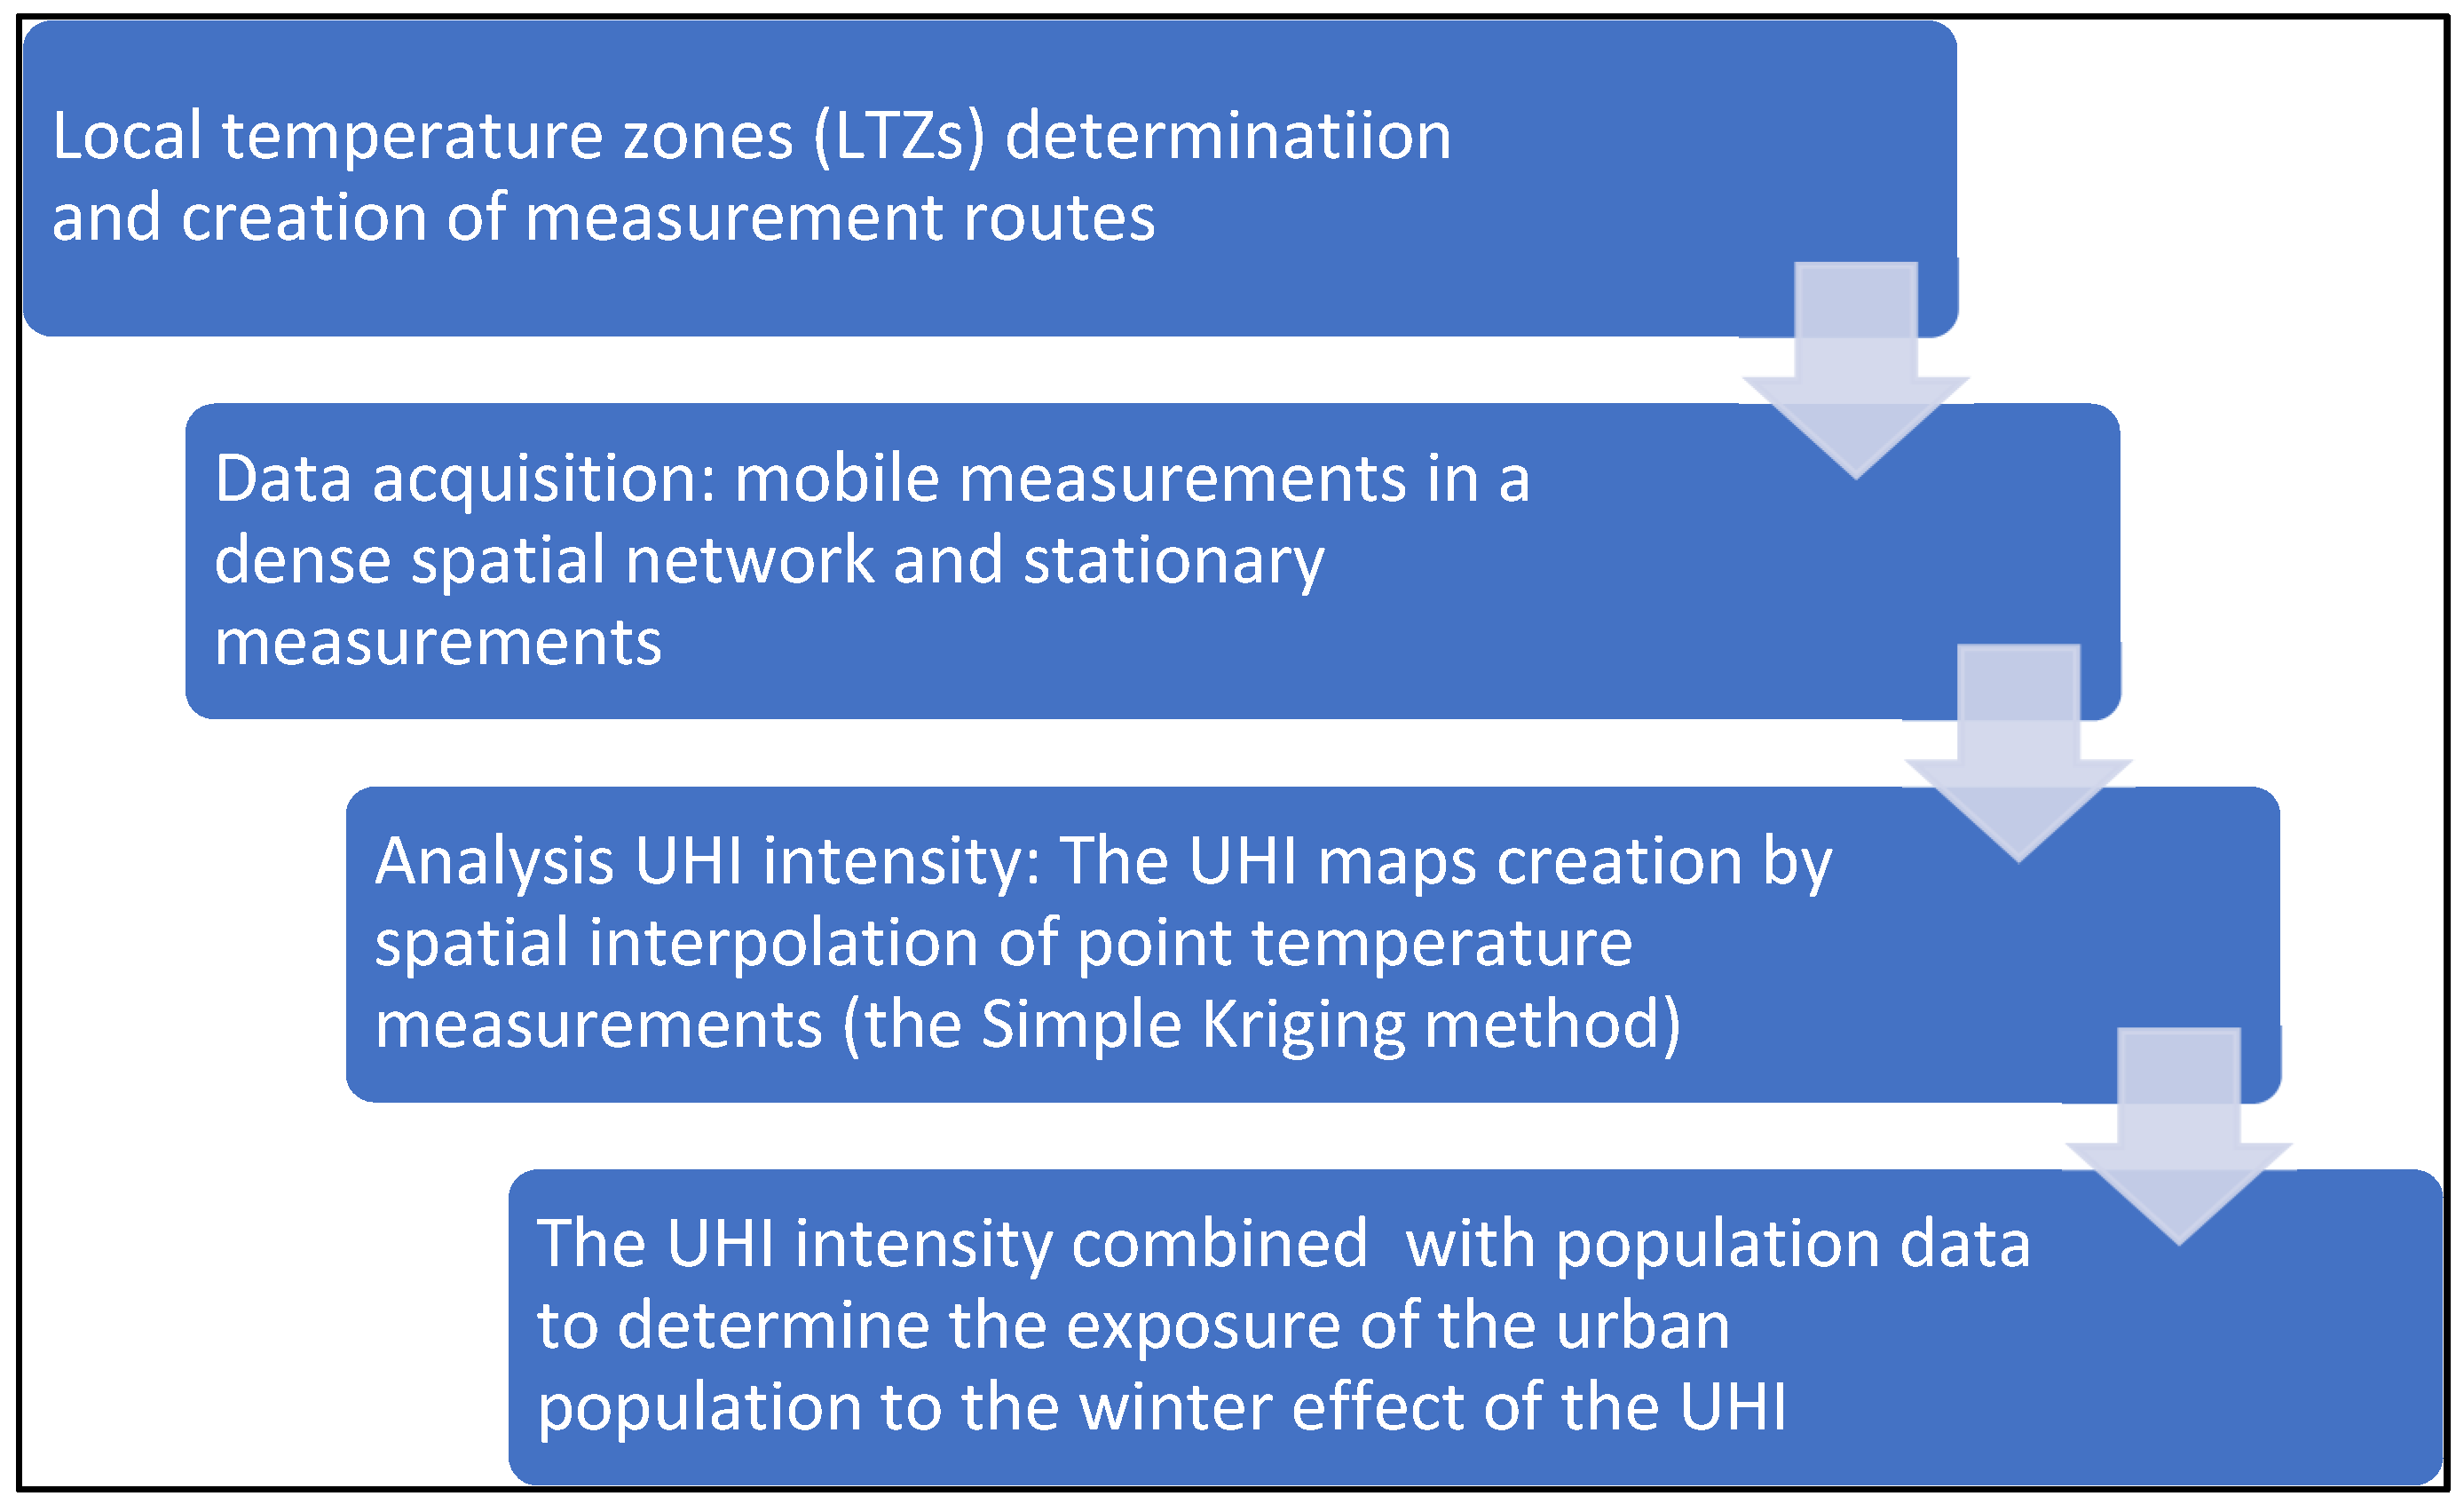
2.2. Methods
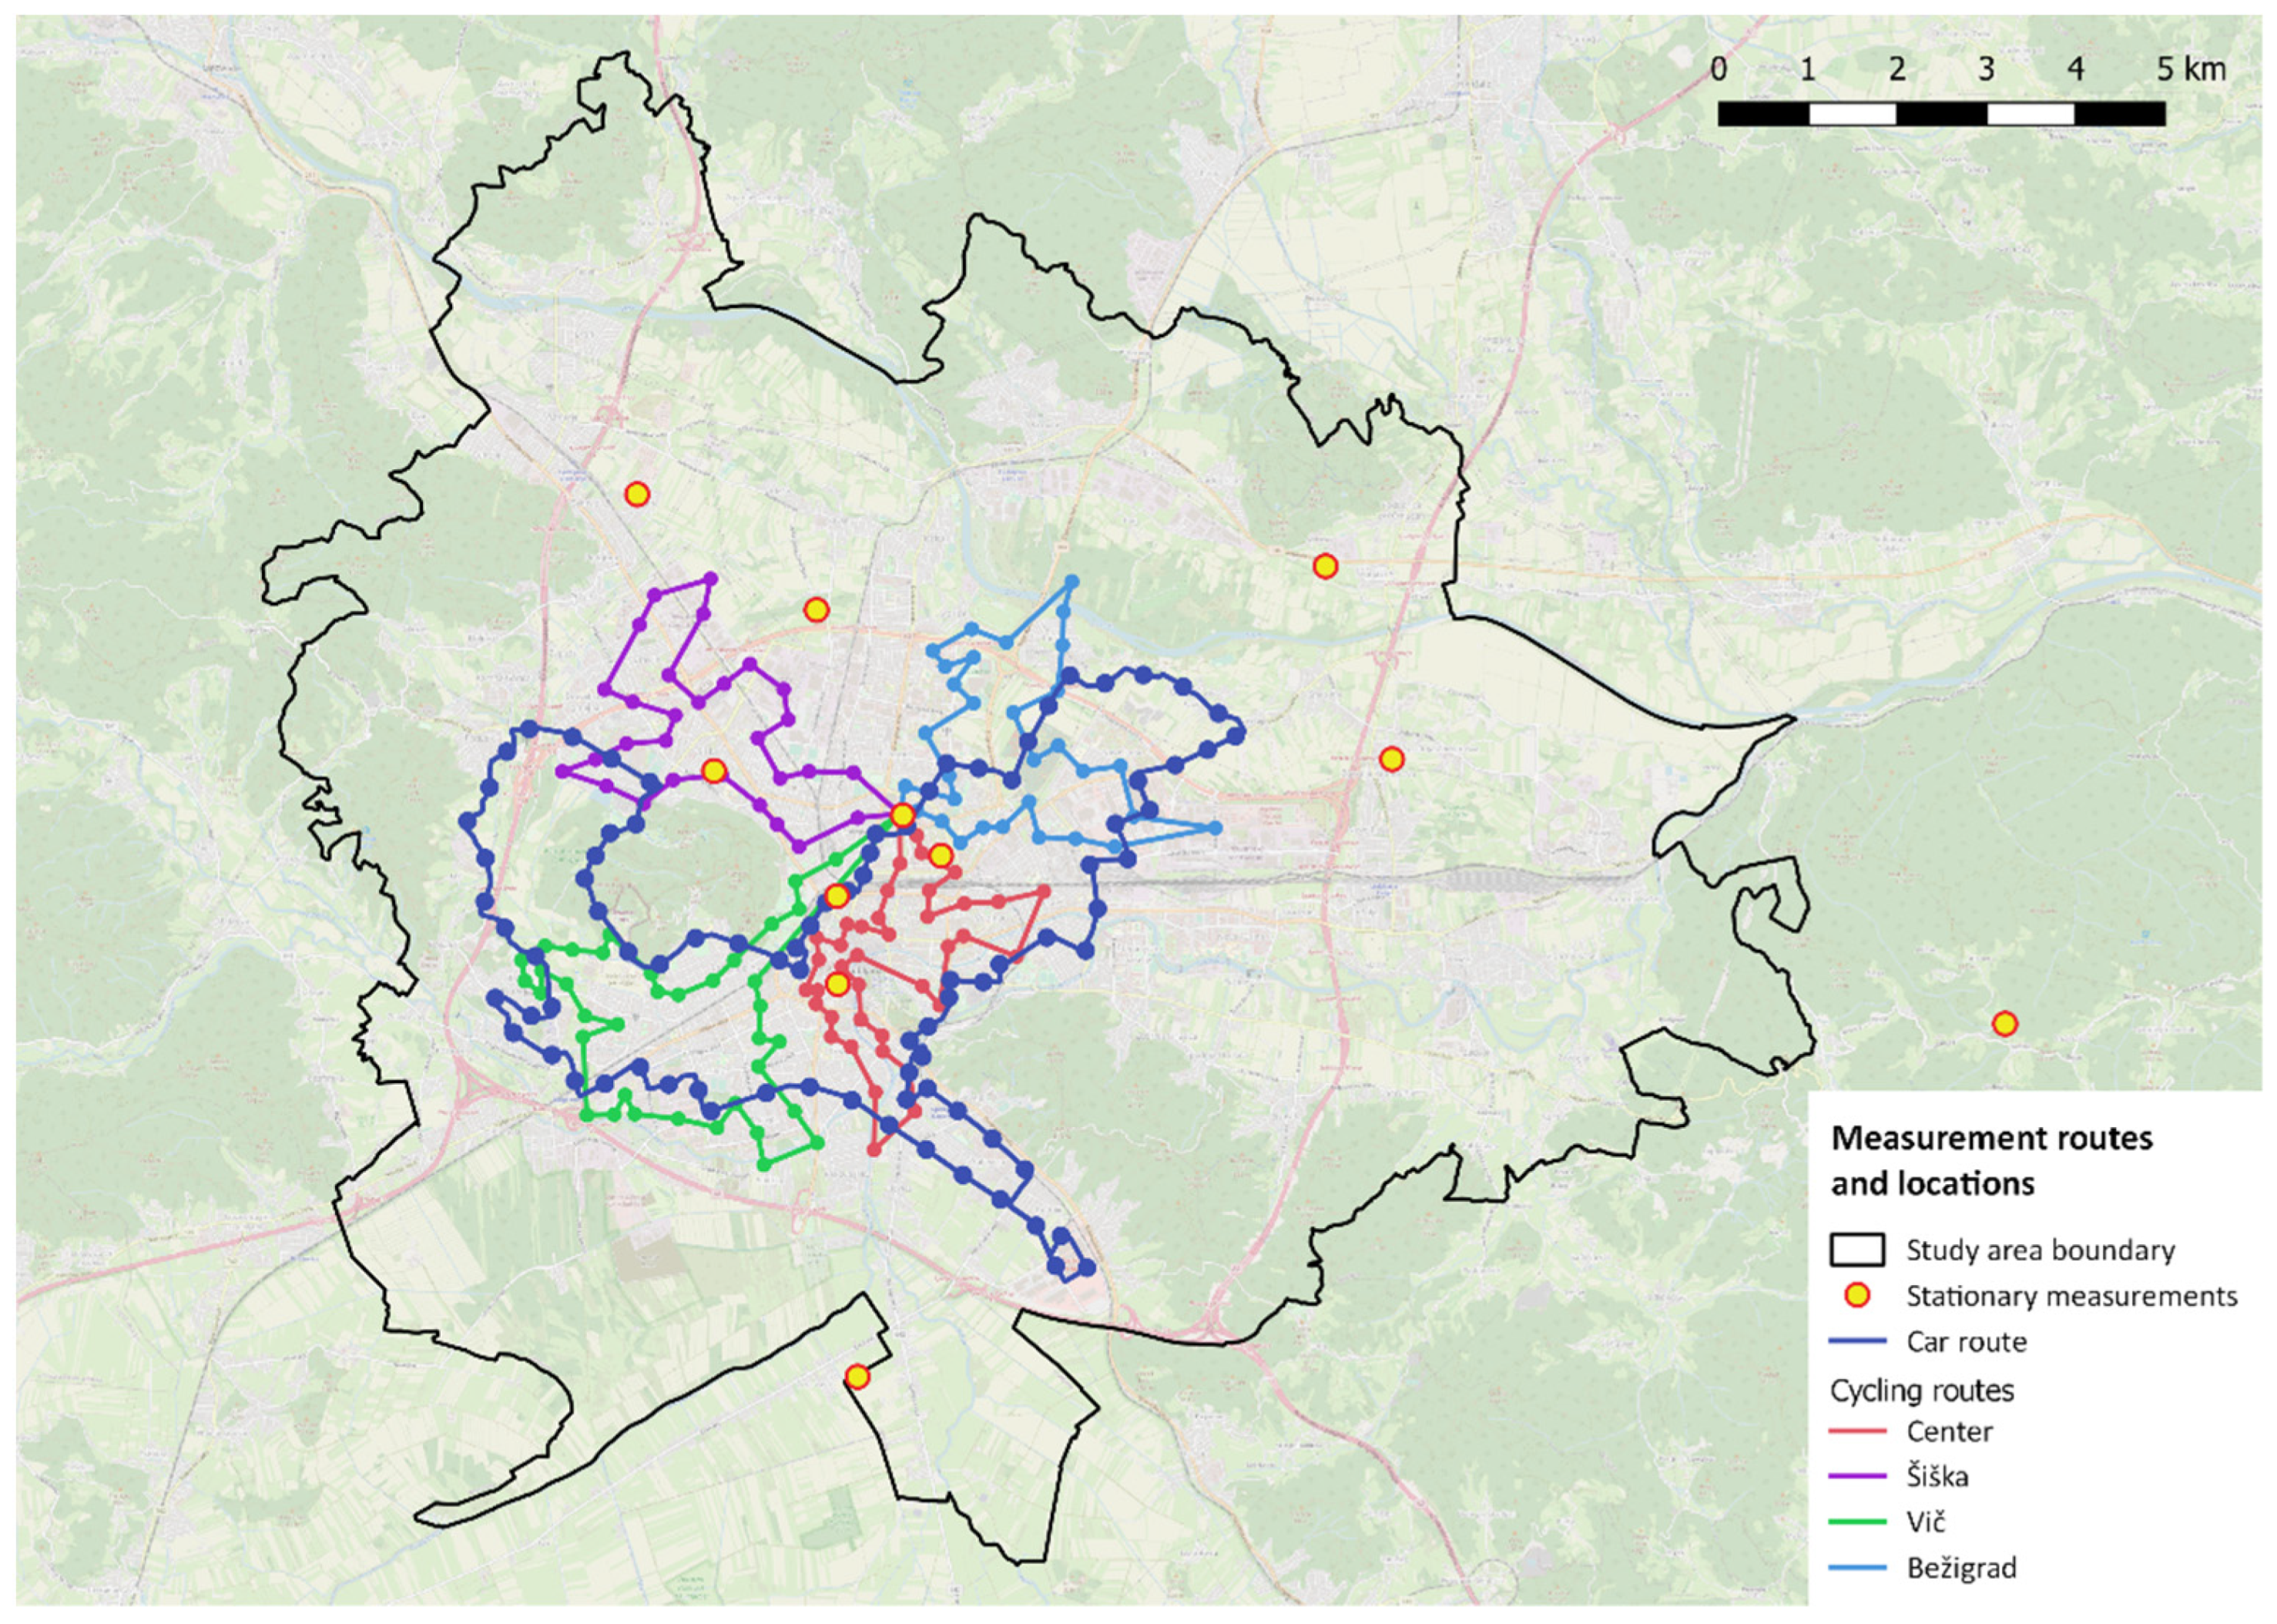
2.3. Mobile Measurements and Determination of Measurement Routes
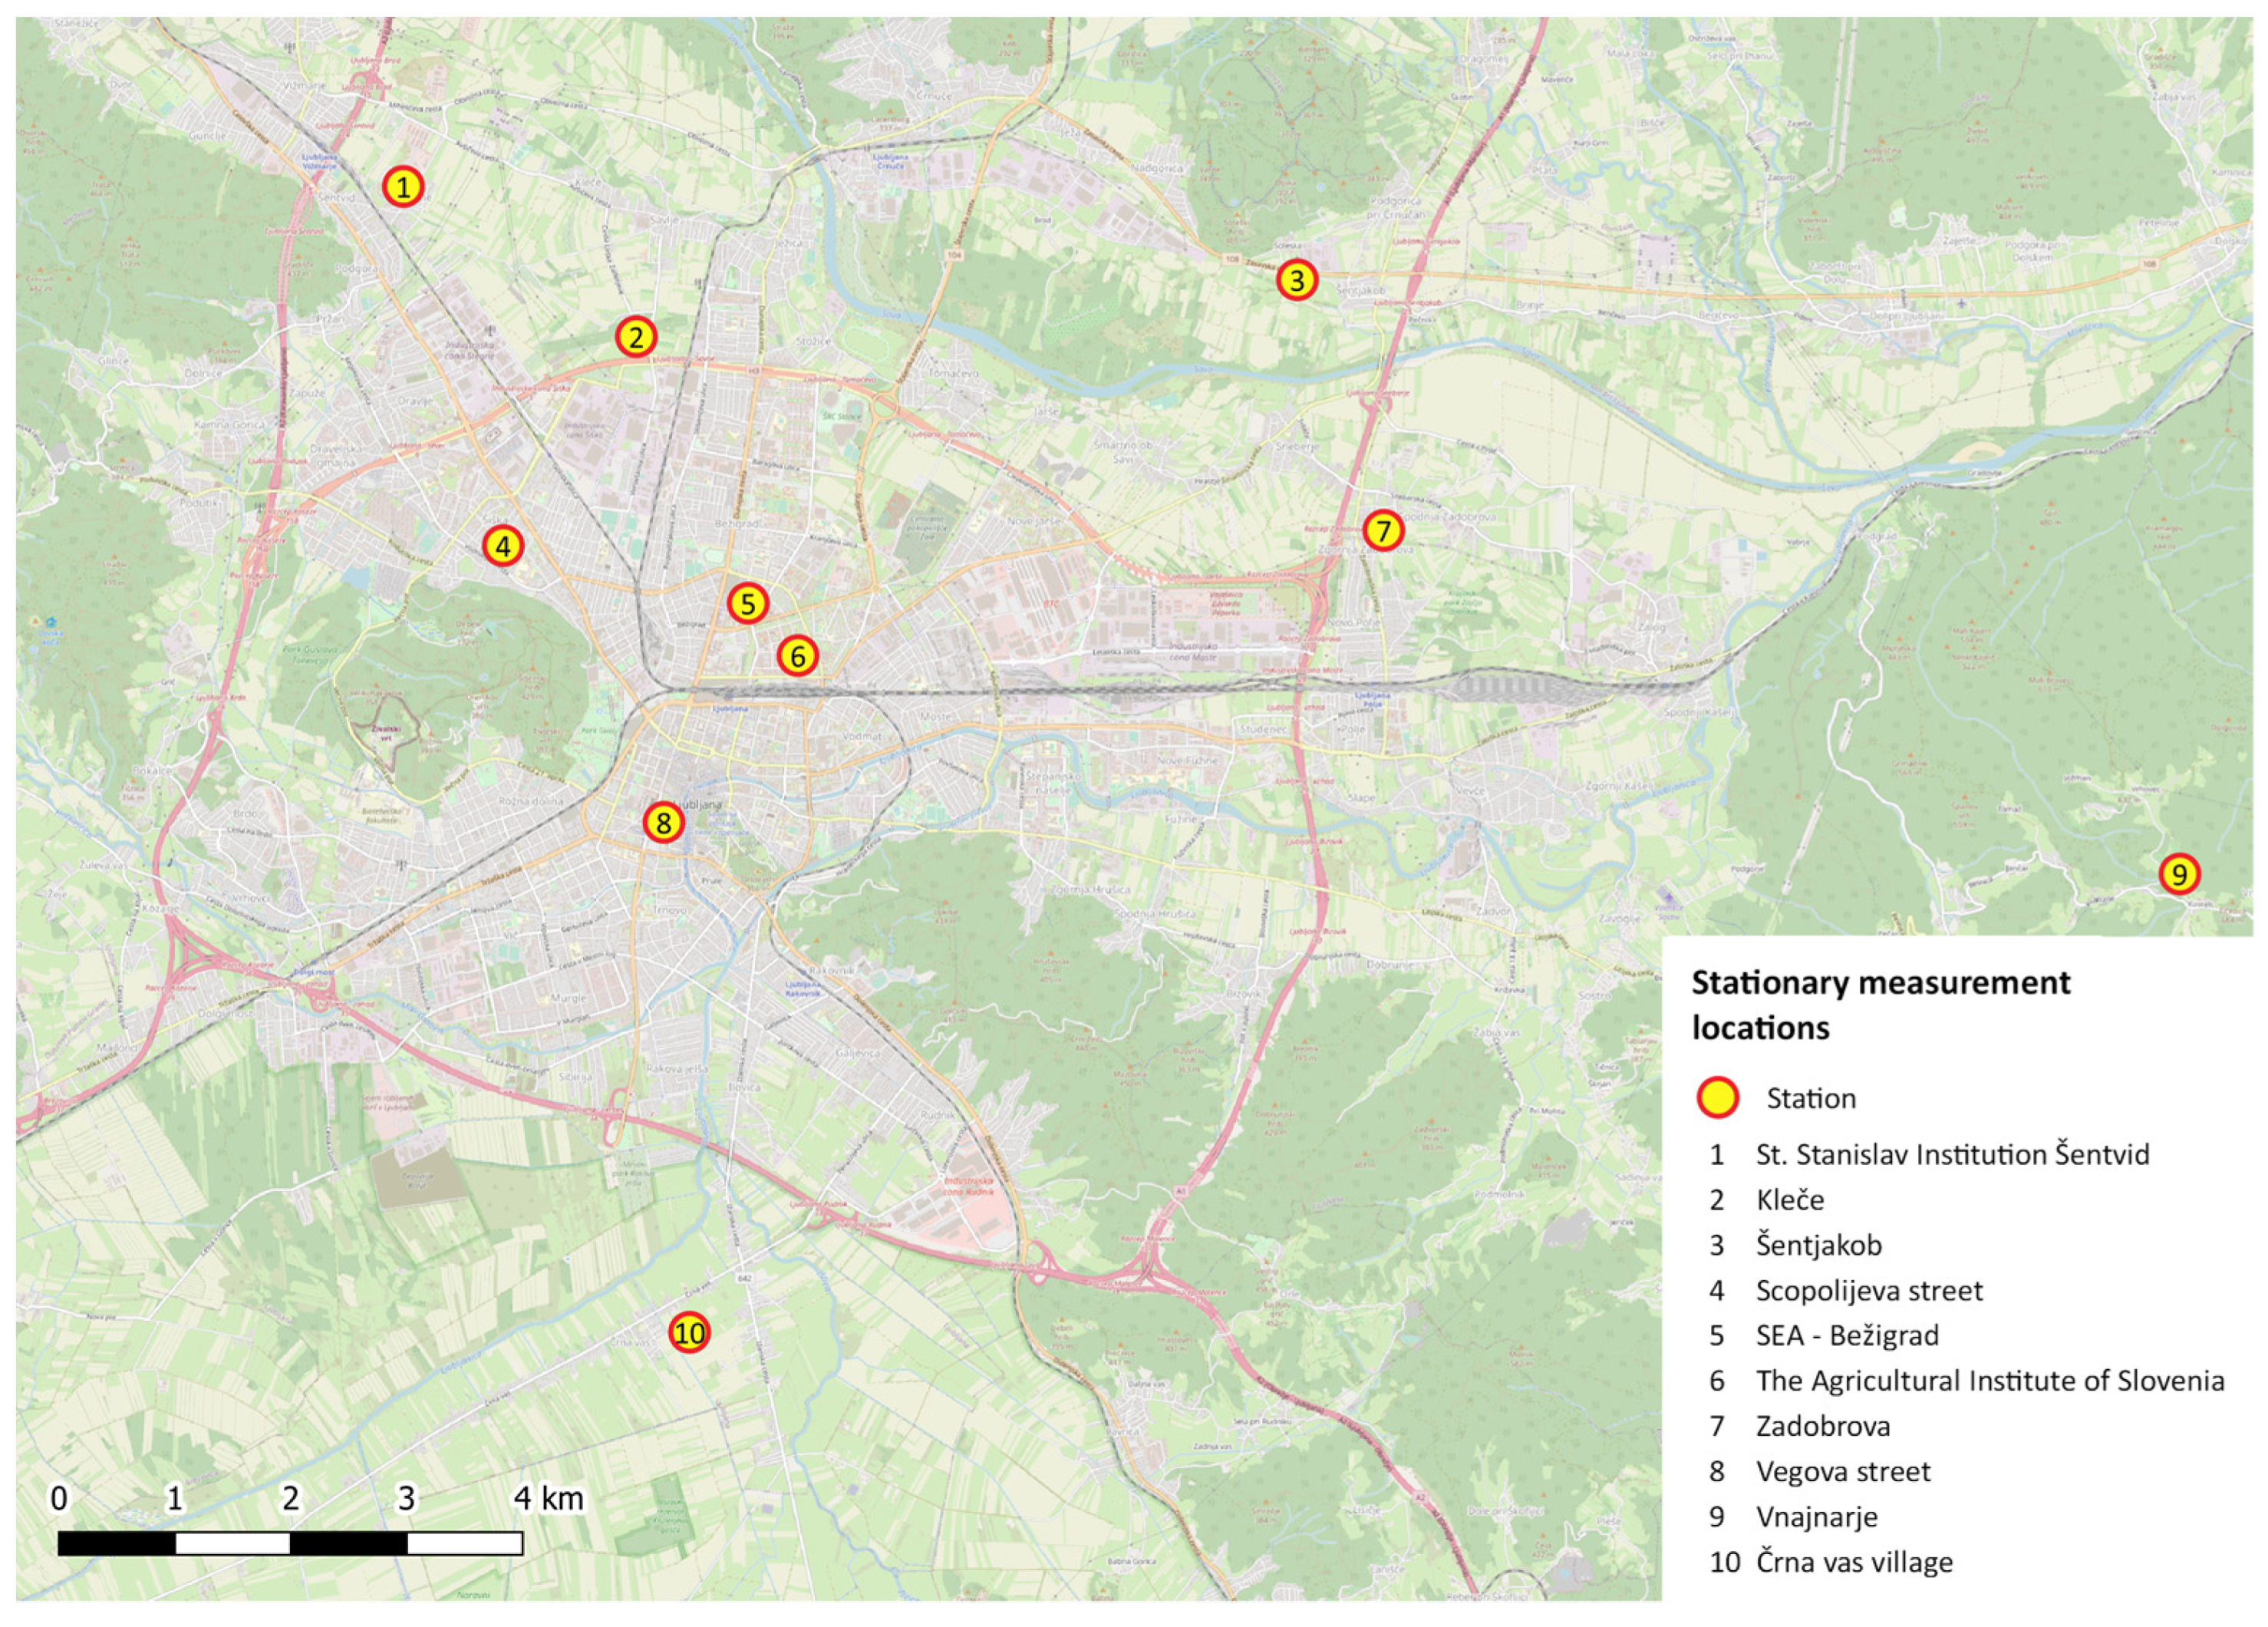
2.4. Stationary Temperature Measurements
3. Winter UHI Intensity and Discussion
3.1. Analysis of Data from Stationary Measurements
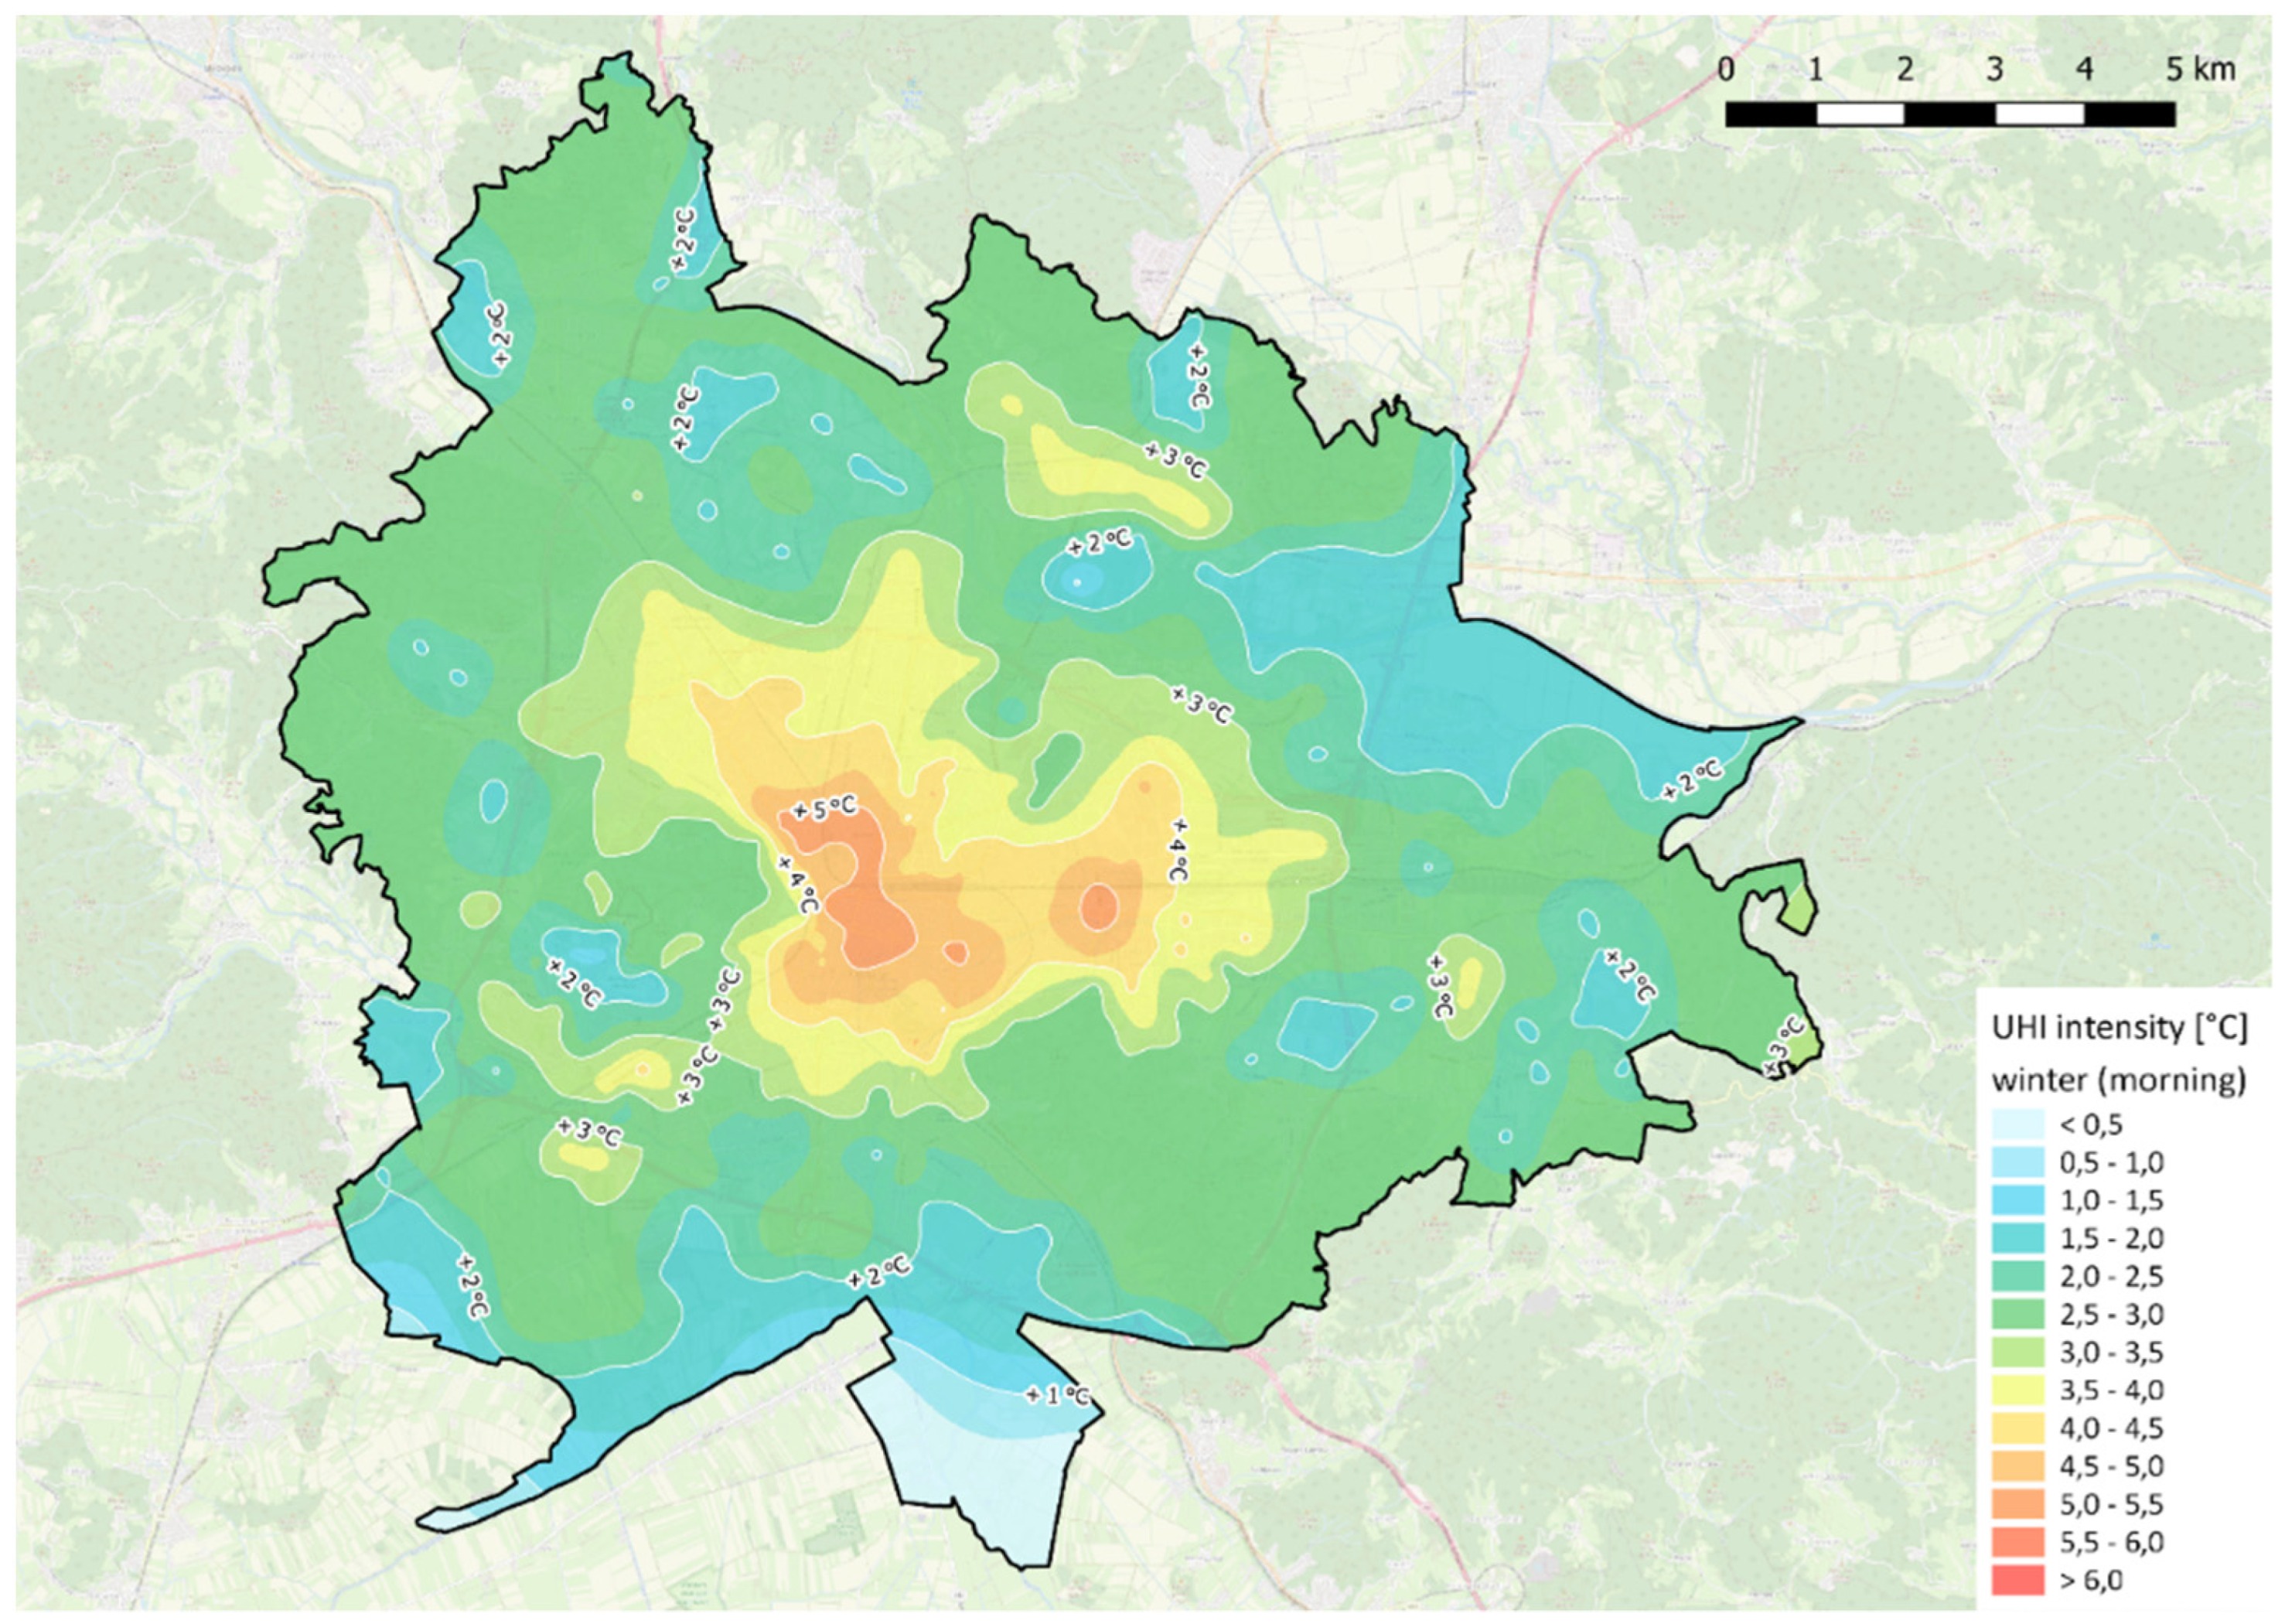
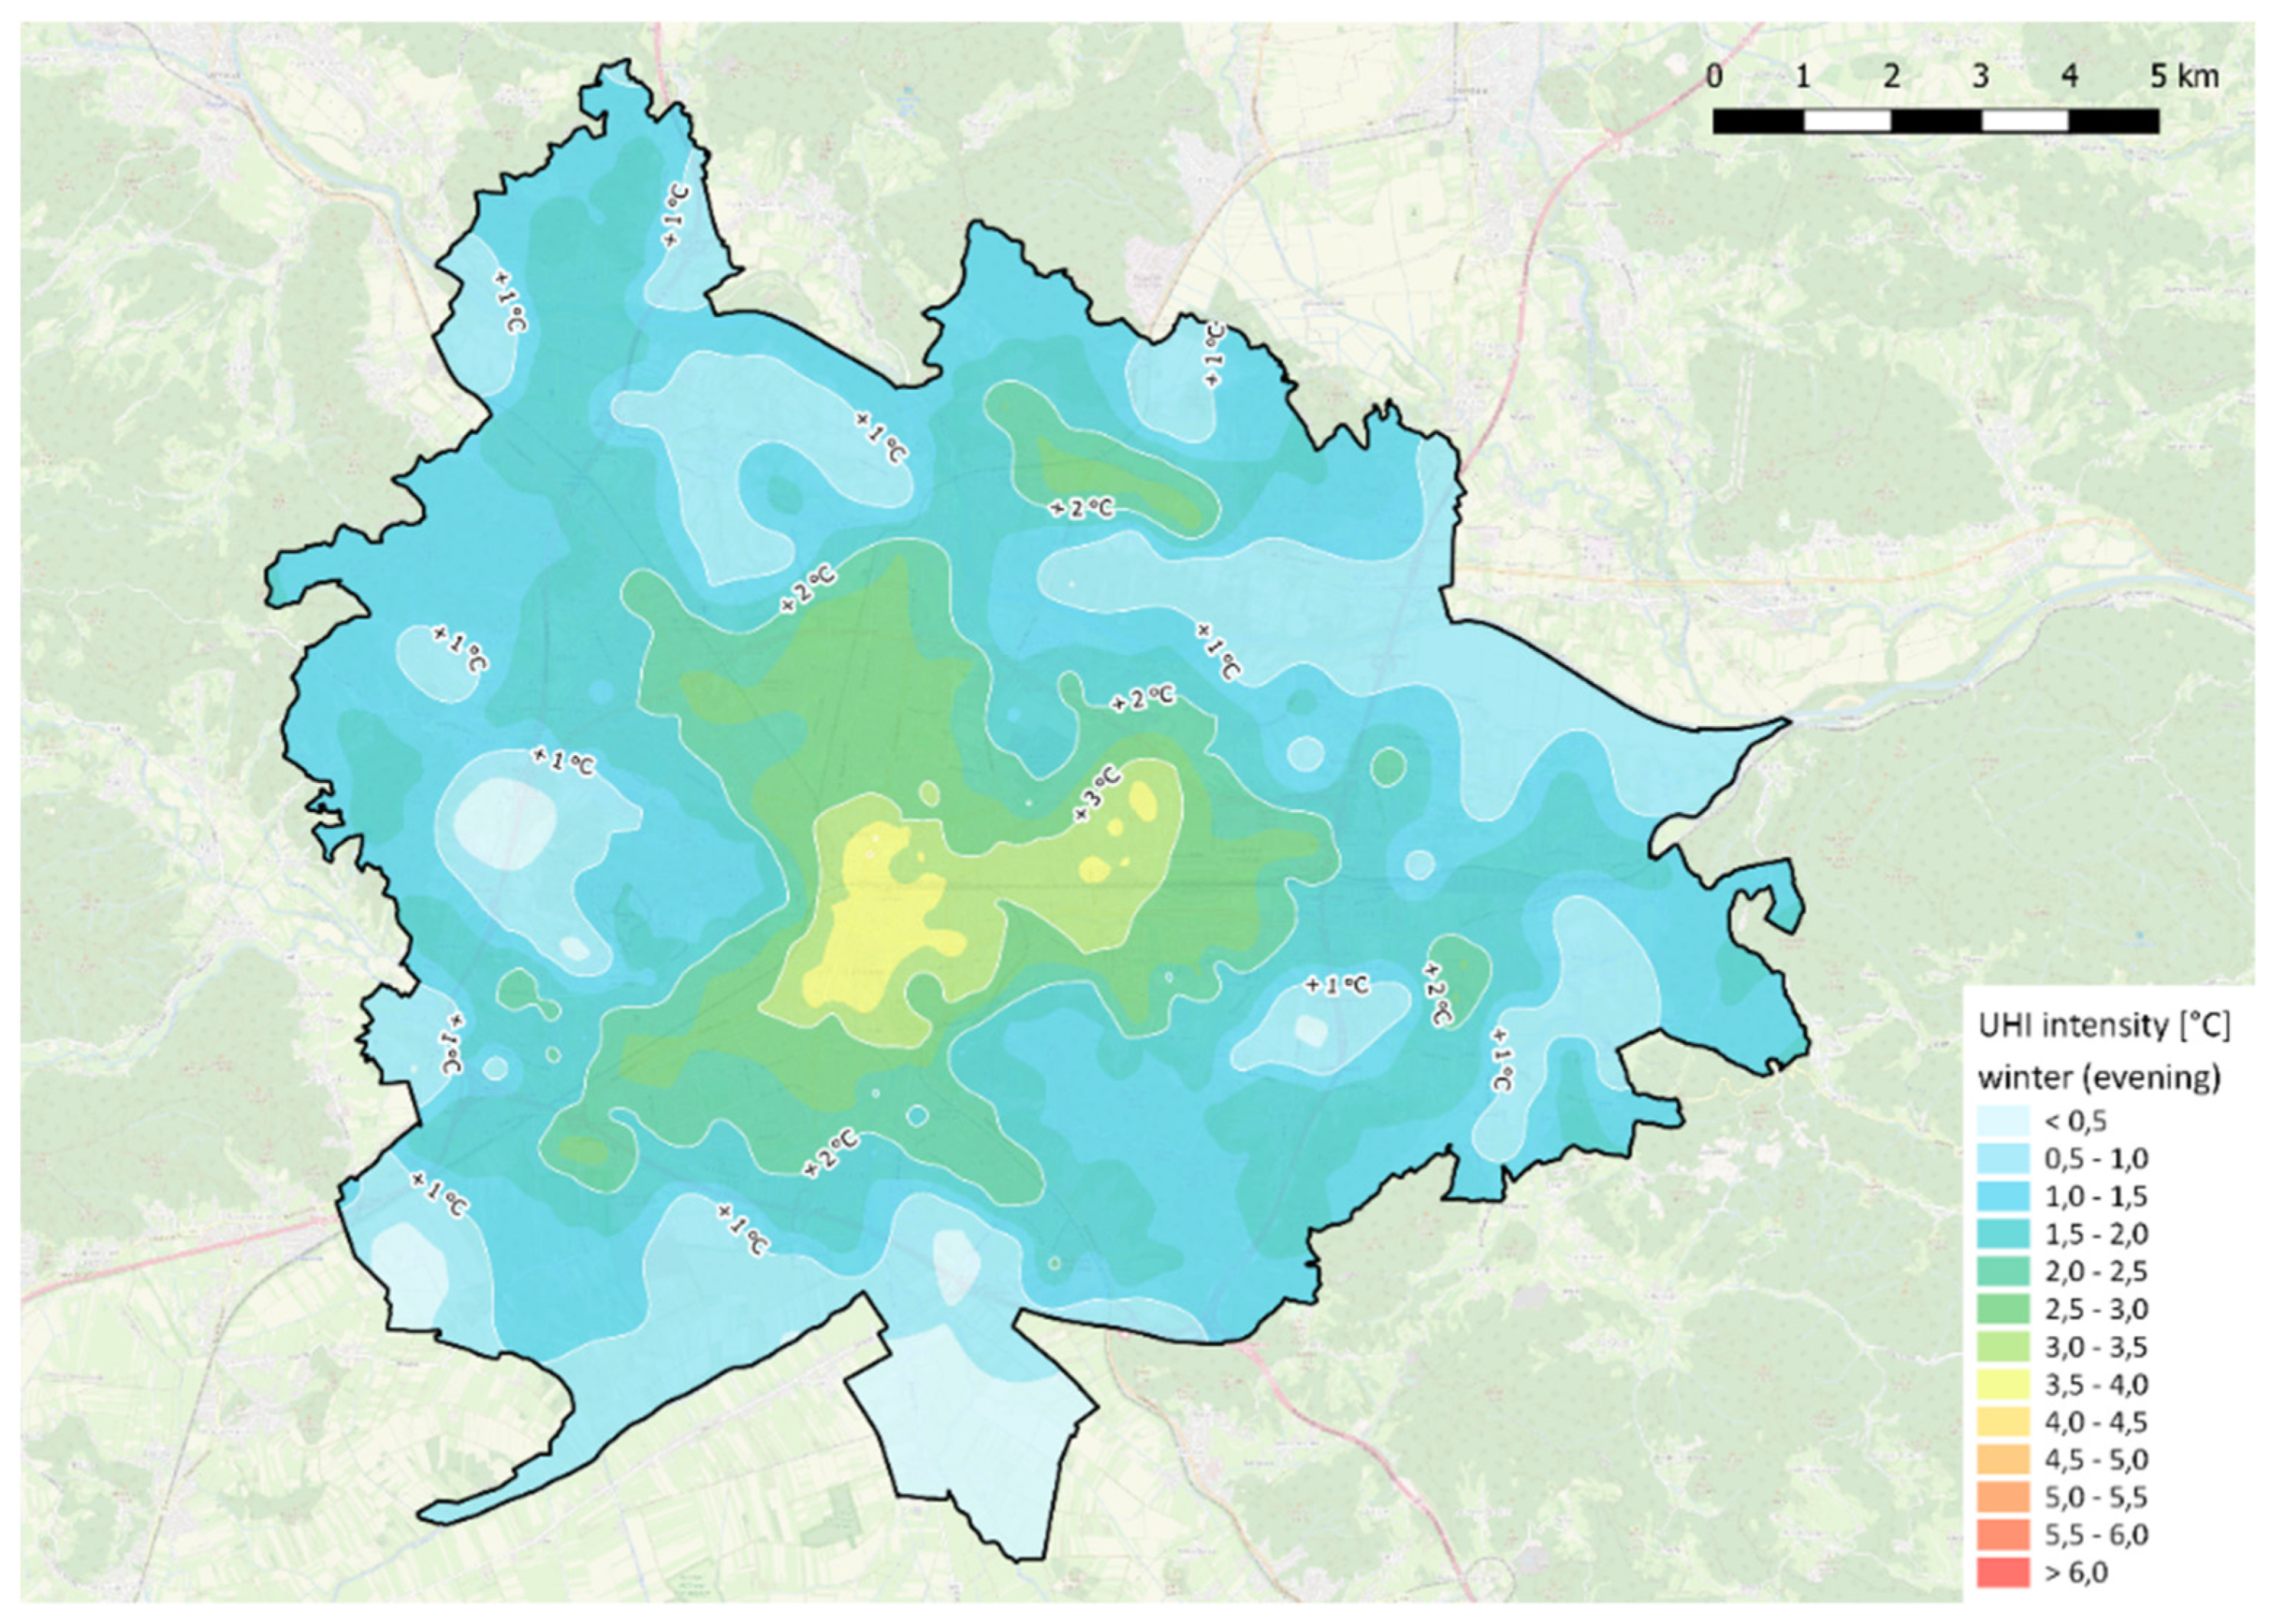
3.2. Analysis of Data from Mobile Measurements
3.3. Comparison of UHI Intensity from 1998 to 2022
4. Conclusions
Author Contributions
Funding
Data Availability Statement
Acknowledgments
Conflicts of Interest
References
- United Nations. Department of Economics and Social Affairs. 2022. Urban and Rural Populations. Available online: https://population.un.org/wup/Download/ (accessed on 23 October 2022).
- Urban Population (% of Urban Population). United Nations Population Division. World Urbanization Prospects: 2018 Revision. Available online: https://data.worldbank.org/indicator/SP.URB.TOTL.IN.ZS (accessed on 23 October 2022).
- Oke, T.R. The energetic basis of the urban heat island. Quart. J. R. Met. Soc. 1982, 108, 1–24. [Google Scholar] [CrossRef]
- Myrup, L.O. A Numerical Model of Urban Heat Island. J. Appl. Meteorol. 1969, 8, 908–918. [Google Scholar] [CrossRef]
- Bornstein, R.D. Observations of the Urban Heat Island Effect in New York City. J. Appl. Meteorol. 1968, 7, 575–582. [Google Scholar] [CrossRef]
- Jernej, S. Analiza Klime Mesta Ljubljane; Municipality of Ljubljana: Ljubljana, Slovenia, 2000; p. 252. [Google Scholar]
- Rizwan, A.M.; Dennis, Y.C.L.; Liu, C. A review on the generation, determination and mitigation of Urban Heat Island. J. Environ. Sci. 2008, 20, 120–128. [Google Scholar] [CrossRef]
- Gedzelman, S.D.; Austin, S.; Cermak, R.; Stefano, N.; Partridge, S. Mesoscale aspects of the Urban Heat Island around New York City. Theor. Appl. Climatol. 2003, 75, 29–42. [Google Scholar] [CrossRef]
- Kassomenos, P.A.; Katsoulis, B.D. Mesoscale and macroscale aspects of the morning urban heat island around Athens, Greece. Meteorol. Atmos. Phys. 2006, 94, 209–218. [Google Scholar] [CrossRef]
- Chandler, T.J. Night-time temperatures in relation to Leicester’s urban form. Met. Mag. 1967, 96, 244–250. [Google Scholar]
- Lee, D.O. Rural Atmospheric Stability and the Intensity of London’s Heat Island. Weather 1975, 30, 102–109. [Google Scholar] [CrossRef]
- Unwin, D.J. The synoptic climatology of Birmingham’s urban heat island 1965–1974. Weather 1980, 35, 43–50. [Google Scholar] [CrossRef]
- Savić, S.; Lužanin, Z.; Milošević, D.; Kresoja, M. Intra-urban analysis of air temperature in Central European city. In Proceedings of the 10th International Conference on Urban Climate—ICUC10, New York, NY, USA, 6–10 August 2018. [Google Scholar]
- Pongrácz, R.; Bartholy, J.; Dezső, Z. Application of remotely sensed thermal information to urban climatology of Central European cities. Phys. Chem. Earth Parts A/B/C 2010, 35, 95–99. [Google Scholar] [CrossRef]
- Fezer, F. Das Klima der Städte; Perthes: Gotha, Germany, 1995; p. 199. [Google Scholar]
- Maradin, M.; Filipčić, A. Urban heat island of Zagreb in summer and winter season. In Proceedings of the International Scientific Conference GEOBALCANICA, Ohrid, Northern Makedonija, 15–16 May 2018; Radevski, I., Komornicki, T., Wang, J., Romanescu, G., Djurović, P., Holt-Jensen, A., Karacostas, T., Bagoli Simo, P., Panidi, E., Zorn, M., et al., Eds.; Geobalcanica Society: Skopje, Northern Macedonia, 2018; pp. 3–13. [Google Scholar]
- Milovanović, B.; Radovanović, M.; Schneider, C. Seasonal distribution of urban heat island intensity in Belgrade (Serbia). J. Geogr. Inst. Cvijic. 2020, 70, 163–170. [Google Scholar] [CrossRef]
- Imhoff, M.L.; Zhang, P.; Wolfe, R.E.; Bounoua, L. Remote sensing of the urban heat island effect across biomes in the continental USA. Rem. Sens. Environ. 2010, 114, 504–513. [Google Scholar] [CrossRef]
- Gams, I.; Krevs, M. Town Climate in Slovenia. Geogr. Obz. 1997, 44, 20–23. (In Slovenian) [Google Scholar]
- Ogrin, D.; Krevs, M. Assessing urban heat island impact on long-term trends of air temperatures in Ljubljana. Dela 2015, 43, 41–59. [Google Scholar] [CrossRef]
- Komac, B.; Ciglič, R.; Loose, A.; Pavšek, M.; Čermelj, S.; Oštir, K.; Kokalj, Ž.; Topole, M. Urban Heat Island in the Ljubljana City. In Counteracting Urban Heat Island Effects in a Global Climate Change Scenario; Musco, F., Ed.; Springer: Cham, Switzerland, 2016; pp. 323–345. [Google Scholar]
- Klemenčič, M. The Use of Remotely Sensed Imagery of the Study of Changing of Urban Heat Island in Ljubljana. Master’s Thesis, University of Ljubljana, Ljubljana, Slovenia, 2016. (In Slovenian). [Google Scholar]
- Macintyre, H.L.; Heaviside, C.; Cai, X.; Phalkey, R. The winter urban heat island: Impacts on cold-related mortality in a highly urbanized European region for present and future climate. Environ. Int. 2021, 154, 106530. [Google Scholar] [CrossRef]
- Fan, Y.; Wang, Z.; Li, Y.; Wang, K.; Sun, Z.; Ge, J. Urban heat island reduces annual building energy consumption and temperature related mortality in severe cold region of China. Urban Clim. 2022, 45, 101262. [Google Scholar] [CrossRef]
- Ogrin, M. The influence of the relief on the formation of several microclimatic types in Slovenia. Geogr. Estnik (Geogr. Bull.) 2003, 75, 9–24. [Google Scholar]
- Mean Monthly Temperature. Available online: https://meteo.arso.gov.si/uploads/probase/www/climate/table/sl/by_location/ljubljana/climate-normals_81-10_Ljubljana.pdf (accessed on 24 October 2022).
- Letak_RCP45_2070. Available online: https://meteo.arso.gov.si/uploads/probase/www/climate/PSS/scenariji/letak_RCP45_2070.pdf (accessed on 24 October 2022).
- Republic of Slovenia, Statistical Office Sistat. Population by Sex and by Age, Municipalities and Settlements, Slovenia, Annually. Available online: https://pxweb.stat.si/SiStatData/pxweb/en/Data/-/05C5003S.px/ (accessed on 24 October 2022).
- Municipality of Ljubljana, Ljubljana in Numbers. Available online: https://www.ljubljana.si/sl/o-ljubljani/ljubljana-v-stevilkah/ (accessed on 24 October 2022).
- Population by Sex, Households, Families, Buildings and Dwellings, 2002 Census. Available online: https://www.stat.si/doc/letopis/2003/35_03/35-03-03.htm (accessed on 24 October 2022).
- Open Street Map. Available online: https://www.openstreetmap.org/#map=9/46.1504/14.9745 (accessed on 24 October 2022).
- Esri Terrain. Available online: https://www.arcgis.com/home/webmap/viewer.html?layers=c61ad8ab017d49e1a82f580ee1298931 (accessed on 24 October 2022).
- Surveying and Mapping Authority of Slovenia. Available online: https://egp.gu.gov.si/egp/ (accessed on 24 October 2022).
- Natural Earth. Available online: https://www.naturalearthdata.com/downloads/ (accessed on 24 October 2022).
- Steward, I.D.; Oke, T.R. Local Climate Zones for Urban Temperature Studies. Bull. Am. Meteorol. Soc. 2012, 93, 1879–1900. [Google Scholar] [CrossRef]
- Zha, Y.; Gao, J.; Ni, S. Use of normalized difference built-up index in automatically mapping urban areas from TM imagery. Int. J. Remote Sens. 2003, 24, 583–594. [Google Scholar] [CrossRef]
- Riley, J.S.; DeGloria, S.D.; Elliot, R. A Terrain Ruggedness Index that Quantifies Topographic Heterogeneity. Intermont. J. Sci. 1999, 5, 23–27. [Google Scholar]
- Smith, R.B. The Heat Budget of the Earth’s Surface Deduced from Space. 2010. Available online: https://yceo.yale.edu/how-convert-landsat-dns-albedo (accessed on 24 October 2022).
- Temperature Measuring Instrument (1-Channel). Available online: https://www.farnell.com/datasheets/1760370.pdf (accessed on 24 October 2022).
- Testo 175 T3—Temperature Logger. Available online: https://www.testo.com/sl-SI/testo-175-t3/p/0572-1753 (accessed on 24 October 2022).
- IOT 2023 MF-300; GPS and Temperature Tracker. (User Manual). Mitja Ferlan: Ljubljana, Slovenia, 2023.
- Žiberna, I.; Ivajnšič, D. Sezonski režim površinskega mestneg toplotnega otoka v Mariboru. In Primeri Prostorskih Analiz vplivov Podnebnih Sprememb: Monografija v Okviru Projekta Preprečevanje Toplotnega Stresa v Urbanih Sistemih v Luči Podnebnih Sprememb (ARRS J7-1822); Ivanjšič, D., Donoša, D., Gjurič, V.G., Pipenbaher, N., Eds.; Univerzitetna založba Univerze v Mariboru: Maribor, Slovenia, 2022; p. 180. (In Slovenian) [Google Scholar]
- Hajat, S.; Vardoulakis, S.; Heaviside, C.; Eggen, B. Climate change effects on human health: Projections of temperature-related mortality for the UK during the 2020s, 2050s and 2080s. J. Epidemiol. Community Health 2014, 68, 641–648. [Google Scholar] [CrossRef]
- Vardoulakis, S.; Dear, K.; Hajat, S.; Heaviside, C.; Eggen, B.; McMichael, A. Comparative assessment of the effects of climate change on heat- and cold-related mortality in the United Kingdom and Australia. Environ. Health Perspect. 2014, 122, 1285–1292. [Google Scholar] [CrossRef]
- Li, H.; Wang, G.; Jombach, S. Characteristics of winter urban heat island in Budapest at local and micro scale. J. Environ. Geogr. 2020, 13, 34–43. [Google Scholar] [CrossRef]
- Hinkel, K.M.; Nelson, F.E.; Klenne, A.E.; Bella, J. The urban heat island at Barrow, Alaska. Int. J. Climatol. 2003, 23, 1889–1905. [Google Scholar] [CrossRef]
- Wilby, R.L. Past and projected trends in London’s urban heat island. Weather 2003, 58, 251–260. [Google Scholar] [CrossRef]
- Zhou, B.; Rybski, D.; Kropp, J.P. On the statistics of urban heat island intensity. Geophys. Res. Lett. 2013, 40, 5486–5491. [Google Scholar] [CrossRef]
- Choi, Y.-Y.; Suh, M.-S.; Park, K.H. Assessment of Surface Urban Heat Islands over Three Megacities in East Asia Using Land Surface Temperature Data Retrieved from COMS. Remote Sens. 2014, 6, 5852. [Google Scholar] [CrossRef]
- Kuznetsova, I.N.; Brusova, N.E.; Nakhaev, M.I. Moscow. Urban Heat Island: Detection, boundaries, and variability. Russ. Meteorol. Hydrol. 2017, 42, 305–313. [Google Scholar] [CrossRef]
- Giridharan, R.; Kolokotroni, M. Urban heat island characteristics in London during winter. Solar Energy 2009, 83, 1668–1882. [Google Scholar] [CrossRef]
- Bhattacharaya, B.K.; Mallick, K.; Padmanabhan, N.; Patel, N.K.; Parihar, J.S. Retrieval of land surface albedo and temperature using data from the Indian geostationary satellite: A case study for the winter months. Int. J. Remote Sens. 2009, 30, 3239–3257. [Google Scholar] [CrossRef]
- Erell, E.; Pearlmutter, D.; Boneh, D.; Kutiel, P.B. Effect of high albedo materials on pedestrian heat stress in urban street canyons. Urban Clim. 2014, 10, 367–386. [Google Scholar] [CrossRef]
- ARSO Meteo, ARCHIVE. Available online: https://meteo.arso.gov.si/met/sl/app/webmet/#webmet==8Sdwx2bhR2cv0WZ0V2bvEGcw9ydlJWblR3LwVnaz9SYtVmYh9iclFGbt9SaulGdugXbsx3cs9mdl5WahxXYyNGapZXZ8tHZv1WYp5mOnMHbvZXZulWYnwCchJXYtVGdlJnOn0UQQdSf; (accessed on 24 October 2022).
- Yang, C.; Ya, F.; Zhang, S. Comparison of land surface and air temperatures for quantifying summer and winter urban heat island in a snow climate city. J. Environ. Manag. 2020, 265, 110563. [Google Scholar] [CrossRef]
- Žiberna, I. Trendi temperatur zraka v Mariboru kot polsedica razvoja mestnega toplotnega otoka (Air temperature trends in Maribor as a consequence of the development of the urban heat islands). Rev. Za Geogr. 2006, 1, 81–98. [Google Scholar]
- Ivajnšič, D.; Kaligarič, M.; Žiberna, I. Geographically weighted regression of the urban heat island of a small city. Appl. Geogr. 2014, 53, 341–353. [Google Scholar] [CrossRef]


| Station Name | Coordinates ɸ, ʎ | Elevation (m) | Network |
|---|---|---|---|
| Scopolijeva Street | 46.073931 N, 14.482441 E | 304 | University of Ljubljana |
| St. Stanislav Institution Šentvid | 46.102036 N, 14.468873 E | 314 | University of Ljubljana |
| Črna vas Village | 46.015019 N, 14.495461 E | 288 | University of Ljubljana |
| Vegova Street | 46.053289 N, 14.498676 E | 297 | University of Ljubljana |
| SEA-Bežigrad | 46.070084 N, 14.508194 E | 299 | National network of SEA |
| The Agricultural Institute of Slovenia | 46.0605556 N, 14.5183333 E | 297 | Network of The Agricultural Institute of Slovenia |
| Šentjakob | 46.0911824 N, 14.5731699 E | 279 | Network of The Agricultural Institute of Slovenia |
| Vnajnarje | 46.0450272 N, 14.6719199 E | 667 | Network of The Agricultural Institute of Slovenia |
| Zadobrova | 46.0670786 N, 14.5880529 E | 280 | Network of Energetika Ljubljana |
| Kleče | 46.0861 N, 14.4997 E | 307 | National Network of SEA |
| January 2022 | February 2022 | March 2022 |
|---|---|---|
| 6.1. | 9.2. | 2.3. |
| 7.1. | 23.2. | 10.3. |
| 12.1. | 24.2. | |
| 13.1. | ||
| 25.1. | ||
| 26.1. |
| Vegova Street | Scopolijeva Street | SEA Bežigrad | Črna vas Village | Šentvid | |
|---|---|---|---|---|---|
| Tavg | 2.0 | 1.2 | 1.5 | 0.5 | 0.6 |
| Tavg min | −0.6 | −2.0 | −1.5 | −3.1 | −2.3 |
| Tavg max | 4.8 | 5.2 | 5.0 | 4.6 | 4.2 |
| Vegova Street | Scopolijeva Street | SEA Bežigrad | Črna vas Village | Šentvid | |
|---|---|---|---|---|---|
| Tmin | −6.5 | −8.0 | −7.1 | −11.0 | −8.3 |
| Tmax | 13.6 | 13.7 | 13.4 | 13.7 | 12.9 |
| Date | 6.1. | 7.1. | 12.1. | 13.1. | 25.1. | 26.1. | 9.2. | 23.2. | 24.2. | 2.3. | 10.3. | Avg. |
|---|---|---|---|---|---|---|---|---|---|---|---|---|
| SD | 0.3 | 0.6 | 0.4 | 0.5 | 0.2 | 0.8 | 0.3 | 0.8 | 0.5 | 0.4 | 0.5 | 0.5 |
| SD Avg. | SD Min. | SD Max. | |
|---|---|---|---|
| Bežigrad | 1.0 | 0.7 | 1.1 |
| Center | 1.2 | 0.9 | 1.5 |
| Šiška | 1.1 | 0.8 | 1.4 |
| Vič | 1.2 | 0.7 | 1.6 |
| Morning UHI | ||||
|---|---|---|---|---|
| Temperature Zone | Area (ha) | Population | Share of Area (%) | Share of Population (%) |
| 0–2 °C | 2619 | 4726 | 16 | 2 |
| 2–4 °C | 12,598 | 200,642 | 77 | 71 |
| >4 °C | 1162 | 77,750 | 7 | 27 |
| Total | 16,379 | 283,118 | 100 | 100 |
| Evening UHI | ||||
| Temperature Zone | Area (ha) | Population | Share of Area (%) | Share of Population (%) |
| 0–2 °C | 12,747 | 99,709 | 78 | 35 |
| 2–4 °C | 3631 | 183,409 | 22 | 65 |
| >4 °C | 1 | 0 | 0 | 0 |
| Total | 16,379 | 283,118 | 100 | 100 |
| Ljubljana | 1961–1970 | 1971–1980 | 1981–1990 | 1991–2000 | 2001–2010 | 2010–2020 |
|---|---|---|---|---|---|---|
| Number of Days with Snow Cover | 76.9 | 58.6 | 59.1 | 47.9 | 50.5 | 29.5 |
Disclaimer/Publisher’s Note: The statements, opinions and data contained in all publications are solely those of the individual author(s) and contributor(s) and not of MDPI and/or the editor(s). MDPI and/or the editor(s) disclaim responsibility for any injury to people or property resulting from any ideas, methods, instructions or products referred to in the content. |
© 2023 by the authors. Licensee MDPI, Basel, Switzerland. This article is an open access article distributed under the terms and conditions of the Creative Commons Attribution (CC BY) license (https://creativecommons.org/licenses/by/4.0/).
Share and Cite
Ogrin, M.; Svetlin, D.; Stefanovski, S.; Lampič, B. Assessment of Winter Urban Heat Island in Ljubljana, Slovenia. Meteorology 2023, 2, 222-238. https://doi.org/10.3390/meteorology2020014
Ogrin M, Svetlin D, Stefanovski S, Lampič B. Assessment of Winter Urban Heat Island in Ljubljana, Slovenia. Meteorology. 2023; 2(2):222-238. https://doi.org/10.3390/meteorology2020014
Chicago/Turabian StyleOgrin, Matej, Domen Svetlin, Sašo Stefanovski, and Barbara Lampič. 2023. "Assessment of Winter Urban Heat Island in Ljubljana, Slovenia" Meteorology 2, no. 2: 222-238. https://doi.org/10.3390/meteorology2020014