

The Challenges of Micro-Nowcasting and the Women’s Slope Style Event at the PyeongChang 2018 Olympic Winter Games

Abstract
:1. Introduction
2. Background
2.1. The ICE–POP Project
2.2. Recent Projects
2.3. The Women’s Slope Style Event
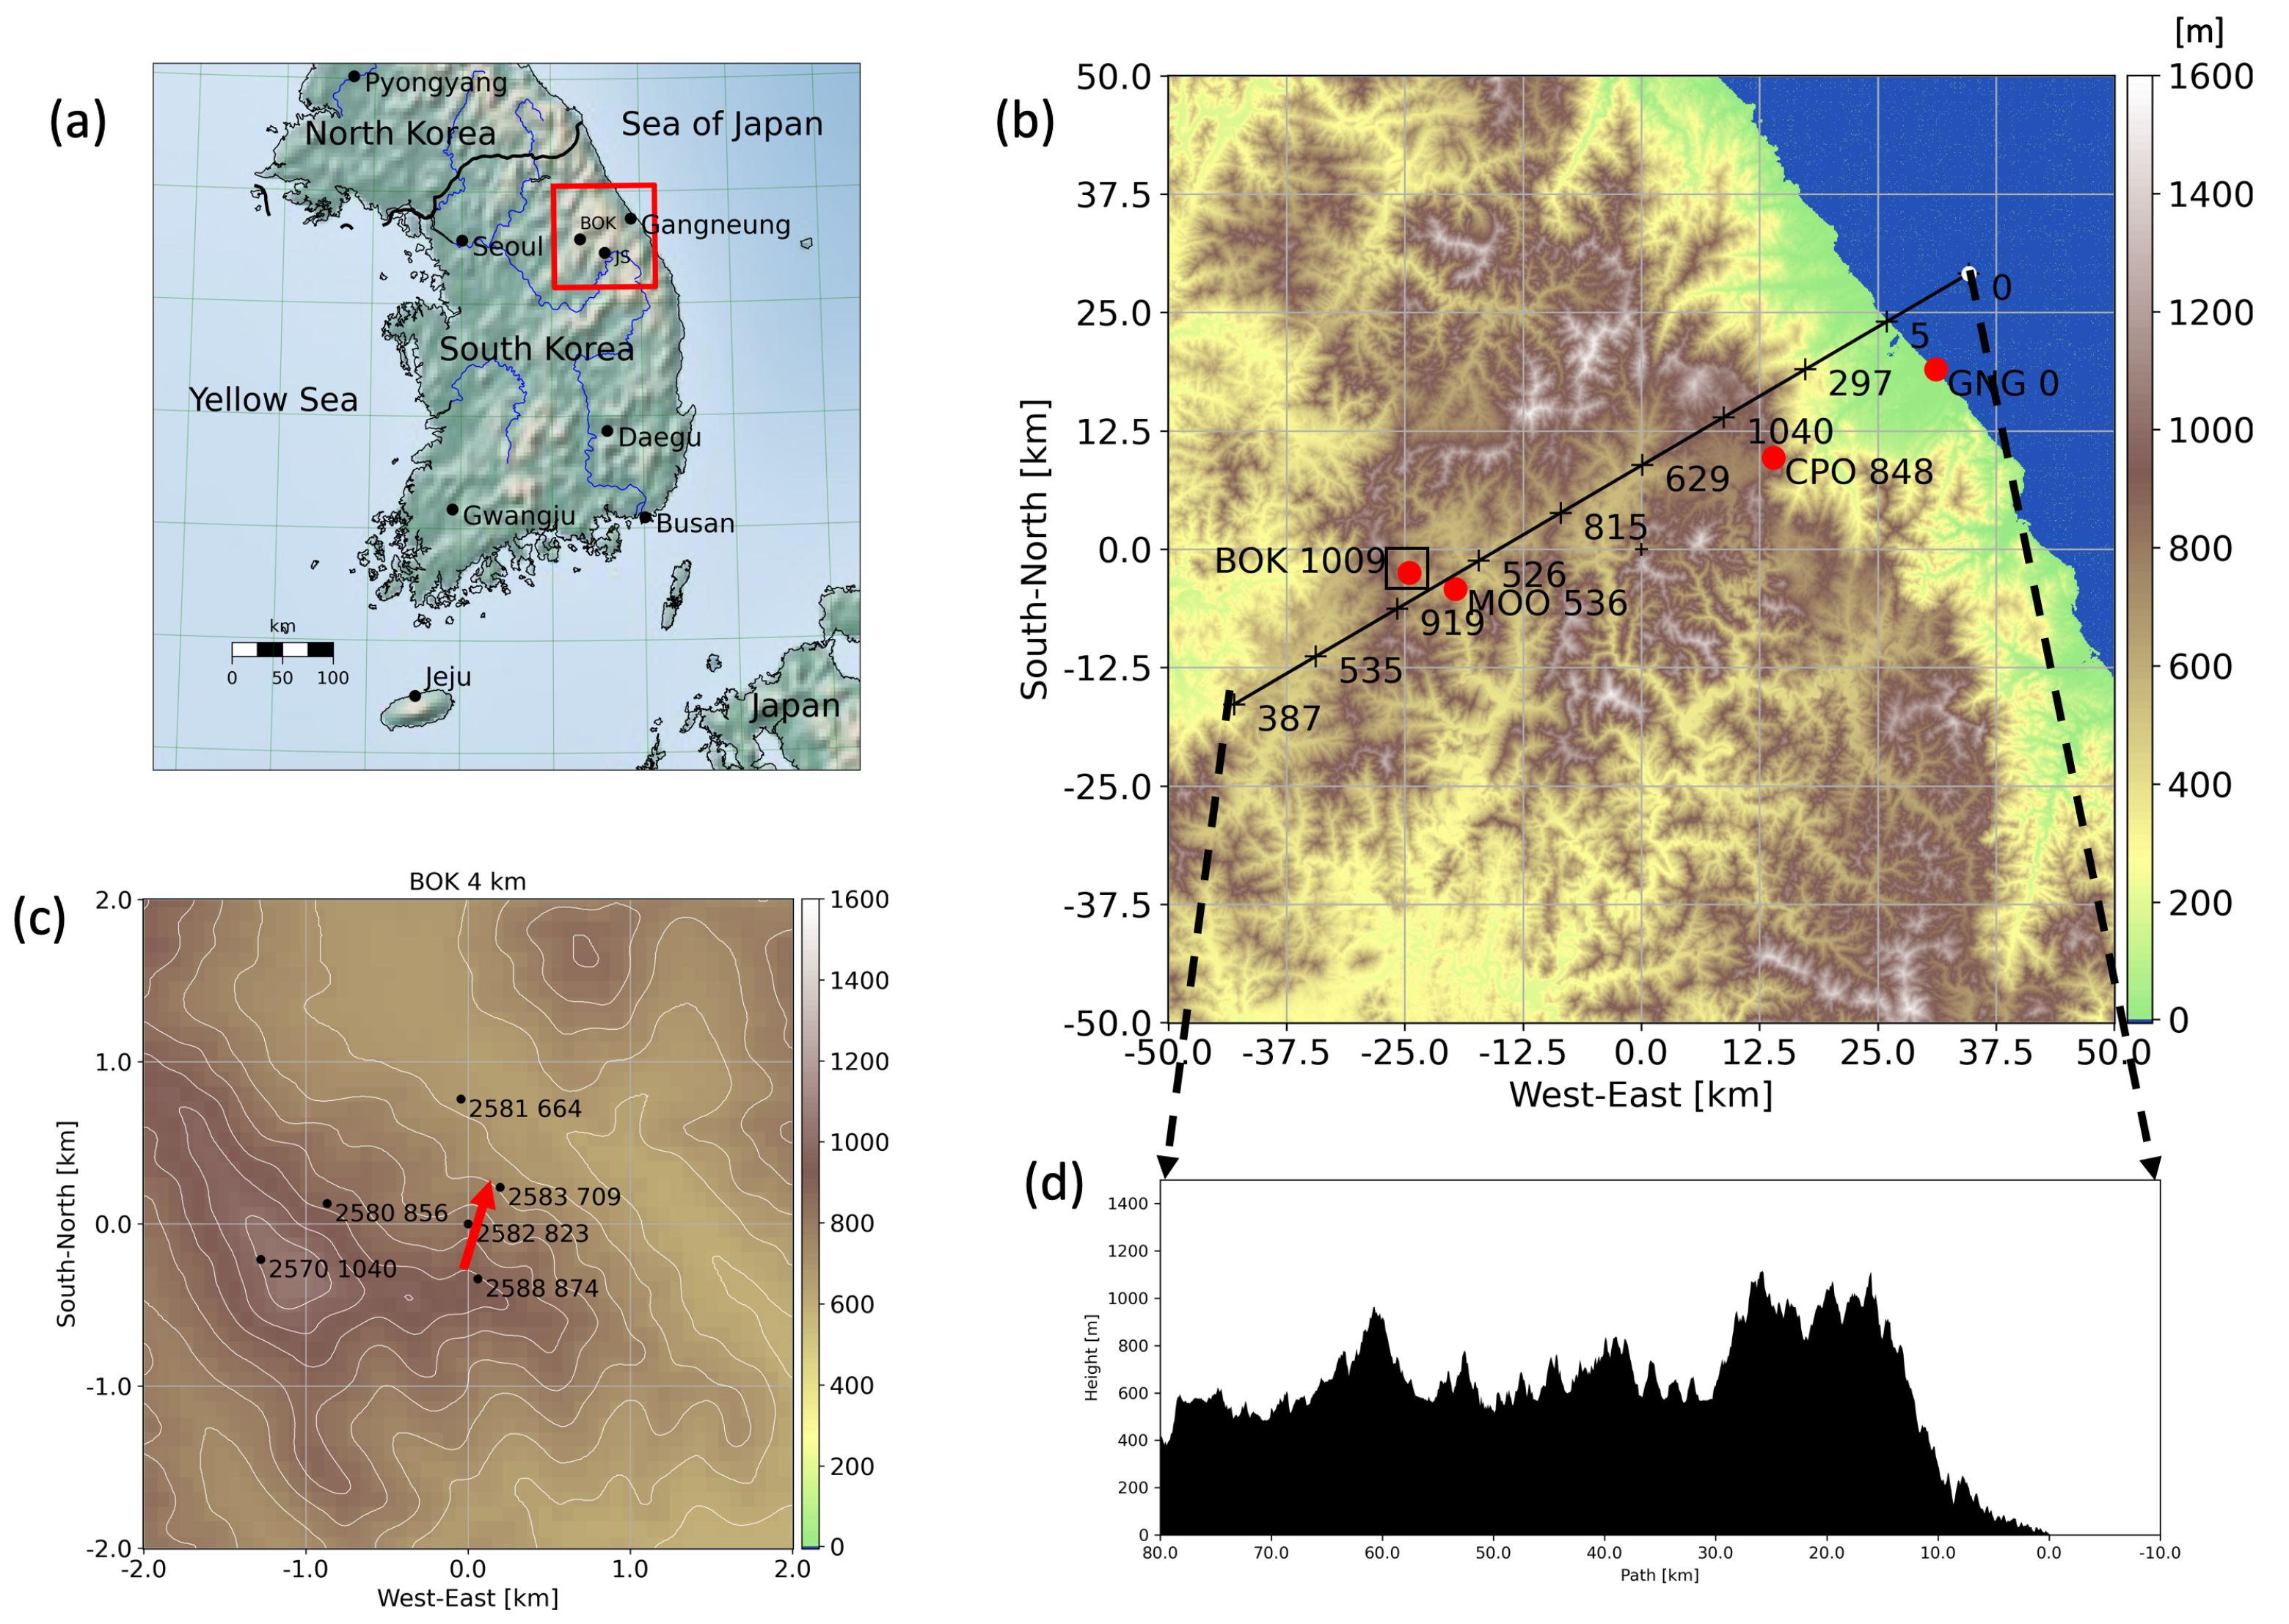
2.4. The Bokwang Observations
3. Analysis
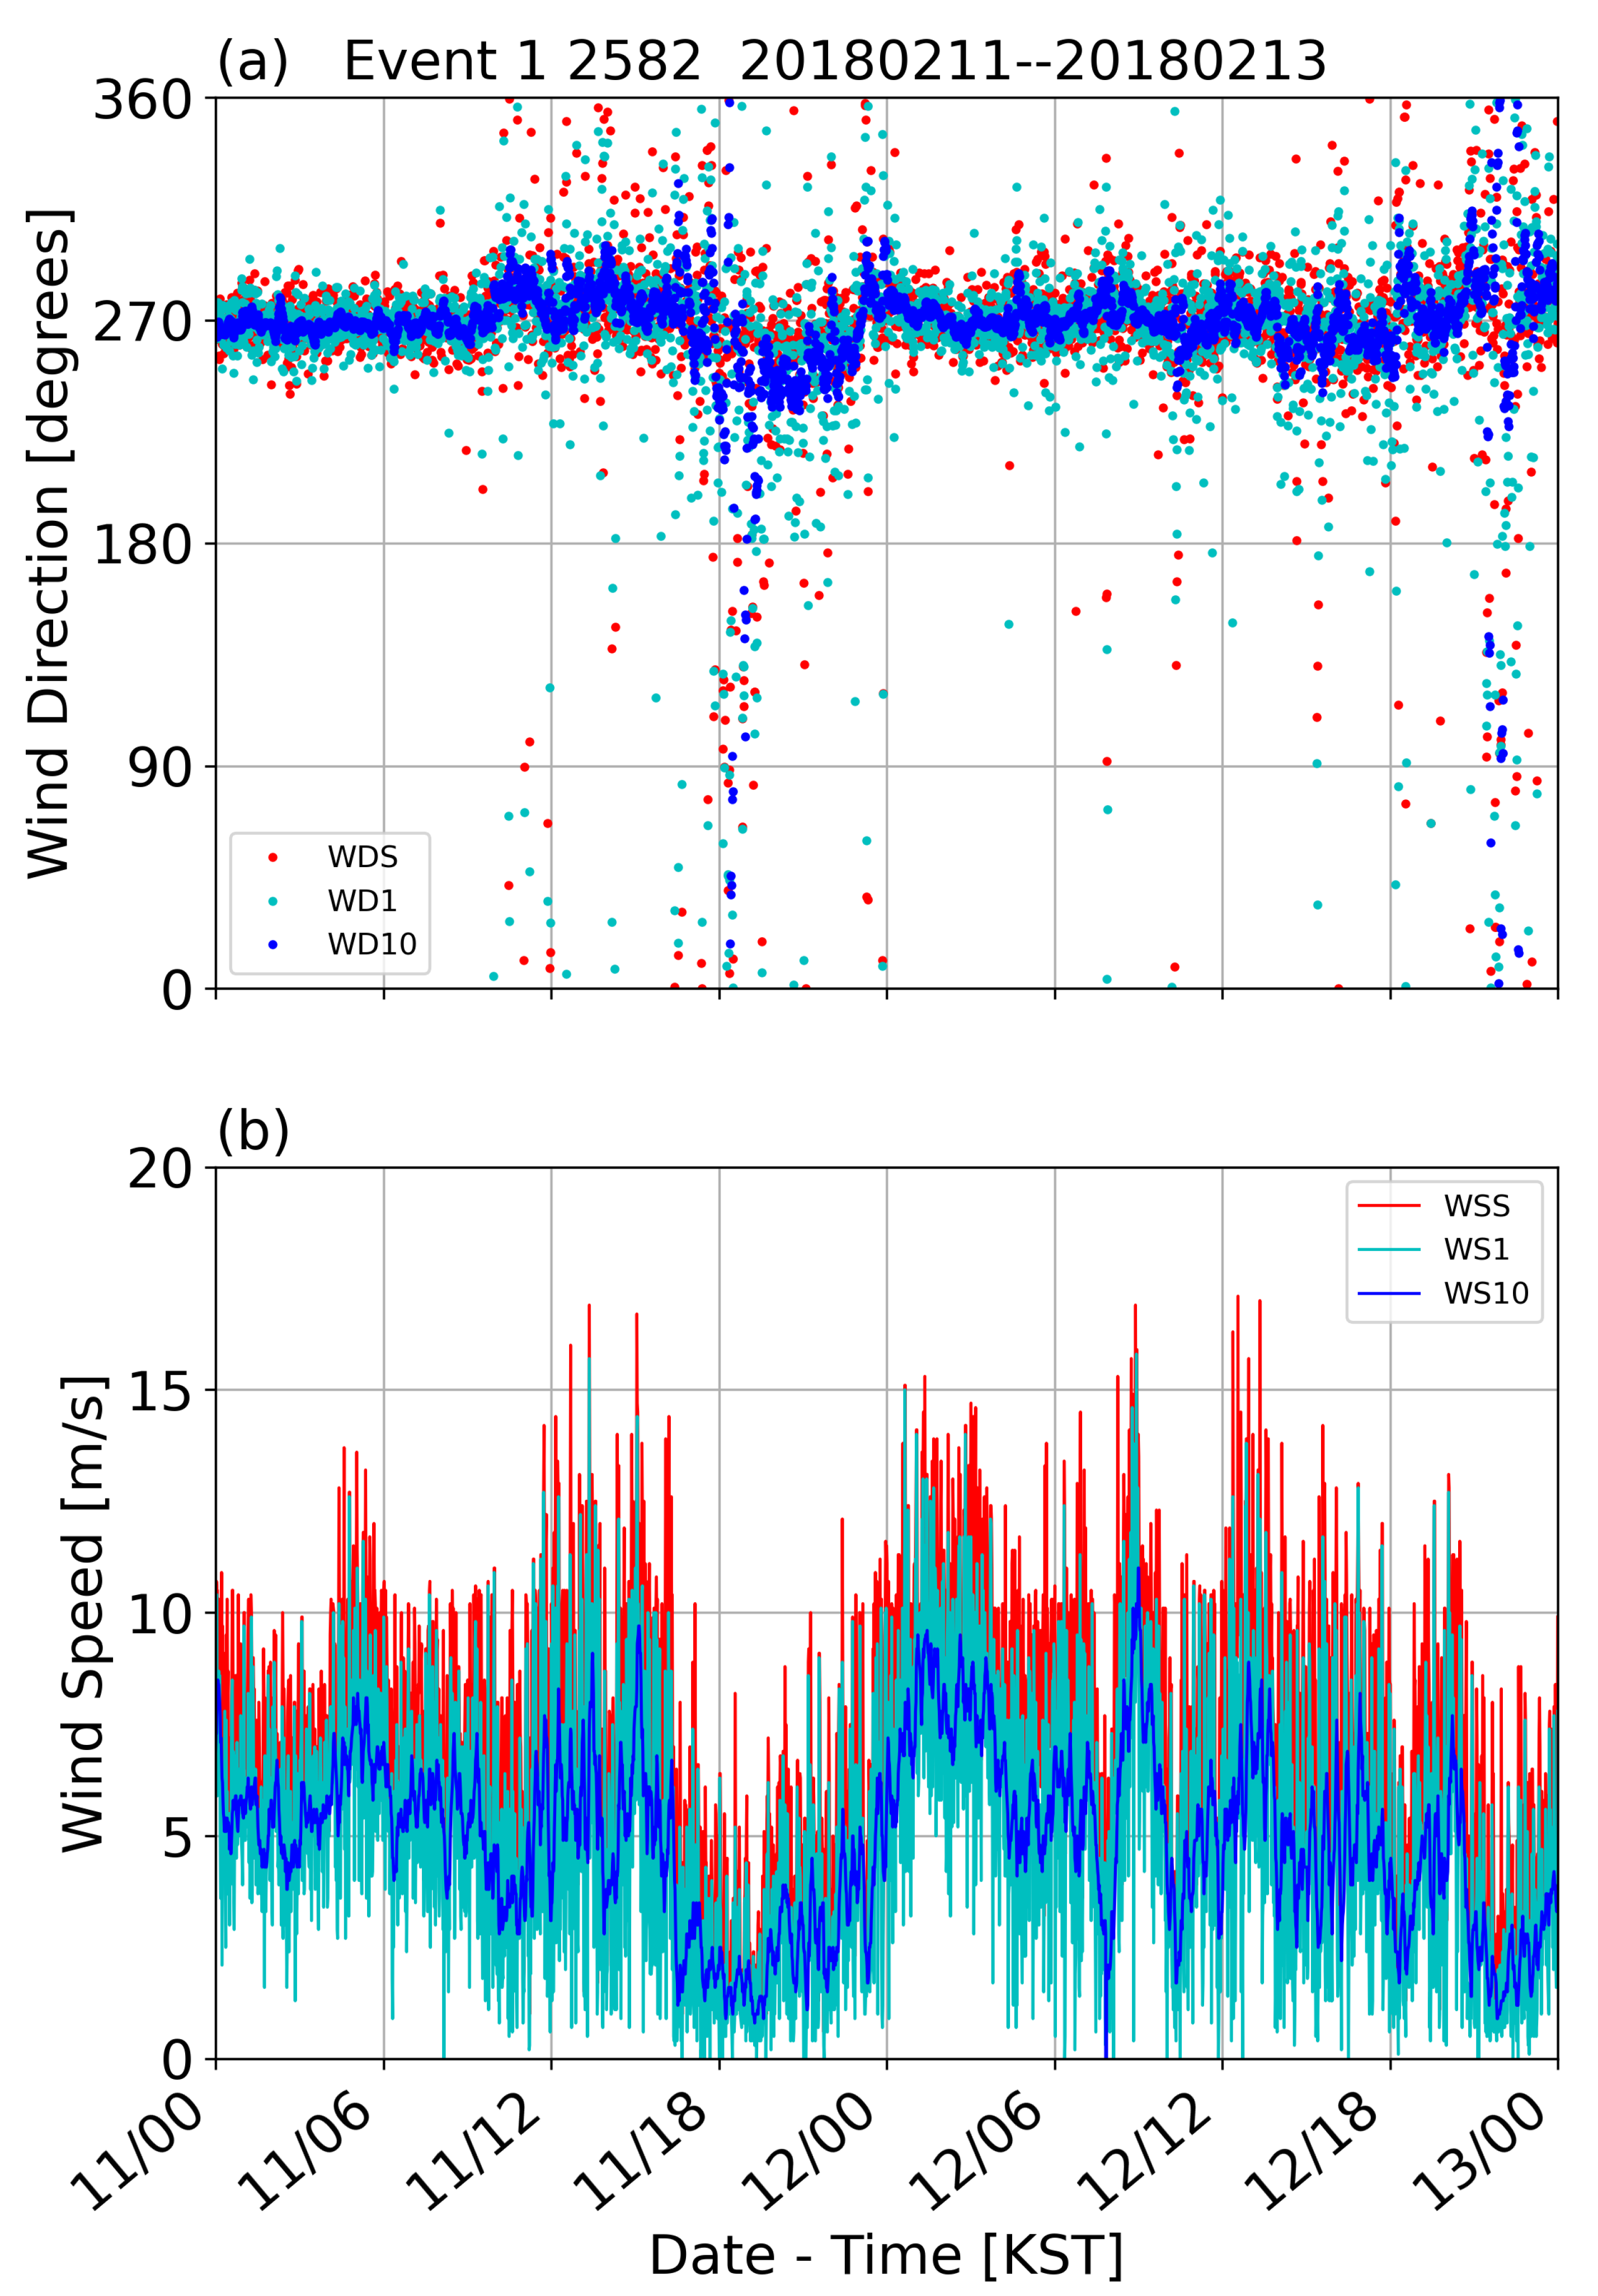
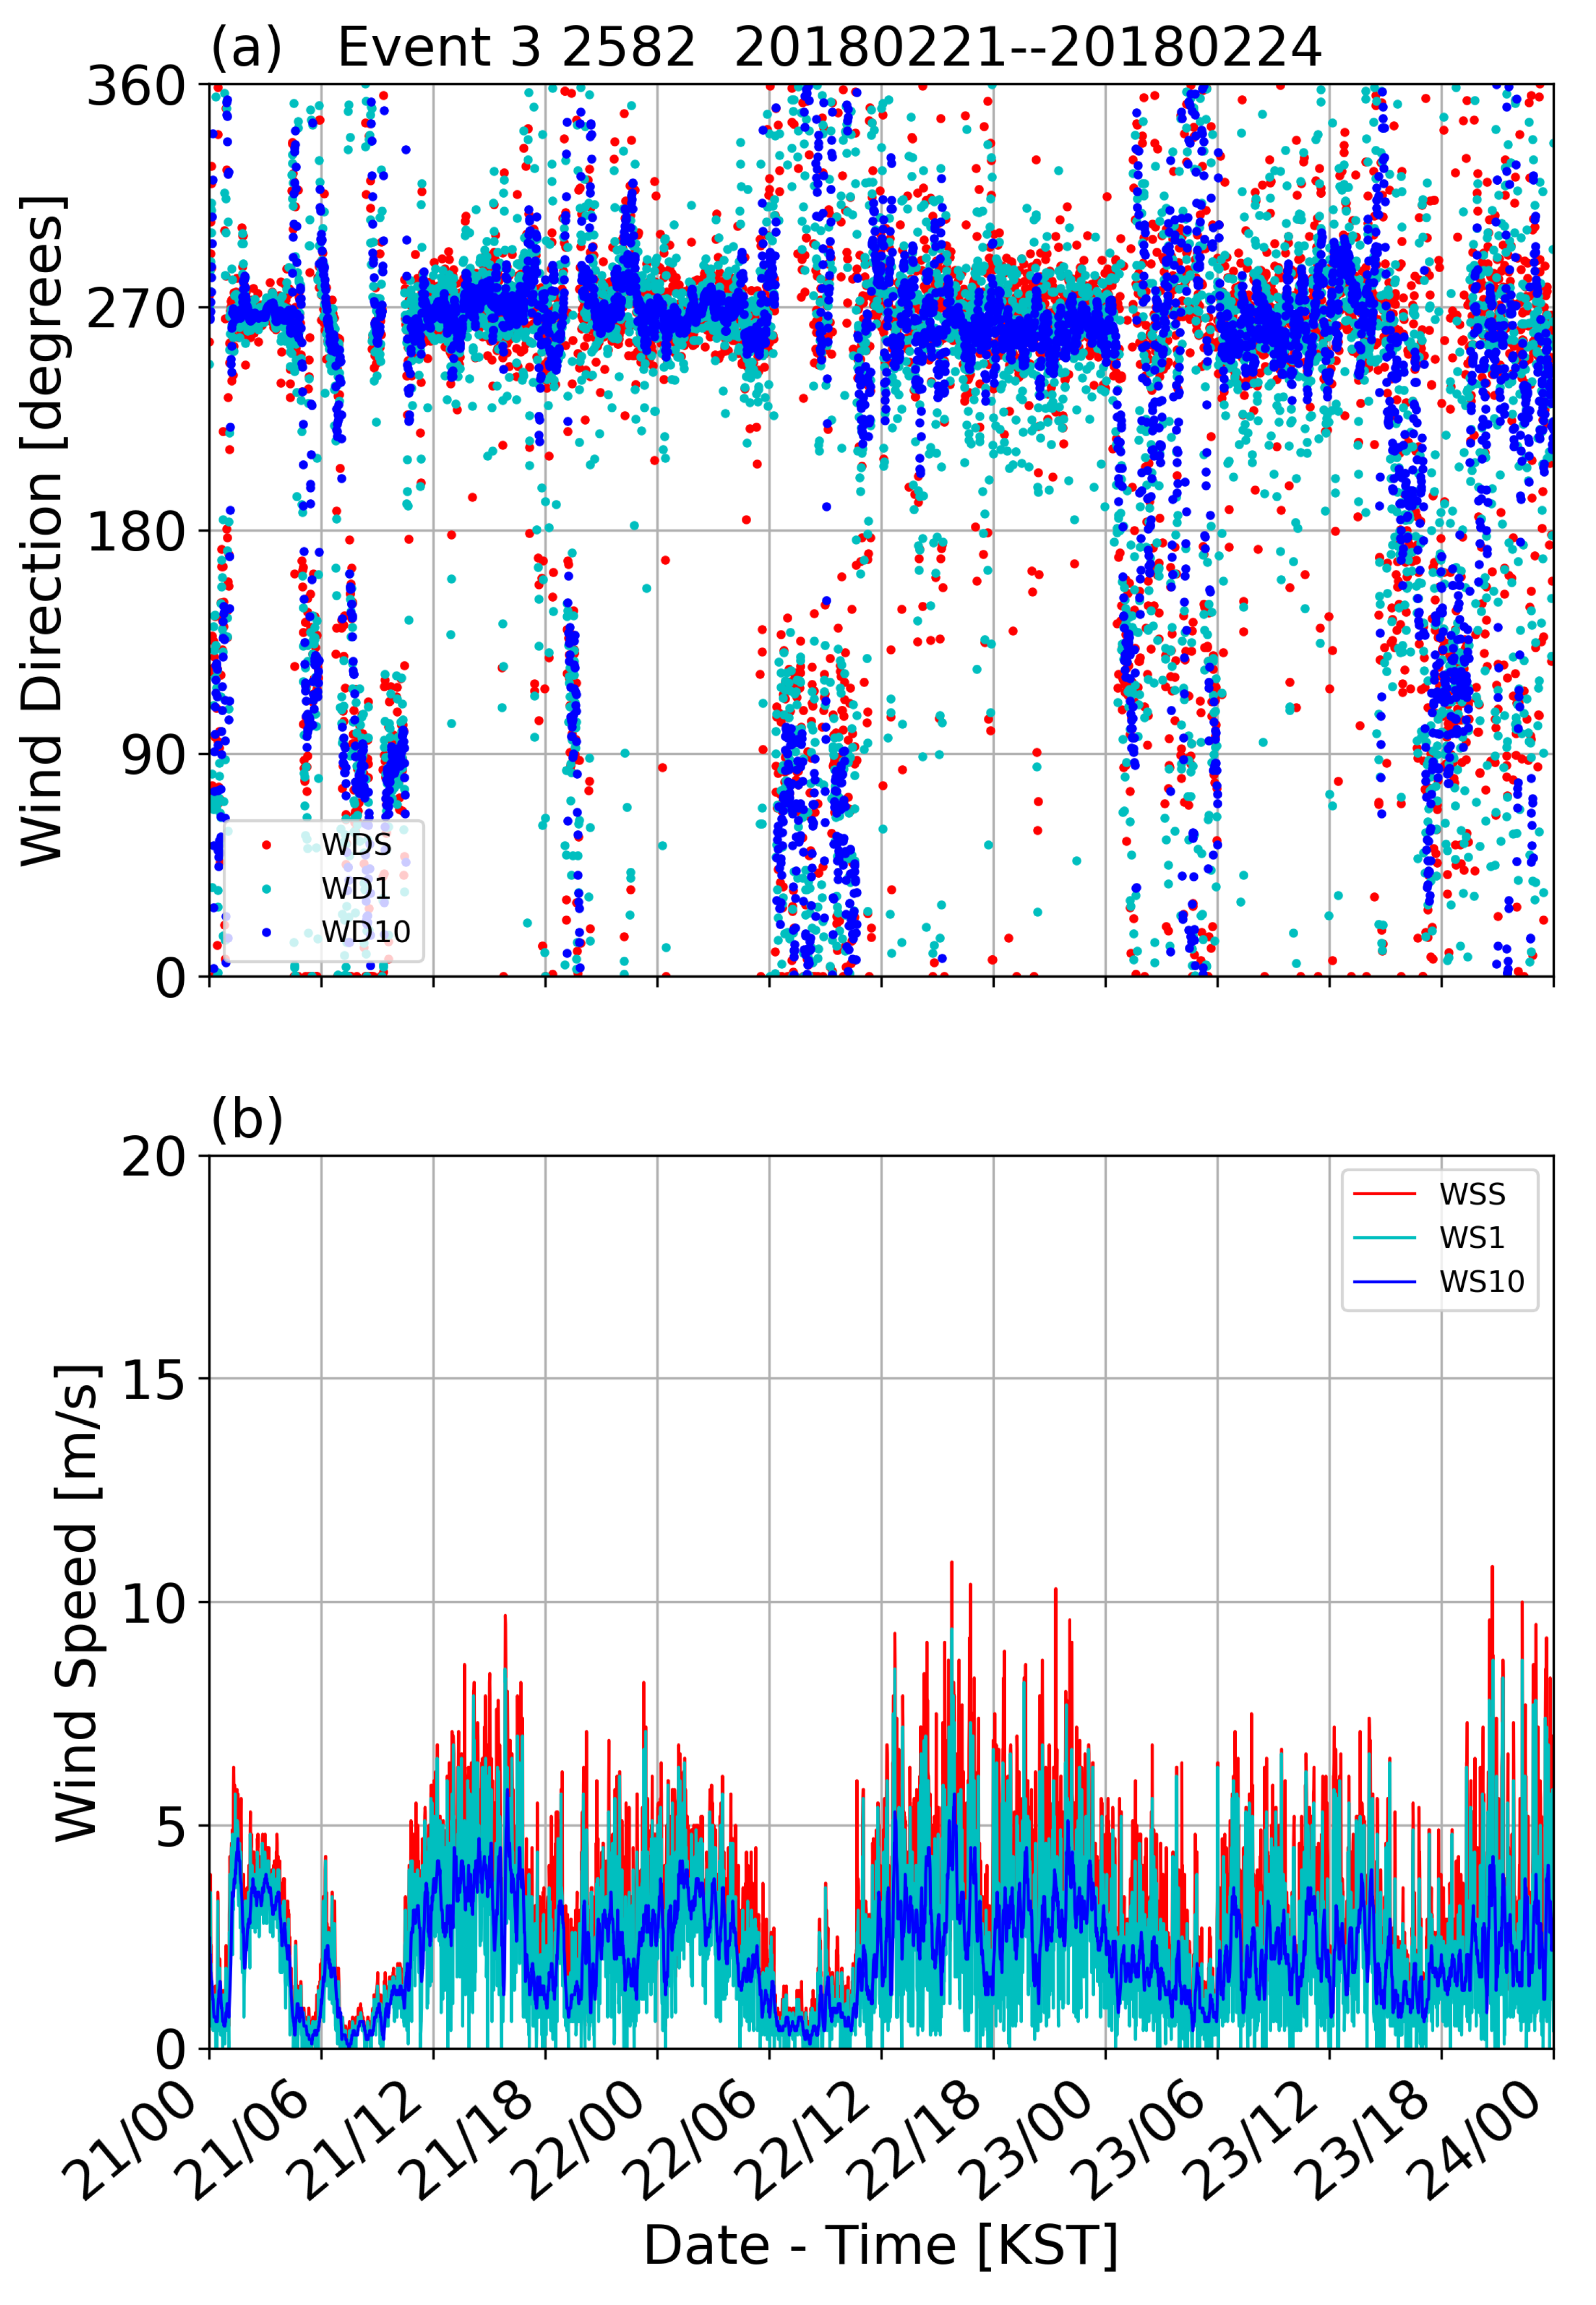
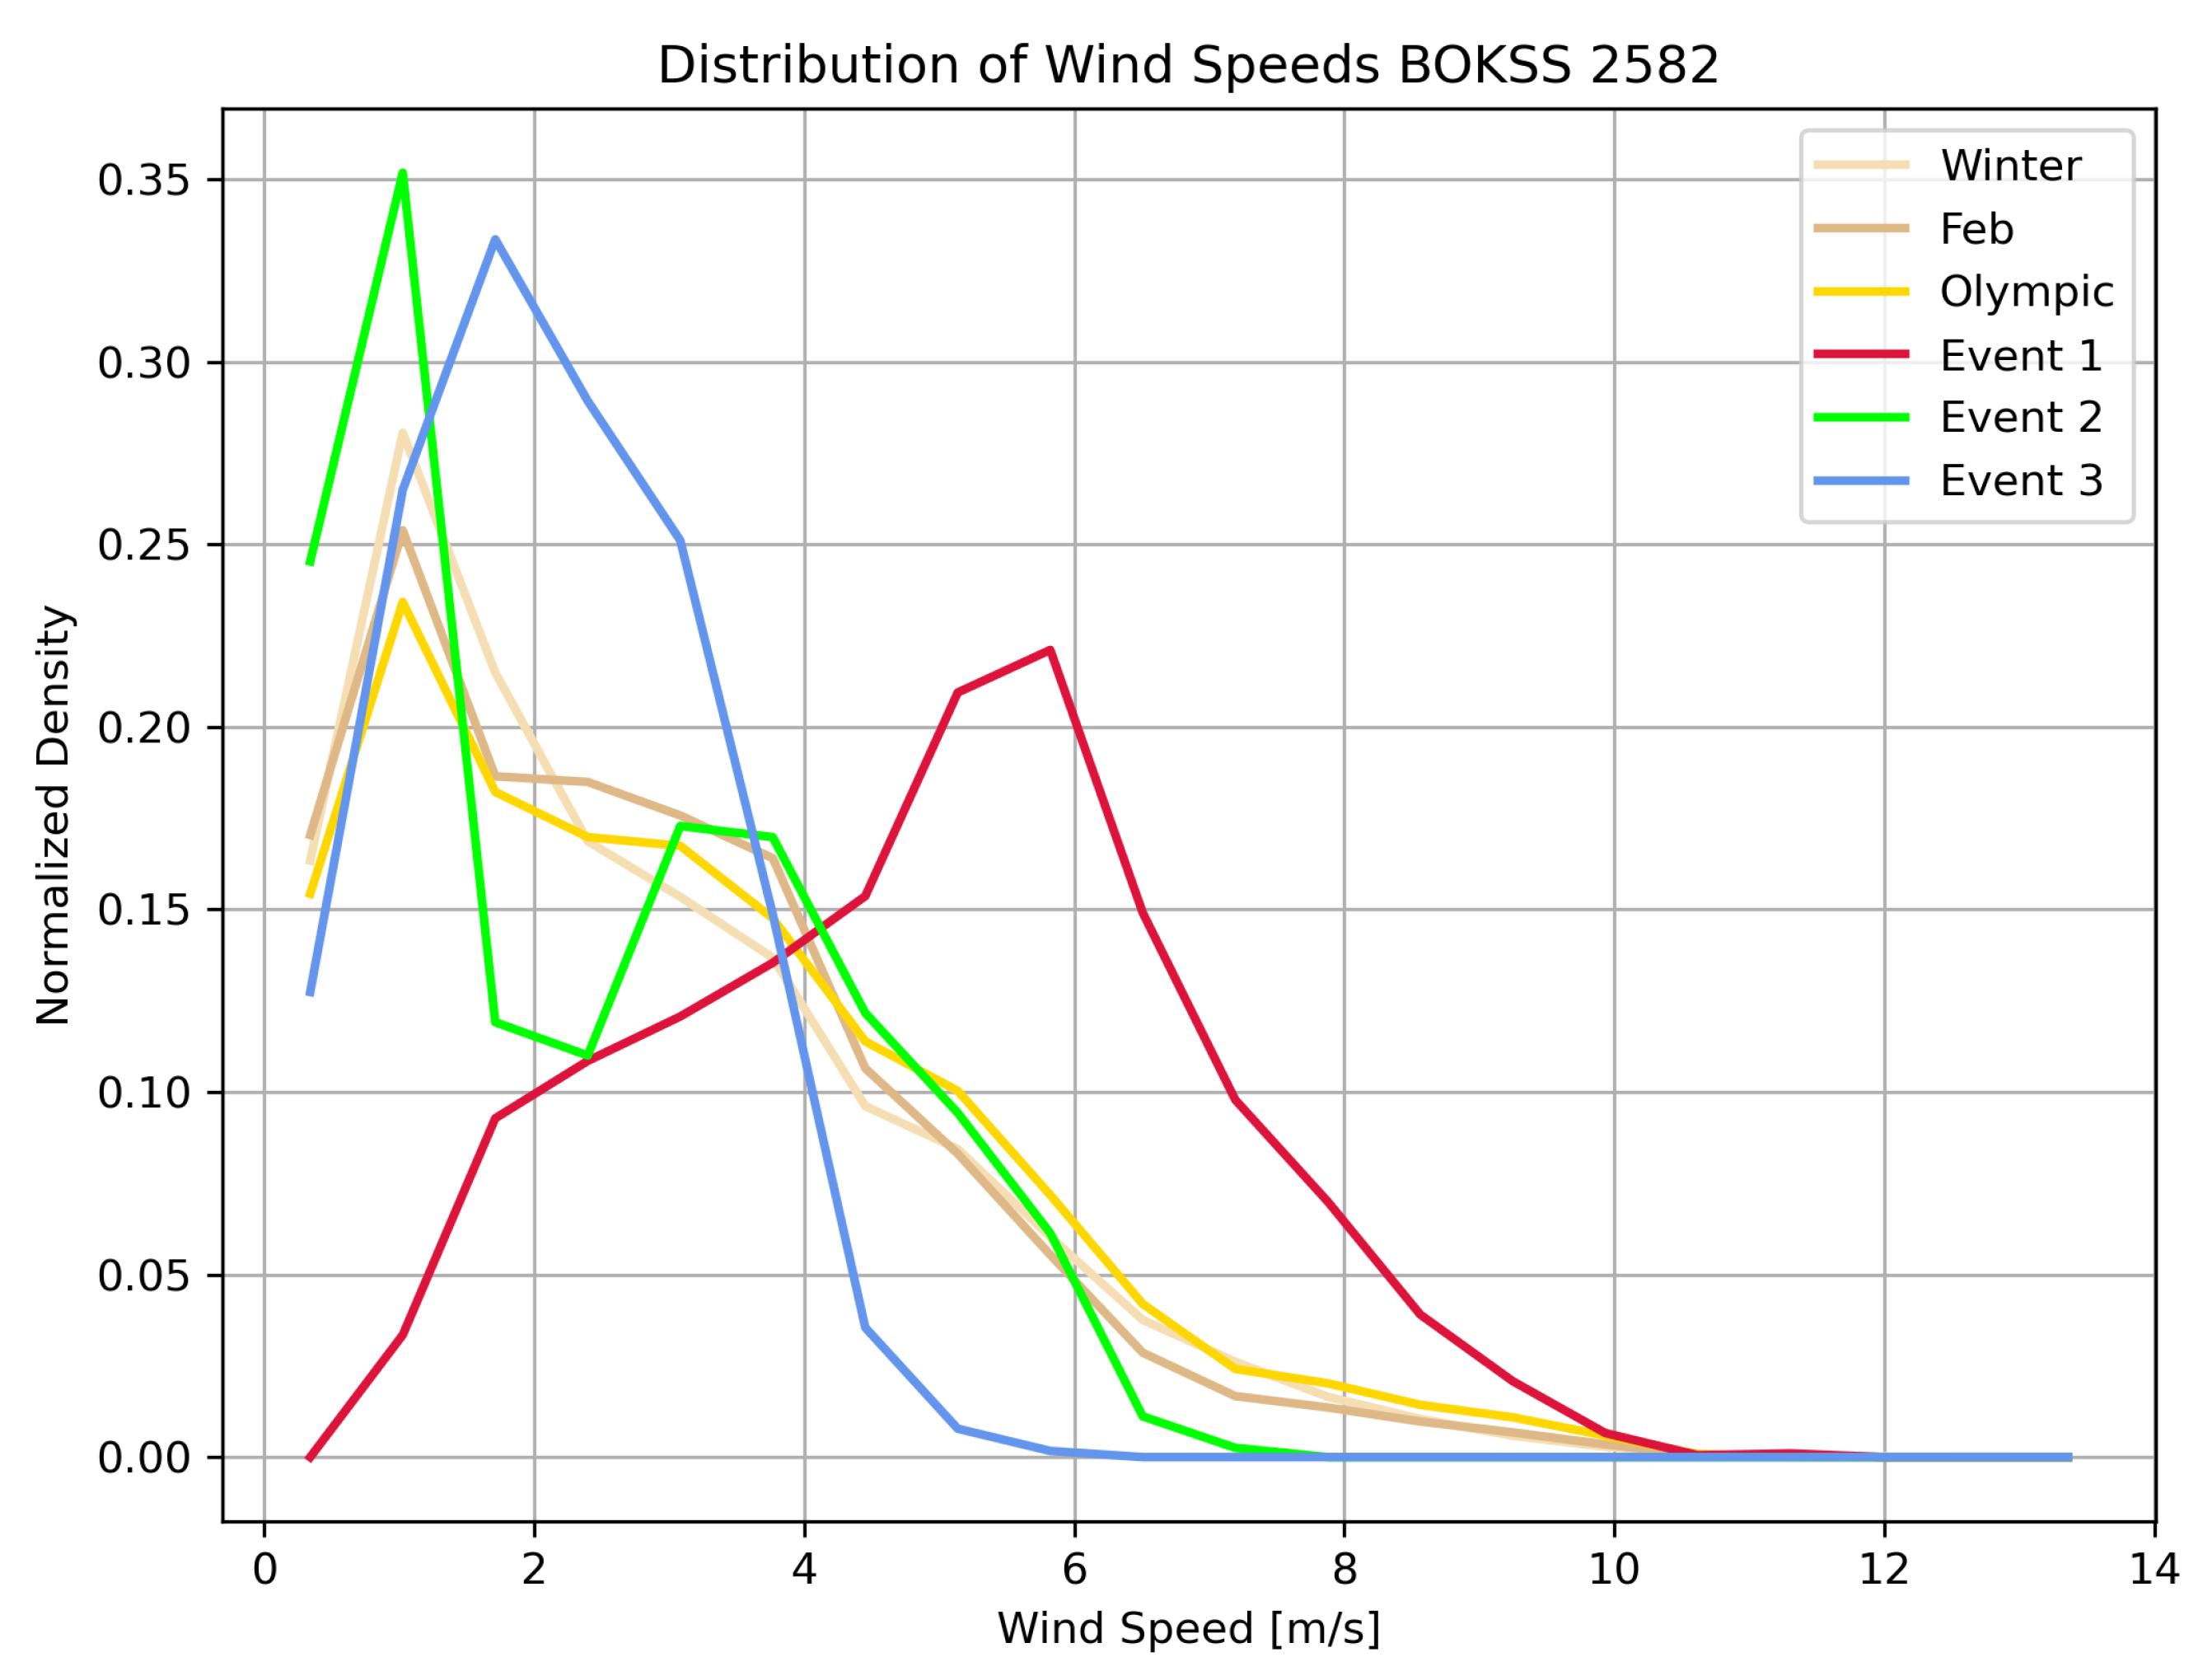
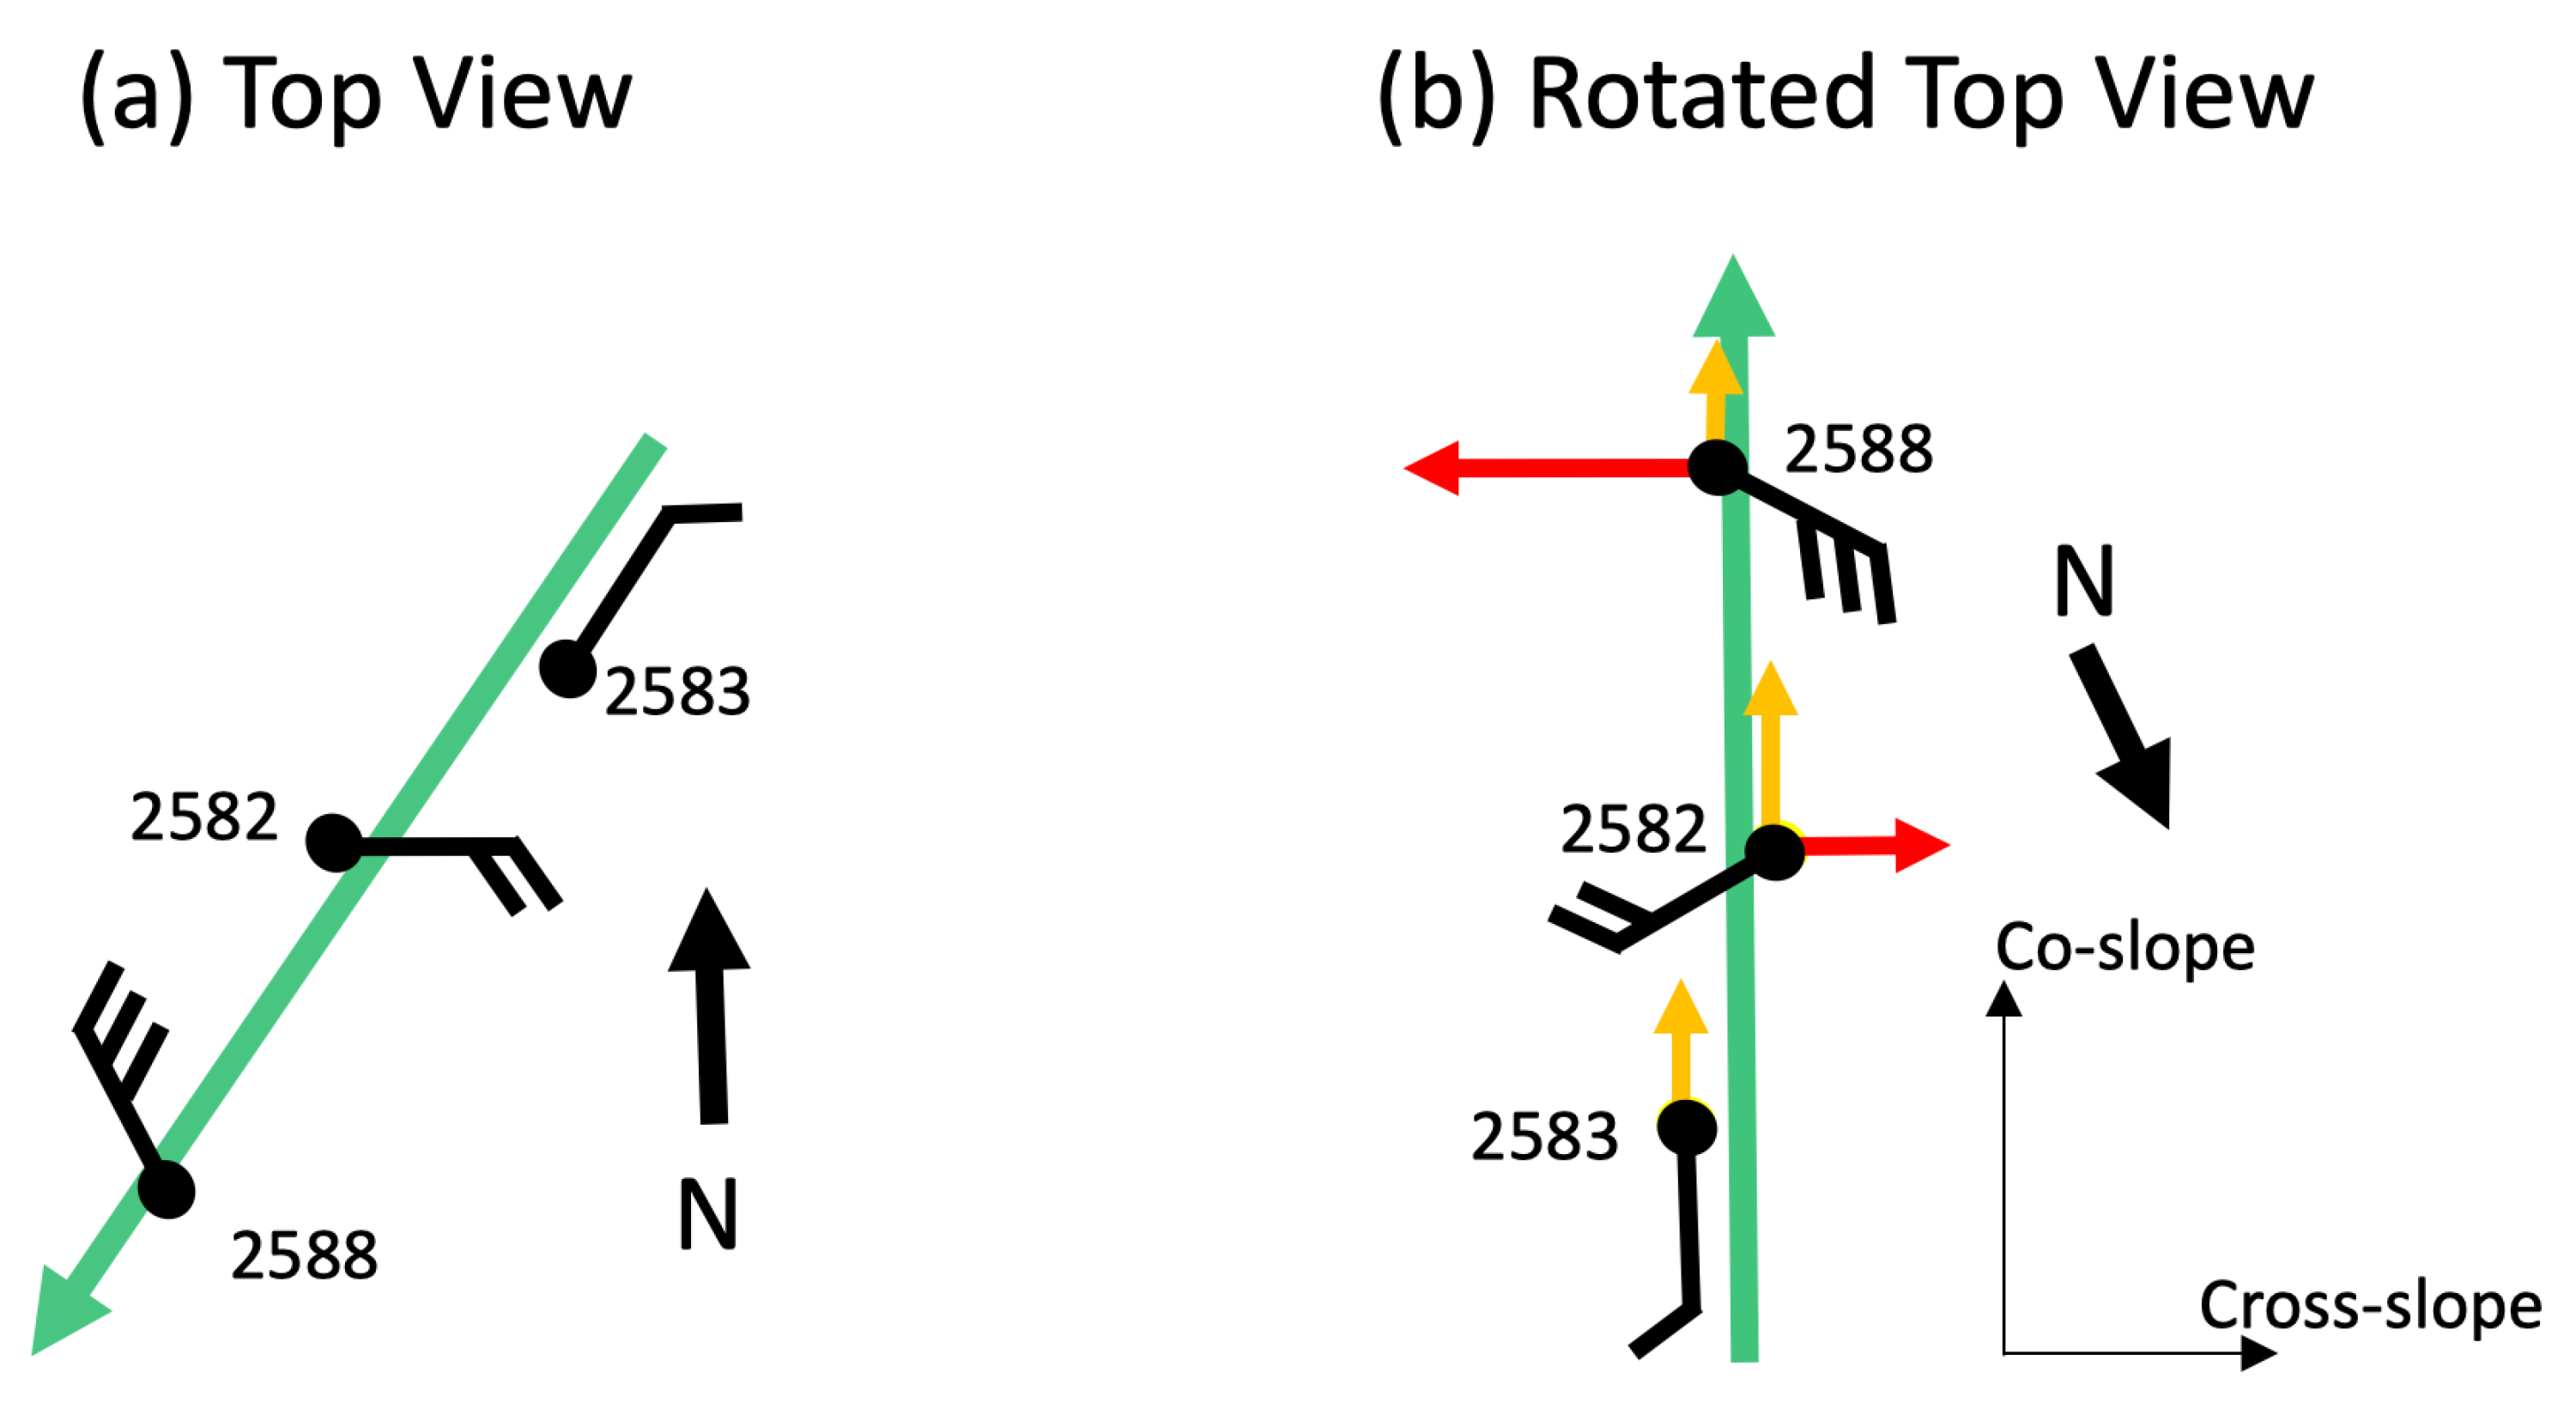
3.1. Surface Winds
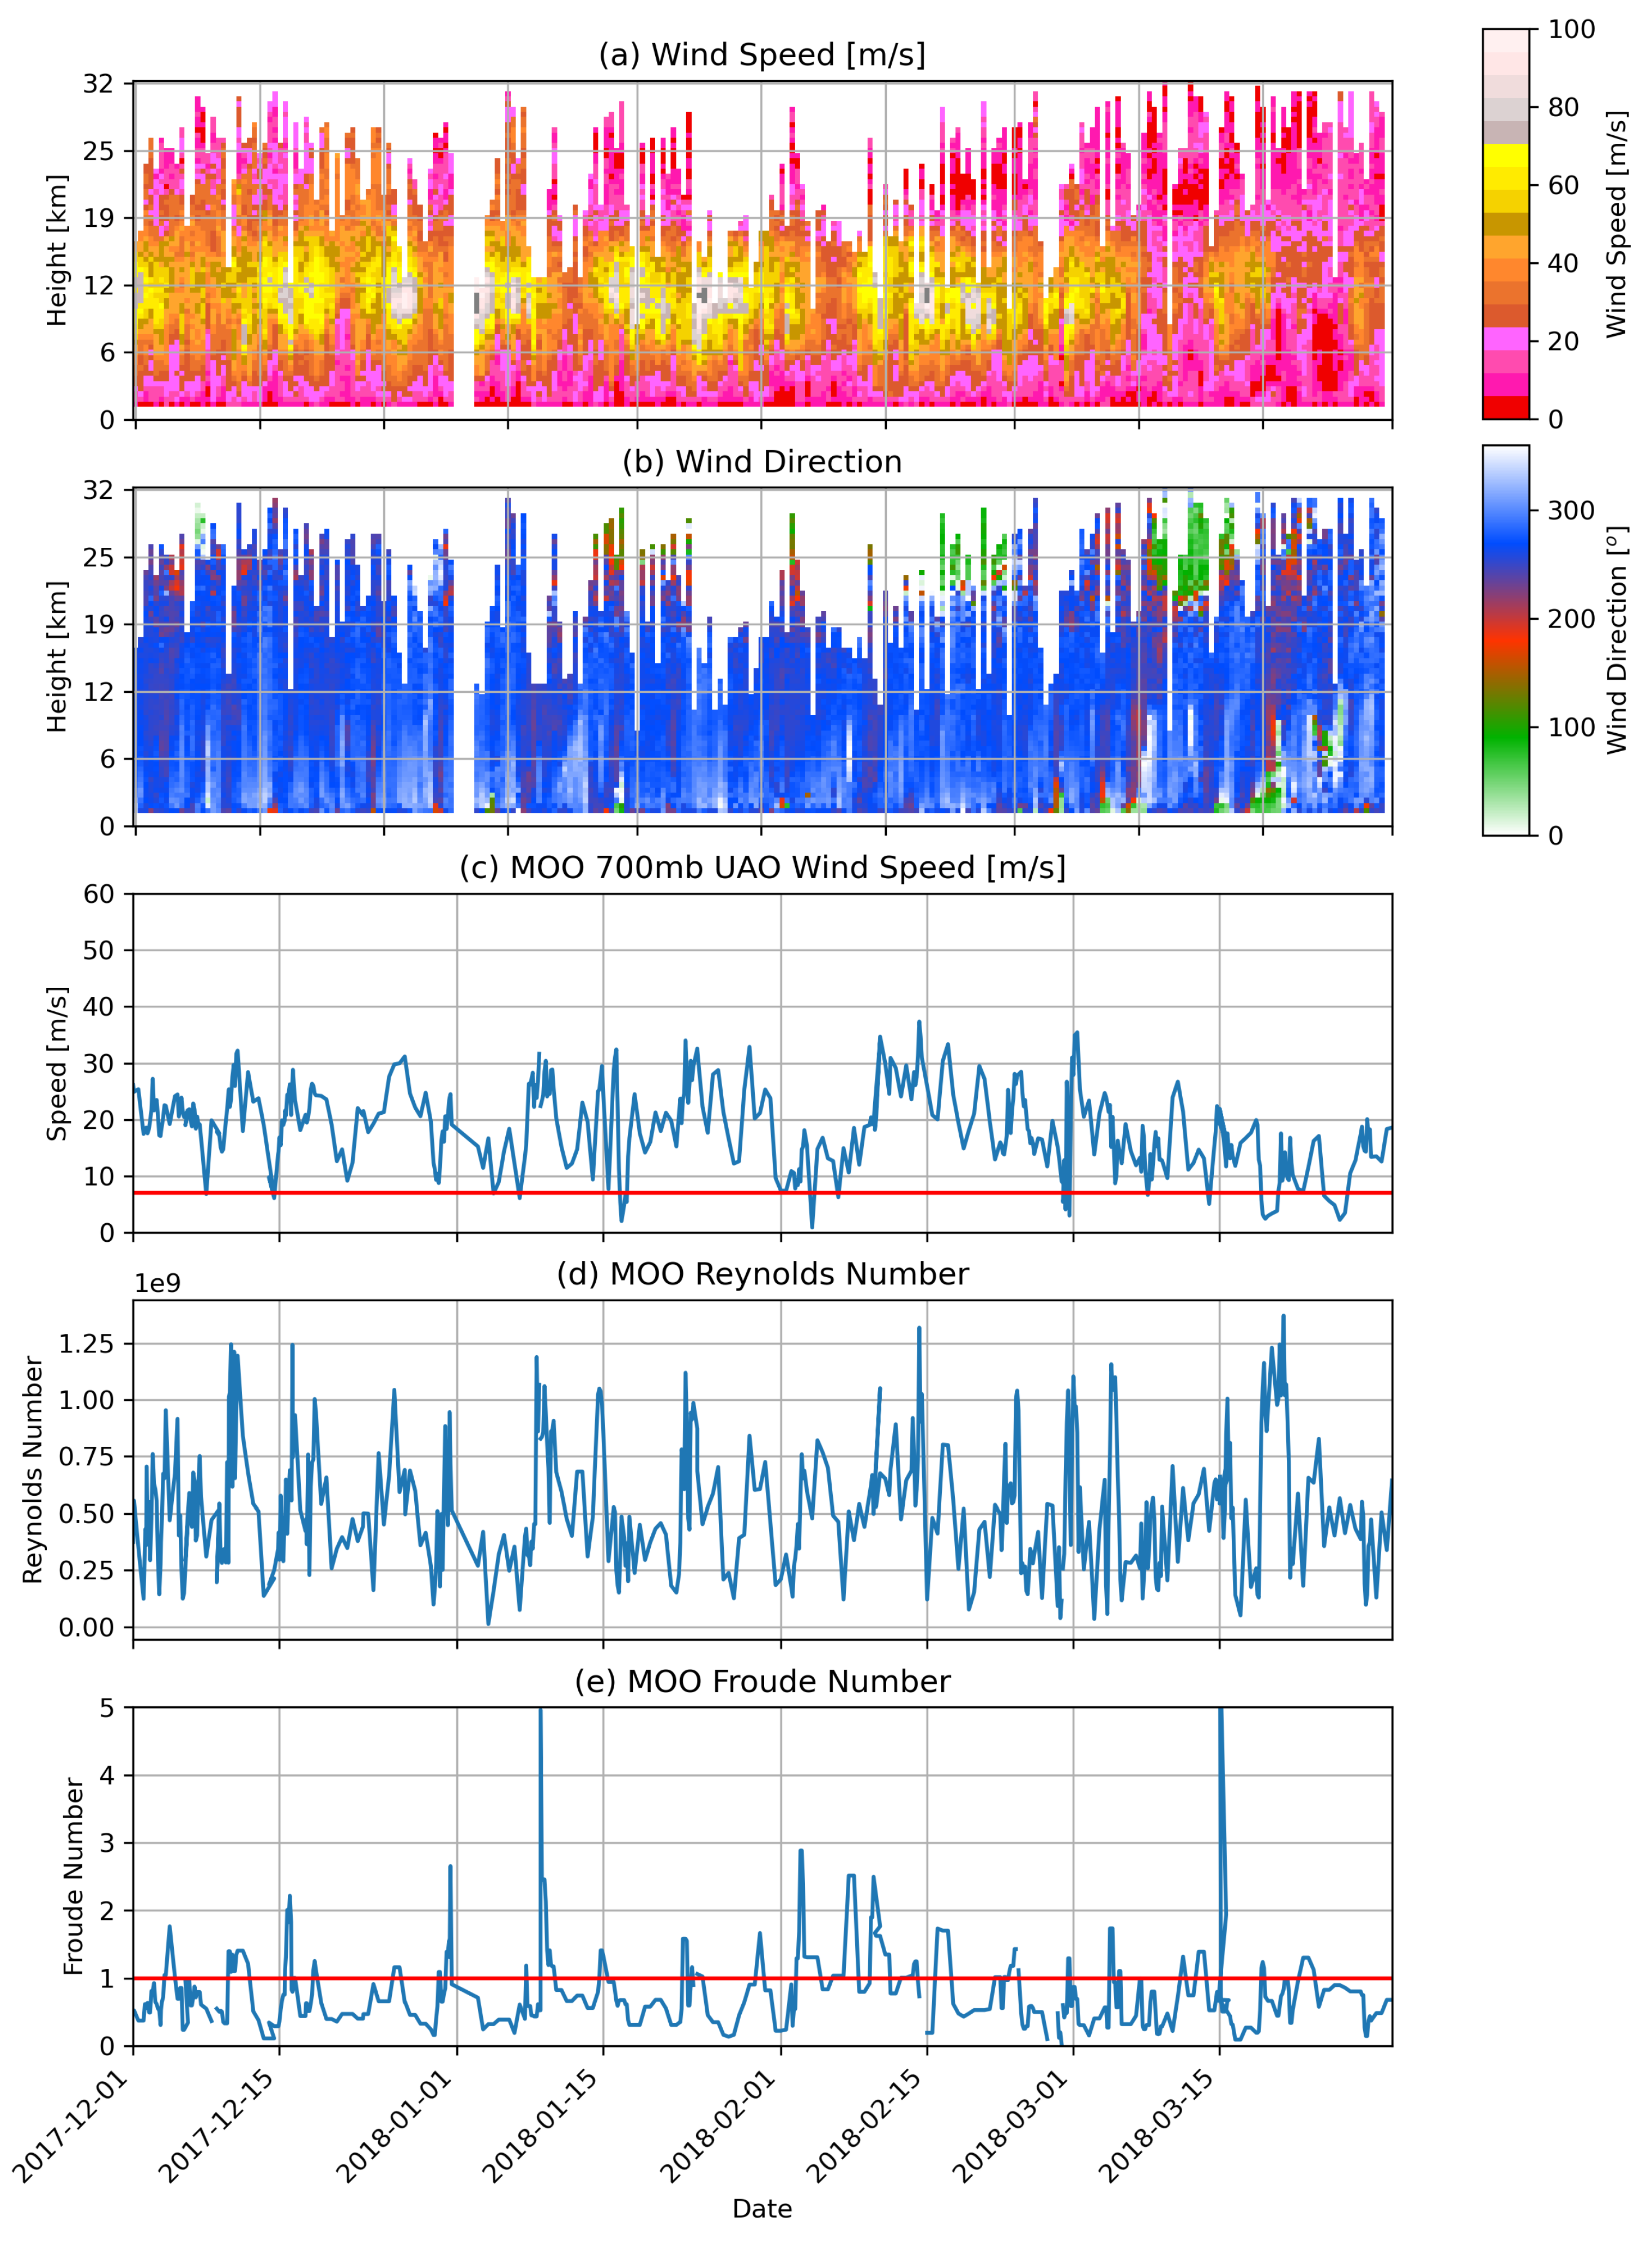
3.2. Upper Air Analysis
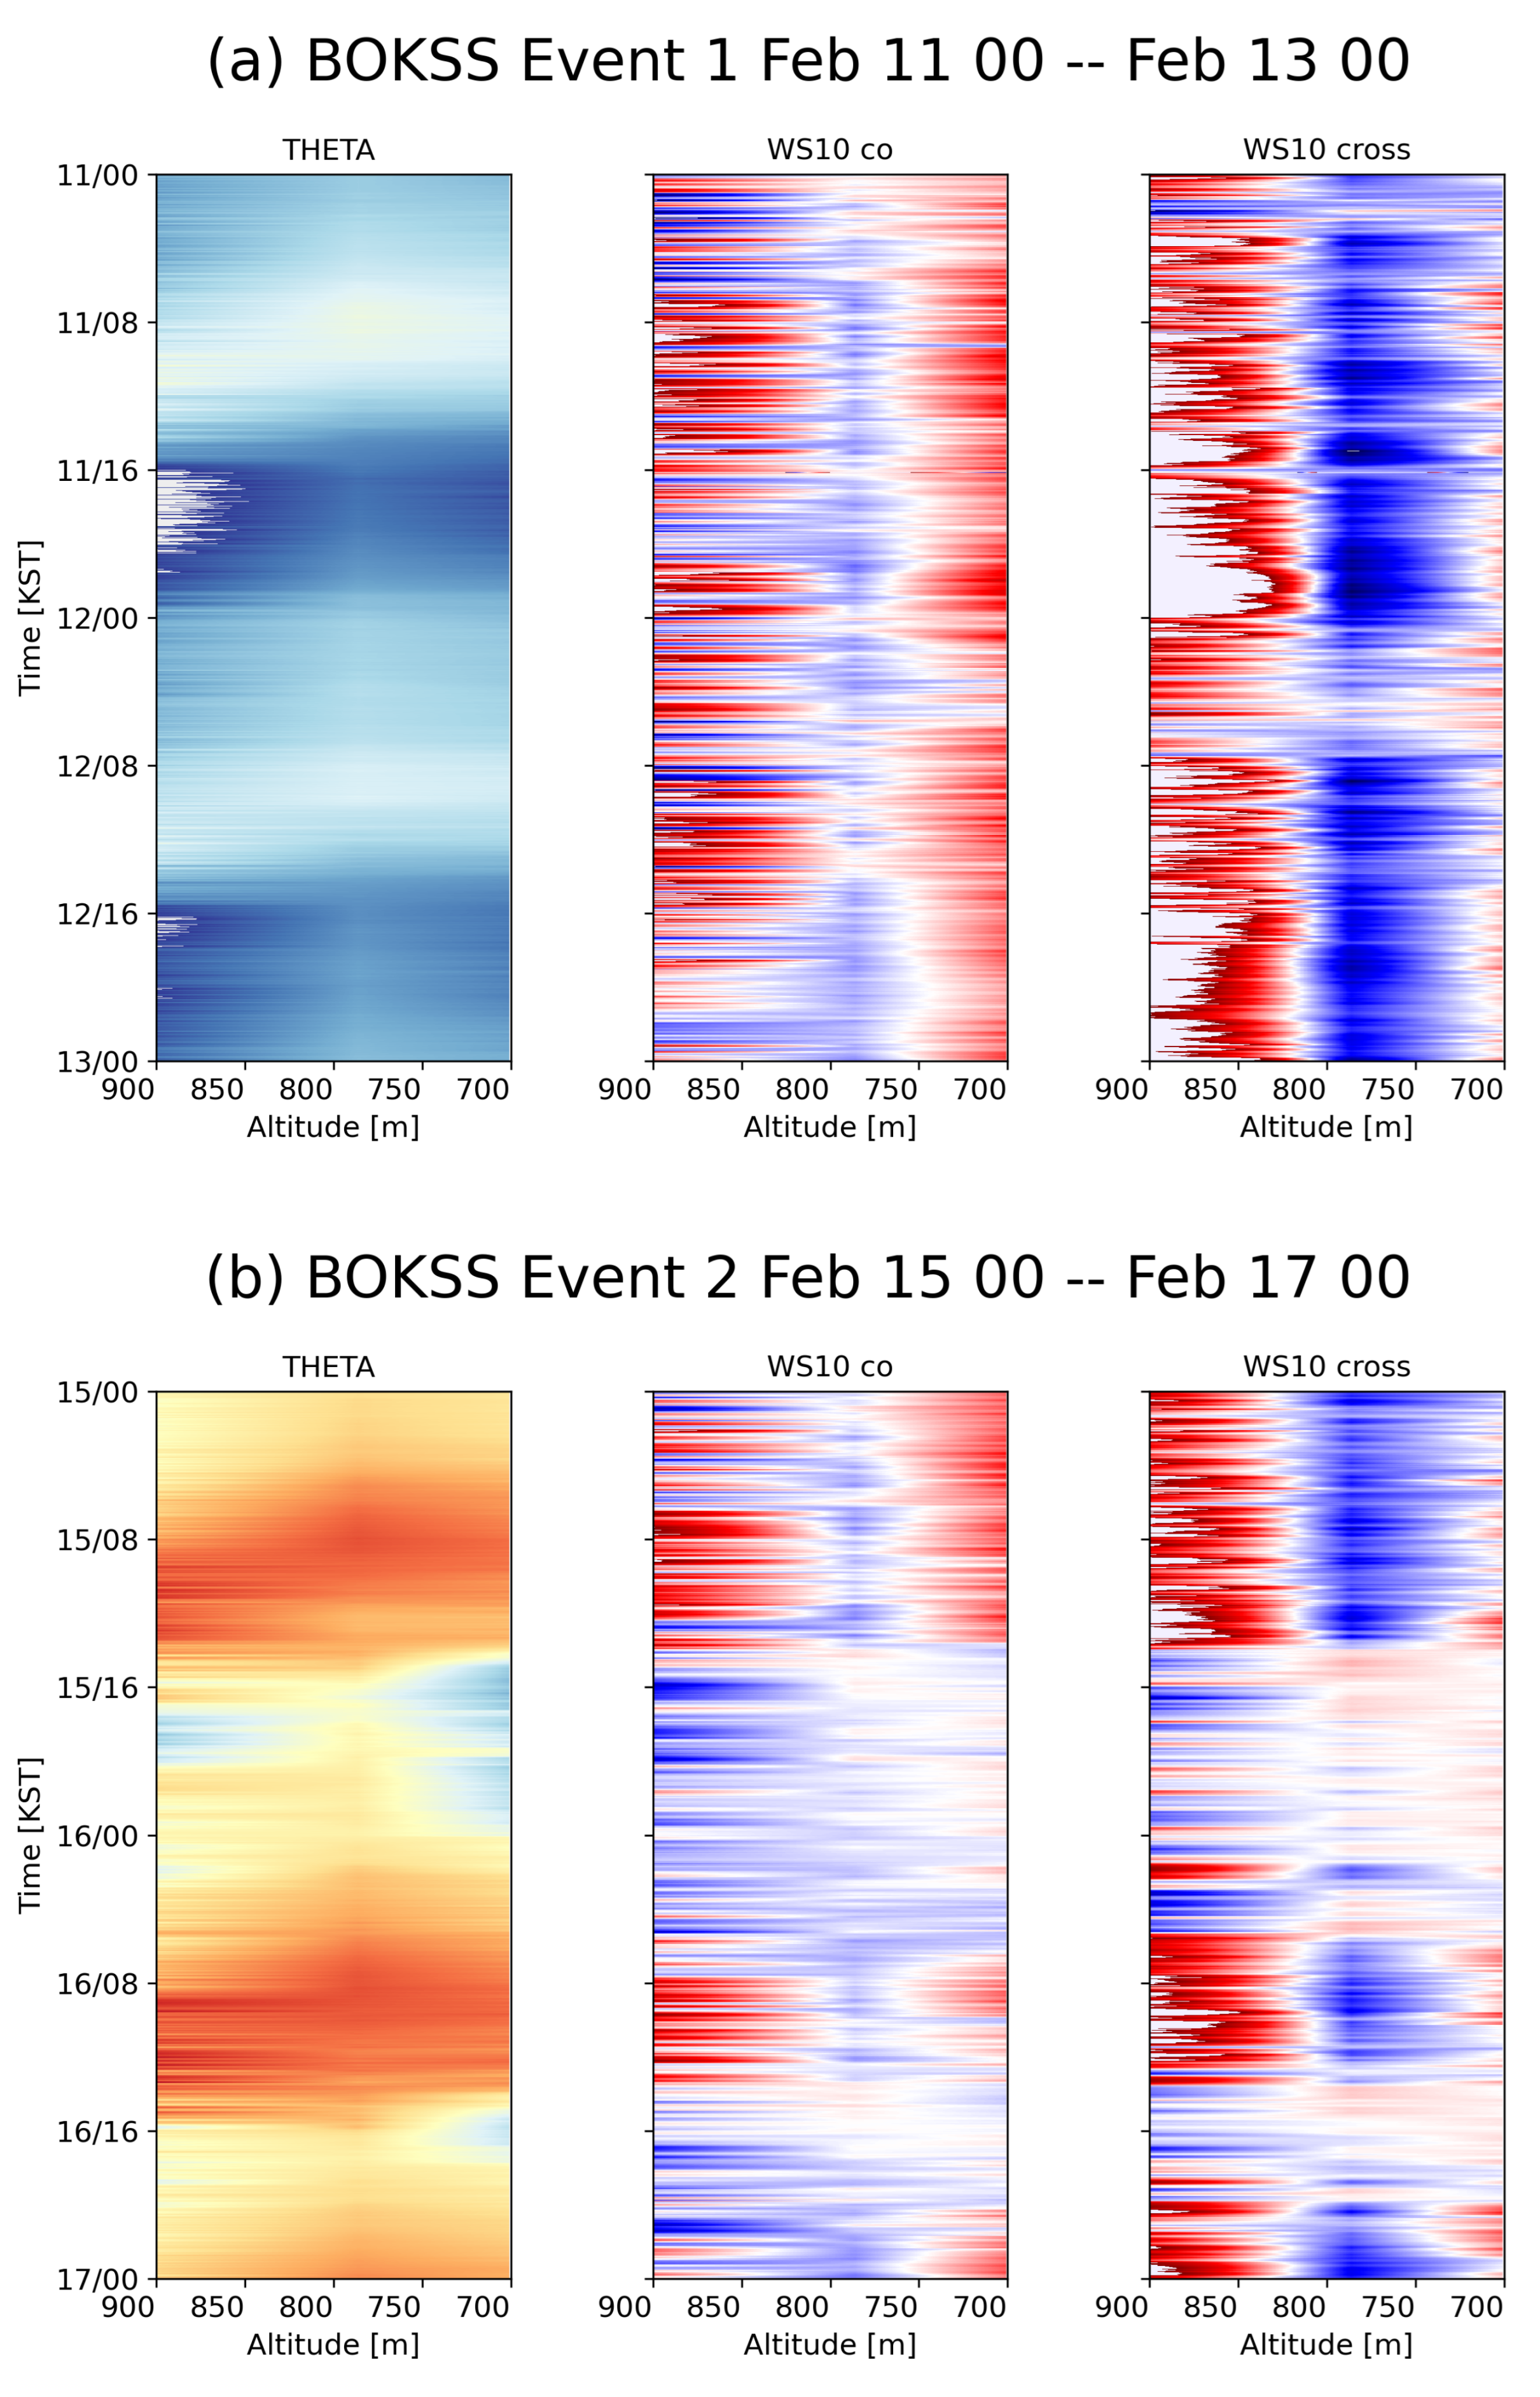
3.3. Hovmöller Analysis
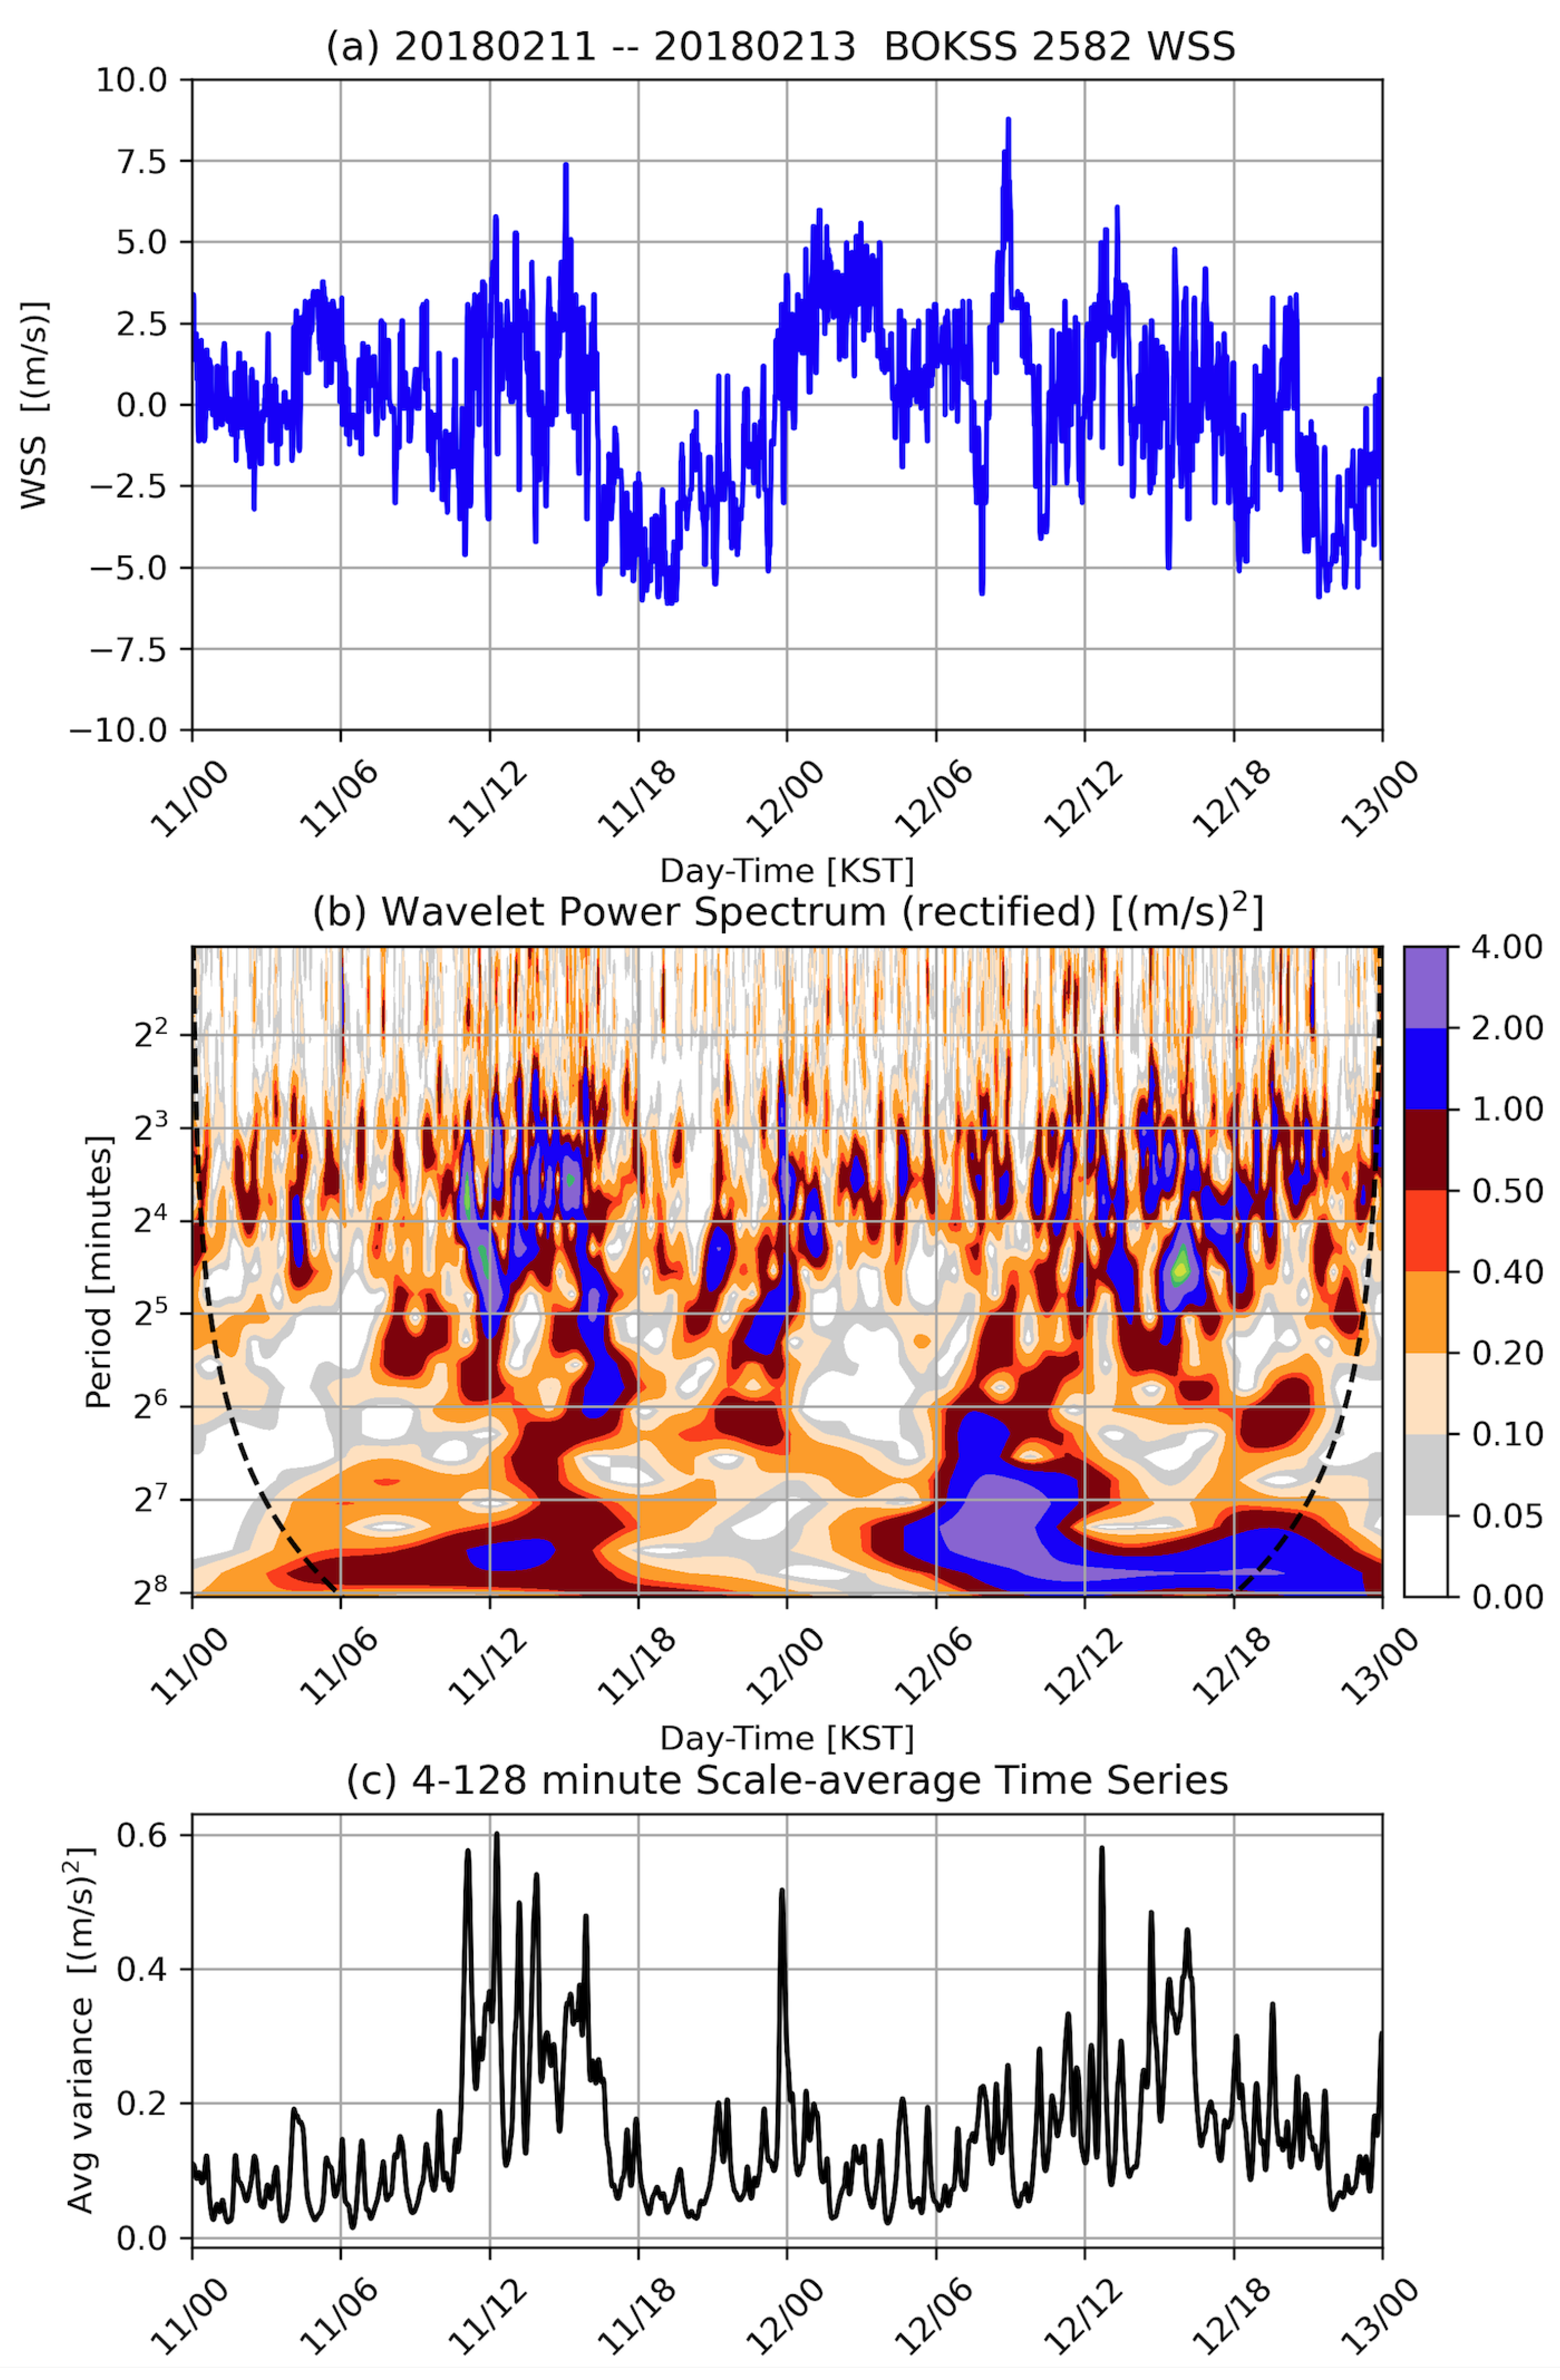
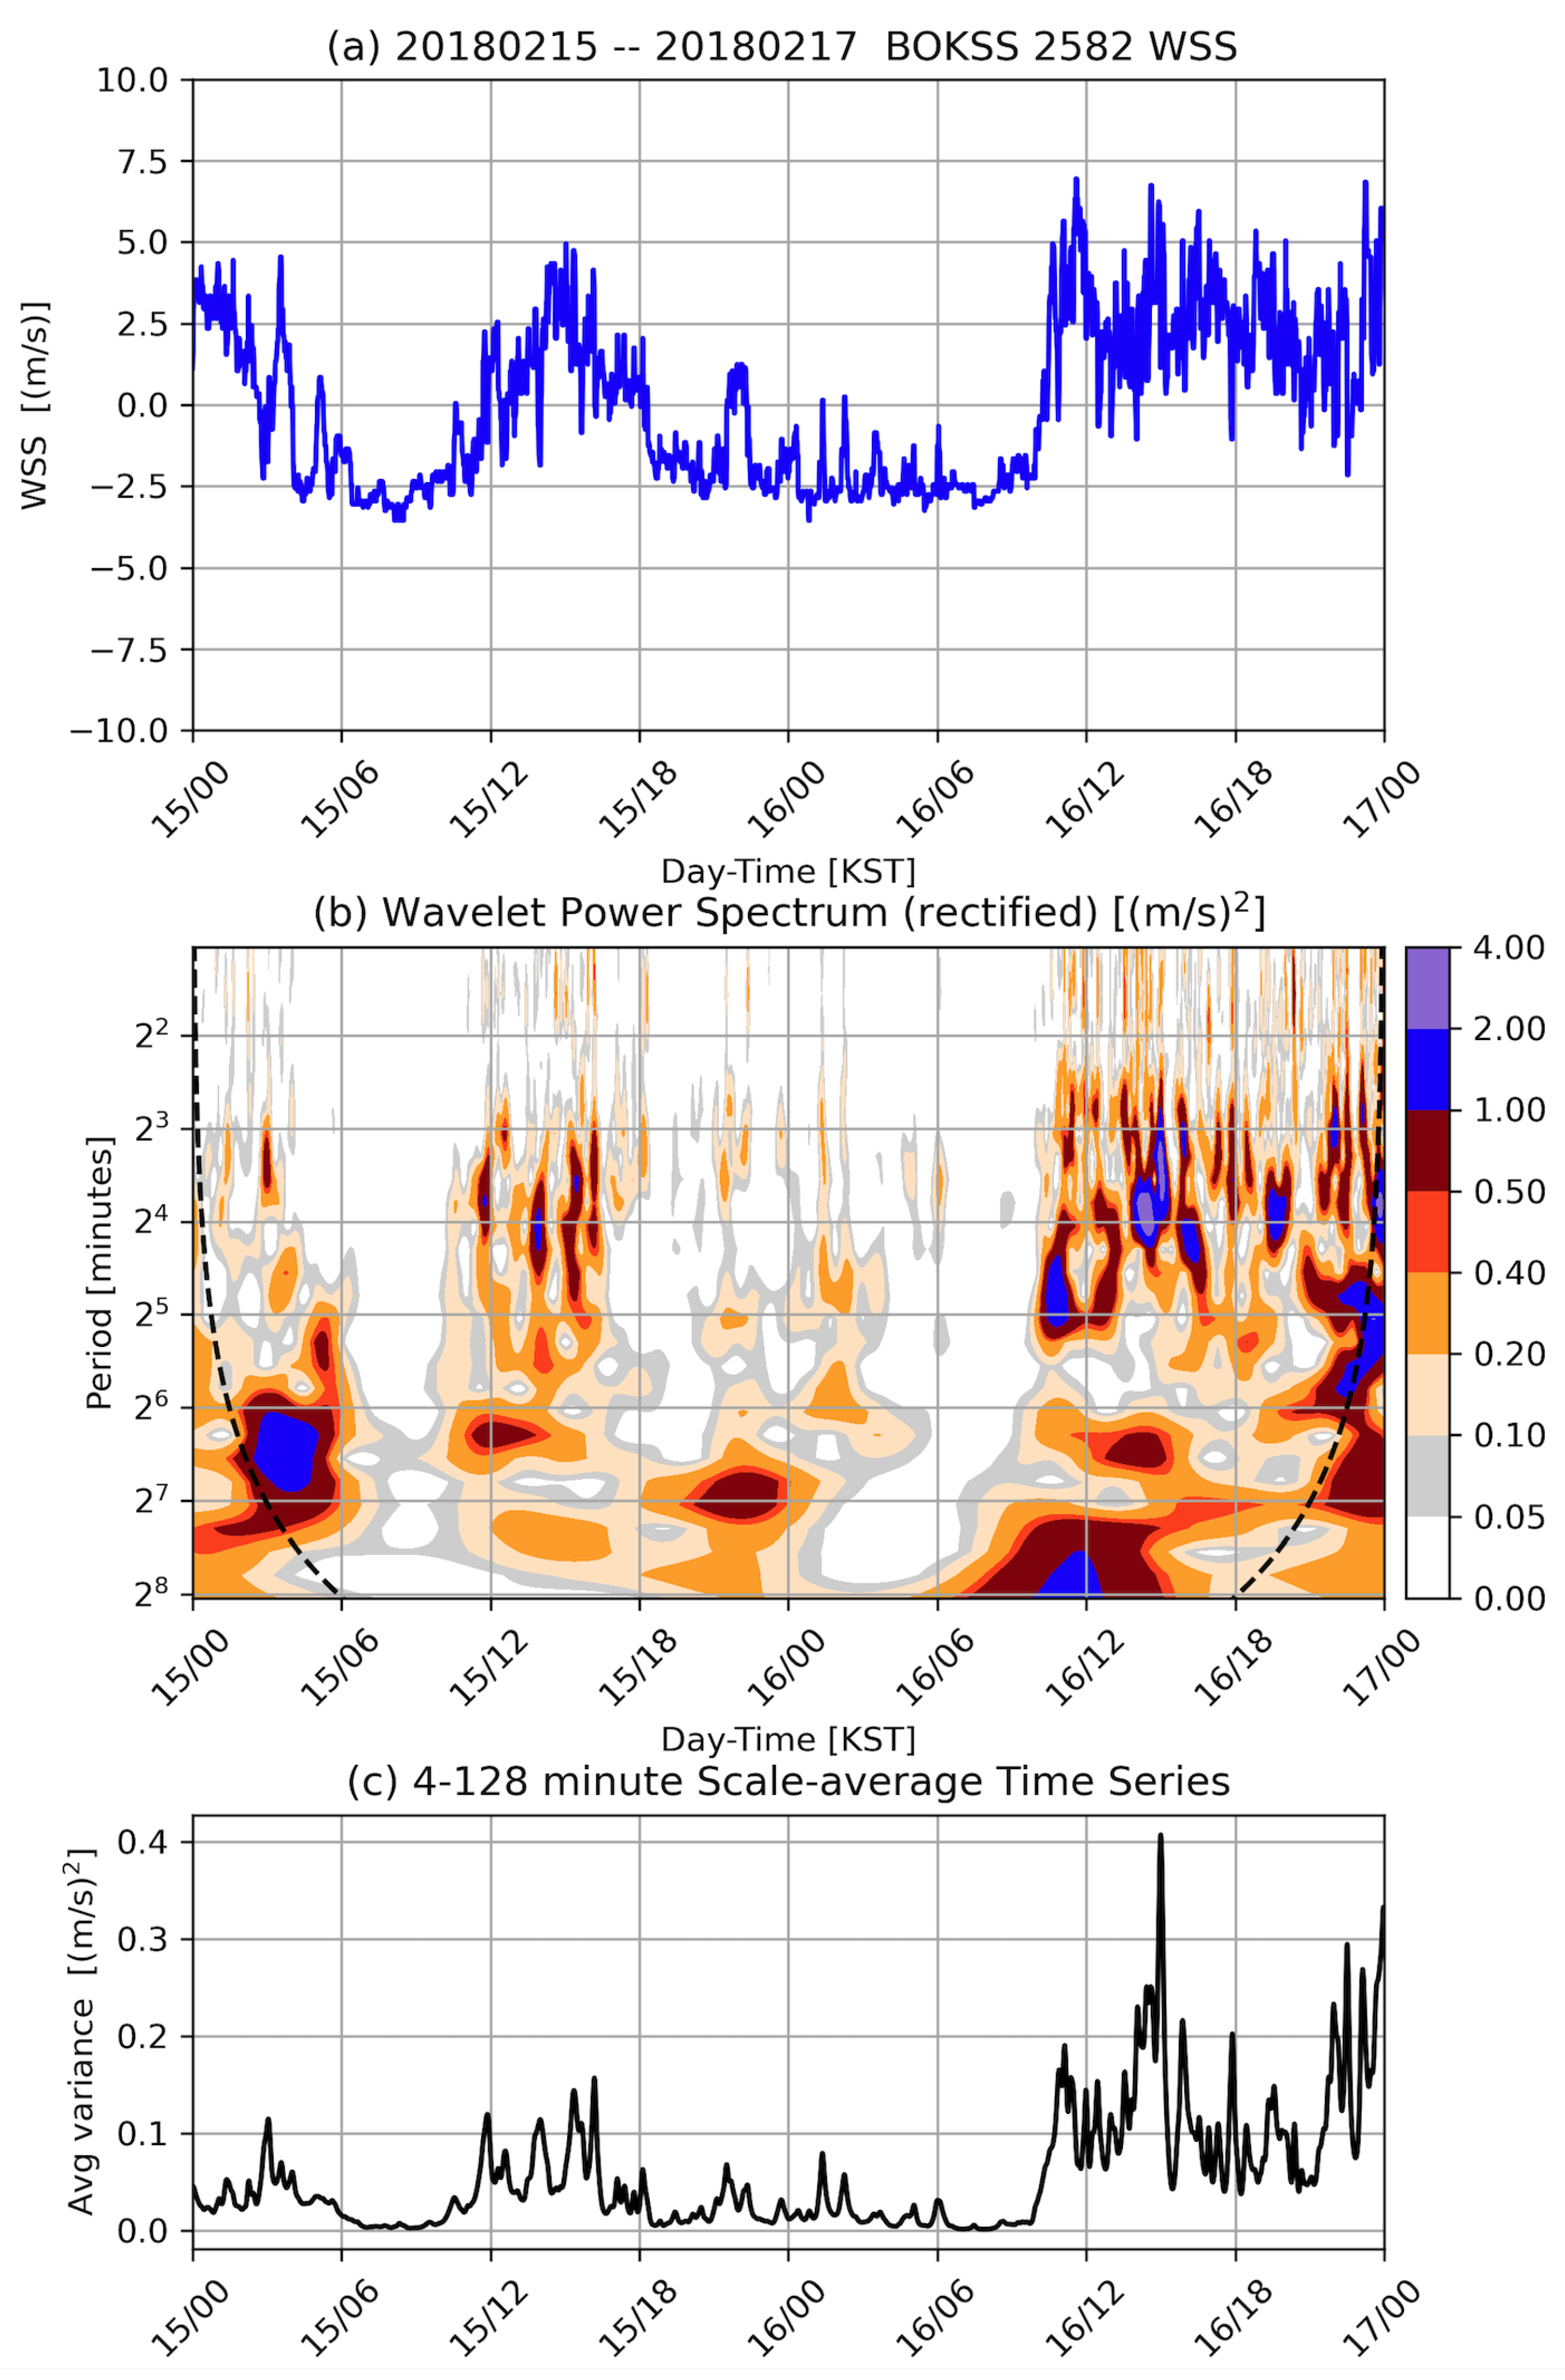
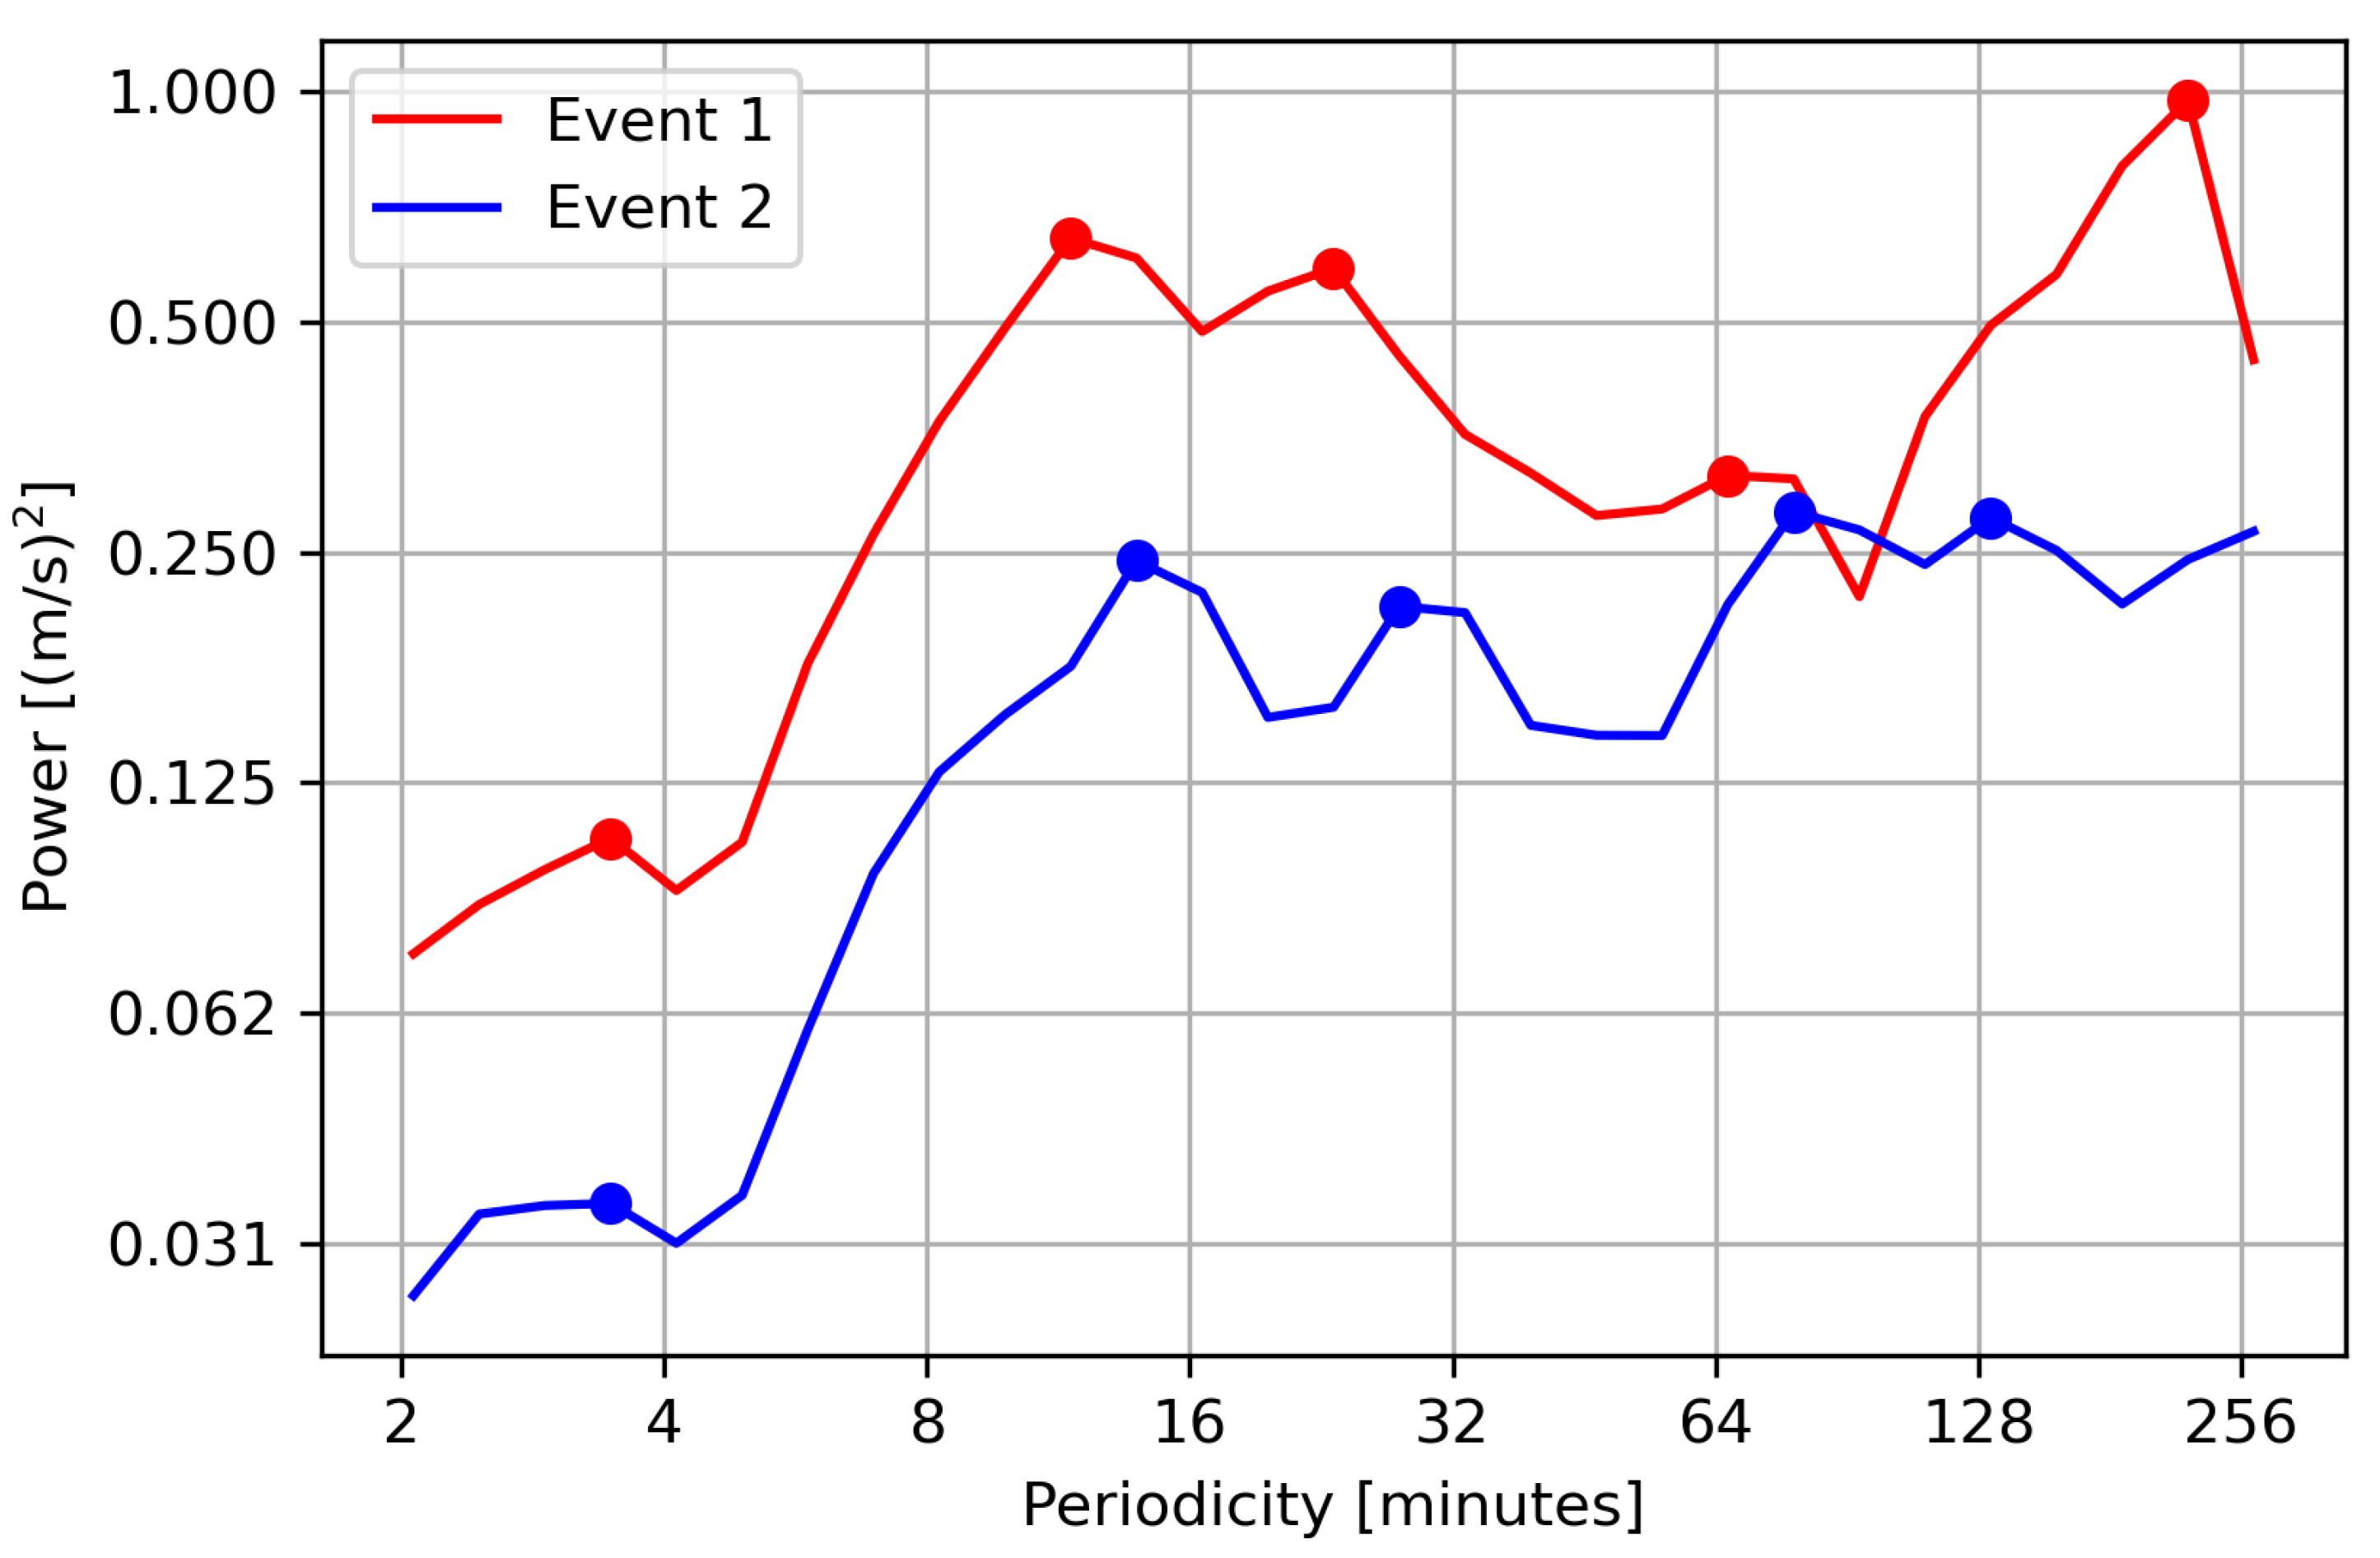
3.4. Wavelet Analysis
4. Discussion
- There is never enough data or guidance products. Expert forecasters develop the ability to filter out irrelevant information. Current telecommunication speeds and storage systems are more than adequate to handle the data volumes. Computing power is a limitation [37]. A review is needed of the needs/representativeness, standards and metadata for high-resolution data [24,25].
- Post-processing is an important consideration for the effective use of high-resolution data. In the WSSE, the difference and the variability in the wind traces of the three types of wind (WS10, WS1, WSS) provided a qualitative indication of the gusts. The Hovmöller analysis of potential temperature and co- and cross- winds provided a succinct post-processed product for visualizing the data and interpreting physical processes for the forecaster. The wavelet transform analysis was able to provide a quantitative clue about the presence of gusts.
- Intermittencies of about 20 min periodicities were observed and provided the possibility that these post-processed products, and others, may be combined and used to extrapolate to shorter periodicities. There is considerable research to understand the science and physical mechanisms [47].
- Attempts to organize an RDP on high-resolution data assimilation over the past twenty-five years have not been successful. This indicates the lack of maturity, the difficulty in transferring the technology or the inadequacy of the model. For example, if the difference in height of surface meteorological observation and the smoothed topography height in the model are too large, the data are filtered from the assimilation scheme (personal communication, Luc Filion). This would certainly be true in complex terrain. The inadequate or lack of representation of physical processes in the model is another factor [25,39,41].
- Observations lead to science and understanding, better model parameterizations, validation, user-based verification [24] and nowcast technique development. The latter will necessarily be based on advanced data analyses using heuristic, empirical or artificial intelligence techniques, even higher-resolution data (e.g., three-dimensional turbulence sensors), advanced instrumentation such as networks of Doppler lidars [16,17,18,51], additional cases and interpretation by forecasters for the end-user. The justification for operational networks should not be solely based on its use for data assimilation [24].
- In situ sensors provide information at discrete locations. It is important to have venue forecasters or in situ visual or remote sensing observations (e.g., video cameras, radars or lidars). In hindsight, they provided the only evidence of the impactful nature of the gusts.
- The implementation of new observation technologies and visualization systems are generational and episodic [37,38]. This leads to lags and gaps in the technology transfer process. For example, doppler radar or lidar networks are first demonstrated in research to assess their value; then radial velocity data assimilation research requires at least demonstration networks to be deployed and available. The use of precipitation from radar by research hydrologists require operational networks to be established and high quality quantitative precipitation radar products.
5. Summary
Author Contributions
Funding
Data Availability Statement
Acknowledgments
Conflicts of Interest
References
- Joe, P.; Doyle, C.; Wallace, A.; Cober, S.G.; Scott, B.; Isaac, G.A.; Smith, T.; Mailhot, J.; Snyder, B.; Belair, S.; et al. Weather Services, Science Advances, and the Vancouver 2010 Olympic and Paralympic Winter Games. Bull. Am. Meteorol. Soc. 2010, 91, 31–36. [Google Scholar] [CrossRef] [Green Version]
- Horel, J.; Potter, T.; Dunn, L.; Steenburgh, W.J.; Eubank, M.; Splitt, M.; Onton, D.J. Weather support for the 2002 Winter Olympic and Paralympic Games. Bull. Am. Meteorol. Soc. 2002, 83, 227–240. [Google Scholar] [CrossRef]
- Isaac, G.A.; Joe, P.I.; Mailhot, J.; Bailey, M.; Bélair, S.; Boudala, F.S.; Brugman, M.; Campos, E.; Carpenter, R.L., Jr.; Crawford, R.W.; et al. Science of nowcasting Olympic weather for Vancouver 2010 (SNOW-V10): A World Weather Research Programme project. Pure Appl. Geophys. 2014, 171, 1–24. [Google Scholar] [CrossRef]
- Keenan, T.; Joe, P.; Wilson, J.; Collier, C.; Golding, B.; Burgess, D.; May, P.; Pierce, C.; Bally, J.; Crook, A.; et al. The Sydney 2000 World Weather Research Programme Forecast Demonstration Project: Overview and Current status. Bull. Am. Meteorol. Soc. 2003, 84, 1041–1054. [Google Scholar] [CrossRef] [Green Version]
- Wilson, J.W.; Feng, Y.; Chen, M.; Roberts, R.D. Nowcasting Challenges during the Beijing Olympics: Successes, Failures, and Implications for Future Nowcasting Systems. Weather Forecast. 2010, 25, 1691–1714. [Google Scholar] [CrossRef]
- Kiktev, D.; Joe, P.; Isaac, G.A.; Montani, A.; Frogner, I.-L.; Nurmi, P.; Bica, B.; Milbrandt, J.; Tsyrulnikov, M.; Astakhova, E.; et al. FROST-2014: The Sochi Winter Olympics International Project. Bull. Am. Meteorol. Soc. 2017, 98, 1908–1929. [Google Scholar] [CrossRef]
- Lee, G.W.; Kim, K. International Collaborative Experiments for Pyeongchang 2018 Olympic and Paralympic Winter Games (ICE-POP 2018). AGU Fall Meeting, 2019, A2019AGUFM.A52B.06L. Available online: https://ui.adsabs.harvard.edu/abs/2019AGUFM.A52B.06L (accessed on 30 October 2022).
- Wyngaard, J.C. Atmospheric Turbulence. Annu. Rev. Fluid Mech. 1992, 24, 205–233. [Google Scholar] [CrossRef]
- Kolmogorov, A.N. Dissipation of Energy in Locally Isotropic Turbulence. Proc. R. Soc. A 1991, 434, 15–17. [Google Scholar]
- Kolmogorov, A.N. The local structure of turbulence in incompressible viscous fluid for very large Reynolds numbers. Proc. R. Soc. A 1991, 434, 9–13. [Google Scholar] [CrossRef]
- Teakles, A.; Mo, R.; Dierking, C.F.; Emond, C.; Smith, T.; McLennan, N.; Joe, P.I. Realizing user-relevant conceptual model for the ski jump venue of the Vancouver 2010 Winter Olympics. Pure Appl. Geophys. 2014, 171, 185–207. [Google Scholar] [CrossRef]
- Gehring, J.; Oertel, A.; Vignon, E.; Jullien, N.; Besic, N.; Berne, A. Microphysics and dynamics of snowfall associated with a warm conveyor belt over Korea. Atmos. Chem. Phys. 2020, 20, 7373–7392. [Google Scholar] [CrossRef]
- Stoelinga, M.T.; Hobbs, P.V.; Mass, C.F.; Locatelli, J.D.; Colle, B.A.; Houze, R.A., Jr.; Rangno, A.L.; Bond, N.A.; Smull, B.F.; Rasmussen, R.M.; et al. Improvement of Microphysical Parameterization through Observational Verification Experiment. Bull. Am. Meteorol. Soc. 2003, 84, 1807–1826. [Google Scholar] [CrossRef]
- Steiner, M.; Bousquet, R.A.H.O.; Smull, B.F.; Mancini, M. Airflow within major Alpine river valleys under heavy rainfall. Quart. J. R. Meteorol. Soc. 2003, 129, 411–431. [Google Scholar] [CrossRef]
- Theriault, J.M.; Rasmussen, R.; Smith, T.; Mo, R.; Milbrandt, J.A.; Brugman, M.M.; Joe, P.; Isaac, G.; Mailhot, J.; Denis, B. A case study of processes impacting precipitation phase and intensity during the Vancouver 2010 Winter Olympics. Wea. Forecast. 2012, 27, 1301–1325. [Google Scholar] [CrossRef] [Green Version]
- Fernando, H.J.S.; Verhoef, B.; Sabatino, S.D.; Leo, L.S.; Park, S. The Phoenix Evening Transition Flow Experiment (TRANSFLEX). Bound.-Layer Meteorol. 2013, 147, 443–468. [Google Scholar] [CrossRef]
- Fernando, H.J.S.; Pardyjak, E.R.; Sabatino, S.D.; Chow, F.K.; De Wekker, J.; Hoch, S.W.; Hacker, J.; Pace, J.C.; Pratt, T.; Pu, Z.; et al. The MATERHORN: Unraveling the intricacies of mountain weather. Bull. Am. Meteorol. Soc. 2015, 96, 1945–1967. [Google Scholar] [CrossRef]
- Fernando, H.J.S.; Mann, J.; PalmLMa, J.M.L.M.; Lundquist, J.K.; Barthelmie, R.J.; Belo-Pereira, M.; Brown, W.O.J.; Chow, F.K.; Gerz, T.; Hocut, C.M.; et al. The Perdigao: Peering into Microscale Details of Mountain Winds. Bull. Am. Meteorol. Soc. 2019, 96, 799–819. [Google Scholar] [CrossRef]
- Whiteman, C.D. Observations of thermally developed windsystems in mountainous terrain. In Atmospheric Processes over Complex Terrain; Meteorological Monographs; American Meteorological Society: Boston, MA, USA, 1990; No. 45; pp. 5–42. [Google Scholar]
- Whiteman, C.D. Mountain Meteorology: Fundamentals and Applications; Oxford University Press: Oxford, UK, 2000; 732p. [Google Scholar]
- Tsai, C.-L.; Kim, K.; Liou, Y.-C.; Kim, J.-H.; Lee, Y.; Lee, G. Orographic-Induced Strong Wind Associated with a Low-Pressure System Under Clear-Air Condition During ICE-POP 2018. J. Geophys. Res. Atmos. 2022, 127, e2021JD036418. [Google Scholar] [CrossRef]
- Park, J.-R.; Kim, J.-H.; Shin, Y.; Kim, S.-H.; Chun, H.-Y.; Jang, W.; Tsai, C.-L.; Lee, G. A Numerical Simulation of Strong Windstorm Event in the Taebaek Mountain Region during the ICE-POP 2018. Atmos. Res. 2022, 272, 106158. [Google Scholar] [CrossRef]
- SS-Event. PyeongChang 2018 Olympic Winter Games, Women’s Slope Style Competition. 2018. Available online: https://olympics.com/en/video/women-s-slopestyle-final-snowboard-pyeongchang-2018-replays (accessed on 16 February 2022).
- WIGOS-HLG. Vision for the WMO Integrated Global Observing System in 2020. 2019. Available online: https://library.wmo.int/doc_num.php?explnum_id=10278 (accessed on 8 February 2022).
- Joe, P.; Belair, S.; Bernier, N.; Brook, J.; Dehghan, A.; Filion, L.; Gultepe, I.; Henderson, D.; Johnstone, D.; Klaassen, J.; et al. The Pan-American Games Science Showcase Project. Bull. Am. Meteorol. Soc. 2018, 99, 921–953. [Google Scholar] [CrossRef]
- Klaassen, J. Summer 2012 Compact Weather Station Sensor Intercomparison Study, in support of the Pan Am and Parapan Am Games. Bull. Am. Meteorol. Soc. 2018, 99, 921–953. [Google Scholar]
- Izumi, Y.; Barad, M.L. Wind speeds as measured by cup and sonic anemometers and influenced by tower structure. J. Appl. Meteorol. Climatol. 1970, 9, 851–856. [Google Scholar] [CrossRef]
- Gill, G.C. Comments on Wind Speeds as Measured by Cup and Sonic Anemometers and Influenced by Tower Structure. J. Appl. Meteorol. 1973, 12, 732–735. [Google Scholar] [CrossRef]
- Joe, P.; Scott, B.; Doyle, C.; Isaac, G.; Gultepe, I.; Forsyth, D.; Cober, S.; Campos, E.; Heckman, I.; Donaldson, N.; et al. The Monitoring Network of the Vancouver 2010 Olympics. Pure Appl. Geophys. 2014, 171, 25–58. [Google Scholar] [CrossRef]
- Kim, K.; Bang, W.; Chang, E.; Tapiador, F.J.; Tsai, C.; Jung, E.; Lee, G. Impact of wind pattern and complex topography on snow microphysics during ICE-POP 2018. Atmos. Chem. Phys. Discuss. 2021, 128, 1–36. [Google Scholar] [CrossRef]
- Whiteman, C.D.; Doran, J.C. The relationship between overlying synoptic-scale flows and Winds within a valley. J. Appl. Meteorol. Climatol. 1993, 32, 1669–1682. [Google Scholar] [CrossRef]
- Colle, B.A. Sensitivity of orographic precipitation to changing ambient conditions and terrain geometries: An idealized modeling perspective. J. Atmos. Sci. 2004, 61, 588–606. [Google Scholar] [CrossRef]
- Chang, P.K. Separation of Flow; Pergamom Press: Oxford, UK, 1970. [Google Scholar] [CrossRef]
- Torrence, C.; Campo, G.P. A practical guide to wavelet analysis. Bull. Am. Meteorol. Soc. 1998, 79, 61–78. [Google Scholar] [CrossRef]
- Liu, Y.; Liang, X.S.; Weisberg, R.H. Rectification of the Bias in the Wavelet Power Spectrum. J. Atmos. Ocean. Technol. 2007, 34, 2093–2102. [Google Scholar] [CrossRef]
- Golding, B. (Ed.) Towards the ’Perfect’ Weather Warning. Bridging Interdisciplinary Gaps through Partnership and Communication; Springer: Cham, Switzerland, 2022; 270p. [Google Scholar] [CrossRef]
- Joe, P.; Sun, J.; Yussouf, N.; Goodman, S.; Riemer, M.; Gouda, K.; Golding, B.; Rogers, R.; Isaac, G.; Wilson, J.; et al. Chapter 7: Bridging the fifth valley—A partnership of observation scientists with forecasters. In Towards the ’Perfect’ Weather Warning: Bridging Interdisciplinary Gaps through Partnership and Communication; Golding, B., Ed.; Springer: Cham, Switzerland, 2022. [Google Scholar]
- Heizenreder, D.; Joe, P.; Hewson, T.; Wilson, L.; Davies, P.; de Coning, E. Chapter 21: Development of applications towards a High Impact weather Forecast System. In Contribution to Seamless Prediction of the Earth System, from Minutes to Months; WMO-1156; World Meteorological Organization: Geneva, Switzerland, 2015; 471p. [Google Scholar]
- Grimmond, S.; Bouchet, V.; Molina, L.; Baklanov, A.; Tan, J.; Schluenzen, K.H.; Mills, G.; Golding, B.; Masson, V.; Ren, C.; et al. Integrated Urban Hydrometeorological, Climate and Environmental Services: Concept, Methodology and Key Messages. Urban Clim. 2020, 33, 100623. [Google Scholar] [CrossRef]
- Majumdar, S.J.; Sun, J.; Caumont, O.; Dudhia, J.; Golding, B.; Gouda, K.C.; Joe, P.; Steinle, P.; Vincendon, B.; Wang, J.J.; et al. Multiscale Forecasting of High-Impact Weather: Current Status and Future Challenges. Bull. Am. Meteorol. Soc. 2021, 102, E635–E659. [Google Scholar] [CrossRef]
- Joe, P.; Baklanov, A.; Grimmond, S.; Bouchet, V.; Molina, L.T.; Schluenzen, K.H.; Mills, G.; Tan, J.; Golding, B.; Masson, V.; et al. Guidance on Integrated Urban Hydro-meteorological, Climate and Environmental Services: Challenges and the Way Forward (Chapter 14). In Urban Climate Science for Planning Healthy Cities; Ren, C., McGregor, G., Eds.; Springer Nature: Cham, Switzerland, 2021; 406p. [Google Scholar] [CrossRef]
- Pliske, R.; Klinger, D.; Hutton, R.; Crandall, B.; Knight, B.; Klein, G. Understanding Skilled Weather Forecasting: Implications for Training and the Design of Forecasting Tools; Contractor Rep. AL/HR-CR-1997-003, Material; Armstrong Laboratory, U. S. Air Force: Washington, DC, USA, 1997. [Google Scholar]
- Pliske, R.M.; Crandall, B.; Klein, G. Competence in weather forecasting. In Psychological Investigations of Competence in Decision Making; Smith, K., Shanteau, J., Johnson, P., Eds.; Cambridge University Press: Cambridge, UK, 2004; pp. 40–68. [Google Scholar]
- Hoffman, R.; LaDue, D.S.; Mogil, H.M.; Roebber, R.J.; Trafton, J.G. Minding the Weather, How Expert Forecasters Think; MIT Press: Cambridge, MA, USA, 2017; 470p, ISBN 978-0-262-03606-1. [Google Scholar]
- Rogers, E.M. Diffusion of Innovations, 5th ed.; Simon and Schuster, Free Press: New York, NY, USA, 2003; 576p. [Google Scholar]
- Shannon, C.E. A mathematical theory of communication. Bell Syst. Tech. J. 1948, 27, 379–423, 623–656. [Google Scholar] [CrossRef] [Green Version]
- McKeown, R.; Oscillator-Monic, R.; Muir, A.; Brenner, M.P.; Rubinstein, S.M. Cascade leading to the emergence of small structures in vortex ring collisions. Phrs. Rev. Fluids 2018, 3, 124702. [Google Scholar] [CrossRef]
- Morrison, H.; van Lier-Walqui, M.; Fridlind, A.M.; Grabowski, W.W.; Harrington, J.Y.; Hoose, C.; Korolev, A.; Kumjian, M.R.; Milbrandt, J.A.; Pawlowska, H.; et al. Confronting the challenge of modeling cloud and precipitation microphysics. J. Adv. Model. Earth Syst. 2020, 12, e2019MS001689. [Google Scholar] [CrossRef]
- Mo, R.; Joe, P.; Isaac, G.A.; Gultepe, I.; Rasmussen, R.; Milbrandt, J.; McTaggart-Cowan, R.; Mailhot, J.; Brugman, M.; Smith, T.; et al. Mid-Mountain Clouds at Whistler During the Vancouver 2010 Winter Olympics and Paralympics. Pure Appl. Geophys. 2014, 171, 157–183. [Google Scholar] [CrossRef]
- Huang, L.X.; Isaac, G.A.; Sheng, G. A new integrated weighted model in SNOW-V10: Verification of continuous variables. Pure Appl. Geophys. 2014, 171, 277–287. [Google Scholar] [CrossRef]
- Vasiljević, N.; LM Palma, J.M.; Angelou, N.; Carlos Matos, J.; Menke, R.; Lea, G.; Mann, J.; Courtney, M.; Ribeiro, F.L.; MGC Gomes, V.M. Perdigáo 2015: Methodology for atmospheric multi-Doppler lidar experiments. Atmos. Meas. Tech. 2017, 10, 3463–3483. [Google Scholar] [CrossRef] [Green Version]


| Station Number | Longitude | Latitude | Altitude (m) | Distance (m) | Slope Drop (m) | Slope Direction () | Incline () |
|---|---|---|---|---|---|---|---|
| 2588 | 128.3232113 | 37.5743463 | 874 | ||||
| 2582 | 128.3225450 | 37.5773941 | 823 | 343 | 51 | 170 | 8.4 |
| 2583 | 128.3247780 | 37.5794284 | 709 | 300 | 114 | 221 | 20.8 |
| Summary | 581 | 165 | 194 | 15.9 |
| Event | Start Day | End Day | Event | Description |
|---|---|---|---|---|
| 1 | 11 | 12 | Women’s Slope Style | Qualification canceled on 11 February due to strong winds, Finals held on 12 February when winds were even stronger. |
| 2 | 16 | 16 | Transition | Diurnal event. |
| 3 | 21 | 23 | Multi-day Wind Event | Strong winds were predicted and events moved to avoid 22 February 2018. |
| Winter | 1 December 2017 | 31 March 2018 | 4-month period | For comparison |
Disclaimer/Publisher’s Note: The statements, opinions and data contained in all publications are solely those of the individual author(s) and contributor(s) and not of MDPI and/or the editor(s). MDPI and/or the editor(s) disclaim responsibility for any injury to people or property resulting from any ideas, methods, instructions or products referred to in the content. |
© 2023 by the authors. Licensee MDPI, Basel, Switzerland. This article is an open access article distributed under the terms and conditions of the Creative Commons Attribution (CC BY) license (https://creativecommons.org/licenses/by/4.0/).
Share and Cite
Joe, P.; Lee, G.; Kim, K. The Challenges of Micro-Nowcasting and the Women’s Slope Style Event at the PyeongChang 2018 Olympic Winter Games. Meteorology 2023, 2, 107-127. https://doi.org/10.3390/meteorology2010008
Joe P, Lee G, Kim K. The Challenges of Micro-Nowcasting and the Women’s Slope Style Event at the PyeongChang 2018 Olympic Winter Games. Meteorology. 2023; 2(1):107-127. https://doi.org/10.3390/meteorology2010008
Chicago/Turabian StyleJoe, Paul, GyuWon Lee, and Kwonil Kim. 2023. "The Challenges of Micro-Nowcasting and the Women’s Slope Style Event at the PyeongChang 2018 Olympic Winter Games" Meteorology 2, no. 1: 107-127. https://doi.org/10.3390/meteorology2010008