1. Introduction
In boreal winter, East Asia is frequently impacted by outbreaks of cold air mass originating from Mongolia, Siberia or even the polar region. The surface signatures of such cold outbreaks include significant pressure rise, strengthening winds, and abrupt temperature drop along its front edge. The eastward and southward movement of cold air mass over East Asia is referred as the East Asian Winter Monsoon [
1], and the associated abrupt change of weather regime is generally referred as a “monsoon surge”. Previous studies [
2,
3,
4,
5,
6,
7] were conducted for the synoptics, thermodynamics and inter-annual variability of the winter monsoon.
1.1. Surface Patterns of Monsoon Surges Affecting Hong Kong
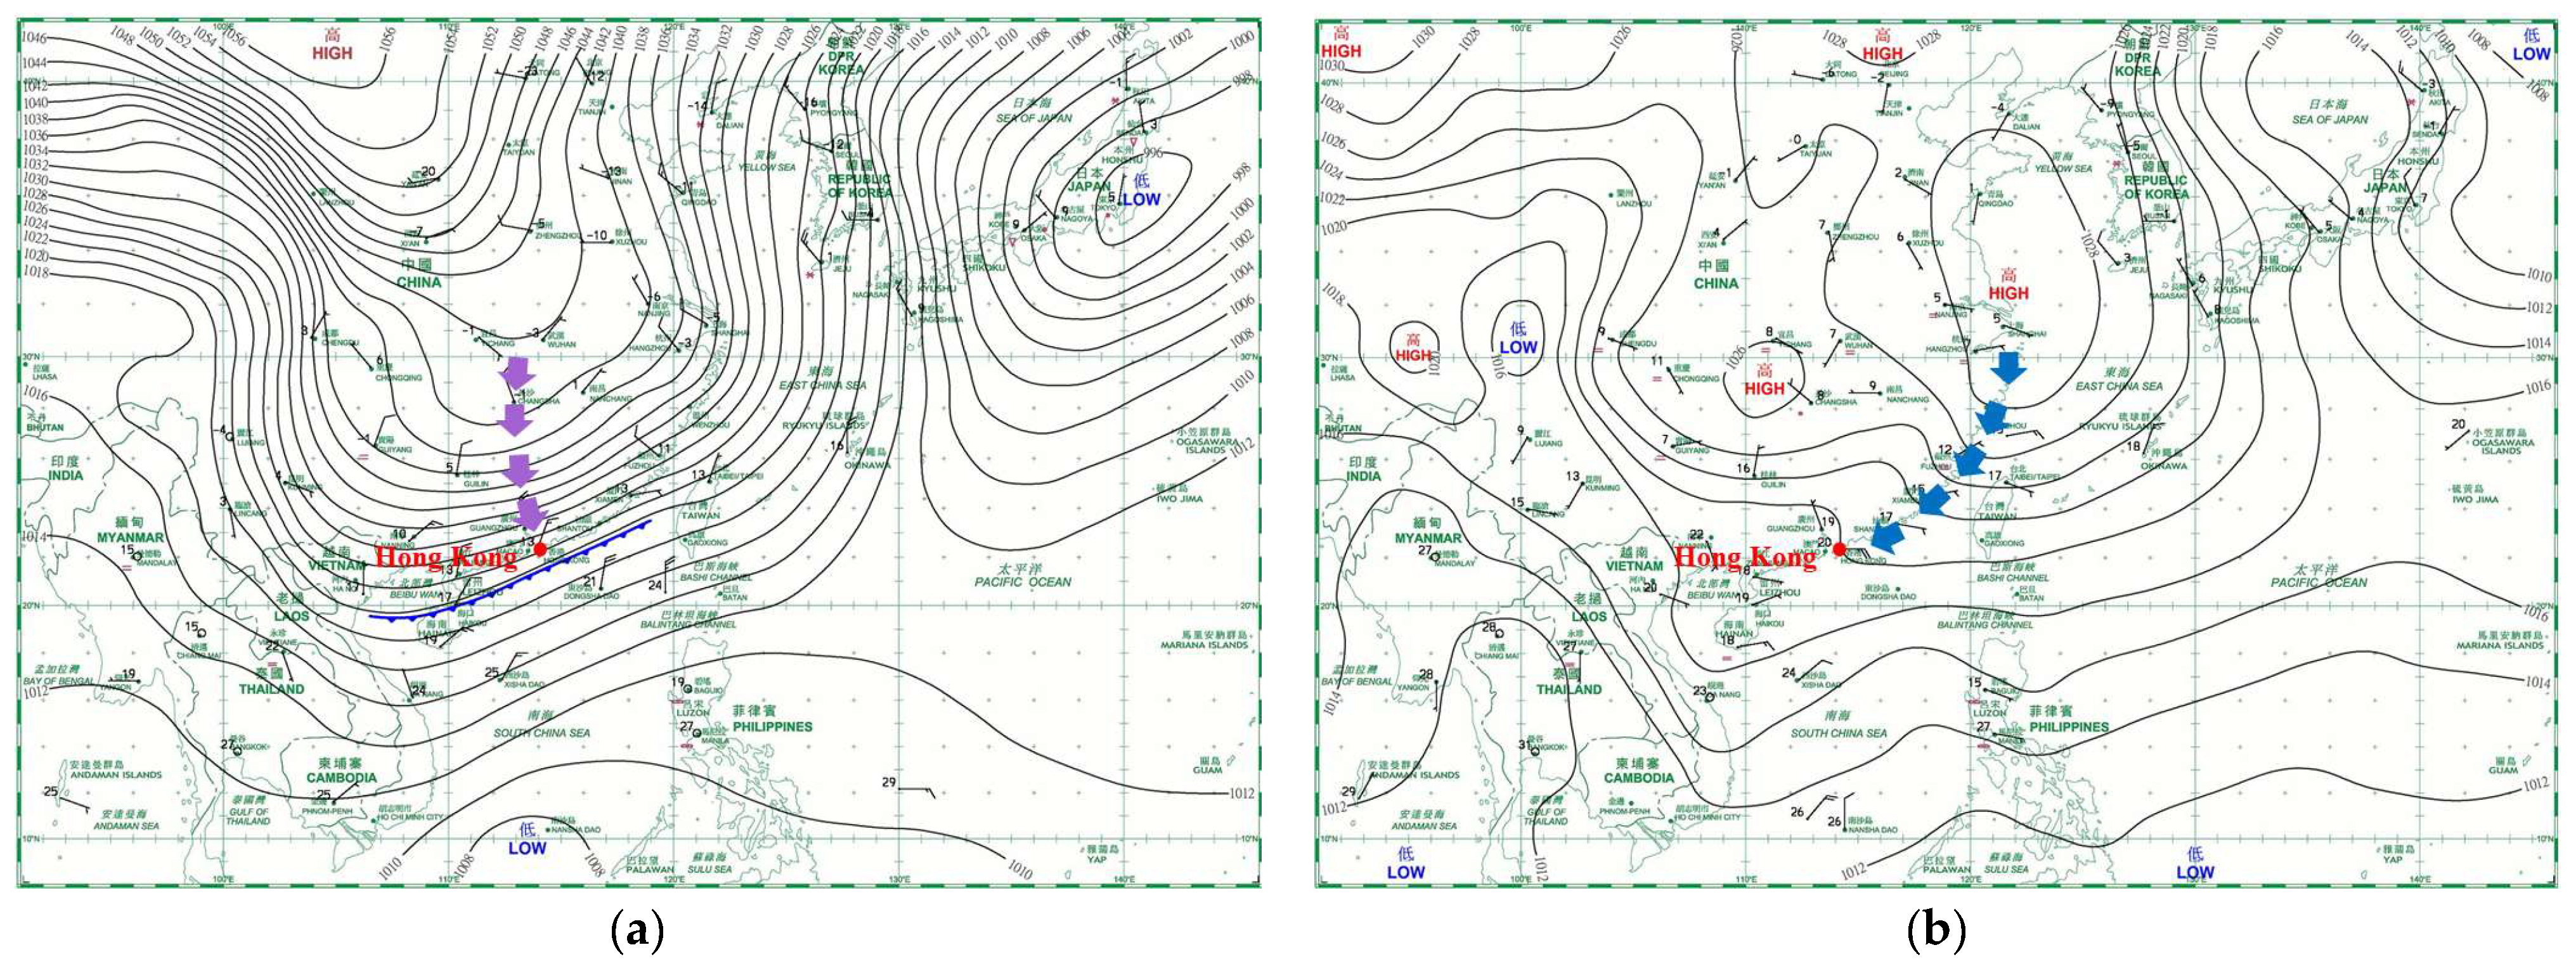
Located in the subtropics and bordered by mainland China and the South China Sea, Hong Kong has distinct monsoon seasons throughout the year. When cold outbreaks over northern China are sufficiently intense, the winter monsoon may further advance southwards and reach the coast of southern China along two major paths: (a) southward crossing the central part of China, the Nanling ranges and landmass of southern China; or (b) south and then turning south-westward, traversing the coastal regions of southeastern China including coastal waters. The two types of monsoon flow are named northerly surge and easterly surge in Hong Kong, respectively, where local winds increase from the north and the east upon the arrival of the surge.
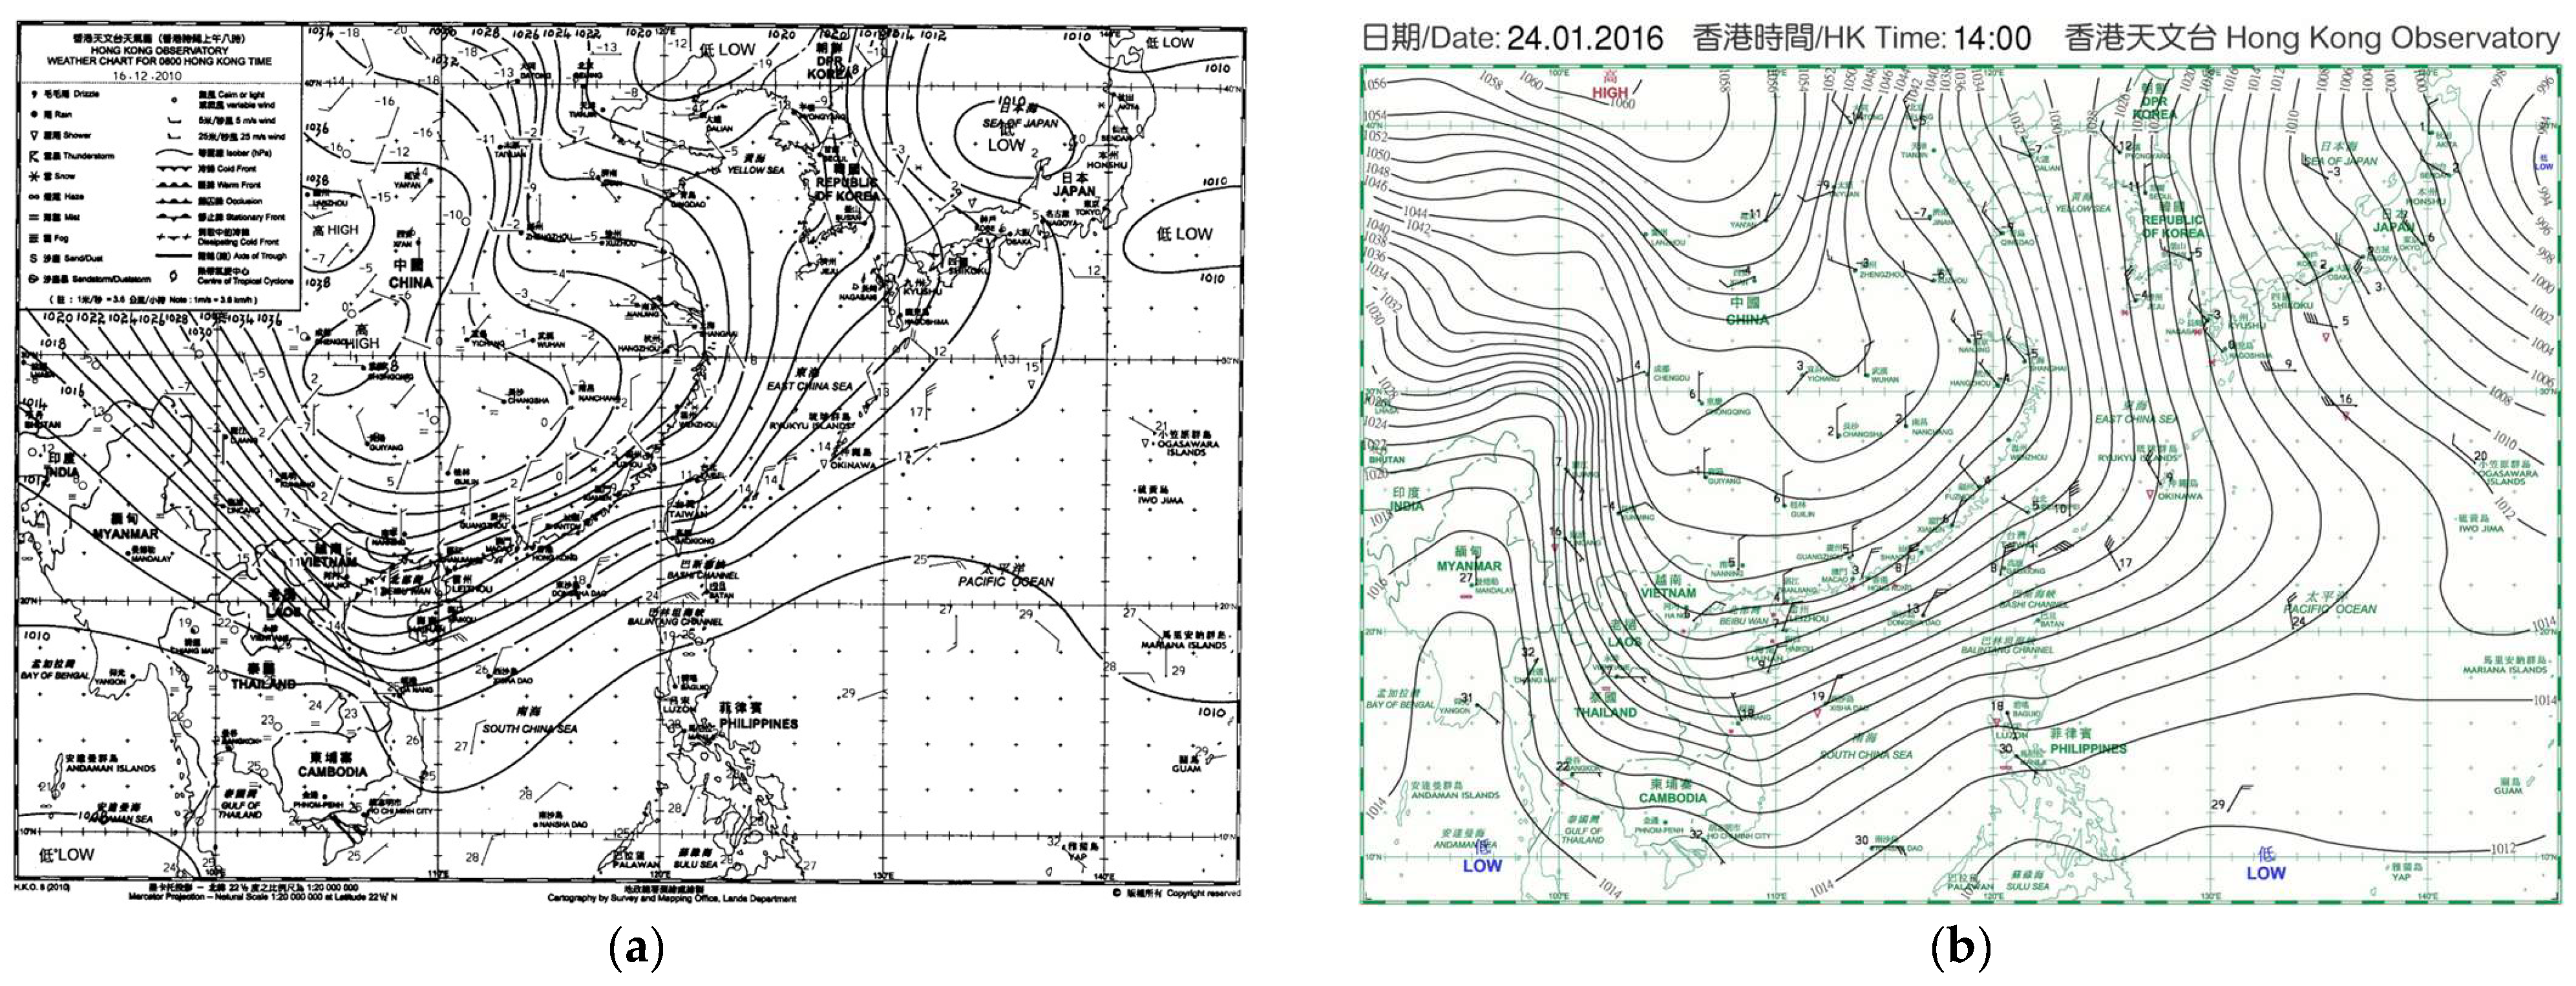
Figure 1 shows the typical surface pressure patterns for northerly and easterly surges. The former shows a large pressure gradient over southern China, prompting significant isallobaric flow and very effective cold advection from north to south. The latter shows a ridge feature along the coast of southeastern China; cold advection along this path is less effective as the flow is moderated by warmer sea surface along its path. Significant temperature drop associated with surge arrival over inland China and Hong Kong is usually due to northerly surges [
5,
8,
9].
1.2. Climatology of Cold Weather in Hong Kong
In Hong Kong there was an average of 15.2 and 0.6 days each year with daily minimum temperatures at or below 12.0 and 7.0 degrees Celsius (°C), respectively, in 1991–2020. These two thresholds were adopted by the Hong Kong Observatory (HKO) to define “cold” and “very cold” weather in Hong Kong in accordance with local winter climatology.
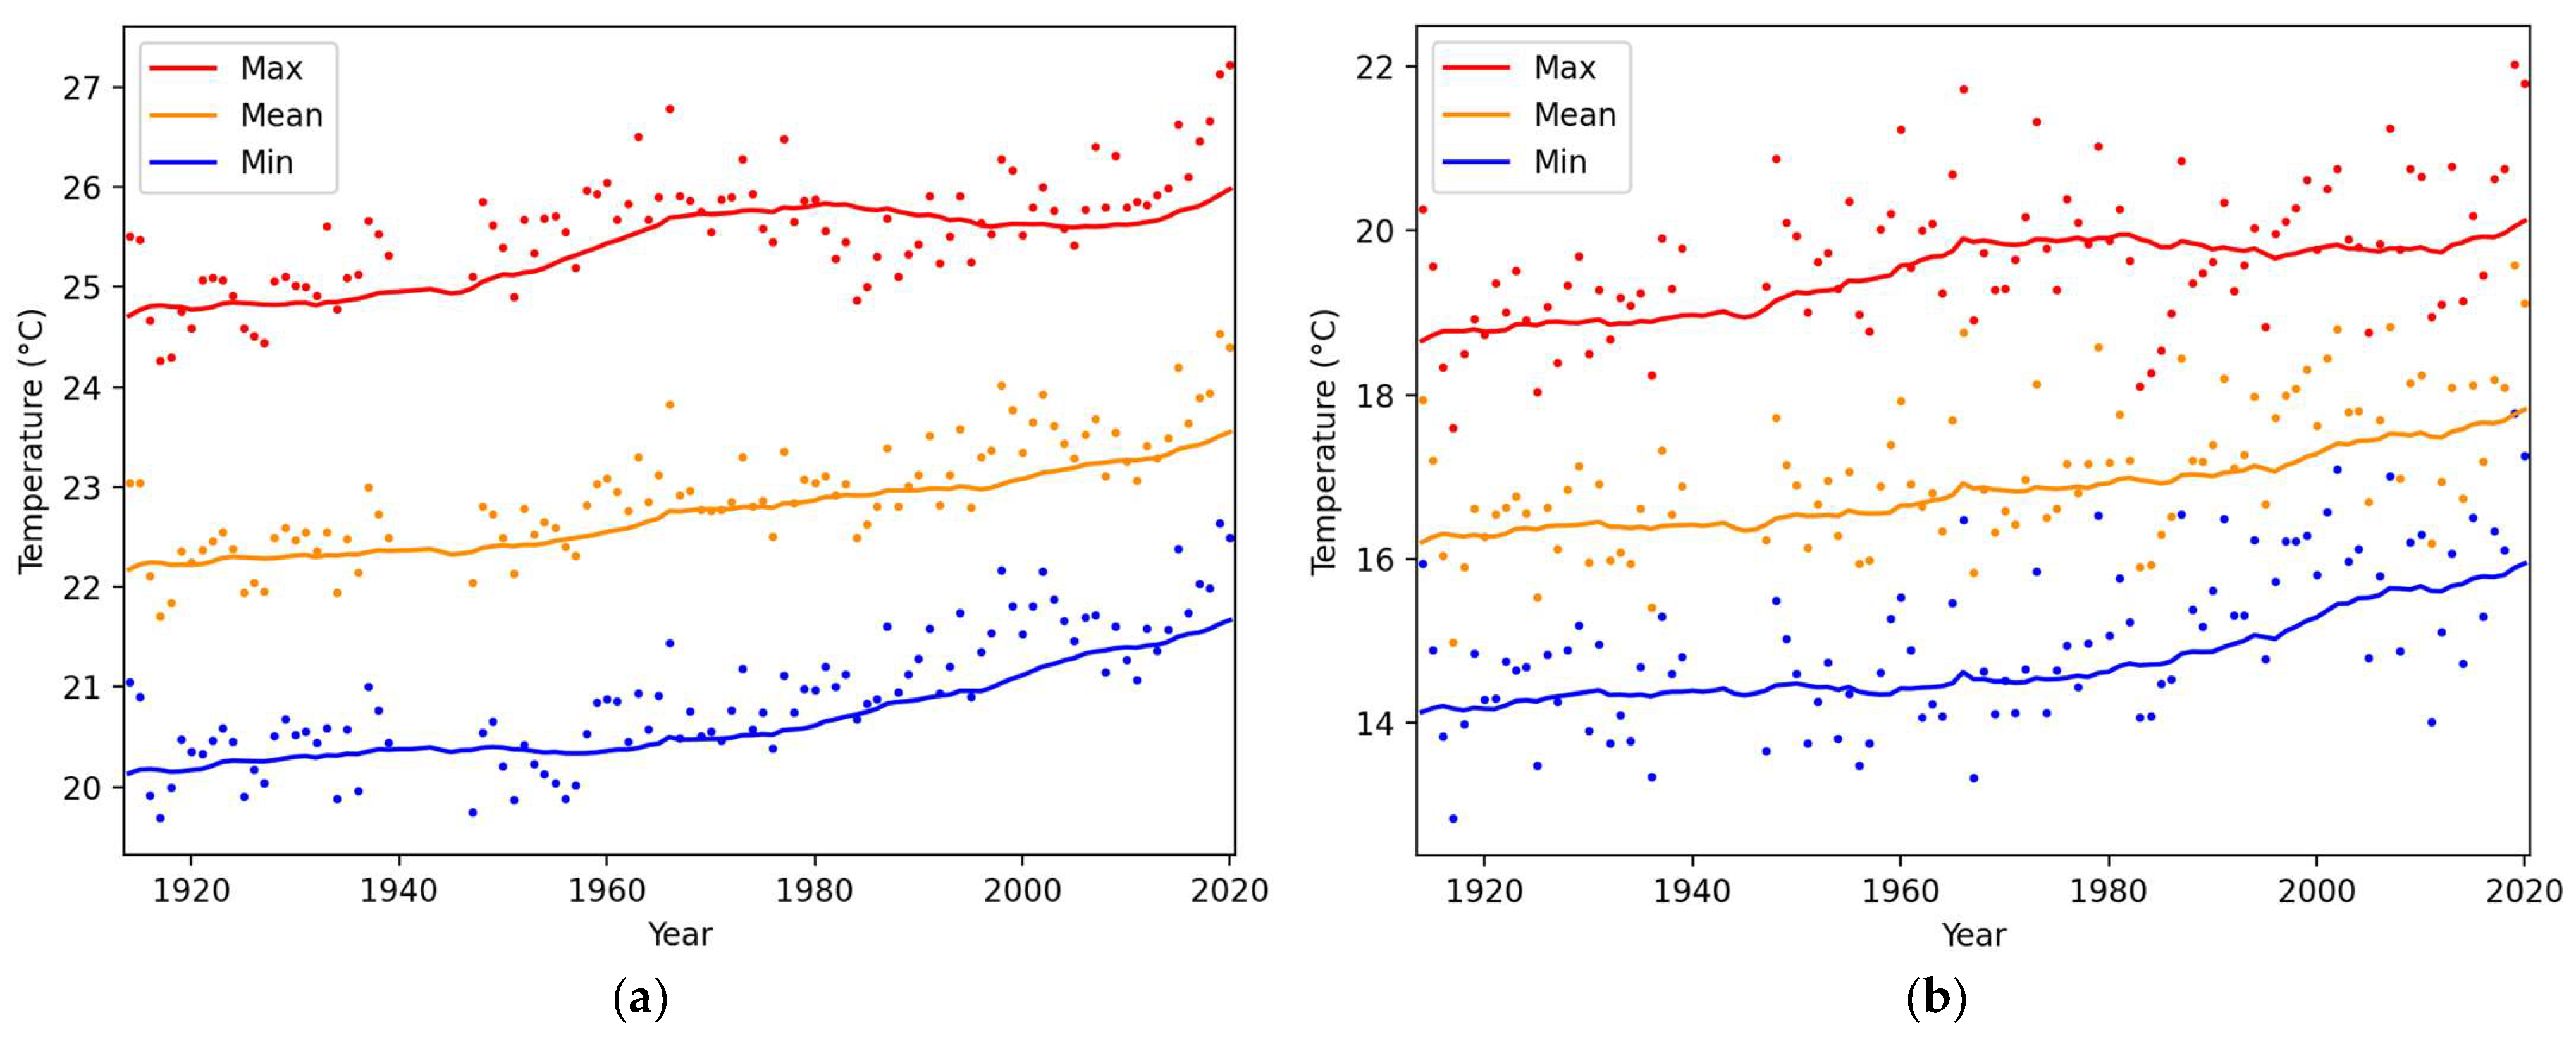
Due to global warming [
10,
11] and urbanization [
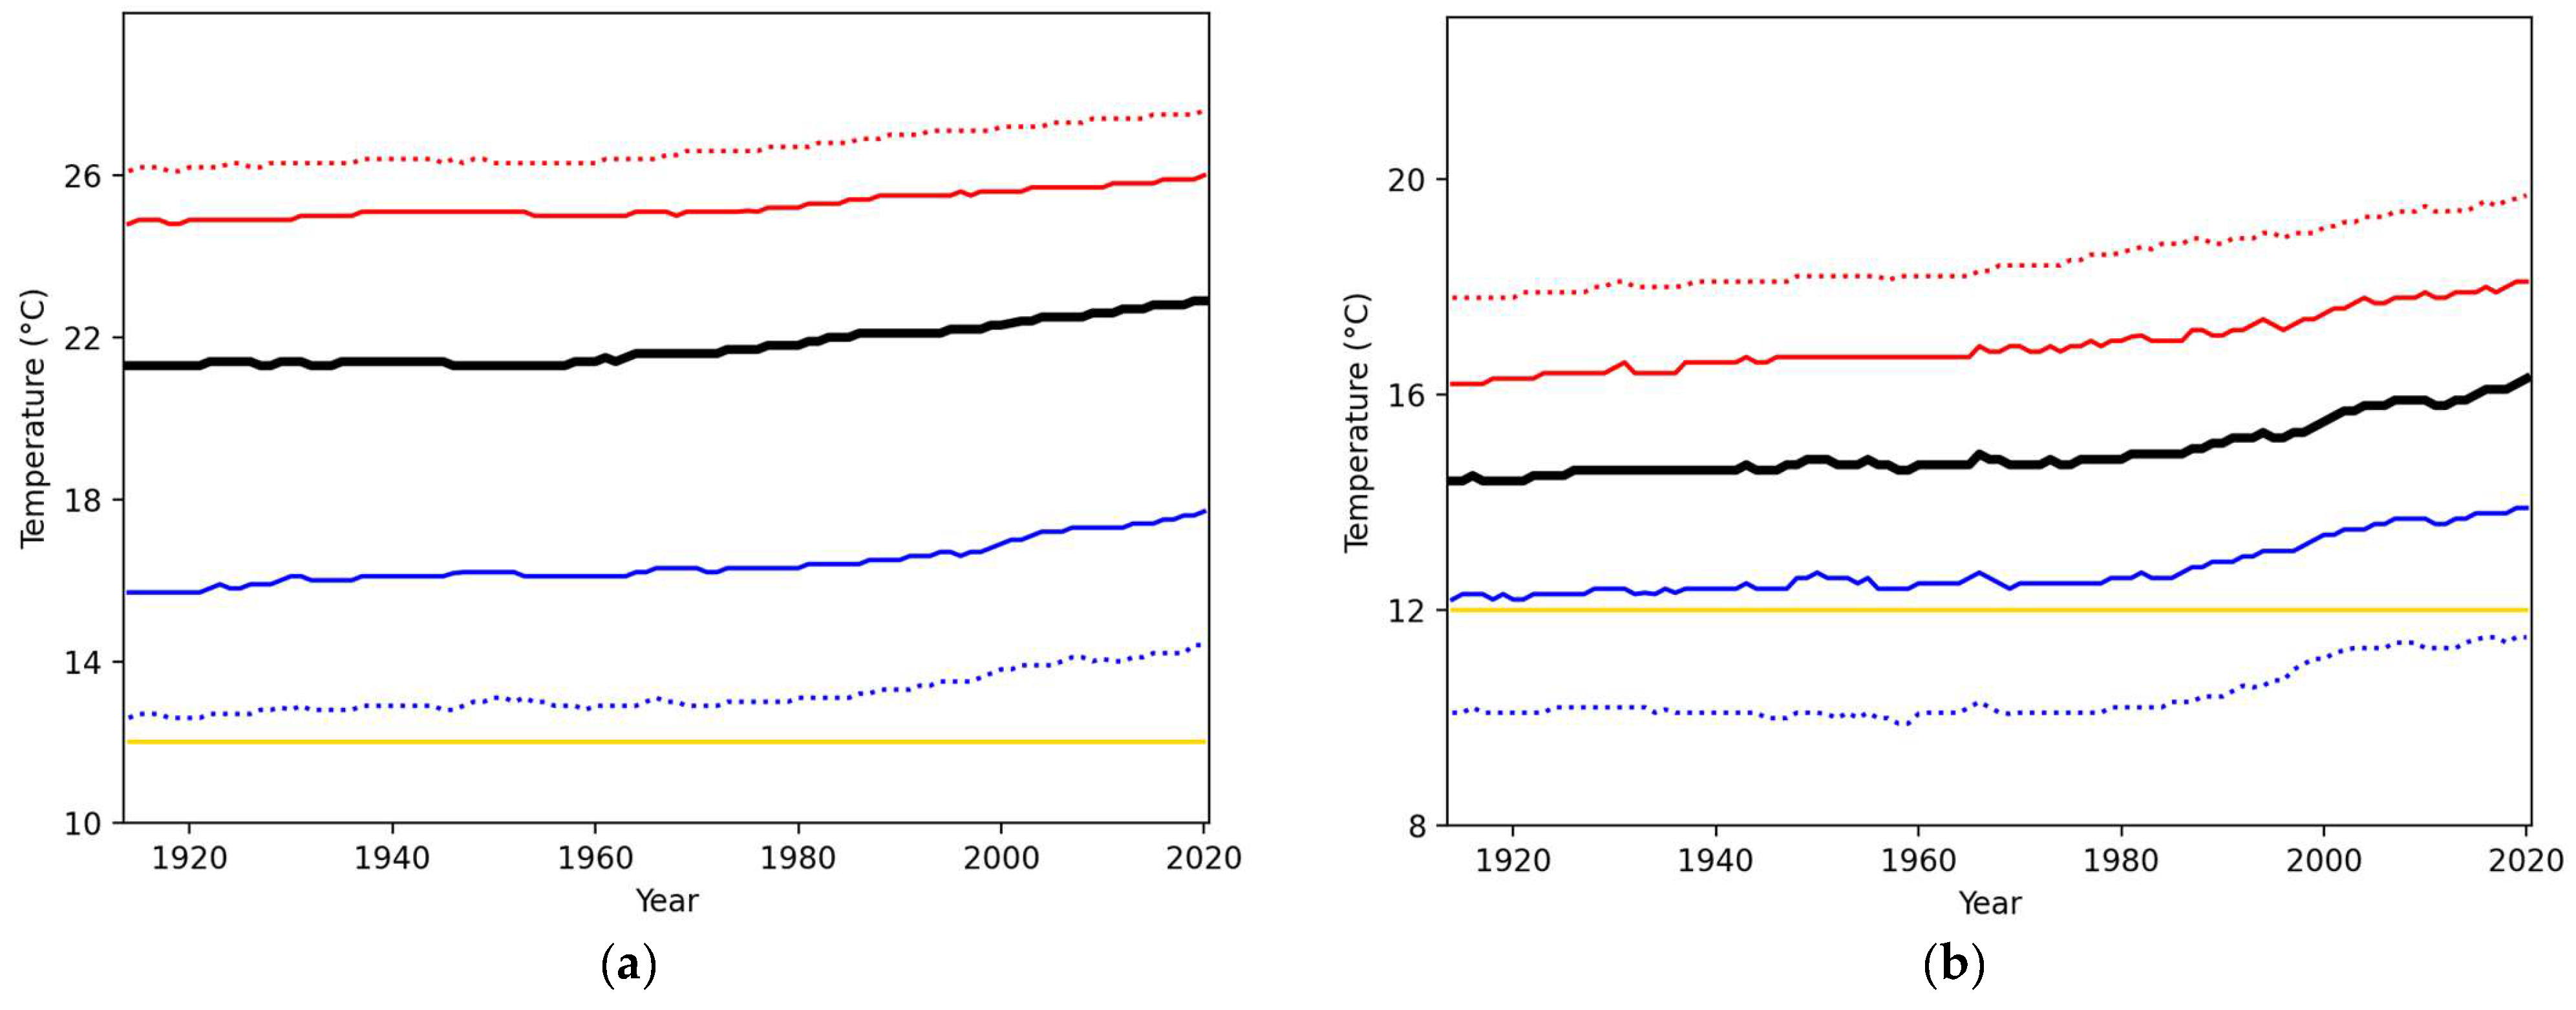
12], HKO’s daily minimum temperature (DMT) has shown a significant rising trend since the 1970s, especially in winter. The rising trends of temperatures in all months and cool months are clearly shown by the 30-year running averages in
Figure 2 and running percentiles of DMT in
Figure 3. To facilitate discussion in this paper, cool months are defined to be from December to March, when the overwhelming majority of cold days were recorded, and their statistics will be related to the extremity of cold surges in
Section 3. It can be observed that the percentile of cold weather in cool months dropped from about 25% in the mid-20th century to about 10% by 2020, implying the occurrence of cold weather has become more infrequent in the recent climate of Hong Kong. Key percentiles and the percentiles that correspond to “very cold” and “cold” weather of different periods are listed in
Table 1. A significant reduction of “cold” days is noticed in the most recent 30 years compared with the entire period of 1884–2020 (data not available for 1940–1946 due to a break during World War II) and “very cold” weather has become extremely rare (below the 0.5th percentile) in Hong Kong even during cool months but has not completely disappeared.
1.3. Impact of Cold Weather
Cold or very cold weather has impacts on human health. In Hong Kong, such weather was found to be associated with increased rate of cardiovascular and respiratory-related hospitalization, particularly for senior citizens [
13,
14,
15,
16]. When cold weather is accompanied with high winds and plummeting temperatures, exposure to wind chill effect poses additional health risks. In the so-called “super cold surge” that affected southern China in January 2016, temperatures over the Tai Mo Shan automatic weather station, located 955 m above mean sea level, fell below −6 °C. Under persisting sub-zero temperatures and strong winds, a significant number of hikers and runners in a cross-country race were adversely affected, and more than 60 were hospitalized for treatment of hypothermia [
17].
1.4. Existing Definitions of Monsoon Surge
Here we attempt to review the literature and find out the weather elements that best reflect the abrupt change in regime upon “monsoon surge” arrival, which will eventually form the definition of “extreme cold surge” in this study. Ding [
18] mentioned that a cold surge is produced by cold air flowing southwards with the intensification of low-level northerly or northeasterly winds. Chang et al. [
2] remarked that a cold surge in Southeast Asia normally possesses one or more of the following features: a sharp drop in surface temperature, a minimum temperature substantially below the seasonal average and a sudden freshening of the northerly or northeasterly monsoon winds. In Chang’s study, the definition of a cold surge specifically for Hong Kong would require a surface temperature drop of at least 6 °C within 48 h. Lau and Lau [
19] proposed that a cold surge over the East Asian seaboard is an event with a drop in surface temperature (at least 5 °C within 48 h), a tightening of surface pressure gradient between the coast and Central China and prevalent northerly surface winds (above 5 m/s). Operationally, in mainland China, the National Meteorological Center (NMC) [
20] considers the minimum temperature, temperature drop and maximum wind speed within a 48-h window for the definition of “cold wave”, a term equivalent to “cold surge” in this context. Three levels of cold wave warnings can be issued by the NMC with different thresholds of the aforementioned elements. Regions of mainland China also adopt different definitions of “cold wave” according to local climatology.
For local operations in Hong Kong, HKO assesses the temperature and wind aspects of monsoon surges separately. A wind surge is defined by the direction of arrival of monsoon surge reaching certain wind speed thresholds, and a temperature surge is a northeasterly monsoon surge that causes at least 2-degree drop in the daily mean temperature, comparing the day before surge arrival and the day after [
21,
22]. HKO will issue the Cold Weather Warning [
23] and Strong Monsoon Signal [
24] to cater for cold weather and sustained strong winds brought by the intense northeast monsoon, respectively. However, the definitions do not address the severity of monsoon surges but rather the nature of the surges.
Based on the literature and operational definitions, the minimum temperature, temperature drop and wind speed in a weather episode are all essential weather elements of “cold surges”. However, there is no universal definition of a “cold surge” in various climatological, research and operational considerations. There is also a lack of literature detailing the quantitative methods of identifying extreme cold surges for a specific city, despite the fact that some meteorological departments have already set up criteria of different levels of cold surges. Kumar [
25] attempted to classify strength, frequency and persistence of cold surges over the entire East Asian region through synoptic weather systems such as the Siberian High and Aleutian Low, but the definition does not cater for the extremity of an individual cold surge event and the classification is indirect in terms of local impact.
A simple way of defining “cold surge” or “extreme cold surge” would be to adopt the definition of nearby regions. In fact, a definition of “cold surge” has already been established over Guangdong province [
26], which neighbors Hong Kong. One of the criteria of for a cold surge over Guangdong requires a local minimum temperature to reach 5 °C. However, such a temperature is too rare for the climate of Hong Kong and cannot be directly applied to the territory. Statistical studies still need to be performed in order to look for an appropriate definition of “extreme cold surge” in the local context.
1.5. Aim of the Paper
This paper suggests a statistical method in identifying extreme cold surges in Hong Kong from past cold events. The method is based on thresholds of “cold surges” in the literature and meteorological departments, with consideration of local climatology. An operable definition of extreme cold surge that suits the territory is also proposed. A “cold event” would have to meet the thresholds of all the three major weather attributes concurrently in order to be classified as a candidate of “extreme cold surges”: the lowest temperature, the largest temperature drop and the maximum sustained wind speed. Data and methods used to identify cold events and candidates of extreme surges are described in
Section 2. Results and statistics of surges are given in
Section 3, complemented by examples of extreme cold surges and significant non-cold surge events in
Section 4. The merits and weaknesses of such a classification method, as well as the potential application of quantifying the extremity of a cold surge in numerical weather prediction models in terms of percentiles to forecast actual events is discussed in
Section 5.
Section 6 summarizes the results and suggests future work to forecast cold surges in Hong Kong.
2. Data and Methods
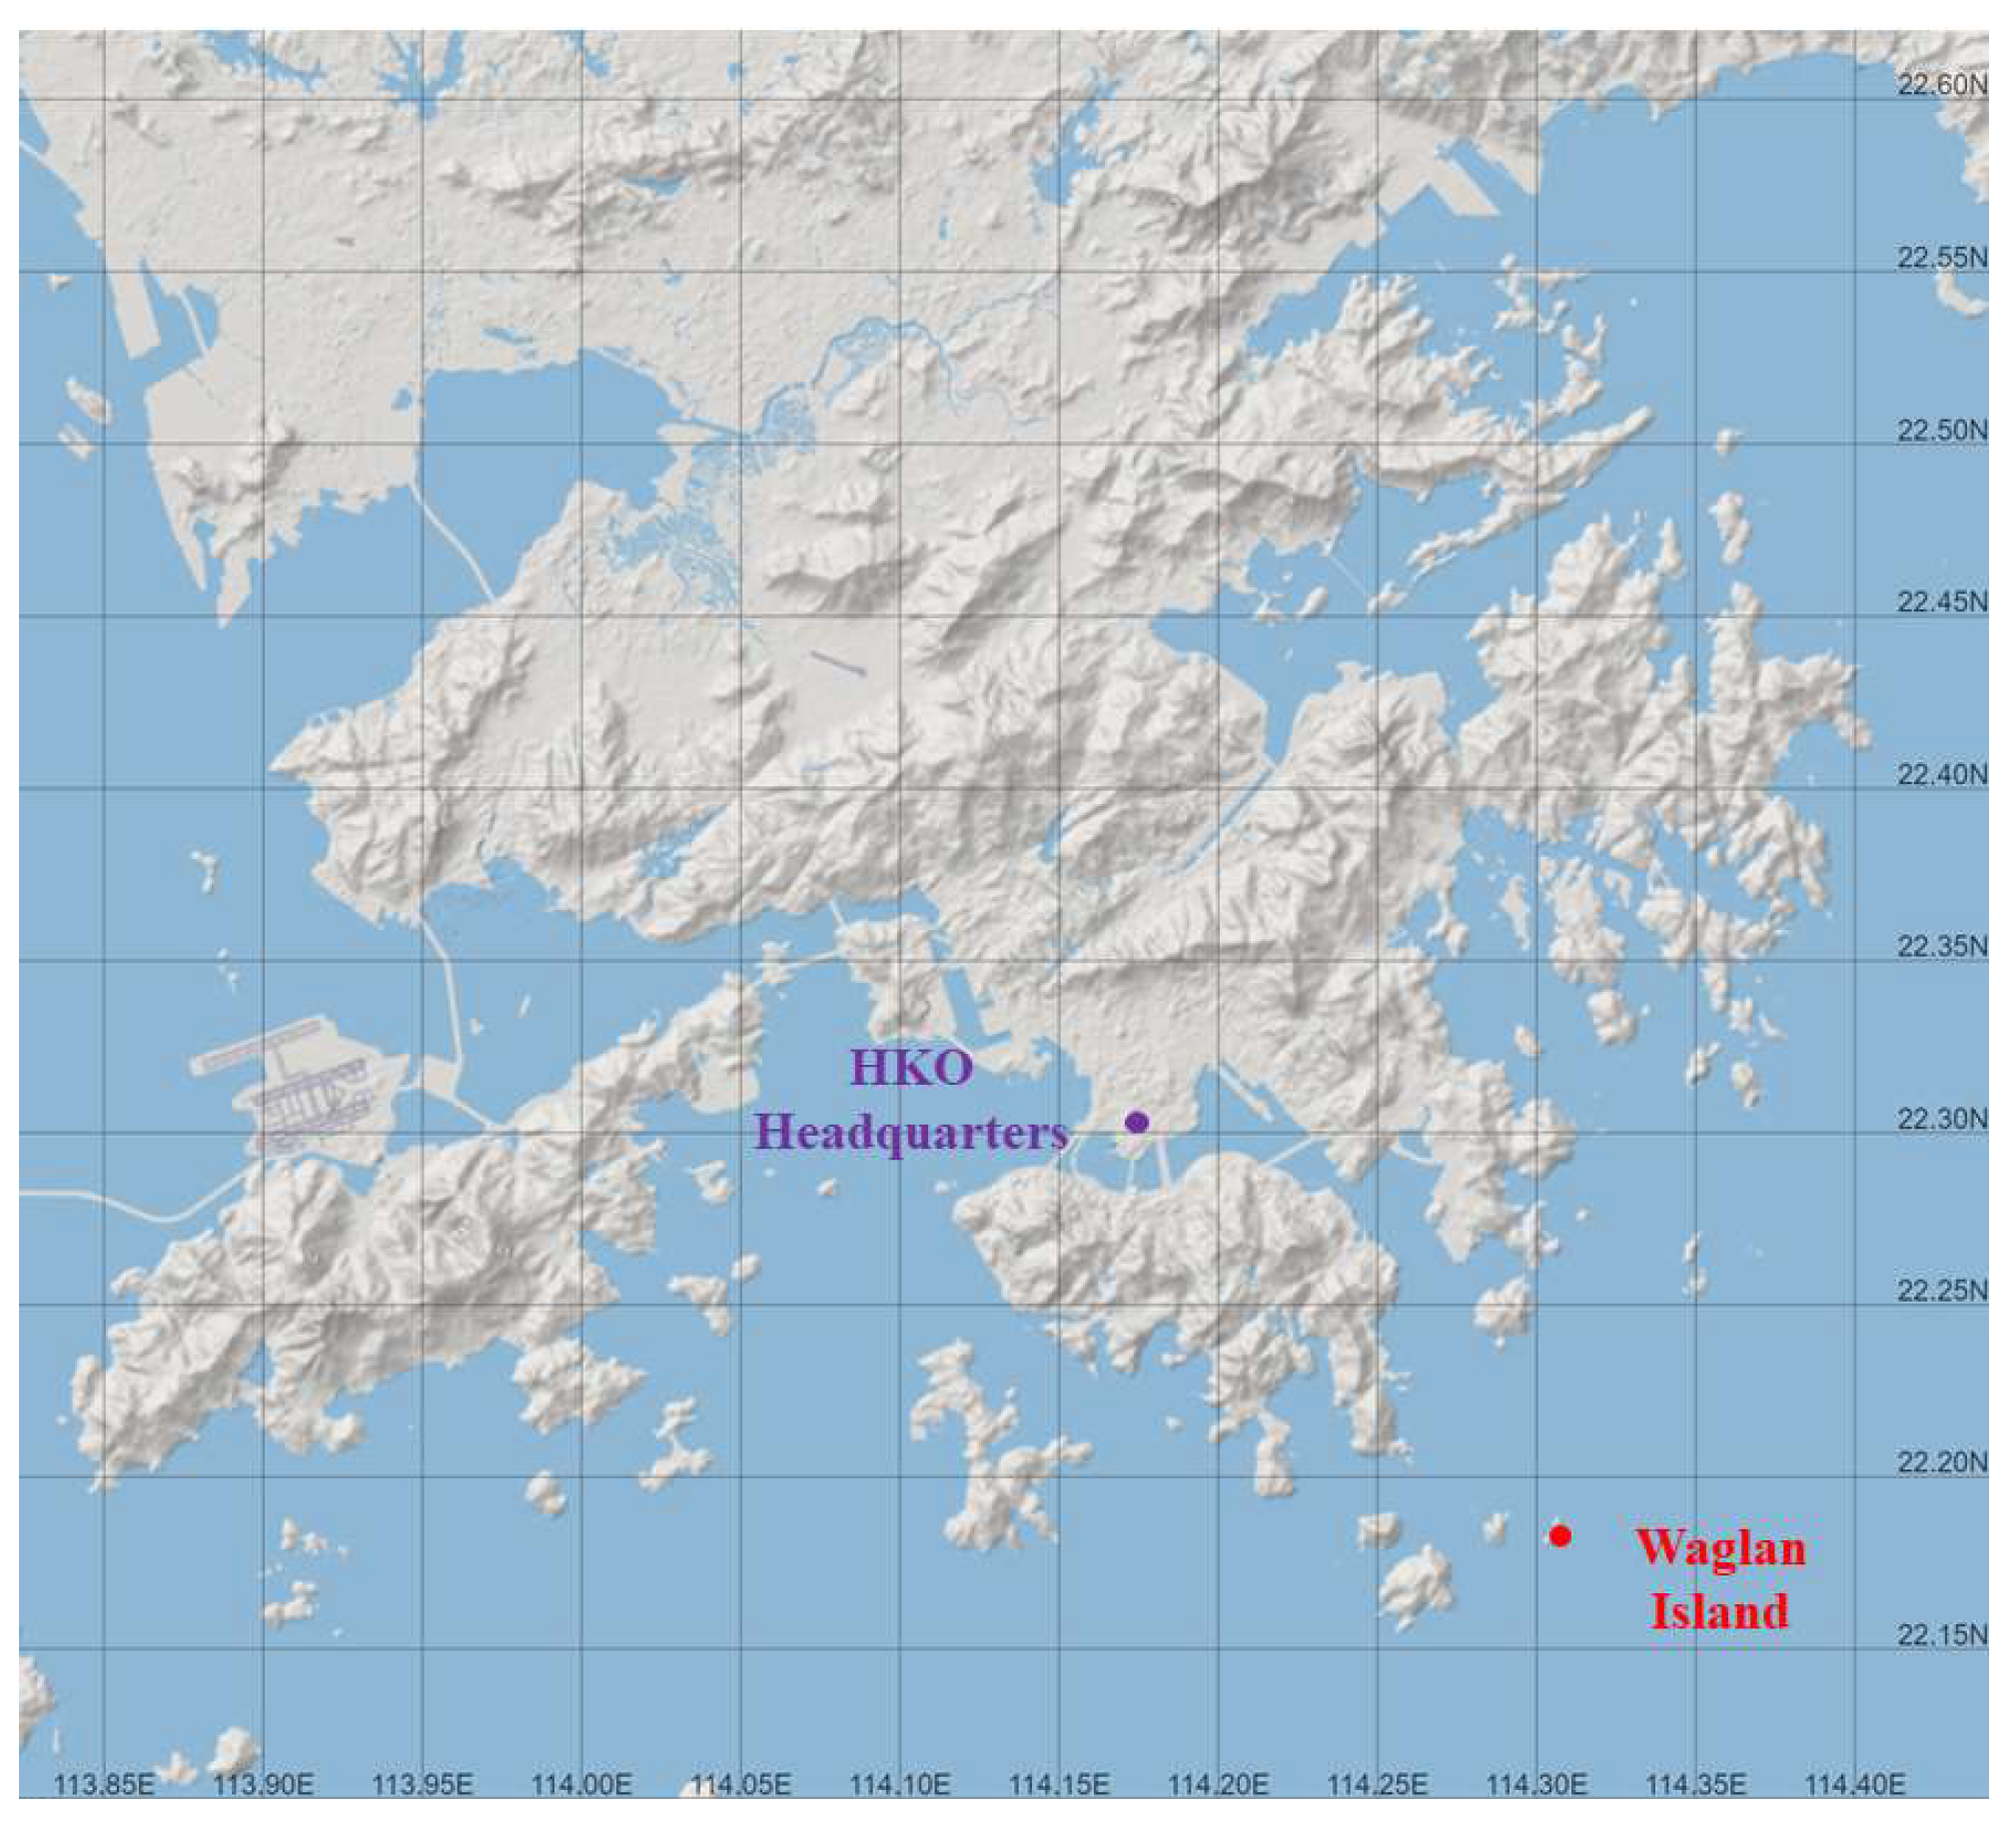
Quantifying the extremity of cold surges of Hong Kong involves the past measurement of temperatures and wind speeds in the territory. In this study, temperatures at HKO Headquarters and wind speeds at Waglan Island of the 30-year period 1991–2020 were employed in this study to reflect the general conditions of the territory and the most recent climatology. The locations of the two stations are given in
Figure 4. Making use of more reference stations was not considered in this study because there were much fewer automatic weather stations in operation in the earlier part of the period, and a definition based on a limited number of stations could be easily interpreted and applied, avoiding over-complication.
Temperatures measured at HKO Headquarters were chosen because of its long history of meteorological observation which began in 1884. Its location in the urban area can also represent the temperatures felt by the general public. Temperature measurements at HKO are currently taken by platinum resistance thermometers placed 1.2 m above ground level in an open shed with a roof made of two separate layers of matting [
27]. More information about the evolution of the instrumentation at the HKO Headquarters from 1884 may be referred to Lee [
28].
For the measurement of wind, Waglan Island, an unsheltered island over the southeastern waters of Hong Kong, was selected to represent the general wind flow in the territory. Although cold surges originate from the continent, Hong Kong has a rather small territory, and the difference of synoptic winds under monsoon surges would be limited. In fact, Waglan Island is only less than 10 km from the seaboard. Located offshore southeast, Waglan Island has good exposure to background winds of both northerly and easterly surges. Furthermore, localized effect due to terrain or urbanization can be avoided through the selection of Waglan Island because Hong Kong has a hilly landscape and is densely developed. The station commenced operation in 1989 and the anemometer is currently placed at 83 m above sea level [
27]. Sustained winds of 10 min are adopted in the study targeting at short-term sustained near surface winds, as recommended by the World Meteorological Organization [
29]. Key percentiles of daily maximum 10-min wind speed over Waglan Island are given in
Table 2. The highest maximum winds actually occurred in summer or autumn months under the influence of tropical cyclones and such months were therefore excluded in this study.
The first step to identify cold surges is to define a “cold event”, a period of low temperatures associated with a monsoon surge. With reference to the local winter climatology and HKO’s operational definition of “cold” weather, a cold day is defined as a day with HKO’s DMT at or below 12.0 °C. In this study, a cold event is defined as a period of consecutive cold days in Hong Kong of any duration. In the entire period of 1884–2020 (excluding 1940–1946), there were on average 6.99 cold events each year (909 events in 130 years), but only an average of 5.07 cold events in 1991–2020.
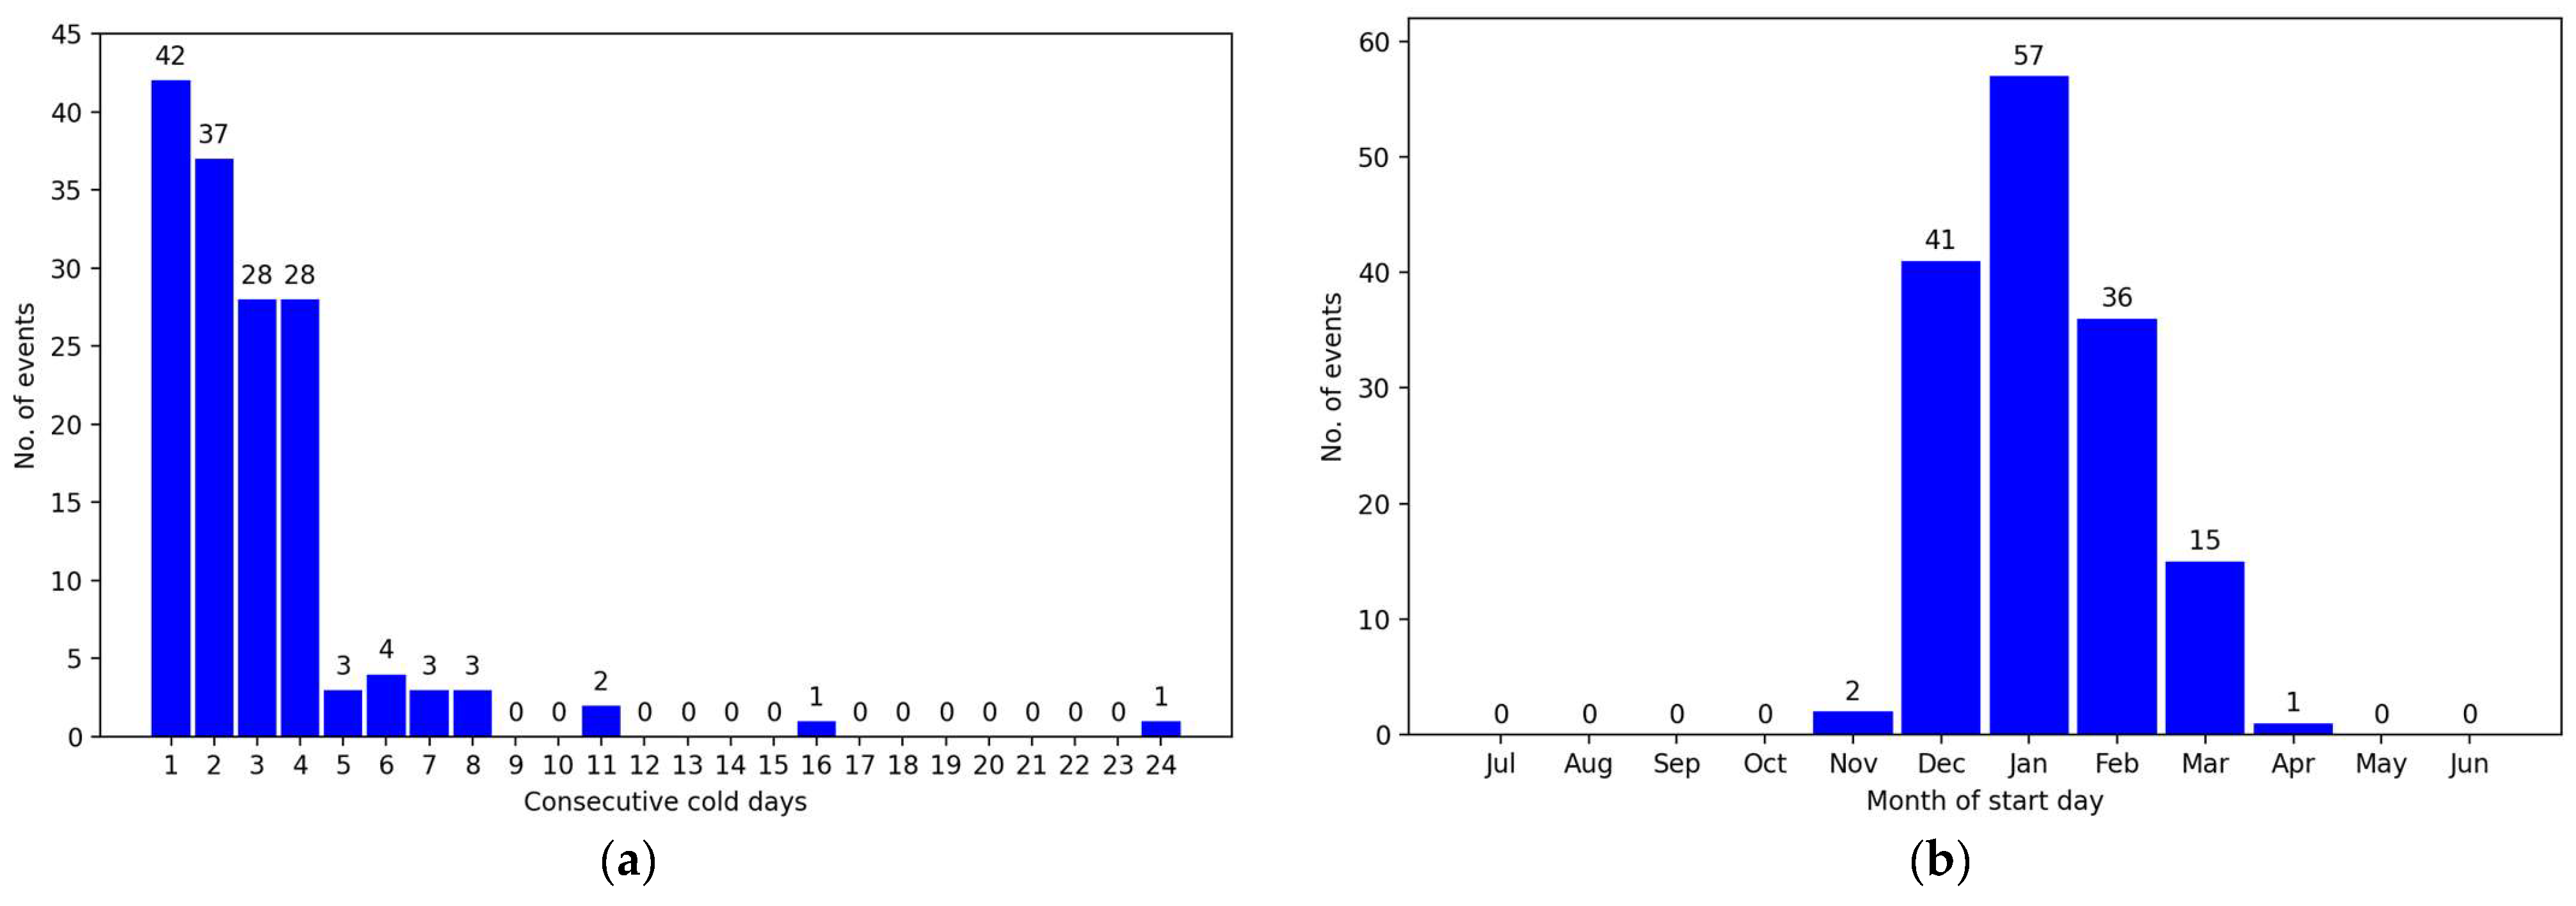
Figure 5a,b show the frequency distributions of duration and the month of start days of all cold events respectively, in the 30-year period concerned. The occurrence of cold events was confined to the months from November to April in the following year. January was the calendar month the most recorded cold events, and the only event in April was a two-day event on 3–4 April 1996 with a minimum temperature of 10.9 °C in HKO in the earlier part of the 1991–2020 climatology. It suffices to take into account only from December to March in the following year to develop the climatology of “cool months”, as explained earlier, whereas the three cold events in November and April would still be taken for the ranking of cold events later. Furthermore, the majority of cold events was found to last for 4 or fewer days, as cold air mass brought by the monsoon would moderate in a couple of days without further supplement of cold air mass. The 16-day and 24-day prolonged cold events occurred from 15 to 30 January 1993 and from 24 January to 16 February 2008, respectively, and the latter case is discussed in
Section 4.2.
The next step is to define elements in cold events that correspond to the three attributes of cold surge for future statistical treatment, given as the following:
: The lowest temperature attained in the cold event, i.e., the minimum DMT across all days in the cold event. This element represents “coldness”.
: The greatest temperature change across a specific number of days to reflect the “abruptness” of the cold event. If the start day of the cold event is defined as Day 0, the “n-day temperature change” is defined as the minimum of DMT change (or the most negative value) across a minimum of 2 days to a maximum (n + 1) days of the cold event. All drops in DMT are calculated with respect to Day −1 or later, until Day (n – 1) or the last day of the cold event, whichever the earliest. An example of the definition of the variable is illustrated in
Table 3. The optimal value of n = 2 is adopted and the variable is referred to as
hereafter. Details of the selection are given below. This element measures “abruptness” and could be interpreted as “2-day temperature drop” in short.
: The maximum 10-min wind speed recorded from the start day of the cold event to the day which was reached inclusive, representing winds associated with cold advection. This element measures “windiness”.
While prolonged coldness or significant temperature drop events could contribute to some other kinds of extreme events posing potentially different health risks to the vulnerable, e.g., elderlies and population with chronic diseases, the criteria for extreme cold surge defined in this study focus on the abrupt change of airmass and the associated heath impacts to the public in general facing sudden change in weather conditions and cold stress.
Here we give more details on the criterion
and the selection of n = 2 in “n-day temperature change” for analysis later. The temperature drop of a cold event is only measured starting from the day before the event (i.e., Day −1) to avoid including fluctuations in temperature associated with other weather systems. For the duration of DMT drop to be considered, some meteorological departments set different temperature thresholds across a different number of days to allow flexibility in the rate of temperature drop across various time scales. This study simplifies the concept as defined above and still retains the idea of “felt” temperature drop in a short period of time at the start of cold events.
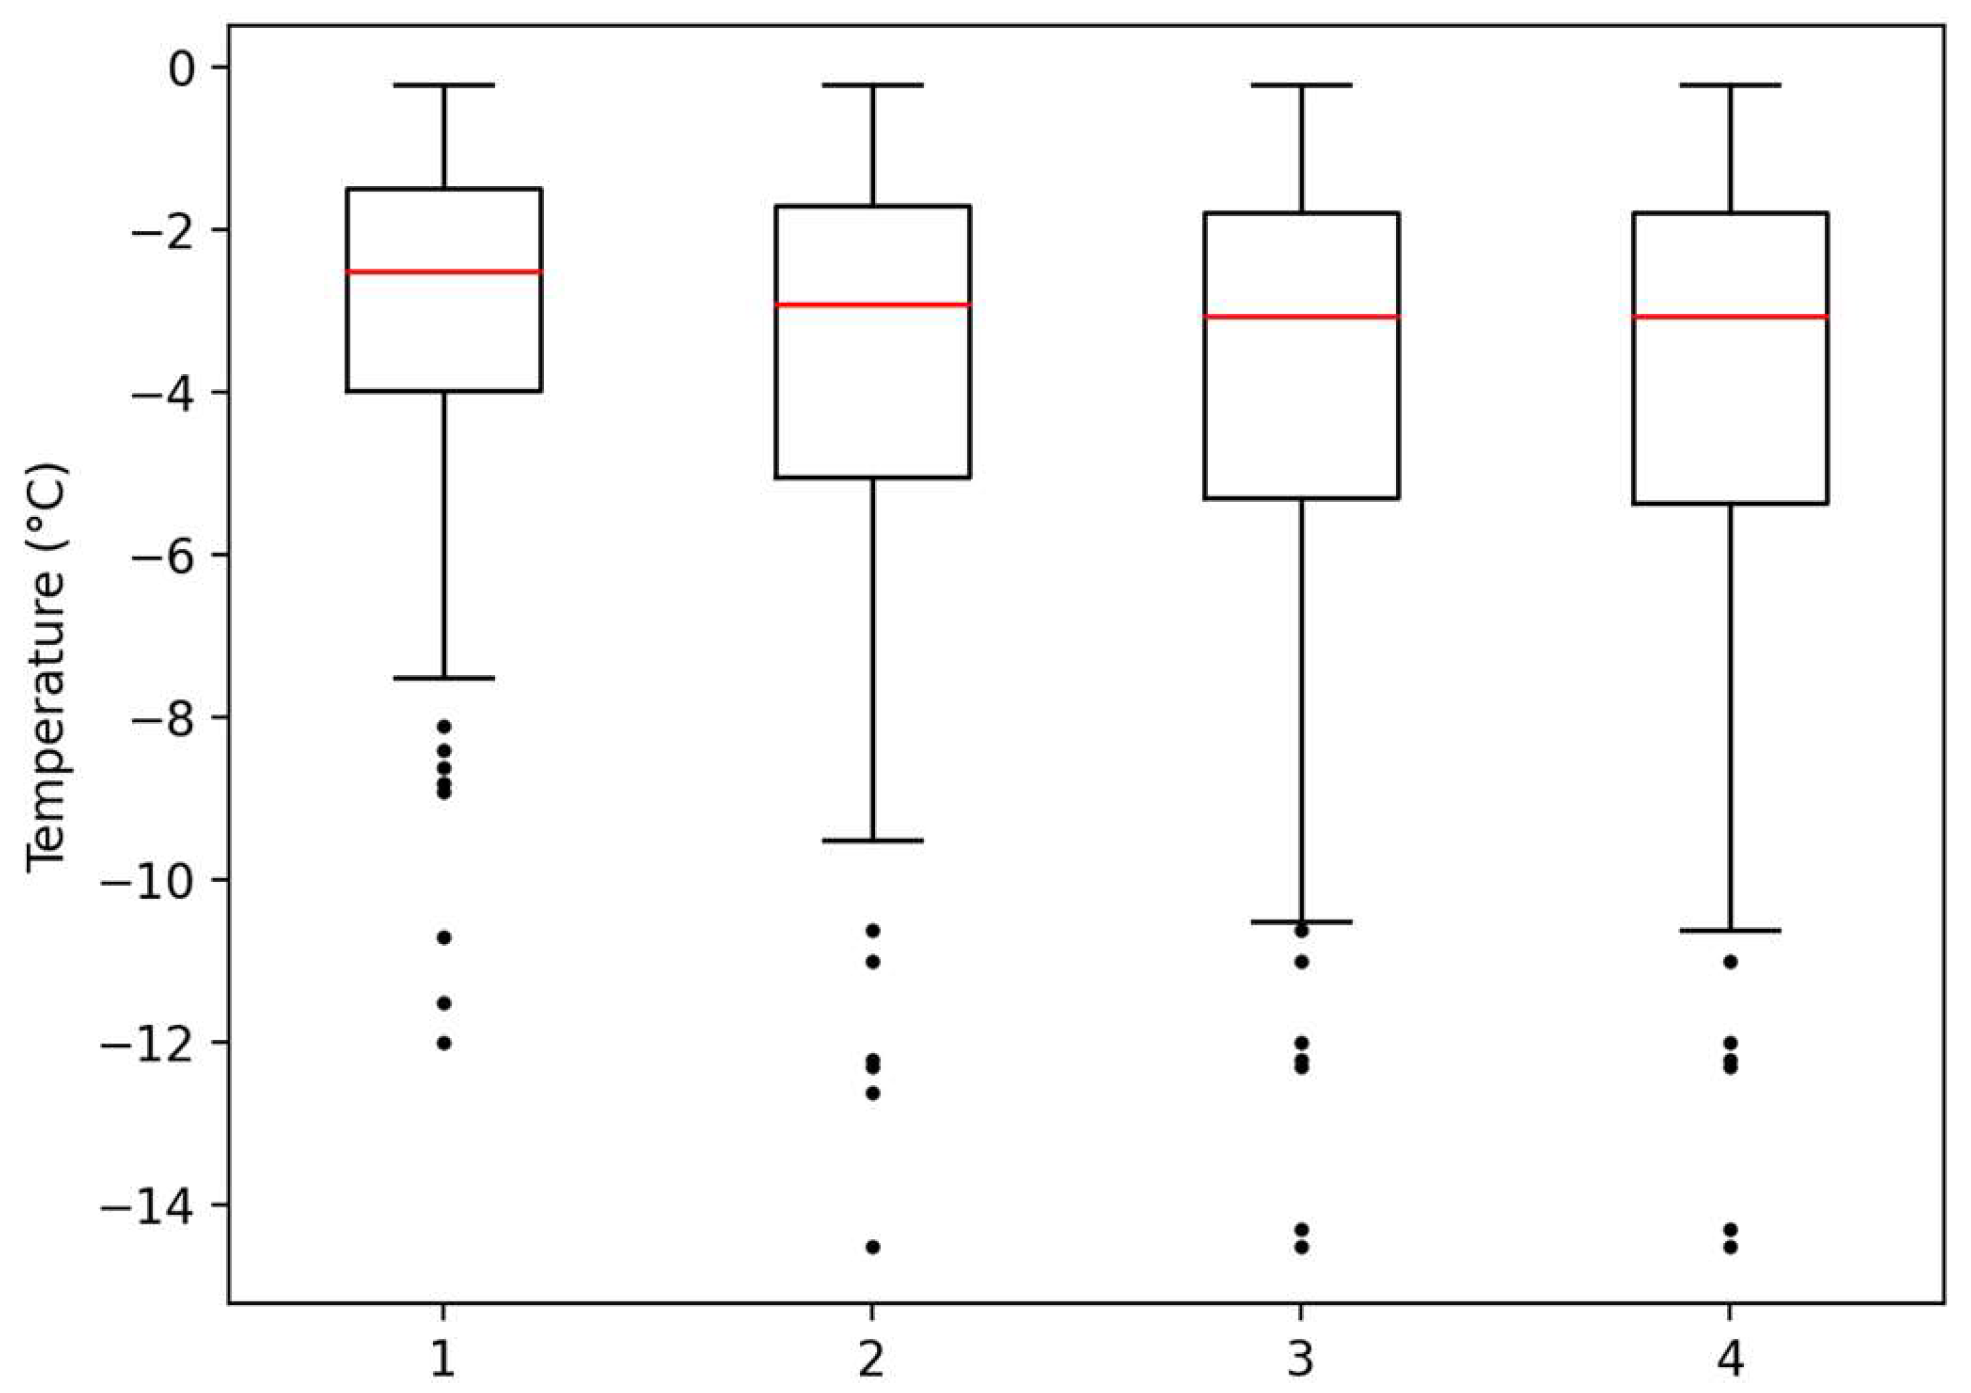
Figure 6 and
Table 4 show the box-and-whiskers distribution and important percentiles of “n-day temperature change” across all cold events; the distribution or key percentiles did not vary much across n = 2, 3 and 4. The measure of abruptness should be sensitive to the maximum changes in the shortest time, so n = 2 would be a more preferred choice.
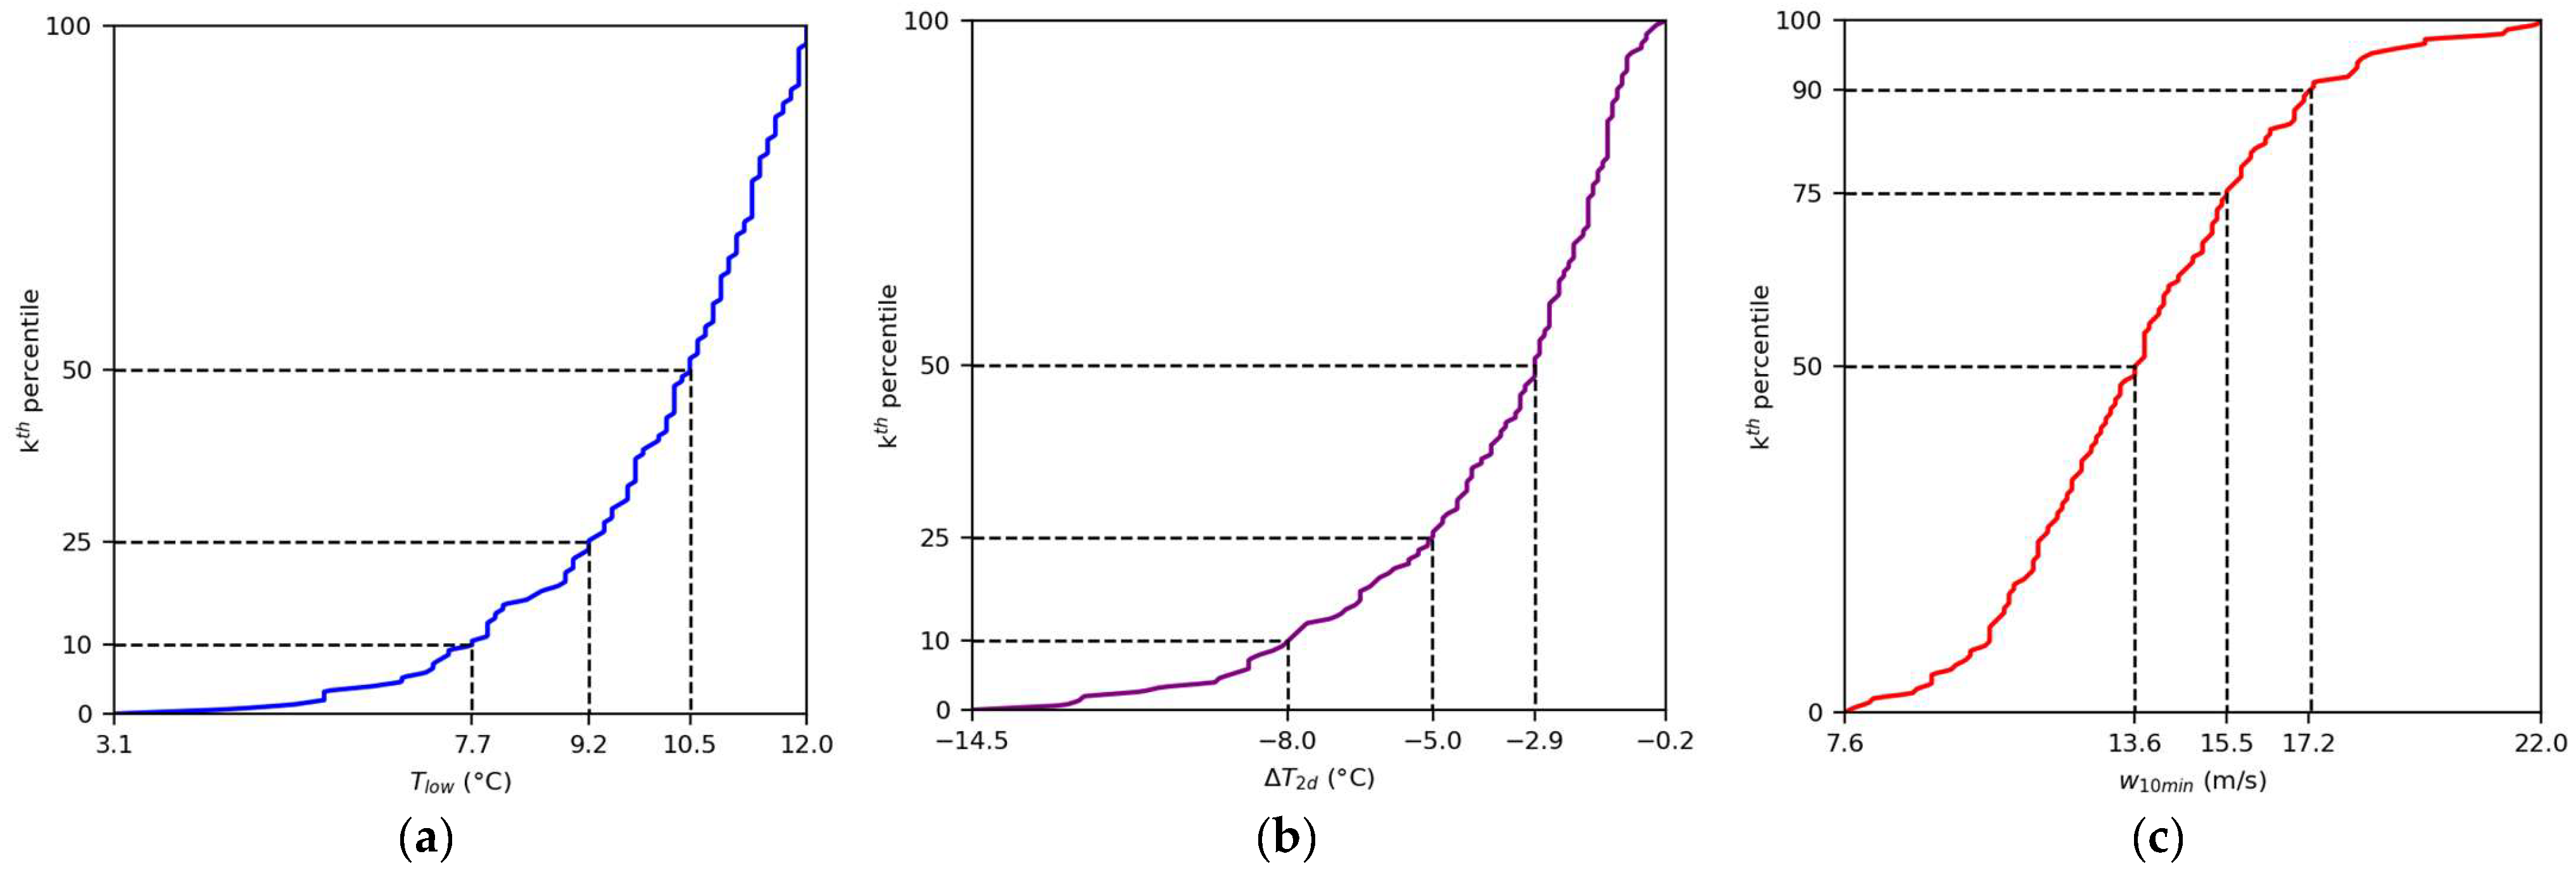
The cumulative distribution of the three indicators and with their important percentiles are given in
Figure 7 and
Table 5. It can be observed that very cold weather was so rare in the set of cold events that even the 10th percentile of
could not even reach 7.0 °C or below. In fact, multiple very cold days fell into the same event; for example, there were 3 very cold days in the so-called “super cold surge” in late January 2016. In addition, the 90th percentile of
is close to the threshold of our operational definition of gale force winds (17.5–24.4 m/s). The values of upper (lower) quartile plus (minus) 1.5 times inter-quartile range (IQR) are also given in
Table 5, as this is a statistical measure of outliers [
30] and could potentially indicate that the surge is extremely severe when one or more of these values are reached.
3. Results
In order to distinguish and classify extreme cold surges from all cold events, the three indicators of the cold event would have to attain the same level of extremity for each of the category concurrently. The values of
and
of the cold event have to be lower than the corresponding values at percentile
, whereas
has to be higher than that of the percentile
. A smaller
indicates a more stringent requirement.
Table 6 presents cold events satisfying the threshold under different values of
for appreciation. The percentile position of threshold values of
and
with respect to DMT and daily maximum wind speed in 1991–2020 are presented in
Table 7 for appreciation of extremity of these values with respect to climatology of all months and cool months.
If we look at the thresholds at = 50, i.e., (, , ) being (10.5 °C, −2.9 °C, 13.6 m/s), all three values seem to be rather mild in terms of local climatology. The requirement of minimum temperature is not far from the benchmark of 12.0 °C for “cold” weather, and only a temperature drop about 3 °C is expected; both are not indicative of an intense surge. Adopting such thresholds for extreme surge would not be convincing. However, only a total of 45 events out of all 152 cold events fulfilled such criteria, slightly less than 30%. These candidates may have one or two elements reaching very extreme values, but even such could not reflect the package of an abrupt change of regime. Furthermore, looking at the thresholds of = 25 with (, , ) being (9.2 °C, −5.0 °C, 15.5 m/s), the separation of these values was not far from = 50. Adopting close to median would create more borderline cases in operational perspective, and categorization of cold surges based on percentile values close to median would not be recommended.
According to the Intergovernmental Panel on Climate Change [
31], an extreme weather event “would normally be as rare as or rarer than the 10th or 90th percentile of a probability density function estimated from observations”. Here we suggest
= 10 to be applied for selecting extreme cold surges from the cold events, with (
,
,
) being (7.7 °C, −8.0 °C, 17.2 m/s), in which both values of
and
are quite extreme in local climatology (
Table 7). Only 4 out of 154 events could be classified as extreme cold surge, which means there was only one occurrence every 7.5 years on average. All extreme surges all took place in either December and January, agreeing with the fact that January is the coolest month in Hong Kong [
32] with the greatest number of cold days and cold events.
Another potential threshold to be applied for extreme cold surges would be to apply thresholds in relation to IQRs, i.e., (, , ) being (6.0 °C, −10.0 °C, 21.3 m/s). Such criteria would be much more stringent than that of the 10th/90th percentiles in our dataset, and only one case (the event on 15–18 December 2010) in the 30-year period met the criteria. Still, 4 occurrences of extreme surges in 30 years defined by percentiles would be sufficiently rare and applying the very stringent IQR requirement would lead to some truly extreme cases felt by the general public, such as the surge in late January 2016, being excluded.
The above statistical method was designed in a way that it could be applied in other regions affected by cold waves or surges.
4. Case Study
Two extreme cold surges and other significant non-cold surges are presented in this section to illustrate the weather change and corresponding criteria of extreme cold surge in actual cases. Changes in weather elements throughout the cold events will be shown in time series.
4.1. Case Study of Extreme Cold Surges
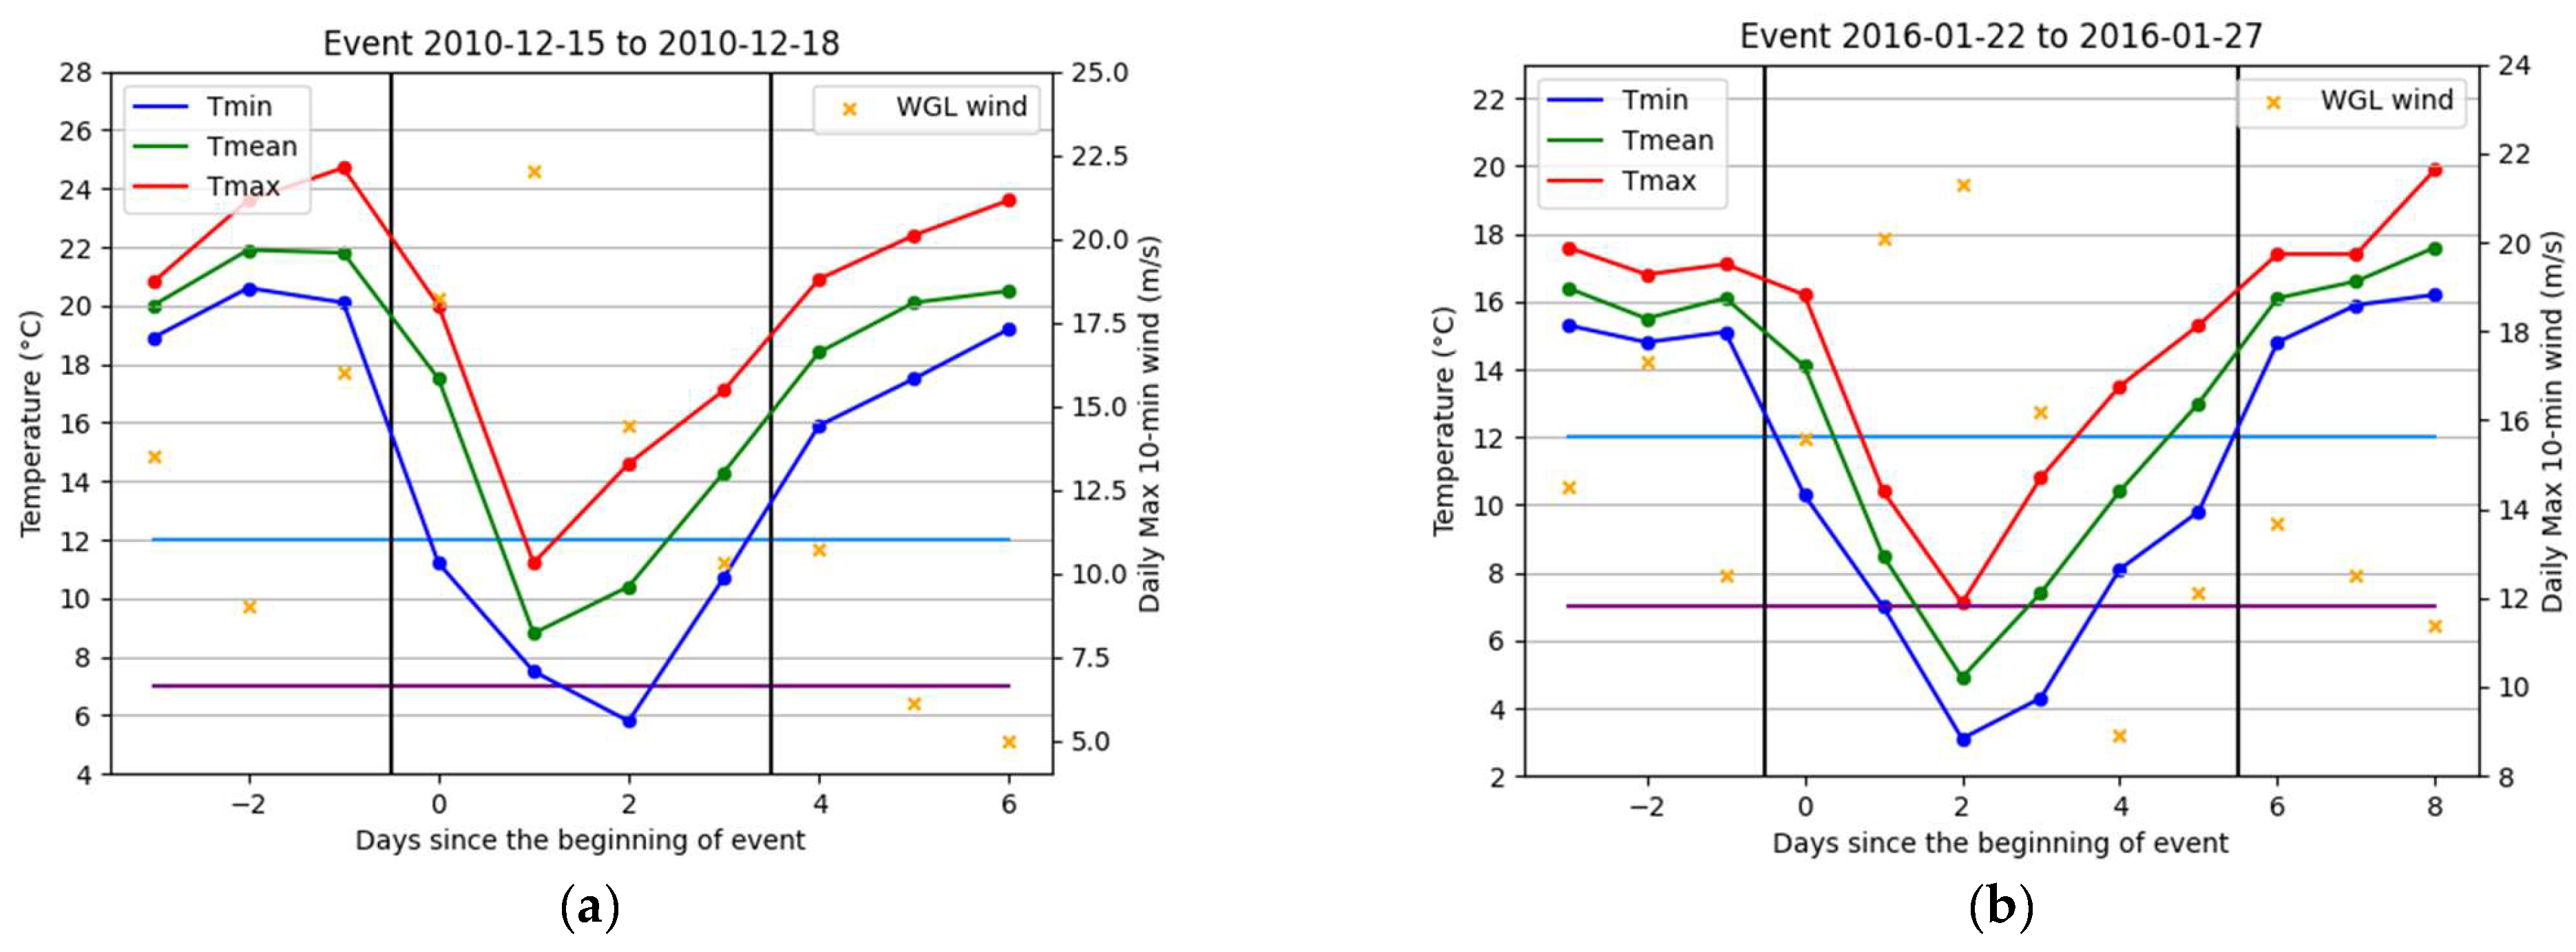
The two most recent occurrences of extreme cold surges on 15–18 December 2010 and 22–27 January 2016 are discussed here (
Figure 8). The former (
Figure 8a) was the only extreme surge that satisfied the IQR criteria.
of 22.0 m/s attained in this surge as also the highest across all cold events. For the latter (
Figure 8b),
of 3.1 °C was the lowest temperature recorded in HKO Headquarters since 1957 and none of the other surges in this study broke the record. As mentioned earlier, this event was referred as “super cold surge” by the media and general public with widespread wintry phenomena over Hong Kong. METAR reports over Guangzhou, Hong Kong and Macau showed observations of ice pellets during daytime on 24 January 2016.
“Very cold” temperatures were attained, and winds shot up well-above gale in the two cases above. However, the extreme cold surge in 2016 showed a more progressive temperature drop from Day −1 to Day 2, leading to lower magnitude of
as compared with the extreme surge in 2010. Surface charts for both cases (
Figure 9) were patterns of prominent northerly surges with very packed isobars over the coast of southern China. The region was under the effect of intense northerly winds. Areas under packed isobars also had rather large temperature gradient. In such a setting, cold advection would be significant along the isallobaric flow (northerlies).
4.2. Case Study of Significant Cold Events Not Classified
For the rest of the cold events, many had temperatures marginally reaching the threshold of “cold” weather or with less effective cold advection. Still, some significant cold events may last for prolonged periods or have rather extreme values in one or two elements whereas the remaining element(s) failed to reach the threshold of extreme cold surges. Two of such cold events, one with sustained cold weather with rather low absolute minimum temperatures and the other with only plummeting temperatures and high winds will be examined. In addition, a recent significant cold event in 2022 was also quite close to meeting the criteria of an extreme surge following 1991–2020 climatology, and the case will be briefly discussed.
The 24-day cold event from 24 January to 16 February in 2008 was the longest event in this study, but none of the elements satisfied the criteria of extreme cold surge. Even if a more generous
= 50 is adopted as threshold, this event would not be classified as an extreme surge for a relatively low maximum wind speed
recorded. From
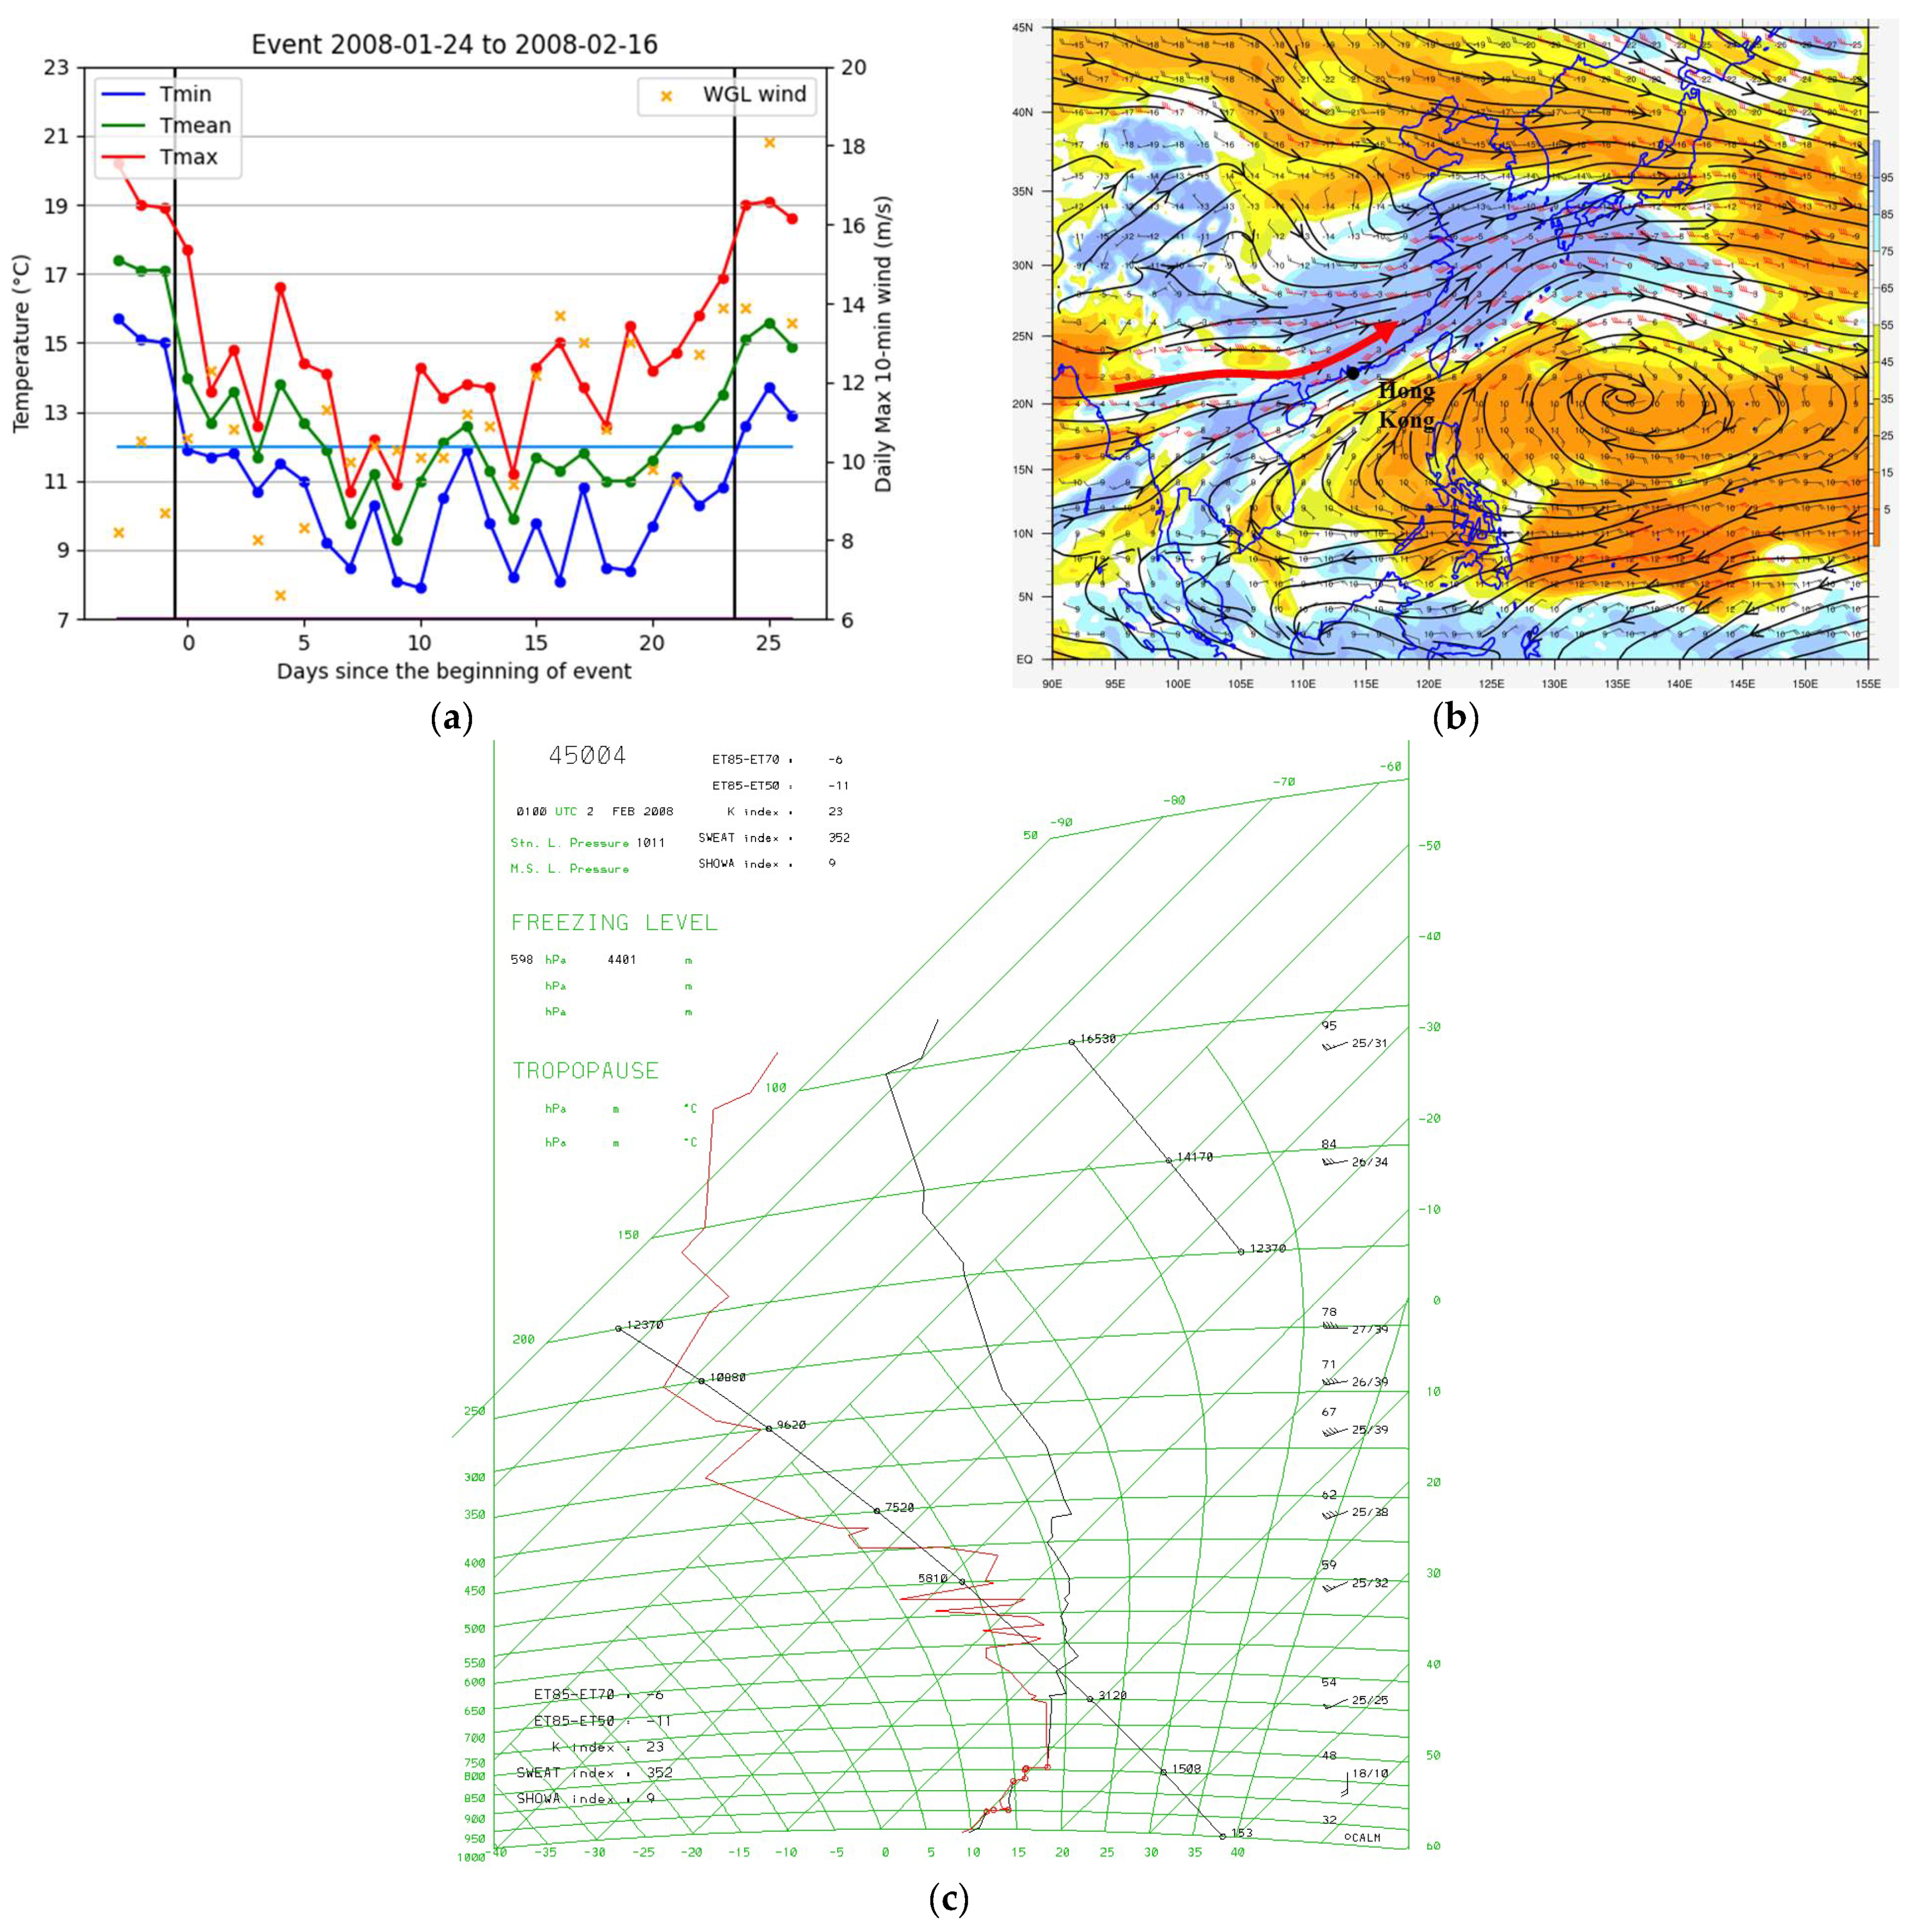
Figure 10a, low temperatures persisted throughout the period with minimum temperatures occasionally reaching single digits, but wind speed remained generally low in the first few days of the cold event and with no abrupt drop in temperature, suggesting the penetration of cold air mass was more or less a gradual process. Cold air mass then remained in place throughout the event.
Local research [
33,
34] attributed prolonged cold weather to continuous supplement of cold air from inland China and the inhibition of temperature rise under extensive cloud cover and rain. The upper-air setting during the event indicated that the southern branch of westerlies, a branch of westerlies split by the terrain of the Tibetan Plateau, brought relatively warm and moist air mass from the Bay of Bengal and Indochina to southern China (
Figure 10b). Tephigram at Hong Kong (
Figure 10c) reveals that the atmosphere was rather stable with a shallow layer of cold air mass at low level and a warmer layer just above. The near-saturated layer from the surface up to about 650 hPa hints a thick layer of clouds with some rain over the territory, and cloud break would not be favorable under the stable setting. Such a synoptic setting is usually conducive to relatively sustained cool or cold weather in Hong Kong.
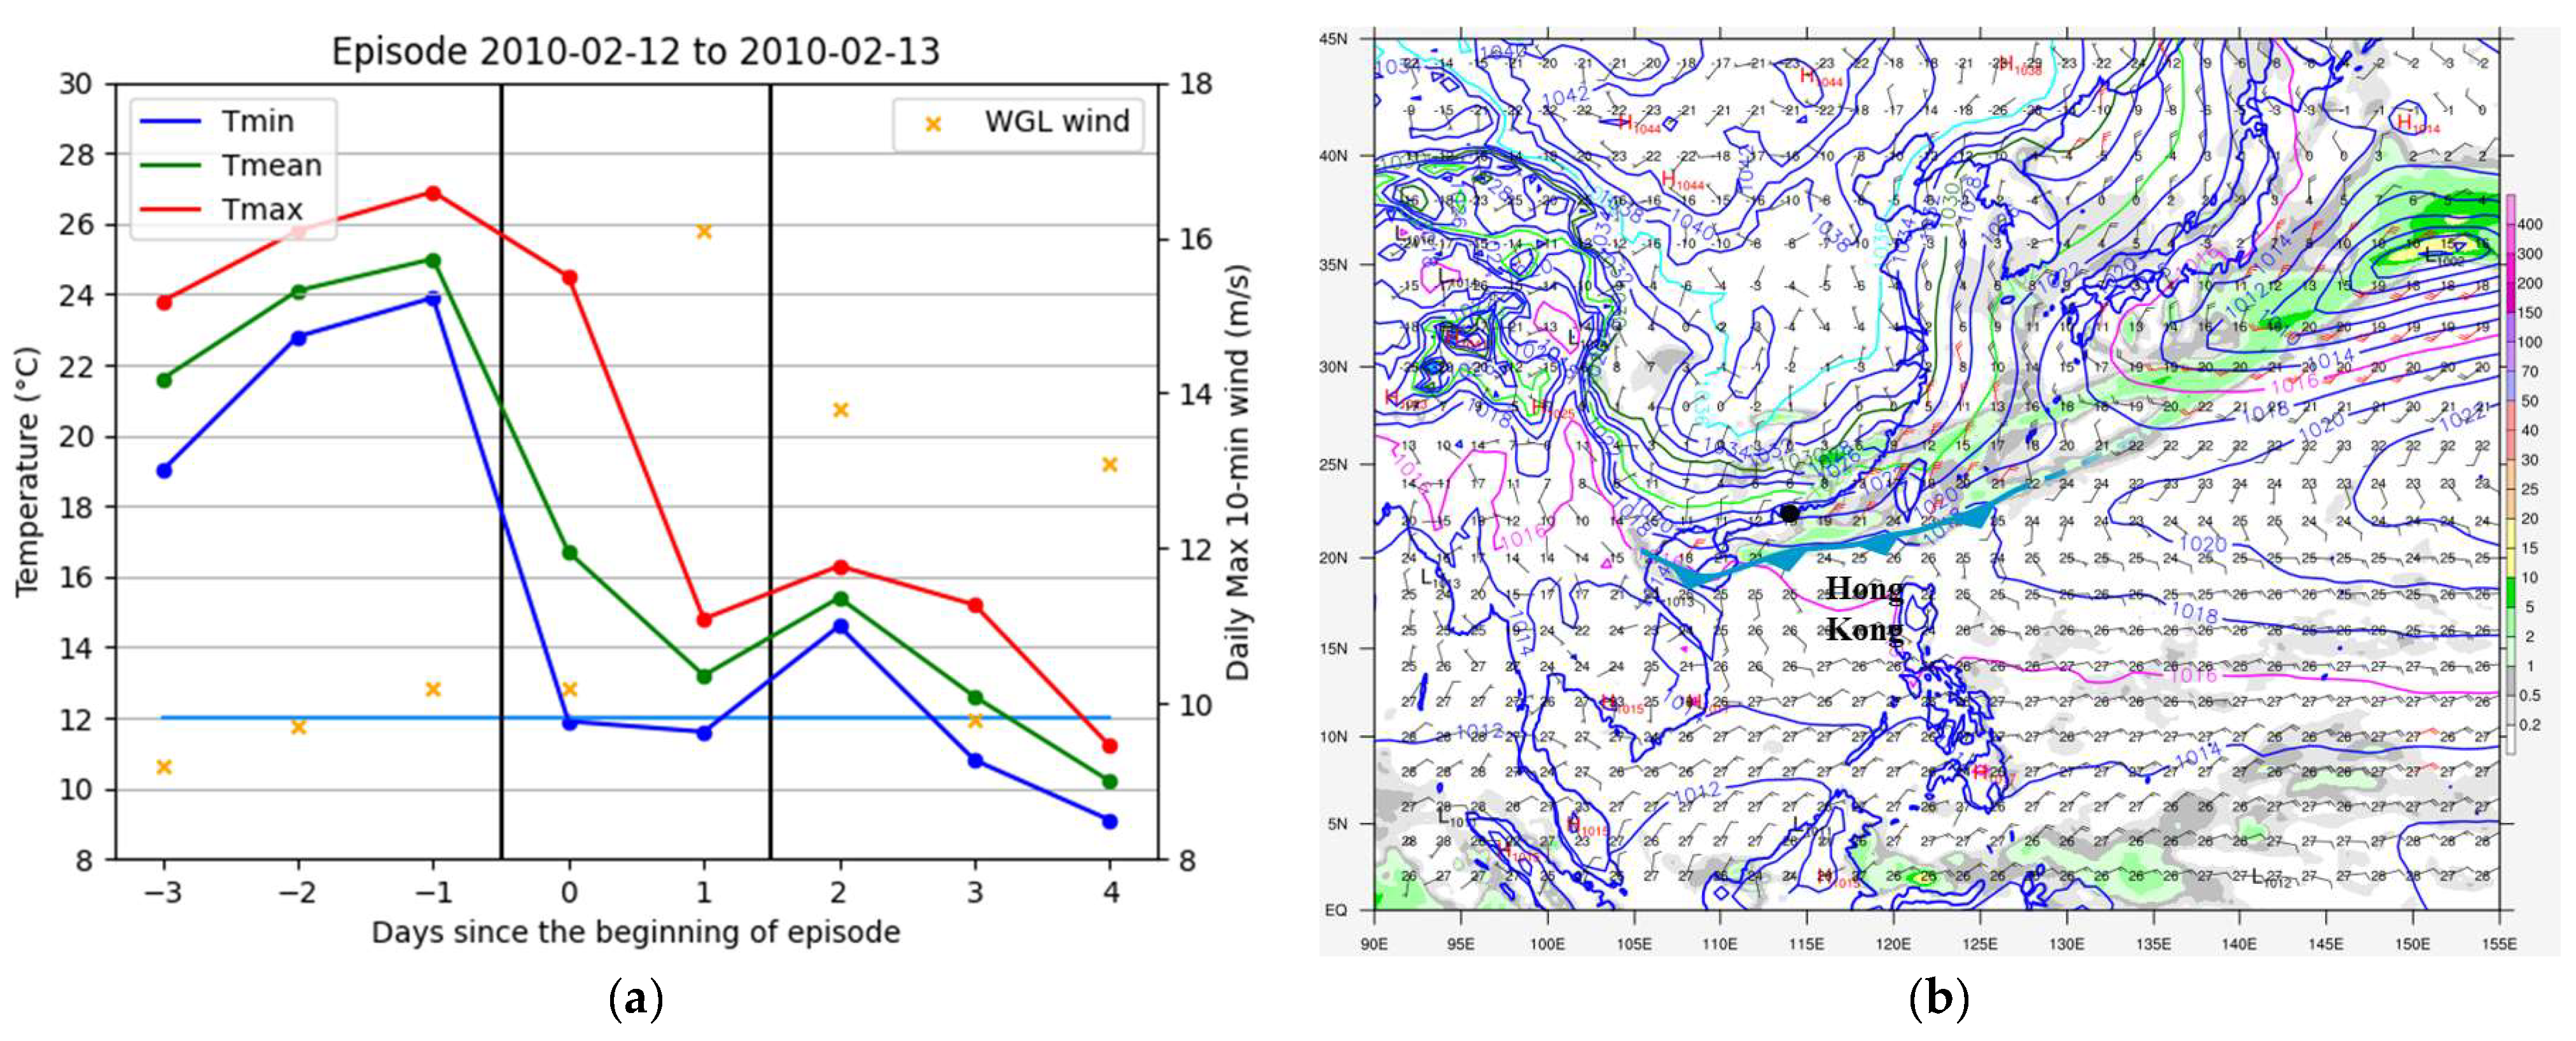
Another cold event on 12–13 February 2010 had plummeting temperatures at the beginning of the event but was not classified as a cold surge because
of the event was only 11.6 °C, just marginally below the threshold of cold weather (
Figure 11). Within the first day of the event (12 February 2010), temperatures at HKO dropped from a maximum of 24.5 °C in the small hours to 11.9 °C in late evening.
of this event was also the third lowest across all 152 events.
Figure 11b showed a cold front had just crossed Hong Kong on the morning of 12 February and light frontal rain persisted over the territory. The temperature difference between inland of southern China and the norther part of the South China Sea was stark, with 5 °C in inland areas and 25 °C over the sea from ERA-5 reanalysis. Records from HKO showed that trace amount of rainfall was reported at HKO Headquarters and there was no sunshine over King’s Park of Hong Kong, indicating that the day was rather gloomy. The cooling effect was well-marked. From the time series of the event and HKO’s Monthly Weather Summary [
35], it can be noticed that DMT shortly rose above 12.0 °C on 14 February as the monsoon slightly weakened; after that, the monsoon intensified again, and temperatures fell progressively to 7.7 °C on 19 February.
Since 2021, there were two significant cold events that nearly met the criteria of extreme cold surge with (
,
,
) = (7.7 C, −8.0 °C, 17.2 m/s), but both events failed to reach the criterion of wind speed. The two events were on 7–14 January 2021 and 19–24 February 2022, with (
,
,
) of (7.7 °C, −8.3 °C, 16.5 m/s) and (7.5 °C, −7.2 °C, 16.3 m/s), respectively. The case in 2022 had a lower absolute minimum temperature, but occurred in mid-to-late February, which was a slightly late time of the year for intense cold events (
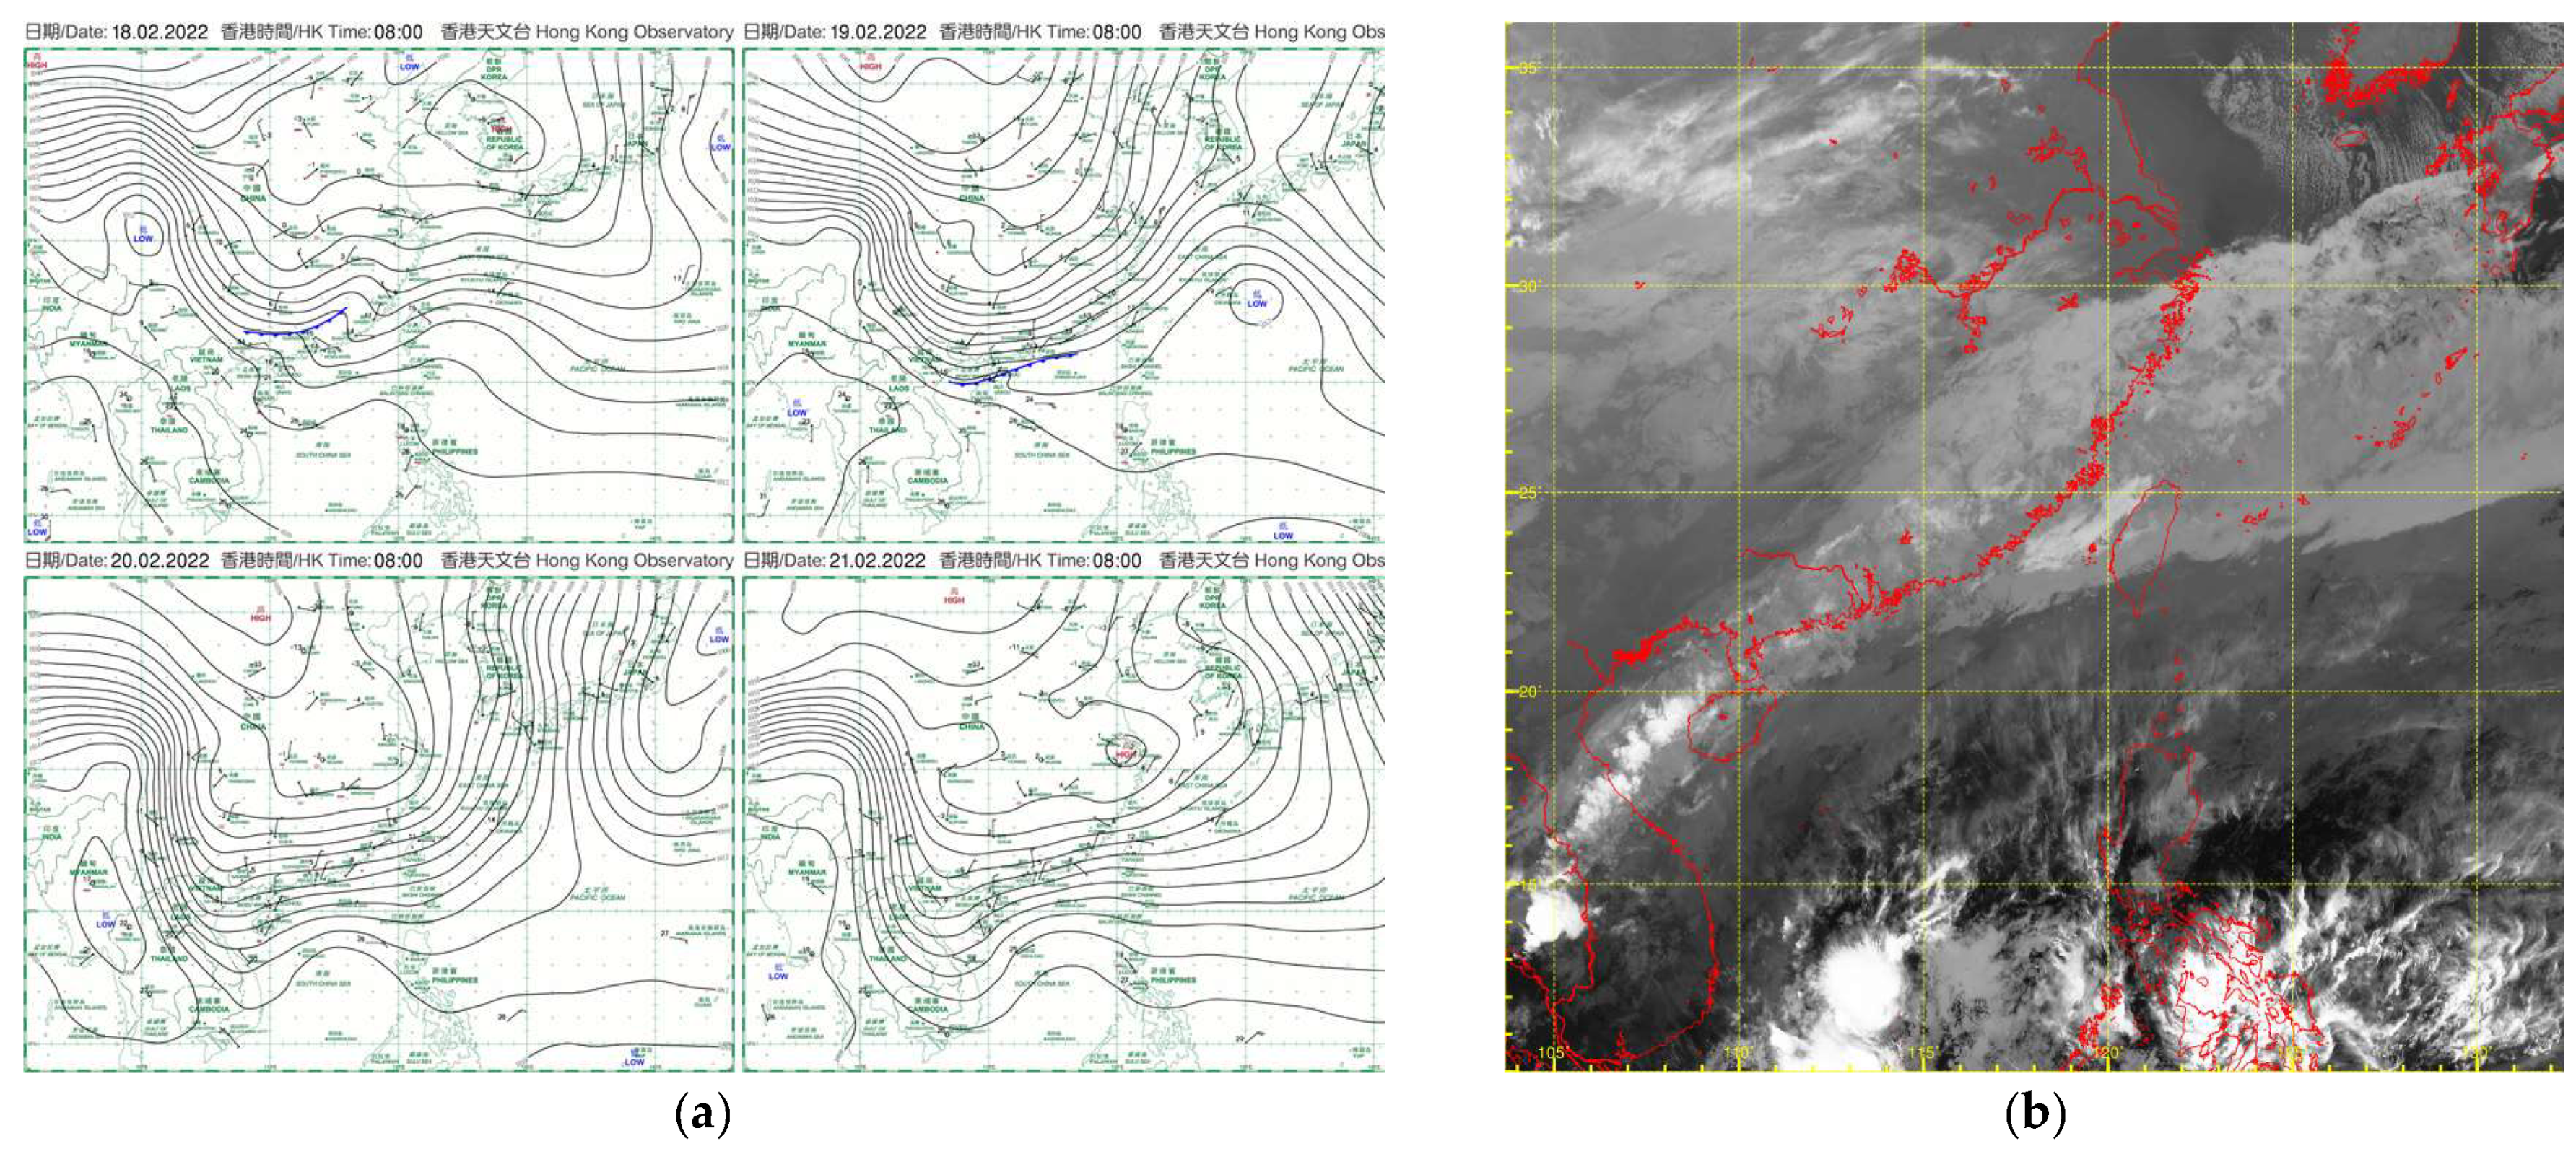
Table 6). Like many cases, the northerly surge arrived Hong Kong on the morning of 19 February 2022 after the passage of cold front (
Figure 12a) and cold air mass continued to spread southwards. The culprit of such low temperatures was the active southern branch westerlies at about 500–700 hPa, which persistently brought cloudy and rainy weather to Hong Kong, and
Figure 12b showed the associated cloud band extended from Indochina all the way over southern China. More than 150 mm of rainfall were generally recorded over Hong Kong on 19–22 February 2022.
5. Discussion
The proposed method of identifying extreme cold surges in Hong Kong can sort out past cold events in a relatively simple manner, with fixed thresholds for the three attributes of cold surge as set out in the literature. The time series of extreme cold surges generally showed a sharp drop of temperature to well below 12.0 °C with soaring winds, distinguishing them from other cold events. The percentile ranking method performed in this study could also be reproduced in other regions conveniently. The definitions are also highly operable, because many well-developed and forecast products have already been available for elements of temperature and wind speed, and the corresponding measures of extremity.
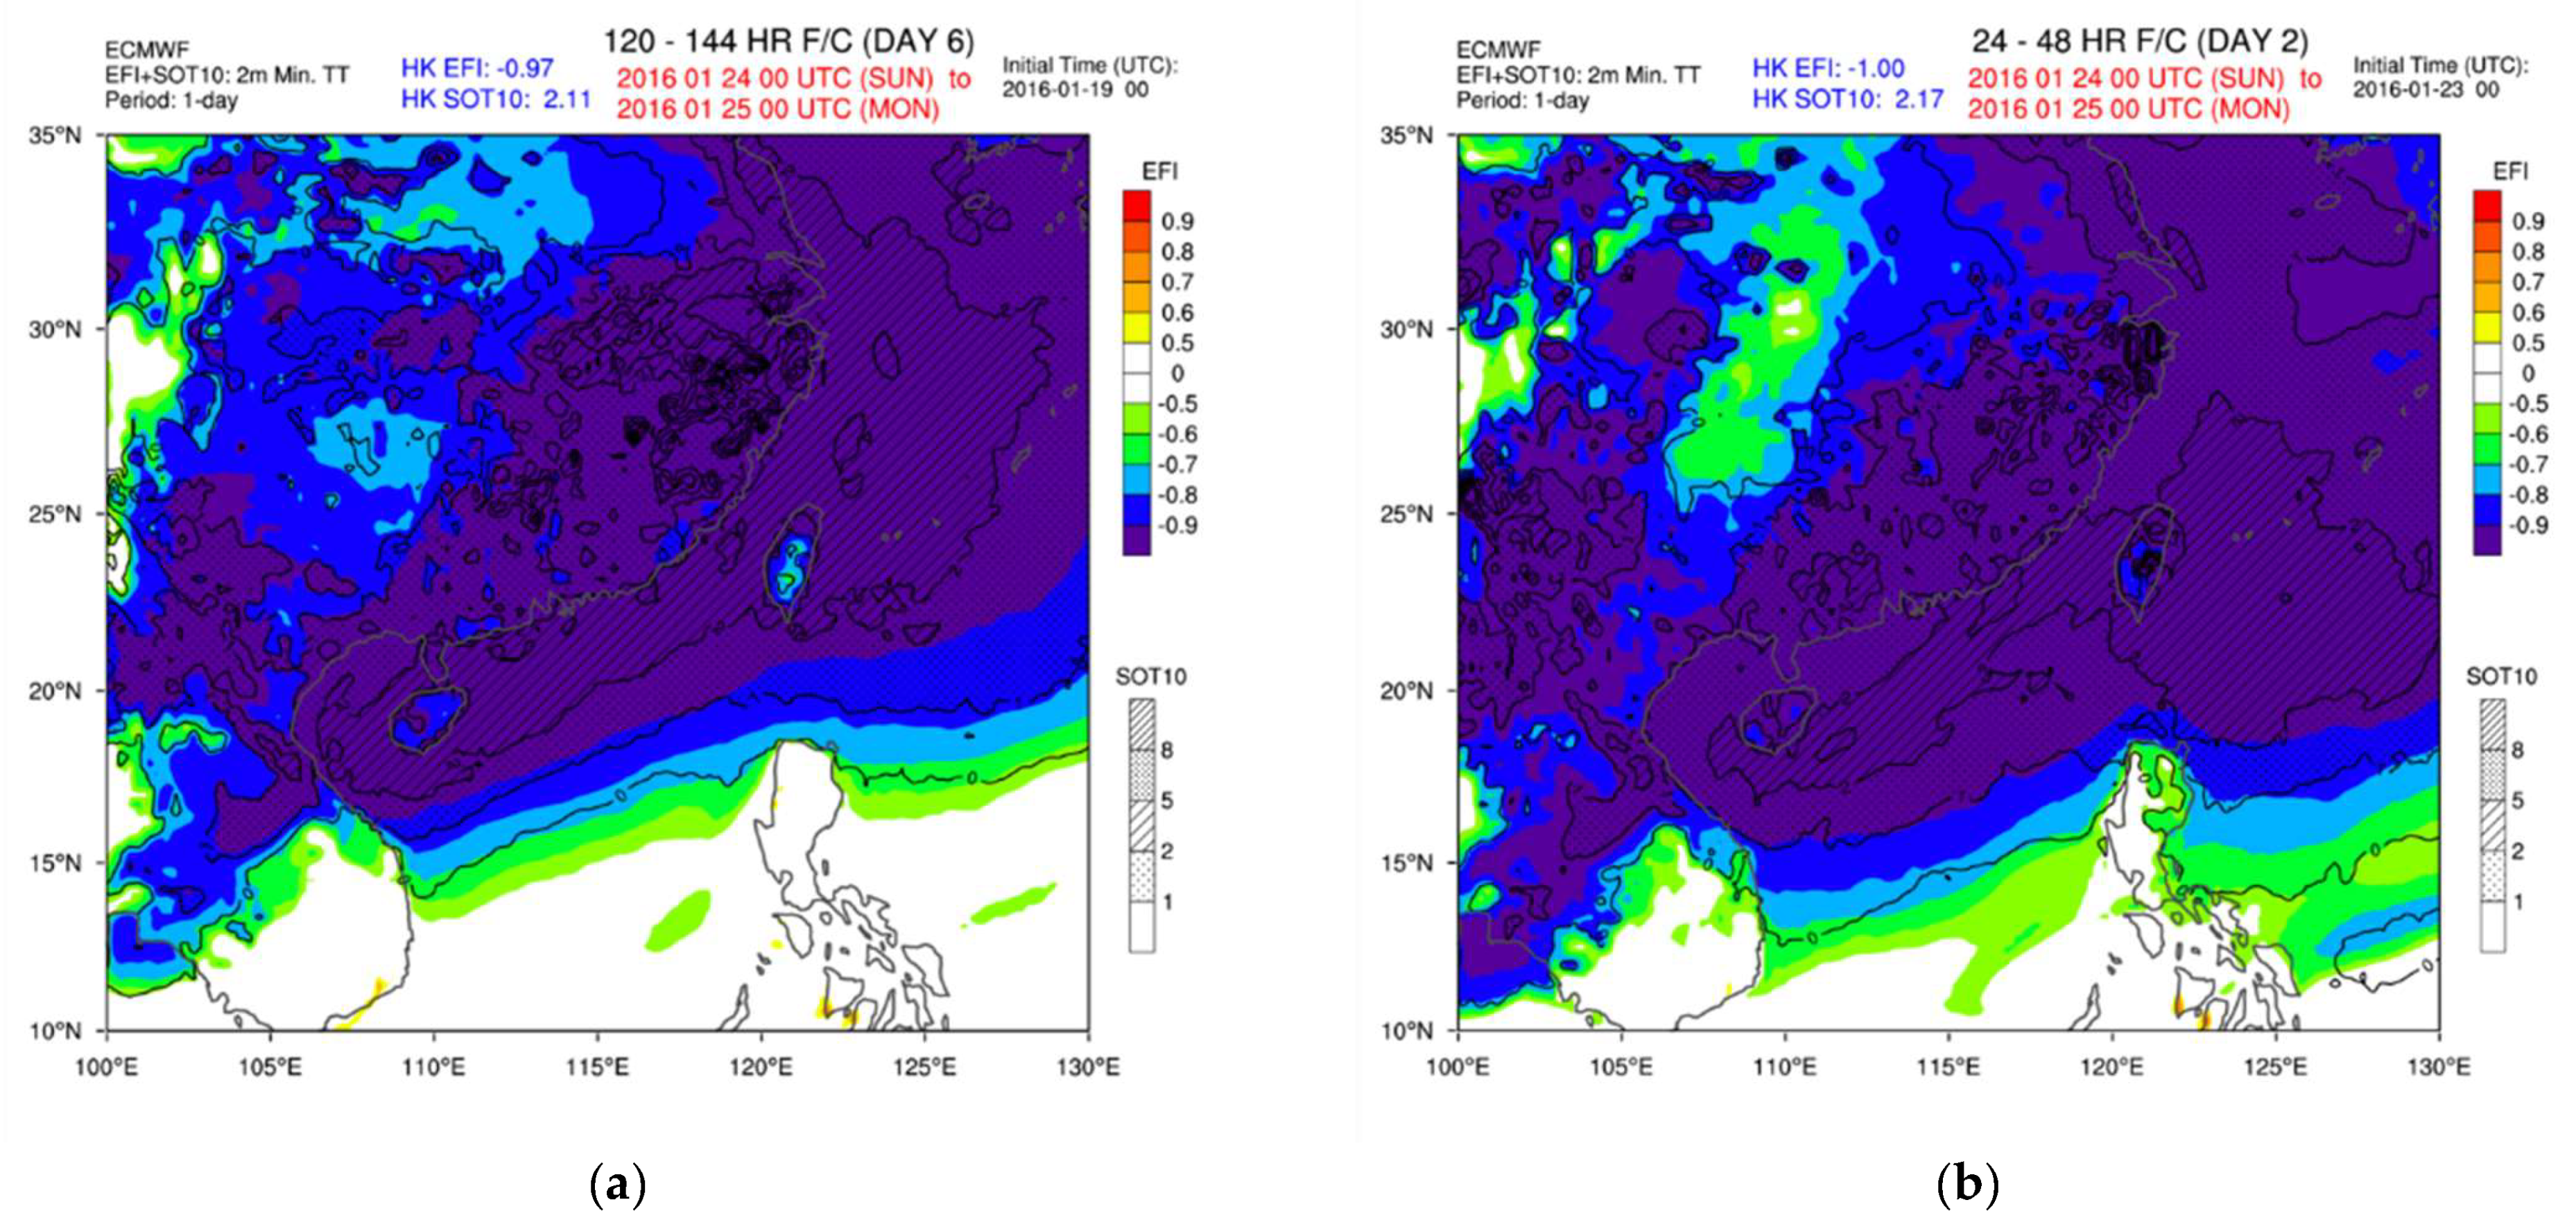
Forecast ensembles and model climate may play an important role when assessing the extremity of an anticipated cold event when such are well-calibrated with respect to the local climatology. Based on the European Centre for Medium-Range Weather Forecasts (ECMWF) model, the Extreme Forecast Index (EFI) [
36] and Shift of Tail (SOT) are measures of ensemble members’ extremity in terms of the model climate of a specified 5-week period close to the calendar date of the forecast [
37]. For EFI and SOT of 2 m minimum temperatures, an EFI closer to −1 and Shift of Tail Index for the 10th percentile (SOT10) being more positive imply that more extreme coldness is forecast. Take four recent intense cold events in 2016, 2018, 2020 and 2022 as examples. The event in 2016 was an extreme cold surge whereas the rest were less extreme, satisfying only the thresholds of
= 25. From
Table 8, it appears that the more extreme the cold events, the more extreme the corresponding EFI (closer to −1) and SOT10 (more positive) are. In fact, the extreme cold surge in 2016 scored EFI effectively −1, with SOT10 reaching about 2 or beyond. Models were seen to have rather stable and persistent performance in terms of the values of EFI and SOT10 across different model runs for all three events. The EFI and SOT10 forecasts of these events were also quite stable from a spatial perspective;
Figure 13 showed that the area of extreme EFI and SOT10 for minimum temperature sat over similar regions of southern China and the northern part of the South China Sea with 1-day and 5-day lead time in the extreme cold surge in 2016.
Although EFI and SOT only take into account the model climate of a selected 5-week period over the past 20 years, the indices indeed quantify the output of each ensemble forecast in terms of extremity, which can potentially be mapped to climatological percentiles in model. The previous examples show the ability of extreme indices to capture a significant cold event through a stable model output. If the corresponding percentile of each cold event in model climate could be evaluated, this would indicate similar extremity in reality. However, it would be complicated to extract decades of model reforecast from ECMWF’s Meteorological Archival and Retrieval System (MARS) database to reconstruct the model climate so that the climatology is not restricted to the 5-week period, and such a method needs to be further explored. When model forecasts are involved, cold events in Hong Kong may also need be categorized into wet and dry scenarios, because models were found to have warm bias for wet scenarios due to evaporative cooling [
38].
Currently, attributes of cold surges are forecast in separate weather elements when presented to the public. To effectively communicate the idea of extreme cold surge to the public, the threshold values of each element could be rounded to thresholds of operational categories, say rounding down of 7.7 °C of to 7.0 °C to match with the definition of “very cold” weather, and 17.2 m/s of to 17.5 m/s to match with the definition of gales. Also, the maximum temperature drop usually takes place within the first two days of cold surges due to intense cold advection, either across Day −1 to Day 0 or Day −1 to Day 1, could be further simplified this way for operational use. The 4 extreme cold surges identified would not be affected even if the thresholds are altered in the aforementioned way, and of course, no more extreme cold surges were included in the set under the slightly more stringent criteria.
However, the pure statistical method assumed the entire territory of Hong Kong would experience the same level of extremity in a cold event because only data at two locations are considered for each element. There could potentially be marginal surges overlooked by the reference stations but felt by the general public, particularly for cases with different temperature response over the territory. Regional temperature differences were so far disregarded in this study as they could be related to localized effect rather than synoptic cold advection and need to be further investigated. For example, radiation cooling in rural areas could significantly stretch the temperature difference between the urban and rural areas overnight for more than five degrees [
39], and winds were most likely calm.
A point to note for the study is that missing data in early years at Waglan Island could lead to potential cold surges being left out of the study in the 1991–2020 period. Through examination of the dataset, there were 5 cold events with undefined
, because there was missing data from Waglan Island between Day 0 and the day attaining
inclusive. Out of those 5 cases, 3 of which had
above 10.5 °C and another one had
above −2.9 °C, so these 4 cases could be ruled out as candidates of cold surges. The remaining case is the cold event on 18–28 February 1996 (
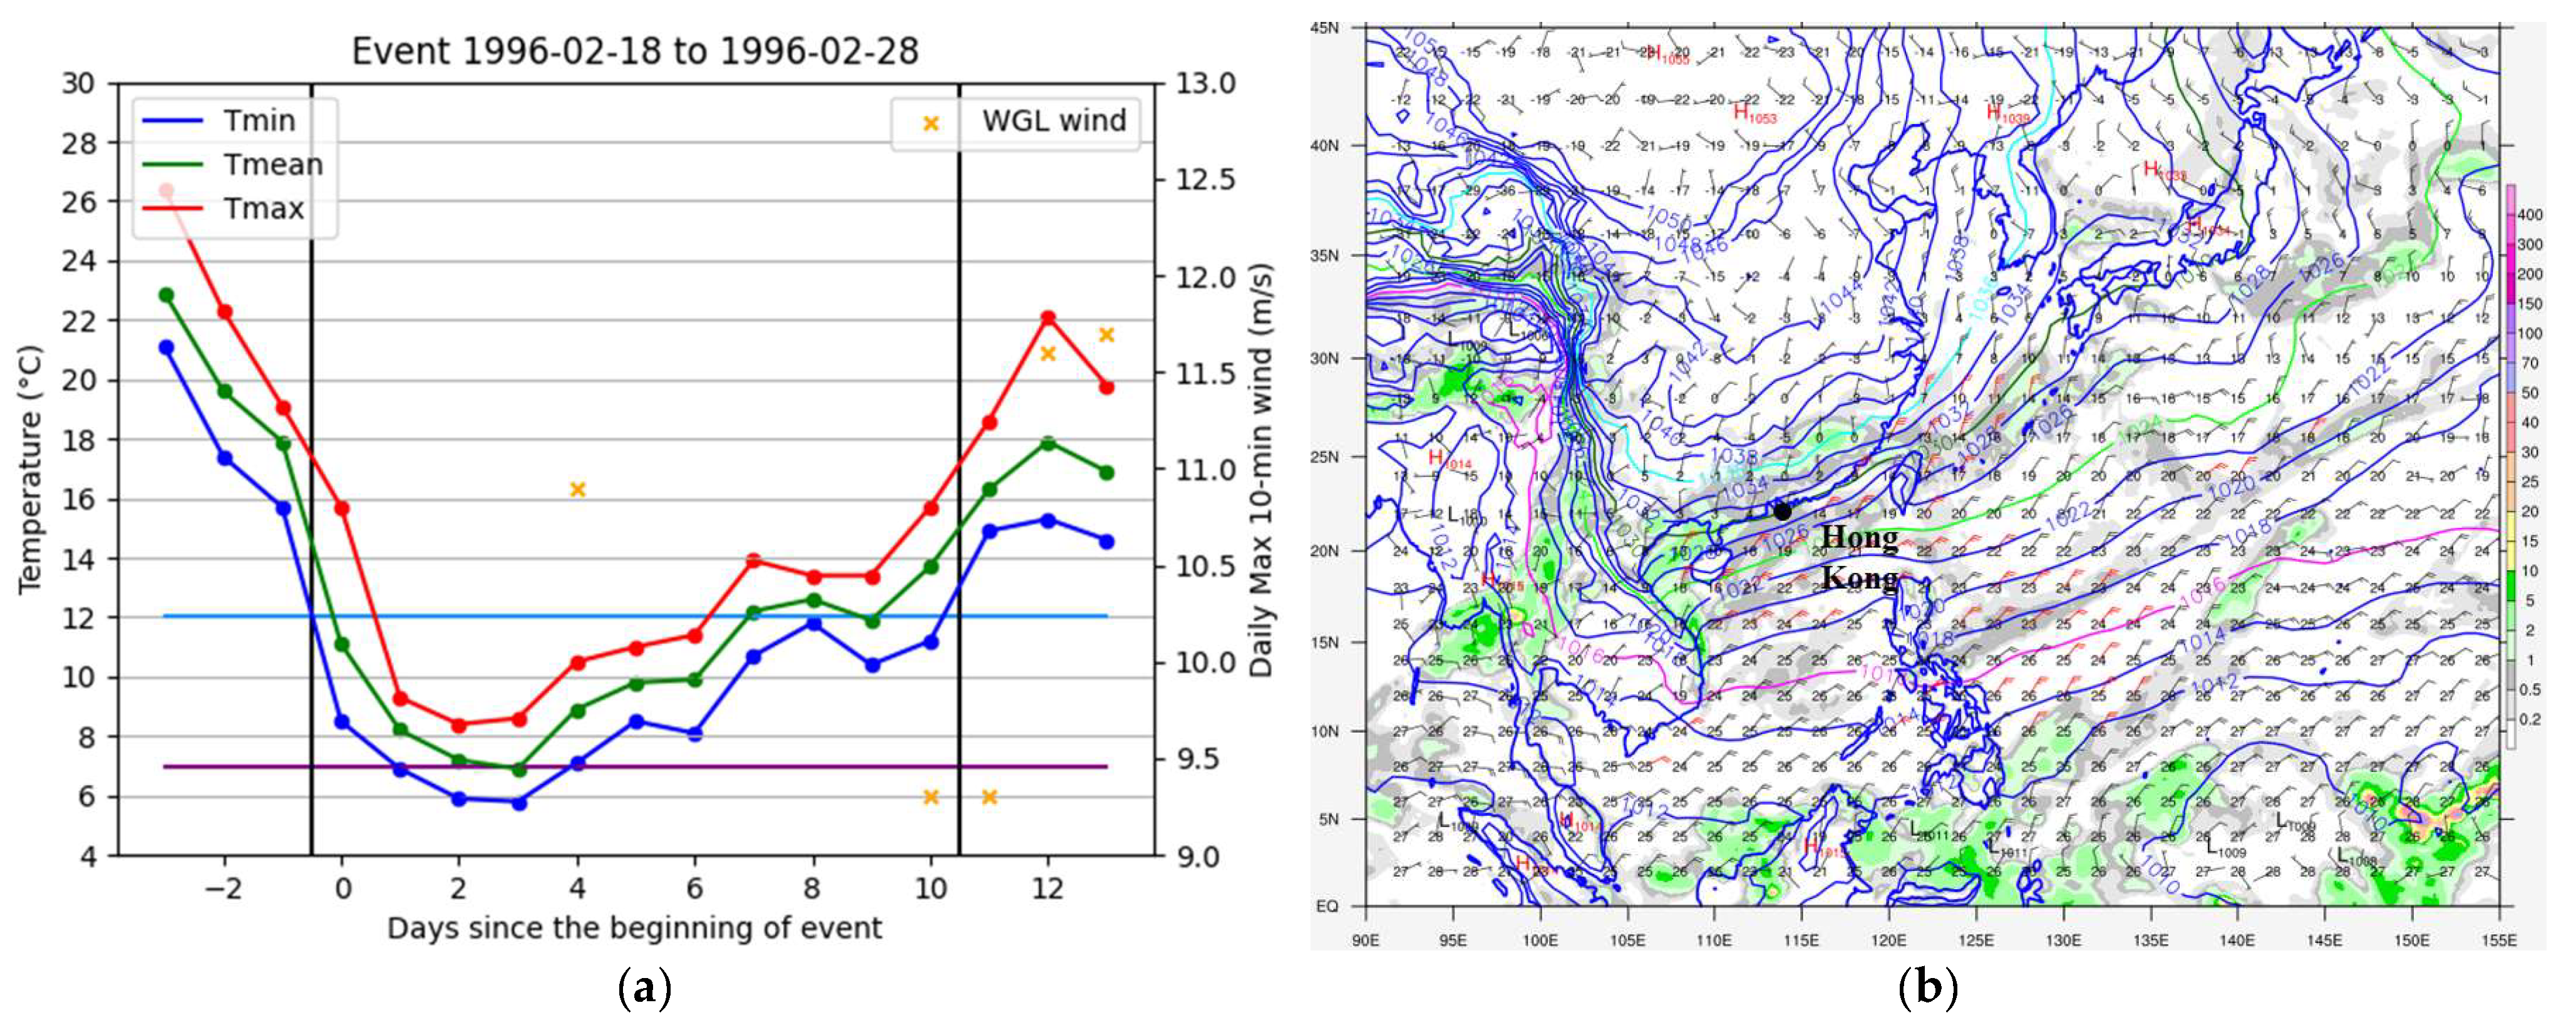
Figure 14a) with
reaching as low as 5.8 °C and an abrupt temperature drop of
= −8.8 °C, making it a potential candidate of an extreme cold surge.
From the surface pattern on 20 February 1996 (
Figure 14b), Day 2 of the cold event, southern China is under a typical pattern of a northerly surge. Isobars remain tight over the coast of Guangdong, meaning that winds were likely to be high. The extensive rain area covering southern China was consistent with records of 3.0 mm of rain at HKO and zero hours of sunshine at King’s Park of Hong Kong that day. Time series of the event showed that the event attained temperature as low as 5.8 °C on Day 3 (21 February) with abrupt temperature drop, making it a potential candidate of extreme cold surge. If we look into wind data from another unsheltered offshore station Cheung Chau (located at 22°12′04″ N, 114°01′36″ E) over the southern waters of Hong Kong, maximum 10-min sustained wind speed of 12.5 m/s, reaching the category of strong wind (Beaufort Force 6–7), was reported in this episode on Day 2 (20 February), one day before
was recorded. Although this is far from the threshold
= 17.2 m/s for extreme surge, it is worth noting that different stations have their respective properties and cannot be compared directly.
In case of missing data, forecasters are encouraged to pay special attention to the actual synoptic conditions and refer to other weather stations with similar properties, in case judgement for borderline cases is needed.
For the evaluation of extreme cold surges before 1991, it is notable that wind data from Waglan Island was only available since late 1989, and automatic wind stations were not even available before early 1980s. However, if we solely apply the temperature and abruptness criteria derived by the 1991–2020 climatology at HKO Headquarters, past extreme cold surges would not be missed out in the classification due to relaxation of wind criteria; however, much more candidates of extreme surges would likely be included.
6. Conclusions and Future Work
This paper proposes a statistical method of identifying and classifying extreme cold surges in Hong Kong from cold events, with respect to local climatology, based on three major attributes of a cold surge: the lowest temperature, the largest temperature drop and the maximum sustained wind speed. In view of the general warming trend in Hong Kong in recent decades due to global warming and urbanization, and the lack of wind data from automatic weather stations earlier on, data from the more recent 30-year period of 1991–2020 were considered in the study. The same level of extremity, in terms of percentile ranking, in all the three attributes has to be attained in order to identify an extreme cold surge. In this study, the 10th or 90th percentile of each the three attributes (, , ) of cold events were adopted as the thresholding criteria for extreme cold surge, resulting in threshold values at 7.7 °C, −8.0 °C, 17.2 m/s, respectively. Out of 152 cold events, only 4 “extreme cold surges” are classified, which means the frequency of occurrence of was once every 7.5 years.
Based on this study of cold surge, the next study in the future could be the application of model data in percentile ranking and hence extreme cold event predictions. The performance of EFI and SOT indices from ECMWF were found to be stable and indicative of the extremity of recent significant cold events, and through finding out the extremity of the forecasted cold surges in model climate in terms of percentile ranking, a potential “extreme cold surge” could be identified in advance.
From the perspective of weather forecasting, new tools of forecast guidance for cold surge can also be developed based on the relative extremity of weather elements in model climate, providing additional guidance on top of post-processed weather elements from direct model output. With the extremity of elements and preparedness of the society to certain extreme weather in mind, different levels of weather messages and precautions can be disseminated as necessary.


