Article

Evaluating Possible Changes in Air Temperature and Precipitation Patterns in Mozambique by Comparing Present and Future RegCM4 Simulation

by
Telmo Cosme A. Sumila
1,*,
Simone E. T. Ferraz
1 and
Angelica Durigon
2
1
Physics Department, Federal University of Santa Maria, Santa Maria 97105900, Brazil
2
Crop Science Department, Federal University of Santa Maria, Santa Maria 97105900, Brazil
*
Author to whom correspondence should be addressed.
Meteorology 2023, 2(1), 15-36; https://doi.org/10.3390/meteorology2010002
Submission received: 20 October 2022 / Revised: 26 November 2022 / Accepted: 2 December 2022 / Published: 6 January 2023
(This article belongs to the Special Issue Early Career Scientists' (ECS) Contributions to Meteorology (2022))

Abstract

:
Unlike global and regional assessments, the spatio-temporal variability of air temperature and precipitation, caused by climate change, must be more useful when the assessment is made at the sub-regional to local scale. Thus, this study aims to assess the possible changes in air temperature and precipitation in patterns for the late 21st century relative to the present climate in Mozambique. The regional model, RegCM4, driven by the global model HadGEM2, was used to perform the downscaling process under two Representative Concentration Pathways (RCPs), moderate RCP4.5 and strong RCP8.5. The three experiments were analyzed in the baseline (1971–2000) and future (2070−2099) range at the subregional scale in Mozambique. In this study domain, the highest amounts of precipitation and the highest air temperatures are observed during the extended summer season. However, the central region is rather warmer and rainier than the northern- and southernmost regions. Hence, the regional model RegCM4 demonstrated agreement relative to the observed weather stations and interpolated dataset from the Climate Research Unit. The strong performance of RegCM4 is revealed by its more realistic local spatio-temporal climate features, tied to the topography and geographical location of the study domain. The future increases in mean annual air temperature are well simulated by the model but, the spatial distribution and magnitude differ between the RCPs and over each of the three regions throughout the country. The sharp hottest response at the end of 21st century occurs in the summer and spring seasons under RCP8.5, spatially over the central and northern region of the study domain, with a hot-spot in the southern region. There is a predominantly drier response in the annual mean precipitation but, during the summer season, a meridional dipolarization pattern is observed, with the wettest response being over the southernmost region and a drier response in the northern and central regions of Mozambique.

1. Introduction

The continued global emission of greenhouse gases (GHG) will lead to additional warming along with long-term changes in all components of the climate system, increasing the likelihood of widespread and potentially irreversible warming in the terrestrial system [1,2,3]. As we are running out of time to limit global warming to 1.5 °C or to well below 2 °C above pre-industrial levels (Paris International Climate Agreement, 21st Conference of Parties), it is expected that the impact will become more severe in developing countries, particularly in underdeveloped regions such as sub-Saharan Africa (SSA). In recent decades, the climate in SSA has warmed at a rate comparable to that of most other continents, and thus somewhat faster than the global mean surface air temperature. Additionally, the warming is higher than it was in the past century, and therefore the continent became one of the most vulnerable regions to global climate change [4]. In the upcoming decades, for both global warming levels (GWLs) increasing by 1.5 and 2 °C and under Representative Concentration Pathways (RCPs), the air temperature may rise sharply in most African countries [5,6,7,8].
Along the entire continent, there is a marked contrast in precipitation levels. Southern Africa is considered one of the few land-based regions in the world for which climate models are in agreement with precipitation decline and air temperature increase as global warming increases. These statements are supported by those claimed in Intergovernmental Panel on Climate Change Assessment Reports (IPCC-ARs) [3,8,9,10,11,12,13]. Over the coastal and developing countries of the southern African region, such as Mozambique, there will likely be an increase in the frequency and intensity of heat waves, a decrease in seasonal and annual mean precipitation, and an increase of regions with extreme droughts, under future climate projections [5,6,9,12,14,15]. Briefly, Africa is therefore a continent of high exposure and vulnerability, and within southern Africa, Mozambique is one of the “hotspots” for climate change-related impacts.
The climate change concept is more useful in practice if the impact assessment is implemented at the sub-regional and local scales [7]. Studies focused on the evaluation of present and future climate change within Mozambique’s borders are scarce (e.g., [11]). Whilst scores of global and regional studies for Africa have taken great strides forward, the sub-regional to local-scale precipitation and air temperature variability that affects small countries such as Mozambique remain little studied. However, some regional climate modeling studies have been performed over extensive regions of the African continent, most of them considering generalized analysis for the southern African region as a whole (e.g., [15,16,17]). It is important to highlight that, if climate information is to be effective in helping to prepare for future climate change in Africa, understanding the local context of its impacts will be crucial to designing an effective adaptation framework [18]. At the small scale, there is some local evidence of an increasing mean air temperature and the irregular distribution of precipitation within Mozambique’s borders, which partially support the global and regional results previously highlighted by INAM-Instituto Nacional de Meteorologia.
In Africa, there are relative significant studies that have received permanent attention on the global and regional scales [10,19,20,21]. In addition to the studies of [11], as far as we know, there are no studies investigating the effects of climate change and responses to global warming under representative climate scenarios through RCMs-downscaled data at the sub-regional, countrywide, and local scales in Mozambique. To address the challenges of a better and deeper understanding of the real impact of climate change in the small-scale in this country, Regional Climate Models (RCMs) have become sophisticated and important tools used in recent decades to improve the coarse resolution of the Atmosphere-Ocean General Circulation Models (AOGCMs) (e.g., [9,22,23,24]). Although these are advantages, besides the initial and boundary conditions, it is known that the output of numerical models can be strongly affected by the local characteristics of the study domain [24,25,26,27,28,29,30,31,32].
Few if any of the abovementioned studies have relied on the use of regional climate models to simulate future climate under representative pathways scenarios over Mozambique domain in details. This research evaluate the performance of the regional models and quantifying the simulated air temperature and precipitation changes in the 21st century within Mozambique boundaries relative to present climate. This study is perhaps the first one using the International Center for Theoretical Physics–Regional Climate Model (ICTP–RegCM4) downscaled outputs under two Representative Concentration Pathways (RCPs), to assess climate projections over Mozambique, opening a local-scale window on climate-related impact. The RegCM4 was driven by a single AOGCM to evaluate and quantify the present and future climate over Mozambique, through two experiments: moderate radiative forcing (RCP4.5) and strong radiative forcing (RCP8.5) for later 21st century (2070–2099), relative to reference period (1971–2000).

2. Data and Methodology

Model Description (Set up) and Simulation Design

The climate assessment for present and future climate is made through the analysis of air temperature and daily precipitation dataset over the study domain. The open source regional model, RegCM4 (available at ICTP—Regional Model, described in [22]) is used in the present study. For dynamical downscaling process the RegCM4 model was running driven by the AOGCM, HadGEM2 [33,34], with grid spacing of 50 km and the time spans conducted at three experiments divided into: historical (1971–2000) (hereafter Ref), and future experiments (2070–2099). The future experiments were runs under two Representative Concentration Pathways (RCPs) scenarios, moderate radiative forcing (RCP4.5) and strong radiative forcing (RCP8.5) [35,36,37,38]. Note that, Representative Concentration Pathways are a set of scenarios that represent pathways of radiative forcing based on socio-economic and technological development [38]. The choice of RegCM4 simulation matrix applied here is far from being perfect, but the brief model setup description used to run the experiments is based on the scheme combination mentioned in the most of literature as the better for tropical region. The experiments were carried out under the following parameterizations schemes: the radiation scheme of CCM3, modified version of the planetary boundary layer scheme of Holtslag, the resolvable scale precipitation scheme (SUBEX) to simulate large-scale precipitation, the mixed convection scheme parameterization of Emanuel and, the Biosphere-Atmosphere Transfer Scheme (BATS) to describe the land surface processes were applied (Table 1).
The study domain is located in southern Africa region, bounded by latitude 10°27′ S and 26°57′ S, and longitude 30°91′ E and 40°51′ E (Figure 1). There are three main types of Koppen-Geiger climate regions in the study domain: temperate climate in most of the northern and portions of central region, semi-arid climate in little restricted areas of southern and central region and, tropical climate with rainy summer throughout the coast [39,40]. The country holds a long coastline bathed by the Indian Ocean with a total distance of about 3000 km.
The observed daily datasets in the study domain are scarce with large gaps in both spatial and temporal coverage, but there is some historical dataset available from the main weather station (WS) along the geographical boundaries of the country. For the model RegCM4 output performance evaluation and validation of interpolated Climatic Research Unit dataset (University of East Anglia Climatic Research Unit—CRU, [41]), were used the abovementioned daily observed WS datasets available by the National Meteorological Agency—Mozambique (INAM-Instituto Nacional de Meteorologia). The black marks illustrated in Figure 1, are close to the geographical location of each WS, and named as: Pemba (PB), Nampula (NP), Lichinga (LC), Quelimane (QL), Tete (TT), Beira (BR), Chimoio (CH), Inhambane (IN), Xai-xai (XX), and Maputo (MP). On the other hand, the CRU dataset used are from the most up-to-date version, which includes additional observations of surface weather stations. Moreover, the interpolation process has been changed to use angular-distance weighting (ADW), and the production of secondary variables has been revised to better suit this approach. The implementation of ADW provides improved traceability between each gridded value and the input observations, allowing more informative diagnostics than the previous version [41]. Another point worth highlighting is that, from the RegCM4 baseline simulation and CRU 0.5° × 0.5° grid space resolution data, the climatological mean of air temperature and precipitation from the geographical points around each corresponding latitude and longitude WS throughout the study domain were extracted. This procedure was executed by the bilinear remapping. These extracted data made it possible to perform comparative analyses of the present climate among the three datasets at local scale level. The analyses are performed for all seasons (December-January-February, DJF; March-April-May, MAM; June-July-August, JJA; and September-October-November, SON), ensuring that the entire year is considered. For the subregion, we also examine the annual cycle of air temperature and precipitation. In addition, the models are evaluated against WS and CRU dataset for the reference period, while RCP4.5 and RCP8.5 changes with respect to the reference period of RegCM4 simulation over the seasons mentioned above.
Table 1. Model setup and physics process applied to run the simulations.
RegCM Configurations
Parametrizations SchemeDescription
Vertical coordinateσ-18 levels (50 hPa)
Horizontal gridB-Arakawa
DynamicsHydrostatic
ProjectionRotmer
Physical processesCumulus convectionGrell + MIT
Radiative transferHoltslag PBL
Resolved scale precipitationSUBEX
Land surfaceBATS
Ocean fluxes[42]
Boundary conditionsRelaxation-exponential technique
ΔT90s
Calendar360
To evaluate RegCM4 performance to simulate precipitation and air temperature climatology in baseline period over the study domain, some statistical metrics were applied: the absolute bias (AB), mean absolute error (MAE), root mean square error (RMSE), and the pattern correlation coefficient (r) between each dataset. The performance metrics are all computed with respect to both the Climate Research Unit-CRU [41] and WS dataset to allow the validation of the CRU dataset and alongside assessing the performance of RegCM4. However, it should be recognized that the performance metrics values should be considered as indicative of the model performance. Additionally, these metrics were applied to the Probability Density Function (PDF) according to Equation (1).
P D F = 1 σ × 2 π × e X μ 2 2 σ 2
where x is the climatological variable (air temperature and precipitation), σ is the standard deviation, and μ the mean of the dataset. The spatio-temporal maps are presented as annual and seasonal averages for the entire region domain and discussed at regional level.

3. Description of Present Climatology

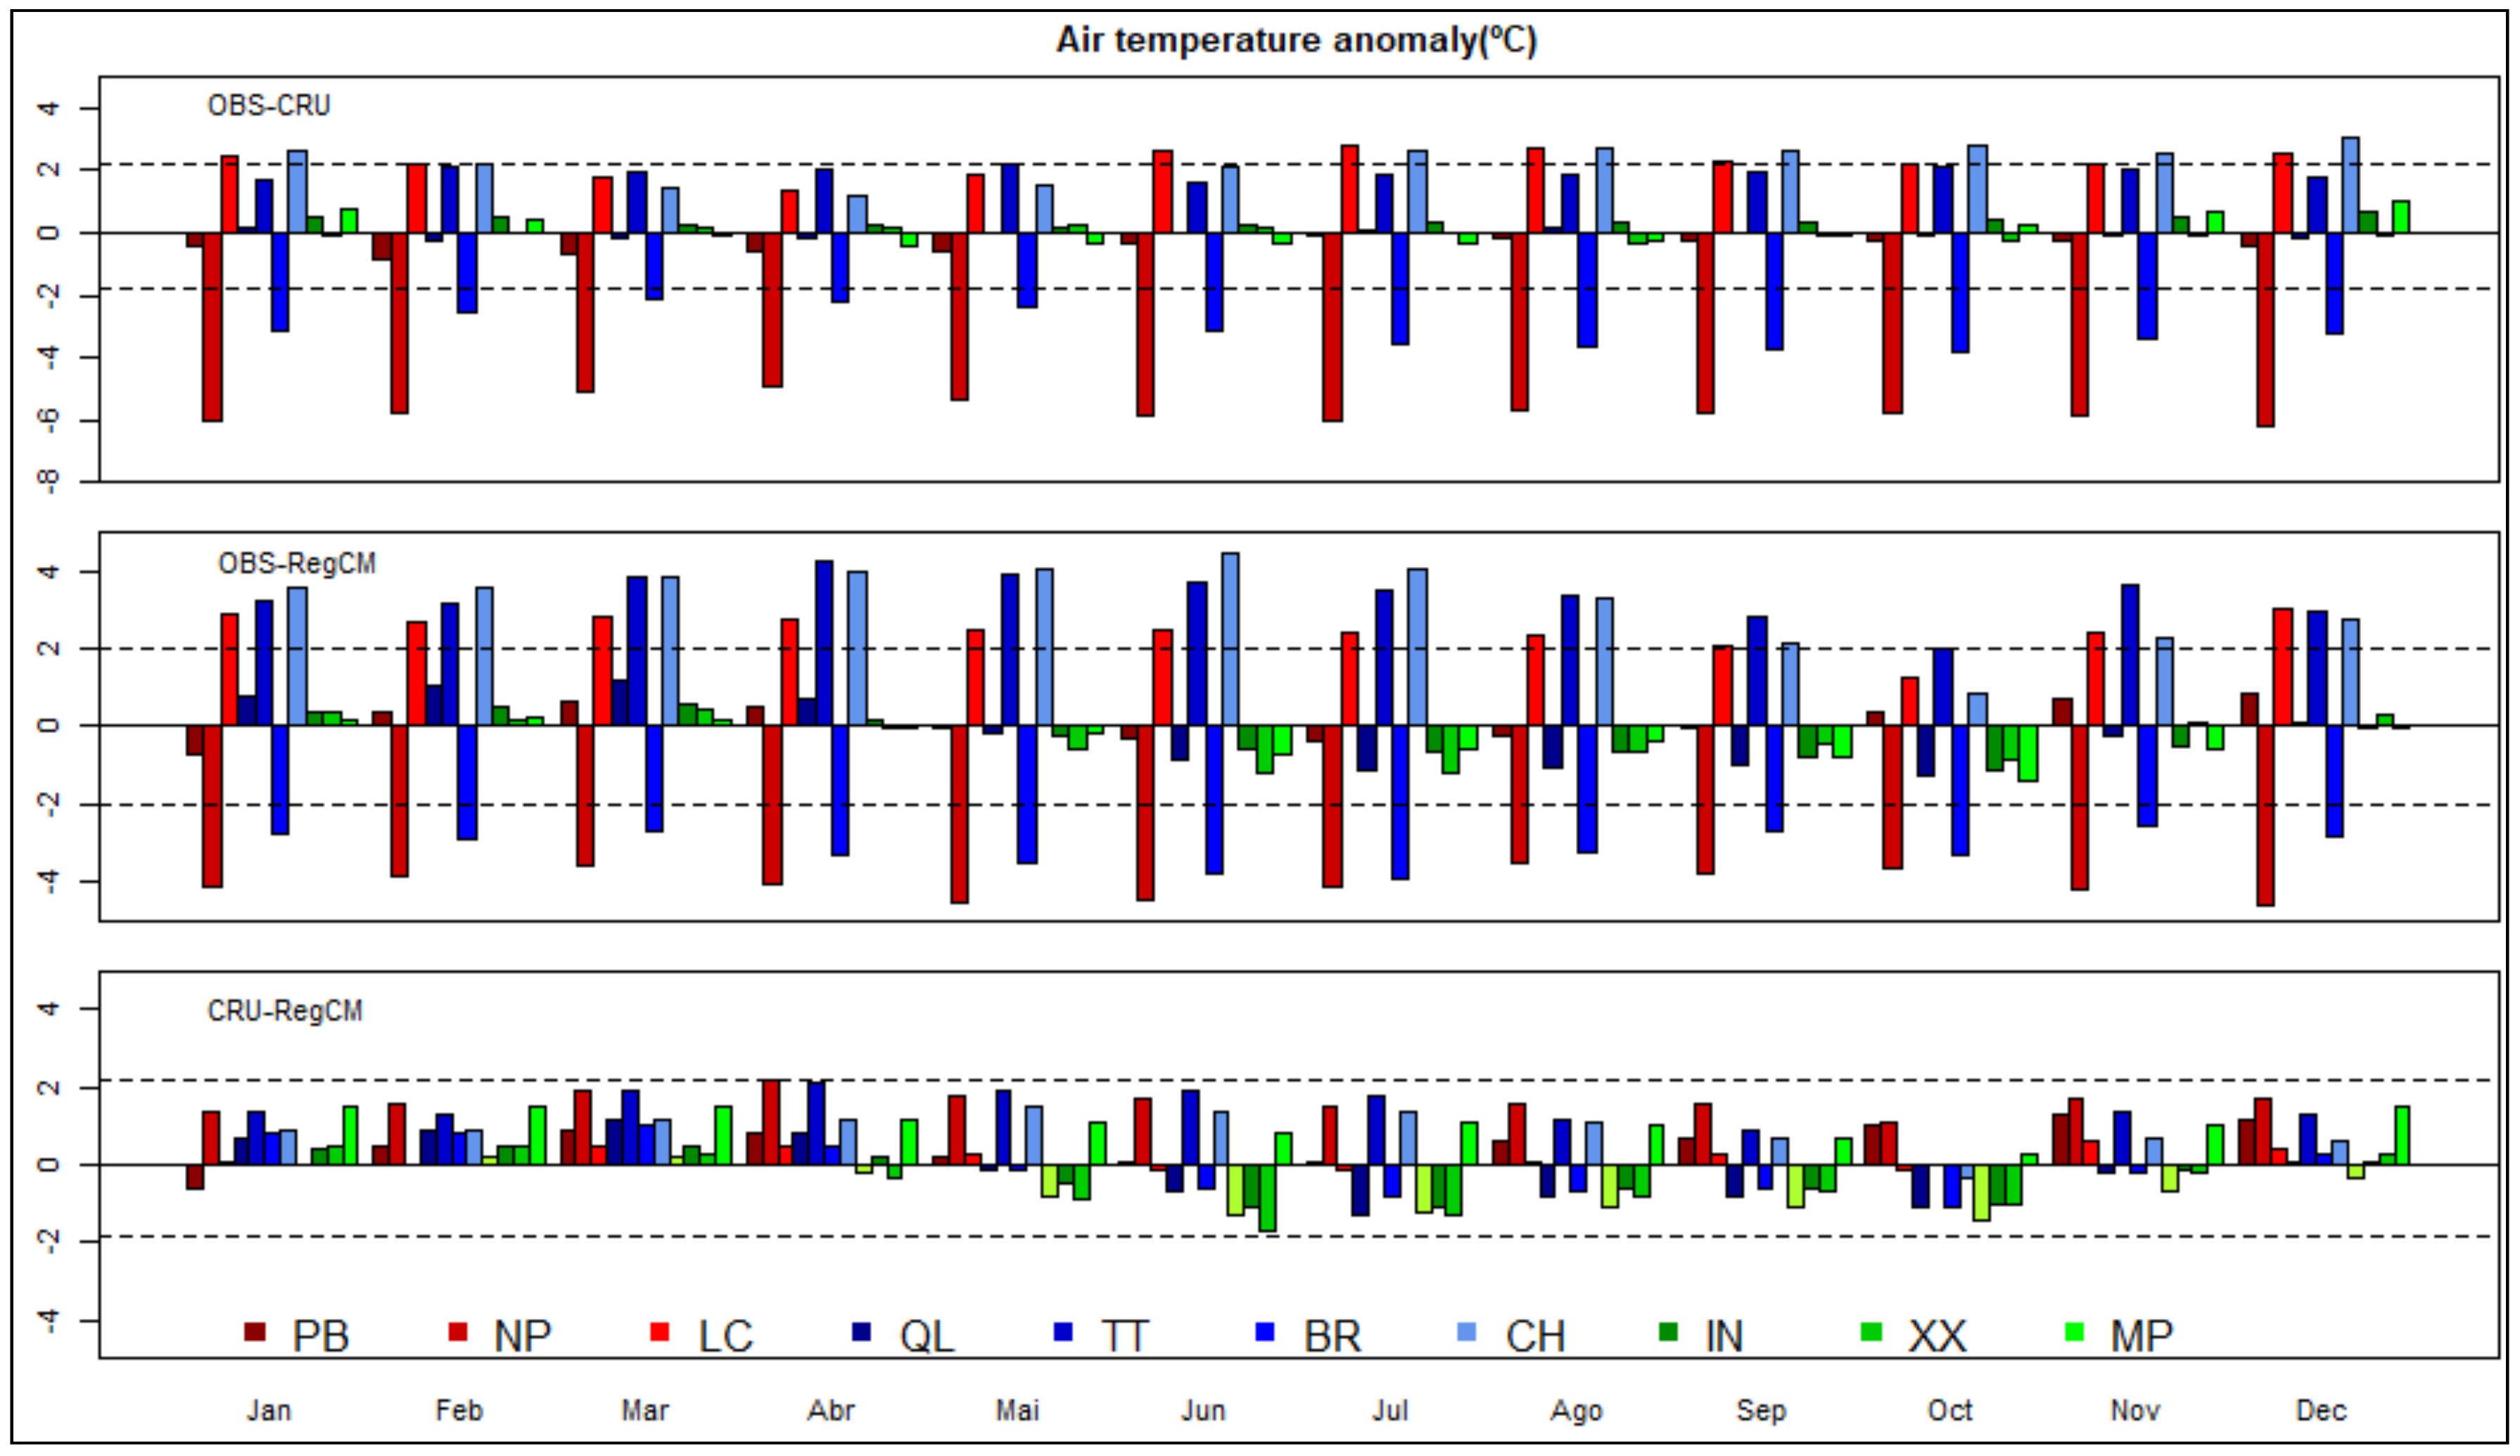
3.1. Air Temperature and Precipitation Annual Trend Line

For the model to be used as a tool of faithful representation of changes in the future climate, it is necessary to evaluate how the model captures the important climate features and simulate the key climate variables such as precipitation and air temperature within the boundaries of the study domain. It is worth remembering that, based on the clustering analysis of climatological similarity (not shown), the representative WS of each of the three climatological regions of the study domain was extracted (Figure 2a,d from PB WS; Figure 2b,e from QL WS; Figure 2c,f from XX WS). Then, according to probability, density of daily air temperature, and precipitation, it is noted that the temporal distribution of these parameters are strongly seasonal. Additionally, it is clearly observed the occurrence of high and low air temperatures from October to March and from April to September, respectively. In the same period, the highest air temperature records above 30 °C is observed, mainly over the central region (Figure 2a–c). Meanwhile, the lower occurrence of daily precipitation is observed from May to September, and the lowest daily amounts (less than 20 mm per day) are recorded in northern and southern regions (Figure 2d,f). On the other hand, from October to March the daily precipitation events above 20 mm are more usual, however, it is in the southern region where the smallest daily amounts of precipitation occur, compared to those recorded in central and northern region (Figure 2d–f). An important point worth highlighting in Figure 2 is that the greater amplitude of air temperature and precipitation are observed in the southern region. This can be explained by the influence of the zonal flow linked to cold fronts during winter season and the absence of this synoptic systems during the summer season, over the southern region. Hence, concerning to precipitation, the interannual variability is higher in regions of lower seasonal precipitation amount, i.e., drier areas are also more variable year-to-year.
Unlike the probability distribution of the climate factors, the annual trend-line of mean air temperature and precipitation over the reference period (1971–2000) represented by observed WS, interpolated CRU and simulated RegCM4 datasets is shown in Figure 3. There is a clear south to north increase in average precipitation amounts and a less well marked increase from interior to coastal areas. Globally, precipitation has similar averages between the WS in each region, but the rainy season is markedly more prominent over central (CH, BR and QL WS) and some areas in northern regions (PB, NP and LC WS) of Mozambique (Figure 3a–c). At the same time, the lowest amount of precipitation are recorded over southern region (IN, XX and MP WS) of the study domain. Note that, despite the overestimated seasonal amplitude and small lags in the annual trend-line, the regional model ReCM4 represents well the annual cycle as well as the seasonal amplitude of precipitation in each WS analyzed (Figure 3a–c).
As they were observed for precipitation, the annual cycle and seasonal amplitude of air temperature are well represented by the three datasets, but with less differences in seasonal amplitude than those occurred for precipitation. The regional model RegCM4 and CRU data can capture the most stand outs mean air temperature in LC, CH and TT WS (Figure 3d–f). It is important to point out this result because, the local topography and geographical location of these WS and surroundings (see Figure 1) are the main climatic feature for the “outsider” annual air temperature trend-line. Thus, from the point of view of temporal distribution, the RegCM4 and CRU datasets are fairly close to the annual cycle and amplitude of seasonal variation in air temperature and precipitation, relatively to observed WS (OBS) dataset (Figure 4).
To make clearer the results founded in the previous discussion and further assess the performances of the regional model and CRU reliability at grid point level, the mean bias was computed for CRU and RegCM with respect to WS datasets, as shown in Figure 4. Firstly, there is no prevailing pattern in precipitation bias (positive or negative) between OBS and CRU. However, in the OBS-RegCM and CRU-RegCM, a negative predominant year-round pattern is observed, meaning that there is a clear trend of the regional model overestimate OBS and CRU.

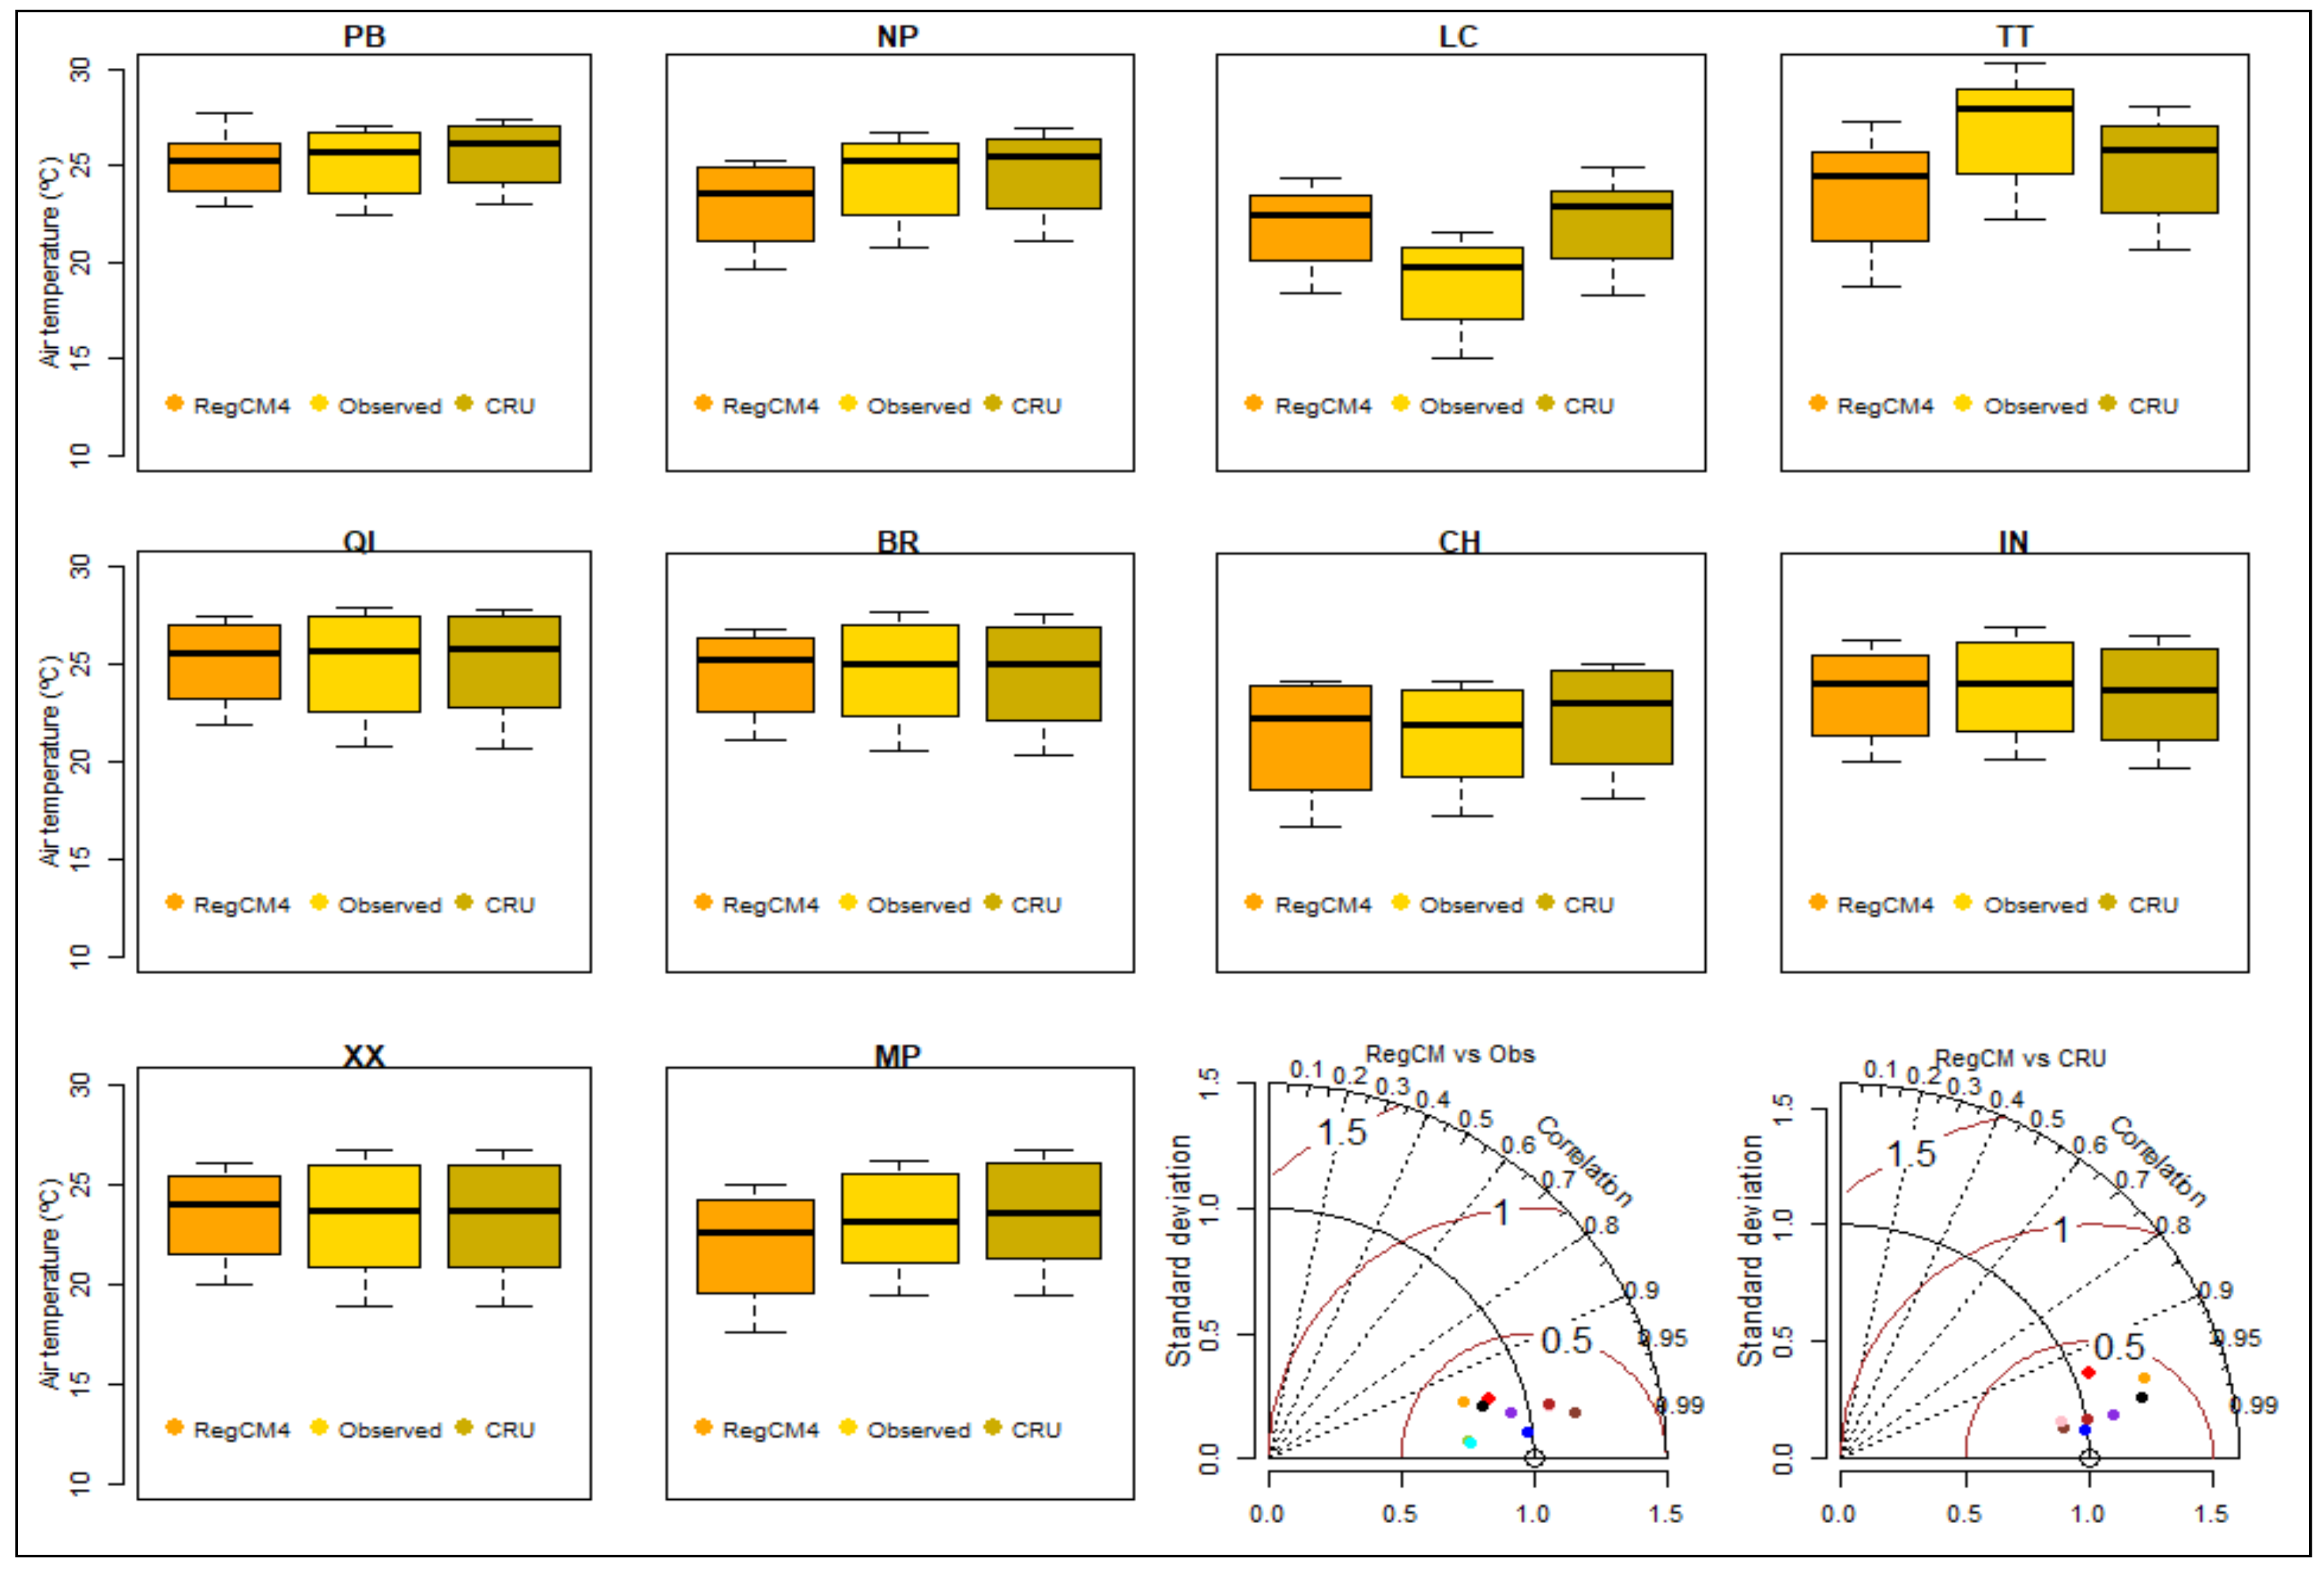
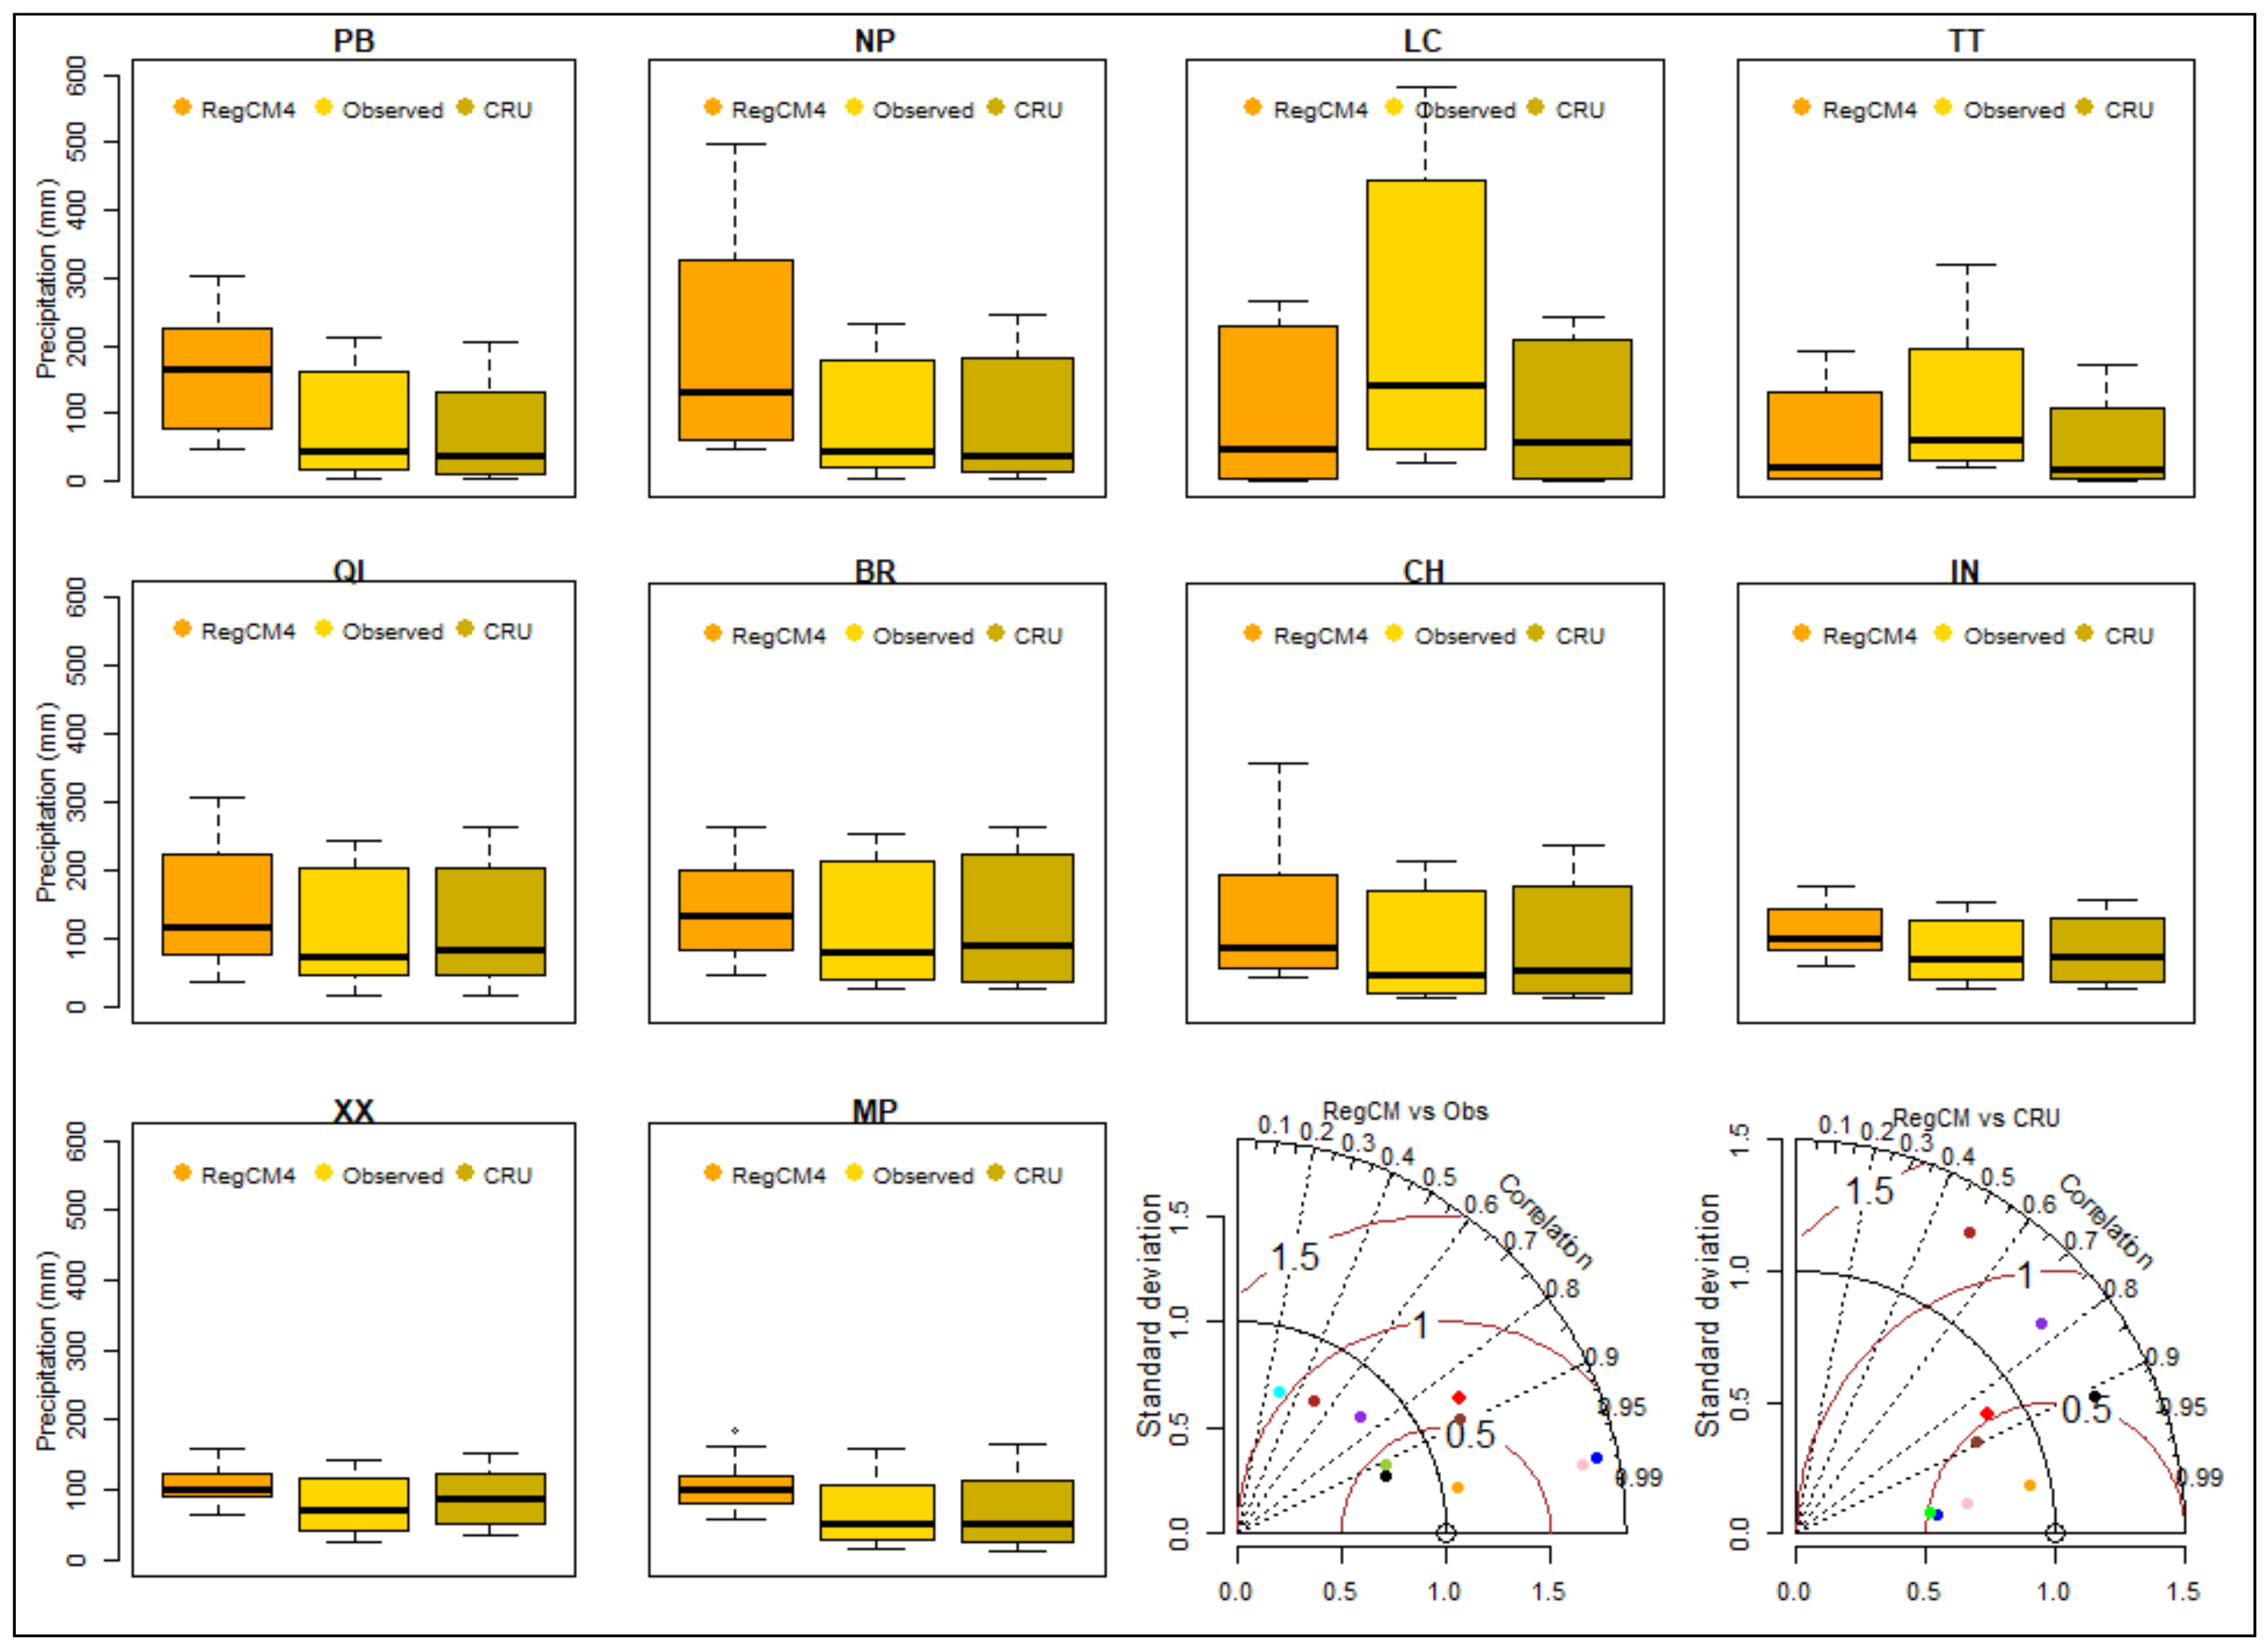
3.2. Evaluation of RegCM4 Performance and CRU Validation

These negative biases are more significant (≥50 mm/month) during the rainy season and over the northern region of the study domain (Figure 4). Meanwhile, an irregular, anomalous response pattern in the air temperature can be observed, mainly for OBS−CRU and OBS−RegCM. On the contrary, RegCM slightly overestimates the CRU with emphasis on extended summer season. During the winter season, there is a small cold bias over most of southern region of the study domain (Figure 4). However, in absolute values, the anomaly between CRU and RegCM is less than 2 °C. Finally, the large absolute biases simulated by RegCM are observed predominantly over the northern region of the study domain.
The prerequisite for the credibility of RegCM4 simulations is the regional model systematic evaluation through comparisons against observations. The RegCM4 evaluation performance and CRU validation is based on how realistically they can reproduce the magnitude and spatio-temporal variability of the climate variables during each of single season in the study domain. For this purpose, we compared the mean monthly precipitation and air temperature from both datasets relative to baseline period of each WS shown in Figure 1. Overall, there is strong consistency in amplitude of air temperature and its range of absolute distribution values, for RegCM4 and CRU datasets relative to OBS, although small differences in LC and TT WS are observed (Boxplot in Figure 5). The Taylor diagrams summarize the similarities between simulated and observed datasets. As kindly explained by [20], the Taylor diagram displays three statistical measures with respect to one reference field. The distance between reference and individual points in the diagram corresponds to root-mean-square difference (RMSE). The black-dashed radial lines display the pattern correlation (r) between the simulated and the reference field. The brown half-circles represent the spatial standard deviation (σ) between the simulated and the reference field.
The RegCM4 against OBS diagram shows a high r (≥95%) with low RMSE and σ (well below 0.5) in almost perfect agreement with the reference providing an indication of strong consistency between the datasets. This means that the datasets are more clustered and close to the reference field with the best performance, following the real annual and seasonal air temperature patterns (Figure 5, RegCM4 vs. OBS). Similar strong consistencies are observed when RegCM4 is compared with CRU, but there are some points with r less than 95%. Except for the LC and TT WS, this result is even more supported by the lower bias indicated previously.
However, when compared precipitation dataset from RegCM4 and OBS, there are some significant differences in absolute values and its range of distribution. From the precipitation boxplot, the distribution between the three datasets lies in the similar ranges despite RegCM4 indicate large overlie dispersion (Figure 6). The boxplot shows once again that, among the WS, TT, and LC are those where the largest difference are found. As a consequence, a shift of the range from median towards to 75th quartile of the box with a broader range value in the LC than TT and NP can be observed. Interestingly, the dispersion of the three datasets are similarly represented (as can be seen by the presence of less extended upper whiskers and symmetrical boxes) in most of the central and southern regions. Meanwhile, although the great agreement in annual cycle (high correlation) of some WS, the Taylor diagram RegCM vs. OBS can distinguish the biases associated with poor simulation of the annual cycle amplitude and those associated with the lag of seasonal pattern, indicated through the below and above the reference line, respectively (Figure 6, both Taylor diagram).
Note that a perfect match of the measurements would yield a point with a normalized standard deviation and correlation coefficient both equal to 1. A point worth highlighting is that the uncertainties associated with precipitation are expected because of the great spatial and seasonal variability, and its dependence on local characteristics. Furthermore, the regional model generates its own internal climate variability within the nested domain, which may differ from that of the driving GCM over the same region and lead to some different projections. As previously mentioned, topography, coastlines, land surface heterogeneity, and smaller scale physical process are sometimes well accounted by regional models as opposed to GCM [43]. Although the crucial issue to simulating precipitation magnitude, it can be claimed that RegCM4 and CRU datasets reproduce basic patterns, supporting the seasonal cycle and depicted the wetter feature of September, October, November (SON) and December, January and February (DJF) relative to the rest of the year. These features are aligned with the observed WS boxplots, hence both datasets faithfully represent the WS data in situ.

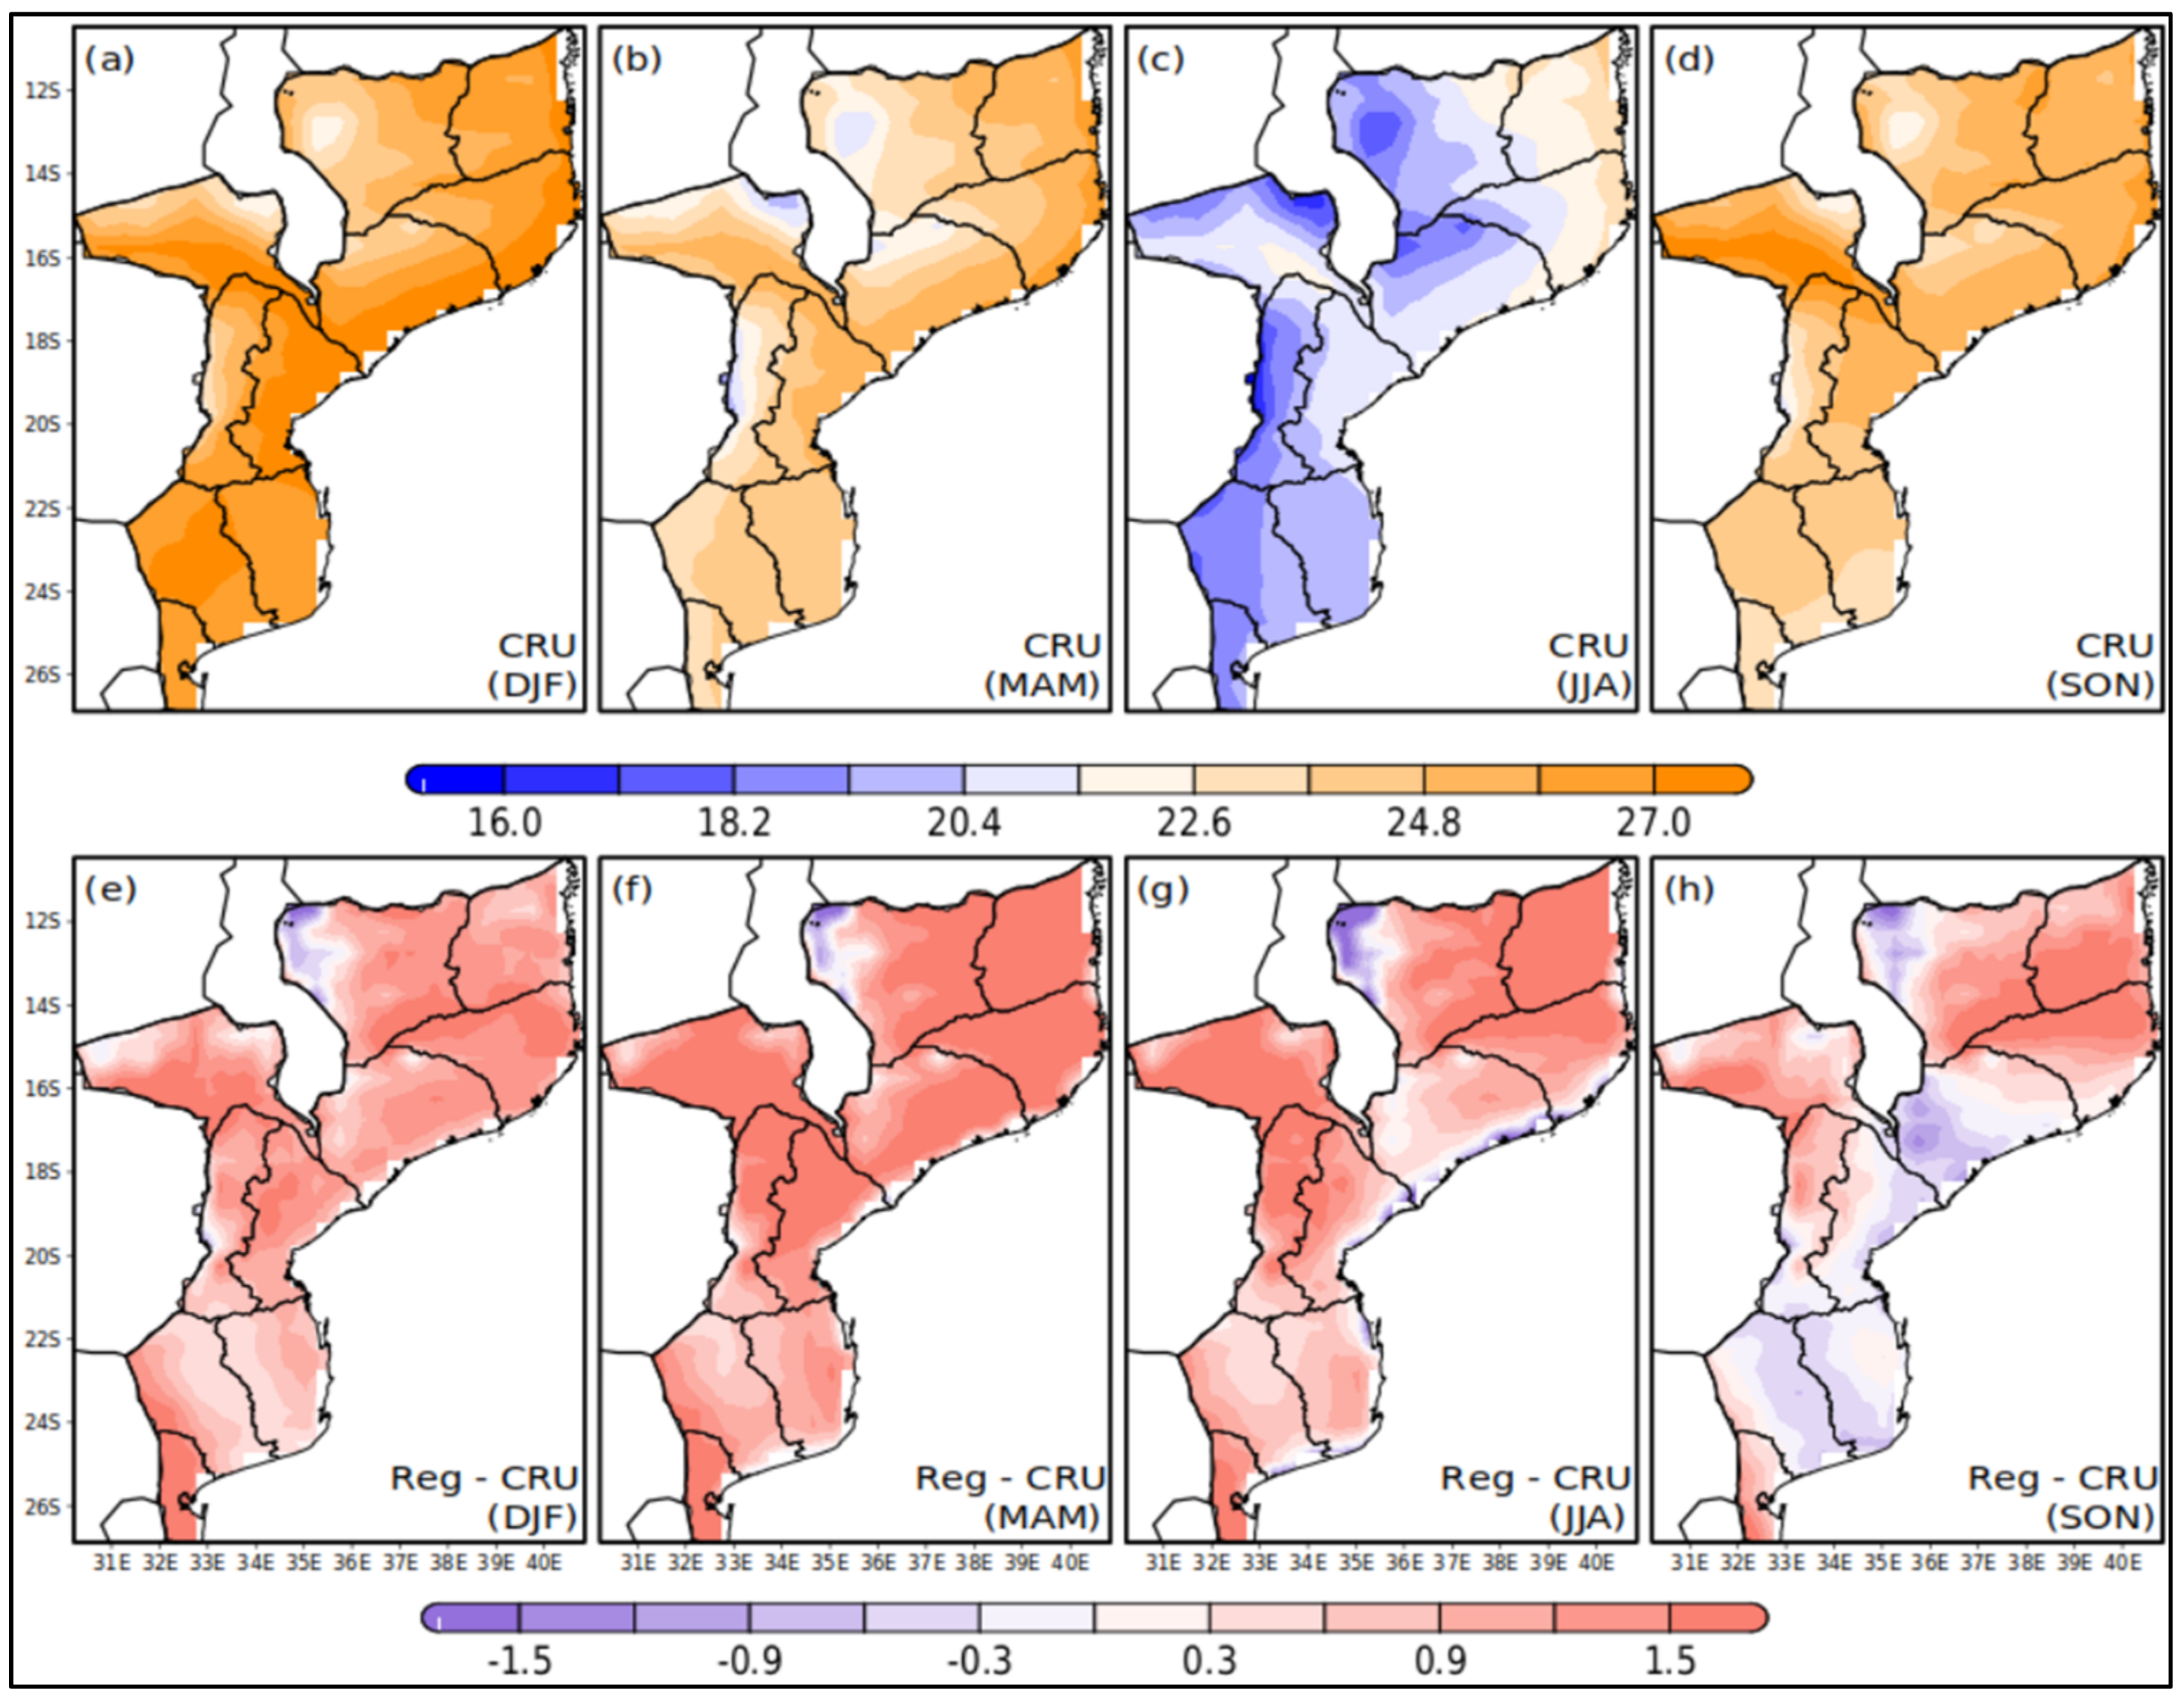
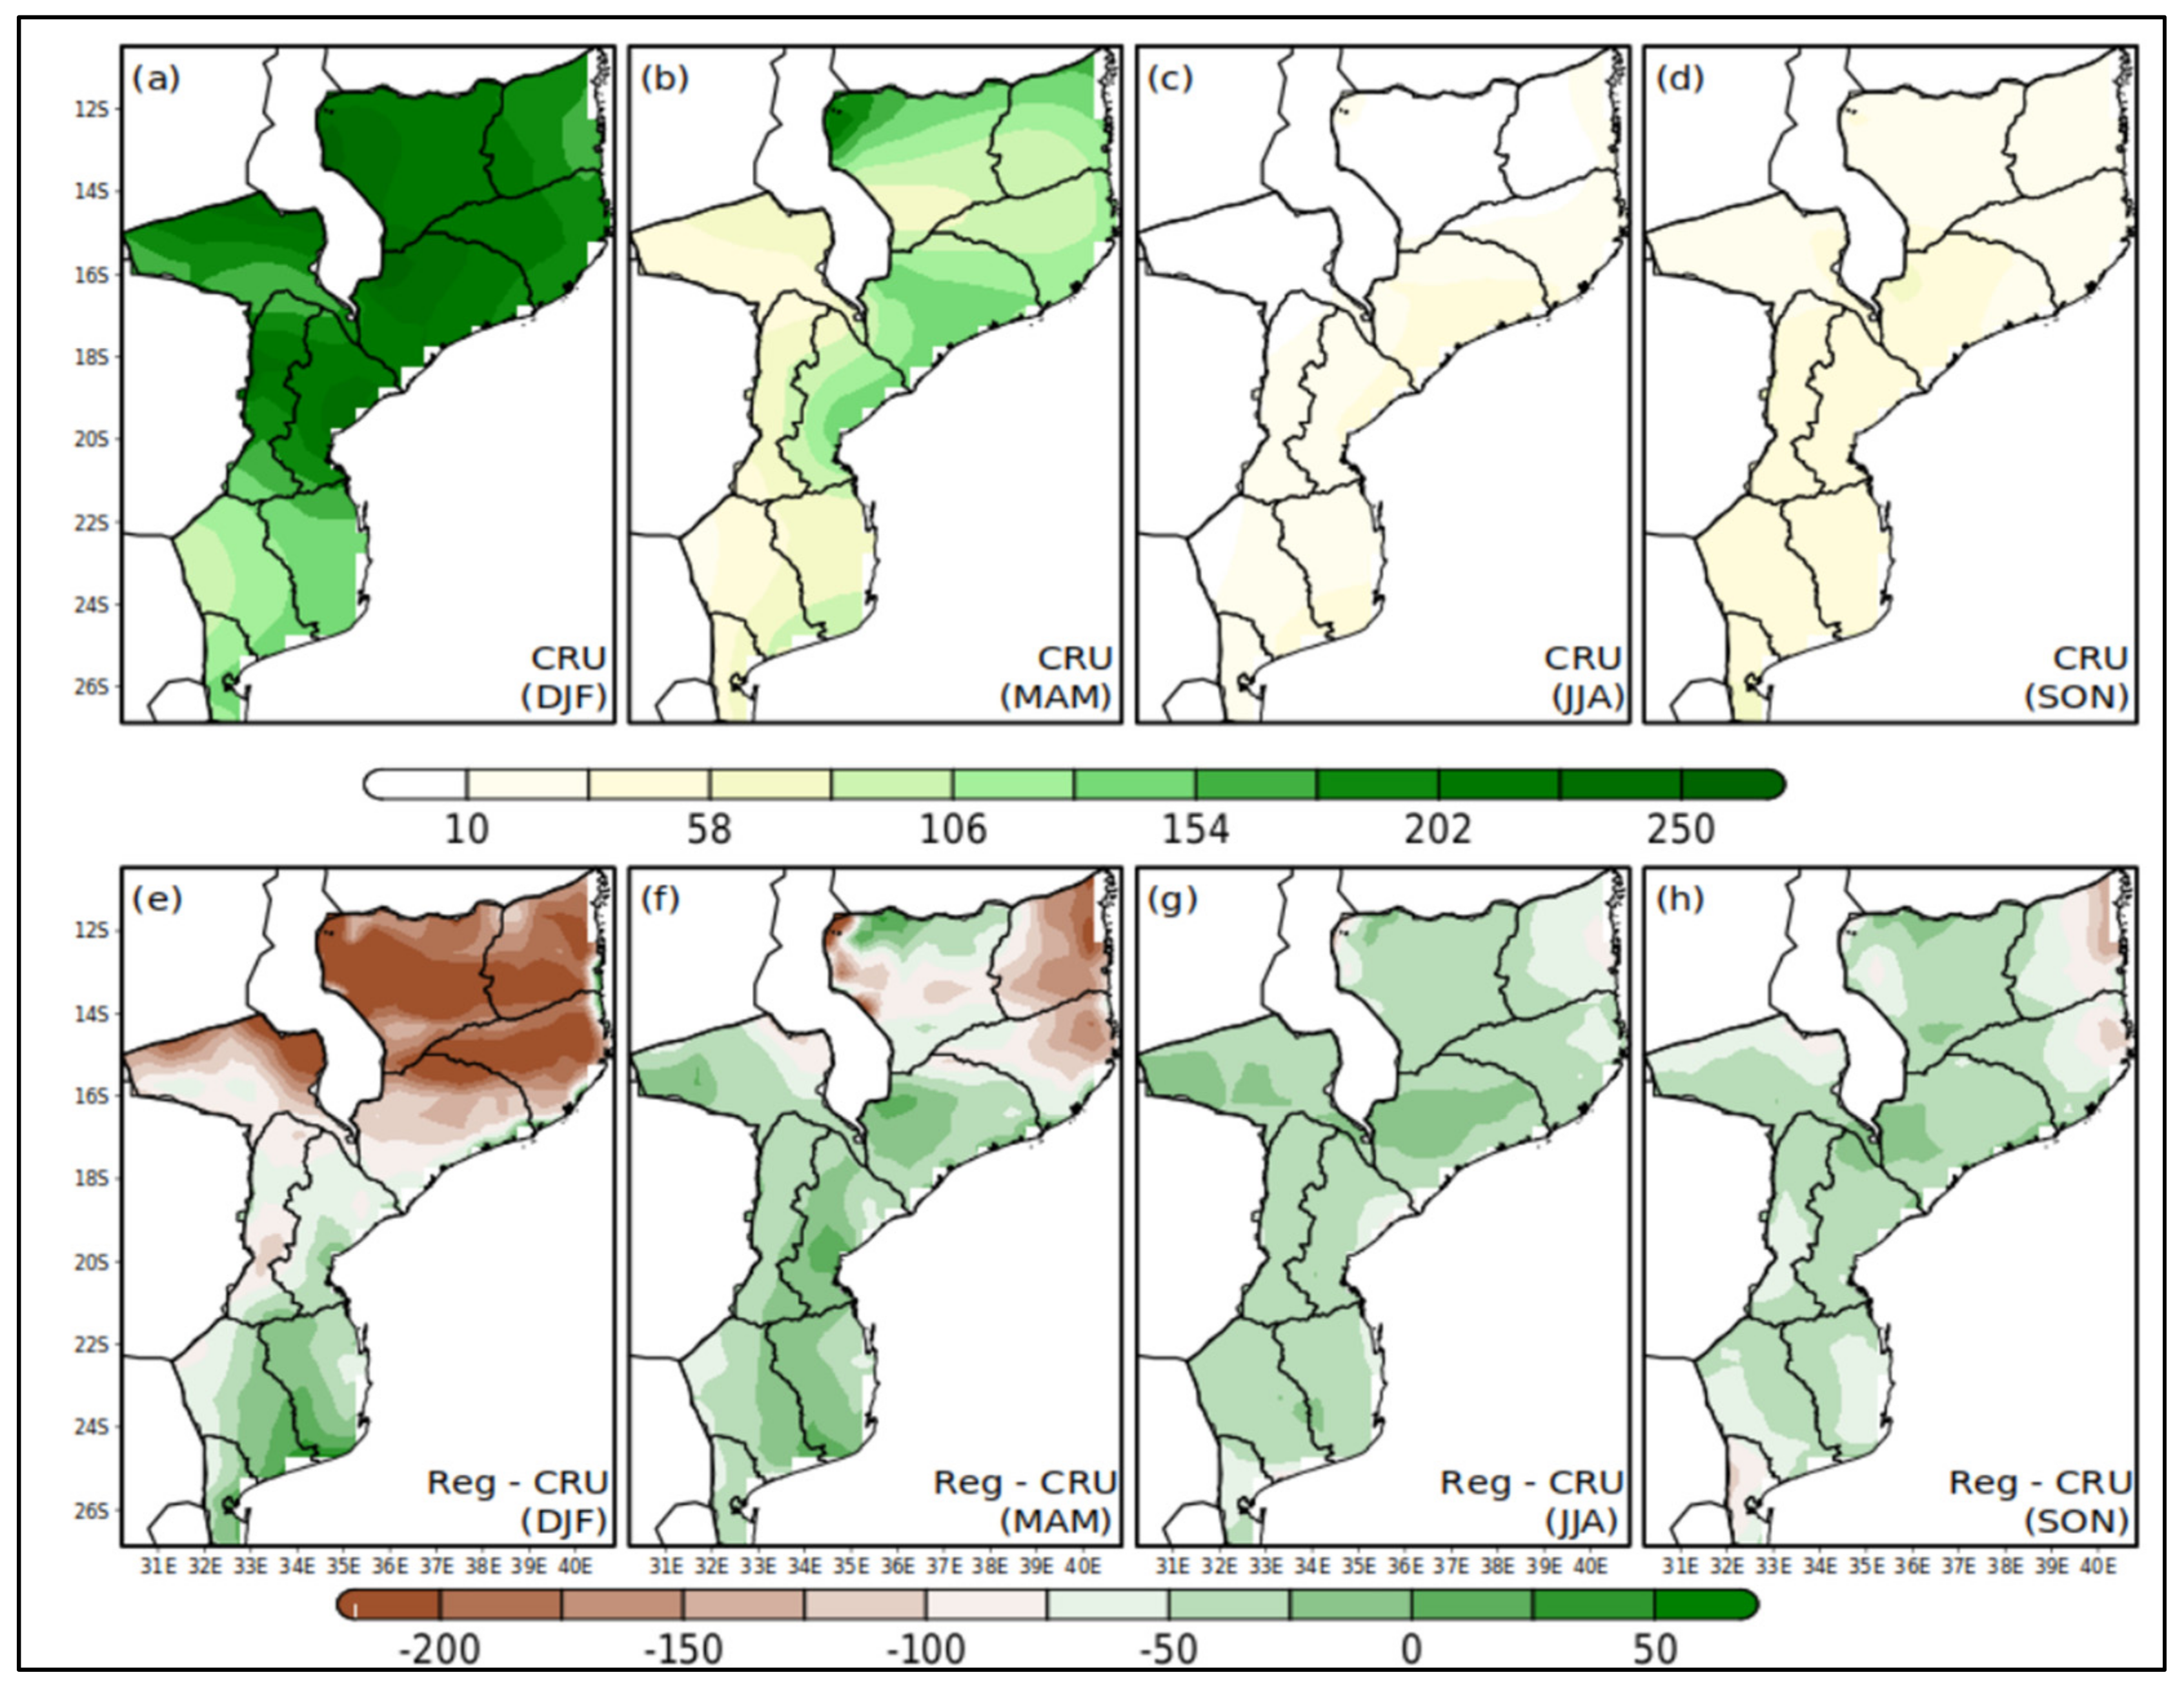
3.3. Spatial Distribution of Precipitation and Temperature

The spatial distribution of CRU and the difference relative to RegCM4 for seasonal mean air temperature and precipitation are shown in Figure 7 and Figure 8. In general, the CRU dataset represents well the spatial features of the climatological pattern of air temperature and precipitation reproducing with good levels of seasonal agreement. It is important to emphasize some notable features associated with the magnitude of both climate factors.
As discussed in the previous section, the annual and seasonal cycle of mean air temperature and precipitation follow the same pattern over the study domain, so that a dry period and slightly low temperatures occurs from middle-late autumn to the late spring of the south hemisphere (Figure 7b–d). The lowest air temperature averages (around 18 °C) recorded during the annual cycle occur in the higher altitude regions, particularly in the north of TT and QL, and west side of LC and CH WS (Figure 7c). On the other hand, the highest air temperature averages (from ±25 to ±28 °C) occurring during summer season are recorded mostly throughout north and central regions of the country, mainly along the coastal of NP, QL and BR, throughout Zambezi river basin and northwest areas of XX and IN (Figure 7a,d). There is a zonal pattern of air temperature, decreasing from the coast to the inland areas of the north and central regions (Figure 7a–d). Because of the well-defined differences in the climatological pattern between the hottest and coldest seasons in Mozambique, it is clearly observed that the spatial difference between DJF and JJA air temperature (absolute value between ±10 to ±12 °C) for each region is greater than, between MAM and SON (absolute value around ±2 °C). This observation is an indicative of greater temporal variability in air temperature from summer to winter seasons (Figure 7a–c) and lower between transition seasons (Figure 7b,d).
Meanwhile, RegCM4 generally overestimates the CRU dataset, choiring with the air temperature annual trend illustrated previously (Figure 7e–h). The mentioned exception occurs in SON quarter, with a “tripolarization” bias being positive over most of the northern and southernmost regions, and negative in the central regions of the study domain. In addition, a negative anomaly hotspot is observed in all quarters over northwest LC WS areas. It is also notable that the greater positive anomaly is observed over the regions of higher air temperatures records. The range of variation of air temperature bias leads to the idea that the regional model RegCM4 is so closed to CRU dataset.
As far as precipitation is concerned, the spatial distribution of mean seasonal captured by CRU and the relative difference from RegCM4 is showed in Figure 8. The spatio-temporal pattern of precipitation across the study domain replicate two important tropical climate characteristics: the first one is that there is a great seasonal variability of precipitation with a rainy summer season (Figure 8a,b) and a dry season (Figure 8c,d); secondly, the highest amount of precipitation occurs predominantly over the central region and the lowest in the southern region (Figure 8a–d). From this point of view, the CRU datasets estimate well the main seasonal distribution and meridional trend of precipitation. In the meantime, when it is observed, the extended austral summer season easily can be noted the higher precipitation amount occurring during DJF to MAM (Figure 8a,b) and lower from JJA to SON (Figure 8c,d). Against this backdrop, it is easily observed that the magnitude of simulated seasonal precipitation by the RegCM4, is predominantly higher than CRU (Figure 8e–h). This observation is particularly true during JJA and SON, leading to idea according with there is a trend to RegCM4 overestimate relative to CRU dataset. However, during the DJF quarter, some underestimates over part of central region and most of northern regions are observed (Figure 8e). During the months of MAM, these underestimates disappear over the central region, but the negative bias continues to be observed in most of the northern region, being more significant along the coast (Figure 8f). Note that, the magnitude of the positive bias is less than the negative bias.
It is important to note that the most important consequence of the interannual shifting of the Intertropical Convergence Zone (ITCZ) is the annual exchange of wet and dry seasons in tropical Africa. To some extent, precipitation seasonality over the northern and central regions of the study domain is explained by the intensification of the ITCZ and Congo Air Mass (CAM) (as mentioned by [44] for Congo River basin) activity in summer season and weakening of the same synoptic systems in spring season. Meanwhile, the advancement of baroclinic systems associated with the sudden convective storms over the southern region has also contributed to seasonal variability of mean precipitation. The Mascarenhas subtropical high system, predominant synoptic system over the Indian Ocean, Santa Helena subtropical high system over Atlantic and, the Tropical Temperate Trough, strongly control the seasonal evolution of precipitation mainly over the southern and central regions of Mozambique. More details about the most important synoptic systems in southern Africa region can be found in several literature (e.g., [21,45,46,47,48,49]).

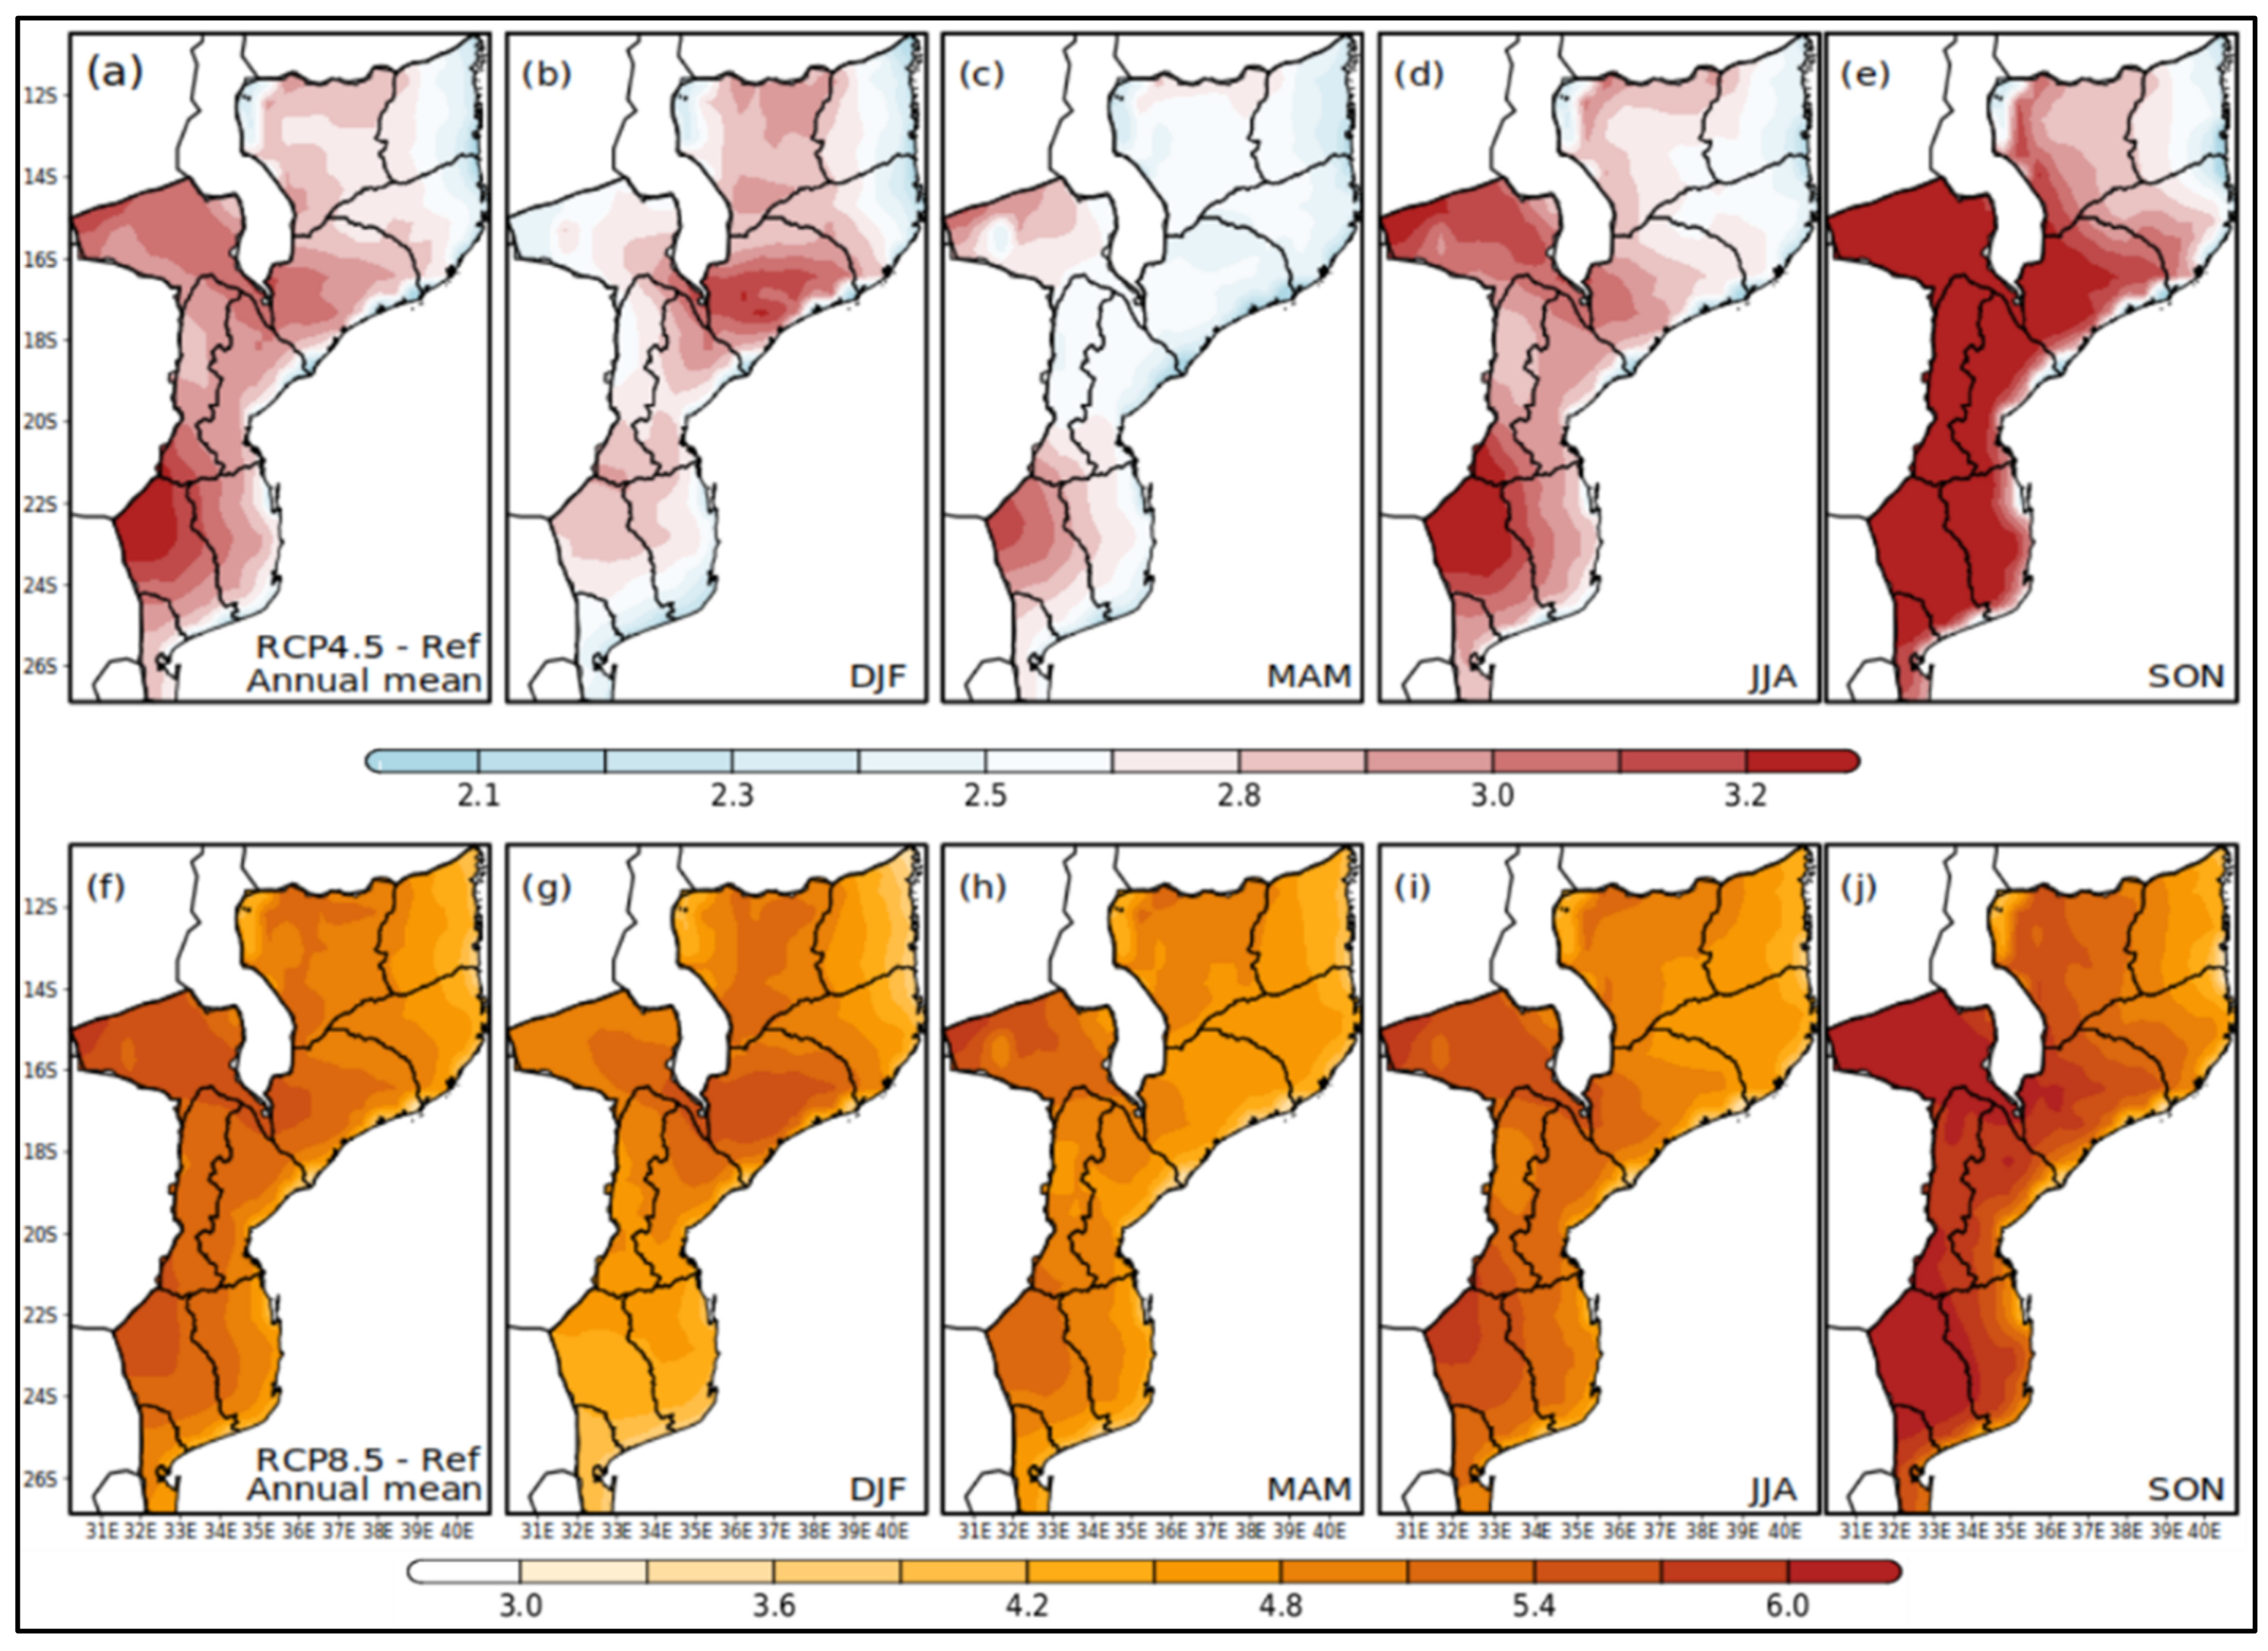
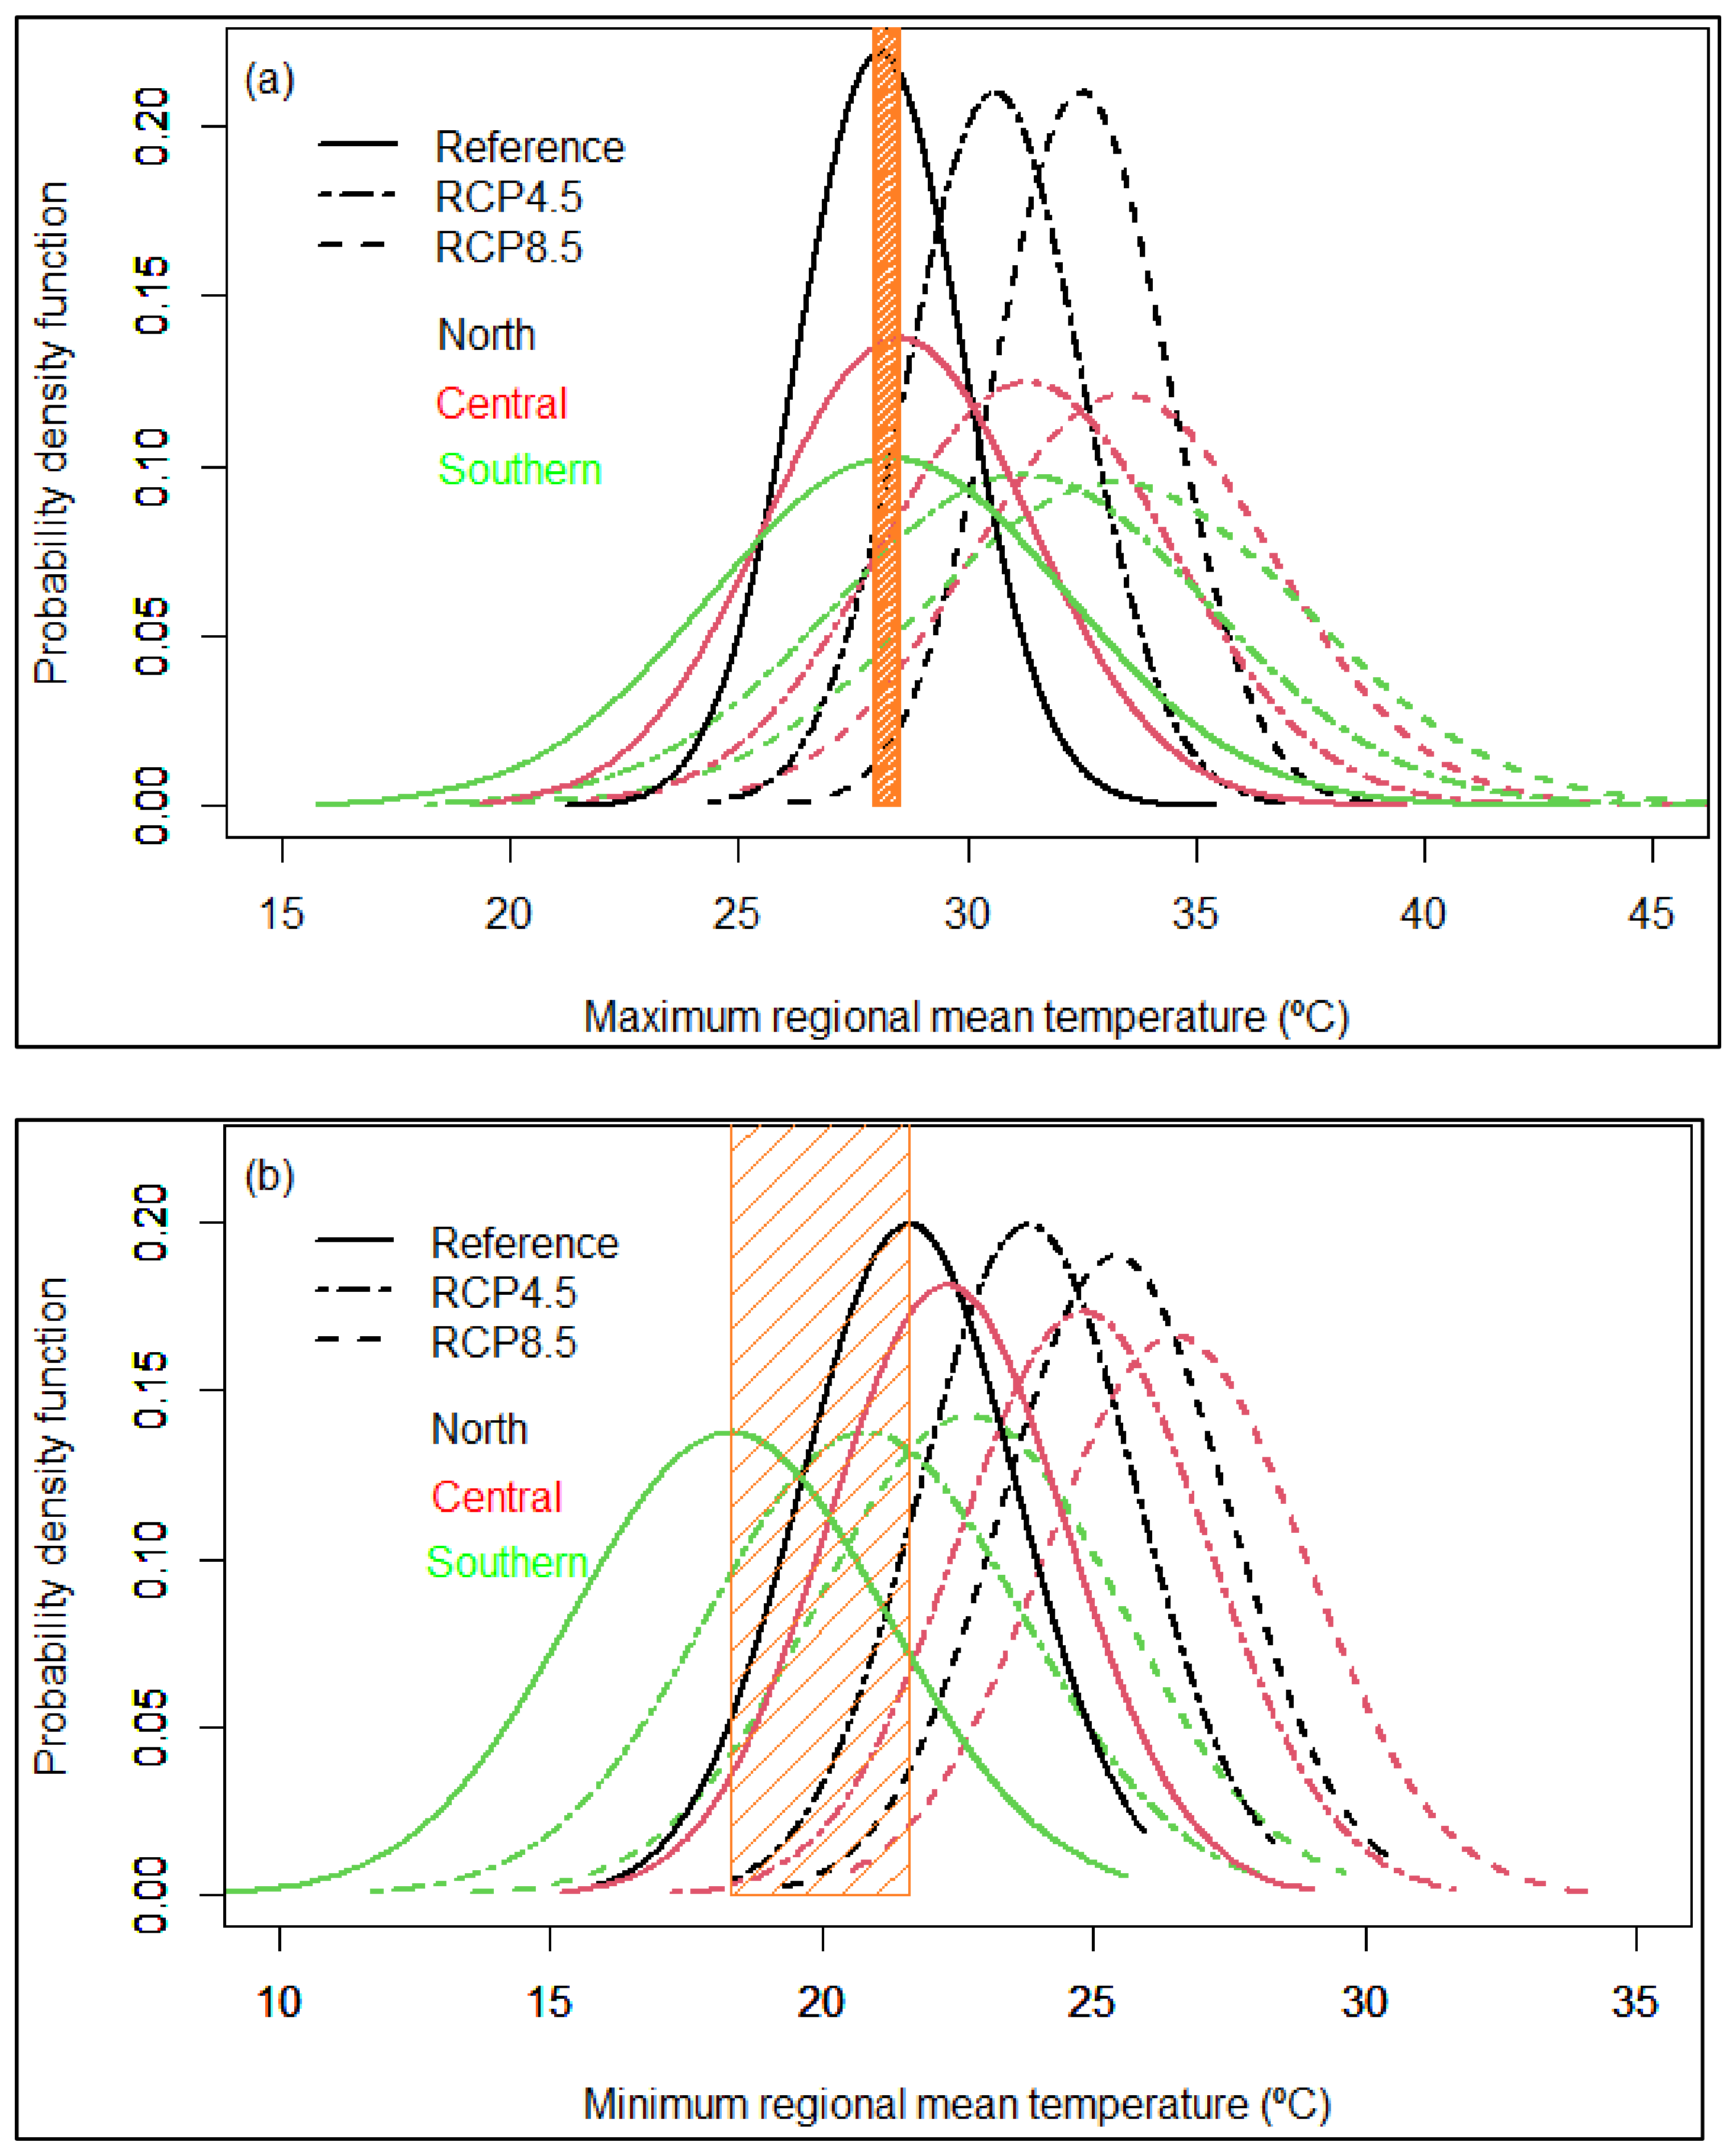
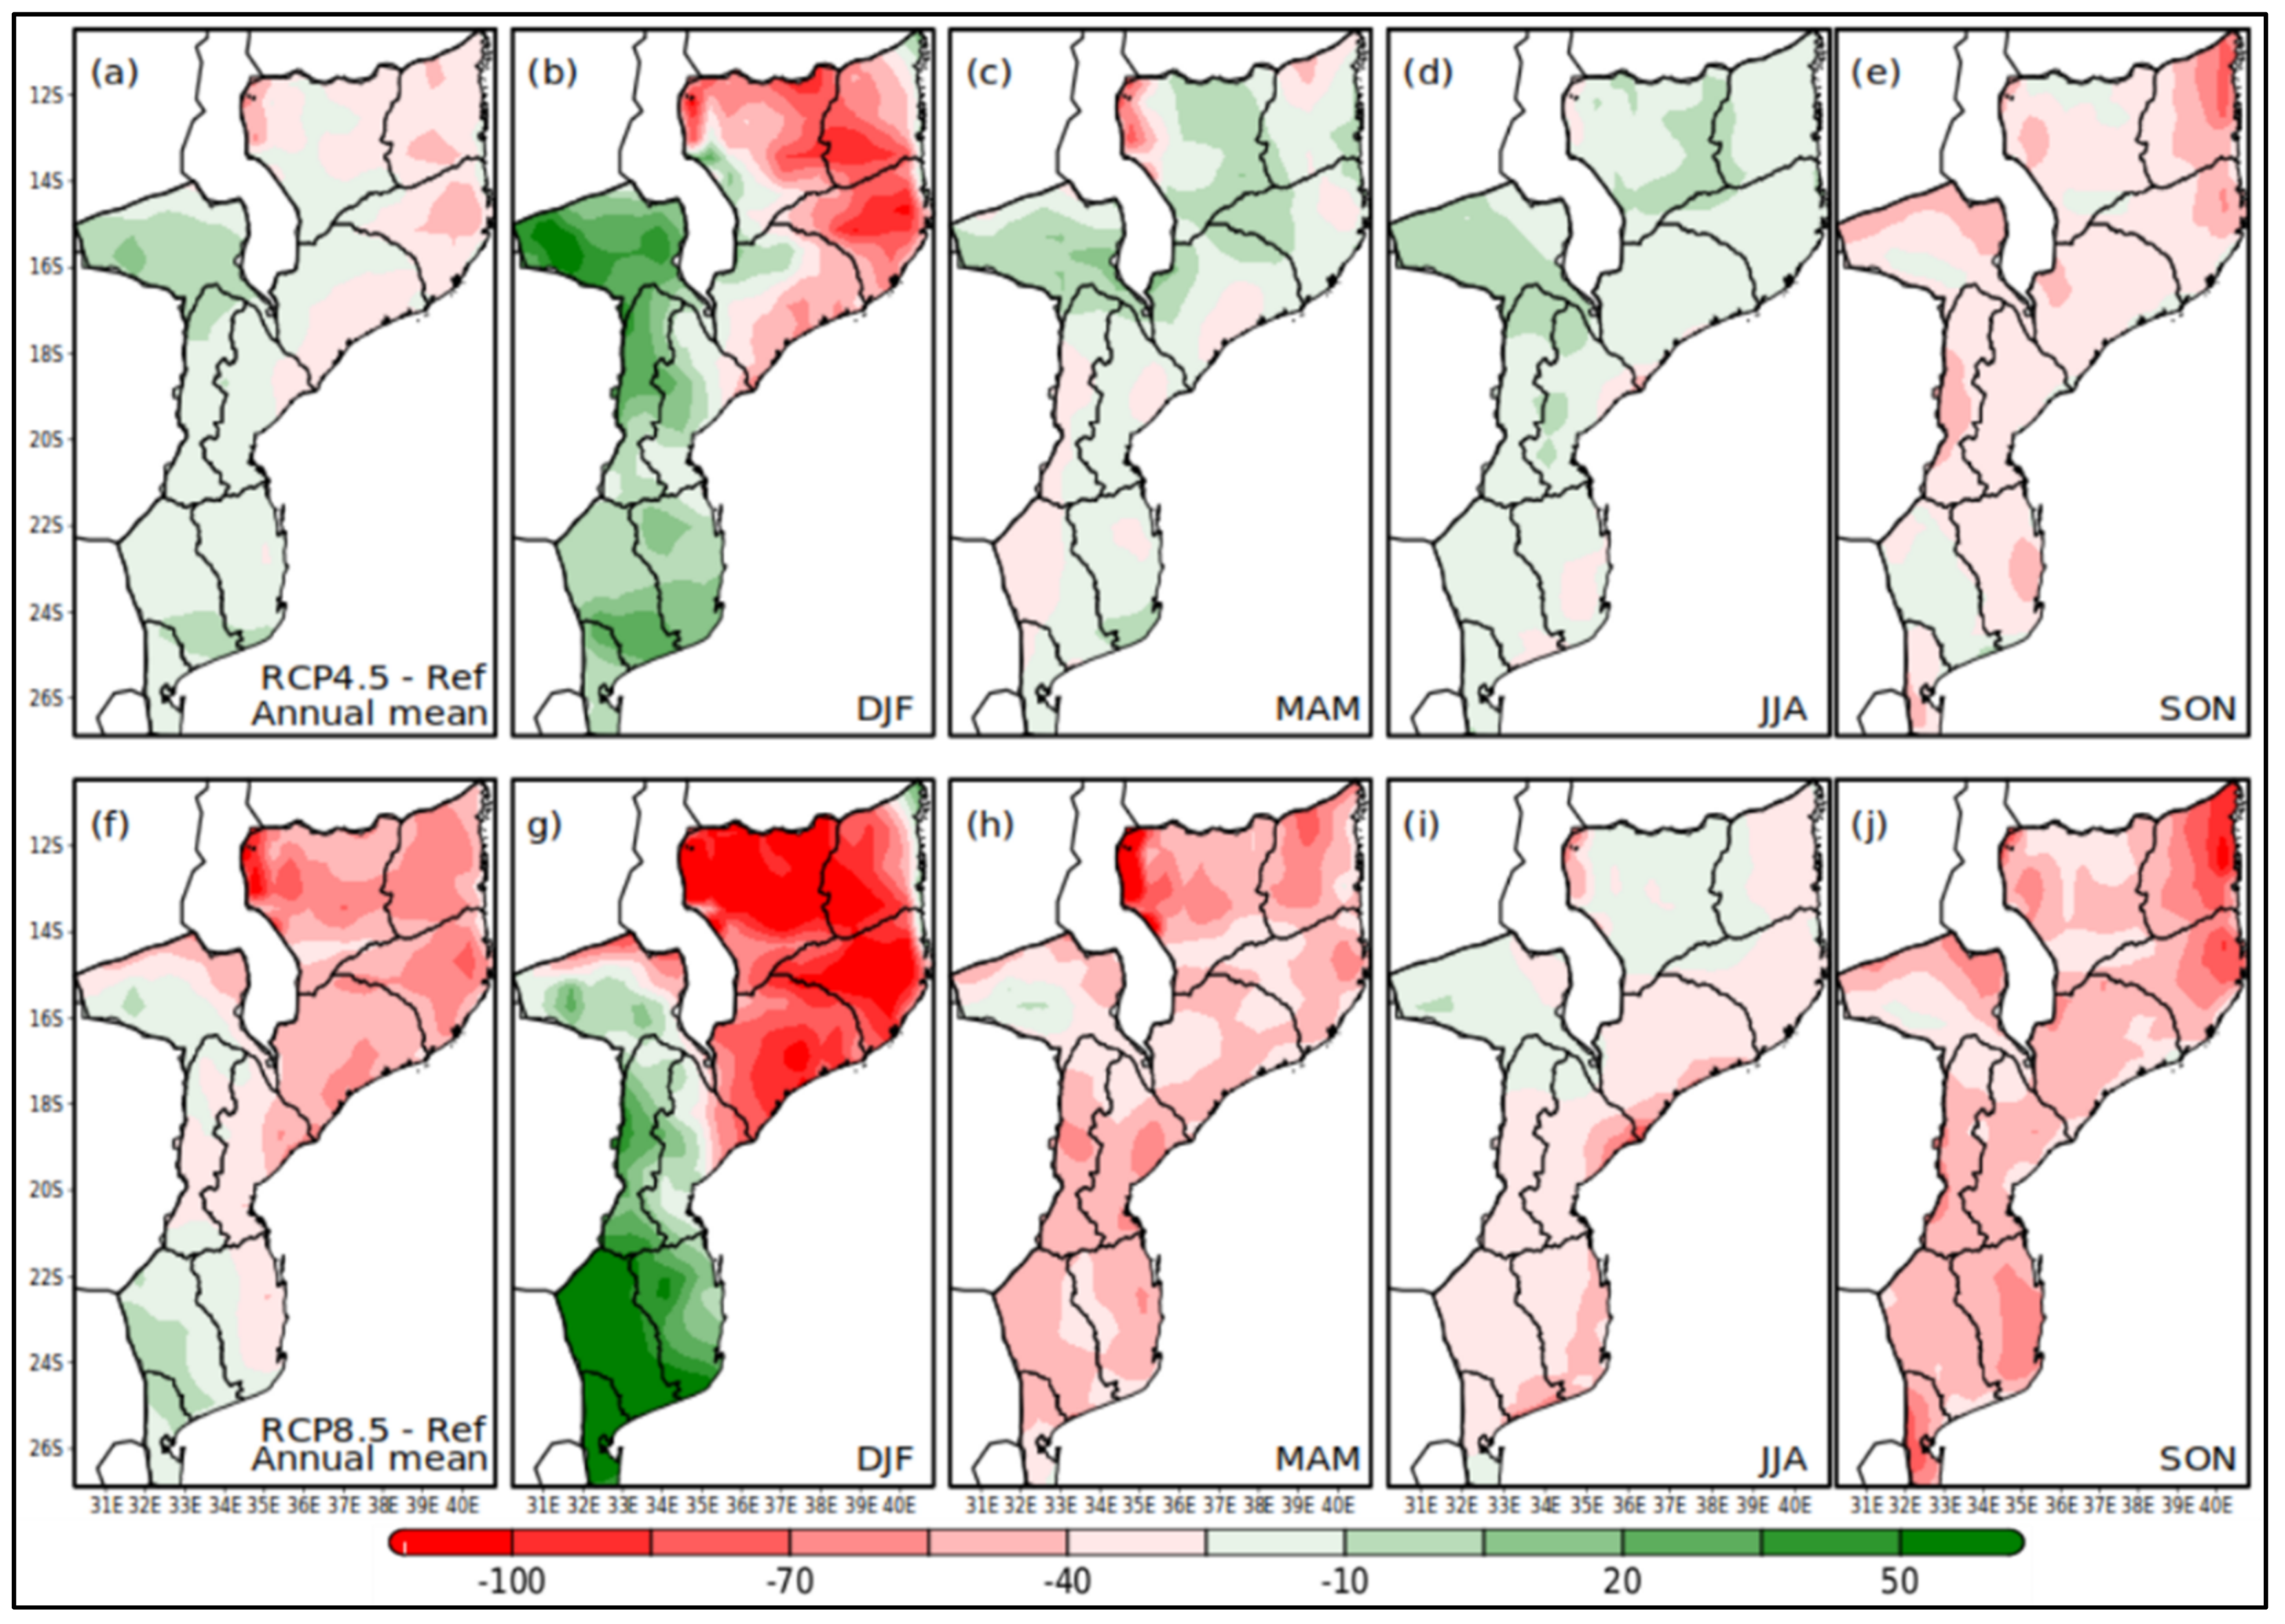
3.4. Air Temperature and Precipitation Future Signals

The projected climate change discussion begins with a comparison of spatial features of a future period relative to the reference for both climate parameters considered in this study. The mean changes in annual and seasonal simulated air temperature for future climate (2070–2099) under RCP4.5 and RCP8.5 scenarios, with respect to reference period (1971–2000), were made by averaged in time resulting in subregional maps over the study domain (Figure 9). Despite the apparent similarity among the quarters, the future warming is not uniform and spreads in space (subregionally) and time (seasonally) within the borders of Mozambique. Differences in spatial pattern of mean annual air temperature between both scenarios relative to reference period are large, being more significant under RCP8.5 (from 3 to 6 °C) than RCP4.5 (from 2.5 to little more than 3 °C) scenarios, suggesting as expected, higher increase for the strongest radiactive forcing (Figure 9a,f). A comparison between RCP4.5 and RCP8.5 (not shown) can confirm this overwhelming air temperature increase under the worst radiative forcing scenario. Regionally, these increases are particularly more pronounced (≥5 °C) over most of central region and northwestern areas of XX and IN WS, probably as a result of intensification of hot air mass coming from central region of southern Africa, and the extent of the driest areas to the inland of Gaza province. This statement is supported in [50,51], where the predominance of the Congo Air Mass over the northern areas of southern Africa region is significant, although the warming signal over the southern and northern region of Mozambique is smaller (1.5 to 3 °C for RCP4.5 and 3.0 to 4 °C for RCP8.5). Meanwhile, there is an observed hotspot region embedded northwest of XX WS with a higher warming signal (±3.0 °C for RCP4.5 and ±4.5 °C for RCP8.5). Similarly, there is an increase in the mean seasonal air temperature pattern in both scenarios but higher in RCP8.5 (between ±4 and ±6 °C), which will result in greater warming in the latter (Figure 9g–j). The most outstanding seasonal warming was observed during SON for both scenarios (3 to 4 °C for RCP4.5 and, 4.5 to 6 °C for RCP8.5), concentrated over central region, and around XX and IN in the south of the country (Figure 9e,j). This result is similar to those shown in the [52] report, according to which the highest increase (up to 3.0 °C) by 2055 is expected along Zambezi river basin and over southern regions, mainly throughout Limpopo valley. Meanwhile, for both scenarios, there is a spatial extent of warming (±4 °C) in the narrow region over most northwest areas of XX WS. It is important to point out that there is a trend of extension of semi-arid area close to southernmost region, associated with the expansion of the Kalahari desert [43,46]. This can likely be the main reason of aforementioned hotspot warming. Seasonally, the lowest increases signal (around ±3 °C for RCP4.5 and 4.5 °C for RCP8.5) in mean air temperature is observed during MAM, except over northwestern areas of XX weather station (Figure 9c,h). It is also important to stress that, during the extended summer season (SON and DJF), the smallest warm response (less than 2.5 and 3.5°C for RCP4.5 and RCP8.5, respectively) is recorded along the coast of the northern region (Figure 9b,e,g,j). This observation converges with one of the results from [7,11]. The authors of these papers indicate that the highest increase in annual mean air temperature was found over the subtropics and the smallest one over many coastal regions. A possible explanation for the abovementioned lower warming response throughout the coastal regions may be found in the predominant transport of low-level ocean moisture through the zonal wind flow which leads to increase of relative humidity amount. In fact, the regional models’ performances are affected by the boundary forcing’s, but the internal model physics is more important to subregional processes affected by topography, land use, and coastline features. Additional physical processes are also explained by [24,46]. As previously noted, under increases of global warming, the projected changes in the magnitude of air temperature over Mozambique are significantly weaker for RCP4.5 when compared to the strongest radiative forcing, RCP8.5 [11,12,53].
The results found here indicate that throughout the last third of 21st century, a large increase in air temperature likely occurs in most of the central region and a contiguous hotspot in southern region of Mozambique. Meanwhile, a relatively smaller yet still significant increase is projected to northern and southernmost regions of the country, particularly under RCP8.5. Unfortunately, as highlighted previously, there are few studies of regional simulations that have made a particular discussion at local scale within the borders of Mozambique. Nonetheless, the results found here are consistent with some of earlier studies, although the difference on spatial domain analysis: for example, refs. [1,44,54] using CMIP6 under Shared Socioeconomic Pathways to project future climate, refs. [4,7,9,11,15,55] projected future changes with the ensemble of CORDEX Regional Climate Models, and [12] testing a Geoengineering Large Ensemble to project the air temperature response to increases in Solar Radiation Response. Another interesting analysis was made in [56] to clarify the relationship between the season trend and the interanual variation of the seasonal rainfall through Empirical Orthogonal Function (EOF).
As the future climate can be indicated by both the shift in the mean and the change in the variability, it is important to investigate these changes under future scenarios relative to present climate. The seasonal mean air temperature changes illustrated in the previous figures, can be analyzed from the point of view of maximum and minimum air temperature distribution density in both radiative forcing (RCP4.5 and RCP8.5) against reference period, at the level of each subregion (north, central and south) of the study domain. For this purpose, the probability distribution function (PDF) is used here to illustrate the future climate feature shifts relative to reference period (Figure 10). In the present study, PDFs are calculated simply as normalized frequency histograms by applying its general form, as illustrated in [57]. The regional average of maximum and minimum air temperature for the reference period (vertical shaded band) ranges from 28 to 28.5 °C and from 18 to 21.6 °C respectively, with the highest value occur in the central region of Mozambique (red line tipping point most shifted to the right, Figure 10a,b). Similar results were found in the previous discussion. The modifications of the PDF are clearly illustrated by the displacement of each density function to the right-side relative to reference period. It means that, there is a gradual trend of increasing maximum and minimum daily air temperature in both future scenarios, however, greater increase is observed for RCP8.5 (broken-dash line) than for RCP4.5 (dash-dot line) as expected. Over the northern (black line), central (red line), and southern (green line) regions, the variations of regional mean maximum air temperature are 4.4, 4.9, and 4.9 °C, respectively, (Figure 10a). For RCP4.5, radiative forcing these variations are slightly smaller (ranges from 2.5 to 3 °C). In the same way, as observed for maximum air temperature, the PDF curves for minimum air temperature are displaced to the right side, relative to reference period, and a slight decrease in the tipping point from reference (solid lines) to both future scenarios (dash-dot and broken-dash lines), except for the southern region (green lines). On the other hand, the variation of regional mean minimum air temperatures under RCP8.5 (RCP4.5) are 3.8 °C (2.2 °C), 4.2 °C (2.5 °C), and 4.4 °C (2.5 °C) over the northern, central and southern regions, respectively. The increases in standard deviation (reduction in PDF curve amplitude) and regional mean (expansion of the area below the PDF curves) are an indication of increase in amplitude and frequency of maximum and minimum daily air temperatures throughout the study domain (Figure 10a,b).
Future changes in annual and seasonal mean precipitation are displayed in Figure 11. From the difference between RCP4.5 and RCP8.5 radiative forcing’s relative to reference period, there is a generalized predominance of drier response in annual mean precipitation in study domain. Under the point of view of annual time scale, the greatest reduction (between −40 and −50 mm for RCP4.5, and more than −50 mm for RCP8.5) is observed in narrow areas over the northern region and surrounding QL WS for both scenarios but, sharper under RCP8.5 (Figure 11a,f). On the other hand, the lowest reductions in mean annual precipitation is estimated over some areas around TT WS and almost entire south regions (Figure 11a,f). On the seasonal precipitation responses, there is a dipolar distribution in the core of extended summer season (DJF), with drier response (between −50 and −80 mm for RCP4.5, and more than −80 mm for RCP8.5) over north-central regions, and at the opposite pole it is observed the wettest response (±50 mm for RCP8.5) over some areas in central and most of southern regions (Figure 11b,g). Meanwhile, under RCP4.5 the difference relative to reference period is very small (between −40 and less than 40 mm). This heterogeneous precipitation pattern for DJF is unique among the seasons analyzed here. It means that, the magnitude of projected precipitation for DJF under RCP8.5 is overwhelmingly higher than RCP4.5 radiative forcing and hence stronger than the reference period.
The north–south dipolar projected changes in the precipitation during the summer season are in agreement with some previous projections made for southern Africa region (e.g., [58]), including Mozambique. For instance, ref. [1] using global CMIP6 models under strong Share Socioeconomic Pathways but with some little differences in spatial distribution over northern region, found a similar dipolarization for summer precipitation. Besides this study, ref. [15] emphasizes the dipolar response of summer precipitation but, unlike the present results, the projected precipitation changes indicates small differences in spatial pattern in the annual mean, showing a slight overestimation over the northern region of Mozambique.
Corroborating with these results [9,12,59], and stated that relative to historical periods, there are projected significant decreases in total annual mean precipitation over southern Africa up to the end of 21st century, under climate scenarios considered in each of these studies. Another similar finding was claimed in [60], but for precipitation trends analysis during present climate (1981–2017). In this study, it was stated that trends in seasonal precipitation appear positive (increasing) in the southernmost third and western areas of the country and moderately negative (decreasing) in the northern provinces. In the same climate report, it is stated that the variation of precipitation trends along the season indicates that the increase in seasonal precipitation in the south and west of the country mostly arises from increases in December and January, already the wettest period of the season. Additionally, the decrease in seasonal precipitation in the central and north of the country are mostly due to decreases in early season rainfall. Likewise, projected changes in mean precipitation for 2071–2100 relative to 1961–1990 assessed in [11] showed similar results in the annual time scale, but small differences come up on the seasonal time scale relative to the results presented here. For instance, ref. [11] stated that all RCP scenarios point to above average precipitation in much of Mozambique during the DJF season. This statement is far from the dipolar pattern of seasonal precipitation presented here.
Unlike the dipolarization projected to the core of extended summer season (DJF), during the months of MAM, JJA, and SON, the spatial response is similar throughout the country with the drier response being predominant, but more sharply in the spring (Figure 11e,j) than autumn (Figure 11c,h). On the other hand, it is observed that there is a very small change in precipitation (small drier response) during the winter season (Figure 11d,i) indicating that the future seasonal precipitation will be closed to the winter pattern as the reference period. Another point worth highlighting from the results presented here is that the drier response in annual mean over southern region of Mozambique is mainly a result of drier response during autumn (MAM) and spring (SON) season, while over the northern-central is due to drier signal in both, spring as well as summer season.
Although the wet response in summer season over southern region of Mozambique, mainly under RCP8.5 radiative forcing (showed in Figure 11), the dryer response year-round is overwhelmingly uppermost throughout the study domain. This general result can be seen by PDF curves for regional maximum and average precipitation distribution shown in Figure 12a,b, respectively. The maximum and mean precipitation under reference period ranges from 23.7 to 24.7 mm/day and from 3.7 to 5.3 mm/day, respectively (Figure 12a,b, vertical shaded band). The tipping points for both maximum and average precipitation over each of the three regions are shifted to the left side relative to the reference period, meaning that there is a generalized drier response throughout the study domain. However, the most significant effect of this negative trend is observed over central (red lines) and northern (black lines) regions of Mozambique, under RCP8.5 than RCP4.5.
This result can be interpreted as higher standard deviation (smaller amplitude of the PDF curves) and higher average, hence, greater dispersion of rainfall compared to regional average. Otherwise, the distribution of regional precipitation (maximum and averaged) is more closed to the reference over the southern region (green line), under RCP4.5 (Figure 12a,b). Although the distribution density curves between both future scenarios are similar (dashed-dot line for RCP4.5 and broken-dash line for RCP8.5), the most significant negative effect occurs with RCP8.5 radiative forcing. The present results indicate that the effect of projected changes in precipitation are enhanced for the high-emission scenario, being more significant during austral summer season and, over the central and northern regions of Mozambique. It is also important to point out that small variations in the absolute amount of precipitation in several short time ranges can lead to significant changes in the climate pattern over the country.

4. Conclusions

This study investigated the performance of regional model RegCM4, in reproducing present climatology and assessing the simulated future changes under two Representative Concentration Pathways, RCP4.5 and RCP8.5, in Mozambique. The discussion presented were performed concerning to the spatial and temporal pattern of the air temperature and precipitation during the austral summer season.
In the validation of simulated present climate, the regional model RegCM4 performs quite well the air temperature and precipitation climatology in particular picking up its annual trend and spatio-temporal variability year-round, over the study domain. However, although the model shows a similar performance when compared to observed climatological weather stations and interpolated CRU datasets, there are biases found for both parameters in different magnitudes. The most significant biases of the regional model were observed for the amplitude and seasonal magnitude of precipitation climatology, mainly during the summer season. Although there are uncertainties related to the air temperature overestimation and precipitation underestimation, the RegCM4 generates higher correlation coefficients relative to the weather station and CRU datasets. Note that, when estimating the confidence interval of a set of weather stations or grid data the spatial correlation may affect the evaluation of the significance [61].
In the present research, we found indications of increase in amplitude and frequency of maximum and minimum of daily air temperatures for the last third of the 21st century, under both radiative forcing’s (RCP4.5 and RCP8.5), throughout the study domain. In addition, this increase is more pronounced under RCP8.5 and over the inland of central region of Mozambique. Regarding to precipitation, the annual mean for far future (2070–2099) shows a drier response throughout the country, particularly over northern and restricted areas of the central region. The changes in the spatial distribution of precipitation during the core of extended summer season, reveals a meridional dipolar feature mainly under RCP8.5 scenario with drier response over north-center and wettest response over southern region of the country. Even if there is no clear and significant trend in seasonal precipitation for some restricted regions, such as central region of Mozambique, the hottest response is overwhelming significant in most of the study domain.
The findings support the conclusion that climate change projections based on regional models add important spatial details over the local scale, which needs to be properly characterized. However, the restricted study domain did not allow the analysis of systematic errors resulting from parameterizations or setup of the regional model used here.

Author Contributions

Conceptualization and methodology, T.C.A.S., S.E.T.F. and A.D.; software, S.E.T.F.; validation, formal analysis, investigation, T.C.A.S., S.E.T.F. and A.D.; resources, S.E.T.F. and A.D., data curation, S.E.T.F. and A.D.; writing—original draft preparation, T.C.A.S., S.E.T.F. and A.D.; writing—review and editing, T.C.A.S., S.E.T.F. and A.D.; visualization, T.C.A.S., S.E.T.F. and A.D.; supervision, S.E.T.F. and A.D.; project administration, S.E.T.F. and A.D.; funding acquisition, T.C.A.S., S.E.T.F. and A.D. All authors have read and agreed to the published version of the manuscript.

Funding

This research was funded by National Council for Scientific Technological Development (CNPq-Brazil).

Institutional Review Board Statement

Not applicable.

Informed Consent Statement

Not applicable.

Data Availability Statement

The CRU interpolated dataset can be found at “Dataset Record: CRU TS4.05: Climatic Research Unit (CRU) Time-Series (TS) version 4.05 of high-resolution gridded data of month-by-month variation in climate (January 1901–December 2020) (ceda.ac.uk)”; the weather stations dataset can be found at “INAM—National Institute of Meteorology”.

Acknowledgments

Telmo Cosme A. Sumila was supported a grant from National Council for Scientific Technological Development (CNPq-Brazil). The authors wish to thank the Federal University of Santa Maria for providing partial funding for this research.

Conflicts of Interest

The authors declare no conflict of interest.

References

  1. Almazroui, M.; Saeed, F.; Saeed, S.; Islam, M.N.; Ismail, M.; Klutse, N.A.B.; Siddiqui, M.H. Projected Change in Temperature and Precipitation Over Africa from CMIP6. Earth Syst. Environ. 2020, 4, 455–475. [Google Scholar] [CrossRef]
  2. Blunden, J.; Boyer, T. State of the Climate in 2020. Bull. Amer. Meteor. Soc. 2020, 102, Si-S475. [Google Scholar] [CrossRef]
  3. Pachauri, R.K.; Meyer, L.A. (Eds.) Climate Change 2014: Synthesis Report. Contribution of Working Groups I, II and III to the Fifth Assessment Report of the Intergovernmental Panel on Climate Change; IPCC: Geneva, Switzerland, 2014; 151p. [Google Scholar]
  4. Russo, S.; Marchese, A.F.; Sillmann, J.; Immé, G. When will unusual heat waves become normal in a warming Africa? Environ. Res. Lett. 2016, 11, 054016. [Google Scholar] [CrossRef]
  5. Déqué, M.; Calmanti, S.; Christensen, O.B.; Aquila, A.D.; Maule, C.F.; Haensler, A.; Nikulin, G.; Teichmann, C. A multi-model climate response over tropical Africa at +2 °C. Clim. Serv. 2017, 7, 87–95. [Google Scholar] [CrossRef] [Green Version]
  6. Lennard, C.; Nikulin, G.; Dosio, A.; Moufouma-Okia, W. On the need for regional climate information over Africa under varying levels of global warming. Environ. Res. Lett. 2018, 13, 060401. [Google Scholar] [CrossRef]
  7. Nikulin, G.; Lennard, C.; Dosio, A.; Kjellström, E.; Chen, Y.; Hänsler, A.; Kupiainen, M.; Laprise, R.; Mariotti, L.; Maule, C.F.; et al. The effects of 1.5 and 2 degrees of global warming on Africa in the CORDEX ensemble. Environ. Res. Lett. 2018, 13, 065003. [Google Scholar] [CrossRef]
  8. WMO. State of the Climate in Africa; WMO: Geneva, Switzerland, 2020; Available online: https://library.wmo.int/doc_num.php?explnum_id=10929 (accessed on 25 November 2022).
  9. Dosio, A. Projection of temperature and heat waves for Africa with an ensemble of CORDEX Regional Climate Models. Clim. Dyn. 2016, 49, 493–519. [Google Scholar] [CrossRef] [Green Version]
  10. Hulme, M.; Doherty, R.; Ngara, T.; New, M.; Lister, D. African climate change: 1900–2100. Clim. Res. 2001, 17, 145–168. [Google Scholar] [CrossRef] [Green Version]
  11. Mavume, A.; Banze, B.; Macie, O.; Queface, A. Analysis of Climate Change Projections for Mozambique under the Representative Concentration Pathways. Atmosphere 2021, 12, 588. [Google Scholar] [CrossRef]
  12. Pinto, I.; Jack, C.; Lennard, C.; Tilmes, S.; Odoulami, R.C. Africa’s Climate Response to Solar Radiation Management with Stratospheric Aerosol. Geophys. Res. Lett. 2020, 47, e2019GL086047. [Google Scholar] [CrossRef]
  13. Intergovernmental Panel on Climate Change. Fourth Assessment Report; Cambridge University Press: Cambridge, UK; Geneva, Switzerland, 2007. [Google Scholar]
  14. James, R.; Washington, R. Changes in African temperature and precipitation associated with degrees of global warming. Clim. Chang. 2012, 117, 859–872. [Google Scholar] [CrossRef]
  15. Maure, G.; Pinto, I.; Ndebele-Murisa, M.; Muthige, M.; Lennard, C.; Nikulin, G.; Dosio, A.; Meque, A. The southern African climate under 1.5 °C and 2 °C of global warming as simulated by CORDEX regional climate models. Environ. Res. Lett. 2018, 13, 065002. [Google Scholar] [CrossRef]
  16. Pinto, I.; Jack, C.; Hewitson, B. Process-based model evaluation and projections over southern Africa from Coordinated Regional Climate Downscaling Experiment and Coupled Model Intercomparison Project Phase 5 models. Int. J. Clim. 2018, 38, 4251–4261. [Google Scholar] [CrossRef]
  17. Van Logchem, B.; Queface, A.J. (Eds.) Respondendo as Mudanças Climáticas em Moçambique: Relatório Síntese; INGC: Maputo, Mozambique, 2012. [Google Scholar]
  18. Steynor, A.; Pasquini, L. Informing climate services in Africa through climate change risk perceptions. Clim. Serv. 2019, 15, 100112. [Google Scholar] [CrossRef]
  19. Monerie, P.-A.; Robson, J.; Dong, B.; Dieppois, B.; Pohl, B.; Dunstone, N. Predicting the seasonal evolution of southern African summer precipitation in the DePreSys3 prediction system. Clim. Dyn. 2018, 52, 6491–6510. [Google Scholar] [CrossRef] [Green Version]
  20. Tamoffo, A.T.; Moufouma-Okia, W.; Dosio, A.; James, R.; Pokam, W.M.; Vondou, D.A.; Fotso-Nguemo, T.-C.; Guenang, G.M.; Kamsu-Tamo, P.H.; Nikulin, G.; et al. Process-oriented assessment of RCA4 regional climate model projections over the Congo Basin under 1.5 °C and 2 °C global warming levels: Influence of regional moisture fluxes. Clim. Dyn. 2019, 53, 1911–1935. [Google Scholar] [CrossRef]
  21. Yuan, C.; Tozuka, T.; Landman, W.; Yamagata, T. Dynamical seasonal prediction of Southern African summer precipitation. Clim. Dyn. 2013, 42, 3357–3374. [Google Scholar] [CrossRef] [Green Version]
  22. Giorgi, F.; Coppola, E.; Solmon, F.; Mariotti, L.; Sylla, M.B.; Bi, X.; Elguindi, N.; Diro, G.T.; Nair, V.; Giuliani, G.; et al. RegCM4: Model description and preliminary tests over multiple CORDEX domains. Clim. Res. 2012, 52, 7–29. [Google Scholar] [CrossRef] [Green Version]
  23. Otieno, V.; Anyah, R. Effects of land use changes on climate in the Greater Horn of Africa. Clim. Res. 2012, 52, 77–95. [Google Scholar] [CrossRef] [Green Version]
  24. Sylla, M.; Giorgi, F.; Stordal, F. Large-scale origins of rainfall and temperature bias in high-resolution simulations over southern Africa. Clim. Res. 2012, 52, 193–211. [Google Scholar] [CrossRef]
  25. Diffenbaugh, N.S.; Pal, J.S.; Trapp, R.J.; Giorgi, F. Fine-scale processes regulate the response of extreme events to global climate change. Proc. Natl. Acad. Sci. USA 2005, 102, 15774–15778. [Google Scholar] [CrossRef] [PubMed] [Green Version]
  26. Giorgi, F.; Mearns, L.O. Introduction to special section: Regional Climate Modeling Revisited. J. Geophys. Res. Atmos. 1999, 104, 6335–6352. [Google Scholar] [CrossRef]
  27. Koné, B.; Diedhiou, A.; Touré, N.E.; Sylla, M.B.; Giorgi, F.; Anquetin, S.; Bamba, A.; Diawara, A.; Kobea, A.T. Sensitivity study of the regional climate model RegCM4 to different convective schemes over West Africa. Earth Syst. Dyn. 2018, 9, 1261–1278. [Google Scholar] [CrossRef] [Green Version]
  28. Maity, S. Comparative assessment of two RegCM versions in simulating Indian Summer Monsoon. J. Earth Syst. Sci. 2020, 129, 1–23. [Google Scholar] [CrossRef]
  29. Mariotti, L.; Diallo, I.; Coppola, E.; Giorgi, F. Seasonal and intraseasonal changes of African monsoon climates in 21st century CORDEX projections. Clim. Chang. 2014, 125, 53–65. [Google Scholar] [CrossRef]
  30. Önol, B. Effects of coastal topography on climate: High-resolution simulation with a regional climate model. Clim. Res. 2012, 52, 159–174. [Google Scholar] [CrossRef] [Green Version]
  31. Ozturk, T.; Turp, M.T.; Türkeş, M.; Kurnaz, L. Future projections of temperature and precipitation climatology for CORDEX-MENA domain using RegCM4.4. Atmos. Res. 2018, 206, 87–107. [Google Scholar] [CrossRef]
  32. Steiner, A.L.; Pal, J.S.; Rauscher, S.A.; Bell, J.L.; Diffenbaugh, N.S.; Boone, A.; Sloan, L.C.; Giorgi, F. Land surface coupling in regional climate simulations of the West African monsoon. Clim. Dyn. 2009, 33, 869–892. [Google Scholar] [CrossRef]
  33. Collins, W.J.; Bellouin, N.; Doutriaux-Boucher, M.; Gedney, N.; Hinton, T.C.; Jones, D.; Liddicoat, S.; Martin, G.; O’Connor, F.; Kim, J.; et al. Evaluation of HadGEM2 Model, Technical Note 74; Meteorological Office Hadley Centre: Exter, UK, 2008; p. 47.
  34. Collins, W.J.; Bellouin, N.; Doutriaux-Boucher, M.; Gedney, N.; Halloran, P.; Hinton, T.; Hughes, J.; Jones, C.D.; Joshi, M.; Liddicoat, S.; et al. Development and evaluation of an Earth-System model–HadGEM2. Geosci. Model Dev. 2011, 4, 1051–1075. [Google Scholar] [CrossRef] [Green Version]
  35. Jubb, A.I.; Canadell, P.; Dix, M. Representative Concentration Pathways (RCPs). Aust. Clim. Chang. Sci. Program 2013, 3, 5–7. Available online: www.cawcr.gov.au/projects/climatechange/ (accessed on 25 November 2022).
  36. Meinshausen, M.; Smith, S.J.; Calvin, K.; Daniel, J.S.; Kainuma, M.L.; Lamarque, J.F.; Matsumoto, K.; Montzka, S.A.; Raper, S.C.; Riahi, K.; et al. The RCP greenhouse gas concentrations and their extensions from 1765 to 2300. Clim. Chang. 2011, 109, 213–241. [Google Scholar] [CrossRef]
  37. Moss, R.H.; Edmonds, J.A.; Hibbard, K.A.; Manning, M.R.; Rose, S.K.; Van Vuuren, D.P.; Carter, T.R.; Emori, S.; Kainuma, M.; Kram, T. The next generation of scenarios for climate change research and assessment. Nature 2010, 463, 747–756. [Google Scholar] [CrossRef] [PubMed]
  38. Van Vuuren, D.P.; Edmonds, J.; Kainuma, M.; Riahi, K.; Thomson, A.; Hibbard, K.; Hurtt, G.C.; Kram, T.; Krey, V.; Lamarque, J.F.; et al. The representative concentration pathways: An overview. Clim. Chang. 2011, 109, 5–31. [Google Scholar] [CrossRef]
  39. Engelbrecht, C.J.; Engelbrecht, F.A. Shifts in Köppen-Geiger climate zones over southern Africa in relation to key global temperature goals. Arch. Meteorol. Geophys. Bioclimatol. Ser. B 2015, 123, 247–261. [Google Scholar] [CrossRef]
  40. Filho, L.C.D.A.L.; Bassoi, L.H.; De Faria, M.A. Variabilidade espacial e estabilidade temporal do armazenamento de água em solo arenoso cultivado com videiras irrigadas. Irriga 2016, 1, 319–340. [Google Scholar] [CrossRef] [Green Version]
  41. Harris, I.; Osborn, T.J.; Jones, P.; Lister, D. Version 4 of the CRU TS monthly high-resolution gridded multivariate climate dataset. Sci. Data 2020, 7, 1–18. [Google Scholar] [CrossRef] [PubMed] [Green Version]
  42. Zeng, X.; Zhao, M.; Dickinson, R.E. Intercomparison of bulk aerodynamic algoriths for the computation of sea surface fluxes using toga coare and tao data. J. Clim. 1998, 11, 2628–2644. [Google Scholar] [CrossRef]
  43. Nikiema, P.M.; Sylla, M.B.; Ogunjobi, K.; Kebe, I.; Gibba, P.; Giorgi, F. Multi-model CMIP5 and CORDEX simulations of historical summer temperature and precipitation variabilities over West Africa. Int. J. Clim. 2016, 37, 2438–2450. [Google Scholar] [CrossRef]
  44. Creese, A.; Washington, R. Using qflux to constrain modeled Congo Basin rainfall in the CMIP5 ensemble. J. Geophys. Res. Atmos. 2016, 121, 13415–13442. [Google Scholar] [CrossRef]
  45. Cook, K.H. The South Indian convergence zone and interannual rainfall variability over Southern Africa. J. Clim. 2000, 13, 3789–3804. [Google Scholar] [CrossRef]
  46. Eckardt, F.; Soderberg, K.; Coop, L.; Muller, A.; Vickery, K.; Grandin, R.; Jack, C.; Kapalanga, T.; Henschel, J. The nature of moisture at Gobabeb, in the central Namib Desert. J. Arid Environ. 2013, 93, 7–19. [Google Scholar] [CrossRef]
  47. Todd, M.C.; Washington, R.; Palmer, P.I. Water vapour transport associated with tropical–temperate trough systems over southern Africa and the southwest Indian Ocean. Int. J. Clim. 2004, 24, 555–568. [Google Scholar] [CrossRef] [Green Version]
  48. Vigaud, N.; Richard, Y.; Rouault, M.; Fauchereau, N. Moisture transport between the South Atlantic Ocean and southern Africa: Relationships with summer rainfall and associated dynamics. Clim. Dyn. 2008, 32, 113–123. [Google Scholar] [CrossRef]
  49. Vigaud, N.; Pohl, B.; Crétat, J. Tropical-temperate interactions over southern Africa simulated by a regional climate model. Clim. Dyn. 2012, 39, 2895–2916. [Google Scholar] [CrossRef]
  50. Howard, E.; Washington, R. Drylines in Southern Africa: Rediscovering the Congo Air Boundary. J. Clim. 2019, 32, 8223–8242. [Google Scholar] [CrossRef]
  51. Howard, E.; Washington, R. Tracing Future Spring and Summer Drying in Southern Africa to Tropical Lows and the Congo Air Boundary. J. Clim. 2020, 33, 6205–6228. [Google Scholar] [CrossRef]
  52. Ministry of Foreign Affairs of the Netherlands. Climate Change Profile Mozambique; Ministry of Foreign Affairs of the Netherlands: The Hague, The Netherlands, 2018; p. 20.
  53. Almazroui, M.; Islam, M.N.; Saeed, F.; Saeed, S.; Ismail, M.; Ehsan, M.A.; Diallo, I.; O’Brien, E.; Ashfaq, M.; Martínez-Castro, D.; et al. Projected Changes in Temperature and Precipitation Over the United States, Central America, and the Caribbean in CMIP6 GCMs. Earth Syst. Environ. 2021, 5, 1–24. [Google Scholar] [CrossRef]
  54. Abiodun, B.J.; Mogebisa, T.O.; Petja, B.; Abatan, A.A.; Roland, T.R. Potential impacts of specific global warming levels on extreme rainfall events over southern Africa in CORDEX and NEX-GDDP ensembles. Int. J. Clim. 2019, 40, 3118–3141. [Google Scholar] [CrossRef]
  55. Dosio, A.; Turner, A.G.; Tamoffo, A.T.; Sylla, M.B.; Lennard, C.; Jones, R.G.; Terray, L.; Nikulin, G.; Hewitson, B. A tale of two futures: Contrasting scenarios of future precipitation for West Africa from an ensemble of regional climate models. Environ. Res. Lett. 2020, 15, 064007. [Google Scholar] [CrossRef]
  56. Morishima, W.; Akasaka, I. Seasonal Trends of Rainfall and Surface Temperature Over Southern Africa. Afr. Study Monogr. 2010, 40, 67–76. [Google Scholar]
  57. Kay, A. Introduction and Review of Statistics. Oper. Amplif. Noise 2012, 1–11. [Google Scholar]
  58. Tadross, M.; Jack, C.; Hewitson, B. On RCM-based projections of change in southern African summer climate. Geophys. Res. Lett. 2005, 32, 1–4. [Google Scholar] [CrossRef]
  59. Pinto, I.; Lennard, C.; Tadross, M.; Hewitson, B.; Dosio, A.; Nikulin, G.; Panitz, H.-J.; Shongwe, M.E. Evaluation and projections of extreme precipitation over southern Africa from two CORDEX models. Clim. Chang. 2015, 135, 655–668. [Google Scholar] [CrossRef]
  60. Programme, W.F. Mozambique: A Climate Analysis; Ministry of Foreign Affairs of the Netherlands: The Hague, The Netherlands, 2017.
  61. Alfaro-Córdoba, M.; Hidalgo, H.G.; Alfaro, E.J. Aridity Trends in Central America: A Spatial Correlation Analysis. Atmosphere 2020, 11, 427. [Google Scholar] [CrossRef]
Figure 1. Topography and geographical location of the study domain (Mozambique) in Africa. Black marks closed to acronyms represent the geographical location of each weather stations (PB, LC, NP, QL, TT, BR, CH, IN, XX, MP) considered here. The three left panel indicate the administrative sub-regions: northern, central, and southern region.
Meteorology 02 00002 g001
Figure 2. The probability density for the annual climatological cycle of air temperature and monthly precipitation in each region (a,d) for northern, (b,e) for central, and (c,f) for southern) of the study domain.
Meteorology 02 00002 g002
Figure 3. Climatology of the annual cycle of observed and simulated precipitation and air temperature in each representative WS of the study domain. Red, blue, and green are the north, central, and southern WS, respectively. The open (filled) circle indicate the coastal (continental) WS.
Meteorology 02 00002 g003
Figure 4. Monthly precipitation and air temperature anomaly (climatology, 1971−2000). Each bar represents the corresponding WS in the study domain. OBS, CRU and RegCM are the three datasets described as observed WS, interpolated CRU and simulated RegCM, respectively. Each bar indicate the bias for the corresponding month and WS. The horizontal dashed lines show the limit between 10 and −10 mm/month for precipitation (panel above), and 2 and −2 °C for air temperature (panel below).
Meteorology 02 00002 g004aMeteorology 02 00002 g004b
Figure 5. Boxplot diagrams for the three datasets, monthly mean of air temperature (°C) for reference period. In the lower right corner, Taylor diagrams for RegCM4 and WS (RegCM vs. Obs), CRU and WS (CRU vs. Obs). Open circle is the reference of normalized standard deviation.
Meteorology 02 00002 g005
Figure 6. Boxplot diagrams for the three datasets, concerning to monthly mean of precipitation (mm/month) for reference period. In the lower right corner, Taylor diagrams for RegCM4 and WS (RegCM vs. OBS), CRU and WS (CRU vs. OBS). Open circle is the reference of normalized standard deviation.
Meteorology 02 00002 g006
Figure 7. Spatial distribution of seasonal mean air temperature (°C) obtained from CRU reanalysis (upper panels) and difference between simulated RegCM4 and CRU, for the reference period (1971–2000). DJF, MAM, JJA, SON represent the set of 3 months of each climatological season.
Meteorology 02 00002 g007
Figure 8. Spatial distribution of seasonal mean precipitation (mm/month) obtained from reanalysis CRU dataset (upper panels) and difference between simulated RegCM4 and CRU, for the reference period (1971–2000). DJF, MAM, JJA, SON represent the set of 3 months of each climatological season.
Meteorology 02 00002 g008
Figure 9. Signal of future climate changes in annual and seasonal mean temperature (°C), under the RCP4.5 and RCP8.5 scenarios for 2070–2099 with respect to reference period (Ref, 1971–2000), simulated by RegCM4. The first column in the panel represent the difference of annual average and each of the rest of the maps match to seasonal differences (DJF, MAM, JJA, and SON).
Meteorology 02 00002 g009
Figure 10. Probability density function of maximum (a) and minimal (b) regional mean air temperature distribution in the three regions (northern represented by black line, central by red line and green line for southern) over the study domain. The air temperature between shaded vertical bands represent the ranges of regional mean air temperature for reference period.
Meteorology 02 00002 g010
Figure 11. Signal of future climate changes in annual and seasonal mean precipitation (mm/month), under the RCP4.5 and RCP8.5 scenarios for 2070–2099 with respect to reference period (Ref, 1971–2000), simulated by RegCM4. The first column in the panel represent the difference of annual average and each of the rest of the maps match to seasonal differences (DJF, MAM, JJA, and SON).
Meteorology 02 00002 g011
Figure 12. Probability density function of maximum (a) and mean (b) regional precipitation distribution in the three regions (northern represented by black line, central by red line and green line for southern) over the study domain. The precipitation between shaded vertical bands represent the range of regional mean precipitation for reference period.
Meteorology 02 00002 g012
Disclaimer/Publisher’s Note: The statements, opinions and data contained in all publications are solely those of the individual author(s) and contributor(s) and not of MDPI and/or the editor(s). MDPI and/or the editor(s) disclaim responsibility for any injury to people or property resulting from any ideas, methods, instructions or products referred to in the content.

