Article

Airplane Emergency Landing Due to Quick Development of Mesoscale Convective Complexes

by
Renata Barros Vasconcelos Leirias
1,2,*,
Natalia Fedorova
2 and
Vladimir Levit
2
1
LATAM Brazil Airlines Group S.A., Maceio 57025-230, Brazil
2
Institute of Atmospheric Science, Federal University of Alagoas, Maceio 57480-000, Brazil
*
Author to whom correspondence should be addressed.
Meteorology 2023, 2(1), 1-14; https://doi.org/10.3390/meteorology2010001
Submission received: 1 October 2022 / Revised: 17 November 2022 / Accepted: 30 November 2022 / Published: 3 January 2023
(This article belongs to the Special Issue Early Career Scientists' (ECS) Contributions to Meteorology (2022))

Abstract

:
Some meteorological phenomena in South America develop quickly and take on large dimensions. These phenomena cause disasters for aviation, such as incidents and accidents. Mesoscale convective complexes (MCCs) forced a commercial airplane into an emergency landing at Ezeiza International Airport in Buenos Aires (Argentina) in October 2018. The airplane took off from São Paulo (Brazil) to Santiago (Chile) and had to alternate to Ezeiza after encountering unanticipated agglomerations of MCCs along the flight route; its structure was seriously damaged, which affected the safety of the flight. A synoptic and thermodynamic analysis of the atmosphere, prior to the event, was made based on GOES16 infrared satellite data, radiosonde data, maps of several variables such as stream lines, temperature advection, surface synoptic maps and layer thickness from CPTEC/INPE and NCEP reanalysis data. The main observed processes that influenced the formation and development of conglomerates of MCCs were the following: (1) the cyclogenesis of a baroclinic cyclone on the cold front; (2) the coupling of subtropical and polar jet streams; (3) the advection of warm and humid air along a low-level jet stream. Recommendations for meteorologists in weather forecasting and for aviators in flight safety were prepared.

1. Introduction

Applied meteorology for the purpose of flight safety is still in its infancy in South America. Most of the information is captured by North American studies and adapted to the region. The low temporal and spatial frequency of surface and upper-air data in South America makes it difficult to use numerical atmosphere models and to provide meteorologists with real-time or updated information, leading to a decrease in flight safety. In addition, numerical models have difficulty in representing the convective processes associated with low-level jets, especially those located in the Planetary Boundary Layer [1]. These jets are of great importance and influence the development of convective clouds and mesoscale convective complexes (MCCs) in Southern Brazil and adjacent regions [2,3,4,5,6]. The term mesoscale convective complexes (MCCs) was given by Maddox (1980) [3]. The detailed climatology of MCCs in South America was described by Velasco and Fritsch (1987) [4]. The MCC structure, formation processes, and development stages were presented by Fedorova (2008b) [5]. The formation processes and forecasting methods of MCCs in northeastern Brazil were described in detail by Fedorova, Pontes da Silva and Levit (2019) [2,3,4,5,6]. The gradual formation of a cyclonic vorticity center at low and middle levels is likely responsible for the round shape of the MCC and was confirmed by simulations by Rocha (1992) [7] as well as by observational studies such as that of Cotton et al. (1989) [8].
The upper-level jet stream is associated with frontal zones of baroclinic cyclones and cyclogenetic processes [6]. The low-level jet stream transports heat and moisture from low to higher latitudes and has a great influence on frontogenesis and MCC formation, especially at night due to its speed increment [9].
According to the Federal Aviation Administration (FAA), meteorology is the fastest growing factor causing undesirable events in aviation: while in the United States in 1967 it was responsible for 40% of events, in 2010, at least 50% of aircraft accidents had it as a major contributing or determining factor. In Brazil, about 21% of air occurrences have meteorology as a contributing factor and an even higher percentage have meteorological phenomena as the main or determinant cause of the occurrences [10]. The incorrect analysis of meteorological phenomena, especially adverse ones, is the most contributing factor to the pilot making an erroneous decision [11].
In the case of commercial aircraft operations by national airlines, the last 10 years have seen a significant frequency and persistence of accidents and incidents where meteorology has been a determining factor [12].
Among them was one that attracted the most attention. This happened in October 2018, involving an Airbus 320 model aircraft that encountered hail on the route between the Guarulhos International Airport in São Paulo, Brazil (SBGR) and Arturo Menizes International Airport in Santiago, Chile (SCEL). The intended flight route and the exact location where the aircraft encountered severe hail are shown in Figure 1. In this case, serious damage to the aircraft structure, including the fuselage, occurred, and due to this, an emergency landing was required (Figure 2a,b). This episode occurred in a region in southern Brazil, which is highly frontogenetic and cyclogenetic, fed by low-level jets from the Amazon region.
The aim of this work was to analyze the meteorological conditions that cause the very fast and strong formation and development of adverse meteorological phenomena, including hail, which was responsible for the flight episode on 31th of October 2018. As a result, we prepared recommendations for meteorologists on forecasting these phenomena and recommendations on flight safety for aviators.
The flight episode occurred in the early morning of 31 October 2018 at 06 UTC.

2. Materials and Methods

The flight episode occurred in the early morning of 31 October 2018, at 06 UTC (Universal Time Coordinated). Detailed synoptic and thermodynamic conditions were analyzed 24 h before the aircraft collision with the MCC with heavy hail. Therefore, the analyzed period was from 30 to 31 October until 6 UTC.
The following synoptic and thermodynamic available variables were used:
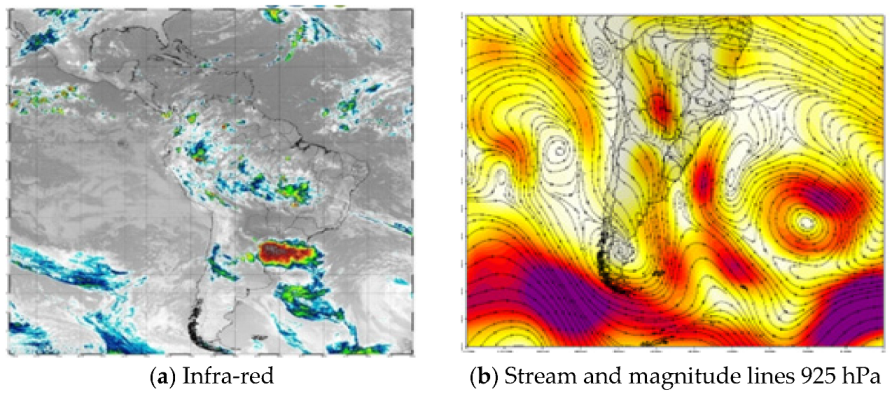
  • Infrared (IR) images from the GOES-16 satellite of the Center for Weather Forecasting and Climatic National Space Research Institute (CPTEC/INPE) in Brazil [13]. The IR images for the period preceding the episode by 24, 8, 5 h and at the exact time of the episode were studied and analyzed.
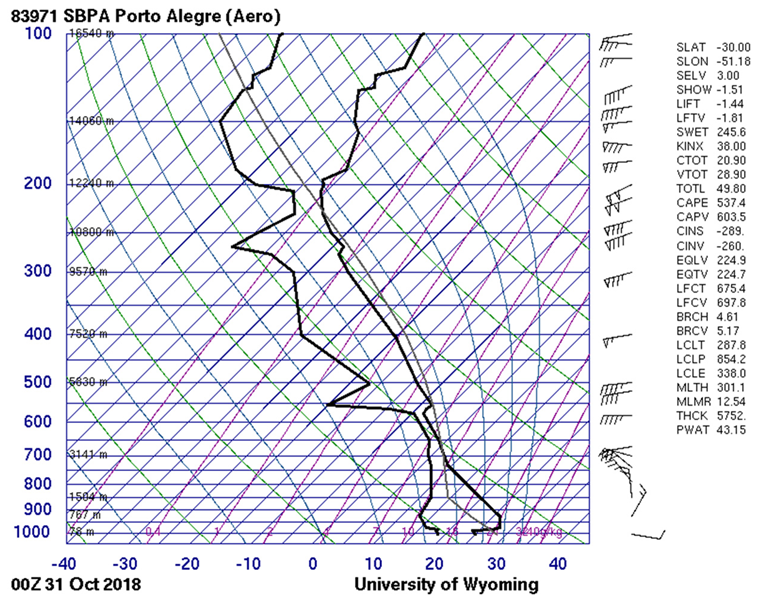
  • Radiosonde data 6 h before the collision from the Porto Alegre International Airport (South of Brazil) were obtained from the Atmospheric Department of the University of Wyoming [14].
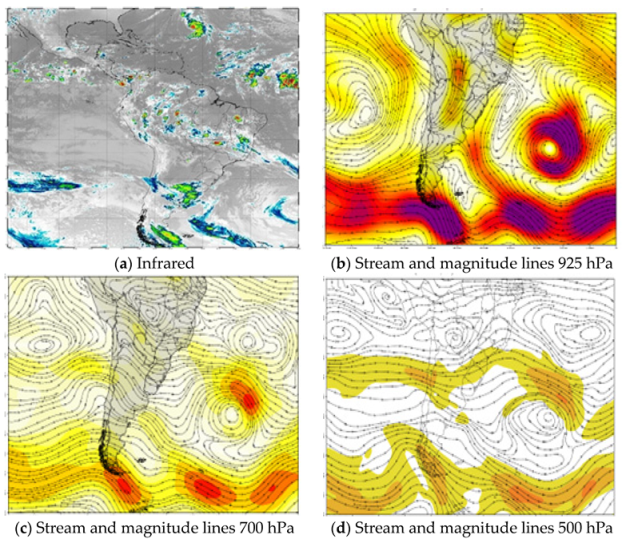
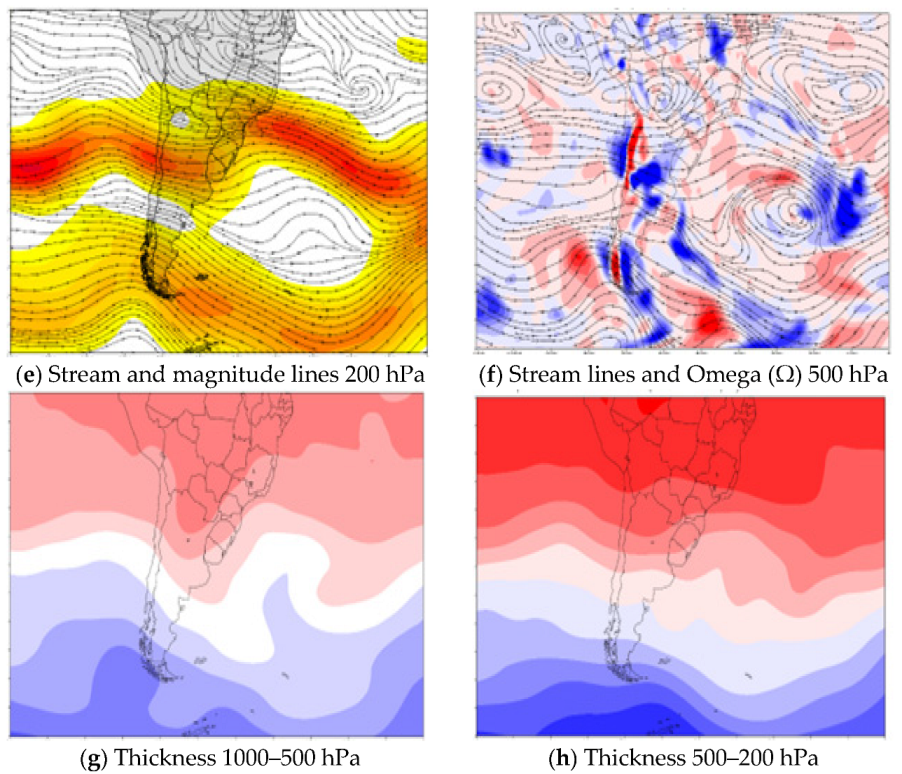
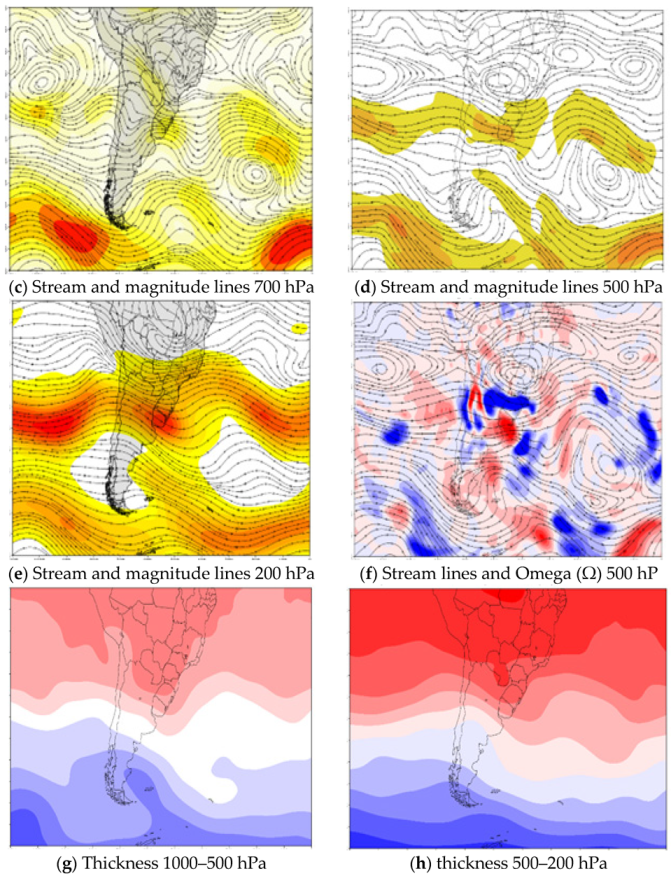
  • Several meteorological maps for South America were elaborated using reanalysis data with the resolution of 2.5° × 2.5° latitude and longitude from the National Centers for Environmental Prediction (NCEP). The following variables were analyzed: stream lines, layer thickness and Omega at 925, 700, 500 and 200 hPa levels (National Weather Service) [15].
The evolution and displacement of meteorological systems that influenced the creation, development and subsequent conglomeration of MCCs over South America, the oceans and adjacent areas were analyzed. The role of baroclinic and barotropic systems, frontal zone displacements, upper-level jet streams and cyclogenetic processes in the formation of MCC conglomeration and its evaluation were studied in detail. The specific topographic conditions of South America, such as the Andes Mountain range, were also analyzed. It plays a fundamental role in the establishment of flow from the north, at low levels, on its eastern slope, in the presence of heat sources in the Amazon, which are typical for summer [16,17].
Seasonal barometric systems such as Bolivian High and South Atlantic Subtropical High were also part of the study.
Meteorological data for international airports located along the intended flight route and adjacent areas to the place where the episode occurred were recorded on the METAR and SPECI database (message to the pilot and special weather report) (Figure 1). The meteorological data were obtained from databases and websites of official meteorological data-capture agencies such as: Center for Weather Forecasting and Climate Studies of the National Institute for Space Research (CPTEC/INPE), Meteorology Network of the Aeronautics Command (REDEMET), National Oceanic Atmospheric Administration (NOAA) and National Institute of Meteorology (INMET) [15,16,17,18].
Figure 2. Aircraft structural damages after its encounter with MCC. (a) View from the cockpit. (b) External view [19].
Meteorology 02 00001 g002

3. Results and Discussion

Satellite images (Figure 3) confirmed that the episode occurred within the large area of cumulonimbus clouds (Cb), which were created by the conglomeration of MCCs. The stages of development of these MCCs and their agglomeration are described below.

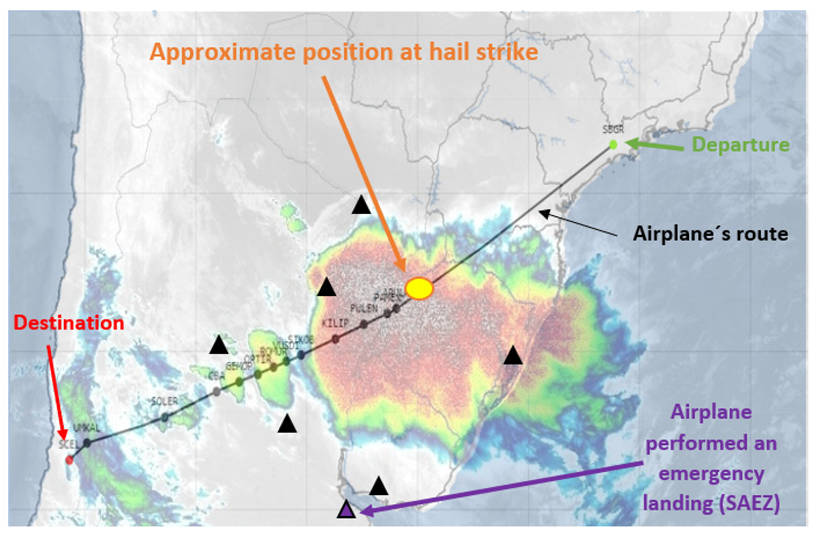
3.1. Episode Overview

The stages of evolution, formation and development of the MCCs that affected the flight trajectory in the period of time preceding the impact are as follows (Figure 3):
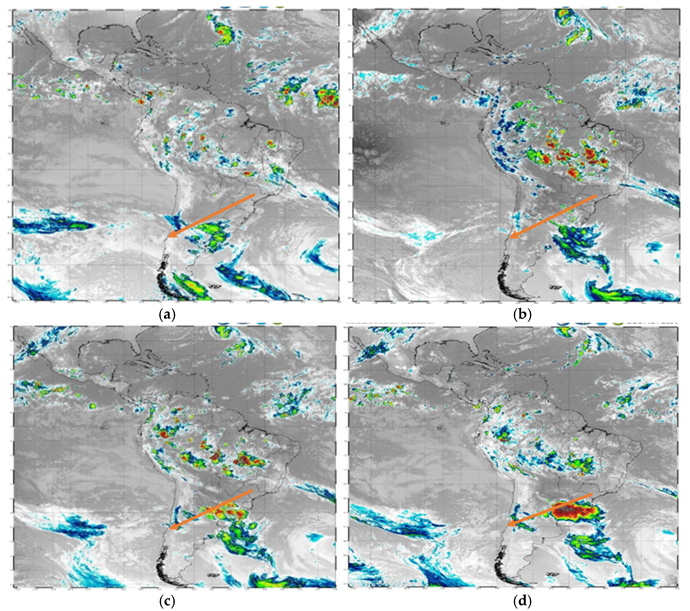
  • 24 h before the event and 22 h before the takeoff: cold front over southeastern America, with clouds not reaching −40 °C. Clouds reached middle troposphere levels and do not affect the flight route (Figure 3a).
  • 8 h before event and 6 h before takeoff: cold front moved northeast towards the Atlantic Ocean (Figure 3b). Note that the formation of convective clouds detached from the end of the front with the temperature of the cloud top being −40 °C, reaching middle levels of the troposphere. These convective clouds quite affected the flight path, and a slight meteorological deviation was required.
  • 5 h before the event and 3 h before takeoff: cold front shifted towards the Atlantic Ocean (northeast displacement; Figure 3c). It was observed that the convective clouds, detached from the end of the cold front, formed a well-defined conglomeration. The temperature of the cloud top quickly dropped and reached −60 °C (high troposphere). It was no longer possible to fly over the tops of MCC formations, and deviations from the flight path due to weather conditions were necessary.
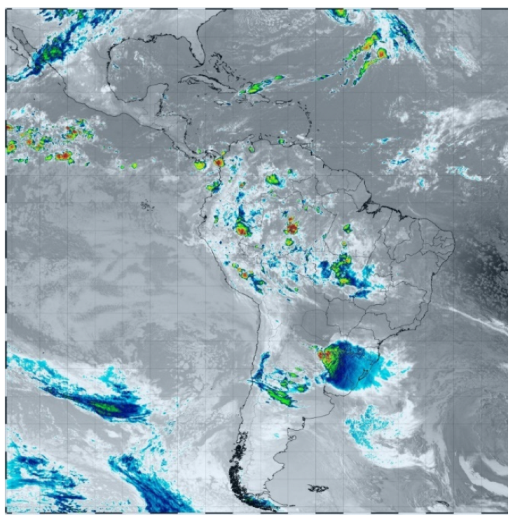
  • Time of the event and 2 h after takeoff: cold front moved towards the Atlantic Ocean (Figure 3d). End of the front with clusters of MCCs joined, forming a large conglomeration of MCCs, covering several countries in South America, such as southern Brazil, Uruguay, Argentina and Paraguay. The temperature of the cloud top reached −90 °C to −100 °C.
The sequence of satellite images (Figure 3) showed the speed of development, size and evolution of the MCCs and their subsequent union. Up to three hours before takeoff (Figure 3c), there was no need for significant meteorological deviations; therefore, little additional fuel was required for the route. At this time, all the flight planning had already been prepared, and all the fuel needed for meteorological deviations was planned.
Two hours after takeoff, the aircraft encountered extremely large and dangerous meteorological formations, covering Uruguay, southern South America, northwest Argentina and Paraguay. Cloud top temperature reached −100 °C. Large lateral deviations should have been made, but the aircraft did not have such a large supply of fuel. It should be noted that the favorable place for the beginning of the MCC was located northwest of the center of maximum speed, at upper levels [20,21], as can be seen from Figure 3d and Figure A2e.
In addition, it should be noted that the meteorological radar used in such an aircraft does not see hail [22]. Cloud tops with a temperature of −100 °C and with hail cannot be detected by radars.
Such a convective system showed signs of dissipation only 3 h after the event. According to Machado and Rossow (1993), as this type of convective system reaches its mature phase, a large number of stratus and cirrus clouds form, reaching about 80% of the total area [23]. This maturity could only be seen at 09:00 GMT, as shown in Figure 4. Consequently, at the moment of impact between the aircraft and hail coming from the MCC at 06:00 GMT, this MCC was in full convective activity.

3.2. METAR and SPECI Analysis

METAR and SPECI messages were received from international aerodromes cleared for emergency landings along the intended and ongoing flight route shown in Figure 1. These aerodromes were selected for analysis because they are close to the study area and because they have minimal operational requirements and capabilities to accommodate medium-size aircraft on an international flight. Such aerodromes are indicated by a symbol ▲, in Figure 1. They are: Porto Alegre-RS (SBPA) in Brazil; Ezeiza (SAEZ), Cordoba (SACO) and Resistencia (SARE) in Argentina; Montevideo (SUMU) in Uruguay, and Asuncion (SGAS) in Paraguay. From the weather reports from these airports, shown in Table 1, it was possible to check the current weather 6 and 4 h before the episode. Thus, the following times were analyzed: 00:00 UTC, 03:00 UTC and 06:00 UTC (the exact time of the event).
In general, on the surface at most of the airports shown, one can observe a change in the quadrant of the direction of the wind and a decrease in temperature as the cold front passes.
Rain and post-frontal fog were found as typical synoptic characteristics during the passage of a cold front. It should be noted that on the end of the cold front, in the area of the Resistencia Airport, in addition to METAR messages, it became necessary to develop SPECI messages due to sudden changes in the weather. It was exactly in this region, at a cold frontal end, where large thermodynamic and synoptic characteristics were confirmed (Table 2), which favored the formation and development of the MCCs and their subsequent junction. It is around the Resistencia Airport, through the analysis of SPECI reports, that the magnitude of the effects of MCCs, such as heavy rain, thunderstorms, cumulonimbus clouds and gusts of wind, can be observed.

3.3. Synoptic and Thermodynamic Analysis and Results

3.3.1. 24 h before the Event and 22 h before Taking off

The cold front of a baroclinic cyclone in the south Atlantic (53 °S) was observed at low levels (925 hPa) by the convergence with the air of an anticyclone located near the southeast of Brazil (30 °S) (Figure A1b in Appendix A). The high values of wind speed (reaching 18 m/s) were recorded along this front. The low-level jets crossing northern Argentina and Paraguay were weak (~13 m/s) and presented convergent flow in these regions. The airflow in this stream was directed towards west central Argentina. This baroclinic cyclone with a frontal zone was located below the leading edge of the trough at 700 hPa (Figure A1c). The polar and subtropical jet streams at 200 hPa were located in northern and southern Argentina (Figure A1e), respectively. The core of the jet stream was located far from the MCC formation zone. Therefore, 24 h before the event, cyclogenetic factors were absent.

3.3.2. At the Event Time (06h00 UTC)

The cyclogenetic process was observed on the cold front, in the vicinity of Uruguay and Rio Grande do Sul (Brazil). This process occurred below the leading edge of the trough at 700 hPa, as was already mentioned in the previous part (Figure A2c). The speed of the low-level jet streams increased (up to 20 m/s) and their direction changed to the southeast (Figure A2b); therefore, these jet streams entered the periphery of the cold front. These low-level jets supply hot air to the leading edge of the frontal zone and are one of the main factors of cyclogenesis. This entry of hot air at low levels was responsible for creating a very strong instability. Six hours before the impact, according to the radiosonde data of Porto Alegre Airport—RS, Brazil (Figure 5), there was a well-defined temperature inversion at low levels (temperature brought by the low-level jets) and soon after that, at 925 hPa, a weak atmospheric instability with an increase in CAPE to 537.4 J/kg. The Lifted Condensation Level (LCL) can be detected close to 800 hPa together with atmospheric humidification (between 750 hPa and 580 hPa). Between 600 hPa and 230 hPa (aircraft flight levels), the atmosphere remained relatively dry. Hail is more likely to be detected in a dry atmosphere, as the moisture in the air acts as a heat conductor, helping to melt the ice [22].
The deepening of the trough at middle levels of 500 hPa (Figure A2d) and at upper levels of 200 hPa (Figure A2e) was accompanied by the union of subtropical and polar jet streams. The region of the union of these currents was observed close to the impact region; this union occurred due to the strong difluence of winds in the Pacific Ocean, west of the Andes, in the high-pressure zone [24]. The formation of MCC clusters occurred in the entry zone of the jet stream core at upper levels (Figure A2e). This region is typical for upward movements and in this case the polar and subtropical jet streams that combined in a single core created the very intense upward movements shown in Figure A1f, with very strong negative Omega values.

3.4. Review of Meteorological Processes That Caused the Air Episode

Review of Meteorological Processes That Caused the Air Episode

Summarizing all the characteristics of the troposphere and the meteorological processes that caused the air episode, Table 2 was compiled.
The area of the event has the following favorable climatological characteristics for MCC development.
  • Spring and summer are the most favorable months of the year for MCC development.
  • The night period is most favorable for MCC formation.
At low levels (925, 850 and 700 hPa):
  • A baroclinic trough over the Atlantic Ocean joined with the low-pressure center, located east of Uruguay. Therefore, the trough from Chaco Low towards the baroclinic cyclone east of Uruguay was extended. There was a confluence and significant increase in the speed of the low-level jets from the northern region of South America to the area of the frontal extremity (925 and 850 hPa). Such low-level jets bring latent heat and air humidity to the area. Therefore, the next processes at low levels were observed:
  • Cold front end around the event area; Figure A2a.
  • Confluence of the low-level jets, coming from the north of South America to the baroclinic cyclone over the study area; Figure A1b.
  • Displacement of the barotropic low-pressure center (known as low of the Chaco) to the baroclinic low-pressure center located in the study area.
  • Union of the trough over the Atlantic Ocean with the baroclinic low-pressure center over the study area; Figure A2b.
  • High pressure over the Atlantic Ocean that prevented the displacement of the cold front to the northeast, as shown in Figure A2b.
Therefore, mesoscale convective systems (MCSs) with sequential propagation (Figure 3c) occurred under the conditions of strong warm advection at low levels (Figure A1g and Figure A2g) and strong wet advection in the layer between the surface and 700 hPa. This advection transported heat and moisture from the Amazon region towards southern South America. A pattern affecting low-level flow was a strong anticyclone, located off the coast of Brazil (Figure A1b,c and Figure A2b,c) which mainly acted in the MCS previous development [25].
At the middle levels (500 hPa):
  • The MCC formation area was found between the ridge in the vanguard and trough at the rear; this is typical behavior of the middle atmosphere at the beginning of the cyclogenetic process, as shown in Figure A2d [5].
  • Negative Omega values at and around the study area, which means that there were significant convective movements as shown in Figure A2f.
  • Cold front reached 500 hPa; Figure A2d.
At the upper levels (200 hPa):
  • There was an increase in the velocity of the upper-level jet stream and its core shifted to the region in which the MCC was formed and observed.
  • Center of the upper-level jet stream located at the rear of the MCC.
  • The MCC was located between the inlet and outlet of the high-level jet.
  • Upper-level western jet, located about 5° south of the MCC position at maximum extension time.
  • Coupling of upper-level jets with low-level jets [26].
  • Coupling of subtropical and polar upper-level jet streams in the same longitude where the aircraft encountered the MCC union.
  • The MCS developed on the anticyclonic side of the inlet region of the upper-level jet (Figure A1e and Figure A2e) [25].

3.5. Limitations

There were operational and meteorological limitations for the study of such an event. Among them:
  • A lack of approved ground-based meteorological radars to provide flight controllers with real-time images to assist pilots in making necessary meteorological deviations en route, as well as during takeoffs and approaches, and to obtain data on cold front displacement in the region. Therefore, the entire interpretation of the atmosphere and the solution of meteorological deviations are left to the discretion of the pilots.
  • There is an under-reporting of such events in the aviation environment. Typically, such events are limited to the airline safety sector and are therefore not reported. Thus, it is impossible to calculate the true number of such events occurring in the region during this period of the year. Additionally, there is no way to access the operational data such as damage, injuries, etc.
  • There is no regulation requiring the presence of meteorologists in airlines. Consequently, scientific and more accurate data cannot be obtained and turned into scientific research. This explains the low level or complete absence of previous studies related to such cases.
  • MCCs take place predominantly at night, when there are some operational restrictions, among them:
  • At night, at airports close to the impact area, indicated by the symbol (▲) in Figure 1, as well as at origin (SBGR), destination (SCEL) and alternative (SAEZ) airports, there were no radiosonde data in the morning. Therefore, the actual data of radio sounding were not recorded. Only Porto Alegre RS Airport, Brazil (SBPA) had radiosonde data at 00 GMT on the 31st, i.e., 6 h before the event (Figure 5).
  • At night, it is impossible for pilots to visualize convective systems and their dimensions with the naked eye, and, in addition, airborne meteorological radars do not detect ice [22] (the cloud top temperature reached –100 °C, as shown in Figure A1a). Therefore, phenomena such as hail may be invisible to pilots.

3.6. Flight Plan Recommendations

In addition to the operational and meteorological limitations shown in 3.5, to minimize negative impacts on air operations at work, proposals for the preparation of a flight plan were created. Some modifications to a flight plan have been proposed that minimize, firstly, human losses, secondly, material losses and thirdly, increase flight safety. The proposals are based on climatological characteristics that have a synoptic and thermodynamic analysis. The proposals are presented in Table 3.

4. Conclusions and Recommendation

According to previous studies [27], the life cycle of convective systems with a radius of 240 km for the middle latitudes of South America in summer has an average lifetime of 15 h and a maximum development at the beginning of the night. From Figure 3, Figure 4, Figure A1 and Figure A2, it can be concluded that the peak of convection and the subsequent union of the MCCs occurred at dawn, when the aircraft was close to the system at its cruising level.
The aircraft’s encounter with agglomerations of MCCs and severe hail forced an intermediate emergency landing of the aircraft with severe structural damage.
The synoptic and thermodynamic analysis concluded that there were cyclogenetic processes allowing the development and further union of the MCCs, creating a significant coverage and intense convective movements.
As a result of this research, a table was prepared with a summary of the meteorological processes observed on the day of the event, throughout the atmosphere, around the area of the aircraft’s impact with the strong hail, due to the development and subsequent union of the MCCs. The table will serve meteorologists and the public involved in flight safety.
The table warns that flights that pass through the area under study, with the synoptic characteristics observed and described in Table 2, can follow the recommendations given in Table 3. This facilitates and speeds up the preparation of flight plans, mitigates aeronautical accidents and incidents, and serves as an input for new meteorological research aimed at flight safety.
Therefore, if synoptic processes similar to those presented in Table 2 are found in climatological areas of MCC formation, then extra care should be taken, as the union of an MCC’s core can occur easily and quickly; it is necessary to be careful and analyze new weather forecasts.

Author Contributions

Conceived and designed the analysis, R.B.V.L., N.F. and V.L.; Collected data, R.B.V.L., N.F. and V.L.; Analysis data, R.B.V.L., N.F. and V.L.; Wrote the paper, R.B.V.L., N.F. and V.L. All authors have read and agreed to the published version of the manuscript.

Funding

This research received no external funding.

Institutional Review Board Statement

The study did not require ethical approval.

Informed Consent Statement

Not applicable.

Data Availability Statement

The images were used solely in this work and have never been published or released before. They were built by me, by a program called GrADS and data taken from NCEP (item 15 of the bibliographical references). GrADS - Grid Analysis and Display System - is an interactive software used in the tasks of accessing, manipulation and visualization of geophysical data. Currently, GrADS is one of the most widely used software by the operational and meteorological research comunities around the world. for more information about the program access: https://www.cpc.ncep.noaa.gov/ (accessed on 30 September 2022). Information that this program was used is in item Section 2.

Conflicts of Interest

The authors declare no conflict of interest.

Appendix A

Figure A1. Synoptic situation 24 h before the event and 22 h before takeoff: 30 October 2018, at 06 UTC: (a) IR satellite image; (b) stream lines at 925 hPa; (c) stream lines at 700 hPa; (d) stream lines at 500 hPa; (e) stream lines at 200 hPa; (f) Omega (Ω) and stream lines at 500 hPa; (g) thickness 1000–500 hPa; (h) thickness 500–200 hPa.
Meteorology 02 00001 g0a1aMeteorology 02 00001 g0a1b
Figure A2. Synoptic situation at the exact time of the event; 31 October 2018, at 06 UTC. (a) IR satellite image; (b) stream lines at 925 hPa; (c) stream lines at 700 hPa; (d) stream lines at 500 hPa; (e) stream lines at 200 hPa; (f) Omega (Ω) and stream lines at 500 hPa; (g) thickness at 1000–500 hPa; (h) thickness at 500–200 hPa.
Meteorology 02 00001 g0a2aMeteorology 02 00001 g0a2b

References

  1. Davy, R.; Esau, I. Surface Air Temperature Variability in Global Climate Models. Atmos. Sci. Lett. 2014, 15, 13–20. [Google Scholar] [CrossRef] [Green Version]
  2. Fedorova, N.; Pontes Da Silva, B.F.; Levit, V. Mesoscale Convective Complexes over the Northeast Brazil. 2019. 239p, ISBN 978-65-900634-0-3. Available online: https://clubedeautores.com.br/livro/complexos-convectivos-de-mesoescala-sobre-o-nordeste-do-brasil (accessed on 30 September 2022).
  3. Maddox, R.A. Mesoscale Convective Complexes. Bull. Am. Meteorol. Soc. 1980, 61, 1374–1387. [Google Scholar] [CrossRef]
  4. Velasco, I.; Fritsch, J.M. Mesoscale Convective Complexes in the Americas. J. Geophys. Res. Atmos. 1987, 92, 9591–9613. [Google Scholar] [CrossRef]
  5. Fedorova, N. Synoptic IV: Synoptic Systems and Processes Active in South America. In Didactic Material: Synopses, Figures and Equations; UFAL: Maceio, Brazil, 2008; 192p, ISBN 978-85-7177-422-3. [Google Scholar]
  6. Fedorova, N. Synoptic III: Fronts, Jet Streams, Cyclones and Anticyclones. In Didactic Material: Synopses, Figures and Equations; UFAL: Maceio, Brazil, 2008; 192p, ISBN 978-85-7177-421-6. [Google Scholar]
  7. Rocha, R.P. Numerical Simulation of a Mesoscale Convective Complex over South America. Master’s Thesis, IAG/USP, São Paulo, Brazil, 1992. [Google Scholar]
  8. Cotton, W.R.; Anthes, R.A. Storm and Cloud Dynamics; Academic Press: Cambridge, MA, USA, 1989; 883p. [Google Scholar]
  9. Corrêa, C.S.; Clarke, R.T.; Silveira, A.L.L. Non-hierarchical Analysis and Classification of Low Level Jets and Maximum Winds in the Vertical Wind Profile over Porto Alegre. In Proceedings of the XII Brazilian Meteorology Congress, Foz do Iguacu, Brazil, 4–9 August 2002; Available online: https://www.researchgate.net/publication/326673111_analise_e_classificacao_nao_hierarquica_dos_jatos_de_nivel_baixo_e_dos_ventos_maximos_no_perfil_vertical_do_vento_sobre_porto_alegre?enrichid=rgreq-a1841c7ff1ae20f7e5eb3952134c5fc6-xxx&enrichsource=y292zxjqywdlozmynjy3mzexmttbuzo2ntm0nju2mtc0ndq4njramtuzmjgwotc1mji0ng%3d%3d&el=1_x_2&_esc=publicationcoverpdf (accessed on 8 January 2022).
  10. Kulesa, G. Weather and Aviation: How Does Weather Affect the Safety and Operations of Airports and Aviation, and How Does FAA Work to Manage Weather-related Effects? In The Potential Impacts of Climate Change on Transportation. Washington, DC, USA, 2002; Available online: www.bv.transports.gouv.qc.ca/mono/1083088.pdf (accessed on 22 December 2021).
  11. Brazila. Defence Ministry, Air Command, Center of Investigation and Prevention of Aeronautical Accidents (CENIPA). Panel SIPAER: Overview of Accidents in the Last 10 Years. Available online: http://painelsipaer.cenipa.aer.mil.br/QvAJAXZfc/opendoc.htm?document=SIGAER%2Fgia%2Fqvw%2Fpainel_sipaer.qvw&host=QVS%40cirros31-37&anonymous=true (accessed on 10 February 2022).
  12. Brazilb. Defence Ministry, Air Command, Center of Investigation and Prevention of Aeronautical Accidents (CENIPA). FCA 58-1—Statistical Overview of Brazilian Civil Aviation. Brasilia, DF. 2014. Available online: https://www2.fab.com.br/cenipa/index.php/estatisticas (accessed on 12 March 2022).
  13. Brazilc. Ministry of Science, Technology, and Innovation. National Institute for Space Research. Satellite Images. GOES-16 Satellite. Time interval from October 30th 2018 to October 31th 2018, AMS Clean band IR CH1310.3 um. Latitude 35 North to 55 South, Longitude 115 West to 25 East. Available online: http://satelite.cptec.inpe.br/acervo/goes16.formulario.logic (accessed on 15 March 2022).
  14. University of Wyoming, Department of Atmospheric Science. Radiosonde image Skew T Log P, October 31 2018 at 00 UTC. Available online: https://weather.uwyo.edu/upperair/sounding.html (accessed on 17 October 2021).
  15. National Wheather Service. National Centers for Environmental Prediction. Meteorological Variables Prepared for South America, Interval: October 30th 2018 to October 31th 2018. Available online: https://www.weather.gov/ncep/ (accessed on 20 October 2021).
  16. Gandú, A.W.; Geisler, J.E. A Primitive Equation Model Sstudy of the Effect of Topography on the Summer Circulation Over Tropical South America. J. Atmos. Sci. 1992, 48, 1822–1836. [Google Scholar] [CrossRef]
  17. Figueiroa, N.F.; Satyamurty, P.; Silva Dias, P.L. Simulations of the Summer Circulation over the South American Region with an ETA coordinate model. J. Atmos. Sci. 1995, 52, 1573–1584. [Google Scholar] [CrossRef]
  18. Brazild. Defence Ministry, Air Command, Center. Air Force Command Meteorology Network (REDEMET). Consult Weather Messages. Available online: https://www.redemet.aer.mil.br (accessed on 15 October 2020).
  19. Dominelli, D. Plane Has Nose and Windshield Destroyed by Hail on Flight to Chile. 2018. Available online: https://www1.folha.uol.com.br/cotidiano/2018/10/aviao-da-latam-tem-nariz-e-para-brisa-destruido-por-granizo-em-voo-para-o-chile.shtml (accessed on 12 January 2022).
  20. Scolar, J.; Figueiredo, J.C. Analysis of Synoptic Conditions Associated with the Formation of Mesoscale Convective Complexes. In Proceedings of the VI Brazilian Meteorology Congress, Salvador, Brazil; 1990; pp. 455–461. [Google Scholar]
  21. Duquia, C.G.; Silva Dias, M.A.F. Mesoscale Convective Complex: ACase Study for Western Rio Grande do Sul. In Proceedings of the VIII Brazilian Meteorology Congress, Belo Horizonte, Brazil; 1994; Volume 2, pp. 610–612. [Google Scholar]
  22. Airbus, S.A.S. Optimum Use of Weather Radar. Saf. First Fr. 2016, 22, 22–43. Available online: https://www.airbus.com/content/dam/corporate-topics/publications/safety-first/Airbus_Safety_first_magazine_22.pdf (accessed on 18 November 2021).
  23. Machado, L.A.T.; Rossow, W.B. Structural Characteristics and Radiative Properties of Tropical Cloud Clusters. Mon. Wea. Rev. 1993, 121, 3234–3259. [Google Scholar] [CrossRef]
  24. Pedroso, D. Atmospheric Blockages and Frontal Systems Over South America In Future Climate Scenarios. Master’s Thesis, Santa Maria Federal University, Santa Maria, Brazil, 2014; 93p. [Google Scholar]
  25. Anabour, V. Mesoscale Convective Systems in Southern South America: Serial Propagation against Low Levels Flow. Ph.D. Thesis, Graduate Program in Physics. Federal University of Santa Maria, Rio Grande do Sul, Brazil, 2008. [Google Scholar]
  26. Uccellini, L.W.; Johnson, D.R. The Coupling of Upper and Lower Tropospheric Jet Streaks and Implications for the Development of Severe Convective Storms. Mon. Wea. Rev. 1979, 107, 682–703. [Google Scholar] [CrossRef]
  27. Machado, L.A.T.; Guedes, R.L.; Silveira, J.M.B.; Waltz, R.C.E.; Alves, M.A.S. Life Cycle of Meteorological Convective Systems. In Proceedings of the VIII Brazilian Meteorology Congress, Belo Horizonte, Brazil, 1994; Available online: http://climanalise.cptec.inpe.br/~rclimanl/boletim/cliesp10a/mcc_cli.html (accessed on 2 January 2022).
Figure 1. Intended flight route. In green, the departure airport (Guarulhos International Airport in Brazil—SBGR). In red, the intended destination (Arturo Menizes International Airport in Santiago—SCEL). In black, the flight plan route. In purple, the airport where the emergency landing was performed (Ezeiza International Airport in Argentina—SAEZ). In orange, the approximate position of the hail strike. As a triangle (▲), the airports with weather messages available s METAR, SPECI or radiosonde.
Meteorology 02 00001 g001
Figure 3. Main stages of MCC development by GOES Infrared Satellite data. Intended flight route (orange line). (a) 24 h before the event and 22 h before the takeoff; (b) 8 h before event and 6 h before takeoff; (c) 5 h before the event and 3 h before takeoff; (d) time of event and 2 h after takeoff.
Meteorology 02 00001 g003
Figure 4. Image by GOES Infrared Satellite data, 31 October at 09h00 GMT, 3 h after the event. It shows that the MCC started its dissipation only 3 h after the event.
Meteorology 02 00001 g004
Figure 5. Skew T-Log P from Porto Alegre International Airport, Brazil, 6 h before the event [14].
Meteorology 02 00001 g005
Table 1. METAR and SPECI codes delivered from the closest airports along the carried-out flight route and the intended flight route.
METAR SBPA
Porto Alegre
310,000Z 100/13kt CAVOK 24/19 Q1008
310,300Z 310,300Z 260/11kt 230V290 3000 TSRA BR FEW040CB SCT 040 OVC070 23/21 Q1011
310,600Z 340/15kt 4000 -TSRA BKN035 FEW040CB OVC070 22/21 Q1010
METAR SAEZ
Buenos Aires
310,000Z 350/03kt 9999 FEW010 BKN060 18/17 Q1009 TEMPO RA 6000
310,300Z 280/02kt CAVOK 15/15 Q1011 BECMG 6000
310,600Z 230/05kt CAVOK 14/14 Q1009 BECMG 4000 BR
METAR SARE
Resistencia
310,000Z 080/04kt CAVOK 30/25 Q1004
310,300Z 050/08 9999 TS SCT050 FEW055CB BKN065 29/25 Q1003
SPECI 310,445Z 27010G30kt 8000 -TSRA FEW019 FEW050CB OVC070 21/21 Q1003
SPECI 310,510Z 20023G34kt 0600 R21/0800 +TSRA OVC003 FEW050CB 21/21 Q1003
SPECI 310,610Z 150/08kt 2000 +TSRA SCT004 OVC046 FEW050CB 21/21 Q1004
METAR SUMU
Montevideo
310,000Z 00000kt 9999 OVC070 18/16 Q1011 TEMPO RA
310,300Z 310/03kt 2500 BR OVC070 17/17 Q1009 TEMPO RA
310,600Z 310/06kt 2500BR OVC030 16/16 Q1009 TEMPO RA
METAR SACO
Cordoba
31,000Z 170/09kt 9999 FEW018 SCT050 17/12 Q1015 NOSIG
310,300Z 240/05kt CAVOK 15/13 Q1016 NOSIG
310,600Z 300/01kt 9999 FEW020 FEW040CB 14/13 Q1013
METAR SAAR
Rosario
310,000Z 140/05kt 9999 FEW025 17/16 Q1011
310,300Z 180/06kt CAVOK 15/14 Q1012
310,600Z 180/07 CAVOK 14/13 1011
SGAS
Asuncion
310,000Z 050/05kt 9999 VCTS FEW040CB 30/24 Q1005
310,300Z 050/06kt 9999 VCTS FEW040CB 29/24 Q1007
310,600Z 050/05kt 010V130 9999 FEW033 BKN080 28/24 Q1005
Table 2. Troposphere characteristics summary (31 October 2018 at 6:00 am GMT).
Summer or Spring
+
Night or Dawn
+
Baroclinic Cyclone at Low Level
Meteorology 02 00001 i001
High
Troposphere
MCC located under the core of upper-level jet stream
MCC located between the inlet and outlet upper-level jet stream
Ridge at 200 hPa
Union of polar and subtropical jet streams.
Start of the MCC is located northwest of the maximum speed center at upper levels
[16,17]
Medium
Troposphere
West winds (close to 30° South) at 500 hPa between 40 m/s e 50 m/s
Trough at 500 hPa over the area (cold front reaches middle levels)
Negative Omega values (Ω) at 500 hPa (intense convective movement)
Heat advection in the layer 500–200 hPa
Low
Troposphere
Coupling of subtropical upper-level jets (200 hPa) with low-level jets (850 hPa)
Low-level jets coming from the north of South America.
Heat advection in the layer 1000–500 hPa.
A change in the direction/quadrant of the wind at the surface, which characterizes the arrival and passage of cold fronts.
(Analyzed by METAR and TAF)
Proximity to the MCC with a 20 °C isotherm on the surface
Windward of a mountain range (Andes Cordillera), parallel to the upper-level jets
Table 3. Operational proposals of minimize the negative MCC impacts on aircrafts.
Development of flight routes that do not cross climatologically potential MCC areas.
If it is impossible to carry out a flight that does not pass through an area with synoptic and cyclogenetic climatological characteristics, in certain seasons and time of the day, then it is proposed to add fuel to the flight, covering at least 480 km of lateral deviations, at flight level intended, since the average radius of MCCs is 240 km (average radius of MCCs in South America) [27].
Implementation of a meteorologist in the airline safety area. This professional will help the flight operational crew to develop a safe flight plan and make the right decisions in developing a flight plan.
Courses, developed by meteorologists, for target audiences such as pilots, flight dispatchers and flight controllers on cyclogenetic processes and MCCs.
Implementation and approval of ground meteorological radars to help lateral and vertical deviations of aircraft that encounter convective systems of this magnitude.
Development of meteorological radars on board the aircraft that are able to predict convective cells, MCCs and ice.
Disclaimer/Publisher’s Note: The statements, opinions and data contained in all publications are solely those of the individual author(s) and contributor(s) and not of MDPI and/or the editor(s). MDPI and/or the editor(s) disclaim responsibility for any injury to people or property resulting from any ideas, methods, instructions or products referred to in the content.

