Article

An Analysis of the Synoptic Dynamic and Hydrologic Character of the Black Sea Cyclone Falchion

1
Atmospheric Science Program, School of Natural Resources, University of Missouri, Columbia, MO 65211, USA
2
Faculty of Aeronautics and Astronautics, Department of Meteorological Engineering, Istanbul Technical University, Istanbul 34469, Turkey
3
Department of Military Training, Odessa State Environmental University, 65016 Odessa, Ukraine
*
Author to whom correspondence should be addressed.
Meteorology 2022, 1(4), 495-512; https://doi.org/10.3390/meteorology1040031
Submission received: 17 October 2022 / Revised: 22 November 2022 / Accepted: 29 November 2022 / Published: 2 December 2022
(This article belongs to the Special Issue Early Career Scientists' (ECS) Contributions to Meteorology (2022))

Abstract

:
In the Mediterranean and occasionally in the Black Sea, low-pressure systems with the character of both mid-latitude and tropical cyclones can form. These hybrid storms are called subtropical storms, subtropical depressions, medistorms/medicanes, or tropical-like cyclones (TLC). A strong low-pressure system given the name Falchion developed in northern part of the Black Sea during 11–20 August 2021. This storm was blamed for damage and more than 30 casualties in the nations bordering the region. At peak intensity, this storm was a as strong as a tropical depression. Falchion developed and moved northeast, reaching peak intensity before becoming nearly stationary. The NCEP reanalyses and satellite data obtained from Eumetsat’s geostationary satellite, Meteosat-8, were used to examine the character of the storm. This study demonstrates that the movement of Falchion was impeded by a blocking event that occurred over central Asia during much of August 2021. The storm did share characteristics with tropical systems, but a comparison of Falchion to tropical depressions and subtropical storms in the North and South Atlantic demonstrated that this storm was more consistent with these types of storms when examining the storm and the proximal environment. This included an examination of integrated water vapor (IVT) plumes, and the plume associated with Falchion did rise to the character of an atmospheric river in spite of the smaller scale.

1. Introduction

The study of the synoptic and dynamic character of extratropical cyclones dates back to the mid-20th century, and even earlier (e.g., [1]), as these events are a daily forecast challenge in meteorology. Additionally, the energy budgets of these cyclones were performed early on (e.g., [2,3]) and this is continued to date (e.g., [4]). The climatology of these events (e.g., [5,6]), including explosive cyclones [7] and their representation in climate models (e.g., [8]), has also been studied for many years. Their dynamic and thermodynamic structure has been studied extensively (e.g., [9,10]), including quasi-geostrophic forcing [11,12], the role of upper air forcing and jet maxima (e.g., [13,14]), the diabatic process [15], and others such as surface processes [16]. These cyclones are known to interact at the large scale specifically as they interact with blocking anticyclones (e.g., [17], and references therein).
It is typically thought that tropical cyclones are confined to the near-equatorial, or low-latitude regions of earth (e.g., [18]). Recognizable regions of tropical cyclogenesis include the Atlantic Ocean, the Gulf of Mexico, the Indian Ocean, the East Pacific, the West Pacific, and the Southern Hemisphere (e.g., [19]). In these regions, warm season sea surface temperatures help facilitate the energy flux from the sea surface to the atmosphere, which is necessary to enhance and sustain tropical vortices (e.g., [20,21,22]) and references therein). Traditional definitions of tropical cyclones (TCs) follow a relatively strict set of criteria to be classified as such: sea surface temperatures (SSTs) exceeding 26.5 °C in the waters in which they develop, a steep vertical lapse rate in temperature, high mid-tropospheric humidity, low wind shear throughout the depth of the troposphere, and a nonzero Coriolis force (e.g., [23,24,25,26,27,28]). Note, a list of all abbreviations used in this paper can be found at the end of this text. Additionally, TCs exhibit features that can be analyzed through satellite imagery (e.g., [20,29]); TCs are axisymmetric around a center of low pressure, display an eye due to subsidence at their center, and show anticyclonic flow aloft characteristic of a warm-core low-pressure system (LPS).
There are special cases, where cyclones, initially seen as extratropical, possess qualities more commonly associated with tropical systems. Previous studies have found that the lower-latitude region of the Mediterranean Sea is a hotbed for quasi-tropical systems aptly named “medicanes” (e.g., [30,31,32]). Medicanes are small, intense, warm-core marine cyclones that commonly form in the relatively warm SST region of the Mediterranean especially the Balearic and Ionian Seas. As with tropical cyclones, medicanes are axisymmetric about their respective core circulations. Medicanes have a lifespan greater than six hours and display a discernable eye surrounded by an eyewall of intense convection. Though considered a subclass of polar lows (e.g., [33,34]), medicanes are quite rare [35], with the authors of [30] identifying only six cases to possess all above characteristics occurring between 1982 and 2003.
Efimov et al. [36] examined the morphology of a specific case. In September of 2005, a cyclone in the Black Sea possessed traits consistent with tropical cyclones and the medicanes discussed above. In their case, an upper-level LPS formed over the Mediterranean coast of Spain and progressed eastward. A blocking anticyclone north of the Black Sea caused the upper-level low to become cut off over the Black Sea. The initially baroclinic system brought cooler air relative to the warm SSTs of the Black Sea nearing 23 °C. Intense energy and moisture flux from the sea surface into the lower atmosphere resulted in a massive reservoir of moisture and instability for convection around the center of circulation to feed off.
Intense latent heat release (LHR) from ensuing convection allowed a transition from a cold-core to a warm-core LPS. The authors of [36] identified four stages of evolution of this cyclone. The initial stage of this event possessed almost no discernable tropical qualities. The central low was a broad 1010 hPa, 100 km in radius, with no symmetry about its center. Maximum sustained winds were a relatively weak 30 knots. Twelve hours later, the cyclone reached its second stage dominated by rapid intensification. Central pressure dropped to 999 hPa and sustained winds jumped to 45 knots. The LHR that dominated the generation mechanism in the first stage was replaced by wind induced surface heat exchange (WISHE) from the stronger sustained winds. This rapid intensification stage persisted for nearly twenty-four hours before an identifiable third stage began. As the central radius decreased to 65 km, angular momentum conservation contributed towards a near perfectly axisymmetric storm. The shorter fourth stage was dominated by rapid decay of the cyclone upon making landfall. They [36] found this cyclone, lasting from 25 September to 28 September, when it made landfall and rapidly fell apart, to possess all the characteristics of a tropical cyclone. Thus, they deemed this cyclone in the Black Sea a quasi-tropical cyclone.
This study will focus on another case of an intense marine cyclone that occurred over the Black Sea in late August of 2021. The storm was named “Falchion” in the popular scientific literature (e.g., [37,38]). It is proposed here that the storm that occurred in the Black Sea between 7 and 15 August 2021 attained tropical-like characteristics during mid-life and may have reached tropical storm status. This paper will consider the same criteria discussed in the previous works above to ascertain whether the cyclone of interest exhibited any tropical qualities. Included herein is an examination of the satellite imagery to determine the physical attributes of this storm, an in-depth analysis of the synoptic scale setup for the event, and a look at satellite-derived SSTs to assess the maritime environment. Additionally, a comparison of Atlantic Region tropical cyclones and subtropical cyclones or hybrid events is performed in order to determine if this event was similar to a subtropical storm A direct comparison of the hydrological character of storms on the Black Sea to Atlantic Region TCs is not available in the literature to our knowledge. Section 2 will provide the data and methods, Section 3 will describe the analysis, and Section 4 will discuss the results and provide conclusions.

2. Data and Methods

2.1. Data

In order to visually analyze the structure of this cyclone, several data sources were used. Satellite imagery is used to examine the cloud and circulation characteristics in order to compare this cyclone to extratropical and tropical cyclones. Hourly satellite imagery (visible and infrared) spanning the lifecycle of this event was obtained from Eumetsat’s geostationary satellite, Meteosat [39] available from https://navigator.eumetsat.int/search?query=indian&filter=satellite__MSG&s=extended (accessed on 17 October 2022), or http://resources.eumetrain.org/ePort_MapViewer/index.html (accessed on 17 October 2022). Immediately preceding and succeeding landfall of the storm, sub-hourly imagery was used for greater detail on how the system behaved pre- and post-landfall. For the purposes of basic analysis, the 0.6 μm visible band and the 10.8 μm infrared band were used for daytime and night-time analysis, respectively. The dates of interest that we focused on were from 7 to 13 August 2021.
The National Centers for Environmental Prediction/National Center for Atmospheric Research (NCEP/NCAR) [40] and North American Regional Reanalyses (NARR) reanalysis imagery was obtained via the website [41] in order to examine large-scale variables including the environment of Falchion as well as blocking. Both of these data sets can be found at https://psl.noaa.gov/data/reanalysis/reanalysis.shtml (accessed on 10 November 2022), and the NCEP/NCAR and NARR re-analyses are available at six and three hourly intervals, respectively. The 1200 UTC data were used since these contain more observations (e.g., [10]). The NCEP/NCAR reanalyses had a resolution of 2.5 degrees latitude by longitude, while the NARR resolution was one degree latitude by longitude. A list of all blocking events and their characteristics are found on the University of Missouri Archive [42] and this information is available at https://weather.missouri.edu/gcc (accessed on 10 November 2022). The primary variables used were, geopotential height (m), air temperature (K), and relative humidity. An analysis of SSTs, integrated water vapor transport (IVT), and surface latent heat fluxes (LHFs) was also completed. The IVT and LHF information was provided by the European Centre for Medium Range Forecasts (ECMWF) reanalyses set version 5 (ERA5) [43] available through https://cds.climate.copernicus.eu/cdsapp#!/home (accessed on 17 October 2022). The SST information was accessed via http://apdrc.soest.hawaii.edu/las/v6/dataset?catitem=1228 (accessed on 17 October 2022) and is the National Oceanic and Atmospheric Administration (NOAA) Optimum Interpolation SSTs (OISSTs) daily Version 2 data set. This analysis will showcase whether the event that occurred over the Black Sea possessed at least some tropical character. As noted by [44], for example, the development of a tropical depression into a hurricane requires heat energy derived from the ocean surface. For this reason, TCs do not usually develop over land or outside of the warm tropical oceans where the SST is colder than ~26.5 °C (~80 °F).

2.2. Study Region

The study region (Figure 1) was primarily the environment of the Black Sea Region which is where this storm completed its lifecycle. We widened the temporal and spatial scales in order to study the blocking event associated with this cyclone. The primary dates that were analyzed span the 7–13 August 2021 time period. The primary dates for the occurrence of Falchion were 11–13 August 2021.

2.3. Methods

The methods used here were both subjective and objective. The synoptic-dynamic analysis in Section 3 examined variables often used in the study of mid-latitude cyclones (sea level pressure or SLP, 850 hPa temperature and wind, 700 hPa vertical motions, 500 hPa height, and 250 hPa wind). Satellite analysis was used to locate stronger convection. The NCEP/NCAR reanalyses were used to examine the environment of Falchion and assess whether or not it possessed characteristics typically associated with mid-latitude cyclones and their development, as well as a comparison of threshold values for environmental character associated with TCs (e.g., vertical wind shear, SST). Surface variables such as the latent heat fluxes (LHFs) were also examined.
Additionally, the IVT and LHF character of Falchion were examined and compared to those of seven randomly chosen Atlantic Region TC and subtropical cyclones. The only requirement was that these TC and subtropical storms were within the NARR domain so that these could be sampled easily There were two weak TC/subtropical storms chosen one early in the Atlantic Season the other late. Two very powerful TCs were also chosen to show an extreme event. Three other TC of more moderate intensity were chosen across the Atlantic tropical season.
Additionally, the magnitude of the IVT streamers (calculated as in [45] and references therein) feeding into Falchion was examined in order to determine whether the water vapor feeding into the storm possessed the character of an atmospheric river (AR) over North America (e.g., [45]). The criterion used in [45] was that the water transport should maximize at greater than 500 kg m−1 s−1 (e.g., [46]) and these IVT transport maxima should persist for a minimum of 12 h (e.g., [47]) though some recommend a longer period (e.g., 48 h—[48]). Finally, the Glossary of Meteorology [49] defines an AR as being at least 850 km in width and [45] determines this using the 250 kg m−1 s−1 contour. Neiman et al. [50] suggested the ratio of the length to with should be 2:1.

3. Results

The Black Sea cyclone Falchion began as a broad area of low pressure over the central Black Sea on 7 August 2021 (Figure 1). The storm moved northeast over the Black Sea toward the Azov Sea. The storm became more organized and retrograded (Figure 1 and Figure 2A) on 10 August. After 10 August, the LPS moved across the Black Sea going ashore near Crimea, southeastern Ukraine, and southwestern Russia (Figure 1 and Figure 2B) by 12–13 August. As can be seen in the Airmass RGB color images (Figure 2C,D), the cyclone was initially filled with cold air in deep tropospheric trough. At the same time, intense stratospheric intrusions into the cyclogenesis area related to upper-tropospheric jets and associated potential vorticity (PV) anomalies were not observed.
Atmospheric fronts typically associated with mid-latitude cyclones were only weakly expressed in the temperature field with Falchion but were well traced in the cloud fields. On the visible satellite images, the well-developed cloudiness of the warm front was observed, with the formation of organized convective systems along the entire frontal cloud band. The convection was especially intense in the southern part of the cyclone (Figure 2C,D and Figure 3).
From the enhanced infrared (IR) satellite map, the storm appears to have a closed circulation and an ‘eye-like’ feature for 12–13 August (Figure 3C,D), which is not uncommon for storms of this type over the Mediterranean. Strong convection is present in the northeast quadrant of the storm and appears to be closer to the center as the storm gets closer to landfall on the north side of the Black Sea. Shortly thereafter, the cyclone made landfall, the eye closed in, and the circulation broadened. Convection at the center began to die as the cyclone entered a stage dominated by rapid decay. As seen in the enhanced IR imagery, the system retrogressed yet again, and positioned itself over the Sea of Azov. The smaller spatial scope of this body of water was not enough to sustain what visible tropical characteristics it briefly possessed. Additionally, the storm itself was of very small scale; however, the character of this storm could be determined even from more coarse resolution data such as the NCEP/NCAR reanalyses.

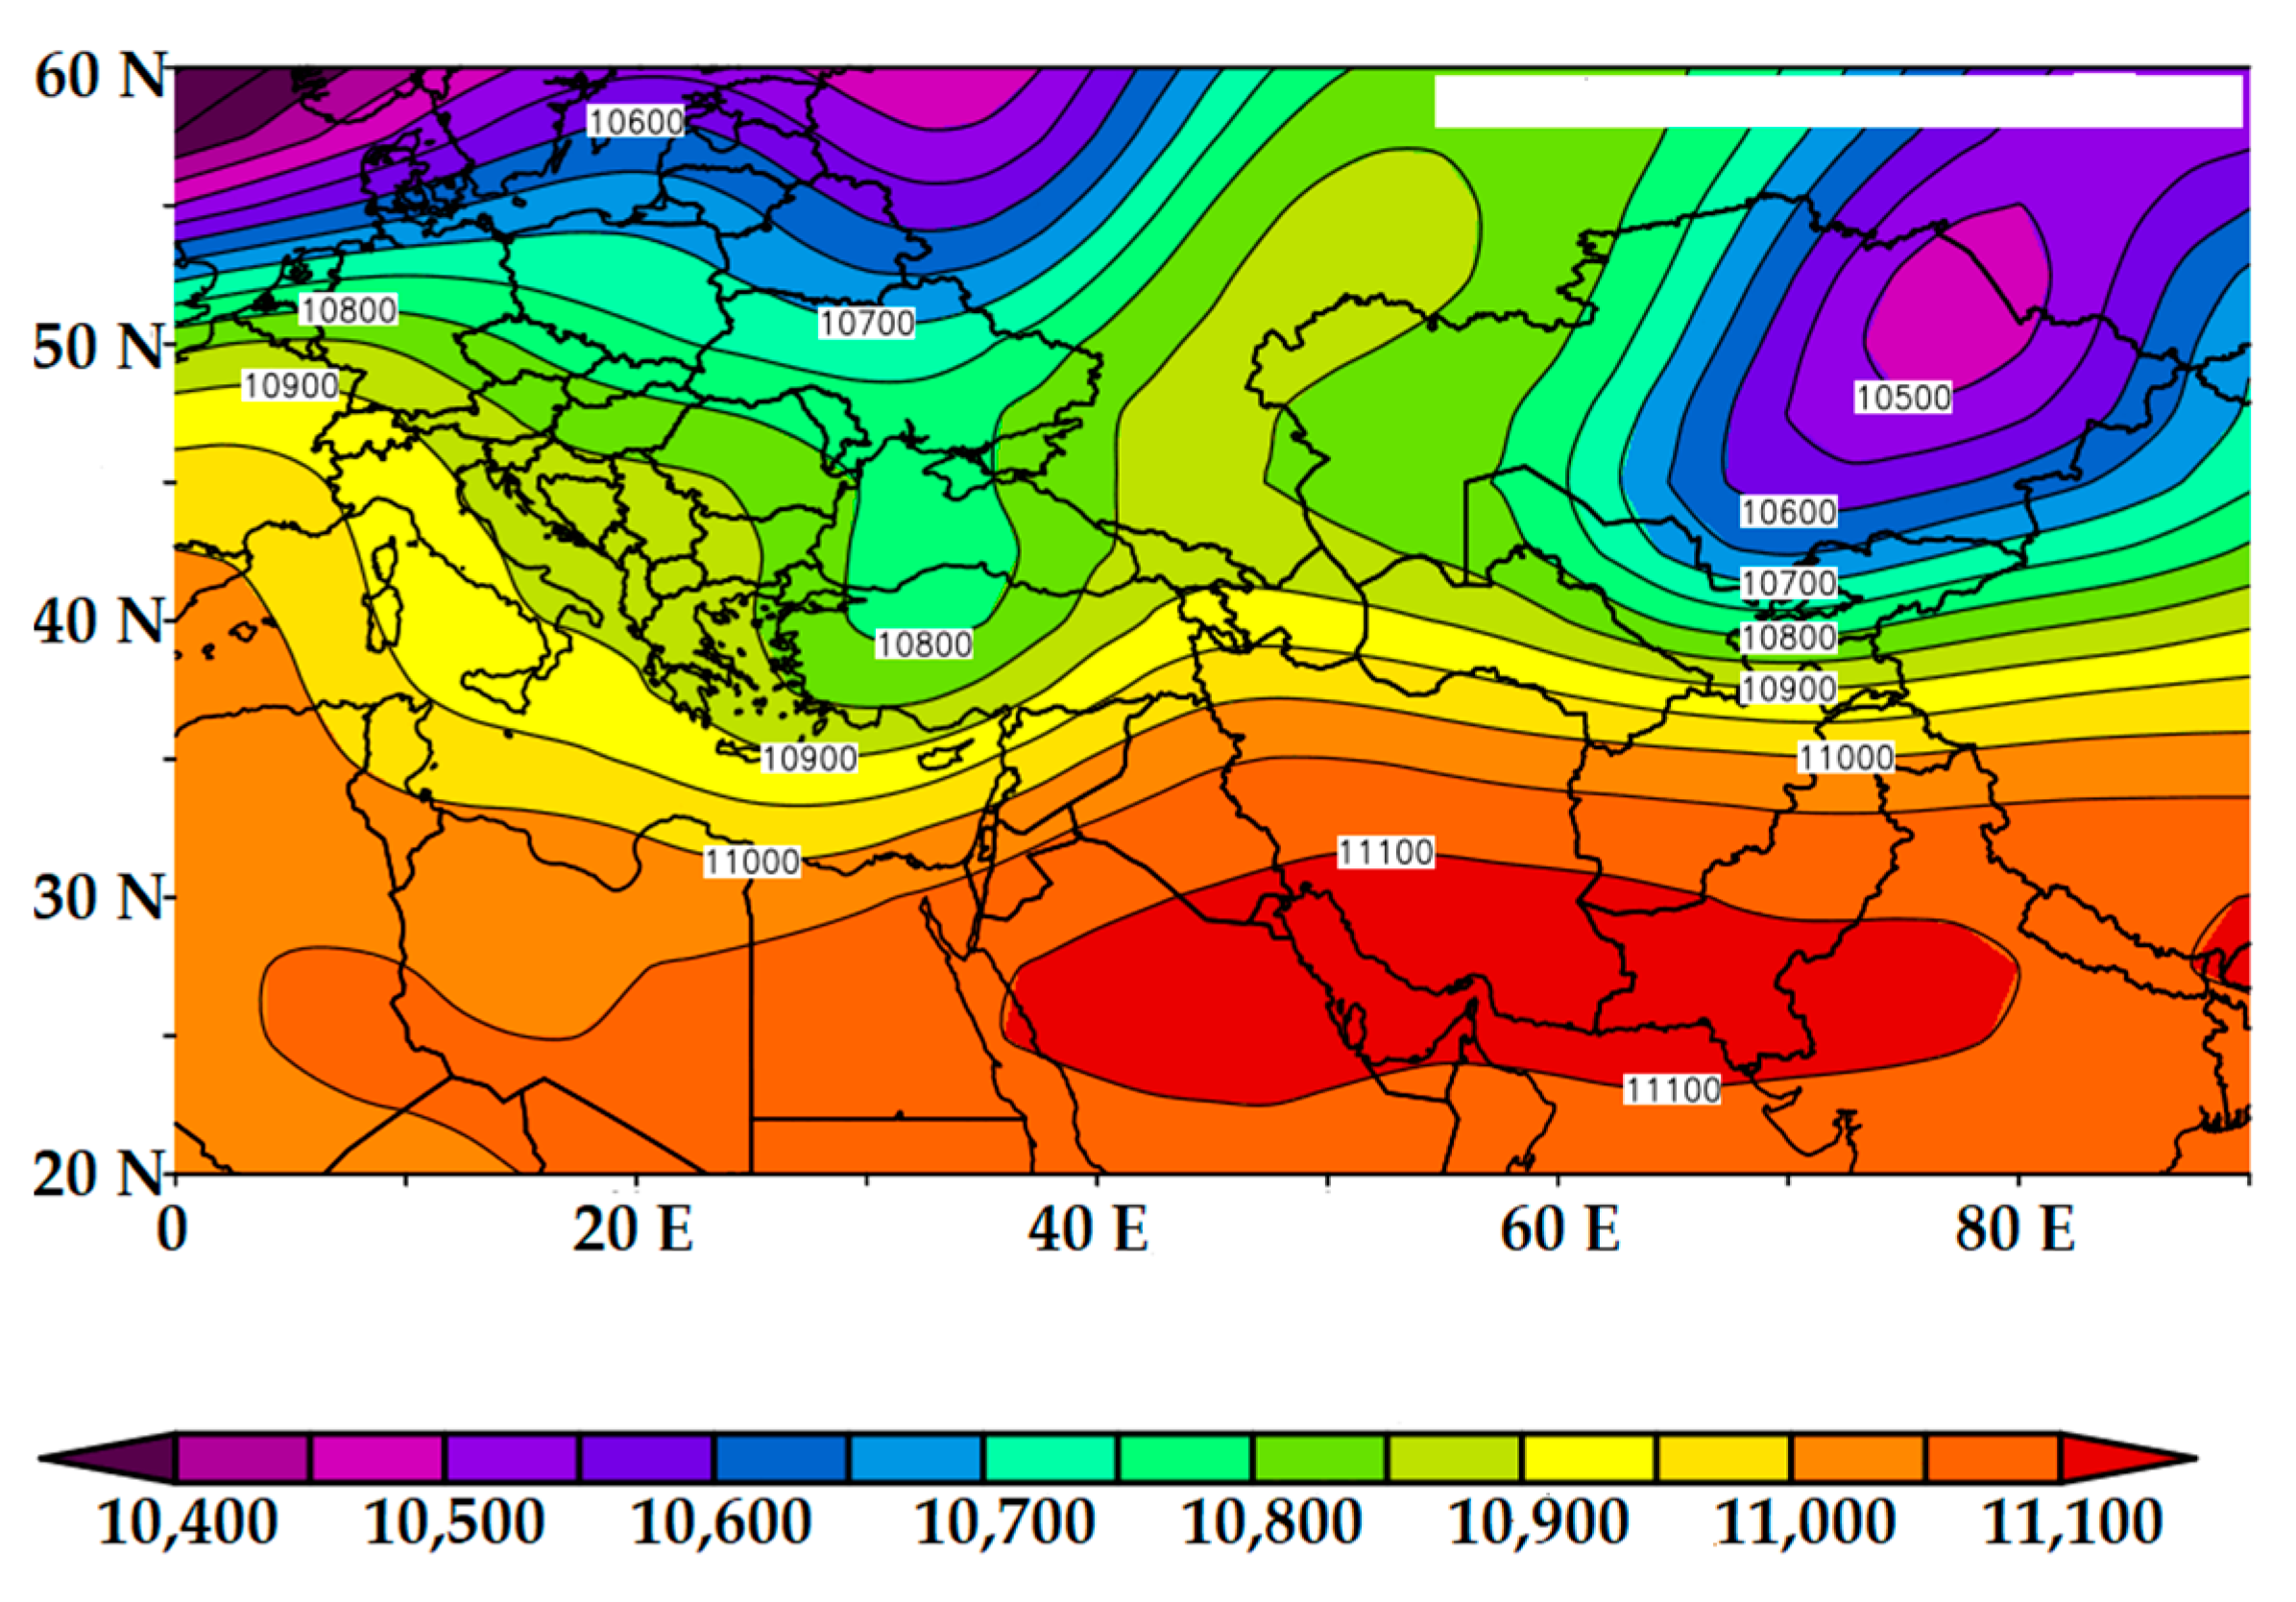
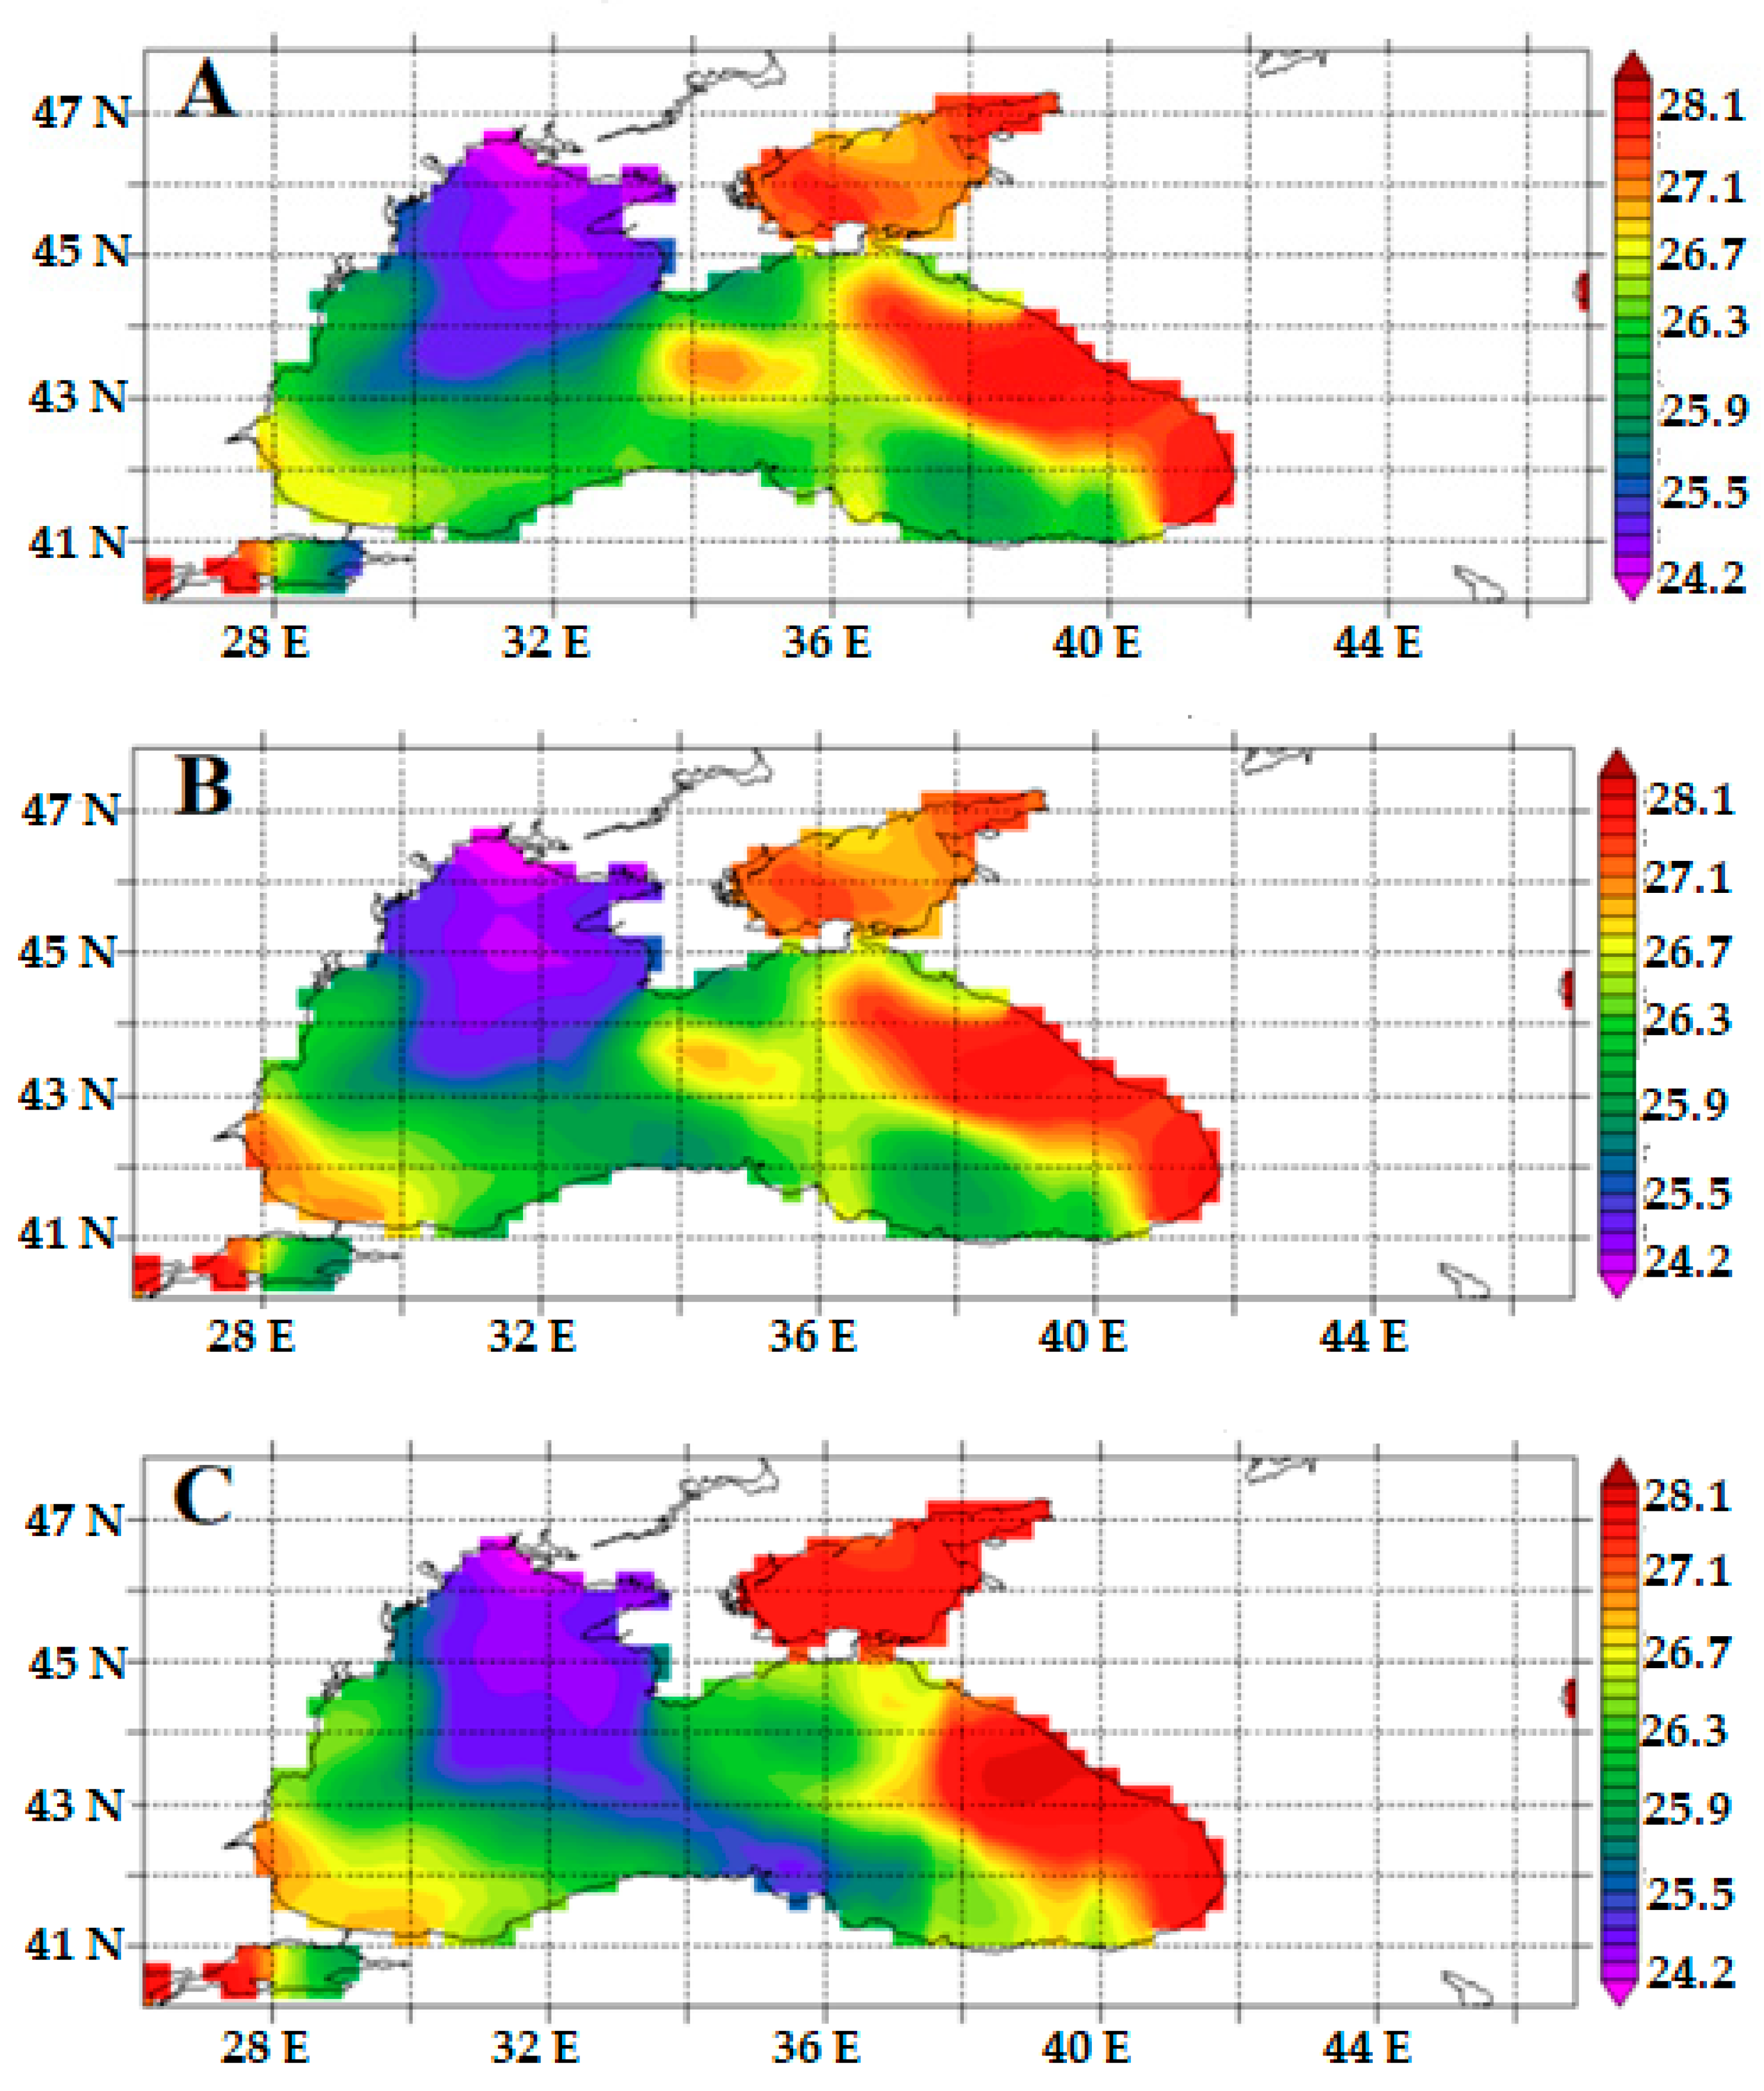
3.1. Synoptic-Dynamic Analysis

Figure 4 below shows synoptic maps for 1200 UTC 7 August 2021, which displays the synoptic environment just before Falchion appeared. At that time, the broad area of higher sea level pressure (Figure 4A) over southeast Europe north Africa and the near east noted above can be seen clearly. A weak low pressure that would become Falchion is over the far northeast Black Sea. A visible satellite image would show convection over central Anatolia (not shown). At 850 hPa (Figure 4B), a broad temperature gradient oriented in a zonal direction was noted extending from central Europe through Kazakhstan. A trough-ridge couplet was present over the Black Sea region, and the temperature gradient here was oriented southwest to northeast. Two low-level jet maxima were noted over northern Europe and the eastern Mediterranean at 850 hPa and a cyclonic circulation exists over the eastern Black Sea (Figure 4C). Figure 4D shows upward motion over North Africa, eastern Black Sea, and over Anatolia, while downward motion is shown over central and Eastern Europe. A negatively tilted short-wave trough was present at 500 hPa (Figure 4E) over southeast Europe and the Black Sea, while a broad ridge is present over western Russia and the Middle East (from roughly 30°–60° N and 30°–60° E). Lastly, Figure 4F shows 250 hPa jet maxima coincident with the 850 hPa temperature and 500 hPa height gradients, respectively.
At 1200 UTC 10 August 2021, an area of lower pressure was noted again over the northeast Black Sea region (Figure 1, Figure 2A,C and Figure 5A) with a central pressure of less than 1012 hPa. Figure 5B,C shows cooler air at 850 hPa associated with the storm as well as a jet maximum over the central and eastern Mediterranean with a cyclonic circulation over the eastern Black Sea. Then, at 700 hPa (Figure 5D) upward motion was present and strongest on the east side of the storm and associated with the convection discussed above. At 500 hPa (Figure 5E) the tough ridge pattern over the Black Sea and Western Russia has amplified and according to [42] this ridge would be classified as a mid-latitude blocking anticyclone event 12 h later according to definitions found in [17]. A 250 hPa (Figure 5F) jet maximum is located within the western flank of the 500 hPa trough, a position which favors deepening of the surface system as well as the upper air trough. Lastly, there does not appear to be a strong westward tilt between 850 and 500 hPa that would be associated with a strongly baroclinic mid-latitude system (e.g., [51] and references therein).
During the next 48 h (by 1200 UTC 12 August 2021), the SLP shows lower pressure in the Black Sea (Figure 6A—see bold L). The 850 hPa trough and ridge in the temperature field (Figure 6B) suggest the low pressure resided in a lower tropospheric baroclinic zone. This is more typical of an extratropical cyclone. Figure 6C shows the 850 hPa winds suggest a very tight counterclockwise circulation (see wind vectors) over the eastern Black Sea as in Figure 2C and Figure 4C although the strongest 700 hPa upward motions (Figure 6D) are southeast of the cyclonic circulation in association with convection over Black Sea. The 500 hPa trough has weakened somewhat (Figure 6E) as a blocking event has become established over western Russia. The 250 hPa winds (Figure 6F) shows the eastern Black Sea region is in a zone that supports upper-level divergence, which is supporting upward motions. The strong southerly jet maximum in western Russia is likely contributing to the influx of anticyclonic vorticity and low PV air associated with the onset of blocking (see [17] and references therein).
In [36], the development of a Black Sea storm similar to Falchion during 25–26 September 2005 occurred near the end of a blocking event over central Asia, while in this case Falchion developed during and shortly after the onset of this blocking event. Additionally, the blocking event reached a local maximum in Block Intensity (BI = 2.27) shortly after onset (e.g., 0000 UTC 11 August—see [14,17] and references therein) and this local maximum was likely at least partly the result of interaction between Falchion and the nascent blocking event (e.g., [14] and references therein). Another pre-blocking mid-latitude cyclone developed over the North Sea during 9–11 August 2021, and this upstream cyclone is also in position to interact with the large-scale ridge and blocking as in [14].
By 1200 UTC 13 August 2021, a closed low-pressure contour (Figure 7A—see bold L)) is evident even in the NCEP/NCAR reanalysis field with a central pressure of approximately 1010 hPa. The low pressure is still located within an 850 hPa baroclinic zone (Figure 7B). There still is a circulation in the 850 hPa wind field (Figure 7C), although the strongest winds are to the west of the surface system. At this time, the strongest upward motions are located close to the center of the cyclone, but the strongest values are northeast (Figure 7D). The associated 500 hPa trough (Figure 7E) continued weakening while the upward motion over eastern Black Sea region and near the cyclone continued to be supported by the 250 hPa flow (Figure 7F).
The weakening of the 500 hPa trough was an interesting development during 12 and 13 August 2021. A composite of the 500 hPa temperature field from 11 to 13 August 2021 (Figure 8) shows that the eastern Black Sea region is associated with warmer temperatures than the surrounding environment, or the LPS possessed a warm core. From 7 to 9 August, the 500 hPa trough would have indicated the system was clearly cold core (not shown) but implied in Figure 2 on 10 August 2021. The weakening of the 500 hPa (or mid-tropospheric) trough as the LPS becomes warm core would be characteristic of a TC. However, the trough at 250 hPa on 1200 UTC 13 August 2021 is still present (Figure 7F and Figure 9), and as stated above there appeared to be divergent flow over Falchion. The support of upper tropospheric flow usually associated with mid-latitude cyclone intensification being involved in the intensification of TCs has been known since at least the 1990s [52] with the study of Hurricane Opal in the Gulf of Mexico, USA. A similar mechanism seems to have been operating here. Additionally, the wind fields are vertically stacked when comparing Figure 7B,F over the eastern Black Sea, and the value of the vertical wind shear from 850 to 250 hPa at 1200 UTC 13 August 2021 was approximately 11–13 m s−1 at maximum. This is less than the 15 m s−1 often cited as a favorable condition for TC development. Thus, it is apparent that Falchion possessed the characteristics of both a mid-latitude cyclone as well as a TC.

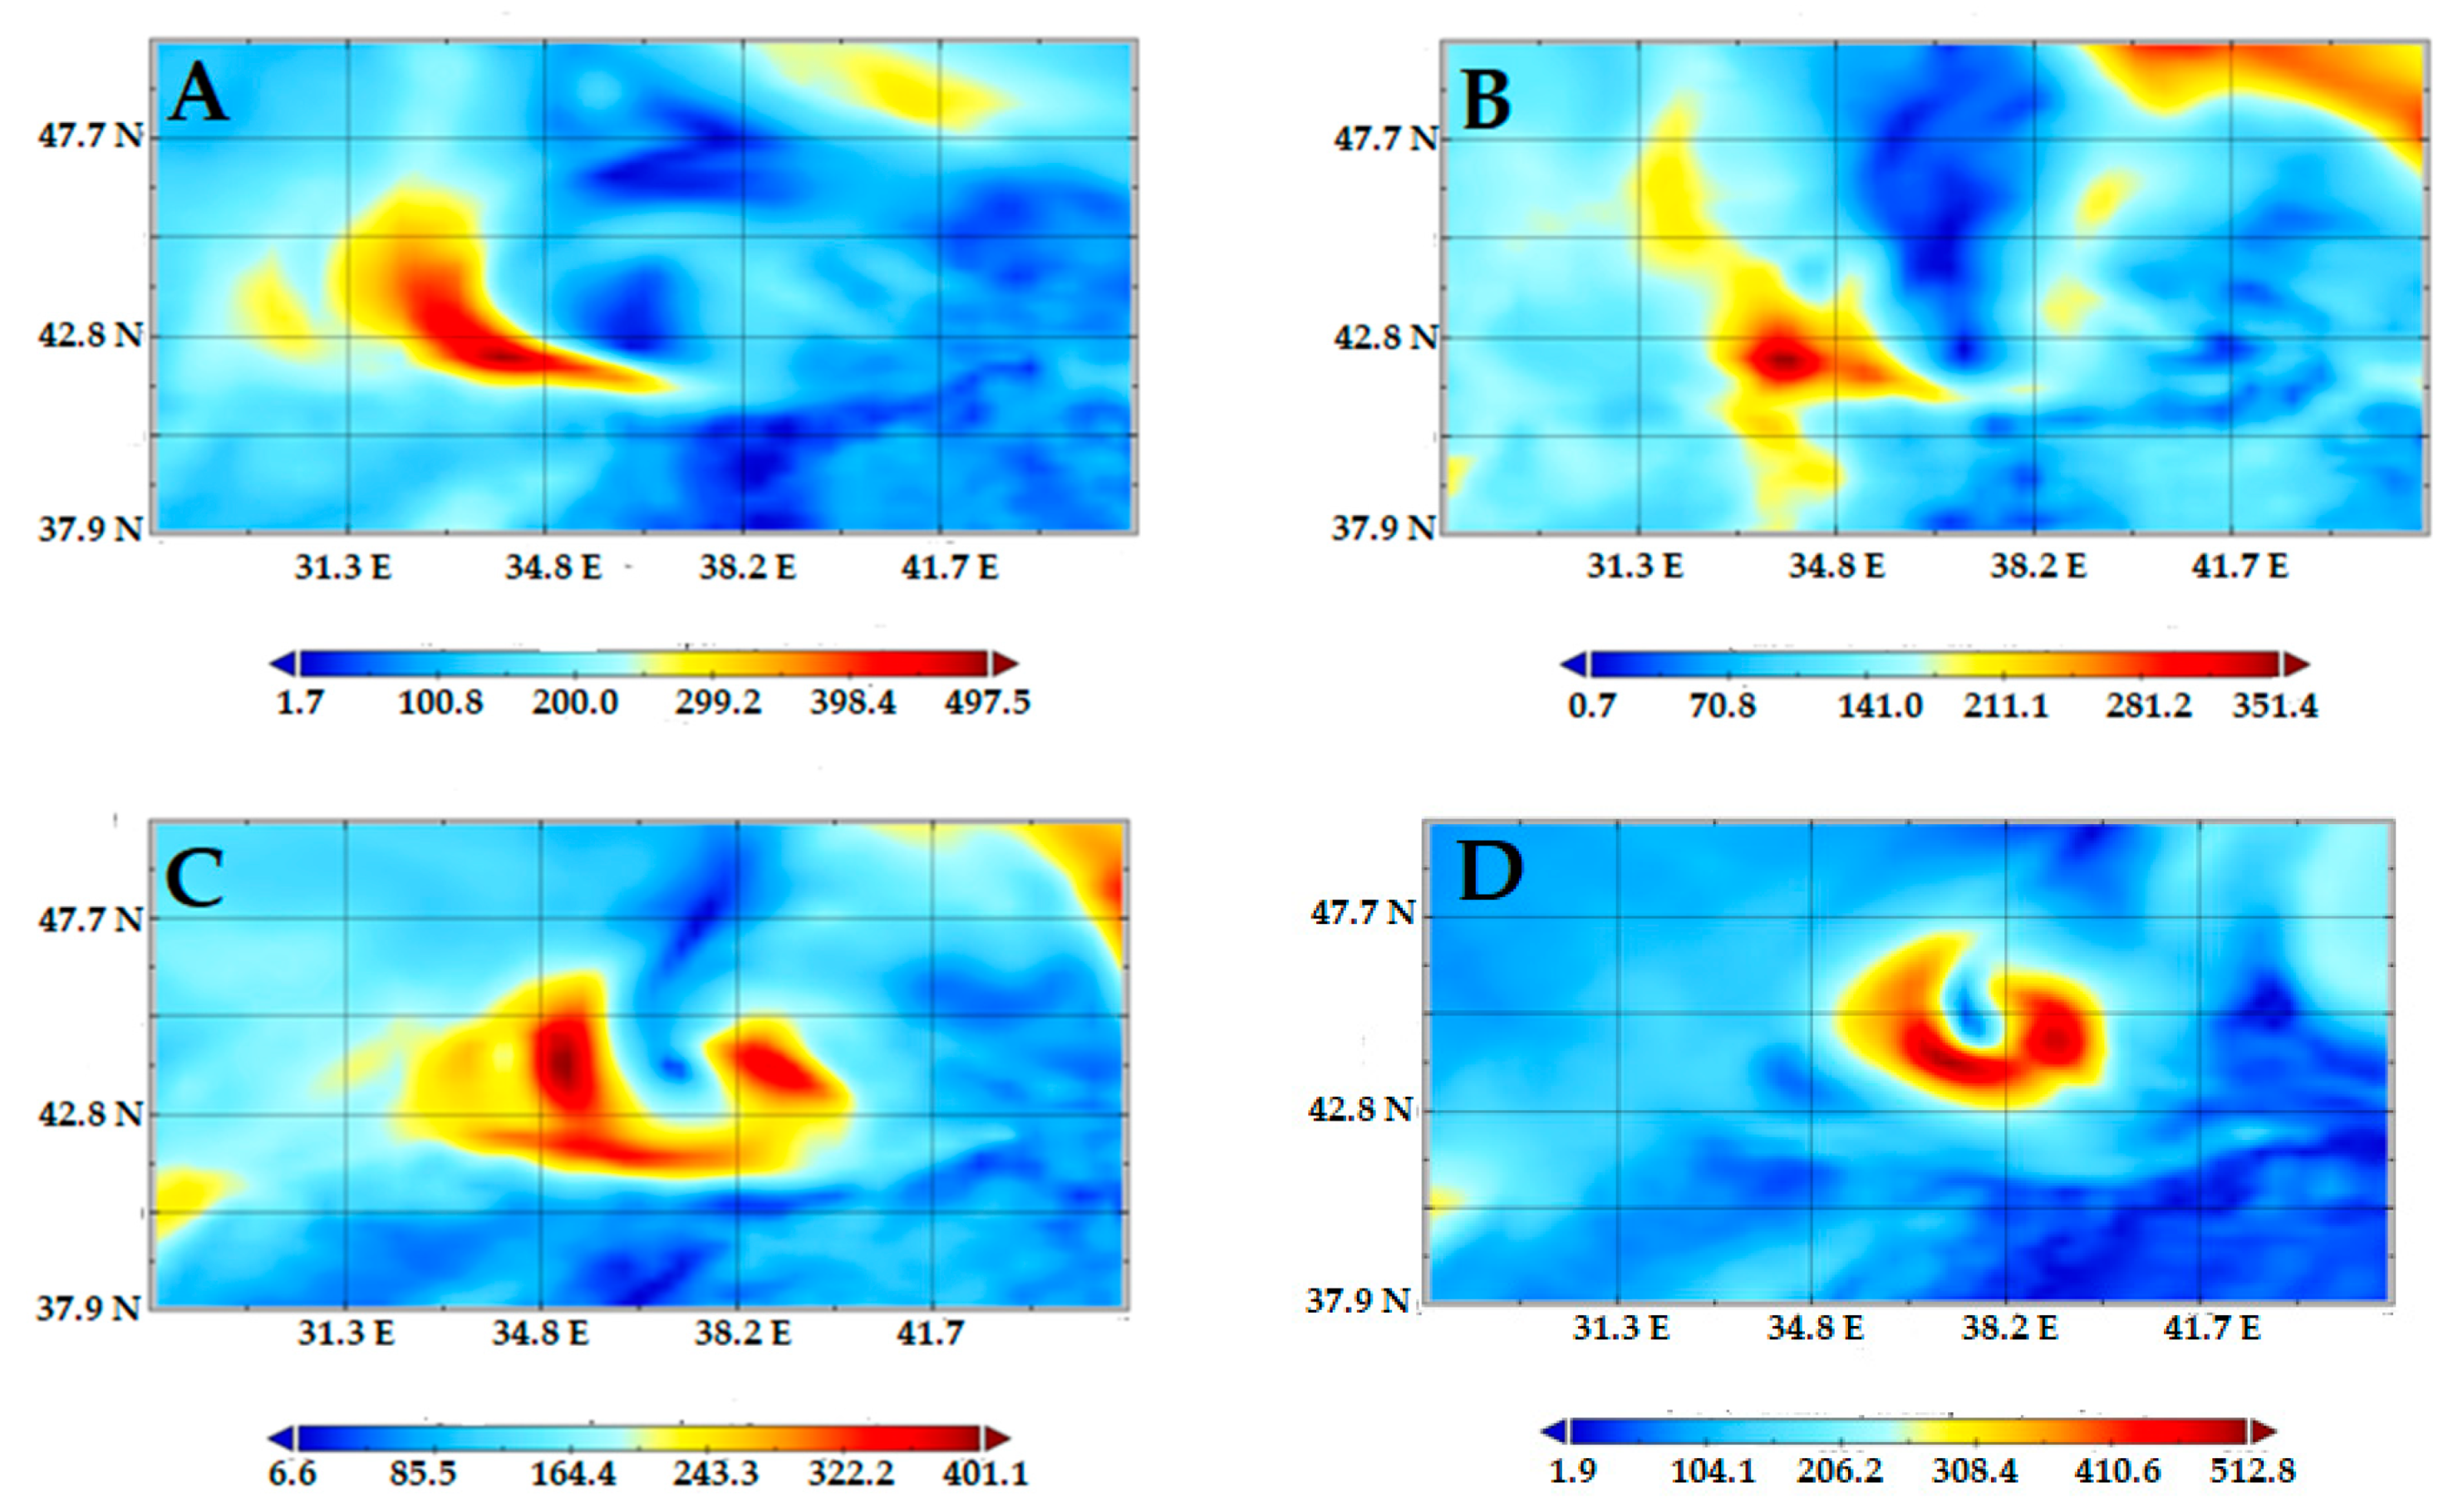
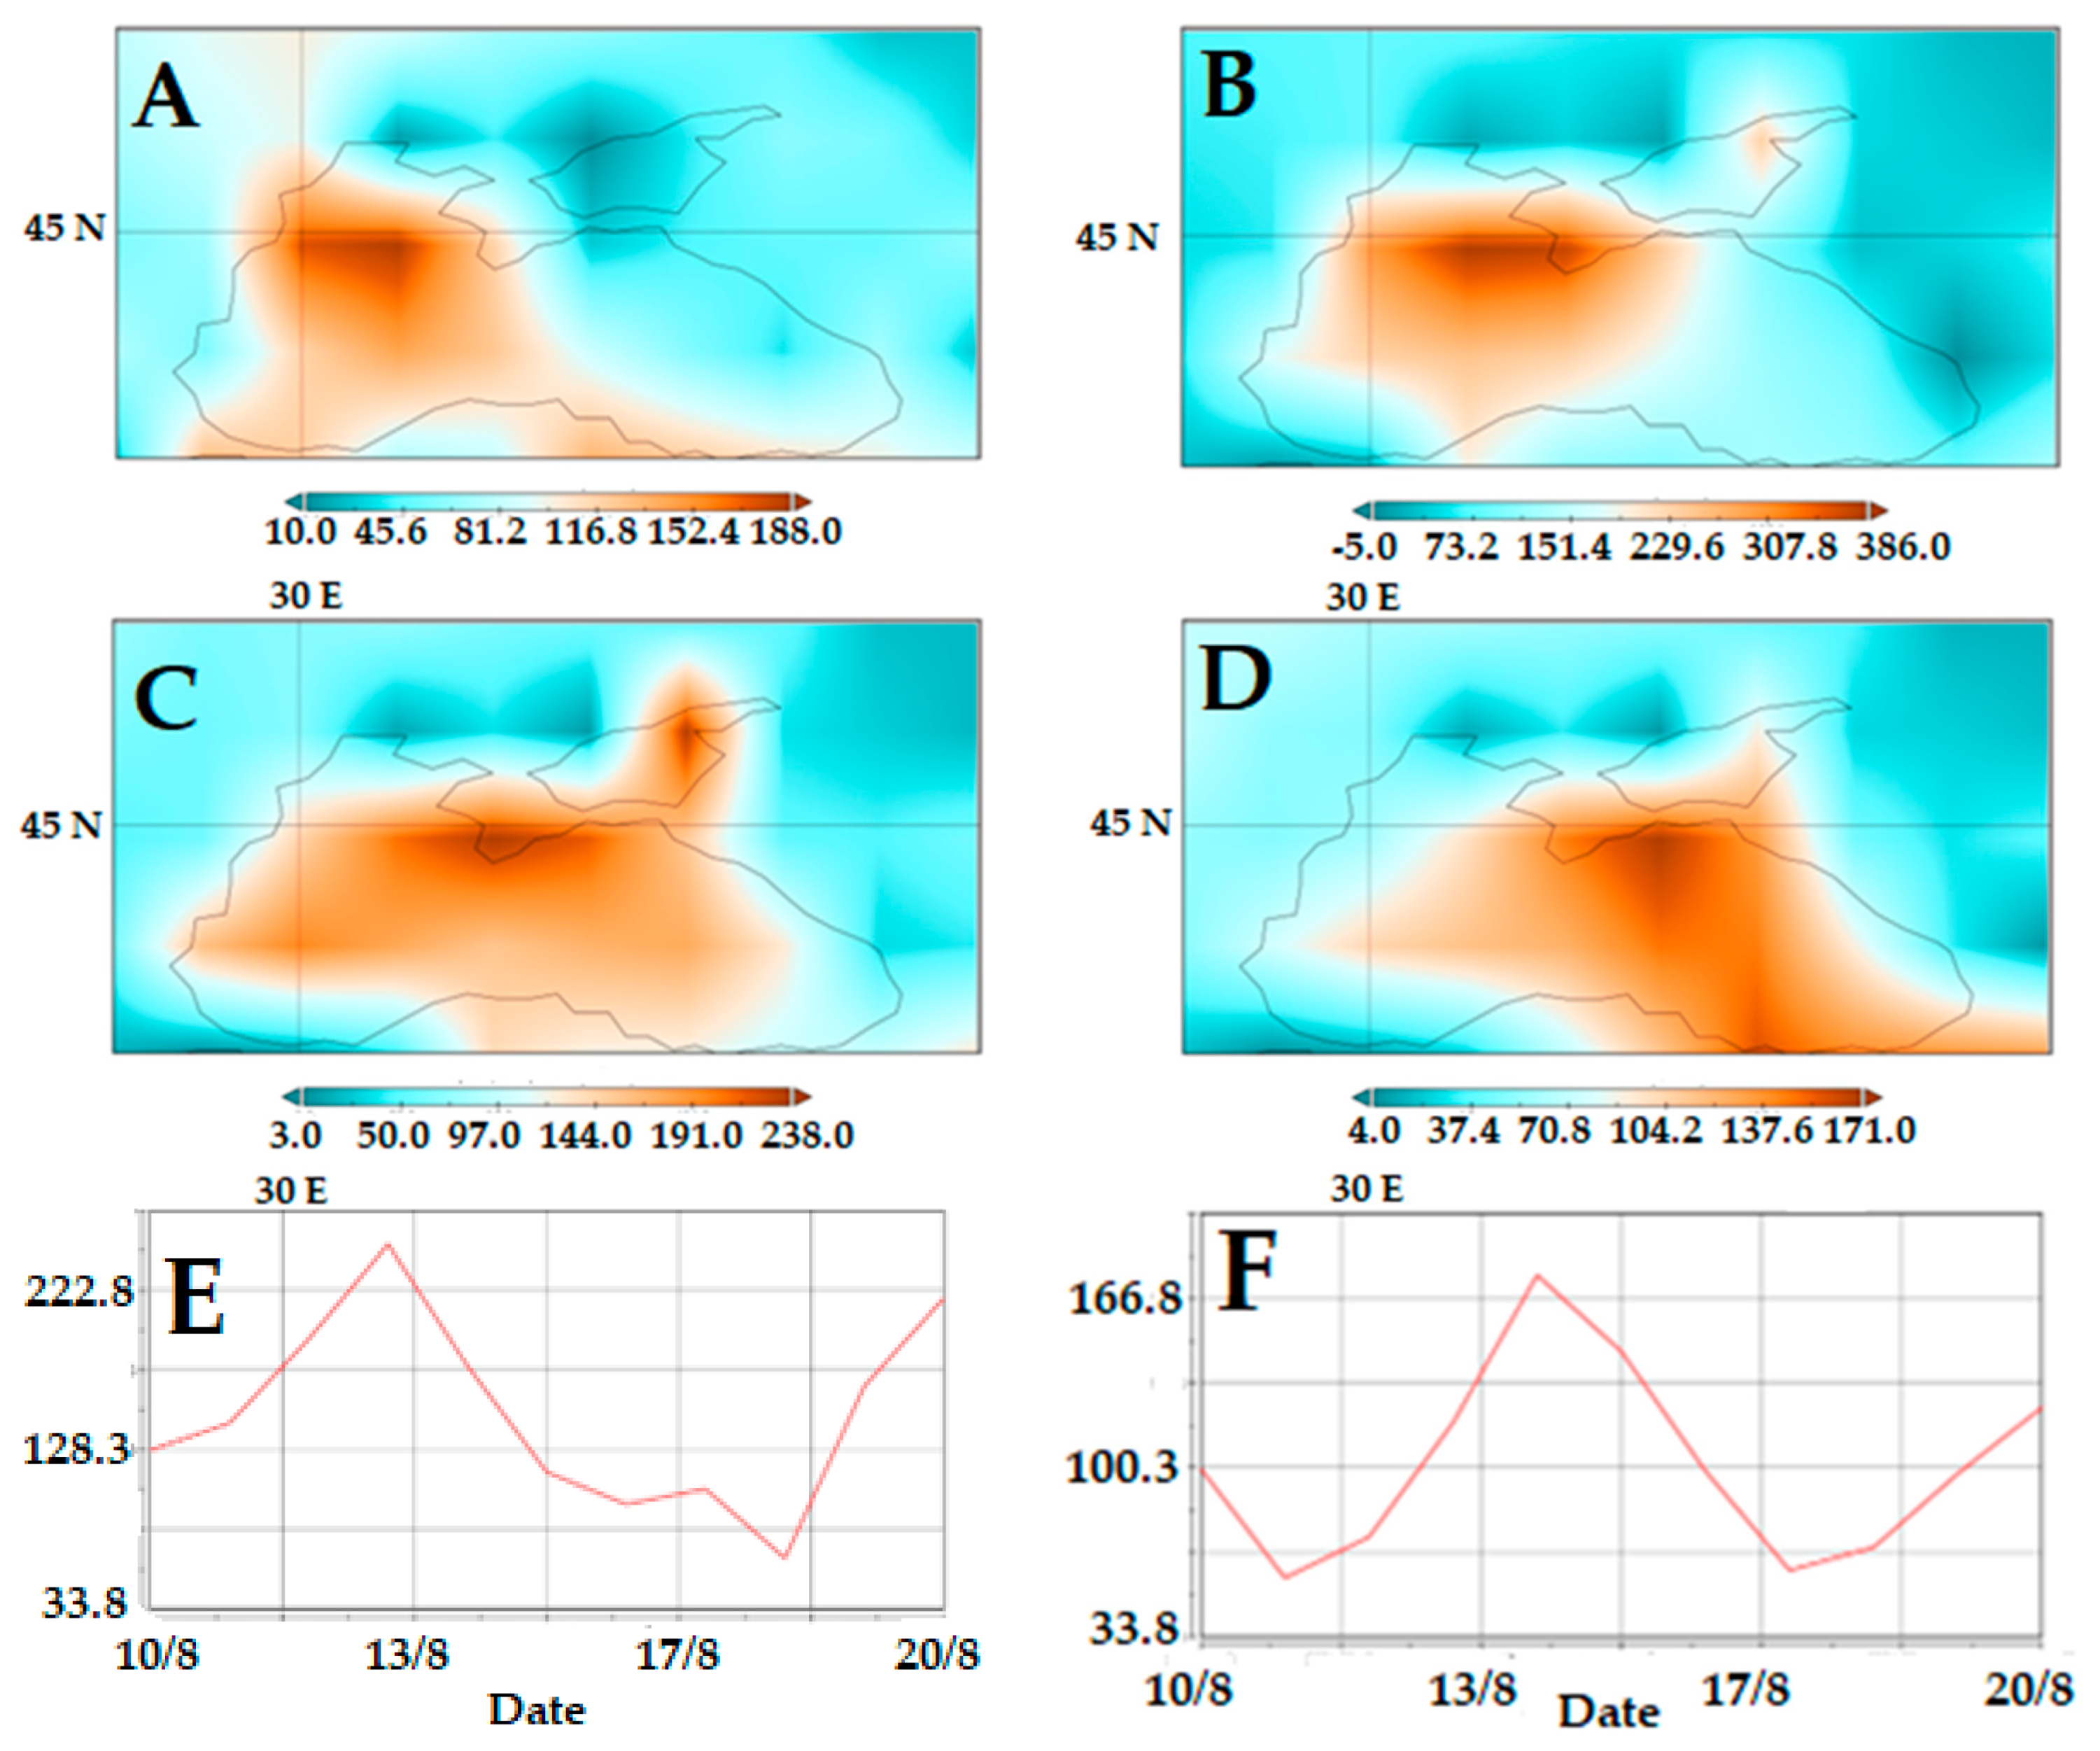
3.2. Moisture Analysis

In this section, the SSTs were examined. Additionally, the IVT and LHFs within Falchion were compared to the IVT and LHFs in seven TC and subtropical cyclones over the Atlantic Ocean Basin and close to North America (Table 1 and Table 2). These TCs were chosen at random in order to cover the spectrum of TC strengths, time of year, and sub-basin. The only requirement was the storm had to occur within the NARR domain.
The SSTs over the Black Sea close to the time of maximum intensity for Falchion were shown in Figure 10. The SSTs were generally above 23.5 °C for these three days. However, they were below 26.5 °C over most to the Black Sea, which is the commonly used SST threshold for examining the potential for TC development. During the three-day period, SSTs were above 26.5 °C over the extreme western Black Sea, eastern Black Sea, and the Sea of Azov.
While most TC develop over SSTs greater than 26.5 °C, there are well-known storms that occurred within cool SST environments. Hurricane Catarina in March 2004 over the South Atlantic occurred in an environment where the SSTs were close to 25 °C (e.g., [53,54]). Thus, when Falchion was over the Black Sea, it was within an environment that was consistent with that of Catarina. Additionally, while most of the storms in Table 1 occur within SST environments that were above the threshold mentioned above, Subtropical Storm Nicole developed just below the SST criterion as well. Additionally, Zuki and Lupo [55] demonstrate that the relationship between SST and TC development/intensification is not linear and that cooler SSTs can be associated with more active TC development as long as the atmosphere is also favorable to tropical development.
An examination of the IVT character of Falchion (Figure 11, Table 1) demonstrates that the IVT plume associated with Falchion would attain the threshold for the IVT transport at over 500 kg m−1 s−1 associated with ARs studied in [45] and references therein. This IVT plume also meets the minimum duration criterion. The only criterion that this IVT plume would fail is the minimum width of 850 km, even though the length to width ratio is close to 2:1 as defined by [50]. The maximum length here was approximately 750 km on 12 August.
Examining the IVT within Falchion and comparing to randomly chosen TC and subtropical storms over the Atlantic Ocean Basin shows that the values associated with Falchion were smaller than even a marginal tropical storm (Bret), although the values are consistent. If Bret was sampled during the day before and after those listed in Table 1, the mean value for Bret would be approximately 499 IVT units or more consistent with those of Falchion. Otherwise, moderate and very strong TCs are associated with IVT values much larger than Falchion and the IVT numbers shown here seem to correlate to the strength of the storm, though a much larger study would be needed to confirm this.
The LHF reflects the nature of the interaction between the sea surface and the atmosphere associated with the processes of condensation and evaporation, which can be especially intense during cyclogenesis. The analysis of the LHF fields showed that the highest LHF near the beginning of cyclone development was observed in the western part of the Black Sea (Figure 12A,B) and reached a maximum on 13 August 2021 (386 W/m2). This region was under the influence of air on the upstream part of the trough near the surface and in the troposphere, which contributed to the advection of cold air and the LHR into the atmosphere during evaporation from the sea surface. Considering the structure of the circulation associated with the surface cyclone, the advection of the latent heat from the western part of the Black Sea area to its eastern part could contribute to an increase in convective instability in the cyclone area during its development. The increase in convective instability is due to heating of the lower layers and enhancing the vertical temperature gradient.
The importance of the influence of advective LHFs in TCs was noted, for example, in [56]. On 14 and 15 August 2021, the intensity of LHFs decreased (Figure 12C,D), and the maximum shifted to the eastern part of the Black Sea, on the upstream side of the cyclone, which reached a maximum depth and moved over the coastal region. In the following days, the LHFs decreased over the entire sea and reached a minimum on 17–18 August (Figure 12E,F), when the cyclone became completely filled. A similar distribution of LHFs was found earlier in extratropical cyclones over the ocean, when the maximum LHF was observed in the cold part of the cyclone, and evaporation from the sea surface was enhanced by upstream winds (e.g., [57] and many others).
A comparison of the LHFs here to the tropical systems in Table 2 reveals that the LHFs associated with Falchion were consistent with those of the weaker (and mid-season) TCs such as Bret, Fay and Andrea, while the more powerful storms had the highest LHF. The two late-season subtropical storms were associated with higher LHFs likely due to the colder air drawn into their environment in the western Atlantic over relatively warm SSTs.

4. Discussion and Conclusions

In this paper, an analysis of the Black Sea Storm named Falchion, which occurred from 7 to 14 August 2021, was carried out using synoptic-dynamic qualitative techniques and quantitative hydrometeorological information. This storm seemed to possess the character of a hybrid tropical and extratropical storm. These storms occur often in the Mediterranean and occasionally in the Black Sea, and Falchion did cause some damage as it moved ashore over the Eastern Black Sea region. There are not many studies of Black Sea cyclones of this type, although several have studied similar storms in the Mediterranean. Using the NCEP/NCAR reanalyses, the NARR data set, satellite analysis, as well as SSTs, the synoptic dynamic and hydrological character of Falchion was studied with the goal of comparing this storm to TCs.
The synoptic dynamic analysis showed that in the lower troposphere, especially during the early phases of Falchion, the storm possessed the character of an extratropical cyclone in that there was temperature contrast across the development area of the storm. However, there was no strong westward tilt with height that would be associated with an extratropical cyclone.
Falchion occurred on the upstream side of a blocking event which onset during the time Falchion began to deepen. The onset of this blocking event was also associated with an upstream mid-latitude surface cyclone as posited by previous researchers. The strength of this blocking maximized shortly after onset and as Falchion began to develop more tropical character. A previously studied Black Sea cyclone also occurred in association with a blocking event in 2005, but that blocking event was at the end of its lifecycle. Thus, it is difficult to speculate how much influence Falchion had on the downstream block, though it is likely it partly influenced strengthening at onset.
Later, Falchion developed more tropical character including the development of an eye-like feature, a warm core, and weaker vertical wind shear. Additionally, while the Black Sea did not meet the SST threshold for TC development across the entire body of water, the SSTs were above 25° C across much of this body of water. Studies of TCs have shown they can develop over water that is under the threshold as long as the atmospheric character is favorable. Additionally, subtropical storm Nicole (Table 1) developed in such an environment.
Lastly, Falchion was associated with a IVT plume that had the character of an AR which might occur over North America with the exception of the actual length and width. However, more study could be done on AR in this part of the world in order to determine if these tend to be smaller in scaler. Additionally, Falchion did have an IVT plume somewhat consistent with that of the IVT associated with a very marginal TC in the Gulf of Mexico. However, the SSTs associated with Tropical Strom Bret were warmer than those associated with Falchion. On the other hand, if the day before and after the period in Table 1 were used for Bret, the IVT would be more comparable to Falchion. Expanding the number of TCs studied in the Atlantic may also find events with lower IVT values, especially later in the season.
Examining LHFs for Falchion revealed that these were consistent with those of mid-season TC in our small sample. Larger LHFs were associated with stronger or late-season TCs. Expanding the number of TCs studied as suggested above would also put Falchion in a stronger statistical context. Overall, this study showed that Falchion was at least partly tropical, and that the storm would compare favorably with a weak Atlantic TC.

Author Contributions

Conceptualization, A.R.L., I.G.S. and V.Y.; methodology, all; software, V.Y.; validation, A.R.L., I.G.S. and S.M.W.; formal analysis, all; investigation, all; resources, all; data curation, A.R.L. and I.G.S.; writing—original draft preparation, S.M.W., E.J.T. and A.R.L.; writing—review and editing, all; visualization, all; supervision, A.R.L. and I.G.S.; project administration, A.R.L. and I.G.S.; funding acquisition, none. All authors have read and agreed to the published version of the manuscript.

Funding

This research received no external funding.

Data Availability Statement

Most of the results in this paper are analyzed from products available online. Information regarding blocking can be found at http://weather.missouri.edu/gcc.

Acknowledgments

The authors would like to acknowledge the two anonymous reviewers for their time and effort in making suggestions which strengthened this work.

Conflicts of Interest

The authors declare no conflict of interest.

Abbreviations

Here is a list of abbreviations used in this paper in alphabetical order.
ARatmospheric rivers
BIblock intensity
ERA5European Centre for Medium Range Forecasts (ECMWF) reanalyses set version 5
IRinfrared
IVTintegrated water vapor transport
LHF(s)surface latent heat flux(es)
LHRlatent heat release
LPSlow-pressure system
NARRNorth American Regional Reanalyses
NCEP/NCARNational Centers for Environmental Prediction/National Center for Atmospheric Research
NOAANational Oceanic and Atmospheric Administration
OISSTOptimum Interpolation SSTs
PVpotential vorticity
SLPsea level pressure
SST(s) sea surface temperature(s)
TC(s) tropical cyclone(s)
WISHE wind induced surface heat exchange

References

  1. Hosler, C.L.; Gamage, L.A. Cyclone frequencies in the United States for the period 1905–1954. Mon. Weather Rev. 1956, 84, 388–390. [Google Scholar] [CrossRef]
  2. Kung, E.C. Energy sources in middle-latitude synoptic-scale disturbances. J. Atmos. Sci. 1977, 34, 1352–1365. [Google Scholar] [CrossRef]
  3. Smith, P.J. The energetics of extratropical cyclones. Rev. Geophys. 1980, 18, 378–386. [Google Scholar] [CrossRef]
  4. Okajima, S.; Nakamura, H.; Kaspi, Y. Cyclonic and anticyclonic contributions to atmospheric energetics. Nat. Sci. Rep. 2021, 11, 13202. [Google Scholar] [CrossRef]
  5. Zishka, K.M.; Smith, P.J. The climatology of cyclones and anticyclones over North America and surrounding environs for January and July 1950–77. Mon. Weather Rev. 1980, 108, 387–401. [Google Scholar] [CrossRef]
  6. Key, J.R.; Chan, A.C.K. Multidecadal global and regional trends in 1000 mb and 500 mb cyclone frequencies. Geophys. Res. Lett. 1999, 26, 2053–2056. [Google Scholar] [CrossRef]
  7. Sanders, F.; Gyakum, J.R. Synoptic-dynamic climatology of the ”bomb”. Mon. Weather Rev. 1980, 108, 1589–1606. [Google Scholar] [CrossRef]
  8. Eichler, T.P.; Gaggini, N.; Pan, Z. Impacts of global warming on Northern Hemisphere winter storm tracks in the CMIP5 model suite. J. Geophys. Res. Atmos. 2013, 118, 3919–3932. [Google Scholar] [CrossRef]
  9. Gyakum, J.R. On the evolution of the QE II storm. Part II: Dynamic and thermodynamic structure. Mon. Weather Rev. 1983, 111, 1156–1173. [Google Scholar] [CrossRef]
  10. Lupo, A.R.; Smith, P.J.; Zwack, P. A diagnosis of the development of two extra-tropical cyclones. Mon. Weather Rev. 1992, 120, 1490–1523. [Google Scholar] [CrossRef]
  11. Petterssen, S. Weather Analysis and Forecasting, 2nd ed.; Mc Graw-Hill: New York, NY, USA, 1956; Volume I, p. 428. [Google Scholar]
  12. Haltiner, G.J.; Martin, F.L. Dynamical and Physical Meteorology; Mc Graw-Hill: New York, NY, USA, 1957; p. 470. [Google Scholar]
  13. Uccellini, L.W.; Petersen, R.A.; Brill, K.F.; Kocin, P.J.; Tuccillo, J.J. Synergistic interactions between an upper-level jet streak and diabatic processes that influence the development of a low-level jet and a secondary coastal cyclone. Mon. Weather Rev. 1987, 115, 2227–2261. [Google Scholar] [CrossRef]
  14. Reynolds, D.D.; Lupo, A.R.; Jensen, A.D.; Market, P.S. The Predictability of Northern Hemispheric Blocking Using an Ensemble Mean Forecast System. Proceedings 2017, 1, 87. [Google Scholar]
  15. Lin, S.C.; Smith, P.J. Diabatic heating and generation of available potential energy in a tornado-producing extratropical cyclone. Mon. Weather Rev. 1979, 107, 1169–1183. [Google Scholar] [CrossRef]
  16. Kuo, Y.H.; Reed, R.J.; Low-Nam, S. Effects of surface energy fluxes during the early development and rapid intensification stages of seven explosive cyclones in the western Atlantic. Mon. Weather Rev. 1991, 119, 457–476. [Google Scholar] [CrossRef]
  17. Lupo, A.R. Atmospheric blocking events: A review. Ann. N. Y. Acad. Sci. 2021, 1504, 5–24. [Google Scholar] [CrossRef]
  18. Krishnamurti, T.N. A diagnostic balance model for studies of weather systems of low and high latitudes, Rossby number less than 1. Mon. Weather Rev. 1968, 96, 197–207. [Google Scholar] [CrossRef]
  19. Lupo, A.R.; Heaven, B.; Matzen, J.; Rabinowitz, J.L. The Interannual and Interdecadal Variability in Tropical Cyclone Activity: A Decade of Changes in the Climatological Character. Reviewed Book; In Current Topics in Tropical Cyclone Research; Lupo, A.P., Ed.; Intech Publishers: Houston, TX, USA, 2020; Chapter 1; pp. 22, 158. [Google Scholar]
  20. Houze, R.A. Clouds in tropical cyclones. Mon. Weather Rev. 2010, 138, 293–344. [Google Scholar] [CrossRef]
  21. Emanuel, K. 100 years of progress in tropical cyclone research. Meteorol. Monogr. 2018, 59, 15.1–15.68. [Google Scholar] [CrossRef]
  22. Levina, G.V. On the path from the turbulent vortex dynamo theory to diagnosis of tropical cyclogenesis. Open J. Fluid Dyn. 2018, 8, 86–114. [Google Scholar] [CrossRef] [Green Version]
  23. Palmen, E. On the formation and structure of tropical cyclones. Geophysics 1948, 3, 26–38. [Google Scholar]
  24. Riehl, H. On the formation of typhoons. J. Meteorol. 1948, 5, 247–264. [Google Scholar] [CrossRef]
  25. Gray, W.M. Global view of the origin of tropical disturbances and storms. Mon. Weather Rev. 1968, 96, 669–700. [Google Scholar] [CrossRef]
  26. Shapiro, L.J.; Goldenberg, S.B. Atlantic sea surface temperatures and tropical cyclone formation. J. Clim. 1998, 11, 578–590. [Google Scholar] [CrossRef]
  27. Landsea, C.W.; Pielke, R.A., Jr.; Mestas-Nunez, A.M.; Knaff, J.A. Atlantic basin hurricanes: Indices of climatic changes. Clim. Change 1999, 42, 89–129. [Google Scholar] [CrossRef]
  28. DeMaria, M.; Knaff, J.A.; Connell, B.H. A Tropical Cyclone Genesis Parameter for the Tropical Atlantic. Weather. Forecast. 2001, 16, 219–233. [Google Scholar] [CrossRef]
  29. Velden, C.; Olander, T.L.; Zehr, R.M. Development of an Objective Scheme to Estimate Tropical Cyclone Intensity from Digital Geostationary Satellite Infrared Imagery. Weather. Forecast. 1998, 13, 172–186. [Google Scholar] [CrossRef]
  30. Tous, M.; Romero, R. Meteorological environments associated with medicane development. Int. J. Climatol. 2013, 33, 1–14. [Google Scholar] [CrossRef]
  31. Tous, M.; Romero, R.; Ramis, C. Surface heat fluxes influence on medicane trajectories and intensification. Atmos. Res. 2013, 123, 400–411. [Google Scholar] [CrossRef]
  32. Akhtar, N.; Brauch, J.; Dobler, A.; Beranger, K.; Ahrens, B. Medicanes in an ocean-atmosphere coupled regional climate model. Nat. Hazards Earth Syst. Sci. 2014, 14, 2189–2201. [Google Scholar] [CrossRef] [Green Version]
  33. Rasmussen, E.; Zick, C. A subsynoptic vortex over the Mediterranean with some resemblance to polar lows. Tellus A Dyn. Meteorol. Oceanogr. 1987, 39, 408–425. [Google Scholar] [CrossRef] [Green Version]
  34. Businger, S.; Reed, R. Cyclogenesis in cold air masses. Weather. Forecast. 1989, 4, 133–156. [Google Scholar] [CrossRef]
  35. Cavicchia, L.; von Storch, H.; Gualdi, S. A long-term climatology of medicanes. Clim. Dyn. 2013, 43, 1183–1195. [Google Scholar] [CrossRef]
  36. Efimov, V.; Stanichny, S.; Shokurov, M.V.; Iarovaia, D. Observations of a Quasi-Tropical Cyclone over the Black Sea. Russ. Meteorol. Hydrol. 2008, 33, 233–239. [Google Scholar] [CrossRef]
  37. Blaskvoic, T. Medistorm Falchion Forms in the Black Sea, Bringing Heavy Rains & Flood. Available online: https://watchers.news/2021/08/13/medistorm-falchion-black-sea-august2021/ (accessed on 8 October 2021).
  38. DeFluri, J. Black Sea Medicane or Not? Available online: https://www.stratumfive.com/industry/black-sea-medicane-or-not/ (accessed on 8 October 2021).
  39. EUMETSAT. Product Navigator. Available online: https://navigator.eumetsat.int/search?query=indian&filter=satellite__MSG&s=extended (accessed on 9 December 2021).
  40. Kalnay, E.; Kanamitsu, M.; Kistler, R.; Collins, W.; Deaven, D.; Gandin, L.; Iredell, M.; Saha, S.; White, G.; Woollen, J.; et al. The NCEP/NCAR 40-year reanalysis project. Bull. Am. Meteorol. Soc. 1996, 77, 437–471. [Google Scholar] [CrossRef]
  41. National Oceanic and Atmospheric Administration Physical Sciences Laboratory NCEP/NCAR Reanalyses. Available online: https://www.psl.noaa.gov/data/gridded/data.ncep.reanalysis.html (accessed on 17 August 2022).
  42. University of Missouri Blocking Archive. 2021. Available online: http://weather.missouri.edu/gcc/ (accessed on 17 June 2021).
  43. ECMWF Reanalyses Version 5. Available online: https://cds.climate.copernicus.eu/cdsapp#!/home (accessed on 17 August 2022).
  44. Whitaker, D. 2014: Hurricanes and Sea Surface Temperature. Available online: https://ie.unc.edu/wp-content/uploads/sites/277/2014/12/Hurricanes-and-sea-surfacetemperature.pdf (accessed on 21 July 2022).
  45. Rabinowitz, J.L.; Lupo, A.R.; Market, P.S.; Guinan, P.E. An Investigation of Atmospheric Rivers Impacting Heavy Rainfall Events in the North-Central Mississippi River Valley. Int. J. Climatol. 2019, 39, 4091–4106. [Google Scholar] [CrossRef]
  46. Mahoney, K.; Jackson, D.L.; Neiman, P.; Hughes, M.; Darby, L.; Wick, G.; White, A.; Sukovich, E.; Cifelli, R. Understanding the role of atmospheric rivers in heavy precipitation in the Southeast United States. Mon. Weather Rev. 2016, 144, 1617–1632. [Google Scholar] [CrossRef]
  47. Miller, D.K.; Hotz, D.; Winton, J.; Stewart, L. Investigation of atmospheric rivers impacting the Pigeon River basin of the southern Appalachian Mountains. Weather. Forecast. 2018, 33, 283–299. [Google Scholar] [CrossRef]
  48. Debbage, N.; Miller, P.; Poore, S.; Morano, K.; Mote, T.; Sheppard, J.M. A climatology of atmospheric river interactions with the southeastern United States coastline. Int. J. Climatol. 2017, 37, 4077–4091. [Google Scholar] [CrossRef]
  49. American Meteorological Society. Glossary of Meteorology; American Meteorological Society: Boston, MA, USA, 2017; Available online: http://glossary.ametsoc.org/wiki/Atmospheric_river (accessed on 7 February 2019).
  50. Neiman, P.J.; Ralph, F.M.; Wick, G.A.; Lundquist, J.D.; Dettinger, M.D. Meteorological characteristics and overland precipitation aspects of atmospheric rivers affecting the west coast of North America based on eight years of SSM/I satellite observations. J. Hydrometeorol. 2008, 9, 22–47. [Google Scholar]
  51. Davis, C.A.; Emanuel, K.A. Potential vorticity diagnostics of cyclogenesis. Mon. Wea. Rev. 1991, 119, 1929–1953. [Google Scholar] [CrossRef]
  52. Bosart, L.F.; Velden, C.S.; Bracken, W.E.; Molinari, J.; Black, P.J. Environmental Influences on the Rapid Intensification of Hurricane Opal (1995) over the Gulf of Mexico. Mon. Weather Rev. 1995, 128, 322–352. [Google Scholar] [CrossRef]
  53. McTaggart-Cowan, R.; Bosart, L.F.; Davis, C.A.; Atallah, E.H.; Gyakum, J.R.; Emanuel, K.A. Analysis of Hurricane Catarina (2004). Mon. Weather Rev. 2006, 134, 3029–3053. [Google Scholar] [CrossRef]
  54. Filho, A.J.P.; Bernardes, A.P.; Simmonds, I.; Lima, R.S.; Vianna, M. New perspectives on the synoptic and mesoscale structure of Hurricane Catarina. Atmos. Res. 2010, 95, 157–171. [Google Scholar] [CrossRef]
  55. Zuki, M.Z.; Lupo, A.R. The interannual variability of tropical cyclone activity in the Southern South China Sea. J. Geophys. Res. 2008, 113, D06106. [Google Scholar] [CrossRef] [Green Version]
  56. Ermakov, D.M.; Sharkov, E.A.; Chernushich, A.P. Role of Tropospheric Latent Heat Advective Fluxes in the Intensification of Tropical Cyclones. Izv. Atmos. Ocean. Phys. 2019, 55, 1254–1265. [Google Scholar] [CrossRef]
  57. Sutil, U.A.; Pezzi, L.P.; Alves, R.C.M.; Nunes, A.B. Ocean-Atmosphere Interactions in an Extratropical Cyclone in the Southwest Atlantic. Anuário do Inst. Geociências—UFRJ 2019, 42, 525–535. [Google Scholar] [CrossRef]
Figure 1. The study region. The position of the low pressure at 0000 UTC from 7 to 14 August is given. The day is given as the subscript.
Meteorology 01 00031 g001
Figure 2. The surface analysis at 1200 UTC for (A) 10 and (B) 12 August 2021; the Airmass RGB images at (C) 1200 UTC 10 August 2021 and (D) 0600 UTC 13 August 2021. The black lines are SLP isobars (hPa).
Meteorology 01 00031 g002
Figure 3. The enhanced IR satellite maps for the Black Sea Region at 0000 UTC for (A) 10, (B) 11, (C) 12, (D) 13 August 2021. The blue lines are 700 hPa height lines (m).
Meteorology 01 00031 g003
Figure 4. The (A) sea level pressure (Pa), (B) 850 hPa temperature (K), (C) 850 hPa wind speed (m s−1), (D) 700 hPa vertical motion (ω—Pa s−1), (E) 500 hPa height (m), and (F) 250 hPa wind speed (m s−1) for 1200 UTC 7 August 2021. The contour intervals are 400 Pa, 3 K, 3 m s−1, 0.1 Pa s−1, 60 m, and 5 m s−1, respectively. In (A), the low pressure is marked with a white L and the line in (E) is the trough. These data were obtained from [40].
Meteorology 01 00031 g004
Figure 5. As in Figure 4, except for 1200 UTC 10 August 2021. In (A), the low pressure is in black.
Meteorology 01 00031 g005
Figure 6. As in Figure 4, except for 1200 UTC 12 August 2021. In (E), the blocking event is marked with an H and omega.
Meteorology 01 00031 g006
Figure 7. As in Figure 4, except for 1200 UTC 13 August 2022.
Meteorology 01 00031 g007
Figure 8. The composite 500 hPa temperature (K) for 11–13 August 2021. The contour interval is 1 K.
Meteorology 01 00031 g008
Figure 9. The 250 hPa geopotential height (m) for 1200 UTC 13 August 2021. The contour interval is 50 m.
Meteorology 01 00031 g009
Figure 10. The SSTs (°C right ordinate) over the Black Sea for 0000 UTC on (A) 11, (B) 12, and (C) 13 August 2021.
Meteorology 01 00031 g010
Figure 11. The IVT (kg m−1 s−1—unit is on the color bar) associated with the near environment Black Sea cyclone Falchion, where the dates for each is (A) 10, (B) 11, (C) 12, (D) 13 August 2021.
Meteorology 01 00031 g011
Figure 12. Latent heat fluxes (W∙m−2 unit is on the color bar) fields over the Black Sea for 1200 UTC on (A) 11, (B) 13, (C) 14 and (D) 15 August 2021. The time series of LHFs (W∙m−2—ordinate) in the (E) western (42.9° N 31.9° E) and (F) eastern (42.9° N 37.5° E) part of the Black Sea from 10 to 20 August 2021 (abscissa).
Meteorology 01 00031 g012
Table 1. The characteristics of Black Sea Storm Falchion and seven Atlantic Region tropical and subtropical cyclones. Column 1 shows the storm name and intensity on the Saffir Simpson Scale (Cat X), tropical cyclone (TC), or subtropical storm (SS) as well as the date(s) sampled. Column 2 shows the location of the event, approximate latitude and longitude is given for the initial date in Column 1. Column 3 shows the lowest central pressure (hPa) and highest wind speeds (km h−1). The mean IVT was assigned as the mean of the daily maxima and the maximum IVT was the largest value found during the sampling period (Column 1). In Column 1, an (*) means the storm occurred in an SST environment less than 26.5 °C.
Storm Name/DatesLocationStrengthMean IVT/Max IVT (kg m−1 s−1)
SS Falchion */10–14 Aug 2021 Black Sea (45° N 37.5° E)1012 hPa/73 km h−1422/513
SS Unnamed/25–29 Oct 2000West Atlantic (24° N 71° W)976 hPa/100 km h−1775/1015
SS Nicole */9–12 Oct 2004West Atlantic (30° N 65° W)986 hPa/85 km h−1801/890
TS Bret/28–30 June 2005Gulf of Mexico (20° N 95° W)1002 hPa/65 km h−1578/745
Cat 5 Wilma/20–24 Oct 2005Gulf of Mexico (18° N 84° W)882 hPa/295 km h−11634/1855
TS Fay/18–22 Aug 2008West Atlantic (23° N 81° W)986 hPa/110 km h−11267/1645
Cat 4 Gustav/30 Aug–3 Sept 2008Gulf of Mexico (21° N 82° W)941 hPa/250 km h−11574/2120
TS Andrea/5–7 June 2013Gulf of Mexico (25° N 87° W)992 hPa/100 km h−11067/1185
Table 2. As in Table 1, except for the surface latent heat fluxes (LHFs) (W m−2) associated with each storm. The (*) has the same meaning as Table 1.
Storm Name/DatesMean LHF/Max LHF (W m−2)
SS Falchion */10–14 Aug 2021 246/386
SS Unnamed/25–29 Oct 2000399/530
SS Nicole */9–12 Oct 2004426/510
TS Bret/28–30 June 2005179/225
Cat 5 Wilma/20–24 Oct 2005706/750
TS Fay/18–22 Aug 2008321/360
Cat 4 Gustav/30 Aug–3 Sept 2008391/565
TS Andrea/5–7 June 2013240/260
Publisher’s Note: MDPI stays neutral with regard to jurisdictional claims in published maps and institutional affiliations.

