Article

Compressed Natural Gas as an Alternative Vehicular Fuel in Tanzania: Implementation, Barriers, and Prospects

by
Gerutu Bosinge Gerutu
1,
Kenedy Aliila Greyson
2 and
Pius Victor Chombo
3,*
1
Department of Mechanical Engineering, Dar es Salaam P.O. Box 2958, Tanzania
2
Department of Electronics and Telecommunication Engineering, Dar es Salaam P.O. Box 2958, Tanzania
3
Department of Electrical Engineering, Dar es Salaam Institute of Technology, Dar es Salaam P.O. Box 2958, Tanzania
*
Author to whom correspondence should be addressed.
Methane 2023, 2(1), 66-85; https://doi.org/10.3390/methane2010006
Submission received: 4 November 2022 / Revised: 12 December 2022 / Accepted: 9 January 2023 / Published: 17 January 2023
(This article belongs to the Special Issue CNG and LNG for Sustainable Transportation Systems)

Abstract

:
This paper presents the implementation of natural gas vehicles (NGVs) in Tanzania’s road transportation sector. The peculiarity of this analysis is the evaluation of the technical and economic performance of the converted gasoline and diesel engines to use compressed natural gas (CNG) as the cleanest-burning hydrocarbon. The technical performance involved vehicle mileage (MiCNG), fuel consumption (Fcons), speed drop, engine fuel enhancement (Fenh), and fuel saving, while the economic performance involved conversion cost (Cc), fuel cost saving (FCsaving), and payback (PB). Considering the conversion of gasoline vehicles, the MiCNG could reach an average of 100 to 500 km per filling, depending on the CNG cylinder size. The Fenh and fuel saving were ranging between 1.9 and 3.9 and 71 and 78%. With a proportion of 30:70 diesel-CNG fuel, the heavy-duty truck with 180 kg of CNG could reach 1300 km, saving about 440 L, which is 78.6% per roundtrip, while the medium passenger car with 15 kg of CNG could reach 350 km, presenting a fuel saving of about 75%. From an economic point of view, gasoline retrofitted NGVs cost about 50 to 200 TZS/km, yielding a fuel cost saving of up to 79% and starting to pay off between 2 and 7 months or 10,000 and 40,000 km, depending on the engine capacity. Considering dual fuel, the heavy-duty truck consumes about 496 TZS/km, saving about 62.3% of diesel fuel and starting to pay off after 2.5 months or 29,304 km. To conclude, NGV technologies have been successfully implemented in Tanzania’s road transportation sector, presenting significant fuel savings and reducing reliance on imported oil. While taking measures, this study paves a way for Tanzania and other sub-Saharan countries to promote NGV growth.

1. Introduction

With fossil fuel prices at historic highs [1], Tanzania is challenged to raise momentum in consuming its huge reserve of natural gas (NG) [2], especially in the area of transportation. While the country is a zonal leader in NG production, a number of factors, including Tanzania’s sluggish economy, political upheaval on recognizing NG as an alternative road transportation fuel [1], and growing concern of gas explosion, are threatening the widespread adoption of natural gas vehicles (NGVs). On the other hand, the alarming levels of global warming and environmental degradation as a result of tailpipe emission [1,3,4] as well as the need to obey the Kyoto agreement restrict Tanzania to using clean road fuels. New fuel technologies such as acetylene [5], biofuels [6], and vegetable oils (palm, soybean, sunflower, peanut, and olive) [7,8] have been developed to mitigate road emissions. Several merits have been revealed when employing new fuel technologies, for instance, better performance, emission, and combustion characteristics for acetylene as a low reactivity fuel [5] and the least black smoke and increase in specific fuel consumption for a biodiesel blend [9]. However, due to its abundance, NG remains the prominent candidate in Tanzania. Therefore, Tanzania’s government is urged to seek alternative measures to facilitate the use of its NG so as to curtail tailpipe emissions, as well as reduce the dependence on imported fossil fuel.
Compressed natural gas (CNG) is the potential alternative fuel in Tanzania’s road sector due to its plentiful and environmental benefits. Despite the anomalous spike in road oil prices (6% from December 2020 to March 2021; 12% from March 2021 to June 2021; 10% from June 2021 and December 2021; and 16% from December 2021 and June 2022) that led to financial burden among Tanzanian residents, the shift to NGVs is not promising. Moreover, around 350 four-wheelers in 2018, 450 four-wheelers in 2020 [1,10], and 1500 four-wheelers were converted to use CNG, accounting for 0.08% of its 1.92 million vehicles (2022). Comparatively, the global commercialization of NGVs hits around 27.4 million (2018), 28.5 million (2019) [1,11], and above 30 million units (2021) [12]. The global NGV records could alternatively indicate that Tanzania is not putting much emphasis on fighting against volatile oil prices and appalling issues of road emissions.
Governments around the world are implementing stringent regulations for reducing greenhouse gas emissions and sustaining ecofriendliness. In Asian-Pacific countries, for instance, Thailand implemented road pollution mitigation measures [13] in two phases [14]. Phase one involved the establishment of the natural gas pipeline in the greater Bangkok, as well as the conversion of public buses to use NG while increasing the in-city filling stations. Phase two involved promoting the use of NG throughout the country by supplying CNG and liquified natural gas (LNG) in the areas with and without NG pipelines, respectively [14]. In India, New Delhi and Mumbai are the first major cities to use NG in their transportation sector primarily driven by environmental and public health imperatives. The NG programs targeted the most polluting segments on Indian roads such as diesel buses, light-duty commercial vehicles, taxis, and three-wheelers [15]. Up to 2010, India had about 10,000 km of the NG pipeline network, owned in proportion by different companies and connected around 30 Indian cities. In the European Union (EU), NG is within the EU strategy for the future of transport. The EU Transport 2050 roadmap sets a big shift to cleaner cars and cleaner fuels for urban mobility—a 50% shift away from conventionally fueled cars by 2030, phasing them out of cities by 2050 [16]. In an attempt to abate the issues of transport energy scarcity and increased road emission, the Nigerian government introduced the use of CNG in its policies as an automobile fuel to improve urban air and reduce adverse health effects [17]. To improve its gas utilization capacity, Nigeria introduced several projects such as liquefied natural gas (LNG), gas to liquids (GTL), natural gas to power, and compressed natural gas (CNG) [17]. The Egyptian government, through the Ministry of Petroleum, supported the NG programs by initiating the CNG commercialization process, stimulating the growth of the CNG market by providing a five-year tax exemption for CNG-approved companies, and introducing high-tech solutions such as the “Gas Card” system. Furthermore, to accelerate the rate of vehicle conversion to use NG, the Egyptian government in 2006 prepared the CNG Master Plan that would affect the CNG activities for the next twenty years [18]. Tanzania is among the countries in sub-Saharan Africa in which the majority of its citizens have low income [19,20] and reside in rural areas. Despite the plentiful NG reserve, to date, Tanzania and other sub-Saharan countries have had sluggish transitions to NGVs. Moreover, there is a scarcity of knowledge to reveal the barriers and address the challenges in Tanzania and sub-Saharan countries so as to accelerate the evolution of NGVs.
The aim of this paper is to assess the technologies deployed to make NGVs plausible in Tanzania’s environment as well as barriers hindering their success to compete at international levels. The contributions are the following:
-
The technical performance of technologies employed to convert gasoline- and diesel-fueled vehicles to use CNG in Tanzania’s road transportation sector is assessed.
-
The economic savings as a result of retrofitting conventional vehicles to use CNG are evaluated in order to understand their payback characteristics in Tanzania’s road transportation sector.
-
The social, technological, economic, and regulatory barriers that are still in place in the country as well as the prospects of NGV development are highlighted.

2. Materials and Methods

2.1. Study Area

This study focuses on the conventional vehicles that were converted and plied in Dar es Salaam city. The selection of this city is based on several factors such as the rapid increase in urbanization and mobility demand, the fact that it accounts for more than 80% of all registered vehicles [1], and the presence of natural gas pipeline routes within the city as well as natural gas filling stations (mother and daughter stations). With the city’s spike in urbanization, most of the residents rely on public transport, while a few of them use private vehicles. When oil prices rise, it tends to raise living costs (the cost of food materials, building materials, etc.), public bus fares, and operational costs of private vehicles. Moreover, the frequent rise in oil prices causes financial burden among city dwellers (awaiting to see the monthly increment in oil prices and its implications for living costs). For this city, a frequent rise in oil prices hurts the majority of its residents who are low-income.

2.2. The Types of Road Vehicles under Conversion

The city’s share of road transport is currently predominated by privately owned paratransit minibuses commonly known as daladala, city taxis (four-wheelers), rickshaws (three-wheelers), motorcycles (two-wheelers), the newly hosted Dar es Salaam bus rapid transit (DART), and a lesser proportion of cycling and walking. On the other hand, the domination of industries and governmental offices in the city has led to an increase in the number of road vehicles that are privately owned by the residents. With the frequent rise in oil prices and the foreseeable benefits of using CNG as an alternative fuel, the majority of city dwellers have opted to convert their vehicles to natural gas vehicles. Therefore, the relief of city dwellers on road mobility could rely on the successful conversion to NGVs.
The conversion to NGVs in Tanzania has been performed by the Dar es Salaam Institute of Technology (DIT)-CNG Conversion Centre since 2008. In 2008, the first vehicle was successfully converted to use CNG; however, the rate was not promising due to the little awareness and hard acceptance of the new technology. Between 2021 and 2022, the spikes in oil prices and living costs made city dwellers switch to NGVs. By 2022, a variety of conventional vehicles were already modified to use CNG. The majority of these are light-duty and medium-duty passenger and cargo petrol-powered vehicles. The light-duty passenger vehicles are dominated by online taxis operated by Uber and Bolt companies. A few of the light-duty passenger vehicles are owned by private dwellers (entrepreneurs and officials). The medium-duty passenger vehicles are mostly daladalas plying on city routes. For medium-duty petrol-powered cargo vehicles, owned by small entrepreneurs and industries, the aim is to cut down the operational cost. The diesel-powered vehicles are only converted by another company owned by Dangote Cement Company Limited located in the Mtwara region. The vast majority of retrofitted gasoline and diesel (medium duty) vehicles operate in Dar es Salaam on asphalt roads. Despite the fact that heavy-duty diesel retrofitted vehicles travel between the Dar es Salaam and Mtwara regions, the two are linked by asphalt roads. As a result, this study considered asphalt as a road type for all NGVs. As the demand for conversion and the number of NGVs increase, the challenges and prospects of NGVs need to be well explored and addressed during their uptake.

3. Implementation

3.1. Technologies for Conversion of Vehicles to NGVs

The CNG systems fitted in vehicles consist of a CNG cylinder and a conversion kit. A CNG cylinder stores pressurized gas. It falls into four types, namely, Type 1, 2, 3, and 4. The type of a CNG cylinder is based on the design and production techniques, including the liner material. Type 1 has no liner; Type 2 is lined by carbon fiber; Type 3 is lined by carbon fiber; and Type 4 is wholly wrapped by an aluminum liner. The liner materials regulate the in-cylinder temperature and therefore affect the quantity of CNG that it can contain based on the defined limits. For instance, carbon fiber tanks retain more heat compared to steel tanks and may reduce the capacity of the CNG due to the molecule expansion under hot conditions. A conversion kit falls into two types, namely, the venturi and sequential kit. The venturi kit is equipped with neither sensors nor an electronic control unit (ECU). This makes it affordable and easier for it to be installed in any type of vehicle. However, the absence of sensors and an ECU makes the operation of the venturi kit unpredictable as it cannot regulate the flow of CNG into the engine. This irregularity causes a lot of stalling and pickup loss as well in the engine. Moreover, as a result of this, the kit and engine need frequent tuning and cleaning—something that requires a certain amount of expertise. On the contrary, the sequential kit comprises a number of sensors and wires that are slightly more complex to install. The sequential kit works properly on vehicles that are equipped with electronic fuel injection systems. The ECU in the sequential kit monitors the flow and controls the combustion of CNG in the engine, which results in better performance and mileage of the vehicle. Moreover, the sequential kit can be an open-loop or closed-loop system. The closed-loop sequential kit consists of oxygen or lambda sensor(s) that are mounted in the vehicle’s exhaust to collect the emissions data and pass them to the ECU to check if they are within acceptable levels. This feedback information provides better control of CNG flow and prevention of excessive pollution. With the increasingly stringent environmental regulations, the sequential kits could be more useful, user-friendly, and even durable for users to switch their kits to another vehicle while benefiting from emission cutdowns.
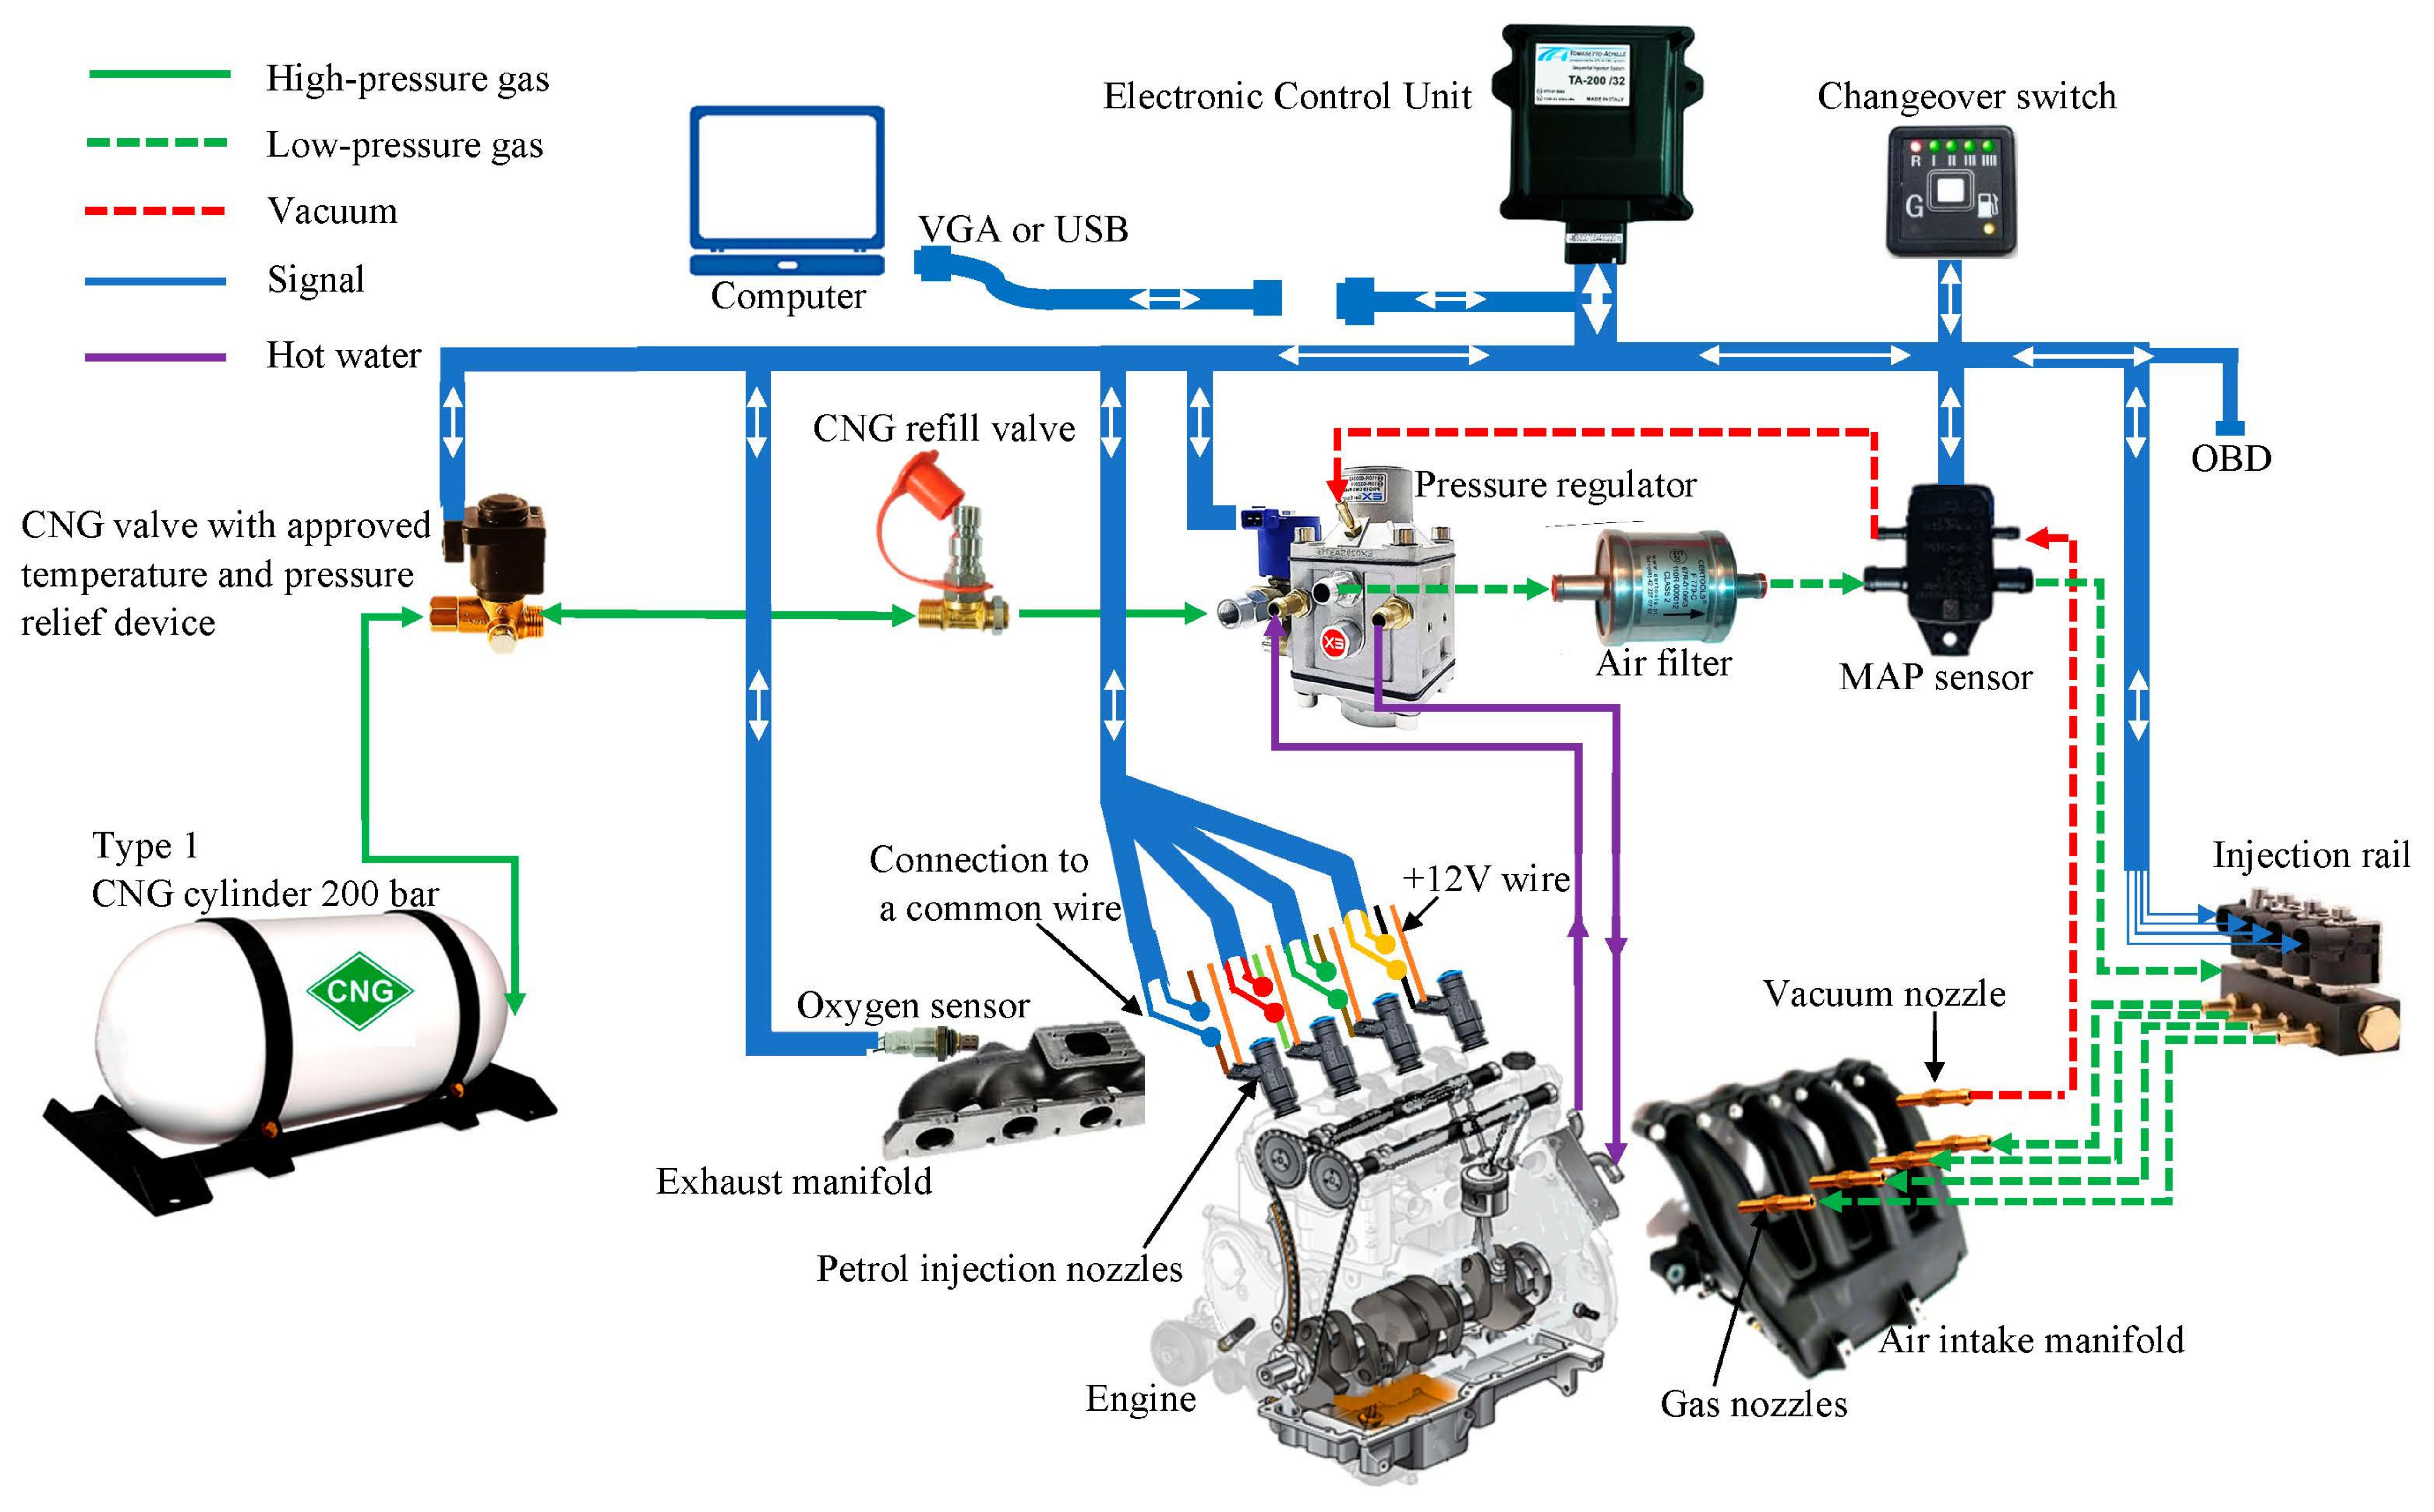
The CNG components for retrofitting petrol-powered vehicles are shown in Figure 1. The natural gas is compressed into a CNG cylinder through a receptacle to a working pressure of 200 bar. The high-pressure gas is transferred to the pressure regulator through the high-pressure pipe. The pressure regulator reduces the pressure to a level that is compatible with the engine fuel injection system. Then, CNG mixes with air in the intake manifold before the mixture enters the combustion chamber for compression. The spark plug ignites the air–gas mixture to produce mechanical power. Once the changeover switch is pressed to allow CNG to operate, the ECU opens the CNG valve and pressure regulator to allow CNG to flow to the injector rail via the gas filter and mean absolute pressure (MAP) sensor while blocking petrol nozzles. The oxygen sensor monitors the amount of oxygen in the exhaust and transmits that information to the ECU, which regulates the air-to-fuel ratio accordingly.
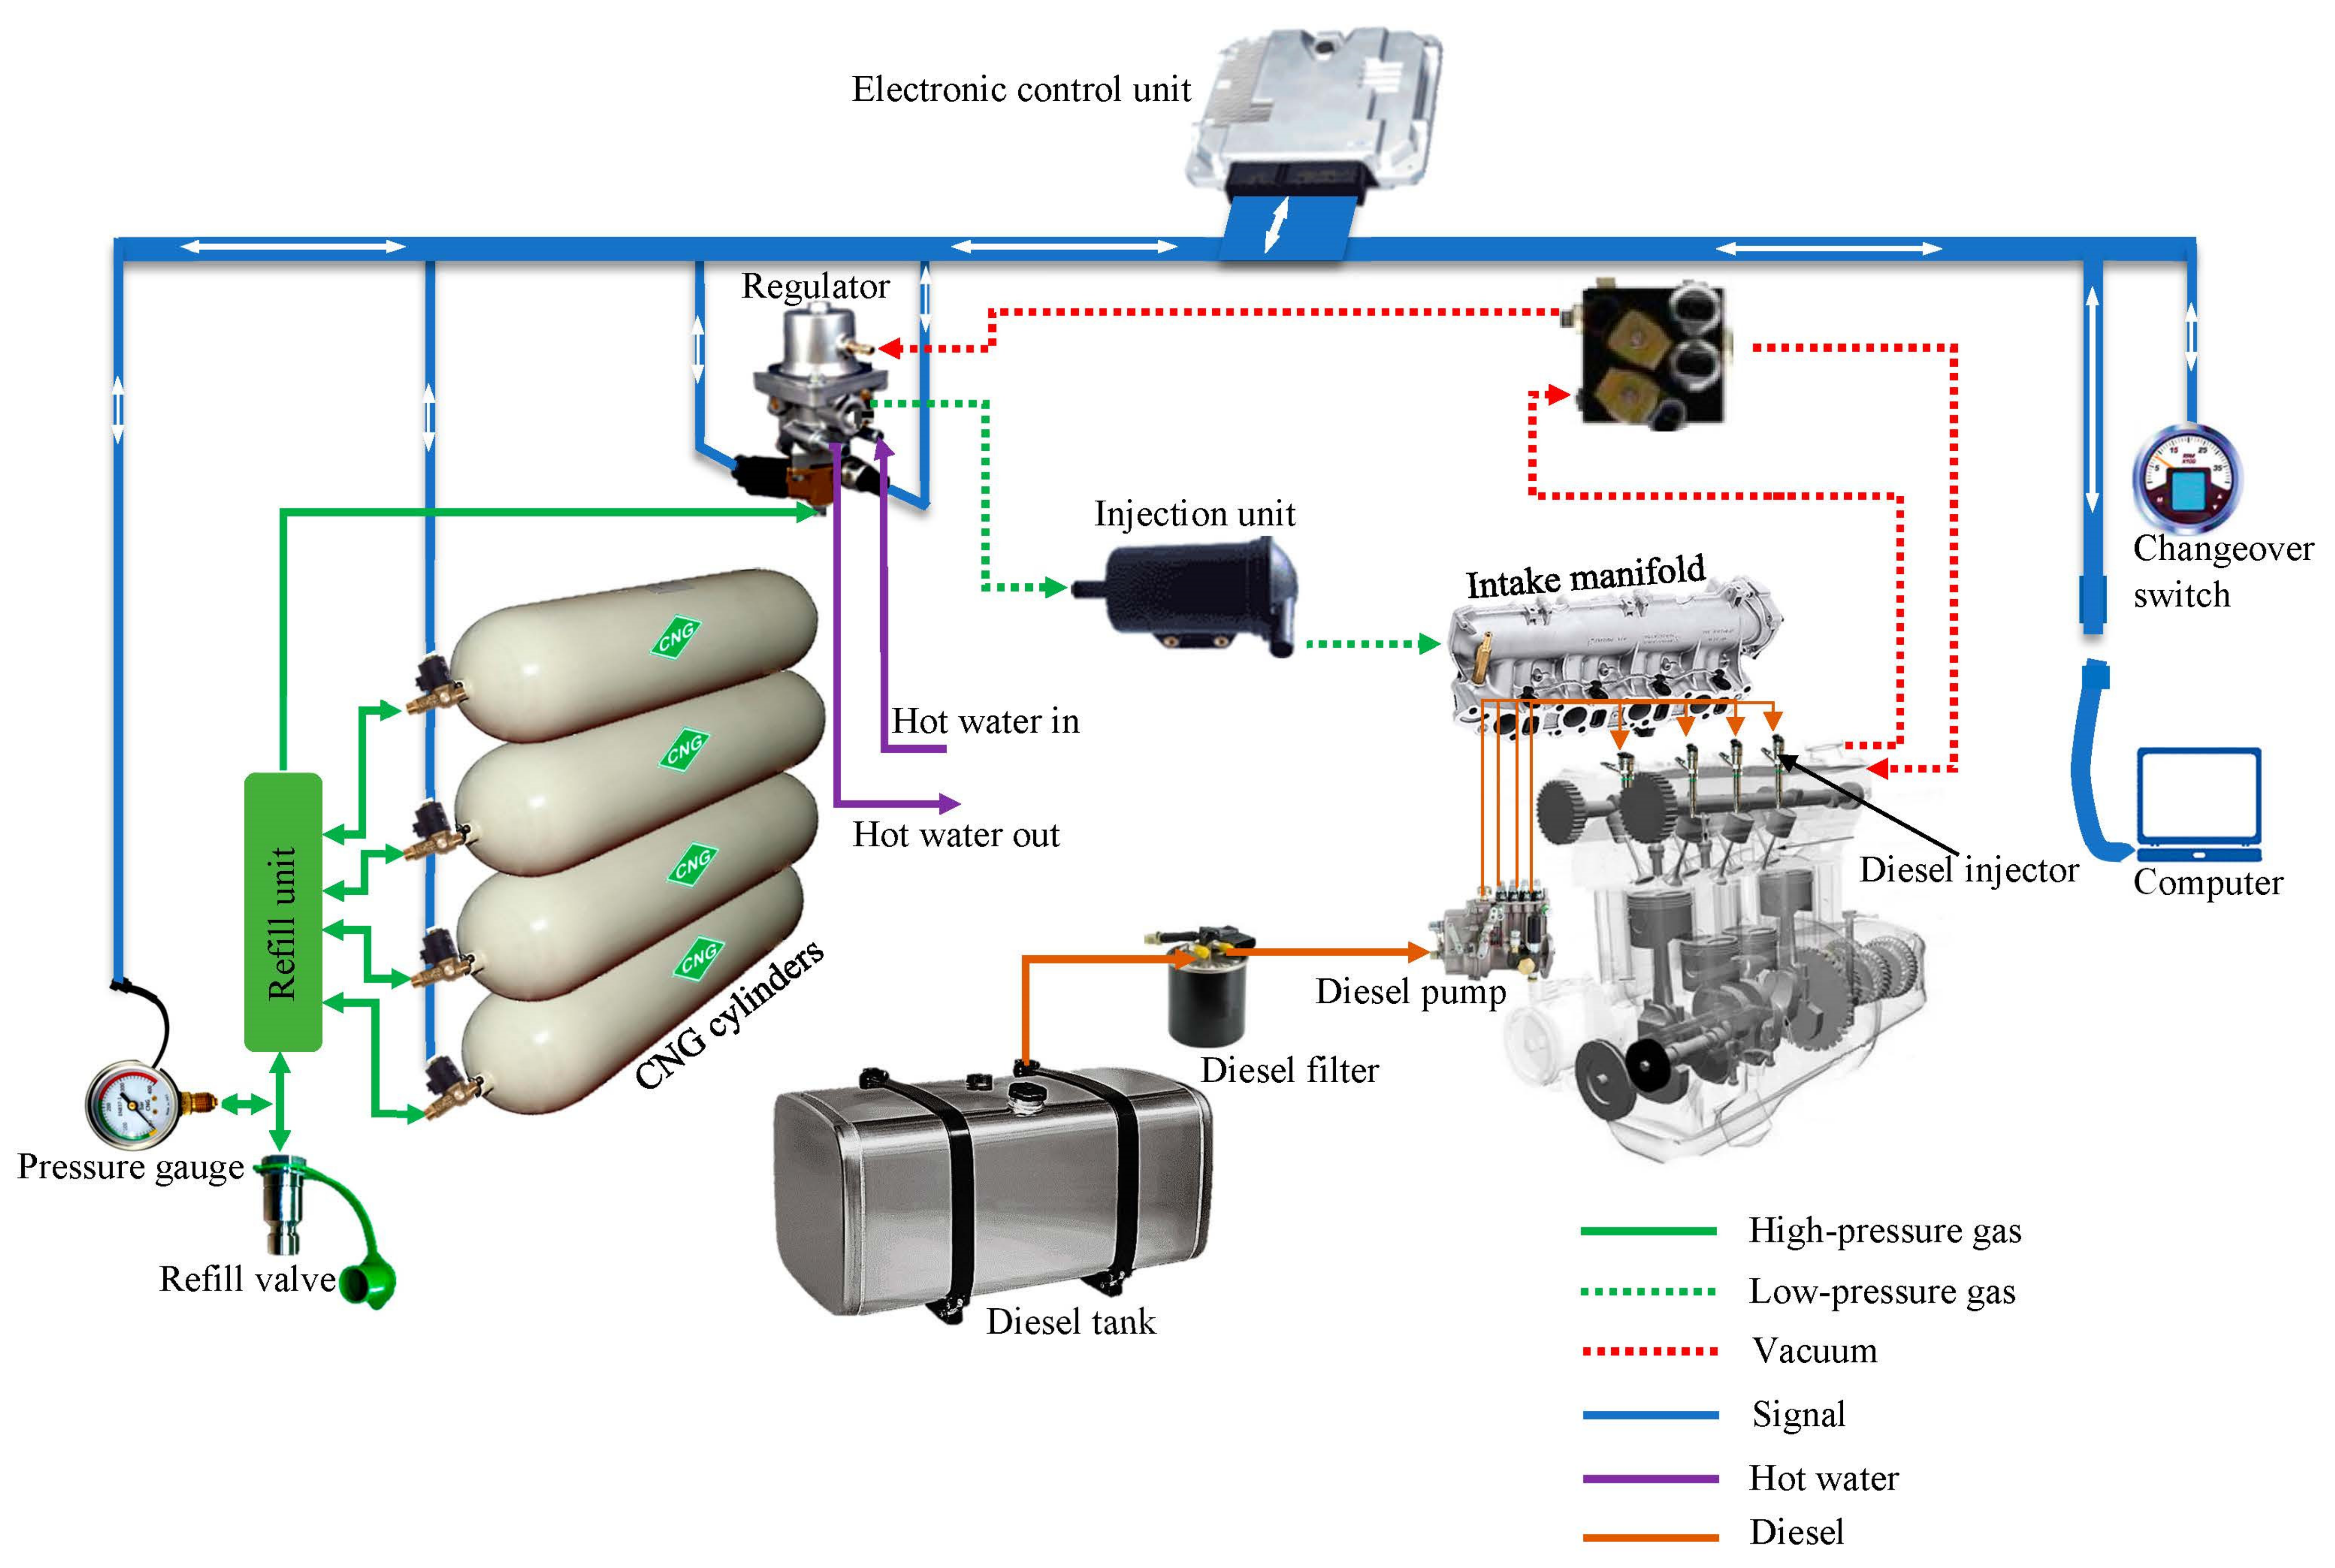
Figure 2 depicts the CNG components for retrofitting diesel-powered vehicles. The pressurized gas is transferred from the CNG cylinder to the pressure regulator, where it is decreased to the level required in the combustion chamber. In the intake manifold, the low-pressure gas combines with the bulky air and is transferred to the combustion chambers for compression. The presence of an air–gas mixture in an engine’s intake air is expected to cause a significant decrease in feed mixture temperature, resulting in the air–gas mixture failing to ignite during the compression stage.
Due to the lack of spark plugs in the combustion chamber, diesel fuel serves as an igniter of the air–gas mixture. Meanwhile, the pressure inside the combustion chamber is already high, obstructing the flow of diesel into the chamber. As a result, little diesel enters, creating a powerful spark to ignite the air–gas mixture during compression. In these engines, diesel provides ignition and natural gas provides power. The CNG used in both retrofitted gasoline and diesel-fueled vehicles has the same quality. According to the Energy and Water Utilities Regulatory Authority (EWURA) [21], the natural gas in the pipeline contains approximately 98 % methane, to which all CNG-filling stations are linked. As a result, all NGVs considered in this study used the same CNG quality.

3.2. Technical Performance of NGVs

For petrol-fueled vehicles, technical performance is evaluated by four parameters, namely, engine performance, speed drop, engine fuel enhancement, and fuel savings. The engine performance is evaluated by the following parameters, namely, vehicle mileage (MiCNG) and fuel consumption (Fcons). MiCNG is the mileage obtained when the vehicle is operated on CNG. Fcons is the amount of CNG consumed by the NGV over a distance; see Equation (1).
F c o n s = Q C N G M i C N G
where Fcons is the amount of CNG consumed by the NGV over a distance (kg/km), QCNG is the total amount of CNG consumed by the NGV or CNG cylinder capacity (kg), and MiCNG is the mileage when the vehicle is operated on CNG (km).
Speed drop is evaluated in two moments: as a difference in engine speed when running on petrol and CNG in idling mode—termed Sdrop-idle (Equation (2)).
S d r o p i d l e = S p e t r o l i d l e S C N G i d l e
where Sdrop-idle is the drop in engine speed during idling mode when shifting from petrol to CNG (rpm), Spetrol-idle is the engine speed when running on petrol during idling mode (rpm), and SCNG-idle is the engine speed when running on CNG during idling mode (rpm).
Engine fuel enhancement (Fenh) is the dimensionless factor defined as the ratio of mileage covered by a full tank of CNG to that of gasoline which is equivalent to CNG fuel; see Equation (3).
F e n h = M i C N G M i g a s o l i n e
where Fenh is the engine fuel enhancement (dimensionless).
Fuel saving (Fsaving) defines the quantity of petrol fuel saved by running the vehicle on CNG. It is quantified by equalizing the energy quantities of petrol and CNG on the same vehicle, same engine condition, same route distance, and fuel price. It is then taken as a difference between the petrol fuel consumed by the vehicle before conversion to the petrol quantity equivalent to the CNG used on the same vehicle; see Equation (4).
F s a v i n g = F p e t r o l F C N G
where Fsaving is the amount of petrol saved by running on CNG (L), Fpetrol is the amount of petrol consumed during driving (L), and FCNG is the amount of petrol that is equivalent to CNG consumed during driving (L).
For diesel vehicles, technical performance is assessed by two parameters, namely, vehicle mileage (Midual) and fuel cutdown (Fcutdown). Midual is the mileage obtained when the vehicle is operated on dual fuel (diesel + CNG). Fcutdown refers to the amount of diesel fuel cut down when using dual fuel over a distance; see Equation (5).
F c u t d o w n = F d i e s e l F d u a l F d i e s e l × 100 %
where Fcutdown is the amount of diesel saved by running on dual fuel (L) and Fdiesel is amount of diesel consumed during driving on diesel (L).
To assess the technical performance, a set of data was collected from the NGV users. The information collected was vehicle maker/model, make year, engine capacity, daily mileage (km), amount of petrol to cover the daily mileage (L), CNG cylinder capacity (kg), and maximum mileage obtained per CNG cylinder capacity in city and highway driving (km).

3.3. Economic Assessment of Conversion to NGVs

3.3.1. Conversion Cost, CC

The initial cost covers the import cost (CI) and overhead cost (COH). The import cost covers the cost of purchasing, shipping, port charges, and inland clearing. The COH covers the cost of installation, first filling, and inspection costs. For petrol-fueled vehicles, CNG cylinders are Type 2 with 80 L or 11 kg and 110 L or 17 kg capacity and are mostly accepted by light-duty and medium-duty vehicle users. Hence, the conversion costs are based on these two sizes. Therefore, the conversion cost based on the vehicle model and size of the cylinder is computed as expressed in Equation (6). It should be noted that COH also varies with the vehicle category. C C , i , j for different vehicle types and cylinders is indicated in Section 4.2.
C C , i , j = C I , i , j + C O H , i , j
where C C , i , j is the cost of conversion for a vehicle with category i and cylinder size j (USD), C I , i , j is the import cost for a vehicle with category i and cylinder size j (USD), and C O H , i , j is the overhead cost for a vehicle with category i and cylinder size j (USD).
Assumptions:
To facilitate computation of the conversion cost, the following assumptions are made:
-
All costs are computed in TZS and USD currencies as of June 2022.
-
The fuel costs refer to the Dar es Salaam region.
-
An NG substitution ratio of 70% is used for all dual fuel vehicles.
-
Table 1 indicates the properties of fuels used in the current study.

3.3.2. Fuel Cost Saving, FCsaving

Another important parameter to be evaluated is the percentage of fuel cost saved for a vehicle with category i over a number of days after conversion to NGV (%FCsaving, i). It is computed as a ratio of the difference between petrol and CNG costs and petrol cost as indicated in Equation (7).
% F C saving ,   i = F C p e t r o l , i F C C N G , i F C p e t r o l , i × 100 %
where %FCsaving,i is the percentage of fuel saved for a vehicle with category i over a number of days after conversion to NGV (TZS), FCpetrol,i is the cost of petrol incurred by a vehicle of category i over a number of days (TZS), and FCCNG,i is the cost of CNG incurred by a vehicle of category i over a number of days (TZS).
For diesel vehicles, the fuel saving is computed as the difference in the cost of diesel and fuel cost when using dual fuel and is expressed as shown in Equation (8).
F C saving , i , j = F C d i e s e l , i F C d i e s e l + C N G , i , j
where FCsaving,i,j is the fuel saving for a vehicle with category i and cylinder size (USD), FCdiesel,i is the cost of fuel when a vehicle is run on diesel (USD), and FCdiesel+CNG,i,j is the cost of fuel when a vehicle runs on dual fuel (diesel and CNG).

3.3.3. Payback, PB

Another important parameter to be evaluated is the percentage of fuel cost saved by a vehicle of category i over a specified number of days after conversion to NGV (%FCsaving,i). It is computed as a ratio of the difference between petrol and CNG costs and petrol cost as indicated in Equation (9).
P B p , i , j = C C , i , j F C s a v i n g , i , j
where PBp,i,j is the payback period for a vehicle with category i and cylinder type j (months).
Payback distance (PBd,i,j) is the distance beyond which the conversion costs begin to be paid off. PBd,i,j is expressed as shown in Equation (10).
P B distance , i , j = C C , i , j C k m , C N G , i , j
where PBdistance,i,j is the payback distance for a vehicle with category i and cylinder type j (km) and CNGkm,CNG,i,j is the cost per km when driving a vehicle of category i and cylinder type j on CNG, obtained as a ratio of refilling cost and MiCNG (TZS/km).

4. Results and Discussions

4.1. Technical Performance of NGVs

To evaluate the technical and economic analyses, a set of data was collected through a survey from the conversion center at the Dar es Salaam Institute of Technology and NGV users at the filling stations. The data collected include vehicle maker/model, make year, engine capacity, daily mileage (km), amount of petrol to cover the daily mileage (L), CNG cylinder capacity (kg), and maximum mileage attained per CNG cylinder capacity in city and highway driving (km). On the economic side, the data collected are the cost of petrol to cover the daily mileage (TZS) and the cost of CNG to cover the daily mileage (TZS).
The mileages reached when the vehicles with different engine capacities run on gasoline and CNG after conversion are shown in Figure 3. It can be seen that vehicles with higher engine capacities (>2500 cc) have shorter mileage compared with those with lower engine capacities (<2500 cc) (see the black dots). Overall, gasoline vehicles plying in the city have a mileage of less than 200 km per filling. After conversion to use NG, the same vehicles attained significant improvements in engine performance. This can be signified by the blue dots, where the majority of the NGVs have a mileage between 100 km and 500 km per filling, depending on the size of the CNG cylinder.
It is also interesting to note that the mileage of the NGVs decreases with the increase in engine capacity. The downtrend of the relationship between mileage and engine capacities is depicted by the blue trendline. The purple dots in Figure 3 show the engine enhancement after the transition to using NG. Overall, the NGVs attained significant engine enhancement compared to their gasoline counterparts. This was revealed by the higher mileage as well as smooth engine running (as reported by many of the NGV users). For instance, Vitz with 900 cc—see in Figure 3—after conversion to using NG, was enhanced by 1.9 times, whereas PRADO with 3378 cc was enhanced by 3.9 times. This enhancement means that the NGV could reach extra mileage compared to its gasoline counterpart. Of great note is that NGVs with higher engine capacities have greater enhancement than those with lower capacities. This is mostly attributed to the better thermodynamic properties of the NG in the engine. Korakianitis, Namasivayam and Crookes, (2011) [23] reported that engines fueled by NG could exceed the thermal efficiency of conventional ones by about 5% due to the high-octane number of NG, which allows comparatively higher compression ratios in the engine. Moreover, the compression ratio can increase from 8:1 to 13:1 in an NG engine.
During calibration, the speed drop of each NGV is normally checked when run on gasoline and NG. The reference speed was taken at the idle speed of 2000 rpm when run on gasoline. The speed drop of gasoline retrofitted vehicles was found to range between 4 and 8%. In many NGVs, the large speed drop was attributed to poor engine combustion when run on NG as a result of poor services, NG leakages, incompatible CNG pressure entering the engine manifold, or weak spark plugs. Figure 4 compares the fuel consumption of vehicles when run on gasoline (black dots) and NG (blue dots). It can be seen that NGVs have better fuel consumption than gasoline counterparts. On the other hand, NGVs with lower engine capacities are seen to have lower fuel consumption compared to those with higher engine capacities. This could be greatly attributed to their poor energy conversion efficiency. Vehicles with engine capacities up to 2500 cc had the Mi ranging between 200 and 400 km and 80 to 160 km when run on CNG and gasoline, respectively. Referring to Table 1, these vehicles could run an average of 5.59 and 3.51 km per fuel energy on CNG and gasoline, respectively. Beyond 2500 cc, the Mi were between 100 and 160 km and 60 and 90 km when run on CNG and gasoline, respectively. These could give an average of 2.43 and 2.19 km per fuel energy, respectively. In terms of fuel saving, as observed in Figure 4 (red dots), NGVs with engine capacities beyond 2500 cc can save more than 50% of their fuel. Moreover, the uptrend in fuel saving with increasing engine capacity is depicted by the trendline, indicating great relief for NGVs with higher engine capacities to run on NG.
To further understand the fuel consumption scenarios, NGVs used in home-to-office and small enterprises and online taxis were categorized based on their engine capacities as shown in Table 2. dmax, represents the maximum mileage plied by each category of NGV. It is still observed that the average percentage of fuel consumption (%FC) is lower for NGVs with lower engine capacities than for those with higher engine capacities. Moreover, vehicle applications seem to have a significant effect on fuel saving. Vehicles used for home-to-office applications had lower fuel savings due to the fact that a majority of them are operated during rush hours, which are mainly characterized by prolonged traffic jams, while those used for small enterprises and online taxis operate in short town trips.
For diesel retrofitted vehicles, the fuel cutdown was compared when the vehicle is run on diesel and dual fuel (diesel and CNG). Since, up to now, most of the retrofitted diesel vehicles are owned by Dangote Cement Company based in Tanzania, they are of similar models (HOWO with 340 HP) plying on the same routes. It was revealed that plying with dual fuel (diesel and CNG) trucks saved about 62.3% (see Table 3) of diesel that could be used for the same route. According to Karim (2003) [24], methane supplementation would be successful for high-compression-ratio diesel engines, which in turn increases thermal efficiency when run on NG. Gord-Ferhaz (2012) [25] revealed that a gain in an NGV’s engine efficiency by 11% would increase the mileage by 89 to 100 km. Expanding the network of refilling stations would not only be beneficial for Dangote’s trucks but also trucks and passenger buses plying on the same route to the upcountry regions.

4.2. Economic Assessment of NGVs

Table 4 shows the conversion cost for gasoline vehicles. It should be noted that these costs cover all the costs required for conversion before the retrofitted car is handed over to the user. From Table 4, it can be seen that the conversion cost increases with the engine capacity and CNG cylinder size. The large portion of this cost is dominated by the cost of CNG cylinders, mainly due to the port clearing charges. In diesel vehicles, the cost is subject to the engine capacity, engine technologies, and route length. For the heavy-duty truck, the cost is up to TZS 25,000,000, while the medium-duty NGV is about TZS 5,500,000.
The results of the fuel cost per kilometer for gasoline vehicles (black dots) and NGVs (blue dots) with different engine capacities are shown in Figure 5. It can be seen that the fuel cost of NGVs is quite cheaper compared to their counterparts. For the fuel cost data acquired, the NGVs cost around 50 to 200 TZS/km, while gasoline vehicles of similar engine capacities cost around 200 to 500 TZS/km. In terms of fuel cost savings (%FCsaving) (see orange dots), it is revealed that NGVs with small engine capacities (<2500 cc) have higher %FCsaving compared to those with larger engine capacities (>2500 cc), reaching 79%. NGVs with engine capacities greater than 2500 cc attained the maximum %FCsaving of 66%. This indicates that small NGVs, which are used by many residents, have great potential to financially benefit the users. The assessment of the performance of dual fuel NGV is shown in Table 5. The price of diesel is as of June 2022, with the Dar es Salaam region as a reference. It is observed that, after conversion, the heavy-duty truck was consuming 180 kg of CNG (four cylinders with 45 kg of CNG each) and 120 L of diesel instead 560 L of diesel, costing around 214.9 TZS/km and saving up to 85.9% of fuel cost. This saving is equivalent to 14,400,000 TZS/month and 172,800,000 TZS/year for one truck. The medium-duty dual fuel NGV saved around 120,000 TZS, equivalent to 84.8%.
Figure 6 compares the payback distance (PBd) as well as payback period (PBp) for gasoline retrofitted vehicles with different engine capacities. The maximum PBd and PBp are 39,000 km and 7 months, respectively. It is seen that both PBd and PBp have an uptrend with increasing engine capacities. Jobbágy (2013) [26] found that the payback of new CNG-powered light-duty vehicles (Opel Zafira 1.6 CNG Turbo Essentia 150 HP and Volkswagen Touran 1.4 TSI EcoFuel Trendline 150 HP) in Hungarian road conditions could be 2 to 7 years. Savickis et al., (2021) [27] revealed that the light-duty vehicle—SEAT LEON 1.5 TGI MAN-6 fueled by CNG—could start to pay off at 57,650 km as an alternative to petrol. For the diesel trucks with dual fuel, the maximum PBd and PBp are 29,304 km and 2.5 months, respectively. Additionally, the medium-duty dual fuel NGV pays off at 7 months. Savickis et al., (2021) [27] found that SEAT LEON 1.5 TGI MAN-6 fueled by CNG pays off at 71,531 km as an alternative to diesel.

5. Barriers to Widespread Adoption of NGVs in Tanzania

5.1. Social Barriers

Lack of public awareness: The conversion of vehicles to use CNG in Tanzania commenced early in 2018. Despite there being plenty of locally available natural gas, the conversion rate is still unpromising even on a regional level. Among the major reasons is the lack of knowledge regarding the benefits of transiting to NGVs. The majority of the residents cannot distinguish between CNG and domestically used liquified petroleum gas (LPG). When they recall some cases where LPG erupted in domestic houses, they become afraid to use CNG in their vehicles. Others think that NGVs can ignite when parked under the sun. Thus, the government needs to take measures to reduce social barriers.
Overexpectation of citizens: Despite the small number of conversion centers and long queues in the existing centers, vehicle owners still expect a one-day service. For the operating NGVs, some owners/drivers expect too much savings in a short driving period or no use of gasoline at all. Overcomplications were raised by some vehicle owners who did not want the CNG cylinder to be publicly seen, who wanted to fit a big CNG cylinder while maintaining sufficient boot space for luggage, and who wanted NGVs to maintain the same performance over years of operation.

5.2. Financial Barriers

Low per capita income: Most vehicle owners cannot afford the initial cost of conversion. After switching to an NGV, some economize CNG usage by not even allowing 1 km of driving on petrol before switching to CNG for optimum vehicle performance.
Increased taxes: The NGV technologies are still immature in Tanzania’s road transportation sector. CNG cylinders were exempted between 2018 and early 2020s while conversion kits were yet to be exempted. Despite the partial exemption on CNG cylinders and no exemption on conversion kits, the conversion rate was accelerated and increased the number of converted vehicles in the country as well. In the middle of 2022, the government of Tanzania withdrew the exemption on CNG cylinders, which resulted in a full tax on CNG systems. As a result, the conversion cost increased, which in turn drastically dropped the conversion rate.

5.3. Technical Barriers

Incompatible engine technologies: During the vehicle inspection prior to the installation of the conversion kit, the engine’s fuel injection technology was inspected to check for its suitability with the kit. The inspected vehicles were made between 1990 and 2010. Technologies such as D4 and gasoline direct injection (GDI) were found to be incompatible with the sequential kit except for variable valve timing intelligence (VVTI) technology; see examples of GDI and D4 engines in Figure 7a. Some of the vehicles were poorly maintained; hence, they were not accepted on time for conversion; see examples in Figure 7b–d.
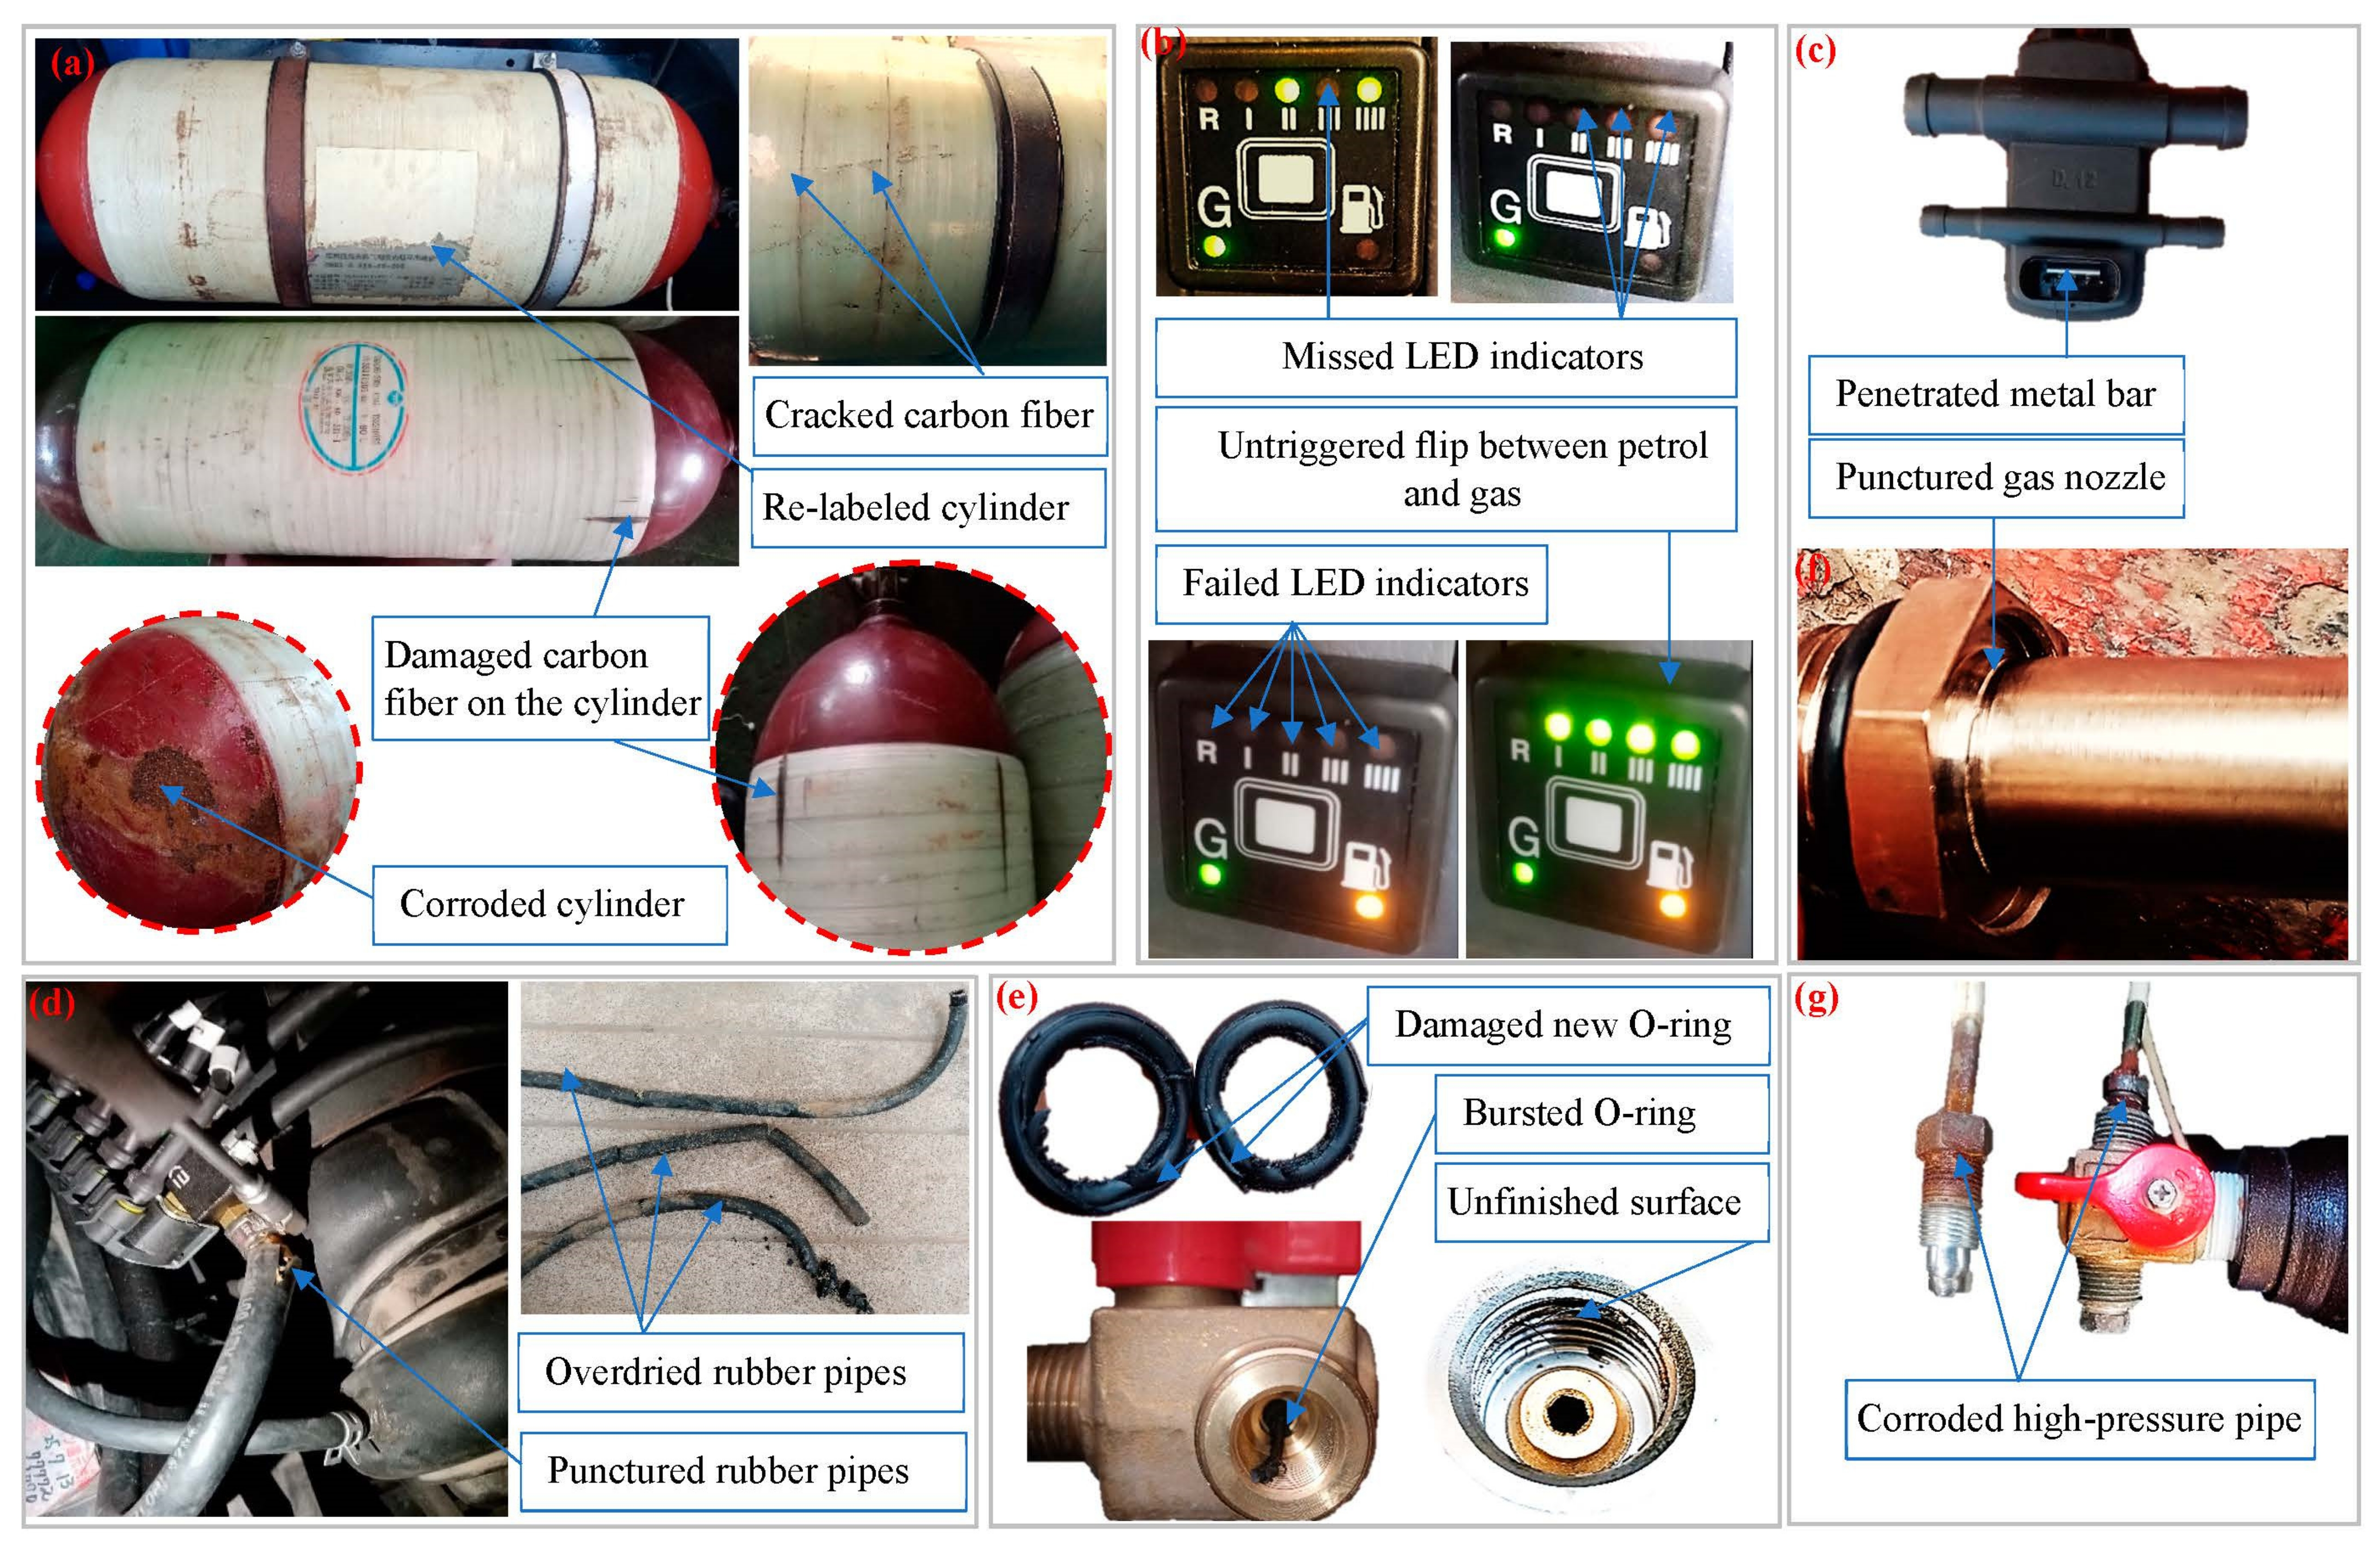
Low quality and malfunction of CNG system component(s): The presence of adulterous centers fitting second-hand CNG cylinders (Figure 8a) or low-quality sequential kits lead to malfunctioning during on-road driving. Examples of malfunctioning components observed were CNG changeover switches (Figure 8b), the electronic control unit (ECU), and mean absolute pressure (MAP) sensors. The MAP sensor rarely malfunctions due to the presence of an internal short-circuit (see Figure 8c). Some of the CNG cylinders could not store the intended amount of CNG when refilled at any time in a day, so makers supplied low-quality hose pipes (Figure 8d) and damaged O-rings in refill valves (Figure 8e). Other issues involved cracking of CNG injection nozzles (Figure 8f) and corrosion of the high-pressure CNG pipe (Figure 8g).
Insufficient pool of NGV components and conversion centers across the country: Currently, all conversion kits are imported from Europe and far-East Asia. There are no readily available spare parts for servicing the NGVs in operation. Up to now, the conversion is only undertaken in Dar es Salaam, where there is a network of NG pipelines. However, the region suffers from a low conversion rate.
Inadequate CNG and NG pipeline infrastructures: There is a limited NG pipeline network. The shortage of the NG pipeline network hinders the expansion of CNG infrastructure, which in turn slows the conversion rate. Currently, only the NG pipeline is routed in the Dar es Salaam region, and there is only one mother and one daughter station.

5.4. Regulatory Barriers

NG is not considered an alternative fuel for vehicles: Tanzania’s current natural gas policy 2013 does not specify CNG as a vehicular fuel. This introduces other issues, for instance, the insurance act of 2015 to recognize only petrol and diesel as vehicle fuels in Tanzania. As a result, NGVs are yet to be insured as petrol or diesel vehicles. Moreover, CNG is seen as a source of fire during fire accidents, resulting in no insurance coverage.
Conflict of interest: The government greatly relies on fossil fuels as a major source of revenue. Oil importers, suppliers, and entrepreneurs consider NG/CNG as a threat to the oil business, which is not the case. On the other hand, energy regulators over-rely on oil for generating income used in some governmental projects. Moreover, NG producers and energy regulators who are responsible for licensing and promoting NG usage in Tanzania are not doing enough, resulting in a void of information and bureaucracy in providing licenses for the establishment of CNG-filling stations. Consequently, from 2018 when the conversion commenced to date, there is only one mother station and one daughter station feeding only 1 out of 30 regions. Yet, no measures have been established to replace the loss of revenue post-transition to NG.
Absence of bodies to promote and secure NGVs: An NGV association is yet to be established, which is crucial to promote the use of NG in the country, link the government and NGV users, provide the best advice to the government on the use of NG in the country, and represent the country in the regional development meetings. The petroleum act of Tanzania of 2015 requires retrofitted vehicles to be re-registered in other bodies. However, it is neither the Tanzania Revenue Authority (TRA), Tanzania Insurance Regulatory Authority (TIRA), nor Land and Air Transport Regulatory Authority (LATRA) that has executed the task. Furthermore, there is no governmental body responsible for dealing with accidental issues of NGVs.

6. Prospects of NGVs in Tanzania

6.1. Increase Public Awareness

The Tanzanian government is the key player in providing information to vehicle owners interested in transiting to NGVs. The government could source a potential website where prospective importers/buyers of NGVs could find a list of approved conversion centers that can help with engine conversions, certified vehicle inspectors for periodic inspection of NGVs, approved conversion costs, and guidelines for estimating paybacks. Specialists from recognized government bodies could provide knowledge regarding the proper usage of NGVs, factors affecting NGV performance, characteristics of CNG, and the socio–technical–economic benefits of transiting to NGVs.

6.2. Introduce Policies to Encourage Shifting to NGVs

The Tanzanian government needs to create green policies that could benefit the local industries to manufacture NGVs, high-quality spare parts, and NG infrastructures. Additionally, it should strengthen the existing policies to recognize NG as a vehicular fuel and introduce incentives to NGV users. For having a determined national focus, a roadmap should be developed to make sure that all NG and NGV stakeholders are bound together to achieve the national goal. Furthermore, sufficient research funds should be provided to academic and research centers to solve existing NG/NGVs challenges, develop new NGVs, and support technology transfer at the local and regional levels. This would in turn make Tanzania a hub of automotive technology, especially NGVs. On the other hand, the government should accelerate the NG market by subsidizing the cost of NG at refueling stations. The incentives should be introduced to financially support vehicle owners in terms of low importation costs for NGVs, low-interest loans for local engine conversions, and tax reductions or exclusions for NGVs operations such as excise tax, municipal tax, oil fund, and energy conservation fund levies.

7. Conclusions and Recommendations

The aim of this study is to assess the technologies deployed to make NGVs plausible in Tanzania’s environment as well as barriers hindering their success to compete at international levels. The technical and economic assessments of natural gas vehicles against their gasoline and diesel counterparts were evaluated. To undertake the analyses, a set of data was collected from the conversion centers and NGV users. Based on the analyses of this study, the following conclusions were made:
-
The technologies for converting gasoline and diesel engines of road vehicles used in Tanzania’s transportation sector have been successfully implemented through the use of sequential conversion kits integrated with either Type 1 or Type 2 CNG cylinders.
-
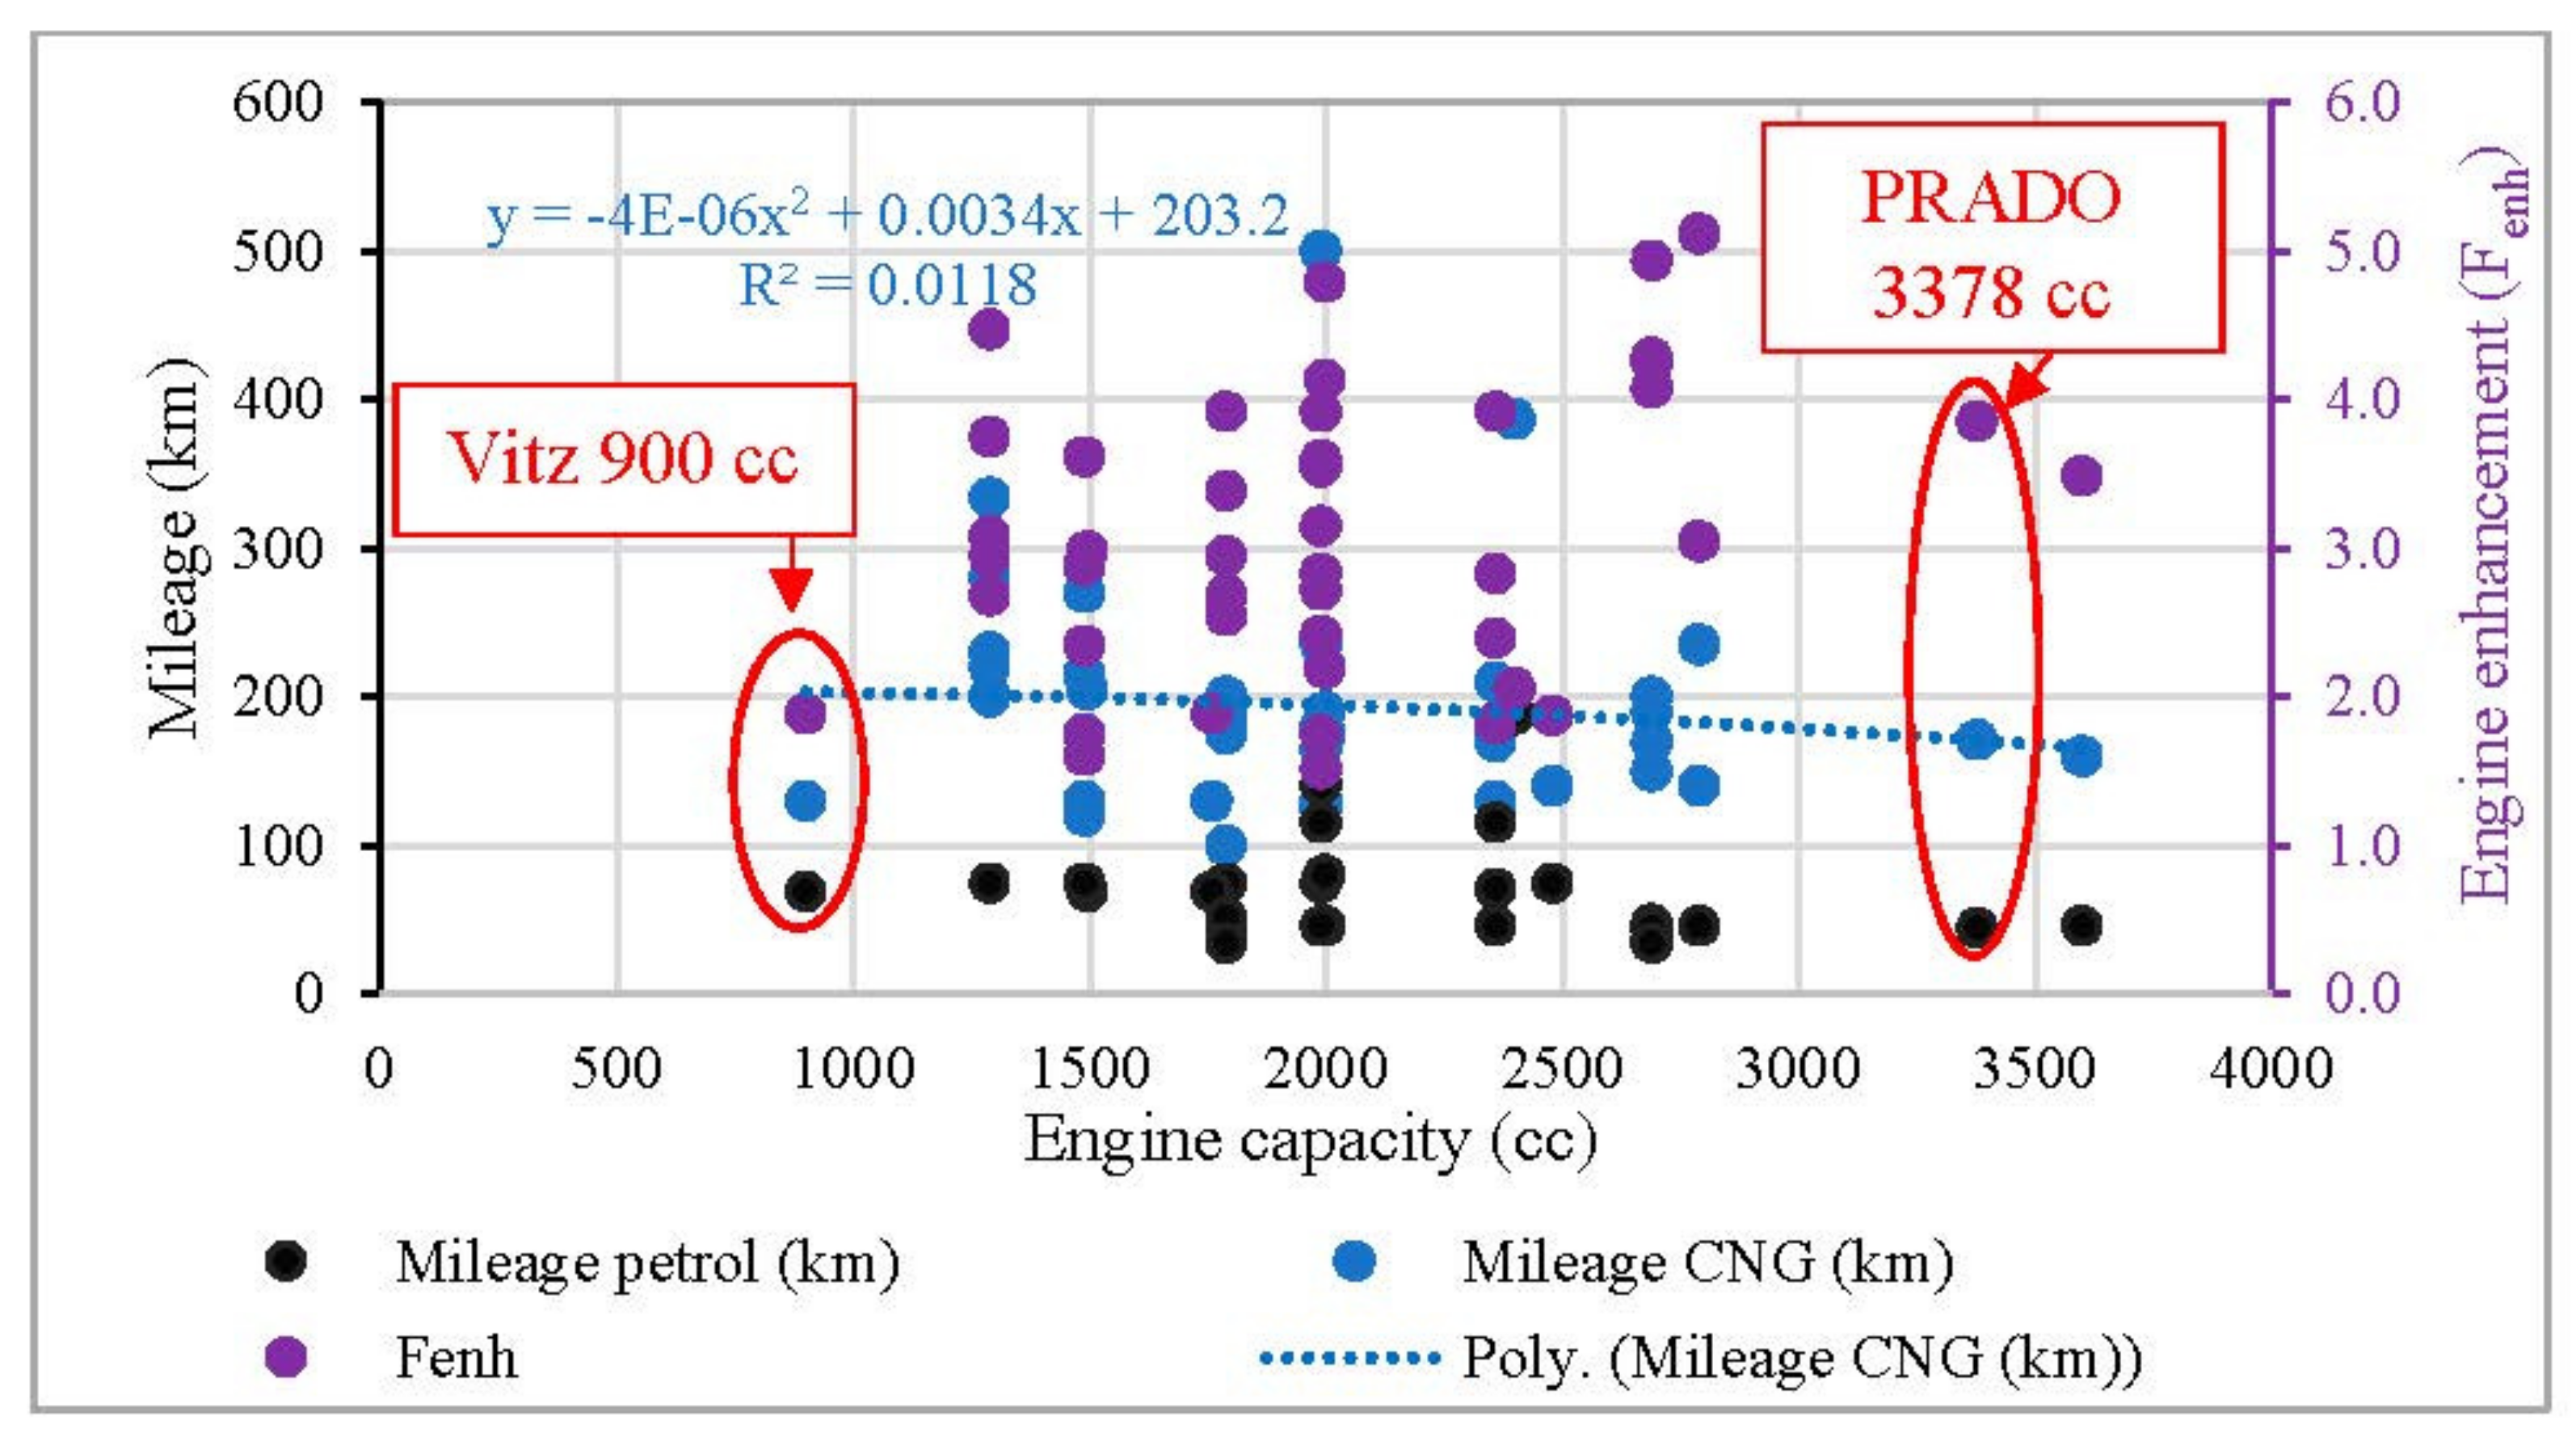
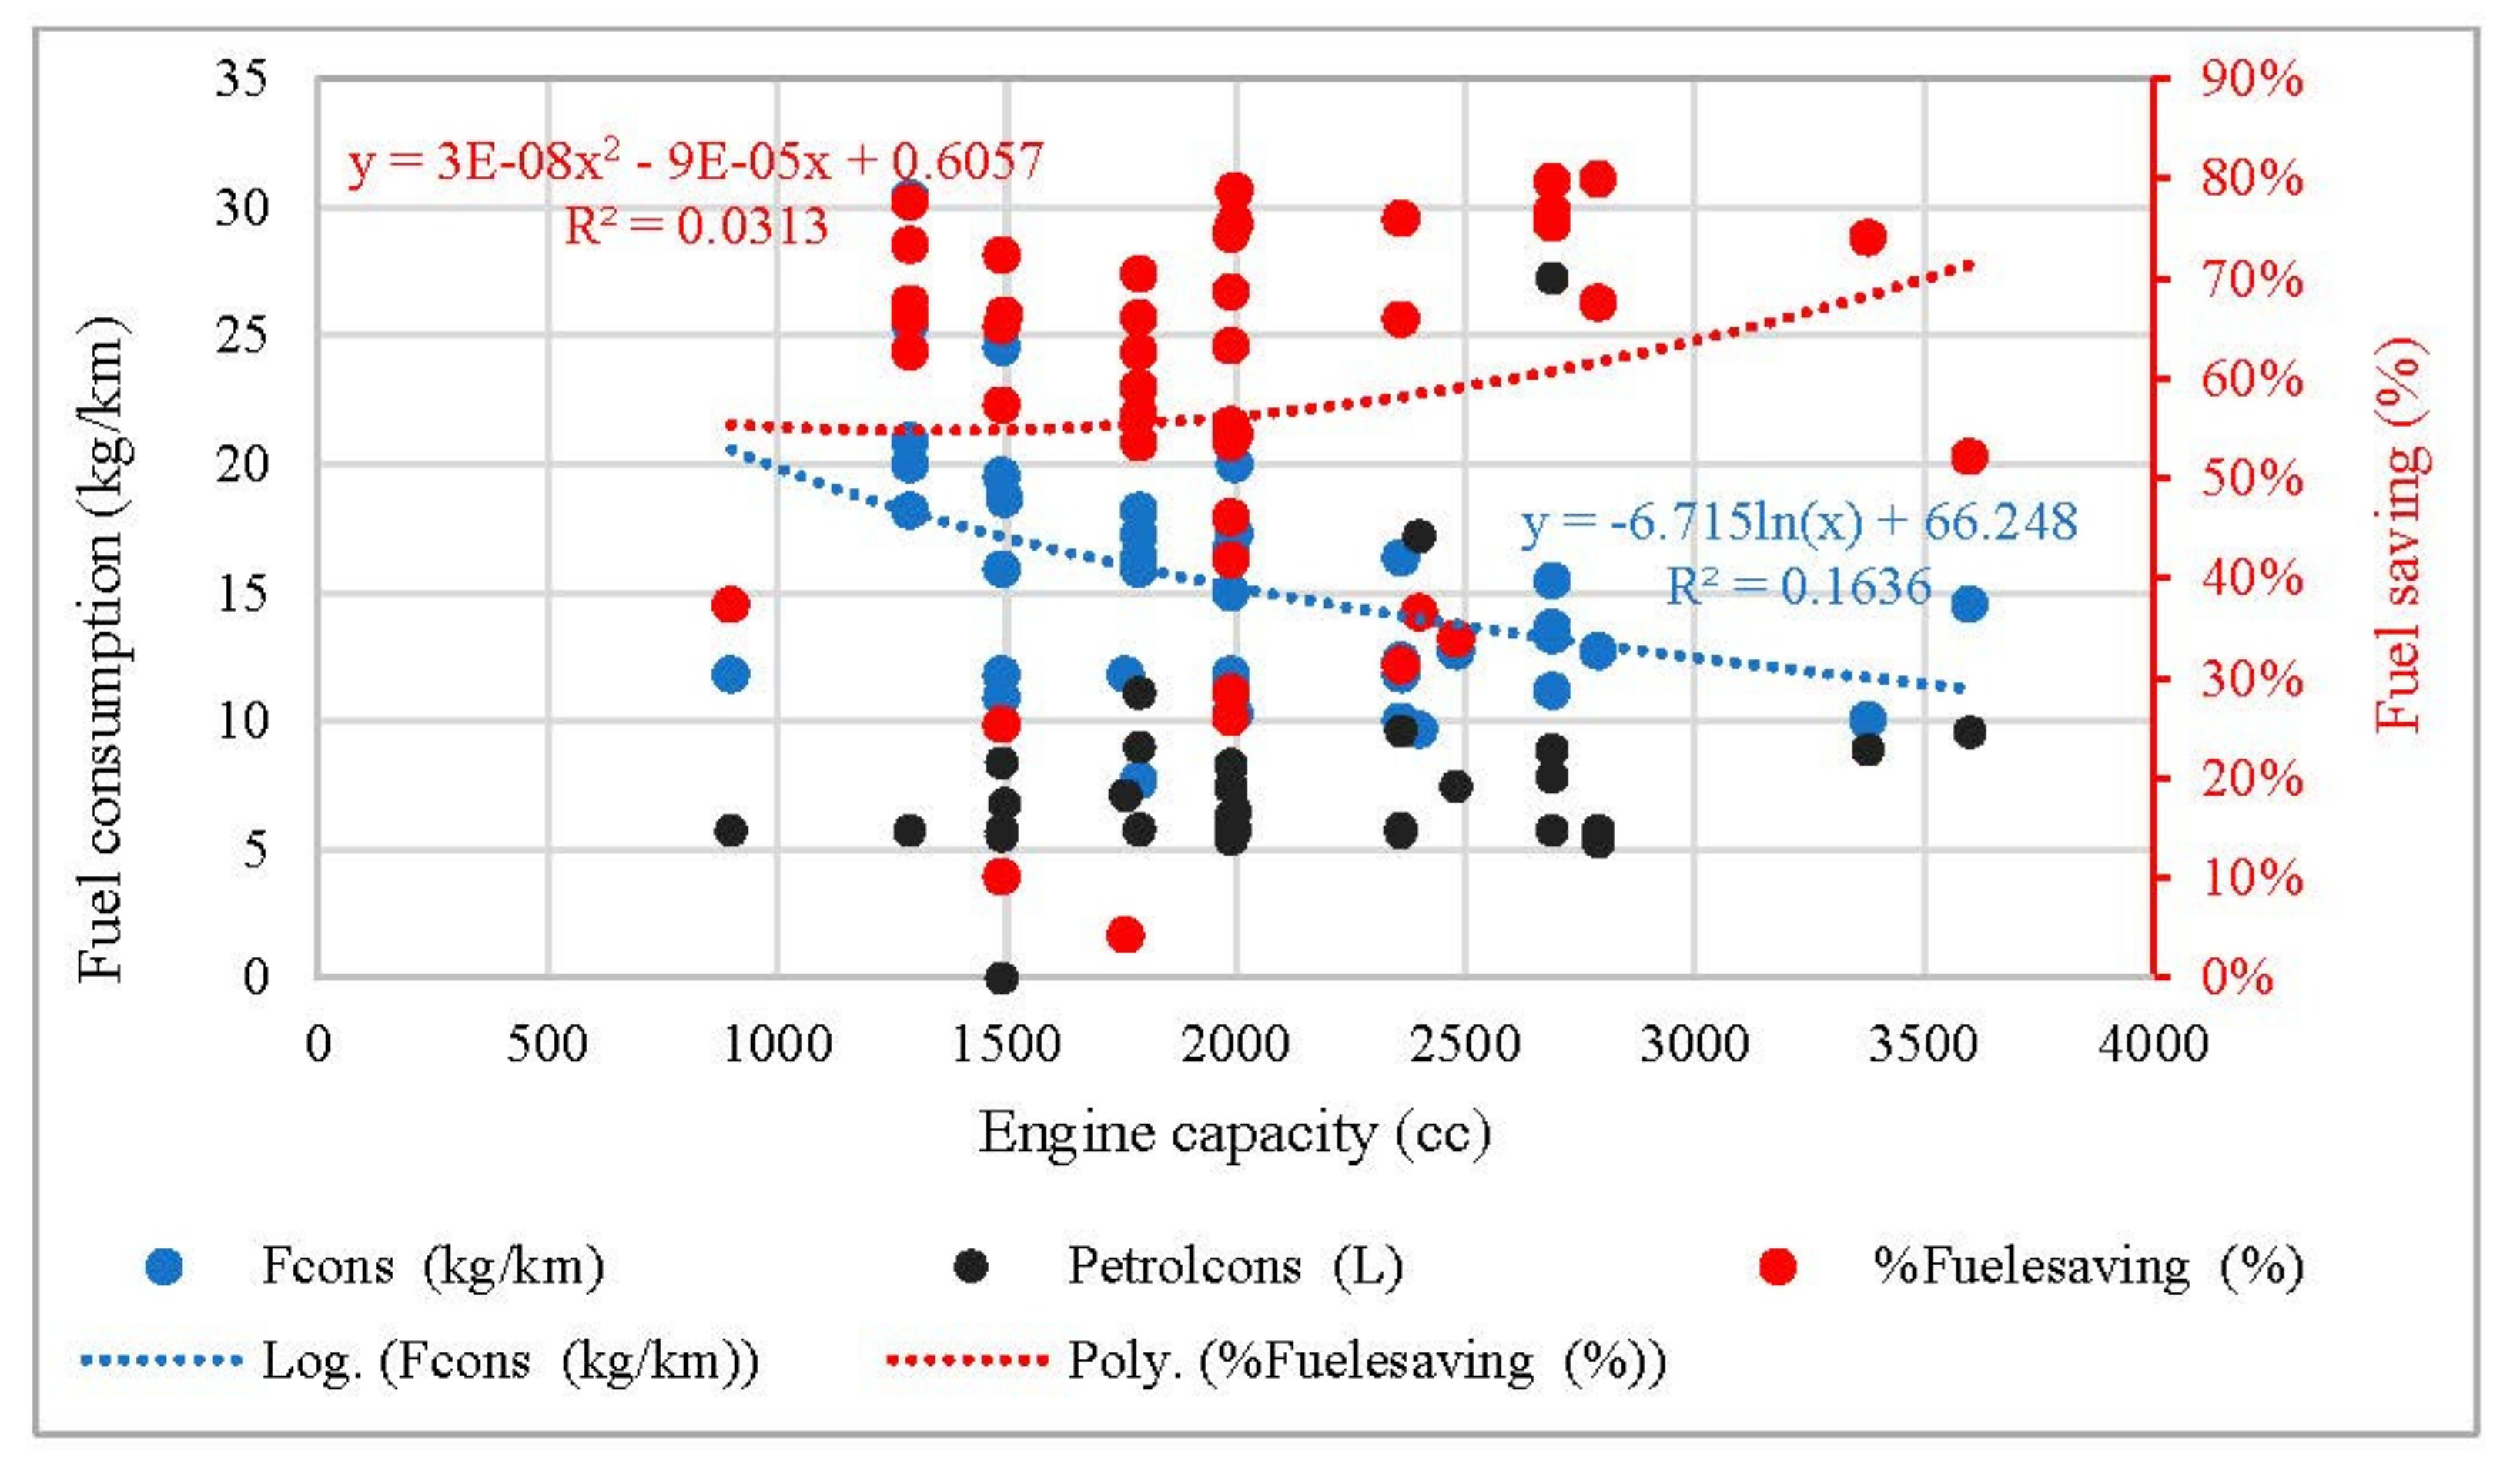
The technical analyses of gasoline retrofitted NGVs indicated an average mileage of 100 to 500 km per CNG filling, depending on the CNG cylinder size, and the mileage decreased with increasing engine capacity. The NGVs attained significant engine enhancement, ranging between 1.9 and 3.9, indicating that more mileage could be covered on CNG. In terms of fuel savings, NGVs can save between 71 and 78% of gasoline fuel, with insignificant effects on vehicle applications. With a proportion of 30:70 diesel-CNG fuel, the NGV (heavy-duty truck) could reach 1300 km, saving about 440 L, which is 78.6%. For a medium passenger car with 30:70 diesel-CNG fuel, 15 kg of CNG could reach 350 km, with fuel savings of about 75%.
-
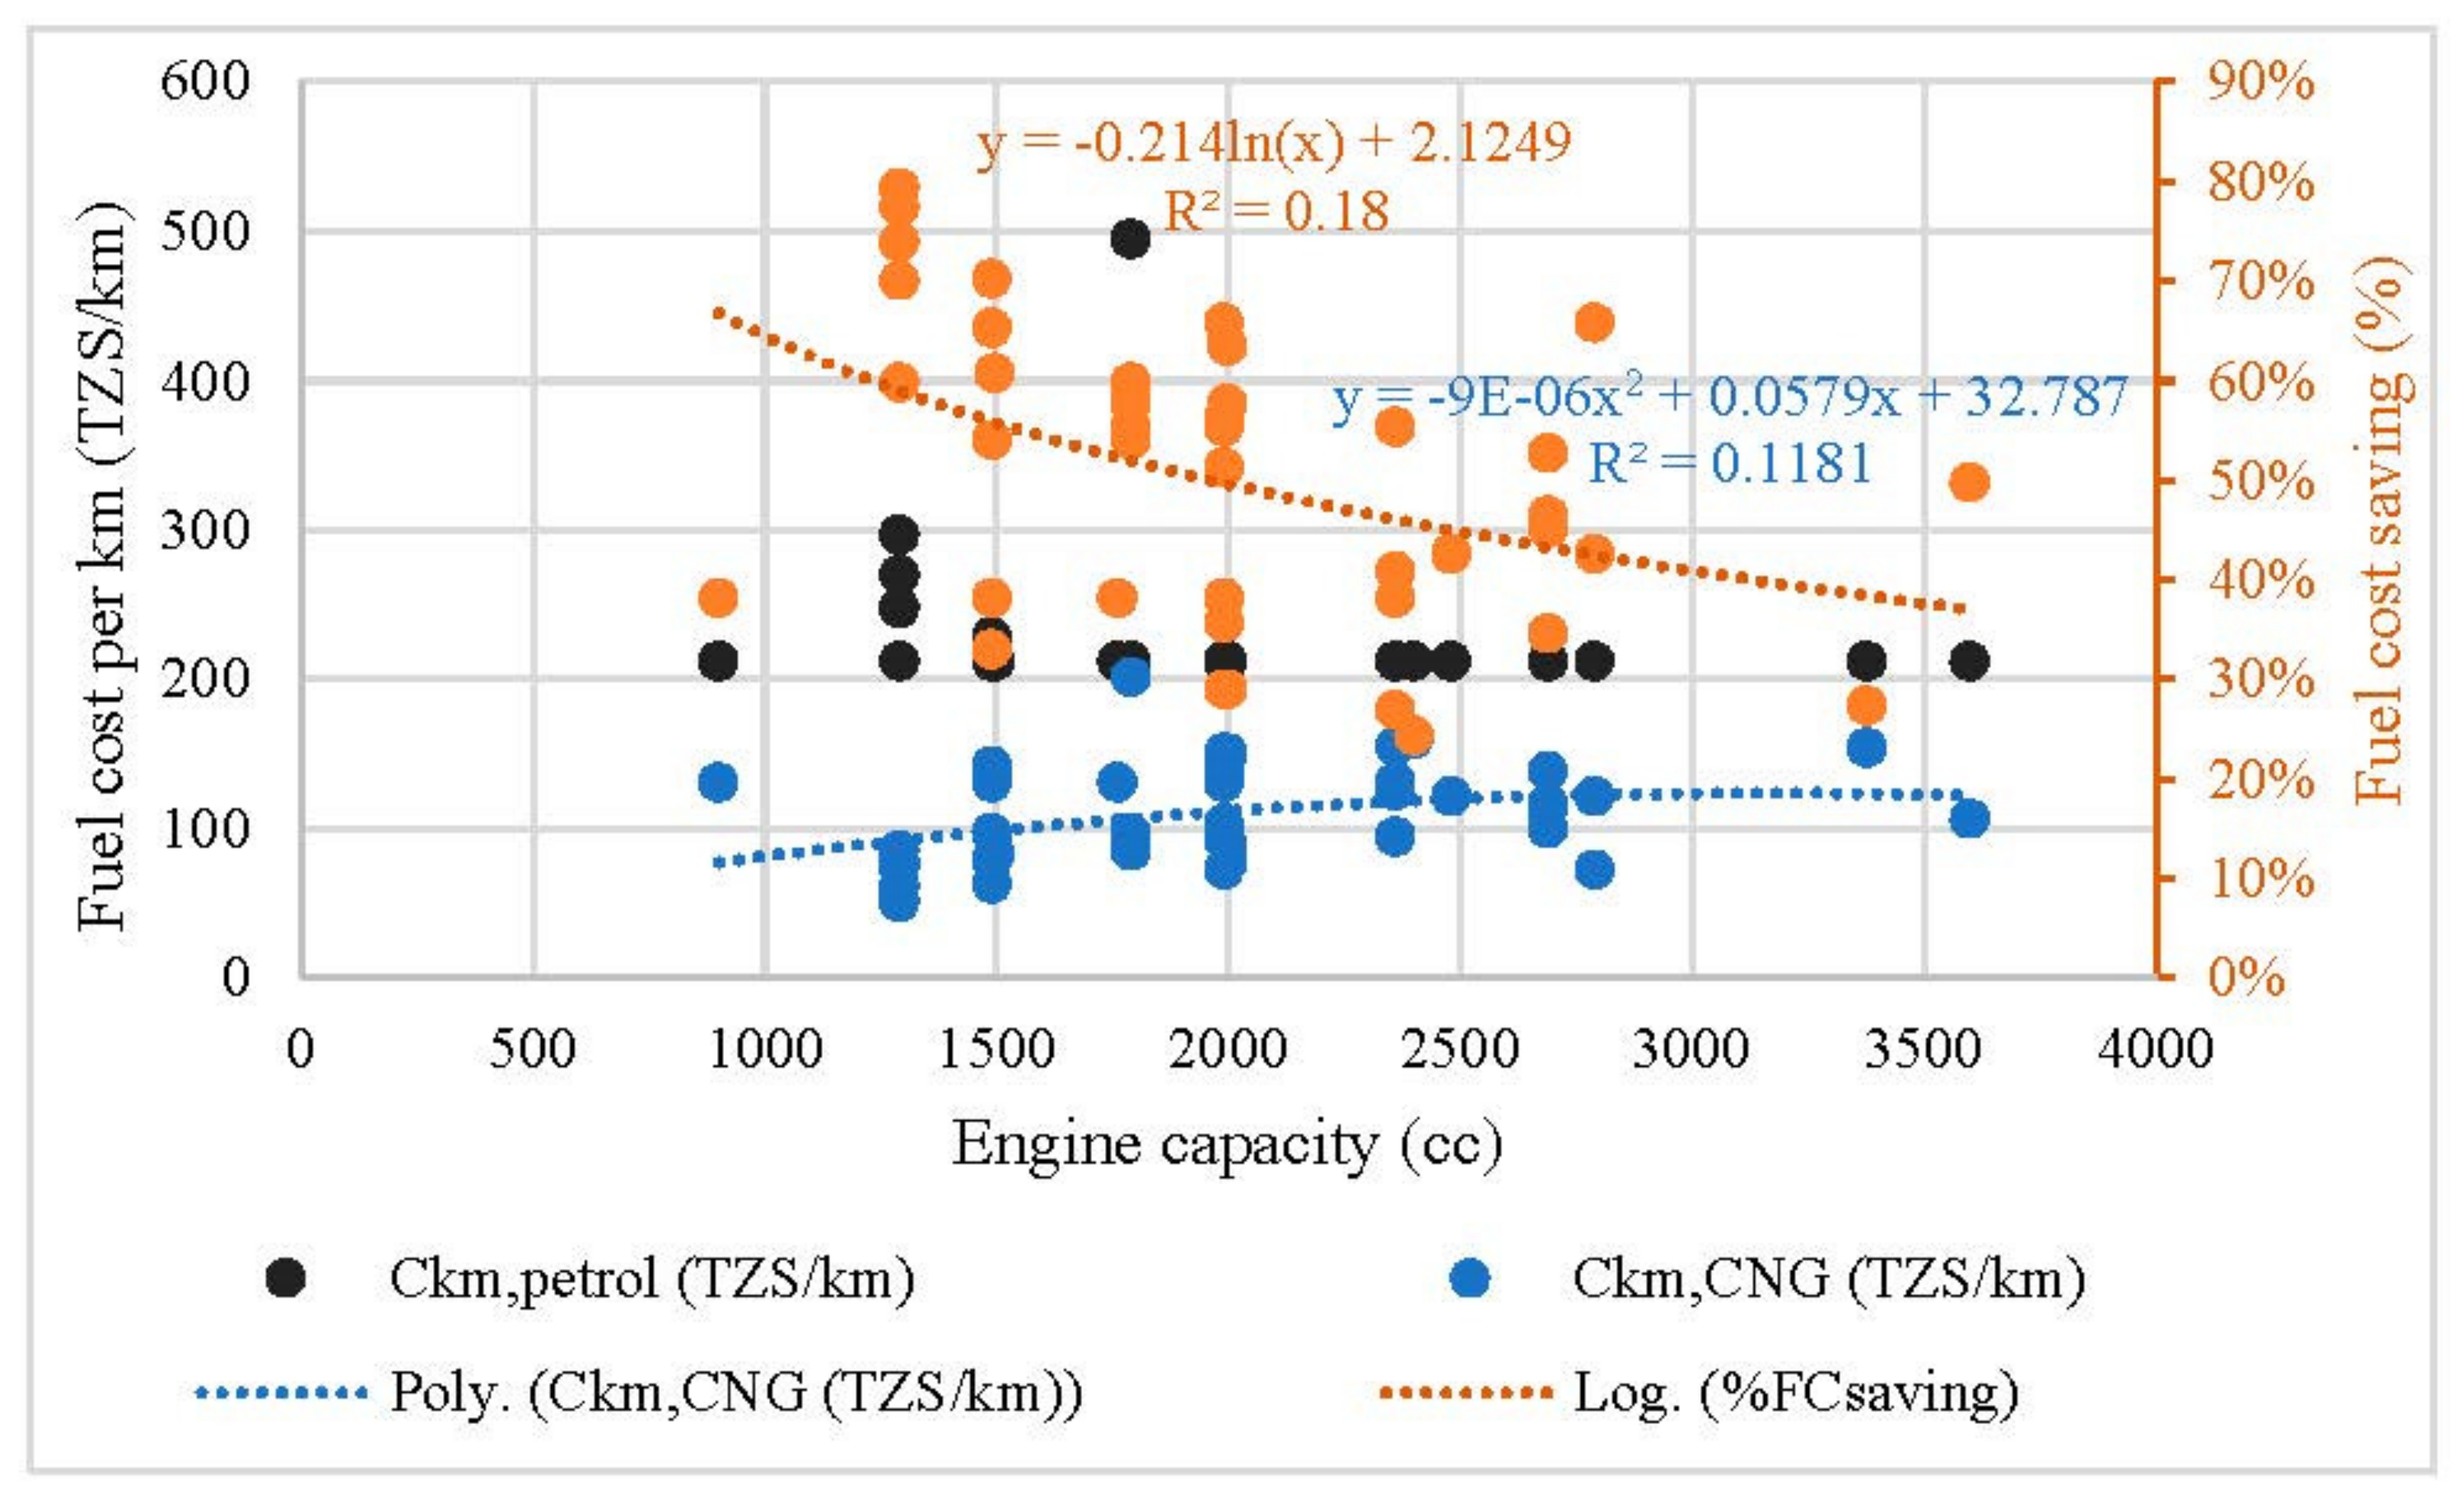
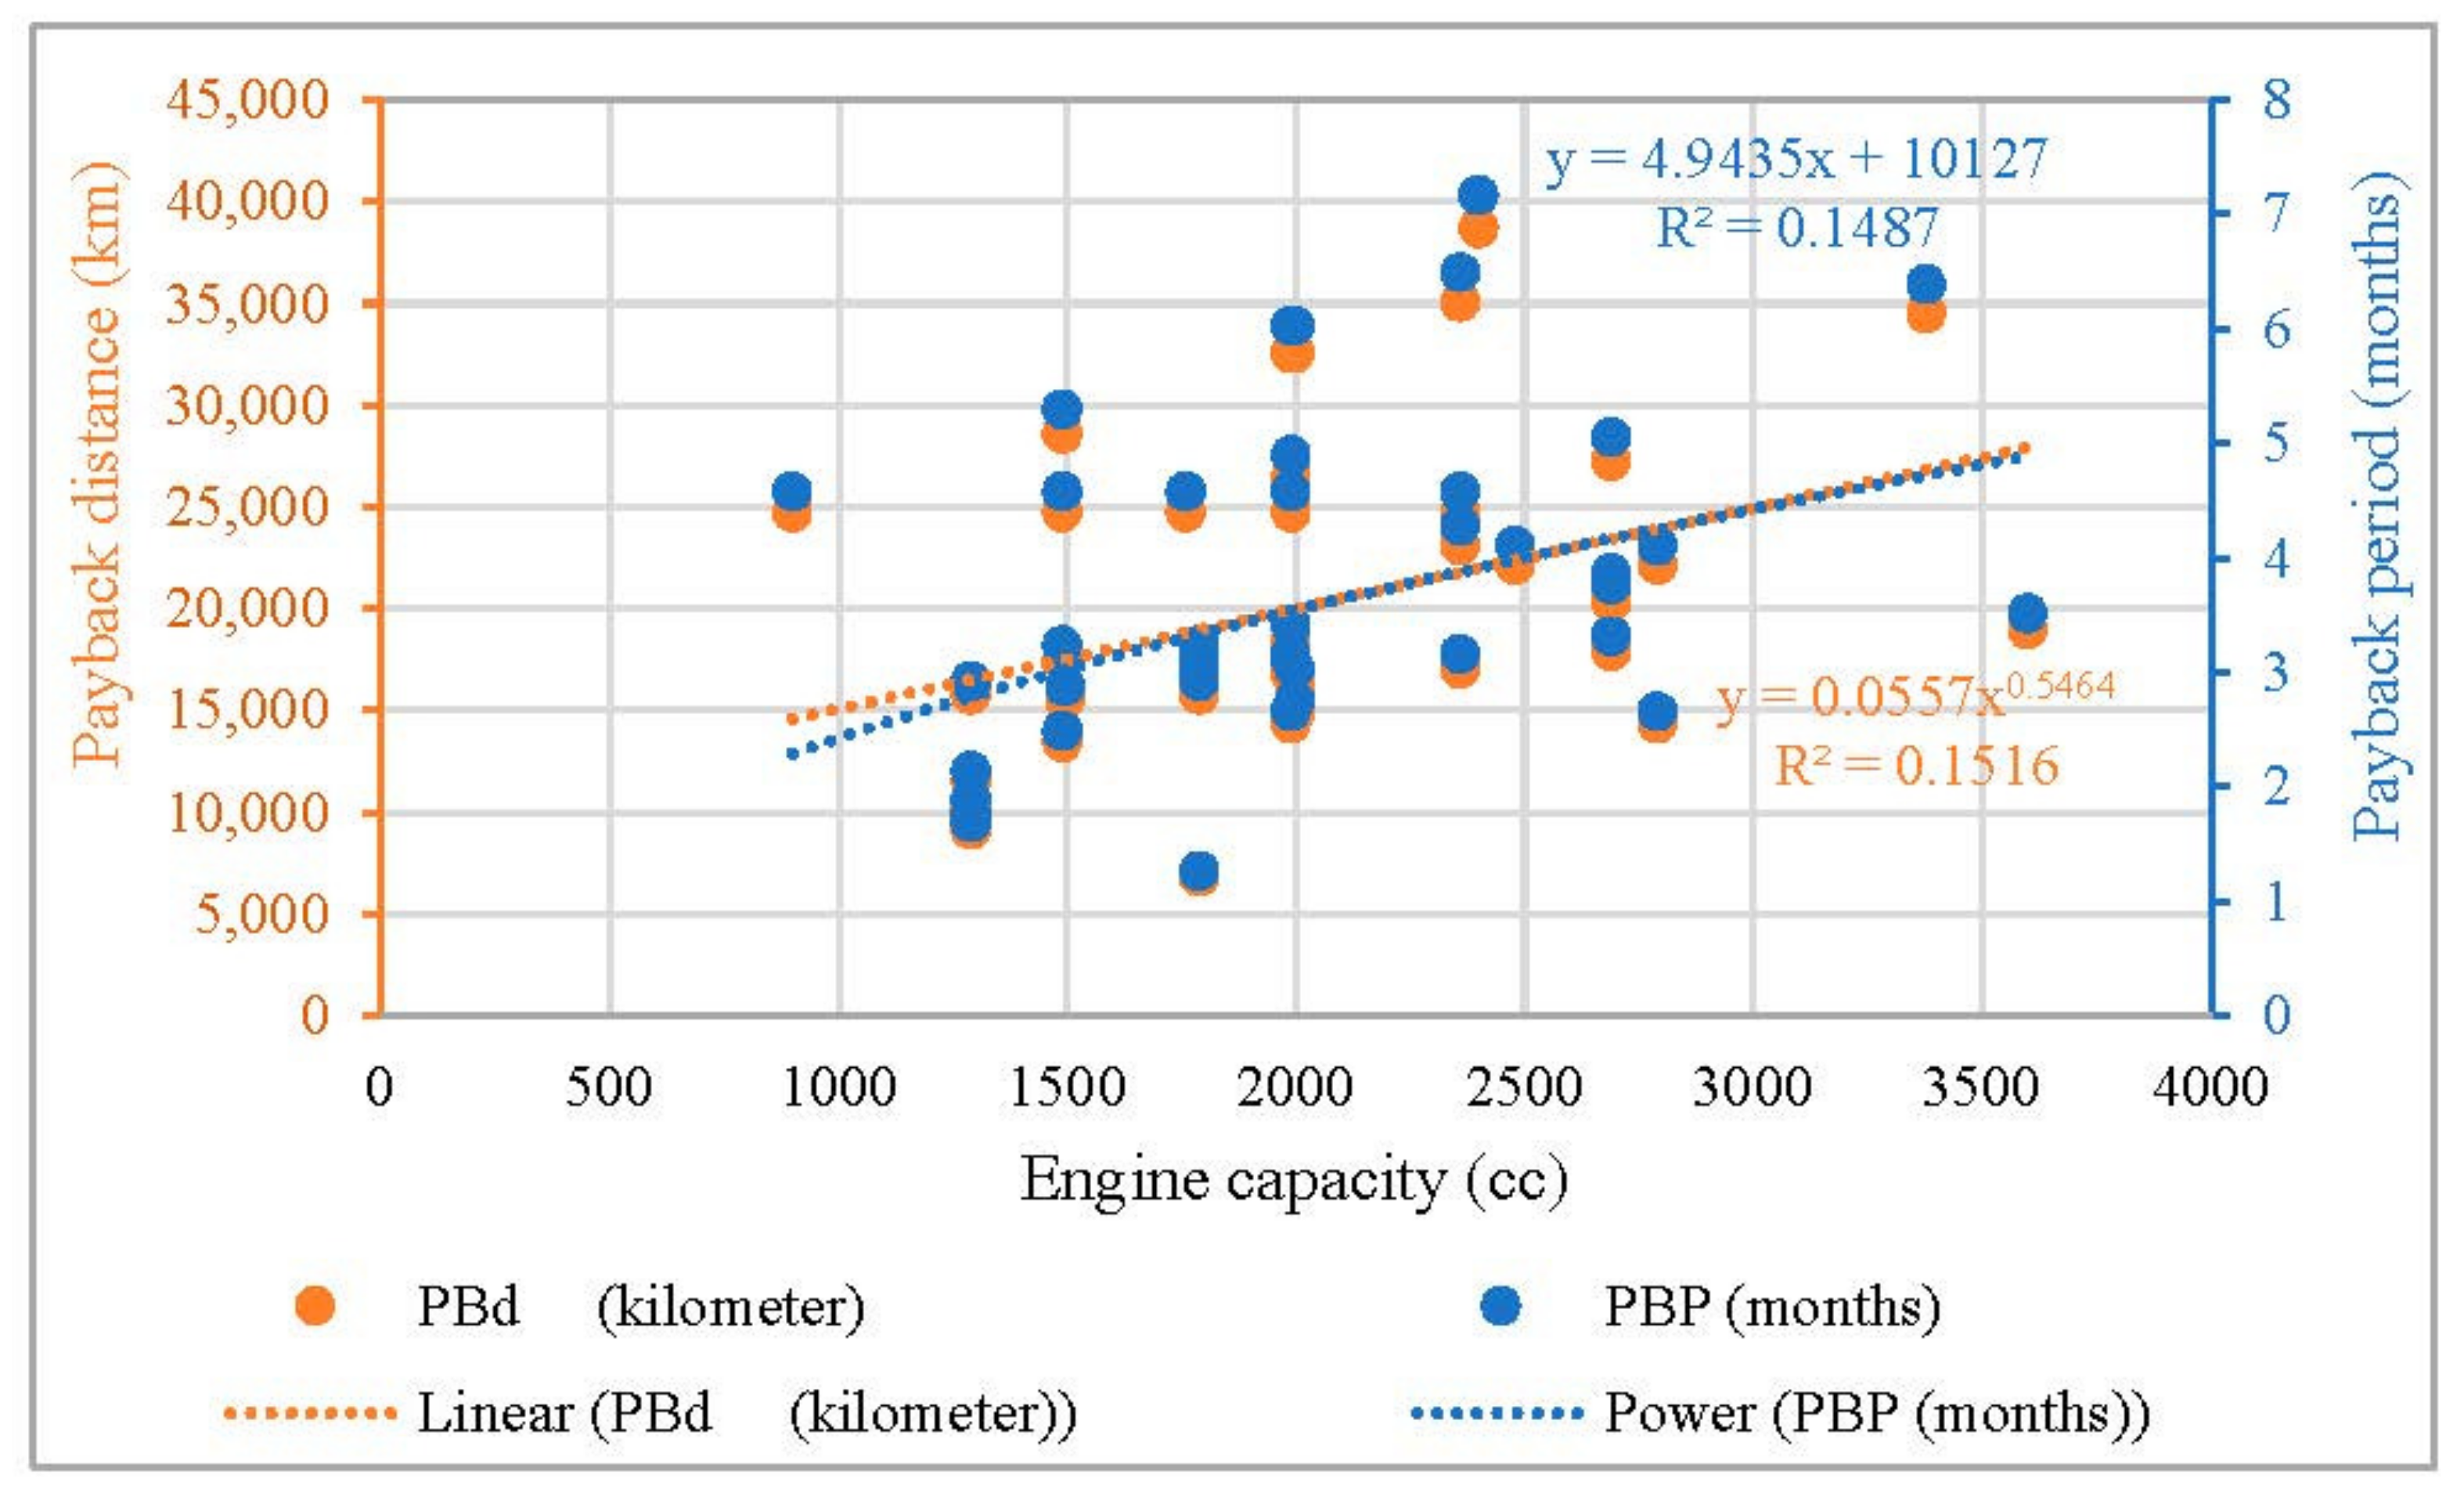
On the economic side, gasoline retrofitted NGVs cost about 50 to 200 km TZS/km, depending on the size of the CNG cylinder. This presents a fuel cost saving of up to 79%. After retrofitting to NGVs, gasoline vehicles start to pay off between 2 and 7 months or 10,000 and 40,000 km, depending on the engine capacity. Considering dual fuel, the heavy-duty truck consumes about 496 TZS/km while saving about 62.3% of diesel fuel. Additionally, the vehicles could start to pay off after 2.5 months or 29,304 km.
-
Lack of proper information regarding socio–technical–economic benefits of NGVs, exclusion of NG as a vehicular fuel in existing policies, rigid and outdated policies, lack of dedicated bodies to promote NGVs, and financial difficulties are among the barriers hindering the wide penetration of NGVs in Tanzania.
It is recommended that, each year, new technologies, global regulations, strategies, and business scenarios are developed and introduced in the market. If Tanzania’s government does not address the existing barriers and employ green policies to speed up the use of its NG in the next few years, it will become obsolete over the other cleaner fuels. Most of the NGVs in Tanzania are not dedicated, and the government could find new ways of compensating the oil shares on NGV revenues. Sequential kits could be very user-friendly and durable for users to switch their kits to other vehicles while appealing to the government to create a more pocket-friendly price for gas in view of the numerous benefits associated with CNG.

8. Future Works

To simulate the effects of road conditions on vehicle performance and fuel economy, lab-scale tests could be performed. To broaden the knowledge of environmental savings for different vehicle models and loads, brake thermal efficiency and emission tests should be performed. Further research is needed to understand the effects of NG substitution across a wide range of loads in terms of combustion and emissions. Furthermore, analyses could consider the normalization of energy per kilogram of fuel.

Author Contributions

G.B.G., K.A.G. and P.V.C. prepared the concept; G.B.G., K.A.G. and P.V.C. collected data, analyzed data, and wrote and revised the manuscript. All authors have read and agreed to the published version of the manuscript.

Funding

This research received no external funding.

Acknowledgments

The authors gratefully thank the Dar es Salaam Institute of Technology—CNG Conversion Centre for their support.

Conflicts of Interest

The authors declare no conflict of interest.

Nomenclature

%Fsaving,ipercentage of fuel saved for vehicle with category i CNG (L)
Cc,i,jconversion cost for vehicle with category i and cylinder size j (TZS)
FCCNGamount of petrol that is equivalent to CNG consumed during driving (L)
Fconsfuel consumption (kg/km)
Fpetrolamount of petrol consumed during driving (L)
Fcutdowndiesel fuel cut down when using dual fuel (L)
Fdieseldiesel fuel used during driving (L)
Fenhengine fuel enhancement (dimensionless)
Fsavingpetrol fuel saved by running the vehicle on CNG (L)
MiCNGvehicle mileage when driving on CNG (km)
Midualvehicle mileage when driving on dual fuel (km)
Mipetrolvehicle mileage when driving on petrol (km)
PBpayback
PBd,i,jpayback distance for vehicle with category i and cylinder type j (km)
PBp,i,jpayback period for vehicle with category i and cylinder type j (months)
QCNGtotal amount of CNG consumed during driving (kg)
SCNG-idleengine speed when running on CNG during idle mode (km/h)
Sdrop-idledrop in engine speed during idle mode (km/h)
Spetrol-idleengine speed when running on petrol during idle mode (km/h)
NGnatural gas
NGVnatural gas vehicle
Subscripts
cconversion
CNGcompressed natural gas
consconsumption
cutdownfuel cutdown
dualdual fuel
enhenhancement
ivehicle category
jcylinder type
savingsaving

References

  1. Greyson, K.A.; Gerutu, G.B.; Bobi, S.; Chombo, P.V. Exploring the potential of compressed natural gas as a sustainable fuel for rickshaw: A case study of Dar es Salaam. J. Nat. Gas Eng. 2021, 96, 104273. [Google Scholar] [CrossRef]
  2. Bishoge, O.K.; Zhang, L.; Mushi, W.G.; Suntu, S.L.; Mihuba, G.G. An overview of the natural gas sector in Tanzania-Achievements and challenges. J. Adv. Res. 2018, 3, e108. [Google Scholar] [CrossRef] [Green Version]
  3. Gerutu, G.B.; Mohamed, C.H.; Chombo, P.V. Transition to Compressed Natural Gas Rickshaws for Urban Mobility: A Case of Dar es Salaam City. JLMSE 2021, 3, 81–87. [Google Scholar]
  4. Baratta, M.; d’Ambrosio, S.; Iemmolo, D.; Misul, D. Method for the recognition of the fuel composition in CNG engines fed with natural gas/biofuel/hydrogen blends. J. Nat. Gas Sci. Eng. 2017, 40, 312–326. [Google Scholar] [CrossRef]
  5. Sonachalam, M.; Manieniyan, V. Optimization of critical angle, distance and flow rate of secondary fuel injection in DI diesel engine using computational fluid dynamics. SN Appl. Sci. 2021, 3, 126. [Google Scholar] [CrossRef]
  6. Manieniyan, V.; Sukumar, V.; Senthilkumar, R.; Sivaprakasam, S. Emission reduction using biodiesel blends with nano-additives and reformed exhaust gas recirculation (REGR) in DI diesel engine. Int. J. Ambient Energy 2022, 43, 641–647. [Google Scholar] [CrossRef]
  7. Demirbas, A. Alternatives to petroleum diesel fuel. Energy Sources Part B 2007, 2, 343–351. [Google Scholar] [CrossRef]
  8. Ali, Y.; Hanna, M.A. Alternative diesel fuels from vegetable oils. Bioresour. Technol. 1994, 50, 153–163. [Google Scholar] [CrossRef]
  9. Islam, M.; Ahmed, A.S.; Islam, A.; Abdul Aziz, S.; Xian, L.C.; Mridha, M. Study on emission and performance of diesel engine using castor biodiesel. J. Chem. 2014, 2014, 452516. [Google Scholar] [CrossRef] [Green Version]
  10. Kamala, J. DIT to Train Locals as CNG Demand Climbs. Daily News. 2020. Available online: https://dailynews.co.tz/news/2020-04-075e8c8fabc8878.aspx (accessed on 29 October 2022).
  11. NGV Global. Current Natural Gas Vehicle Statistics. 2021. Available online: http://www.iangv.org/current-ngv-stats/ (accessed on 29 October 2022).
  12. NGV Global. Natural Gas Vehicle Knowledge Base. 2022. Available online: https://www.iangv.org/ (accessed on 29 October 2022).
  13. Likitsuwannakool, N.; Combs, H.W.; Chaipoopirutana, S. A comparative study of prospective natural gas for vehicle (NGV) buyers’ behavior intention in Thailand. J. Int. Buss. Cult. Stud. 2012, 6, 1–10. [Google Scholar]
  14. NGV Global. NGV Development in Thailand. 2005. Available online: http://www.iangv.org/category/country/thailand/#:~:text=Current%20status%20of%20NGV%20in%20Thailand&text=%E2%80%93%2034%20NGV%20Service%20Stations%20and%2010%20more%20stations%20are%20under%20construction (accessed on 29 October 2022).
  15. Centre for Science and Environment. CNG Programme in India: The Future Challenges. Available online: http://www.indiaenvironmentportal.org.in/files/CNG%20programme%20in%20India.pdf (accessed on 29 October 2022).
  16. European Commission. Putting European Transport on Track for the Future. 2021. Available online: https://transport.ec.europa.eu/system/files/2021-04/2021-mobility-strategy-and-action-plan.pdf (accessed on 29 October 2022).
  17. Ibeneme, I.O.; Ighalo, J.O. Implementation of CNG as an alternative fuel for automobiles in Nigeria: Benefits and recommendations. Int. J. Eng. Res. Technol. 2020, 9, 1516–1522. [Google Scholar]
  18. NGV Global. Egypt Country Report July 06. 2006. Available online: https://www.iangv.org/category/country/egypt/ (accessed on 29 October 2022).
  19. The World Bank GDP per Capita (Current US$), The World Bank. 2020. Available online: https://data.worldbank.org/indicator/NY.GDP.PCAP.CD (accessed on 29 October 2022).
  20. Greyson, K.A.; Gerutu, G.B.; Mohamed, C.H.; Chombo, P.V. Exploring the adoption of e-bicycle for student mobility in rural and urban areas of Tanzania. Sustain. Energy Technol. Assess. 2021, 45, 101206. [Google Scholar]
  21. EWURA. Natural Gas Sub-Sector Regulatory Performance: Report for the Year Ended on 30 June 2020. 2020. Available online: https://www.ewura.go.tz/wp-content/uploads/2021/07/Natural-Gas-Sub-Sector-Performance-Report-for-the-Year-ended-June-2020.pdf (accessed on 29 November 2022).
  22. Staffell, I. The Energy and Fuel Data Sheet. 2011. Available online: https://www.claverton-energy.com/wordpress/wp-content/uploads/2012/08/the_energy_and_fuel_data_sheet1.pdf (accessed on 29 November 2022).
  23. Korakianitis, T.; Namasivayam, A.M.; Crookes, R.J. Natural-gas fueled spark-ignition (SI) and compression-ignition (CI) engine performance and emissions. Prog. Energy Combust. Sci. 2011, 37, 89–112. [Google Scholar] [CrossRef]
  24. Karim, G.A. Combustion in gas fueled compression ignition engines of the dual fuel type. J. Eng. Gas. Turbine. Power 2003, 125, 827–836. [Google Scholar] [CrossRef]
  25. Farzaneh-Gord, M.; Rahbari, H.R.; Nikofard, H. The effect of important parameters on the natural gas vehicles driving range. Pol. J. Chem. Technol. 2012, 14, 61–68. [Google Scholar] [CrossRef] [Green Version]
  26. Jobbágy, P. Payback Analysis of E85- and CNG-Powered Vehicles in Hungary. APSTRACT 2013, 6, 47–50. [Google Scholar] [CrossRef] [PubMed]
  27. Savickis, J.; Ansone, A.; Zemite, L.; Bode, I.; Jansons, L.; Zeltins, N.; Koposovs, A.; Vempere, L.; Dzelzitis, E. The natural gas as a sustainable fuel alternative in Latvia. Latv. J. Phys. Tech. 2021, 3, 169–185. [Google Scholar]
Figure 1. The arrangement of CNG components in petrol-fueled vehicles.
Methane 02 00006 g001
Figure 2. The arrangement of CNG components in diesel-fueled vehicles.
Methane 02 00006 g002
Figure 3. The comparison of mileage and engine enhancement for gasoline vehicles with different engine capacities.
Methane 02 00006 g003
Figure 4. The comparison of consumption and fuel saving for gasoline vehicles with different engine capacities.
Methane 02 00006 g004
Figure 5. The comparison of fuel cost per kilometer and fuel cost saving for gasoline vehicles with different engine capacities.
Methane 02 00006 g005
Figure 6. The comparison of payback distance and payback period for gasoline vehicles with different engine capacities.
Methane 02 00006 g006
Figure 7. Some of the technical challenges found during inspection prior to the installation of CNG system in gasoline vehicles (a) incompatible engine technologies, (b) poorly maintained engines, (c) weakened spark plugs, and (d) weakened spark plug housings.
Methane 02 00006 g007
Figure 8. Some of the technical challenges found in the NGVs (a) defective CNG cylinders, (b) malfunctioning of changeover switches, (c) malfunctioning MAP sensor, (d) punctured hose pipes, (e) damaged O–rings, (f) cracking of CNG injection nozzles, and (g) corroded high–pressure pipes.
Methane 02 00006 g008
Table 1. Properties of vehicle fuels used in this study adapted from [21,22].
FuelsFlammability RangeDensity
kg/m3
Ignition Temp.
°C
Energy/Kilogram
MJ/kg
Energy/Liter
MJ/L
Natural gas5.0–15.0%0.7062853.638.9
Gasoline1.4–7.6%3.0033346.434.2
Diesel4.0–7.5%3.0033345.434.6
Table 2. The effect of vehicle applications on fuel saving.
Engine CapacitiesVehicles Applicationsdmax,CNG
(km)
FCpetrol
(km/L)
FCCNG (km/kg)%FCsaving
500–2499 ccHome-to-office180–2809.5–1015–2570.1–70.9
Small enterprises and online taxis200–33011–1318–2870.5–72.5
2500–3500 ccHome-to-office140–1602.5–3.05.5–1374.7–75.8
Small enterprises and online taxis150–1704.5–6.08.0–1577.6–80.9
Table 3. Technical performance of diesel-CNG-fueled medium-duty and heavy-duty vehicles.
Vehicle TypeFCdieselFCdualMi,diesel
(diesel)
Mi,dual
(Dual Fuel)
FenhFuel Saving
Fortuner7 km/L16 km/kg150 km350 km2.3375%
HOWO2 km/L8 km/L325 km1300 km462.3%
Table 4. Costs of retrofitting petrol-fueled light-duty and medium-duty vehicles to NGVs.
Engine CapacityConversion Cost (TZS)
Engine CylindersEngine Capacity, cc11 kg CNG Cylinder17 kg CNG Cylinder
3–4 cylinders600–19002.0 millionN/A
1900–29002.0 million2.7 million
2000–29902.5 million2.7 million
6 cylinders2000–30003.0 million3.5 million
3100–40003.0 million3.7 million
8 cylinders4000–47003.0 million3.5 million
4 cylinders3000–33003.5 million3.7 million
6 cylinders3100–40003.5 million3.7 million
8 cylinders4000–47004.0 million4.0 million
Table 5. Assessment of the dual fuel NGVs’ performance.
Vehicle TypeCkm,dieselCkm,dualFCsaving% FCsavingPBpPBd
FORTUNER43666.42369.5784.8%7 months35,000 km
HOWO1526214.61311.485.92.5 months29,304 km
Disclaimer/Publisher’s Note: The statements, opinions and data contained in all publications are solely those of the individual author(s) and contributor(s) and not of MDPI and/or the editor(s). MDPI and/or the editor(s) disclaim responsibility for any injury to people or property resulting from any ideas, methods, instructions or products referred to in the content.

