
Characteristics of Dietary Intake in Relation to the Consumption of Home-Produced Foods among Farm Women in Two Rural Areas of Kenya: A Preliminary Study

 , , ,
, , ,
Abstract
:1. Introduction
2. Materials and Methods
2.1. Study Design
2.2. Study Sites
2.3. Participants
2.4. Body Measurements
2.5. Dietary Survey
2.6. Dietary Evaluation
2.7. Statistical Analysis
3. Results
4. Discussion
5. Conclusions
Author Contributions
Funding
Institutional Review Board Statement
Informed Consent Statement
Data Availability Statement
Acknowledgments
Conflicts of Interest
References
- Murray, C.J.L.; Aravkin, A.Y.; Zheng, P.; Abbafati, C.; Abbas, K.M.; Abbasi-Kangevari, M.; Abd-Allah, F.; Abdelalim, A.; Abdollahi, M.; Abdollahpour, I.; et al. Global burden of 87 risk factors in 204 countries and territories, 1990–2019: A systematic analysis for the Global Burden of Disease Study 2019. Lancet 2020, 396, 1223–1249. [Google Scholar] [CrossRef] [PubMed]
- Kenya National Bureau of Statistics. Kenya Demographic and Health Survey 2014; Kenya National Bureau of Statistics: Nairobi, Kenya, 2015.
- Global Health Observatory: Prevalence of Anemia in Women of Reproductive Age. Available online: https://www.who.int/data/gho/data/indicators/indicator-details/GHO (accessed on 9 August 2022).
- Hansen, A.W.; Christensen, D.L.; Larsson, M.W.; Eis, J.; Christensen, T.; Friis, H.; Mwaniki, D.L.; Kilonzo, B.; Boit, M.K.; Borch-Johnsen, K.; et al. Dietary patterns, food and macronutrient intakes among adults in three ethnic groups in rural Kenya. Public Health Nutr. 2011, 14, 1671–1679. [Google Scholar] [CrossRef] [PubMed] [Green Version]
- Food and Agriculture Organization of the United Nations; World Health Organization. Sustainable Healthy Diets—Guiding Principles; Food and Agriculture Organization of the United Nations, World Health Organization: Rome, Italy, 2019.
- Akinola, R.; Pereira, L.M.; Mabhaudhi, T.; de Bruin, F.-M.; Rusch, L. A Review of Indigenous Food Crops in Africa and the Implications for more Sustainable and Healthy Food Systems. Sustainability 2020, 12, 3493. [Google Scholar] [CrossRef] [PubMed] [Green Version]
- Maundu, M.; Ngugi, W.; Kabuye, H. Traditional Food Plants of Kenya; Kenya Resource Centre for Indigenous Knowledge (KENRIK) National Museum of Kenya: Nairobi, Kenya, 1999. [Google Scholar]
- van Jaarsveld, P.; Faber, M.; van Heerden, I.; Wenhold, F.; van Rensburg, W.J.; van Averbeke, W. Nutrient content of eight African leafy vegetables and their potential contribution to dietary reference intakes. J. Food Compos. Anal. 2014, 33, 77–84. [Google Scholar] [CrossRef] [Green Version]
- World Health Organization; Regional Office for Africa. Traditional African Leafy Vegetables for Improved Nutrition; No.: WHO/AF/UHP/04/2022; World Health Organization: Geneva, Switzerland; Regional Office for Africa: Brazzaville, Congo Republic, 2022.
- Keding, G.B.; Msuya, J.M.; Maass, B.; Krawinkel, M. Dietary Patterns and Nutritional Health of Women: The Nutrition Transition in Rural Tanzania. Food Nutr. Bull. 2011, 32, 218–226. [Google Scholar] [CrossRef] [PubMed] [Green Version]
- Agrobiodiversity Diet Diagnosis Interventions Toolkit (ADD-IT): Alliance Bioversity International–CIAT. Available online: https://alliancebioversityciat.org/tools-innovations/agrobiodiversity-diet-diagnosis-interventions-toolkit-add-it (accessed on 9 August 2022).
- Ng’Endo, M.; Bhagwat, S.; Keding, G.B. Influence of Seasonal On-Farm Diversity on Dietary Diversity: A Case Study of Smallholder Farming Households in Western Kenya. Ecol. Food Nutr. 2016, 55, 403–427. [Google Scholar] [CrossRef] [PubMed]
- County Government of Kitui. Kitui County Integrated Development Plan 2018–2022; County Government of Kitui: Kitui County, Kenya, 2018.
- County Government of Vihiga. Vihiga County Integrated Development Plan 2018–2022; County Government of Vihiga: Vihiga County, Kenya, 2018.
- Hotz, C.; Pelto, G.; Armar-Klemesu, M.; Ferguson, E.F.; Chege, P.; Musinguzi, E. Constraints and opportunities for implementing nutrition-specific, agricultural and market-based approaches to improve nutrient intake adequacy among infants and young children in two regions of rural Kenya. Matern. Child Nutr. 2015, 11, 39–54. [Google Scholar] [CrossRef] [PubMed] [Green Version]
- FAO; Government of Kenya. Kenya Food Composition Tables; FAO, Republic of Kenya: Nairobi, Kenya, 2018.
- Overview of Food Fortification Program. Available online: https://www.nutritionhealth.or.ke/programmes/micronutrient-deficiency-control/food-fortification/ (accessed on 9 August 2022).
- Meyers, L.D.; Hellwig, J.P.; Otten, J.J. Dietary Reference Intakes: The Essential Guide to Nutrient Requirements; National Academies Press: Washington, DC, USA, 2006. [Google Scholar] [CrossRef]
- Leech, R.M.; Worsley, A.; Timperio, A.; McNaughton, S.A. Characterizing eating patterns: A comparison of eating occasion definitions. Am. J. Clin. Nutr. 2015, 102, 1229–1237. [Google Scholar] [CrossRef] [PubMed] [Green Version]
- Jakubowicz, D.; Barnea, M.; Wainstein, J.; Froy, O. High Caloric intake at breakfast vs. dinner differentially influences weight loss of overweight and obese women. Obesity 2013, 21, 2504–2512. [Google Scholar] [CrossRef] [PubMed]
- Wang, J.B.; Patterson, R.E.; Ang, A.; Emond, J.A.; Shetty, N.; Arab, L. Timing of energy intake during the day is associated with the risk of obesity in adults. J. Hum. Nutr. Diet. 2013, 27, 255–262. [Google Scholar] [CrossRef] [PubMed]
- Mutie, F.; Rono, P.; Kathambi, V.; Hu, G.-W.; Wang, Q.-F. Conservation of Wild Food Plants and Their Potential for Combatting Food Insecurity in Kenya as Exemplified by the Drylands of Kitui County. Plants 2020, 9, 1017. [Google Scholar] [CrossRef] [PubMed]
- Gewa, C.A.; Onyango, A.C.; Angano, F.O.; Stabile, B.; Komwa, M.; Thomas, P.; Krall, J. Mothers’ beliefs about indigenous and traditional food affordability, availability and taste are significant predictors of indigenous and traditional food consumption among mothers and young children in rural Kenya. Public Health Nutr. 2019, 22, 2950–2961. [Google Scholar] [CrossRef] [PubMed]
- Kehlenbeck, K.; Asaah, E.; Jamnadass, R. Diversity of indigenous fruit trees and their contribution to nutrition and livelihoods in sub-saharan Africa: Examples from Kenya and Cameroon. In Diversifying Food and Diets: Using Agricultural Biodiverssity to Improve Nutrition and Health; Earthscan Routledge: New York, NY, USA, 2013; pp. 257–269. [Google Scholar]
- Stelmach-Mardas, M.; Rodacki, T.; Dobrowolska-Iwanek, J.; Brzozowska, A.; Walkowiak, J.; Wojtanowska-Krosniak, A.; Zagrodzki, P.; Bechthold, A.; Mardas, M.; Boeing, H. Link between Food Energy Density and Body Weight Changes in Obese Adults. Nutrients 2016, 8, 229. [Google Scholar] [CrossRef] [PubMed]
- Keding, G. Nutrition Transition in Rural Tanzania and Kenya. World Rev. Nutr. Diet 2016, 115, 68–81. [Google Scholar] [CrossRef] [PubMed]
- Keding, G.B. Linking Nutrition Security and Agrobiodiversity: The Importance of Traditional Vegetables for Nutritional Health of Women in Rural Tanzania; Cuvillier Verlag: Göttingen, Germany, 2010. [Google Scholar]
- Kigutha, H.N. Assessment of dietary intake in rural communities in Africa: Experiences in Kenya. Am. J. Clin. Nutr. 1997, 65, 1168S–1172S. [Google Scholar] [CrossRef] [PubMed] [Green Version]
- Gewa, C.A.; Stabile, B.; Thomas, P.; Onyango, A.C.; Angano, F.O. Agricultural Production, Traditional Foods and Household Food Insecurity in Rural Kenya: Practice, Perception and Predictors. J. Hunger Environ. Nutr. 2021, 16, 1–24. [Google Scholar] [CrossRef]


| Kitui (n = 10) | Vihiga (n = 11) | p-Value * | |||
|---|---|---|---|---|---|
| Age (years old) | 47.0 ± 12.6 | (30–70) | 44.5 ± 14.2 | (25–64) | 0.670 |
| BMI (kg/m2) | 29.5 ± 4.3 | (19.4–35.8) | 27.7 ± 5.4 | (20.3–37.0) | 0.423 |
| Overweight (25 ≤ BMI < 30) | 3 (30%) | 4 (36%) | |||
| Obese (30 ≤ BMI) | 6 (60%) | 4 (36%) | |||
| Kitui (n = 10) | Vihiga (n = 11) | p-Value for Intake (1) | p-Value for Risk (2) | |||
|---|---|---|---|---|---|---|
| Mean ± SD | Risk of Insufficient or Excess | Mean ± SD | Risk of Insufficient or Excess | |||
| Total energy (kcal) † | 1922 ± 421 | - | 2123 ± 598 | - | 0.573 | - |
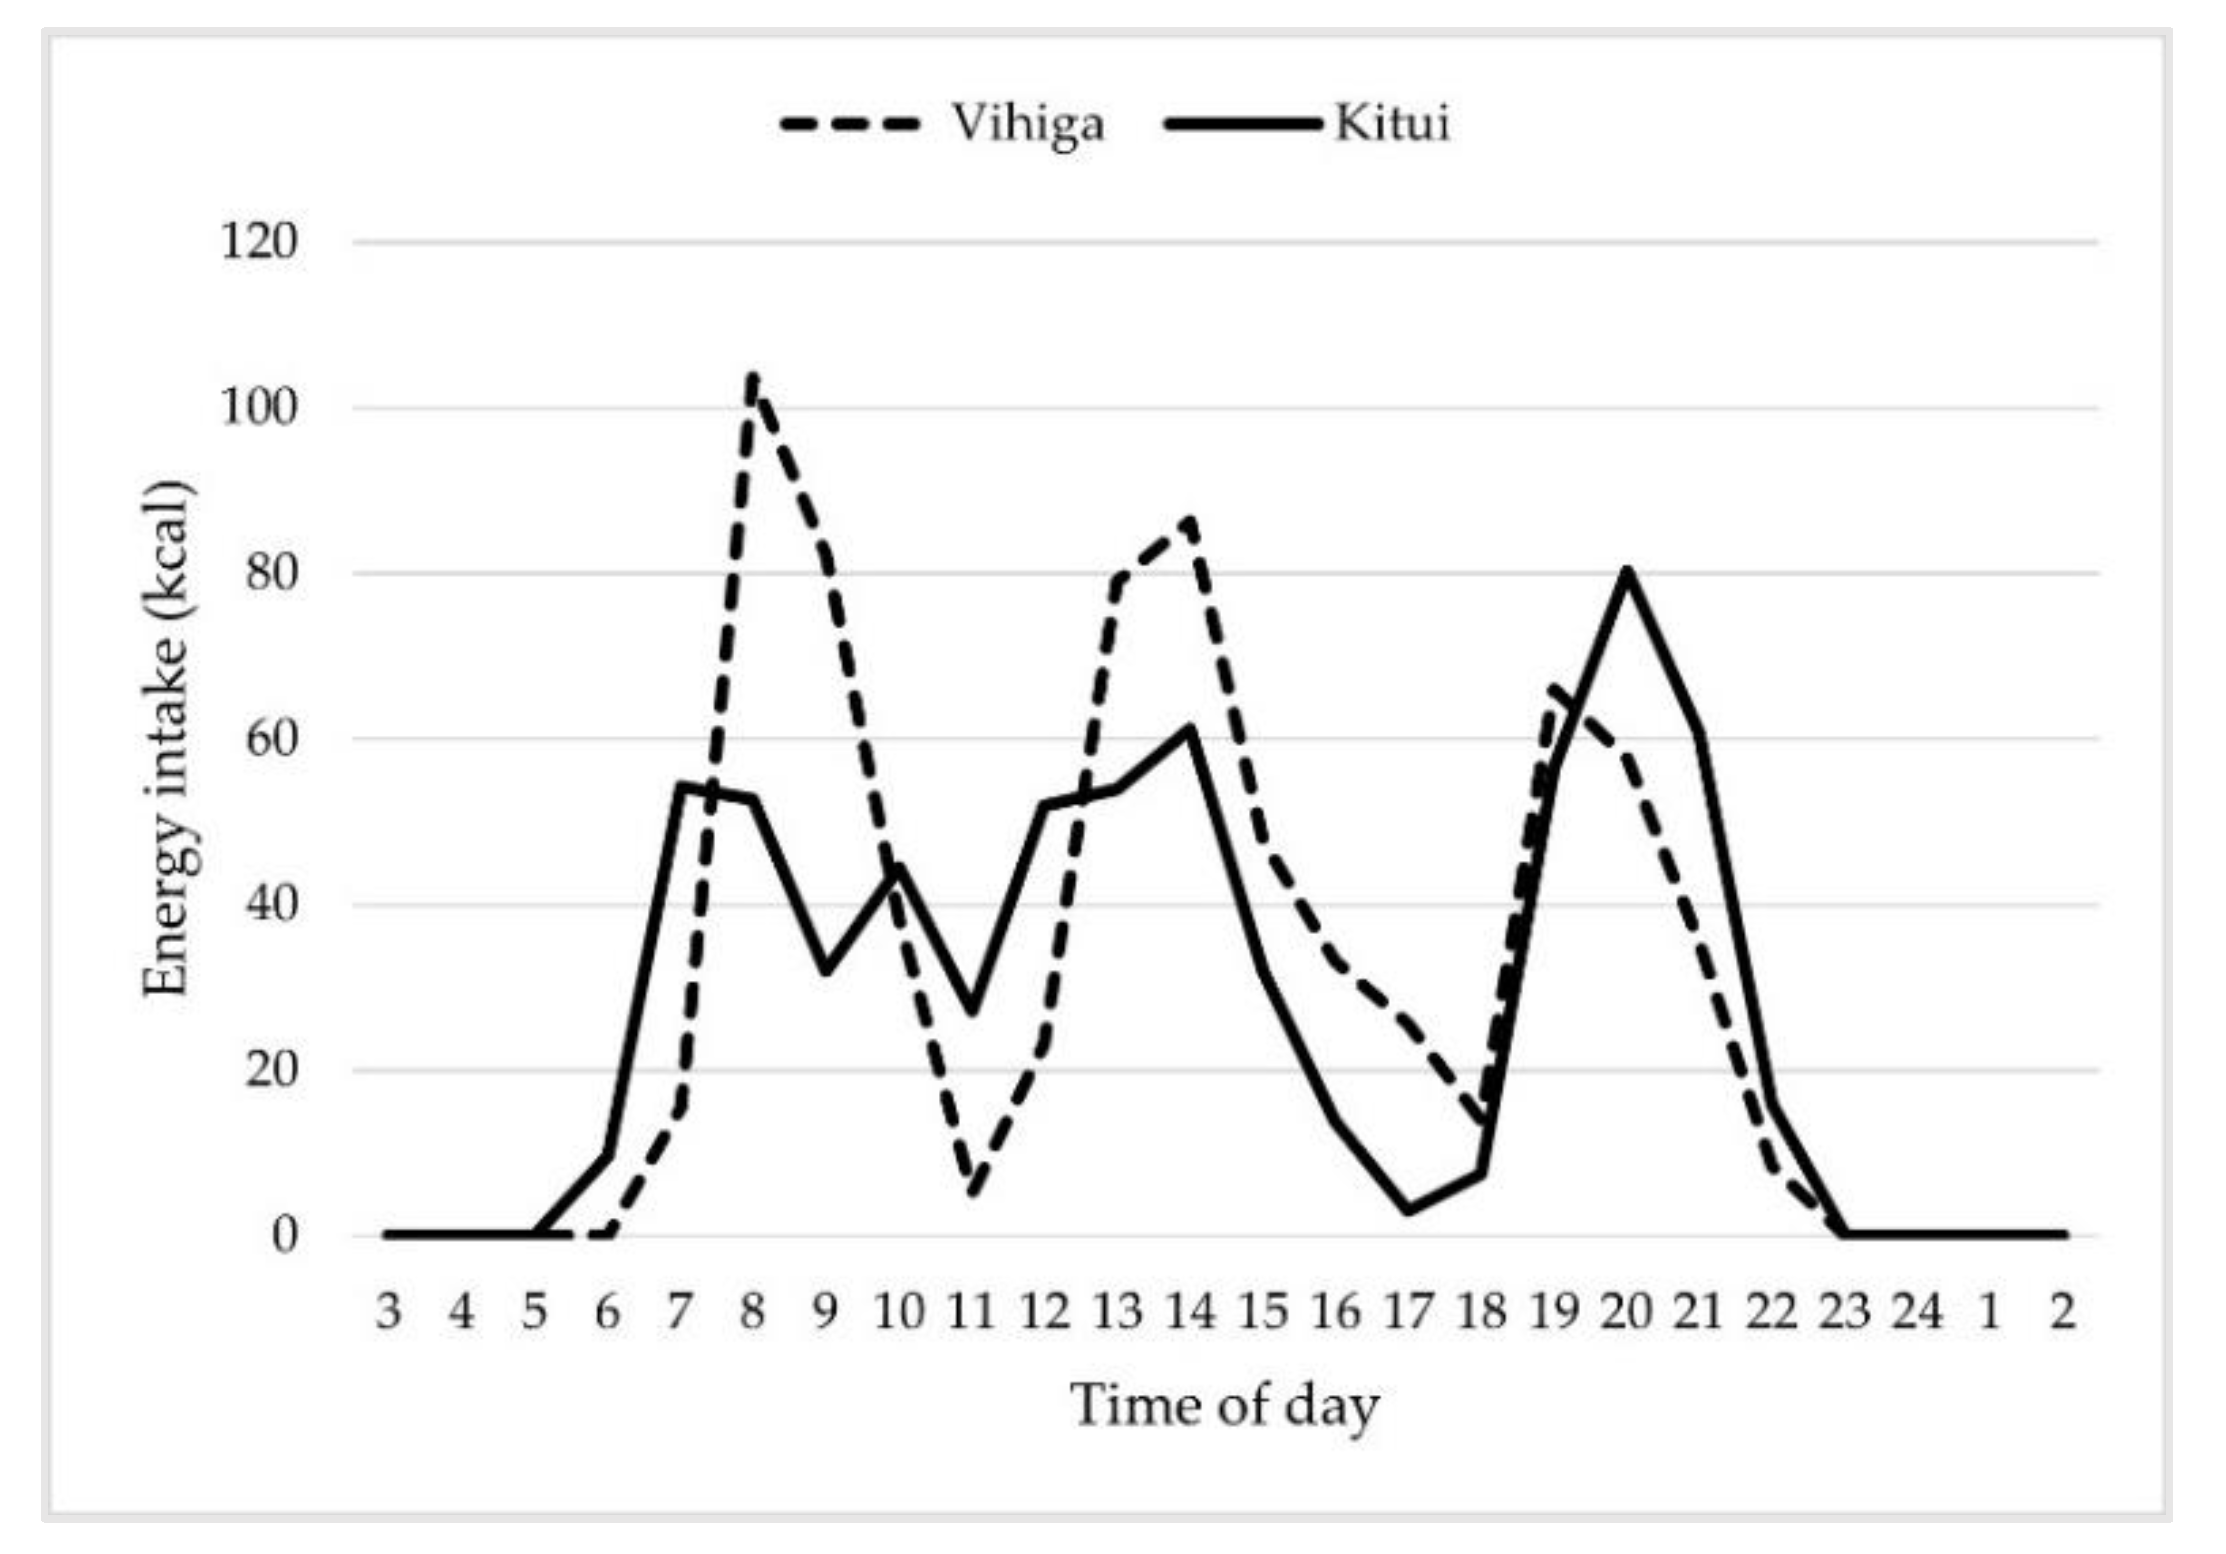
| Breakfast time (kcal) (3) | 444 ± 195 | - | 603 ± 193 | - | 0.075 | - |
| Lunch time (kcal) (3) | 619 ± 191 | - | 612 ± 291 | - | 0.951 | - |
| Dinner time (kcal) (3) | 716 ± 165 | - | 615 ± 257 | - | 0.303 | - |
| Snack (kcal) (3) † | 143 ± 164 | - | 292 ± 402 | - | 0.245 | - |
| Protein (g) | 61.1 ± 20.2 | - | 60.7 ± 16.6 | - | 0.956 | - |
| Protein (g/kgBW) † | 0.82 ± 0.3 | 20.0% | 0.88 ± 0.3 | 18.2% | 0.324 | 1.000 |
| Fat (g) † | 50.0 ± 20.8 | - | 59.6 ± 23.7 | - | 0.336 | - |
| Carbohydrate (g) | 284.8 ± 54.2 | - | 317.8 ± 88.4 | - | 0.313 | - |
| Protein/energy ratio (%) | 12.7 ± 2.2 | 10.0% | 11.5 ± 1.1 | 9.1% | 0.163 | 1.000 |
| Fat/energy ratio (%) | 22.4 ± 6.4 | 40.0% | 24.9 ± 4.3 | 9.1% | 0.332 | 0.149 |
| Carb/energy ratio (%) | 64.9 ± 6.0 | 40.0% * | 63.6 ± 4.7 | 45.5% * | 0.607 | 1.000 |
| Dietary fiber (g) | 43.4 ± 15.4 | 20.0% | 35.5 ± 8.0 | 27.3% | 0.149 | 1.000 |
| Calcium (mg) † | 608 ± 248 | 90.0% | 884 ± 412 | 81.8% | 0.121 | 1.000 |
| Magnesium (mg) | 292 ± 94 | 30.0% | 315 ± 59 | 27.3% | 0.509 | 1.000 |
| Iron (mg) | 16.8 ± 4.4 | 30.0% | 20.0 ± 5.2 | 18.2% | 0.149 | 0.635 |
| Zinc (mg) | 8.7 ± 2.8 | 20.0% | 9.8 ± 2.4 | 9.1% | 0.361 | 0.586 |
| Vitamin A (µgRAE) | 257 ± 109 | 100.0% | 379 ± 159 | 81.8% | 0.056 | 0.476 |
| Vitamin B1 (mg) | 1.51 ± 0.43 | 10.0% | 1.41 ± 0.52 | 18.2% | 0.652 | 1.000 |
| Vitamin B2 (mg) † | 1.21 ± 0.47 | 20.0% | 1.93 ± 1.02 | 9.1% | 0.020 | 0.586 |
| Niacin (mg) | 13.1 ± 4.0 | 30.0% | 14.8 ± 4.4 | 9.1% | 0.354 | 0.311 |
| Vitamin B12 (µg) † | 2.2 ± 1.2 | 60.0% | 4.9 ± 3.7 | 9.1% | 0.017 | 0.024 |
| Folate (µg) | 625 ± 231 | 10.0% | 690 ± 354 | 9.1% | 0.625 | 1.000 |
| Vitamin C (mg) | 48 ± 26 | 80.0% | 79 ± 31 | 27.3% | 0.022 | 0.030 |
| Kitui (n = 10) | Vihiga (n = 11) | p-Value * | |
|---|---|---|---|
| Mean ± SD | Mean ± SD | ||
| Grains and cereals | 541.3 ± 147.8 | 633.9 ± 209.3 | 0.260 |
| Starchy roots, bananas and tubers † | 50.0 ± 34.8 | 112.6 ± 101.2 | 0.397 |
| Sugar and sweeteners | 27.4 ± 16.9 | 51.3 ± 49.4 | 0.155 |
| Nuts and seeds † | 2.2 ± 6.3 | 5.4 ± 9.3 | 0.208 |
| Green and yellow vegetables (1) | 34.8 ± 24.8 | 52.8 ± 36.6 | 0.209 |
| Other vegetables | 91.9 ± 38.1 | 111.5 ± 57.5 | 0.374 |
| Fruits † | 19.6 ± 26.1 | 27.4 ± 25.4 | 0.420 |
| Beans and pulses | 220.2 ± 160.3 | 49.5 ± 50.2 | 0.008 |
| Fishes † | 2.0 ± 6.3 | 13.0 ± 15.1 | 0.004 |
| Meats and poultries | 28.7 ± 25.4 | 25.7 ± 23.5 | 0.780 |
| Eggs † | 5.3 ± 7.7 | 8.3 ± 10.0 | 0.447 |
| Milk and dairy products † | 120.0 ± 75.8 | 287.6 ± 293.7 | 0.121 |
| Oils and fats | 25.5 ± 14.8 | 23.4 ± 13.8 | 0.751 |
| Confectioneries † | 0.4 ± 1.1 | 6.9 ± 13.4 | 0.259 |
| Beverages † | 412.9 ± 242.4 | 608.4 ± 387.1 | 0.205 |
| Condiments | 9.9 ± 5.4 | 7.1 ± 2.6 | 0.171 |
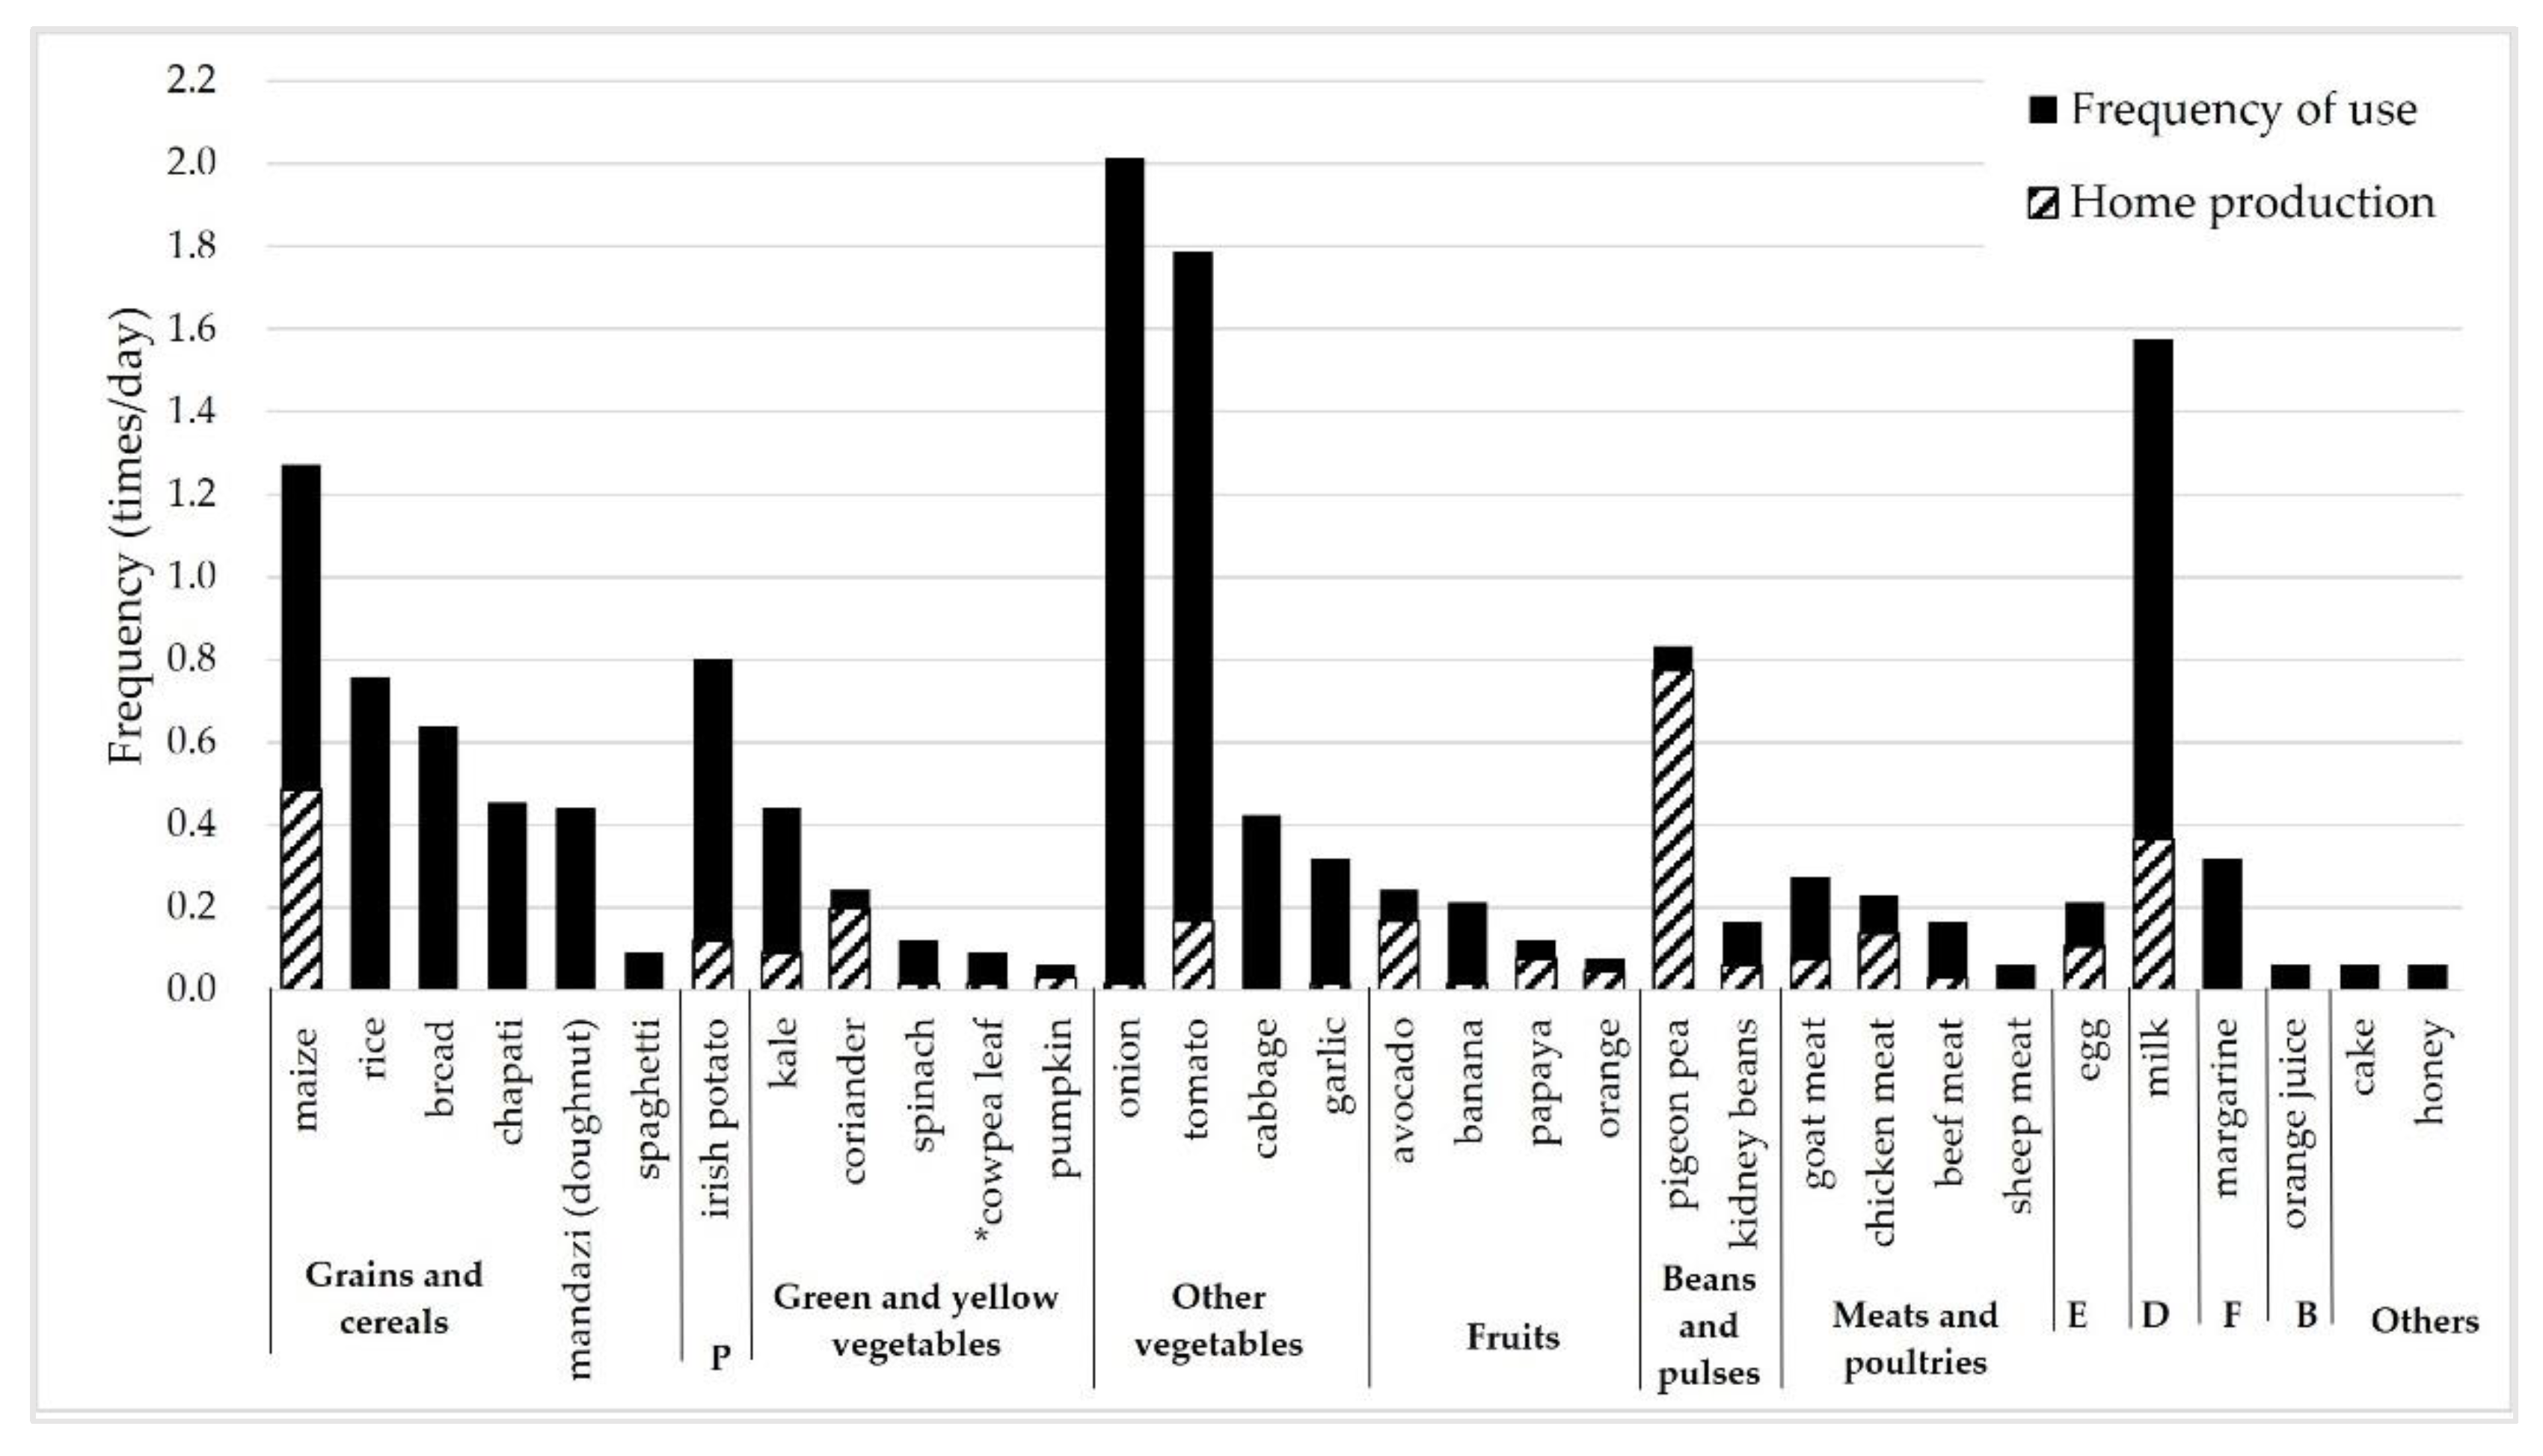
| Group | Name of Dishes/Foods | Main Ingredients (1) | Kitui | Vihiga | ||||||||||
|---|---|---|---|---|---|---|---|---|---|---|---|---|---|---|
| Frequency (Times/Day) (3) | Median (4) (g/Time) | Frequency (Times/Day) (3) | Median (4) (g/Time) | |||||||||||
| Total | BF | LC | DN | SN | Total | BF | LC | DN | SN | |||||
| Staple foods | Ugali | Maize flour | 0.64 | 0.02 | 0.19 | 0.36 | 0.06 | 325 | 1.10 | 0.03 | 0.28 | 0.63 | 0.18 | 300 |
| Muthokoi | Degermed maize and beans | 0.45 | 0.06 | 0.13 | 0.26 | 0.00 | 490 | - | - | - | - | - | - | |
| Mandazi (doughnut) | (mostly commercial) | 0.40 | 0.28 | 0.09 | 0.02 | 0.02 | 100 | 0.48 | 0.40 | 0.05 | 0.00 | 0.03 | 102 | |
| Boiled rice | - | 0.30 | 0.02 | 0.15 | 0.11 | 0.02 | 300 | 0.35 | 0.03 | 0.25 | 0.08 | 0.00 | 336 | |
| Chapati | Wheat flour (and sugar) | 0.32 | 0.09 | 0.11 | 0.11 | 0.02 | 195 | 0.30 | 0.10 | 0.08 | 0.08 | 0.05 | 137 | |
| Bread | (mostly commercial) | 0.45 | 0.43 | 0.00 | 0.00 | 0.02 | 58 | 0.28 | 0.15 | 0.03 | 0.03 | 0.08 | 82 | |
| Rice and beans | Rice and beans | 0.23 | 0.04 | 0.09 | 0.09 | 0.02 | 434 | - | - | - | - | - | - | |
| Boiled or roasted maize | - | - | - | - | - | - | - | 0.20 | 0.13 | 0.05 | 0.03 | 0.00 | 200 | |
| Githeri | Maize and beans | 0.06 | 0.00 | 0.02 | 0.04 | 0.00 | 300 | 0.15 | 0.08 | 0.05 | 0.03 | 0.00 | 392 | |
| Cassava | - | - | - | - | - | - | - | 0.13 | 0.10 | 0.03 | 0.00 | 0.00 | 110 | |
| Rice and potato | Rice, Irish potato, T&O | 0.09 | 0.02 | 0.04 | 0.02 | 0.00 | 313 | 0.05 | 0.03 | 0.00 | 0.03 | 0.00 | 325 | |
| Matoke (green banana) | Green banana, T&O | 0.02 | 0.00 | 0.02 | 0.00 | 0.00 | 357 | 0.10 | 0.03 | 0.03 | 0.00 | 0.05 | 550 | |
| Potato and cabbage stew | Irish potato, cabbage, T&O | 0.06 | 0.00 | 0.04 | 0.02 | 0.00 | 150 | - | - | - | - | - | - | |
| Sweet potato | - | - | - | - | - | - | - | 0.05 | 0.00 | 0.05 | 0.00 | 0.00 | 225 | |
| Spaghetti | - | - | - | - | - | - | - | 0.05 | 0.00 | 0.03 | 0.03 | 0.00 | 330 | |
| Banana and beans | Green banana and beans | 0.04 | 0.00 | 0.04 | 0.00 | 0.00 | 536 | - | - | - | - | - | - | |
| Potato and banana | Irish potato and green banana | - | - | - | - | - | - | 0.03 | 0.00 | 0.03 | 0.00 | 0.00 | 500 | |
| ASFs | Beef stew | Beef meat, T&O | 0.11 | 0.00 | 0.02 | 0.06 | 0.02 | 250 | 0.38 | 0.00 | 0.18 | 0.18 | 0.03 | 63 |
| Goat stew | Goat meat, T&O | 0.17 | 0.00 | 0.06 | 0.06 | 0.04 | 150 | - | - | - | - | - | - | |
| Omena (small fishes) stew | Omena, T&O | - | - | - | - | - | - | 0.20 | 0.00 | 0.03 | 0.13 | 0.05 | 55 | |
| Fried egg | Chicken egg, T&O | - | - | - | - | - | - | 0.18 | 0.05 | 0.00 | 0.10 | 0.03 | 50 | |
| Boiled Egg | Chicken egg | 0.09 | 0.09 | 0.00 | 0.00 | 0.00 | 51 | - | - | - | - | - | - | |
| Fish, samaki, tilapia | Fish, T&O | - | - | - | - | - | - | 0.10 | 0.00 | 0.00 | 0.08 | 0.03 | 174 | |
| Chicken stew | Chicken meat, T&O | 0.09 | 0.00 | 0.00 | 0.09 | 0.00 | 235 | 0.05 | 0.00 | 0.03 | 0.00 | 0.03 | 200 | |
| Beans and pulses | Pigeon pea stew | Pigeon pea, T&O | 0.32 | 0.02 | 0.13 | 0.13 | 0.04 | 220 | - | - | - | - | - | - |
| Green gram stew | Green grams, T&O | - | - | - | - | - | - | 0.13 | 0.00 | 0.03 | 0.10 | 0.00 | 257 | |
| Stir-fried vegetables | Kales (Sukuma wiki) | Kales, T&O | 0.36 | 0.00 | 0.13 | 0.23 | 0.00 | 150 | 0.40 | 0.00 | 0.13 | 0.28 | 0.00 | 110 |
| Cabbage | Cabbage, T&O | 0.15 | 0.00 | 0.09 | 0.06 | 0.00 | 125 | 0.30 | 0.00 | 0.18 | 0.08 | 0.05 | 143 | |
| Amaranth vegetables | Amaranth leaves, T&O | - | - | - | - | - | - | 0.18 | 0.00 | 0.08 | 0.08 | 0.03 | 66 | |
| Mixed leaves | Green leaves (2), T&O | - | - | - | - | - | - | 0.15 | 0.00 | 0.03 | 0.08 | 0.05 | 128 | |
| Cowpea leaves | Cowpea leaves, T&O | - | - | - | - | - | - | 0.03 | 0.00 | 0.00 | 0.03 | 0.00 | 287 | |
| Carrot | - | - | - | - | - | - | - | 0.03 | 0.00 | 0.03 | 0.00 | 0.00 | 43 | |
| Fruits | Avocado | - | 0.13 | 0.00 | 0.09 | 0.04 | 0.00 | 75 | 0.05 | 0.03 | 0.00 | 0.03 | 0.00 | 175 |
| Papaya | - | 0.09 | 0.00 | 0.06 | 0.02 | 0.00 | 175 | - | - | - | - | - | - | |
| Mango | - | - | - | - | - | - | - | 0.08 | 0.03 | 0.00 | 0.00 | 0.05 | 105 | |
| Orange | - | - | - | - | - | - | - | 0.08 | 0.00 | 0.03 | 0.03 | 0.03 | 90 | |
| Guava | - | - | - | - | - | - | - | 0.03 | 0.00 | 0.00 | 0.00 | 0.03 | 120 | |
| Nuts | Groundnut | - | - | - | - | - | - | - | 0.20 | 0.08 | 0.05 | 0.03 | 0.05 | 22 |
| Beverages | Milk tea | Tea and milk (cow or goat) | 1.47 | 0.91 | 0.17 | 0.21 | 0.17 | 400 | 1.70 | 0.90 | 0.30 | 0.13 | 0.38 | 400 |
| Miro | Milk and miro powder | - | - | - | - | - | - | 0.05 | 0.05 | 0.00 | 0.00 | 0.00 | 300 | |
| Others | Sugar in milk tea | - | 1.47 | 0.91 | 0.17 | 0.21 | 0.17 | 10 | 1.55 | 0.75 | 0.33 | 0.10 | 0.38 | 18 |
| Margarine on the bread | - | 0.19 | 0.17 | 0.00 | 0.00 | 0.02 | 9 | 0.23 | 0.13 | 0.03 | 0.03 | 0.05 | 8 | |
| Sugar in black tea | - | - | - | - | - | - | - | 0.15 | 0.05 | 0.03 | 0.05 | 0.03 | 65 | |
| Group | Name of Dish/Food | Kitui | Vihiga | ||||||||||||
|---|---|---|---|---|---|---|---|---|---|---|---|---|---|---|---|
| En | Pro | Ca | Iron | V.A | V.B12 | V.C | En | Pro | Ca | Iron | V.A | V.B12 | V.C | ||
| Staple foods | Ugali | 15.4 | 11.2 | 4.0 | 13.7 | 0.0 | 0.0 | 0.0 | 24.5 | 20.1 | 5.1 | 20.2 | 0.1 | 0.0 | 0.1 |
| Muthokoi | 16.0 | 24.1 | 14.8 | 17.7 | 5.1 | 0.0 | 3.3 | - | - | - | - | - | - | - | |
| Mandazi (doughnut) | 7.7 | 4.4 | 9.2 | 8.8 | 7.7 | 7.4 | 0.0 | 7.5 | 5.0 | 7.2 | 8.2 | 5.9 | 4.0 | 0.0 | |
| Boiled rice | 5.9 | 3.4 | 0.7 | 3.1 | 0.0 | 0.0 | 0.0 | 7.2 | 4.4 | 0.7 | 3.5 | 1.4 | 0.0 | 1.2 | |
| Chapati (1) | 11.7 | 6.8 | 2.2 | 12.4 | 18.4 | 11.5 | 0.0 | 8.4 | 7.6 | 1.6 | 11.5 | 10.2 | 6.1 | 0.0 | |
| Bread | 3.8 | 3.7 | 1.7 | 3.0 | 0.0 | 0.9 | 0.0 | 2.8 | 3.0 | 1.0 | 2.0 | 0.0 | 0.4 | 0.0 | |
| Rice and beans | 5.8 | 5.8 | 0.3 | 5.1 | 0.2 | 0.0 | 0.9 | - | - | - | - | - | - | - | |
| Maize | - | - | - | - | - | - | - | 0.9 | 0.8 | 0.2 | 0.7 | 0.0 | 0.0 | 0.0 | |
| Githeri | 1.8 | 2.1 | 1.2 | 2.0 | 0.7 | 0.0 | 0.6 | 2.6 | 4.2 | 1.3 | 3.5 | 0.4 | 0.0 | 0.4 | |
| Cassava | - | - | - | - | - | - | - | 1.2 | 0.3 | 0.5 | 0.6 | 0.0 | 0.0 | 4.6 | |
| Rice and potato | 1.8 | 1.2 | 0.0 | 1.4 | 0.0 | 0.0 | 1.6 | 0.9 | 0.6 | 0.1 | 0.8 | 0.0 | 0.0 | 0.6 | |
| Matoke | 0.3 | 0.1 | 0.1 | 0.2 | 0.0 | 0.0 | 2.2 | 2.6 | 1.4 | 0.5 | 2.3 | 0.1 | 0.0 | 13.7 | |
| Potato and cabbage stew | 0.5 | 0.8 | 1.3 | 0.6 | 0.3 | 1.1 | 2.0 | - | - | - | - | - | - | - | |
| Sweet potato | - | - | - | - | - | - | - | 0.5 | 0.3 | 0.3 | 0.2 | 0.2 | 0.0 | 1.7 | |
| Spaghetti | - | - | - | - | - | - | - | 0.9 | 1.0 | 0.1 | 0.2 | 0.0 | 0.0 | 0.0 | |
| Banana and beans | 1.3 | 1.8 | 3.1 | 1.7 | 1.2 | 0.0 | 3.9 | - | - | - | - | - | - | - | |
| Potato and banana | - | - | - | - | - | - | - | 0.6 | 0.4 | 0.1 | 0.6 | 0.0 | 0.0 | 1.9 | |
| ASFs | Beef stew | 1.3 | 3.2 | 0.3 | 6.3 | 0.9 | 5.1 | 2.4 | 2.4 | 8.7 | 0.2 | 16.6 | 0.9 | 7.2 | 1.5 |
| Goat stew | 1.6 | 4.5 | 0.4 | 2.1 | 1.4 | 8.1 | 3.3 | - | - | - | - | - | - | - | |
| Omena (small fishes) stew | - | - | - | - | - | - | - | 0.6 | 1.3 | 4.1 | 0.6 | 0.7 | 14.3 | 0.9 | |
| Fried egg | - | - | - | - | - | - | - | 0.7 | 1.7 | 0.5 | 0.8 | 4.1 | 2.9 | 0.3 | |
| Boiled Egg | 0.3 | 0.8 | 0.3 | 0.4 | 2.8 | 1.8 | 0.0 | - | - | - | - | - | - | - | |
| Fish, samaki, tilapia | - | - | - | - | - | - | - | 1.2 | 3.1 | 1.2 | 1.4 | 0.7 | 2.9 | 0.9 | |
| Chicken stew | 1.3 | 2.4 | 0.3 | 1.5 | 2.5 | 2.0 | 2.0 | 0.9 | 2.0 | 0.1 | 0.9 | 1.4 | 0.9 | 0.5 | |
| Beans and pulses | Pigeon pea stew | 4.3 | 8.0 | 8.4 | 7.3 | 3.0 | 0.0 | 6.2 | - | - | - | - | - | - | - |
| Green gram stew | - | - | - | - | - | - | - | 1.9 | 4.3 | 1.5 | 3.2 | 1.0 | 0.0 | 1.2 | |
| Stir-fried vegetables | Kales (Sukuma wiki) | 1.9 | 2.3 | 18.0 | 4.6 | 18.9 | 0.9 | 37.5 | 1.5 | 1.9 | 14.2 | 3.9 | 14.7 | 0.0 | 23.2 |
| Cabbage | 0.5 | 0.6 | 1.0 | 0.6 | 0.3 | 0.7 | 6.1 | 1.1 | 0.8 | 1.9 | 1.0 | 0.9 | 0.0 | 9.7 | |
| Amaranth vegetables | - | - | - | - | - | - | - | 0.4 | 0.6 | 2.7 | 2.3 | 6.9 | 0.0 | 3.7 | |
| Mixed leaves | - | - | - | - | - | - | - | 0.8 | 1.3 | 5.3 | 3.7 | 4.9 | 0.0 | 7.6 | |
| Cowpea leaves | - | - | - | - | - | - | - | 0.2 | 0.3 | 1.2 | 0.6 | 0.0 | 0.0 | 1.4 | |
| Carrot | - | - | - | - | - | - | - | 0.0 | 0.0 | 0.0 | 0.0 | 1.1 | 0.0 | 0.0 | |
| Fruits | Avocado | 1.0 | 0.3 | 0.3 | 0.6 | 0.1 | 0.0 | 3.0 | 0.7 | 0.2 | 0.2 | 0.4 | 0.0 | 0.0 | 1.4 |
| Papaya | 0.2 | 0.1 | 0.3 | 0.4 | 3.2 | 0.0 | 10.4 | - | - | - | - | - | - | - | |
| Mango | - | - | - | - | - | - | - | 0.2 | 0.1 | 0.1 | 0.1 | 1.6 | 0.0 | 2.7 | |
| Orange | - | - | - | - | - | - | - | 0.1 | 0.0 | 0.1 | 0.0 | 0.0 | 0.0 | 1.6 | |
| Guava | - | - | - | - | - | - | - | 0.1 | 0.1 | 0.1 | 0.1 | 0.2 | 0.0 | 8.1 | |
| Nuts | Groundnut | - | - | - | - | - | - | - | 1.6 | 1.9 | 0.8 | 1.6 | 0.0 | 0.0 | 0.0 |
| Beverages | Milk tea | 5.3 | 8.2 | 28.4 | 2.9 | 21.5 | 53.5 | 7.7 | 10.7 | 18.3 | 43.9 | 4.0 | 33.6 | 57.8 | 6.3 |
| Miro | - | - | - | - | - | - | - | 0.3 | 0.5 | 1.2 | 0.0 | 0.9 | 1.6 | 0.0 | |
| Others | Sugar in milk tea | 5.1 | 0.0 | 0.0 | 0.0 | 0.0 | 0.0 | 0.0 | 6.2 | 0.0 | 0.0 | 0.0 | 0.0 | 0.0 | 0.0 |
| Margarine on the bread (1) | 0.6 | 0.0 | 0.0 | 0.0 | 7.0 | 2.5 | 0.0 | 0.5 | 0.0 | 0.0 | 0.0 | 5.1 | 1.2 | 0.0 | |
| Sugar in black tea | - | - | - | - | - | - | - | 2.2 | 0.0 | 0.0 | 0.0 | 0.0 | 0.0 | 0.0 | |
Publisher’s Note: MDPI stays neutral with regard to jurisdictional claims in published maps and institutional affiliations. |
© 2022 by the authors. Licensee MDPI, Basel, Switzerland. This article is an open access article distributed under the terms and conditions of the Creative Commons Attribution (CC BY) license (https://creativecommons.org/licenses/by/4.0/).
Share and Cite
Kishino, M.; Hirose, M.; Hida, A.; Tada, Y.; Ishikawa-Takata, K.; Hara, K.; Irie, K.; Maundu, P.; Morimoto, Y. Characteristics of Dietary Intake in Relation to the Consumption of Home-Produced Foods among Farm Women in Two Rural Areas of Kenya: A Preliminary Study. Dietetics 2022, 1, 242-254. https://doi.org/10.3390/dietetics1030021
Kishino M, Hirose M, Hida A, Tada Y, Ishikawa-Takata K, Hara K, Irie K, Maundu P, Morimoto Y. Characteristics of Dietary Intake in Relation to the Consumption of Home-Produced Foods among Farm Women in Two Rural Areas of Kenya: A Preliminary Study. Dietetics. 2022; 1(3):242-254. https://doi.org/10.3390/dietetics1030021
Chicago/Turabian StyleKishino, Madoka, Miru Hirose, Azumi Hida, Yuki Tada, Kazuko Ishikawa-Takata, Kenta Hara, Kenji Irie, Patrick Maundu, and Yasuyuki Morimoto. 2022. "Characteristics of Dietary Intake in Relation to the Consumption of Home-Produced Foods among Farm Women in Two Rural Areas of Kenya: A Preliminary Study" Dietetics 1, no. 3: 242-254. https://doi.org/10.3390/dietetics1030021