
Croatian Combat Athletes’ Attribution Patterns for Their Successes and Failures
by

Rebeka Prosoli
1,
Margareta Jelić
2,
Renata Barić
1,
Cassandra Sisneros
3 and 
Marc Lochbaum
4,5,*
1
Faculty of Kinesiology, University of Zagreb, 10 000 Zagreb, Croatia
2
Faculty of Humanities and Social Sciences, University of Zagreb, 10 000 Zagreb, Croatia
3
Center for Transformative Undergraduate Experiences, Texas Tech University, Lubbock, TX 79409, USA
4
Department of Kinesiology and Sport Management, Texas Tech University, Lubbock, TX 79409, USA
5
Education Academy, Vytautas Magnus University, 4428 Kaunas, Lithuania
*
Author to whom correspondence should be addressed.
Youth 2023, 3(1), 381-391; https://doi.org/10.3390/youth3010025
Submission received: 16 January 2023
/
Revised: 22 February 2023
/
Accepted: 27 February 2023
/
Published: 1 March 2023
Abstract
:Successes and failures are integral outcomes to the sport experience. Based on decades of research, how athletes process both outcomes influence their thoughts, emotions, and subsequent achievement endeavors. Attribution theory details three dimensions as to the causes of success and failure. Since the 1980s, attribution theory has found a home in sport psychology literature. However, research across countries requires valid and reliable questionnaires. One such country is Croatia where attribution research is scant. Thus, in a Croatian combat athlete sample, we examined athletes’ attributions for the most and least successful performances via retrospection. Croatian athletes (N = 154) from three combat sports (judo, karate, and taekwondo) who all competed at least once on an international stage completed the Croatian Causal Dimension Scale-II, answered in reference to a specific reason for their best and worst competitive experience. Results showed that the combat sport athletes attributed their most and least successful competitive achievement to psychological reasons more than other reasons (i.e., general preparation and physical preparation). Furthermore, based on a series of two-tailed paired samples t-tests and the nonparametric equivalent, Wilcoxon signed rank test, the participants made, from small to medium in meaningfulness (Cohen’s d), more internal (d = 0.30), stable (d = 0.56), personal (d = 0.30), and external (d = 0.21) controllable attributions for success than for failure (all t-test p-values < 0.01). Our results suggest the athletes made the self-serving attribution bias across both the success and failure competitive events. Our results contribute to better understanding of specific reasons for success and failure and the attribution dimensions explaining the competitive outcomes in competitive combat sport. Specific to Croatian sport, our results provide Croatian combat sport with theory driven research applicable to improving development of Croatian combat athletes on the international stage.
1. Introduction
Attribution theory describes how people ascribe causes to life events such as winning and losing [1]. The causes or attributes link with cognitive, affective, and behavioral variables in sport [2,3,4] such as self-efficacy, emotions, team cohesion, slump busting, self-esteem, persistence, and performance [5,6,7,8,9,10,11,12]. With all these linkages, attributions are a vital sport psychology research and applied topic.
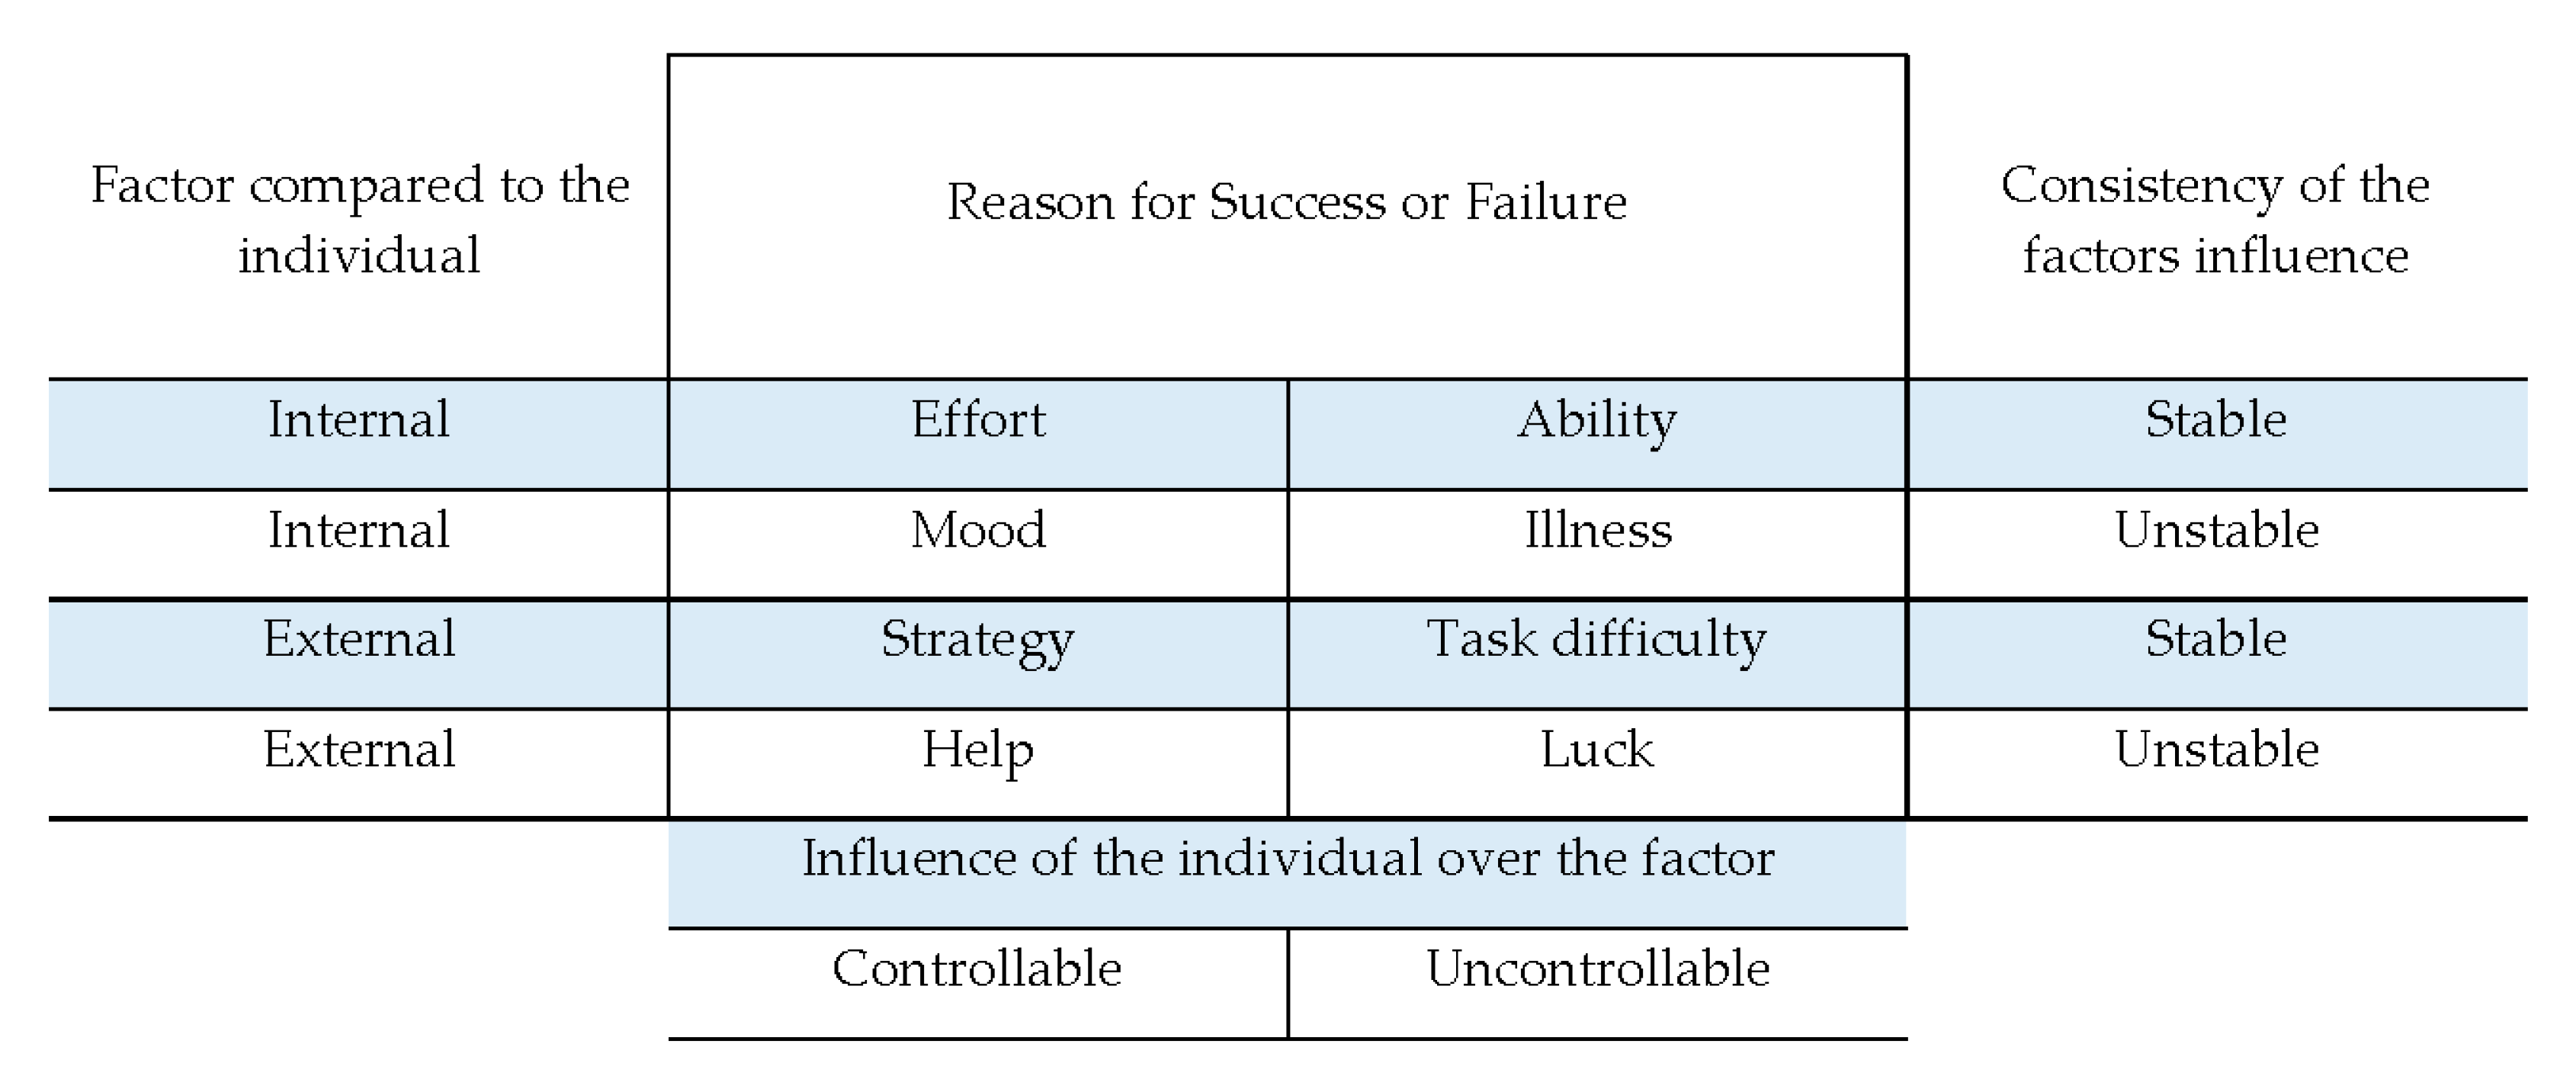
Weiner [13,14] proposed his model of attributions and suggested the existence of three dimensions: locus, stability, and controllability. Locus relates to the causes which are inside or outside of the person, stability refers to the temporal nature of the causes which may vary from stable to unstable, and controllability refers to the degree of control which can be related to the cause [15]. In everyday life, people often exhibit attribution biases; that is, they make attribution errors. One such error is the self-serving bias that represents our tendency to explain our successes with internal, dispositional factors and blame external, situational factors for our failures [15]. Moreover, the tendency to attribute success to internal factors (efforts, abilities, or dispositions) is the self-enhancing bias while the tendency of attributing failure to the lack of luck, the difficulty of the task, or other external factors is the self-protecting bias [15]. Research supports the existence of self-serving bias both in sport [2] and in the general population [16]. However, there are also studies with different results where participants made internal and controllable attributions after failure, and external and uncontrollable attributions following success [17]. Figure 1 provides an overview of the dimensions and reasons for success and failure.
Weiner’s attribution dimensions served as a framework for studies in achievement contexts, one being sport. In the early years of sport attribution research, McAuley [18] found that successful female gymnasts, according to the scores awarded by the judges as well as their self-perception, made more internal, stable, and controllable attributions for their performance than the less successful ones. McAuley and Gross [19] found that winners in table tennis made more internal, stable, and controllable attributions than losers even though the attributions were internal, unstable, and controllable in both situations. Furthermore, Hamilton and Jordan [20] concluded that male track athletes attributed their best performances to more internal, stable, and controllable factors than their worst performances, while Santamaria and Furst [21] in their research on long distance runners found differences in the same direction but only on locus of causality and personal controllability subscales.
On the other hand, research conducted on wrestlers [22] showed significant differences on all four dimensions, suggesting that winners attributed their performances more internally, stable, personally, and externally controllable than losers. Grove and colleagues [23] conducted research on players, coaches, and spectators in basketball and reported their participants attributed winning to more stable and controllable causes than losing. This finding was consistent across players, coaches, and spectators, and was invariant to outcome margin. In addition, they found that competitors attributed outcomes internally for both winning and losing which was in line with the result from the earlier study conducted by Mark et al. [24]. Mark and his colleagues reported the same result where winners and losers did not differ on the locus of causality dimension. Winners and losers differed as winners made more stable and controllable attributions than losers.
Taken together, the discussed results suggest that athletes do not always internalize success, and externalize failure, which implies the need for further research in this area. There are situational norms which encourage acceptance of responsibility and discourage external attributions for failures, thereby they remain self-serving in dimensions of stability and controllability. Researchers consider this specific pattern of self-serving attributions as functional [23,24]. Therefore, it is necessary to look beyond the locus of control to conclude on the existence of self-serving attribution error.
Research Aims
Although research is not as prolific as other motivation theories such as achievement goal theory [25,26,27], researchers still considered attribution theory vital in the context of sport [28,29,30]. Therefore, the aim of this study was (a) to examine attributions of Croatian combat sport competitors for their most and least successful performances and (b) to investigate whether they evince self-serving bias. Based on previous research in this area, we expected our participants to attribute their most successful performances to more internal, stable, and controllable factors than unsuccessful performances, and that the athletes will exhibit self-serving bias while making the attributions for their performances.
2. Materials and Methods
2.1. Participants
Combat athletes, from judo (n =106), karate (n = 32), and taekwondo (n =16), were the study participants and recruited from 45 clubs across Croatia. All participants competed at least once on the international stage. Of the 154 participants, 94 identified as male and 60 as female. Participants on average were 20 years (M = 19.9; SD = 4.12) ranging from 16 to 33. All participants were active at the time of data collection and participated in their combat sport on average for 12 years (M = 11.98; SD = 4.17), though with a wide range from 4 up to 24 years. All participants were active competitors at the time of completing the questionnaire.
2.2. Procedures
The first author contacted coaches and clubs concerning our study aim and explanation of requirements. With granted club permission, the Croatian potion of the research team contacted athletes as well as the parents of minors. Thus, all potential participants, including parents of minors, received information concerning the study. We informed each participant that by filling the questionnaire that they gave their informed consent with the knowledge they could withdraw from the study (questionnaire completion) at any time without any potential penalty. We assured anonymity as this research was in accordance with the Helsinki Declaration and approved by the University of Zagreb, Faculty of Humanities and Social Sciences, Department of Psychology.
2.3. Instruments
At the beginning of the survey, athletes filled in demographic questions considering their age, gender, type of sport, and years involved in sport. Next, the participants completed the Croatian version of revised Causal Dimension Scale [28] based on the McAuley and colleagues revised scale [29]. The scale measures four causal dimensions in accordance with Weiner’s [13,14] model: locus of causality, stability, and controllability, divided into personal and external control. The scale contains 12 questions with 3 questions representing each dimension. Participants choose their answers on a bipolar scale ranging from 1 to 9, and the result of each dimension may vary from 3 to 27. Higher values represent attributions that are more internal, stable, personally controlled and externally controlled. Since number 5 marks the middle of the scale, scores above 15 represents attributions that are internal, stable, personally controlled and externally controlled while scores below 15 represents attributions that are external, unstable, and not controlled personally and externally. McAuley and his colleagues initially reported marginally acceptable to acceptable alpha reliability coefficients: locus (0.67), stability (0.67), personal control (0.79), and external control (0.82). The Croatian version showed the same factorial structure as the original scale and adequate alpha reliability coefficients [21]. Specific to our 154 participants, the reliability coefficients were locus (0.75), stability (0.71), personal control (0.85), and external control (0.88) for success, and locus (0.64), stability (0.71), personal control (0.79), and external control (0.86) for failure.
To meet our study aim, participants completed the attribution questionnaire twice: once for the most successful and once for the least successful competition performance (e.g., “Please try to remember the competition in which you had your most successful performance. In the space below, please enter what you think is the main reason for your success in this competition.”). After writing the main reason they believed led to their competition success or failure, participants completed the CDS-II questionnaire with that reason in mind. Our instructions followed past studies [21]. Participants assessed performance success via perception and thus not necessarily the result. This is in line with the recommendations from literature which emphasize the importance of participants placing the reasons at the dimensions of attributions and the importance of distinguishing the performance from outcomes [30].
2.4. Data Analysis
To analyze the reasons athletes wrote as their answer to the open-ended questions regarding their best and worst performances, we used qualitative analysis. The first and last author of this study reviewed, counted, and assigned the answers to the higher order themes. After the initial analysis, their categories matched 84.40% of the cases for success attributions and in 87.01% of the cases for failure attributions. After discussing the differences, consensus was 100%. Concerning the data generated from the Croatian version of the revised Causal Dimension Scale, we used quantitative analyses. First, we examined descriptive data as well as correlations amongst the scale and demographic variables (i.e., age and years of experience). We interpreted correlation values from 0.10 to 0.29 as small, 0.30 to 0.49 as medium, and 0.50 or greater as large [31]. To examine attribution style mean level differences, we used a two-tailed paired samples t-test to examine whether the mean differences between each attribution by success and failure was significantly different than zero with Cohen’s d calculated for meaningfulness interpretation. We followed standard meaningfulness guidelines for Cohen’s d with 0.20 as small, 0.50 as medium, and 0.80 as large [31]. For each two-tailed paired samples t-test, we conducted a Shapiro–Wilk test to determine whether a normal distribution could have produced the difference [32]. We interpreted a significant Shapiro–Wilk test result (p < 0.05) to as a failure to meet the normality assumption. If this was the case, we then used the Wilcoxon signed rank test as a non-parametric alternative to the paired samples t-test that does not share its distributional assumptions [33]. We used Intellectus Statistics [34] to analyze our quantitative data.
3. Results
3.1. Attributions for Success and Failure
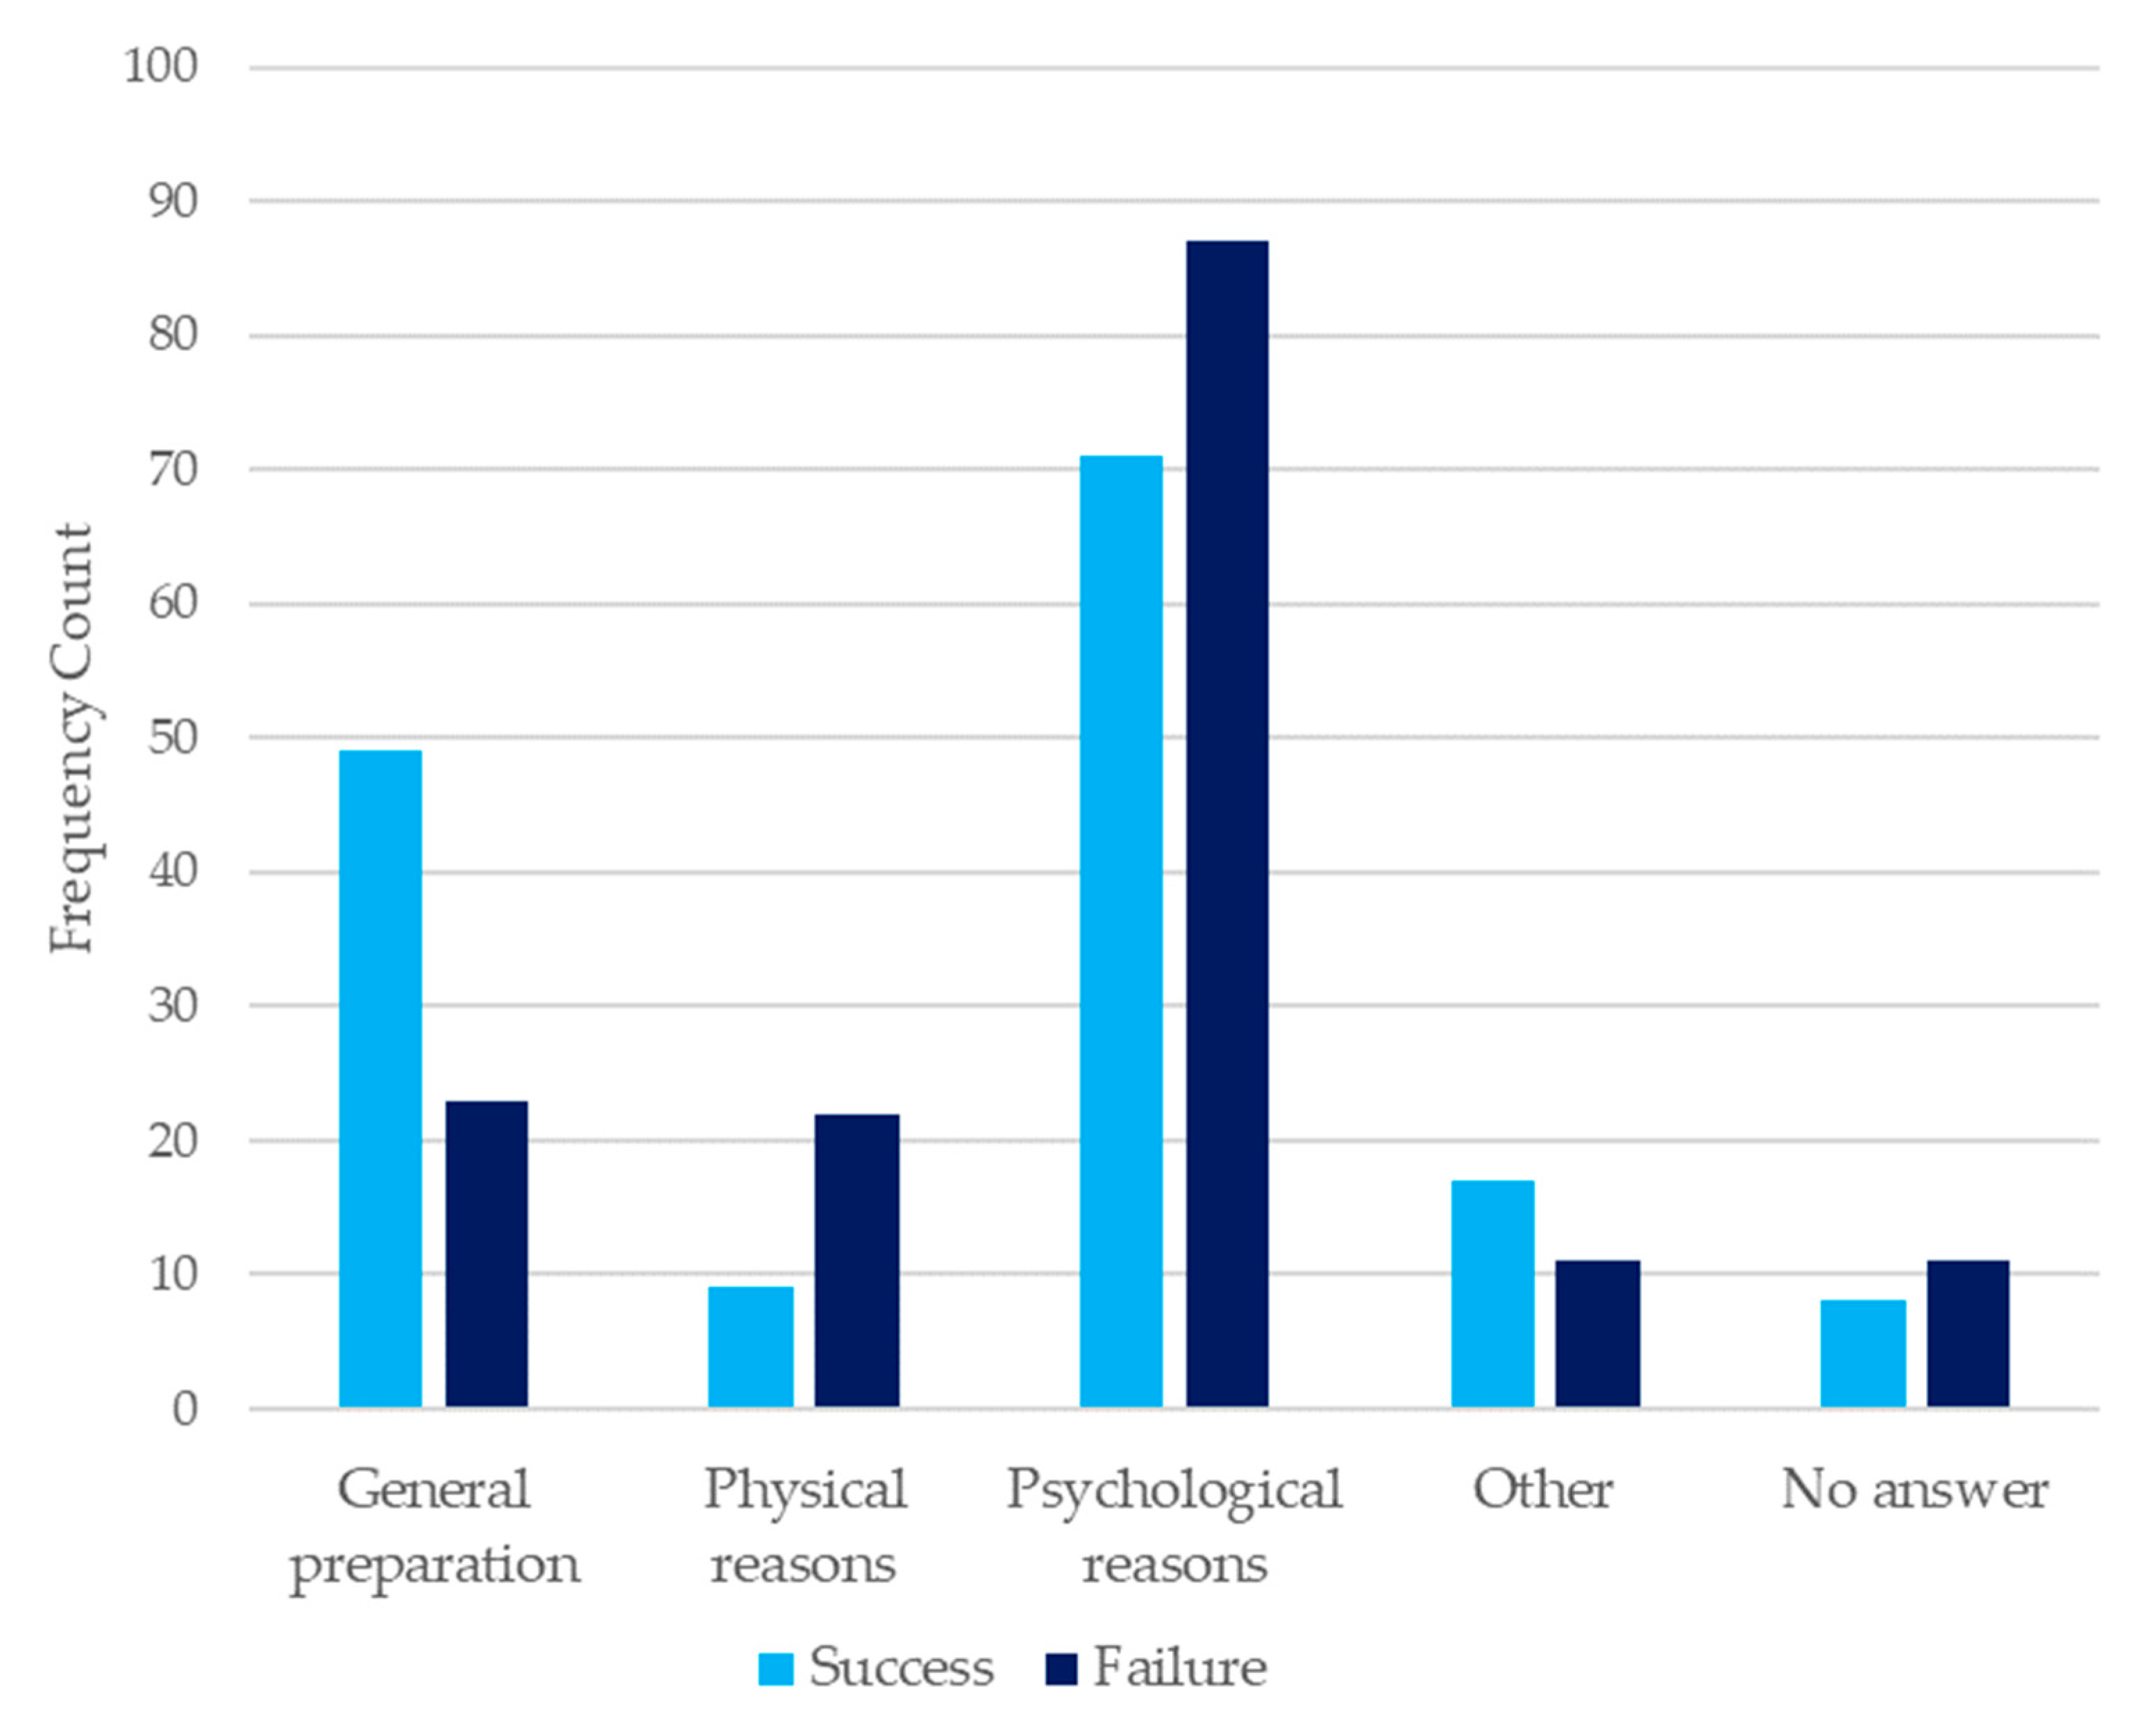
We analyzed athletes’ answers to the questions about the reasons they believed led to their success and failure at their most and least successful competitions (see Figure 2). When thinking of success, the combat sport athletes attributed their highest competitive achievement to psychological reasons as 46.1% (e.g., concentration, motivation, self-confidence, psychological preparation), 31.8% to general preparation (e.g., training, well-paced form, both physical and psychological readiness/preparation), 11.0% to some other reason (e.g., went to the lower category, luck, good day), and 5.9% of the reasons related to physical reasons (e.g., physical training/preparation). The remaining 5.2% of participants did not provide an answer to this question.
When thinking of failure, 56.5% of the responses related to psychological factors (e.g., lack of concentration, anxiety, lack of motivation, lack of self-confidence, lack of psychological preparation), 15.0% to general preparation (e.g., lack of training, bad preparation, lack of both physical and psychological readiness/preparation), 14.3% related to physical reasons (e.g., physical preparation, overtraining, injury, sickness), and 7.1% of the participants named some other reason (e.g., bad refereeing, bad day). The remaining 7.1% did not provide an answer to this question.
3.2. Descriptive and Correlation Data
Prior to testing for success and failure differences for each attribution dimension, we examined descriptive and correlational data. Looking at both mean and median data (see Table 1), the success attribution dimension values were all greater than those when the participants thought about a failed competition. The range of answers spanned the possible questionnaire minimum value of 3 points to the maximum of 27 points for the attribution dimensions. All skewness and kurtosis values fell within the range of considering the variables being symmetrical about the mean. As a note, participant self-reported sex (male or female) did not impact our mean level results, thus we did not examine sex further.
We examined the correlations between our two demographic variables, age and years of experience, and our attribution dimensions to gain an understanding if they related and thus were important for more analyses. As reported in Table 2, none of the correlations were reliable as the 95% confidence intervals crossed zero. None of the correlations approached traditional statistical significance, let alone a Bonferroni corrected p-value (0.05/16 = 0.003). Hence, we did not examine age and years of experience in our main analyses.
We also examined the intercorrelations amongst our attribution dimension scales for both success and failure (see Table 3) to examine their relationships and determine as with our demographic variables whether any concerns arose. With a Bonferroni correction (0.05/28 = 0.0017), few correlations achieved this threshold. Regardless of statistical significance, most correlations (n = 21) were less than 0.30 in absolute value. Hence, the attribution dimensions appeared to be nonoverlapping.
3.3. Differences between Success and Failure Attribution Dimensions
We used the two-tailed paired samples t-tests to examine whether the mean difference between each attribution dimension for success and failure were different from zero. For each two-tailed paired samples t-test, we assessed whether the differences resulted by a normal distribution with the Shapiro–Wilk test [32]. Table 4 contains these results. All dimension comparisons (success competition greater than failure competition) surpassed statistical significance with Cohen’s d ranging from small to medium. Concern appeared for the Stability and Personal Control dimension results regarding the normality assumption. Hence, we followed up both with a nonparametric Wilcoxon signed rank test of matched pairs. For the Stability dimension, the results of the two-tailed Wilcoxon signed rank test were significant based on an alpha value of 0.01, V = 7651.00, z = −6.07, p < 0.001, suggesting that the differences between Stability for success and Stability for failure were not due to random variation. The Stability for success median (14.00) was significantly larger than the Stability for failure median (10.00). For Personal Control, the results of the two-tailed Wilcoxon signed rank test were significant based on an alpha value of 0.01, V = 6182.50, z = −3.69, p < 0.001, suggesting the differences between Personal Control for success and Personal Control for failure were not due to random variation. The Personal Control for success median (20.50) was significantly larger than the Personal Control for failure median (18.00).
3.4. Self-Serving Bias
Arithmetic means of our results on the locus of control dimension in the most successful situation (M = 19.24) and the least successful situation (M = 17.31) suggest that athletes from combat sports showed the tendency to attribute both to internal factors, therefore confirming self-enhancing bias. We concluded this based on the observation that the arithmetic mean in both situations was above 15, as suggested in the research conducted by Hamilton and Jordan [20]. In addition, attributions in both situations, success, and failure, were unstable, personally controllable, and externally not controllable. Finally, based on the mean and median values, the participants’ attributions were more internal, stable, and both personally and externally controllable for the success than for the failure, suggesting the existence of a self-serving bias more in the success than failure condition.
4. Discussion
Competitions in combat sports end with a winner and the loser. However, competitors can have different ideas about how successful or unsuccessful their performance was, regardless of the outcome and result. They can be very satisfied with their performance and consider it their best result even if they lost the match against a much stronger opponent. On the contrary, they can feel they performed below their expectations in the competition even if they won it. Therefore, in this study, we examined Croatian combat sport athletes’ reasons and attribution patterns in their perceived most successful and least successful competition performances. Our work forwarded the attribution literature with Croatian combat athletes.
First, we analyzed the reasons the combat athletes gave. The athletes attributed psychological reasons more than any other reason for their competitive outcomes. This is in line with belief written by Krane and Williams [35] who stated that most athletes and coaches would claim that at least 40% and up to 90% of success in sports is due to psychological factors and that the importance of mental factors increases with the increase of the athlete’s skill level. In the psychological literature, Eklund [36,37] as well as Gould and colleagues [38,39] in their research with elite level wrestlers found that high level performances were characterized by positive emotional activation, optimal intensity, motivation and effort, being totally focused on match preparation thoughts/strategy and absorbed into the match using (re)focusing strategies when needed, technical/tactical thoughts, awareness of coach input, feelings of confidence and readiness, and positive expectancies. On the other hand, the participants characterized their low-level performances by both positive and negative affective states, low intensity and effort, lack of focus, concerns about losing, task irrelevant and negative thoughts, confidence problems, nonoptimal arousal, negative physical feelings, nonadherence to routines/competition plans, and making poor strategy selections. Although the above-mentioned studies did not focus on attributions, these characteristics were in our study as well.
Peak performance is a result of both physical and psychological factors combined and those factors are equally important in athletes’ sport preparation [35]. Therefore, we believe that the percentages obtained in our study do not necessarily show the objective importance of psychological versus other forms of preparation but simply represent the athletes’ opinions about reasons behind their most and least successful competition performances. Based on these results, we can conclude that athletes from combat sports stated factors connected to psychological preparation regardless of outcome. These frequencies may show the recognition of their importance and thus the need to include psychological training as an integral part of their training.
The results of our study also showed that athletes attributed both their success and their failures toward internal, unstable, high personal, and low external control. These results are in line with McAuley and Gross [19] in which both winners and losers classified causality of their table tennis competition outcomes toward internal, unstable, and controllable end of the attribution subscales. Further analysis indicated our participants’ attributions for their most and least successful performances significantly differ on all four dimensions of attribution. The Croatian combat sport athletes made more internal, stable, and personally controllable attributions for their most successful performance than for their least successful performance, which is in line with our hypothesis and previous studies [20]. However, athletes also reported higher levels of external control over their most successful performances than for their least successful performance. In a similar study, Santamaria and Furst [21] found no differences on stability and external control dimensions between the most successful and least successful race of the runners. Hamilton and Jordan [20] found no difference only on the external control. On the other hand, De Michele et al. [22] found that winners in wrestling attributed their performances to more internal, stable, personally, and externally controllable reasons than those wrestlers who lost. Our results are congruent with their results. The explanation for this is the similarity between the samples because wrestling is also a combat sport with a similar competition system to judo, karate, and taekwondo. In these types of combat sports, athletes compete one-on-one, thus the event outcome is due to the athlete’s actions and by the actions and reactions of their opponents. It is possible that athletes in our study, as well as the wrestlers in the similar study [22], believed that their success was under their personal control but also more influenced by, for example, the opponents and referees than their failure.
Based on all the analysis mentioned above, one of the aims of this study was to investigate whether athletes have a self-serving bias. From the results, we can conclude that the athletes who participated in our study believed that the causes behind the most successful performances in their career came from more internal reasons than causes for their least successful performances. This is consistent with previous studies [16,18]. However, if we look at the arithmetic means of our results on the locus of control dimension in the most successful situation and the least successful situation, we can conclude that, although there is a significant difference on locus of causality dimension, athletes showed the tendency to attribute both to internal factors. As mentioned before, self-serving attribution error consists of two types of errors, and our study confirmed just self-enhancing bias because our participants did not attribute their failure to external causes. This finding is consistent with other research conducted on athletes [23,24]. Therefore, Mark et al. [24] offered the idea about the new formulation of self-serving bias which suggests that self-protective and self-enhancing motives can lead to attributional effects not just on a locus of causality dimension, but on stability and controllability dimensions as well. In line with this suggestion, we analyzed the results on the stability and controllability dimensions and concluded that our participants made self-serving attributions.
Attributing success and failures to internal factors may be threatening for the athlete’s self-esteem [14,15]. It also represents a desirable form of taking responsibility for failures in sport instead of seeking excuses for outside reasons. It is possible that stability and controllability dimensions help them preserve their self-esteem and the expectation of success in the future [24]. The literature on this topic reports contradictory findings and the results obtained in this study may suggest where this contradiction arises. The athletes in this study tended to attribute both success and failure more internally than externally. This tendency suggests the pattern of taking responsibility for their behavior and outcomes. At the same time, they attributed their success more internally in relation to the failure, which could function as a protective mechanism. It is important to state that this difference can be the result of the methodology used (whether we take the successful and unsuccessful performance, a perception of success or result). This suggests the need for future investigation and research conducted on athletes from different sports and various levels of participation.
Study Limitations and Future Directions
Our study, as with most, has limitations. One positive aspect of our limitations is that our limitations provide future directions. Though we sought out combat sport athletes with an international background, we involved a small sample of participants relative to all combat athletes in Croatia and of course worldwide. Expanding our research question to a wider net of Croatian athletes is one of our future goals. For instance, investigating junior athletes would allow us to see attribution patterns across the combat athlete development continuum. Given that younger athletes make up the vast majority of in competition combat members in sport as younger athletes do in all sports, gaining insight into their attribution patterns may allow a better understanding of dropout patterns. A second limitation is the unequal number of participants across the surveyed combat sports. Though we do not know of a theoretical reason combat sport types might differ in attribution patterns, our small numbers limited our ability to ascertain whether they did differ. We suggest that future studies consider a way to collect data more equal in participant per combat sport. One of the biggest obstacles for data collection in this study was that it was dispersed across numerous clubs across the country, so our research team had to cover large areas and contact numerous people in order to recruit athletes, which are small in numbers per club. Conducting our research in collaboration in other countries is a future direction again given the size of Croatia and size of combat sport clubs. A potential third study limitation is we included only active competitors. Perhaps athletes who in the last year or so discontinued combat sport competitions would provide a suitable contrast to currently competing athletes. Such research could be particularly useful for identifying the preferred set of attributions, so we suggest recruiting both active and inactive combat sport athletes in the future. Finally, and more of a future direction than study limitation, we believe it would be interesting to examine attributions for the same events made by athletes, their coaches, and parents to gain a deeper understanding of the attribution patterns.
5. Conclusions
This study provided insight into the reasons that athletes from three combat sports (judo, karate, and taekwondo) believe were the causes behind the most successful and least successful performances in their career. The results showed that they make more internal, stable, personally, and externally controllable attributions for success than for failure. They also tend to believe that psychological factors were the most common reasons behind both their biggest success and failure at the competition. This information can be useful to coaches, athletes, and other people involved in the sport because it could help them understand how athletes from combat sports explain their successes and failures. Finally, this is the first such research to our knowledge with Croatian combat sport athletes. We encourage future research in Croatia to expand the attribution literature within Croatia while contributing to the global attribution literature.
Author Contributions
Conceptualization, R.P. and M.J.; methodology, R.P. and M.J.; software, R.P., M.J., R.B. and M.L.; formal analysis, R.P., M.J., R.B., M.L. and C.S.; investigation, R.P. and M.J.; resources, R.P. and M.L.; data curation, R.P. and M.L.; writing—original draft preparation, R.P., M.J., R.B. and M.L.; writing—review and editing, M.L., R.B. and C.S.; supervision, M.J., R.B. and M.L.; project administration, R.P. All authors have read and agreed to the published version of the manuscript.
Funding
This research received no external funding.
Institutional Review Board Statement
The study was conducted in accordance with the Declaration of Helsinki and approved by the University of Zagreb, Faculty of Humanities and Social Sciences, Department of Psychology (Fall 2014). Study numbers are not provided for anonymous data collections with adults. The approval process in the Croatian language is found here—http://psihologija.ffzg.unizg.hr/istrazivanja/eticko-povjerenstvo (accessed on 16 January 2023).
Informed Consent Statement
By agreeing to complete the questionnaire, participants provided their informed consent. Thus, informed consent was obtained from all subjects involved in the study.
Data Availability Statement
The first and corresponding authors have the data supporting all results that can be found in this manuscript.
Acknowledgments
The research team thanks all participants for completing the questionnaire and the Croatian combat clubs for their assistance in making their clubs available for recruitment.
Conflicts of Interest
The authors declare no conflict of interest.
References
- Aronson, E.; Wilson, T.D.; Akert, R.M.; Sommers, S.R. Social perception: How we come to understand other people. In Social Psychology, 9th ed.; Pearson Education: London, UK, 2015; pp. 84–118. [Google Scholar]
- Allen, M. A systematic review of content themes in sport attribution research:1954–2011. Int. J. Sport Exerc. Psychol. 2012, 10, 1–8. [Google Scholar] [CrossRef]
- Rees, T.; Ingledew, D.K.; Hardy, L. Attribution in sport psychology: Seeking congruence between theory, research and practice. Psychol. Sport Exerc. 2005, 6, 189–204. [Google Scholar] [CrossRef]
- Biddle, S.J. Motivation and perceptions of control: Tracing its development and plotting its future in exercise and sport psychology. J. Sport Exerc. Psychol. 1999, 21, 1–23. [Google Scholar] [CrossRef]
- Allen, M.S.; Jones, M.V.; Sheffield, D. Causal attribution and emotion in the days following competition. J. Sport. Sci. 2009, 27, 461–468. [Google Scholar] [CrossRef]
- Coffee, P.; Rees, T. The CSGU: A measure of controllability, stability, globality, and universality attributions. J. Sport Exerc. Psychol. 2008, 30, 611–641. [Google Scholar] [CrossRef]
- Coffee, P.; Rees, T.; Haslam, A. Bouncing back from failure: The interactive impact of perceived controllability and stability on self-efficacy beliefs and future task performance. J. Sport. Sci. 2009, 27, 1117–1124. [Google Scholar] [CrossRef] [Green Version]
- Green, T.D.; Holeman, S. Athletes’ attributions for team performance: A theoretical test across sports and genders. Soc. Behav. Personal. Int. J. 2004, 32, 199–206. [Google Scholar] [CrossRef]
- Le Foll, D.; Rascle, O.; Higgins, N.C. Persistence in a putting task during perceived failure: Influence of state-attributions and attributional style. Appl. Psychol. Int. Rev. 2006, 55, 586–605. [Google Scholar] [CrossRef]
- Shapcott, K.M.; Carron, A.V.; Greenlees, I.; El Hakim, Y. Determinants of team-referent attributions: A multi-level analysis. Int. J. Sport Exerc. Psychol. 2010, 8, 227–244. [Google Scholar] [CrossRef]
- Stead, J.; Poolton, J.; Alder, D. Performance slumps in sport: A systematic review. Psychol. Sport Exerc. 2022, 61, 102136. [Google Scholar] [CrossRef]
- Simonton, K.L.; Garn, A.C. Emotion and motivation consequences of attributional training during a novel physical task. Res. Q. Exerc. Sport 2020, 93, 219–229. [Google Scholar] [CrossRef] [PubMed]
- Weiner, B. A theory of motivation for some classroom experiences. J. Educ. Psychol. 1979, 71, 3–25. [Google Scholar] [CrossRef]
- Weiner, B. An Attributional Theory of Achievement Motivation and Emotion. Psychol. Rev. 1985, 92, 548–573. [Google Scholar] [CrossRef] [PubMed]
- Hewstone, M. Causal Attribution: From Cognitive Processes to Collective Beliefs; Blackwell Publishers Ltd.: Oxford, UK, 1998. [Google Scholar]
- Mezulis, A.H.; Abramson, L.Y.; Hyde, J.S.; Hankin, B.L. Is There a Universal Positivity Bias in Attributions? A Meta-Analytic Review of Individual, Developmental, and Cultural Differences in the Self-Serving Attributional Bias. Psychol. Bull. 2004, 130, 711–747. [Google Scholar] [CrossRef] [PubMed] [Green Version]
- Wong, P.T.P.; Weiner, B. When people ask "Why" questions, and the heuristics of attributional search. J. Personal. Soc. Psychol. 1981, 40, 650–663. [Google Scholar] [CrossRef]
- McAuley, E. Successes and causality in sport: The influence of perception. J. Sport Psychol. 1985, 7, 13–22. [Google Scholar] [CrossRef]
- McAuley, E.; Gross, J.B. Perceptions of causality in sport: An application of the Causal Dimension Scale. J. Sport Psychol. 1983, 5, 72–76. [Google Scholar] [CrossRef]
- Hamilton, P.R.; Jordan, S.J. Most Successful and Least Successful Performances: Perceptions of Causal Attributes in High School Track Athletes. J. Sport Behav. 2000, 23, 245–254. [Google Scholar]
- Santamaria, V.L.; Furst, D.M. Distance runners’ causal attributions for most successful and least successful races. J. Sport Behav. 1994, 17, 43–51. [Google Scholar]
- De Michele, P.E.; Gansneder, B.; Solomon, G.B. Success and failure attributions of wrestlers: Further evidence of the self-serving bias. J. Sport Behav. 1998, 8, 242–255. [Google Scholar]
- Grove, J.R.; Hanrahan, S.J.; McInman, A. Success/failure bias in attributions across involvement categories in sport. Personal. Soc. Psychol. Bull. 1991, 17, 93–97. [Google Scholar] [CrossRef]
- Mark, M.M.; Mutrie, N.; Brooks, D.R.; Harris, D.V. Causal attributions of winners and losers in individual competitive sports: Toward a reformulation of the self-serving bias. J. Sport Psychol. 1984, 6, 184–196. [Google Scholar] [CrossRef]
- Lochbaum, M.; Çetinkalp, Z.K.; Graham, K.-A.; Wright, T.; Zazo, R. Task and ego goal orientations in competitive sport: A quantitative review of the literature from 1989 to 2016. Kinesiology 2016, 48, 3–29. [Google Scholar] [CrossRef] [Green Version]
- Lochbaum, M.; Jean-Noel, J.; Pinar, C.; Gilson, T. A meta-analytic review of Elliot’s (1999) Hierarchical Model of Approach and Avoidance Motivation in the sport, physical activity, and physical education literature. J. Sport Health Sci. 2017, 6, 68–80. [Google Scholar] [CrossRef] [Green Version]
- Harwood, C.G.; Keegan, R.J.; Smith, J.M.J.; Raine, A.S. A systematic review of the intrapersonal correlates of motivational climate perceptions in sport and physical activity. Psychol. Sport Exerc. 2015, 18, 9–25. [Google Scholar] [CrossRef] [Green Version]
- Prosoli, R.; Banai, B.; Barić, R.; Lochbaum, M.; Cooper, S.; Jelić, M. Causal attributions for success and failure among athletes: Validation of the Croatian version of the revised Causal dimension scale (CDS-II). Pedagog. Phys. Cult. Sport. 2021, 25, 241–249. [Google Scholar] [CrossRef]
- McAuley, E.; Duncan, T.E.; Russell, D. Measuring causal attributions: The revised Causal Dimension Scale (CDSII). Personal. Soc. Psychol. Bull. 1992, 18, 566–573. [Google Scholar] [CrossRef]
- Hanrahan, S.J.; Biddle, S.J.H. Attributions and perceived control. In Advances in Sport Psychology, 3rd ed.; Horn, T.S., Ed.; Human Kinetic Inc.: Champaign, IL, USA, 2008; pp. 99–114. [Google Scholar]
- Cohen, J. Things I have learned (so far). Am. Psychol. 1990, 45, 1304–1312. [Google Scholar] [CrossRef]
- Razali, N.M.; Wah, Y.B. Power comparisons of Shapiro-Wilk, Kolmogorov-Smirnov, Lilliefors and Anderson-Darling tests. J. Stat. Model. Anal. 2011, 2, 21–33. [Google Scholar]
- Conover, W.J.; Iman, R.L. Rank transformations as a bridge between parametric and nonparametric statistics. Am. Stat. 1981, 35, 124–129. [Google Scholar]
- Intellectus Statistics [Online Computer Software]. Intellectus Statistics. 2022. Available online: https://analyze.intellectusstatistics.com/ (accessed on 21 February 2023).
- Krane, V.; Williams, J.M. Psychological characteristics of peak performance. In Applied Sport Psychology: Personal Growth to Peak Performance, 5th ed.; Williams, J.M., Ed.; McGraw Hill: New York, NY, USA, 2006; pp. 207–228. [Google Scholar]
- Eklund, R.C. A season-long investigation of competitive cognition in collegiate wrestlers. Res. Q. Exerc. Sport 1994, 65, 169–183. [Google Scholar] [CrossRef] [PubMed]
- Eklund, R.C. Preparing to compete: A season long investigation with collegiate wrestlers. Sport Psychol. 1996, 10, 111–131. [Google Scholar] [CrossRef]
- Gould, D.; Eklund, R.C.; Jackson, S.A. 1988 U.S. Olympic wrestling excellence: I Mental preparation, precompetitive cognition, and affect. Sport Psychol. 1992, 6, 358–382. [Google Scholar] [CrossRef]
- Gould, D.; Eklund, R.C.; Jackson, S.A. 1988 U.S. Olympic wrestling excellence: II Thoughts and affect. Sport Psychol. 1992, 6, 383–402. [Google Scholar] [CrossRef]
Figure 1.
Attribution theory reasons for success or failure.

Figure 2.
Frequency counts for success and failure attributions.


Table 1.
Summary statistics table for interval and ratio variables for all participants (N = 154).
| Competitive Event | Dimensions of Attributions | M | SD | SEM | Min | Max | Skewness | Kurtosis | Median |
|---|---|---|---|---|---|---|---|---|---|
| Success | Locus | 19.24 | 5.33 | 0.43 | 3.00 | 27.00 | −0.63 | −0.26 | 20.00 |
| Stability | 13.73 | 5.38 | 0.43 | 3.00 | 26.00 | 0.07 | −0.42 | 14.00 | |
| External control | 13.27 | 6.15 | 0.50 | 3.00 | 27.00 | 0.02 | −0.65 | 13.00 | |
| Personal control | 19.44 | 5.52 | 0.44 | 3.00 | 27.00 | −0.74 | 0.02 | 20.50 | |
| Failure | Locus | 17.31 | 5.35 | 0.43 | 3.00 | 27.00 | −0.44 | −0.23 | 18.00 |
| Stability | 9.95 | 4.76 | 0.38 | 3.00 | 25.00 | 0.30 | −0.46 | 10.00 | |
| External control | 11.81 | 6.21 | 0.50 | 3.00 | 27.00 | 0.22 | −0.65 | 12.00 | |
| Personal control | 17.48 | 5.66 | 0.46 | 3.00 | 27.00 | −0.36 | −0.34 | 18.00 |
Table 2.
Pearson correlations (r) with 95% confidence intervals (CI) between age and sport experience with the success (S) and failure (F) attribution dimensions with associated p-value. N = 154 for all correlations.
Table 2.
Pearson correlations (r) with 95% confidence intervals (CI) between age and sport experience with the success (S) and failure (F) attribution dimensions with associated p-value. N = 154 for all correlations.
| Variables | Attribution | r | 95% CI | p-Value |
|---|---|---|---|---|
| Age with | Locus (S) | 0.14 | [−0.02, 0.29] | 1.000 |
| Locus (F) | 0.15 | [−0.01, 0.30] | 1.000 | |
| Stability (S) | −0.11 | [−0.27, 0.04] | 1.000 | |
| Stability (F) | −0.21 | [−0.35, −0.05] | 0.345 | |
| External Control (S) | 0.00 | [−0.16, 0.16] | 1.000 | |
| External Control (F) | −0.16 | [−0.31, −0.00] | 1.000 | |
| Personal Control (S) | 0.13 | [−0.02, 0.29] | 1.000 | |
| Personal Control (F) | 0.04 | [−0.12, 0.19] | 1.000 | |
| Sport Experience with | Locus (S) | 0.08 | [−0.08, 0.24] | 1.000 |
| Locus (F) | 0.07 | [−0.08, 0.23] | 1.000 | |
| Stability (S) | −0.10 | [−0.25, 0.06] | 1.000 | |
| Stability (F) | −0.13 | [−0.06, 0.26] | 1.000 | |
| External Control (S) | −0.00 | [−0.16, 0.16] | 1.000 | |
| External Control (F) | −0.15 | [−0.30, 0.01] | 1.000 | |
| Personal Control (S) | 0.10 | [−0.12, 0.20] | 1.000 | |
| Personal Control (F) | 0.04 | [−0.29, 0.02] | 1.000 |
Table 3.
Pearson correlations (r) with 95% confidence intervals (CI) amongst all attribution dimensions and both competitive events, success (S), and failure (F), with associated p-value. N = 154 for all correlations.
Table 3.
Pearson correlations (r) with 95% confidence intervals (CI) amongst all attribution dimensions and both competitive events, success (S), and failure (F), with associated p-value. N = 154 for all correlations.
| Attribution Dimensions | r | 95% CI | p-Value | |
|---|---|---|---|---|
| Stability (S) | External Control (F) | 0.19 | [0.04, 0.34] | 0.567 |
| External Control (S) | −0.14 | [−0.29, 0.02] | 1.000 | |
| Locus (F) | −0.08 | [−0.23, 0.08] | 1.000 | |
| Locus (S) | 0.27 | [0.12, 0.41] | 0.023 | |
| Stability (F) | 0.12 | [−0.04, 0.28] | 1.000 | |
| Personal Control (S) | 0.22 | [0.06, 0.36] | 0.232 | |
| Personal Control (F) | 0.10 | [−0.06, 0.26] | 1.000 | |
| External Control (F) | External Control (S) | 0.39 | [0.25, 0.52] | <0.001 |
| Locus (F) | −0.30 | [−0.44, −0.15] | 0.004 | |
| Locus (S) | −0.08 | [−0.23, 0.08] | 1.000 | |
| Stability (F) | 0.28 | [0.12, 0.42] | 0.020 | |
| Personal Control (S) | −0.08 | [−0.24, 0.08] | 1.000 | |
| Personal Control (F) | −0.09 | [−0.24, 0.07] | 1.000 | |
| External Control (S) | Locus (F) | 0.04 | [−0.12, 0.19] | 1.000 |
| Locus (S) | −0.13 | [−0.29, 0.03] | 1.000 | |
| Stability (F) | 0.15 | [−0.01, 0.30] | 1.000 | |
| Personal Control (S) | −0.04 | [−0.20, 0.12] | 1.000 | |
| Personal Control (F) | 0.02 | [−0.14, 0.18] | 1.000 | |
| Locus (F) | Locus (S) | 0.28 | [0.02, 0.32] | 0.014 |
| Stability (F) | 0.03 | [0.30, 0.55] | 1.000 | |
| Personal Control (S) | 0.17 | [0.02, 0.32] | 1.000 | |
| Personal Control (F) | 0.43 | [0.53, 0.72] | <0.001 | |
| Locus (S) | Stability (F) | −0.29 | [−0.43, −0.14] | 0.010 |
| Personal Control (S) | 0.64 | [0.53, 0.72] | <0.001 | |
| Personal Control (F) | 0.38 | [0.24, 0.51] | <0.001 | |
| Stability (F) | Personal Control (S) | −0.32 | [−0.46, −0.18] | 0.001 |
| Personal Control (F) | −0.11 | [−0.26, 0.05] | 1.000 | |
| Personal Control (S) | Personal Control (F) | 0.34 | [0.19, 0.47] | <0.001 |
Table 4.
Two-tailed Paired Samples t-test, Cohen’s d, and Shapiro–Wilk test (W) results for Success Compared to Failure for Each Attribution Dimensions (N = 154).
Table 4.
Two-tailed Paired Samples t-test, Cohen’s d, and Shapiro–Wilk test (W) results for Success Compared to Failure for Each Attribution Dimensions (N = 154).
| Attribution Dimension | t | p-Value | W | p-Value | Cohen’s d |
|---|---|---|---|---|---|
| Locus | 3.75 | <0.001 | 0.98 | 0.067 | 0.30 |
| Stability | 6.98 | <0.001 | 0.98 | 0.041 | 0.56 |
| Personal Control | 3.78 | <0.001 | 0.98 | 0.035 | 0.30 |
| External Control | 2.66 | 0.009 | 0.98 | 0.078 | 0.21 |
Disclaimer/Publisher’s Note: The statements, opinions and data contained in all publications are solely those of the individual author(s) and contributor(s) and not of MDPI and/or the editor(s). MDPI and/or the editor(s) disclaim responsibility for any injury to people or property resulting from any ideas, methods, instructions or products referred to in the content. |
© 2023 by the authors. Licensee MDPI, Basel, Switzerland. This article is an open access article distributed under the terms and conditions of the Creative Commons Attribution (CC BY) license (https://creativecommons.org/licenses/by/4.0/).
Share and Cite
MDPI and ACS Style
Prosoli, R.; Jelić, M.; Barić, R.; Sisneros, C.; Lochbaum, M. Croatian Combat Athletes’ Attribution Patterns for Their Successes and Failures. Youth 2023, 3, 381-391. https://doi.org/10.3390/youth3010025
AMA Style
Prosoli R, Jelić M, Barić R, Sisneros C, Lochbaum M. Croatian Combat Athletes’ Attribution Patterns for Their Successes and Failures. Youth. 2023; 3(1):381-391. https://doi.org/10.3390/youth3010025
Chicago/Turabian StyleProsoli, Rebeka, Margareta Jelić, Renata Barić, Cassandra Sisneros, and Marc Lochbaum. 2023. "Croatian Combat Athletes’ Attribution Patterns for Their Successes and Failures" Youth 3, no. 1: 381-391. https://doi.org/10.3390/youth3010025