Article

Blueberries as a Source of Energy: Physical Chemistry Characterization of Their Anthocyanins as Dye-Sensitized Solar Cells’ Sensitizers

by
Tatiana Montagni
1,
Mauricio Rodríguez Chialanza
2 and
María Fernanda Cerdá
1,*
1
Laboratorio de Biomateriales, Instituto de Química Biológica, Facultad de Ciencias, UdelaR. Iguá 4225, Montevideo 11400, Uruguay
2
PDU Ciencias Física y sus Aplicaciones, Centro Universitario Regional del Este, UdelaR. Ruta 15 y Ruta 9, Rocha 2700, Uruguay
*
Author to whom correspondence should be addressed.
Solar 2023, 3(2), 283-297; https://doi.org/10.3390/solar3020017
Submission received: 10 March 2023 / Revised: 11 May 2023 / Accepted: 15 May 2023 / Published: 18 May 2023

Abstract

:
This work aimed to show the possibility of applying anthocyanins extracted from blueberries following a straightforward path as potential impregnation dyes in dye-sensitized solar cells (DSSCs), particularly in the presence of co-adsorbents, such as silver nanoparticles, as an alternative in order to profit from large amounts of discarded fruits. Following a simple procedure, anthocyanins (mainly delphinidin-3-glucoside) were obtained from blueberries (Southern Highbush type). Complete characterization was carried out in order to prove the utility of delphinidin-3-glucoside as a sensitizer in DSSCs. The analyzed anthocyanin is suitable for sensitizing because of its high molar absorptivity values within the visible region of the light spectra, the adsorption ability to a FTO/TiO2 electrode (FTO, fluorine-doped tin oxide) as confirmed by Fourier transform infrared (FTIR) as well as thermogravimetry coupled to differential scanning calorimetry (TG-DSC), a potential oxidation value near 1 V, and adequate thermal as well as light stabilities. Moreover, the cell’s conversion efficiency is improved in the presence of silver nanoparticles, reaching 0.24% (nearly a 25% increase). The sum of all these characteristics points to the application of delphinidin-3-glucoside as a sensitizer in DSSCs, offering a technological use with potential interest for countries where agricultural production offers an abundant origin of extraction.

1. Introduction

Dye-sensitized solar cells (DSSCs) are based on transparent and colorful materials. They provide an alternative to silicon-based devices for indoor applications and BIPVs (building-integrated photovoltaics) due to their transparency and beauty or for long-term wireless power for Internet of things (IoT) devices and wireless sensors (where the need for current or voltage is low) [1,2,3,4,5,6,7]. Dyes can be extracted from natural sources or obtained from synthetic paths, and reach conversion efficiency depending on their origin.
First reported in 1991, DSSCs described power conversion efficiency (PCE) values improved to 13.5% under standard 1 sun, AM 1.5 solar radiations. The documented record is a PCE of 34.5% under ambient light [8,9,10,11].
The total efficiency of DSSCs depends strongly on the photoanode composition, where the dye plays a vital role in the transfer processes [12]. Strong dye adsorption onto the TiO2 is required for efficient electron injection from the pigment to the semiconductor. The selection of photosensitizers in dye-sensitized cells is based on the high molar absorptivity of visible light at different wavelengths, the stability towards the temperature or light, and the costs associated with them being obtained. Among the evaluated sensitizers, several dyes extracted from natural resources (anthocyanins, carotenoids, flavonoids, and chlorophyll) have been reported and represent an attractive alternative regarding their abundance, costs, and eco-friendly characteristics [13,14,15,16,17,18]. Conversion efficiencies for natural pigments are much lower than those obtained for synthesized dyes, but they still constitute a research focus [19,20,21,22,23,24,25,26]. Although DSSCs based on synthetic dyes are more efficient, their use of expensive metals, such as N3 and N719, has several drawbacks [27]. DSSCs based on natural dyes could offer an exciting alternative to profit from tons of biomass originating from fruits that are discarded due to different reasons (i.e., them being overripe, crushed, or too small), from invasive seaweeds or produced as secondary products associated with tree felling, among others [28,29,30,31]. Moreover, pigment extraction from these sources could be as easy as using a suitable solvent [32,33,34].
DSSCs can operate indoors and under light-diffused conditions or cloudy skies. This being the case, they can be used as photovoltaic windows or integrated into greenhouses [35,36,37,38]. Additionally, applying this technology could offer an energy generation alternative, particularly for cold regions. When sensitizers are natural dyes, low temperatures constitute an ally regarding thermal stability.
Silver nanoparticles have been applied in DSSCs, increasing cell efficiency [39,40,41]. They enhance the electron transference towards the photoanode surface by covering bare spots on the electrode or as a part of a net with the dyes. Nanoparticles could be added mixed with the pigment as an impregnation cocktail, or by following a sequential step.
This work aimed to explore the use of anthocyanins extracted from blueberries (Southern Highbush type), primarily delphinidin-3-glucoside (Scheme 1), as sensitizers in DSSCs.
The use of anthocyanins as sensitizers has been widely reported and constitutes one of the best options for this use among natural resources [13,42,43,44,45,46,47,48]. Nevertheless, exploring new sources from which to obtain these compounds and examine technological benefits could interest countries where agricultural production offers an abundant extraction origin.
For co-sensitized cells assembled with delphinidin-3-glucoside and silver round nanoparticles, we achieved a conversion efficiency of 0.24% under a power of 1 sun, AM 1.5.

2. Materials and Methods

2.1. Extraction and Purification of Dyes

Fresh samples from blueberries of the Southern Highbush type were obtained from the market. Blueberries were washed with Milli-Q water and dried at 40 °C. Two extraction options were tested: from the entire fruit or from the peel. The fruit or the peel were mechanically crushed into a mortar and mixed with liquid nitrogen. The remaining solid was dried once more at 40 °C. Then, 1 g of solid was mixed with 10 mL of solvent (Milli-Q water, acidified methanol pH = 3.5 or acidified ethanol pH = 3.5, or absolute ethanol). The mixtures were vortexed and refrigerated at 4 °C in the dark overnight. Finally, the solutions were centrifuged and the solid was discarded.
Anthocyanin extractions were followed by UV (ultraviolet)–visible spectroscopy, and the concentrations of delphinidin-3-glucoside (DEL3GLU) were calculated in accordance with Beer’s law using a molar absorptivity coefficient of 29,000 L mol−1 cm−1 for the methanol-containing solutions [49], and a coefficient of 23,700 L mol−1 cm−1 for ethanol and aqueous solutions [50].
After the extractions, the solid-free centrifuged solutions were purified via the use of C18 columns, employing an acetonitrile–methanol (ratio of 3:2) mixture as a mobile phase. The eluted solution was partially evaporated via the use of a Savant SPD 2010 Speed Vac Concentrator to increase the concentration. The purified concentrated solutions were then characterized through different techniques and applied to sensitize the DSSCs.

2.2. Characterization

FTIR spectra in the range of 400–4000 cm−1 were obtained at room temperature through employing a Shimadzu infrared spectrometer model IR-Prestige 21, averaging ten scans at a nominal resolution of 4 cm−1. In the case of anthocyanins, a few drops of the concentrated solutions (obtained as described in Section 2.1) were deposited in a Petri dish and dried overnight. After this, the remaining solids were scratched with a spatula and thoroughly mixed with KBr in an agate mortar to obtain an approximately 1% mixture (w/w). In this way, 13 mm discs were prepared in a Pike Crush IR at a pressure of 10 tons.
Different FTIR spectra were recorded: 1—for TiO2 (anatase form), 2—for the purified anthocyanin-containing solution (from the dried drops, as explained before), and 3—for the dye after incubation for 24 h onto TiO2 electrodes. To obtain the dye incubate on TiO2 samples, 100 µL of the dye-containing solutions was deposited on the FTO/TiO2 electrodes and left at room temperature to dryness. After 24 h in darkness, a disc was prepared through the use of KBr and some milligrams of the scraped electrode surface via the described procedure.
Cyclic voltammetry was employed to evaluate the redox behavior through the use of screen-printed disposable Au-pc (polycrystalline) electrodes (DROPSENS) at a potential scan rate of 0.05 Vs−1, with a pseudo-reference potential of E = 0.238 V vs. SHE (standard hydrogen electrode). The supporting electrolyte was ethanol/0.1 M NaClO4 in milli-Q water (50/50).
For thermogravimetry (TG) and differential scanning calorimetry (DSC), 449F5 Netzsch simultaneous thermal analysis equipment was employed, using aluminum crucibles. The equipment was previously calibrated using metals as standards under heat flow and temperature. Synthetic air was used as an atmosphere with a 50 mL/min flow rate. We used a 10 °C/min heating rate. Three samples were analyzed: DEL3GLU, DEL3GLU adsorbed to TiO2, and TiO2. These were obtained in the same way as for FTIR, except that the DEL3GLU was obtained from a lyophilized aqueous crude extract from blueberry peels.
In addition, the stability of the DEL3GLU extracted with ethanol and water was evaluated by heating the solution at temperatures within the range of 40 to 80 °C in the presence and absence of spherical Ag nanoparticles of 100 nm (NP100). In this case, the thermal stability of the compound was followed by recording the absorbance values at 550 nm, i.e., the maximum of the visible spectra.

2.3. DSSC Assembly and Characterization

DSSCs were assembled following a sandwich configuration, with FTO/TiO2 (SOLARONIX test kit, 20 mm × 20 mm sized, active area of mesoporous TiO2 0.36 cm2) and FTO/Pt (20 mm × 20 mm sized, screen printed with SOLARONIX’s Pt Platinum Catalyst, as offered at the test cell kits) as the working and counter-electrodes, respectively. Both electrodes were purchased from SOLARONIX and used without further treatment. The titania opaque electrodes were printed on TCO22-7/LI glass (7 Ω/sq fluorine-doped tin oxide coating on one side), with active titania and reflective titania. The active titania was about 10 microns thick and comprised anatase nanoparticles of about 15–20 nm (porosity ~10–20 nm). The reflective titania was about 2–3 microns and composed of about 80–120 nm nanoparticles. Before use, the FTO/TiO2 electrode was heated at 500 °C for 30 min. The electrolyte was a 50 mM iodide/tri-iodide (I/I3) in acetonitrile (SOLARONIX Iodolyte AN-50).
Three different sensitizers were applied to assemble the DSSCs: pure ethanolic extract, pure ethanolic extract with silver nanoparticles, and aqueous crude extract.
FTO/TiO2 electrodes were immersed overnight into the DEL3GLU-containing solution to adsorb the dye and then rinsed thoroughly with ethanol. A sequential approach was followed when silver nanoparticles were used. The dye solution was applied first, followed by the immersion of the photoanode in the nanoparticle solution [40]. Spherical Ag nanoparticles of 100 nm (NP100) (Nanocomposix®, 0.02 mg mL−1 of silver with 2 mmol L−1 of sodium citrate) were utilized.
The assembled DSSCs were characterized by measuring the current density vs. voltage (J–V) profiles and recording the electrochemical impedance spectroscopy (EIS) data with a CHI 604E potentiostat. J–V analyses were accomplished at a potential scan rate (v) of 0.05 Vs−1, at room temperature, in darkness and using a solar simulator from ABET Technologies (1 sun or 100 mW cm−2, AM 1.5). EIS experiments were performed between 0 and 0.5 V and inside the frequency range of 0.1 Hz to 3 MHz (in darkness).
Some additional absorbance evaluations were registered by using a reflection probe connected to a SPELEC (DROPSENS) instrument to explore the co-adsorption of anthocyanins and NP100. For this, the FTO/TiO2 electrodes were dipped overnight inside the cocktail solutions (i.e., a mixture of purified anthocyanins and NP100) and rinsed with ethanol before being measured within the 350 to 650 nm range.

3. Results and Discussion

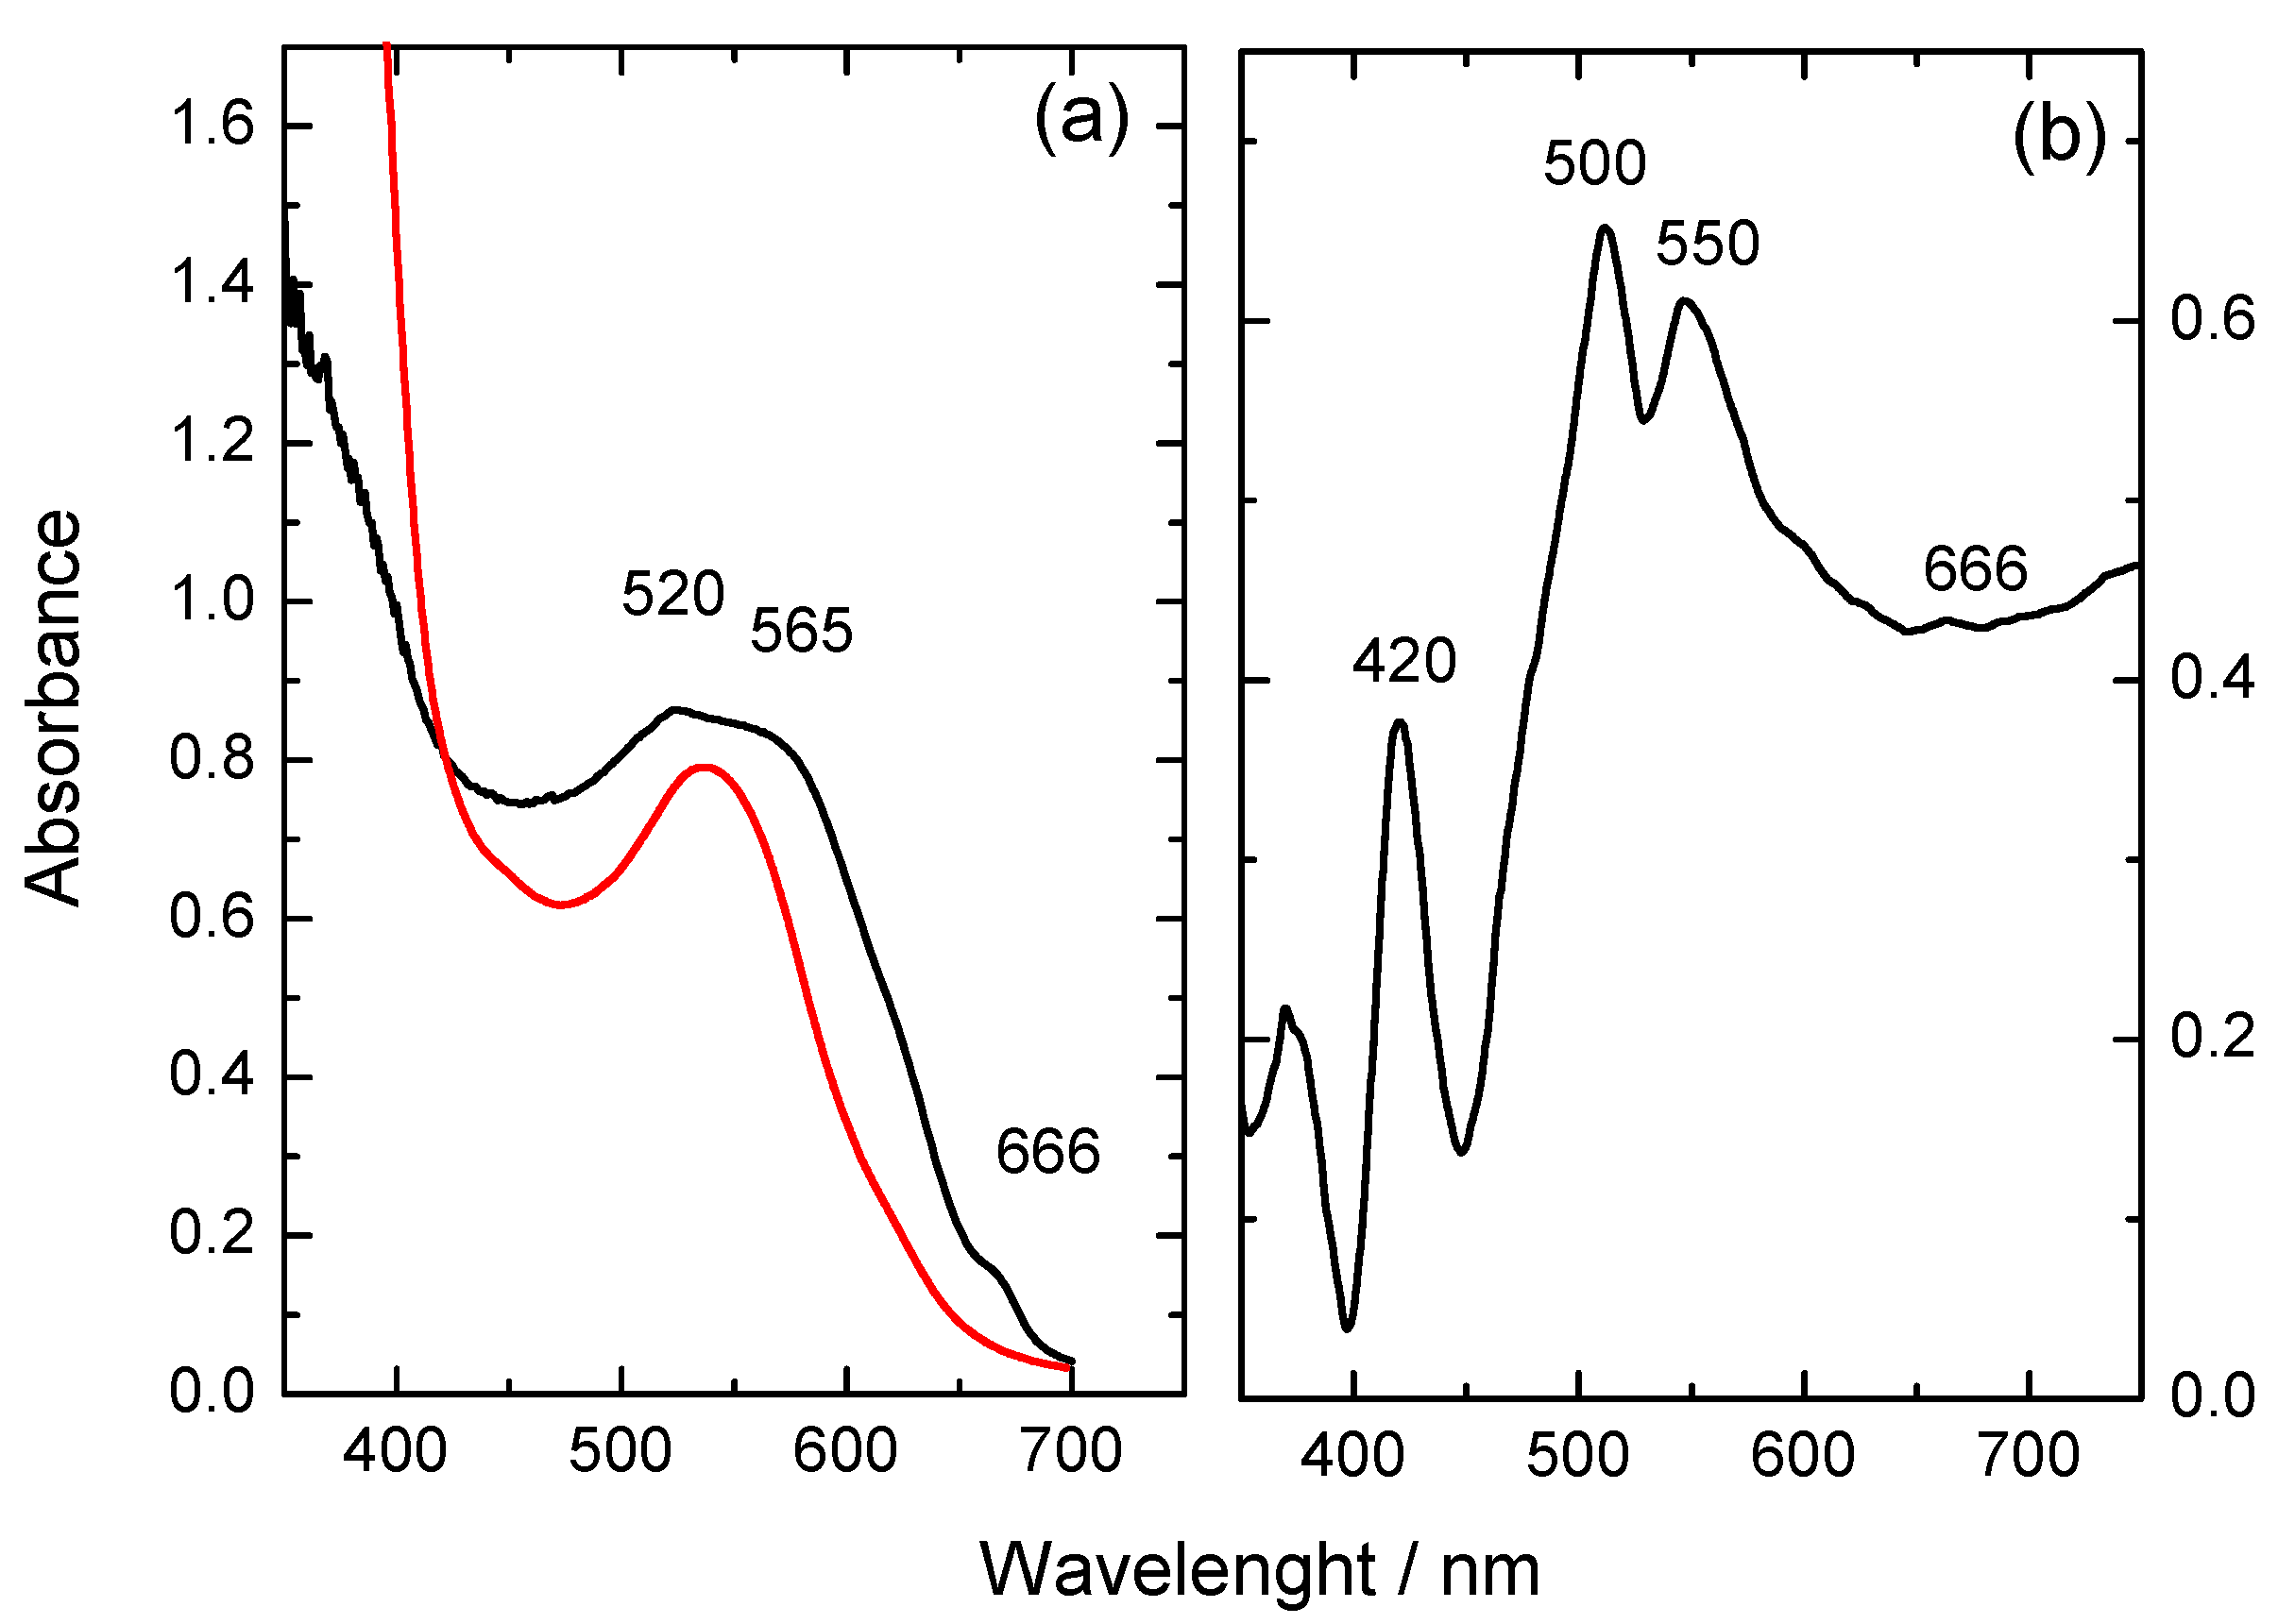
3.1. Extraction and Purification

As detailed in Section 2.1, different extraction conditions were applied and followed via visible spectroscopy. Concentrations were calculated accordingly to Beer’s law.
The highest delphinidin-3-glucoside (DEL3GLU) contents were obtained from extractions from the whole fruit using water as an extraction solvent and from the peel using acidic methanol. For these cases, the obtained concentrations were 12 × 10−5 M. On the opposite end, the lowest delphinidin-3-glucoside amounts were obtained using ethanol as the extraction solvent starting from the peel or the whole fruit, and almost the same concentration of 2 × 10⁻⁵ M was calculated.
The absorbance spectra for the anthocyanin-containing solutions confirmed the presence of chlorophylls (peak at 666 nm) and anthocyanins (peaks at 520 and 565 nm), and therefore a C18 column was used to purify them [17,51]. Additionally, as observed in Figure 1a, the absorbance peak is very wide in ethanol, and even two superimposed peaks are detected. In neutral to slightly acidified media, anthocyanins are involved in equilibrium with their quinonoid form, and therefore two species could be seen [52,53,54].
Comparing the spectra recorded from the solution with those obtained from the adsorbed compounds onto the FTO/TiO2 electrodes is interesting. Anthocyanins and chlorophylls are detected in both types of spectra (Figure 1a,b). The spectra also showed the presence of NP100 originating from the sensitizing impregnation cocktail. The ratio between the absorbance of the peak at ca. 550 nm related to the one at 666 nm changes and decreases after adsorption. This shows that chlorophylls, when present, compete with DEL3GLU for the semiconductor surface, but that their adsorption is more favorable, even in the presence of silver NP100. The presence of adsorbed NP100 could be assessed from the absorbance peaks at 380 and 420 nm due to the surface plasmon absorption band, also pointing to nanoparticle aggregation [55]. At this point, it is necessary to clarify some details. When ethanol is used to extract, chlorophylls in the raw solution are detected for the peak absorbance at 666 nm. When adsorbed to the TiO2, they compete with the anthocyanins for the electrode surface. For this reason, chlorophylls are removed from the raw solution via the use of a C18 column to increase the cell’s efficiency.

3.2. FTIR

After evaporation to dryness, KBr discs were prepared to contain the purified anthocyanins and the red-colored compound after incubation for 24 h onto FTO/TiO2 electrodes (Figure 2, Table 1). Then, those samples prepared through scratching the TiO2 contained less DEL3GLU due to the presence of an amount of the semiconductor. Remarkably, the signals’ relative intensities are irrelevant since the KBr discs were prepared through weighing 1 mg of the sample to be analyzed.
Despite this, for discs prepared from TiO2 after incubation overnight in the anthocyanin solution, the presence of the signals assigned to DEL3GLU demonstrated the adsorption. Moreover, if the position of some of the signals moved to different frequencies, the functional group responsible for the signal was involved in the bonding with the semiconductor.
The double signal peak at 1715 cm−1 and 1647 cm−1 is due to C=O groups. In the TiO2 samples, the signal at 1647 cm−1 detected in the dye moved to 1637 cm−1 after the adsorption of DEL3GLU. Establishing bonds between the dye and the semiconductor caused this displacement. To understand some details, it is important to consider the structures involved in the equilibrium. In anthocyanins, flavylium cations (red colored) and the quinonoid form (red-blue) are in equilibrium. After adsorption onto TiO2, electrodes became red-blue colored, showing that quinonoid is the main form when conjugated to the semiconductor [31]. The quinonoid form has C=O groups, whereas the flavylium does not.
After union to the TiO2, some signals coming from phenol groups disappeared: in particular, signals at 1454 cm−1 and 1421 cm−1 (assigned to C-C=C vibration), in addition to the signal at 1250 cm−1 (from C-O vibration) [56]. These observations proved that DEL3GLU could be adsorbed to the titania through using the phenolic –OH moieties.
The strong signal at 1060 cm−1 is split into two weak contributions at 1130 and 1000 cm−1 after adsorption onto TiO2. The mentioned signal could be explained due to the C-O vibration of bonds from primary alcohol groups, such as those found in glucose and the stretching of C-O-C bonds of carbohydrates or flavylium [57,58]. These facts involved the –OH groups from glucose or the flavylium ion in coordination with titanium.
Finally, a signal related to the stretching Ti-O-Ti is detected at 665 cm−1. The peak intensity at 1647 cm−1 ratio to the peak intensity at 665 cm−1 decreased after the adsorption of DEL3GLU to the semiconductor, confirming the existence of intermolecular interactions between anthocyanin and the semiconductor.

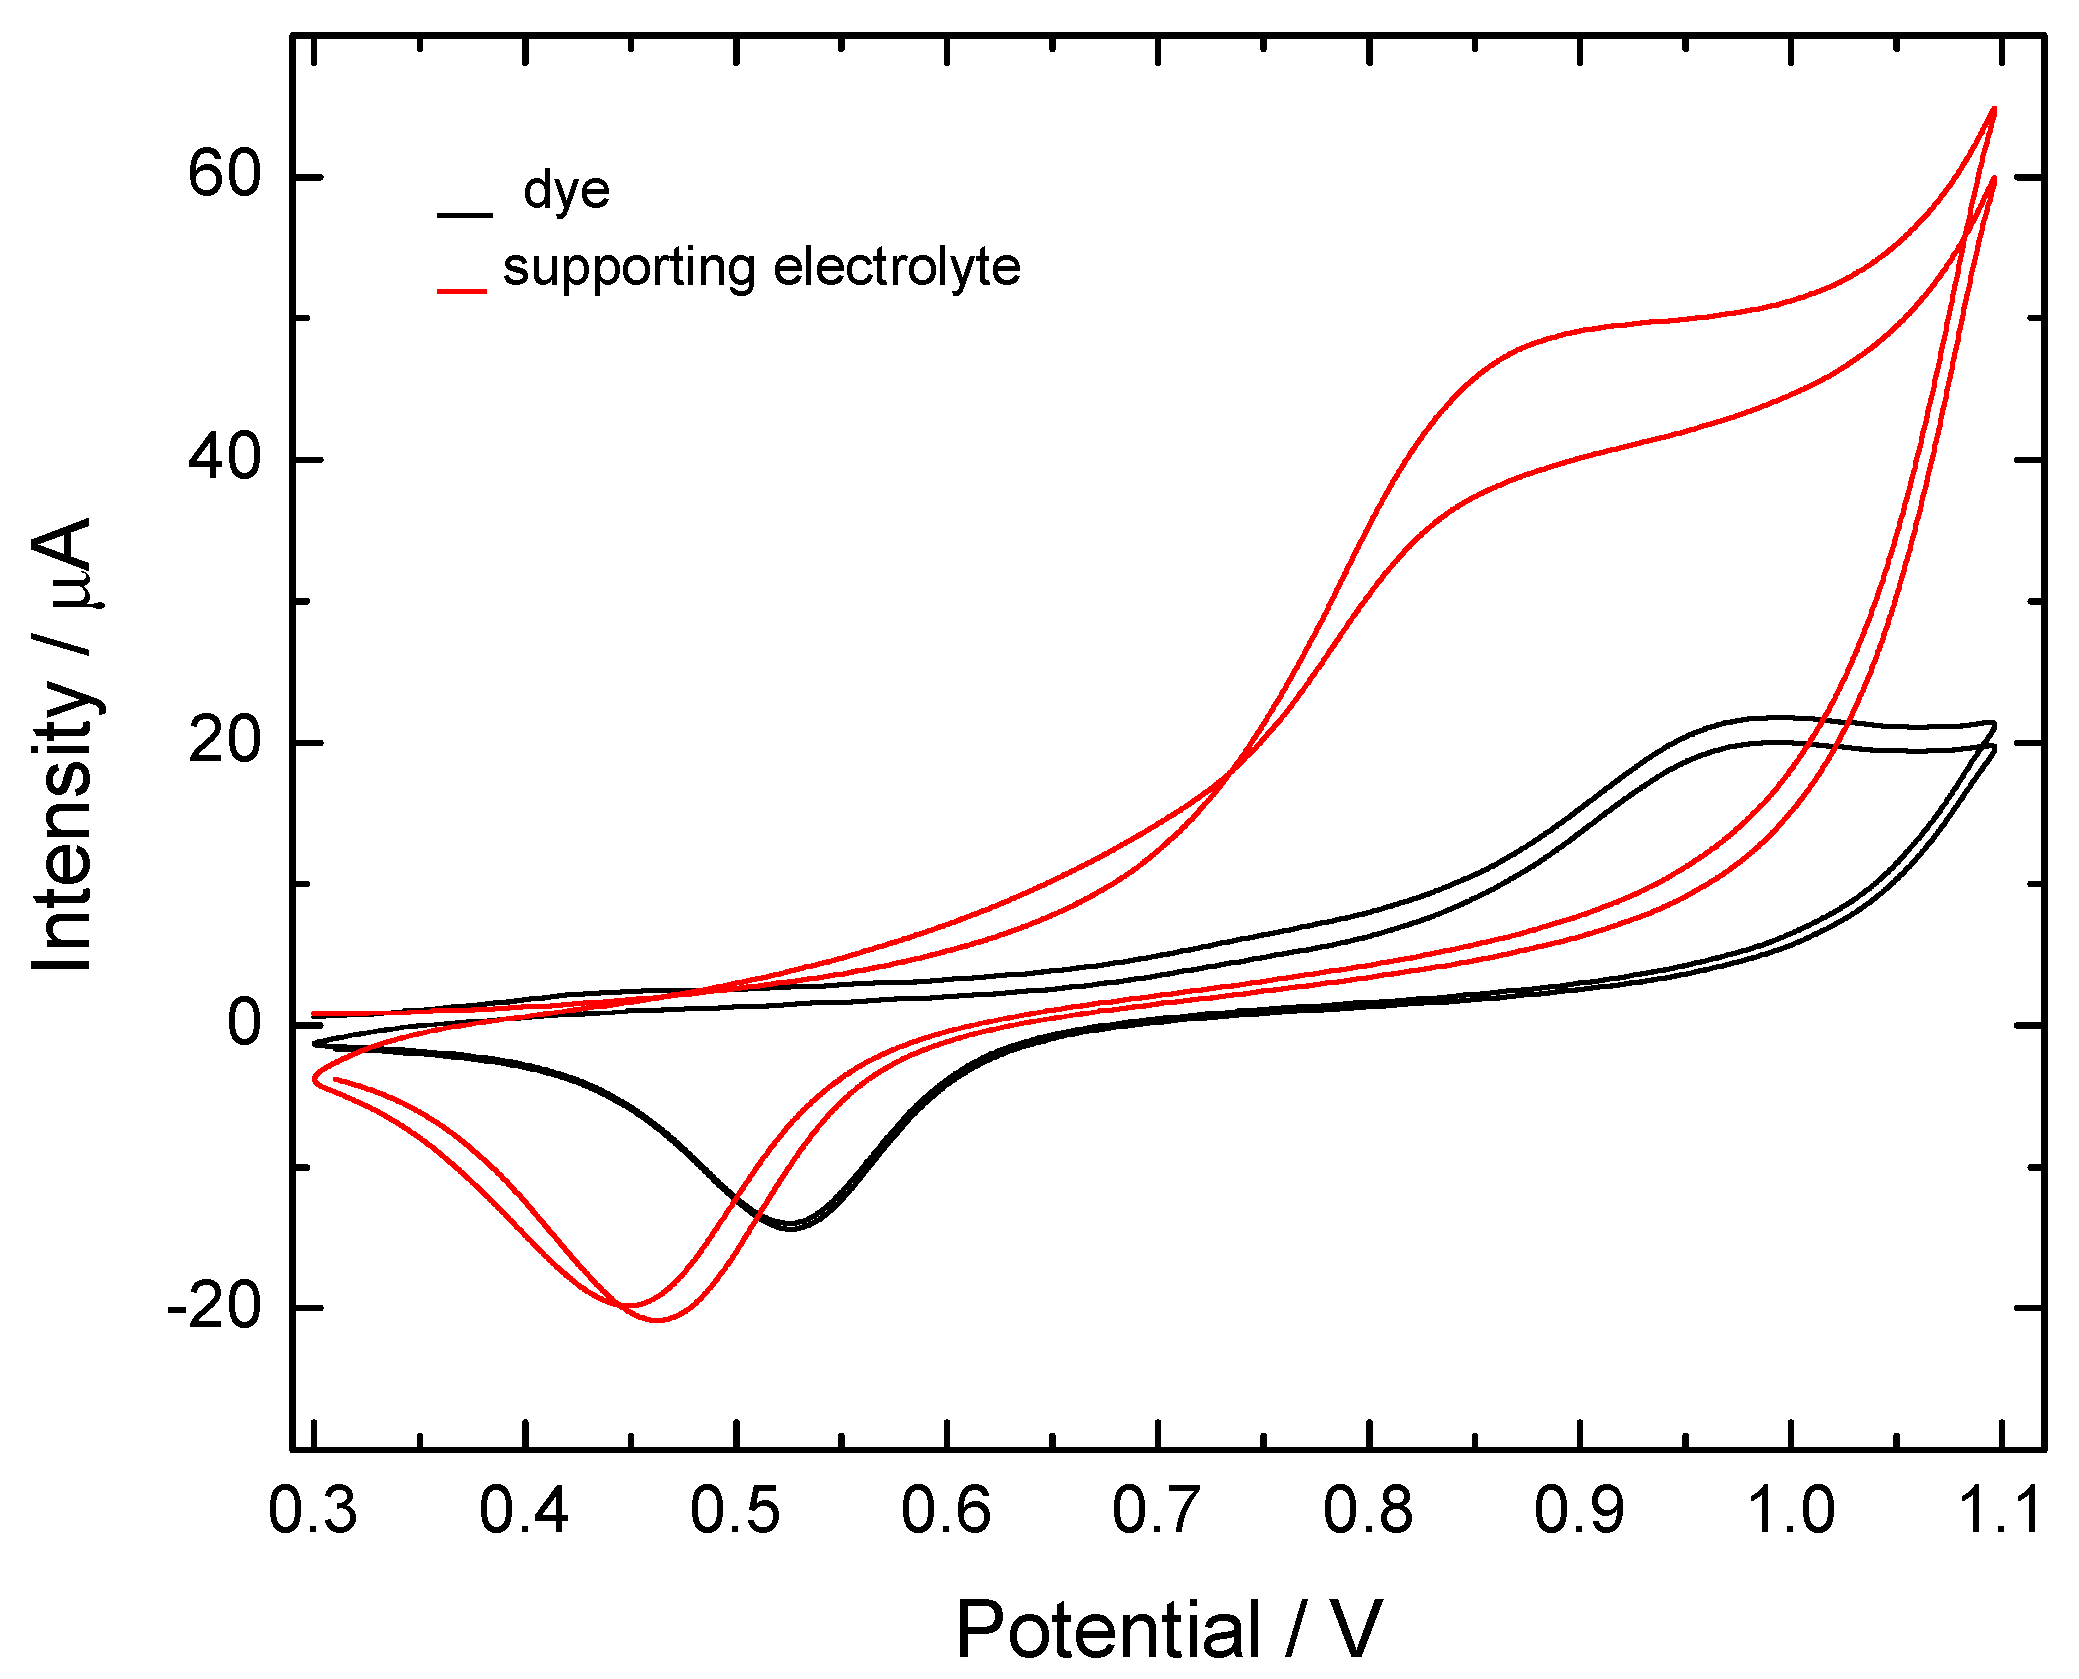
3.3. Redox Characterization

From cyclic voltammetry, profiles registered at v = 0.05 Vs−1 for Au-pc in the supporting electrolyte (ethanol/0.1 M NaClO4 in Milli-Q water 50/50) displayed an anodic contribution at 0.88 V with a cathodic counter-peak at 0.52 V. The potential of the pseudo-reference electrode is 0.238 V vs. SHE. The potentials in the text are referred to as this value.
Voltametric profiles obtained for Au-pc in an anthocyanin solution dissolved in the supporting electrolyte showed the presence of an anodic peak at 0.98 V with a cathodic contribution at 0.52 V (Figure 3). The –OH groups from the anthocyanin adsorb to the electrode surface first, and the oxidation of this group then occurs at 0.98 V [43].
An oxidation potential of ca. 1 V is high enough to assure electronic transfer inside DSSCs once assembled through using such sensitizer in the photoelectrode.

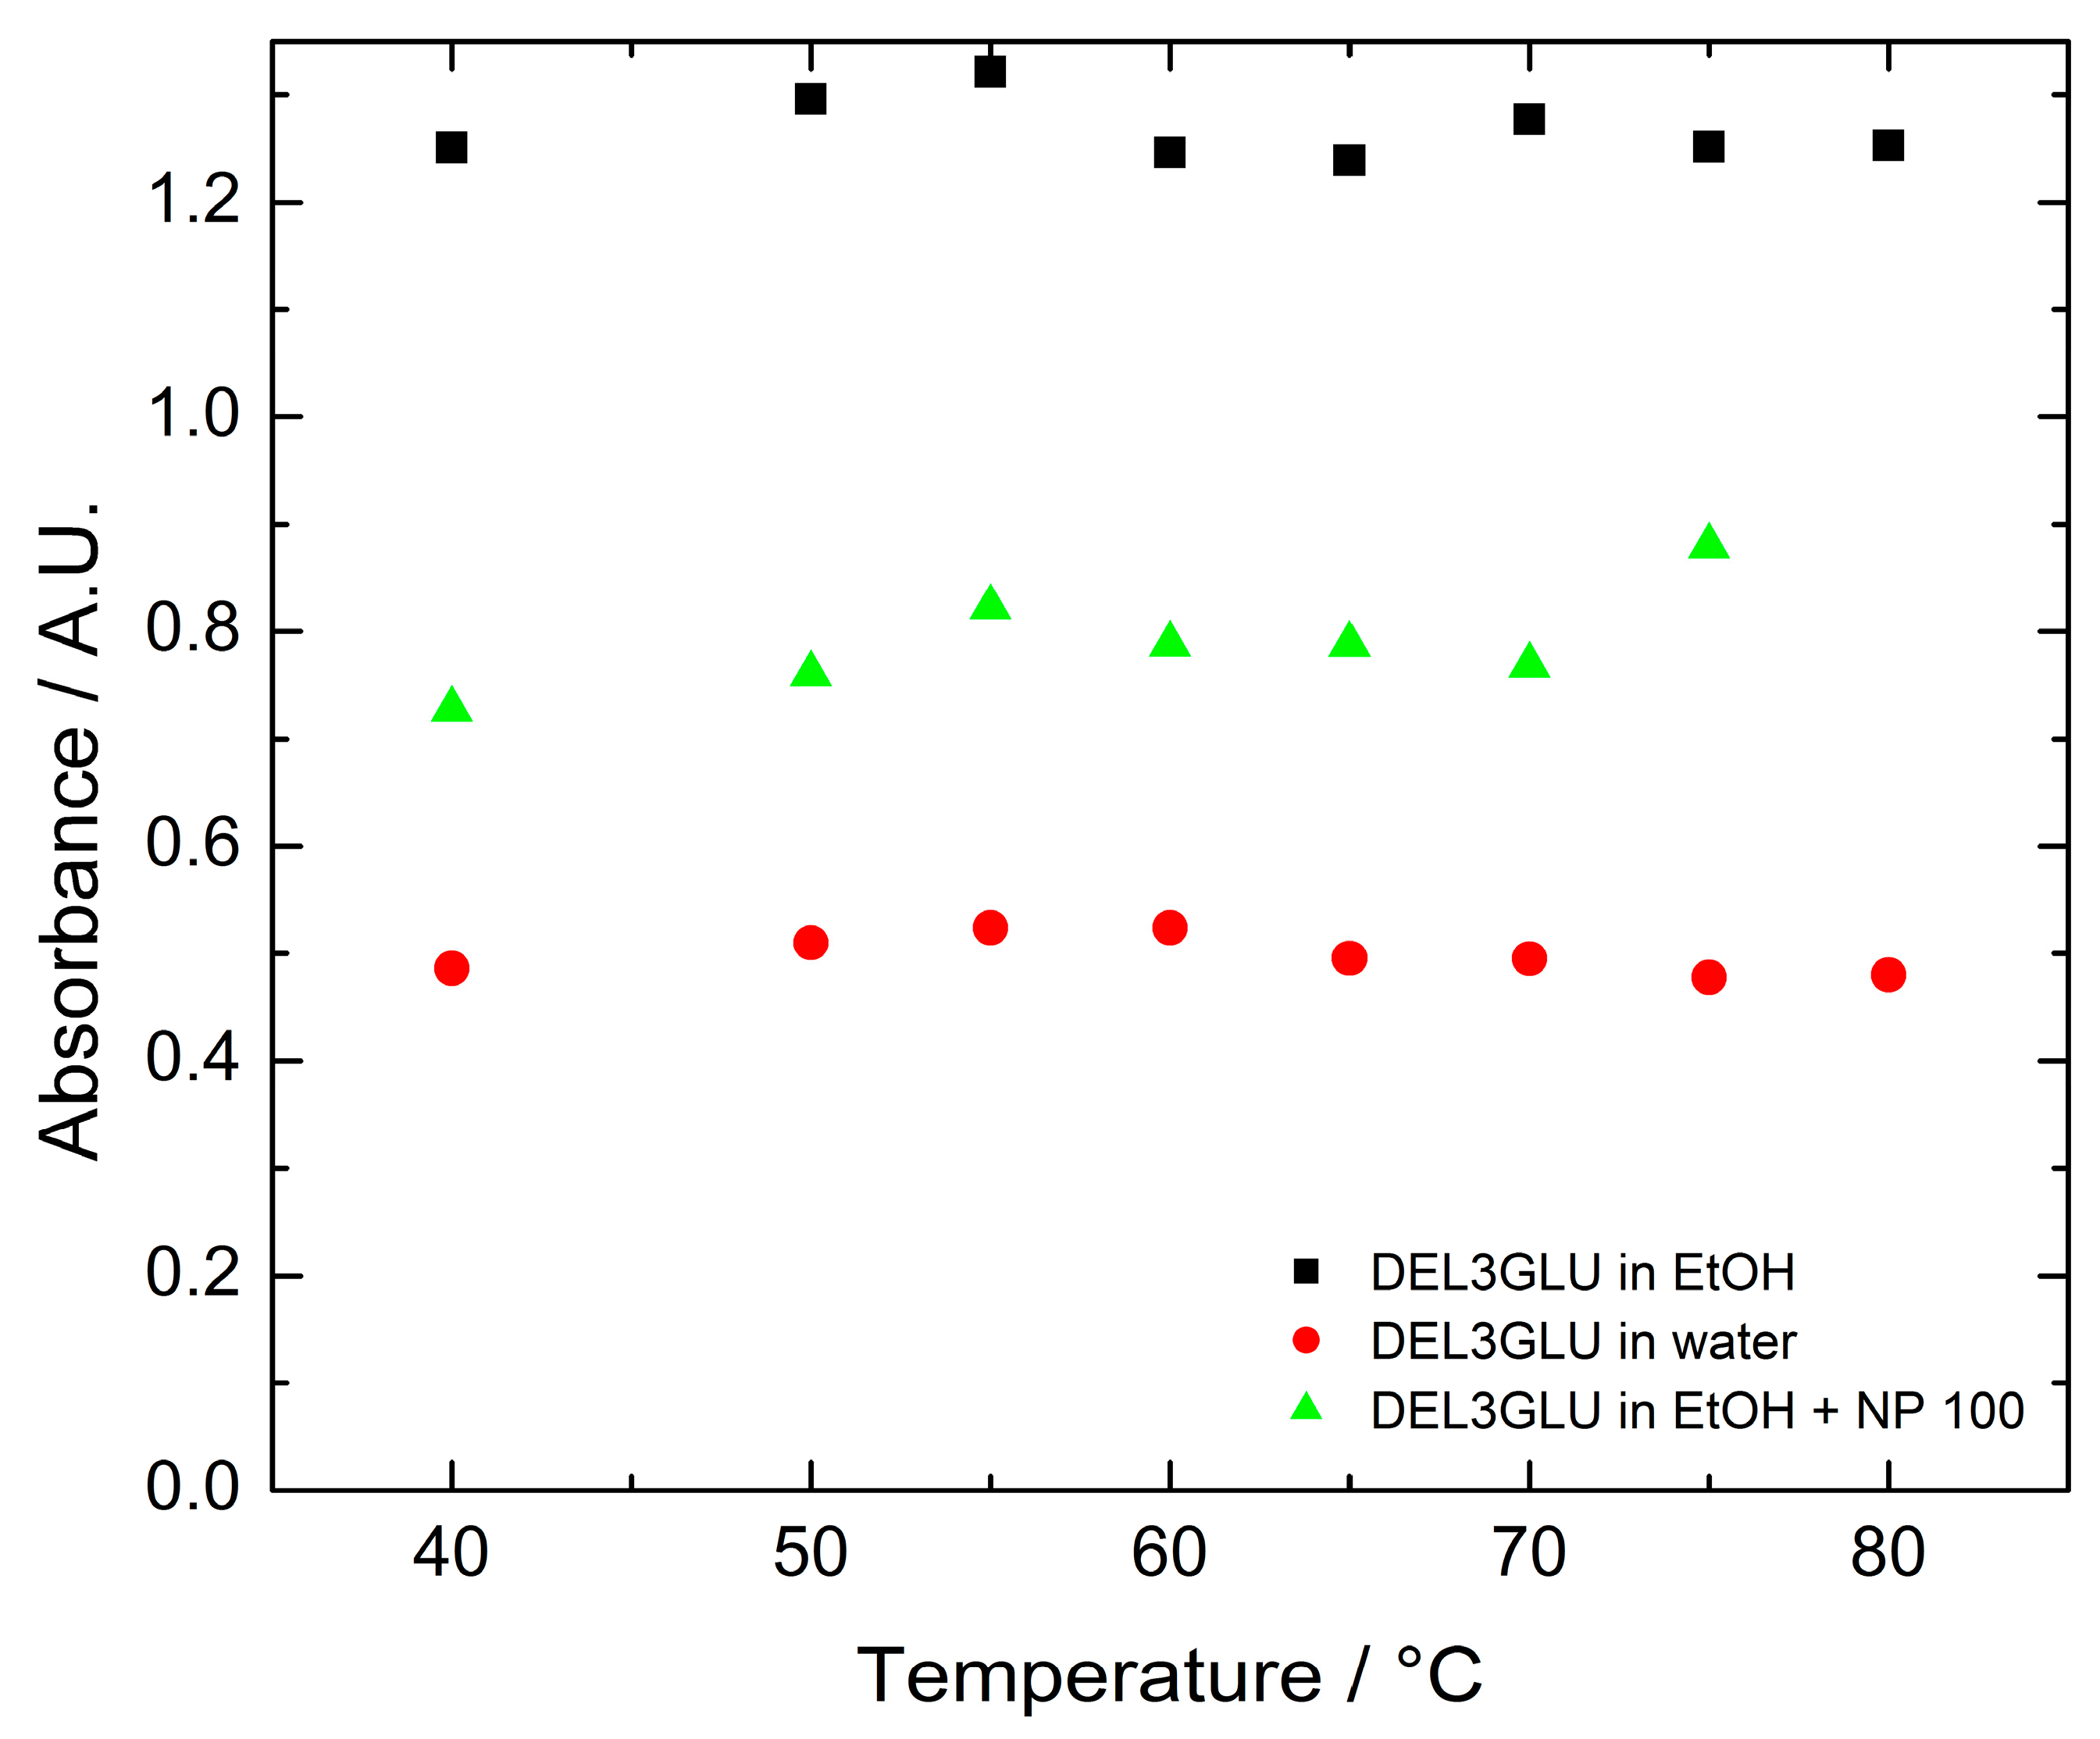
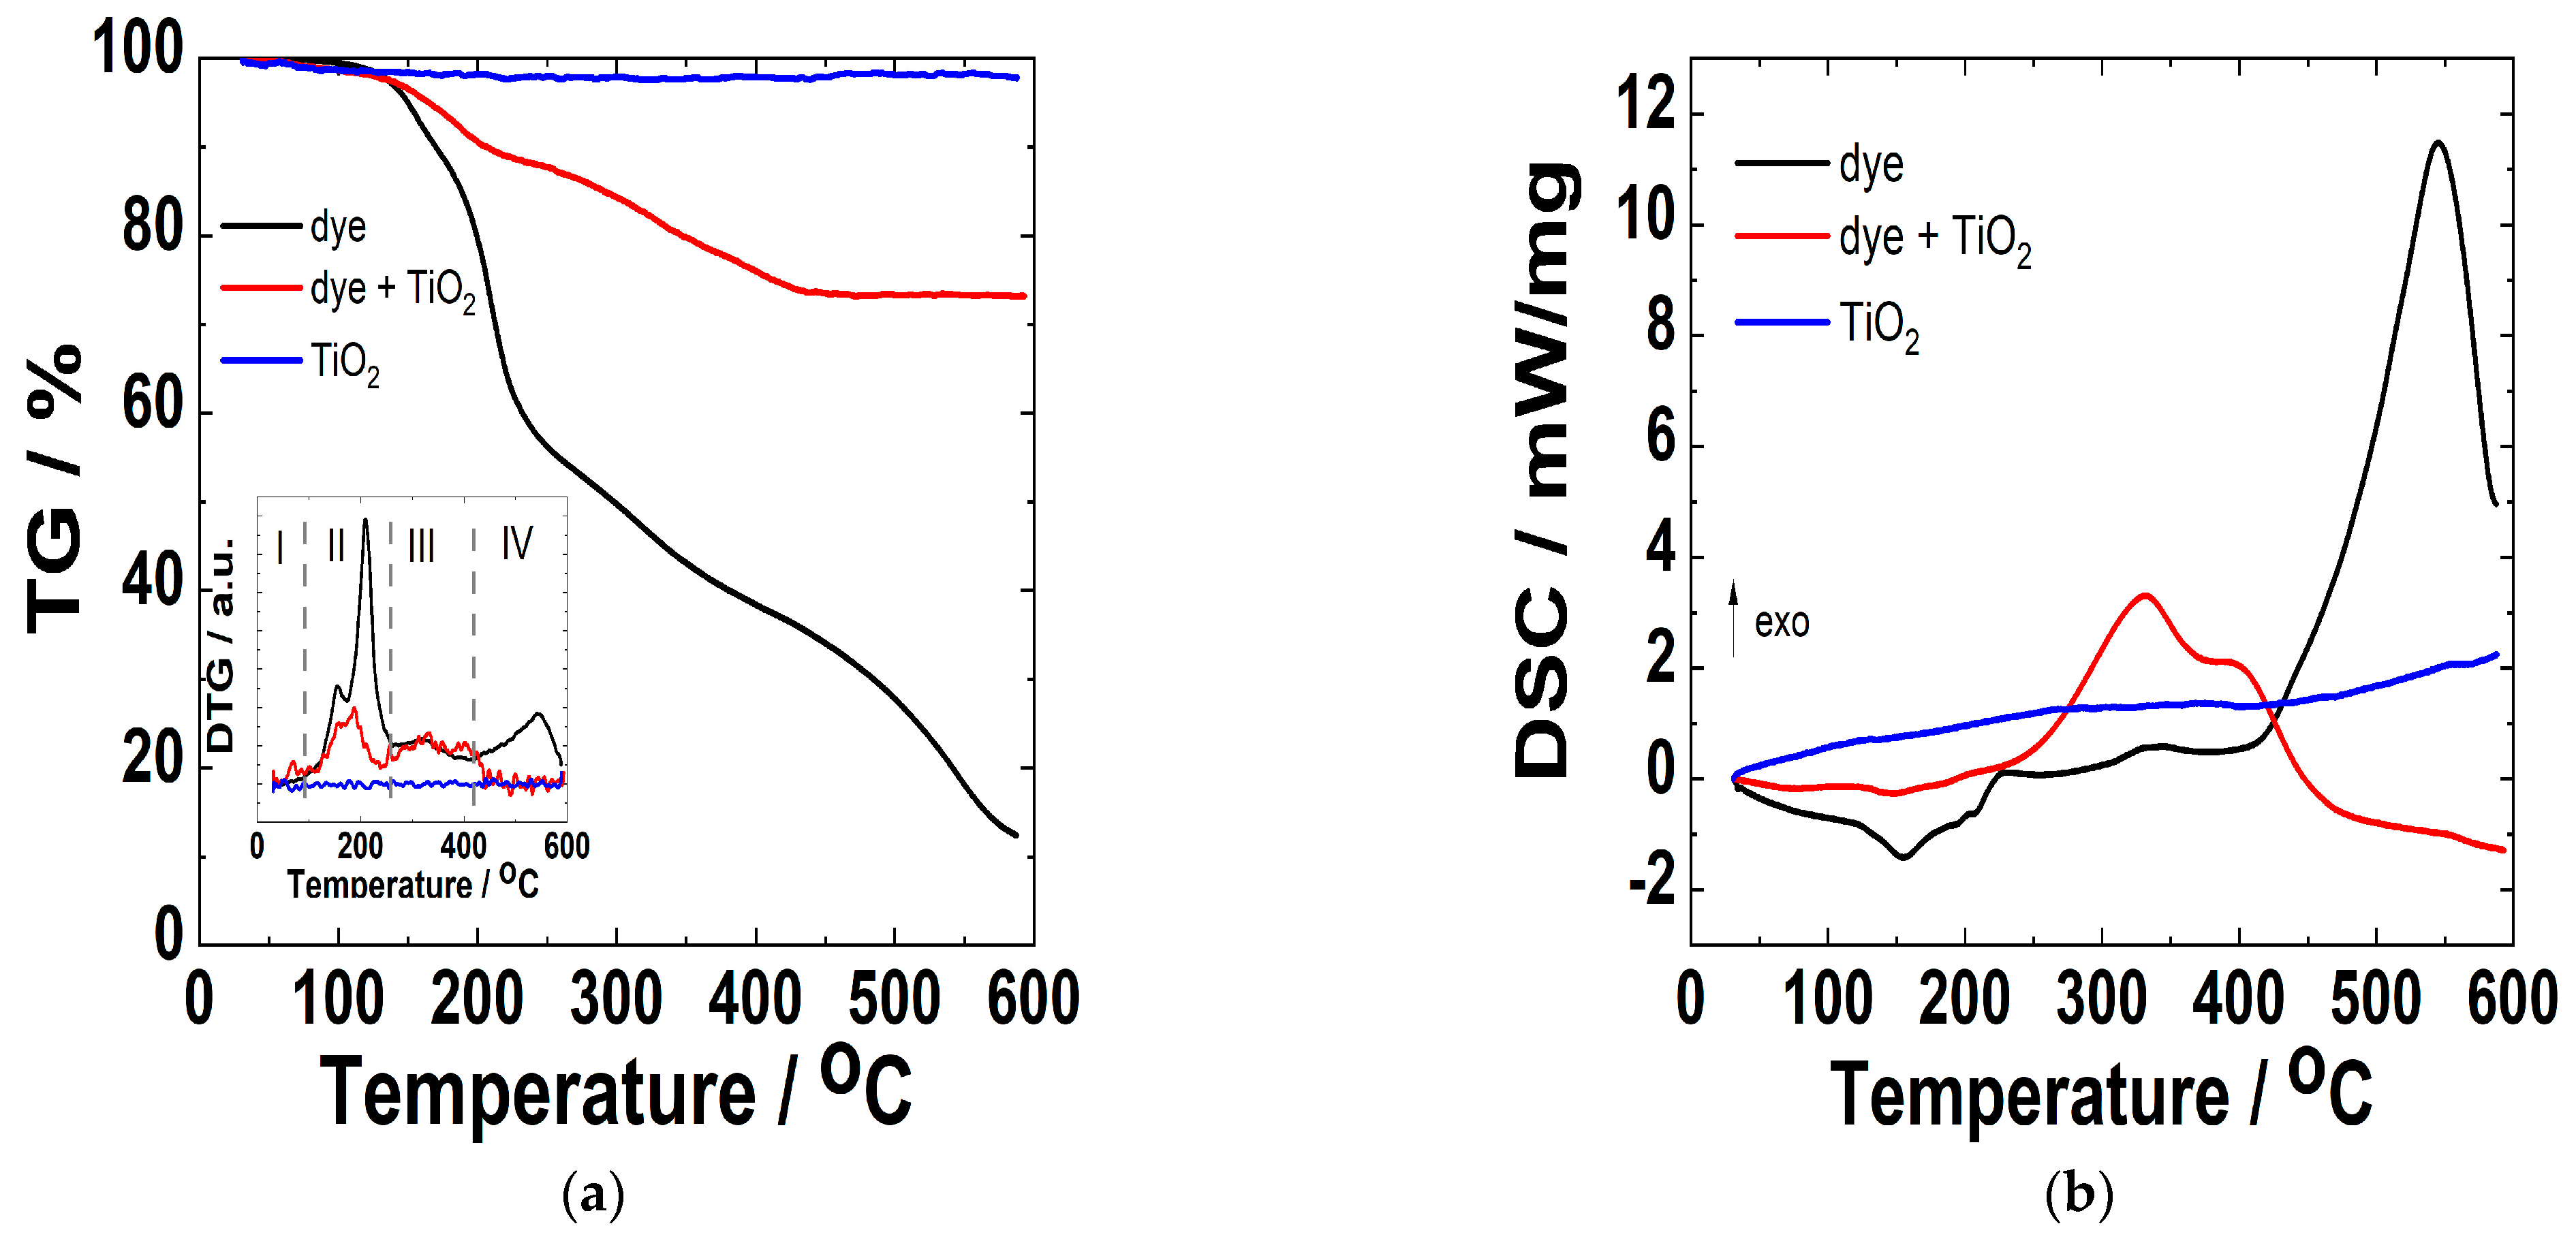
3.4. Thermal Stability

The stability of DEL3GLU extracted with ethanol and water was evaluated by heating the solution at temperatures within the range of 40 to 80 °C in the presence and absence of NP100 (Figure 4). For this reason, changes in the absorption values for the maxima were recorded.
In all evaluated cases, the stability of the solutions did not show significant changes. Only a slight increase was detected at 50–55 °C and could be explained due to the co-pigmentation effect. The flavylium cation is a planar chromophore. Under the influence of the temperature, these planar structures stack with other, similar ones, resulting in increased stability instead of decomposition due to a nucleophilic attack of water, increasing the color intensity and the absorbance values [59].

3.5. TG and DSC Evaluation of the Samples

To evaluate DEL3GLU and TiO2 adsorption, in addition to the stability of their union, TG and DSC techniques were carried out. Samples with TiO2 were obtained from FTO/TiO2 electrodes used to assemble the cells, and the others were used as is.
Figure 5 shows the TG and DSC thermograms. The TG signal’s derivative is displayed for a better visualization of the events. From 5a, it is possible to observe weight loss during the heat treatment. Each sampling event with mass percentages and associated temperature ranges is described in Table 2. Four events were observed in the thermal decomposition of the pigment: the first, between 0 °C and 100 °C, with a mass loss of 0.5% associated with the evaporation of the solvent (water); the second, which seems to be two overlapping events (one between 100 °C and 160 °C and the other between 160 °C and 250 °C), with a 43% mass loss; the third, between 250 °C and 400 °C, with a 17% mass loss; and the fourth event, between 400 °C and 600 °C, with a 25% mass loss. Therefore, there is a 85% mass loss associated with the thermal decomposition of the pigment. Regarding TiO2, it can be observed that there is no associated mass loss event in the range studied. While the DEL3GLU sample supported on TiO2 shows the same type of events as DEL3GLU alone, the second and fourth events, however, are lower, as is possible to observe in the derivative thermogravimetry (DTG) plot in the inset figure and in Table 2. From Figure 5b, it is possible to observe the DSC signal for the same samples. In the TiO2 sample, as in TG, no signal was observed. Meanwhile, for DEL3GLU it is possible to observe signals (exo and endo) in the same range of temperature indicated in the TG thermogram. In the range of 100–260 °C it is possible to distinguish a first endothermic and a second exothermic peak. In the fourth event it is possible to observe a bigger exothermic peak.
Considering the structure of delphinidin-3-glucoside as a starting compound, it is possible to postulate some decomposition path. Therefore, if we take into account that, in the second event, 43% of the mass is lost, this percentage of loss could be associated with the rupture of the glycosidic bond, resulting in aglycone, which has a very unstable structure, producing the opening of the oxygenated hetero-cycle and thus losing a compound derived from delphinidin. A similar decomposition was observed in anthocyanins from black soybean, where TG and high-performance liquid chromatography (HPLC) studies were able to associate the decomposition in the range of 100 to 400 °C of sugar with the cyanin-derived molecule and its decomposition. In the last event, a loss of 25% can be observed, which would correspond to the decomposition of sugar; however, this value is slightly lower than the theoretical value (35%) [60]. This difference may be due to the difficulty of determining each reaction’s start and end points since, as observed in the DTG in the range of 100 to 600 °C, there is an excellent overlapping of peaks, indicating the coexistence of decomposition reactions simultaneously. The prominent final exothermic peak observed in DSC could confirm the above, in addition to showing the difficulty in determining the start of the reaction [61,62].
Regarding the DEL3GLU supported on TiO2, the same behavior and similar temperature ranges can be observed. Due to the difficulty of precisely knowing the proportion of anthocyanin adsorbed onto TiO2, the observed variations in DSC and TG can be assigned to a mass effect.

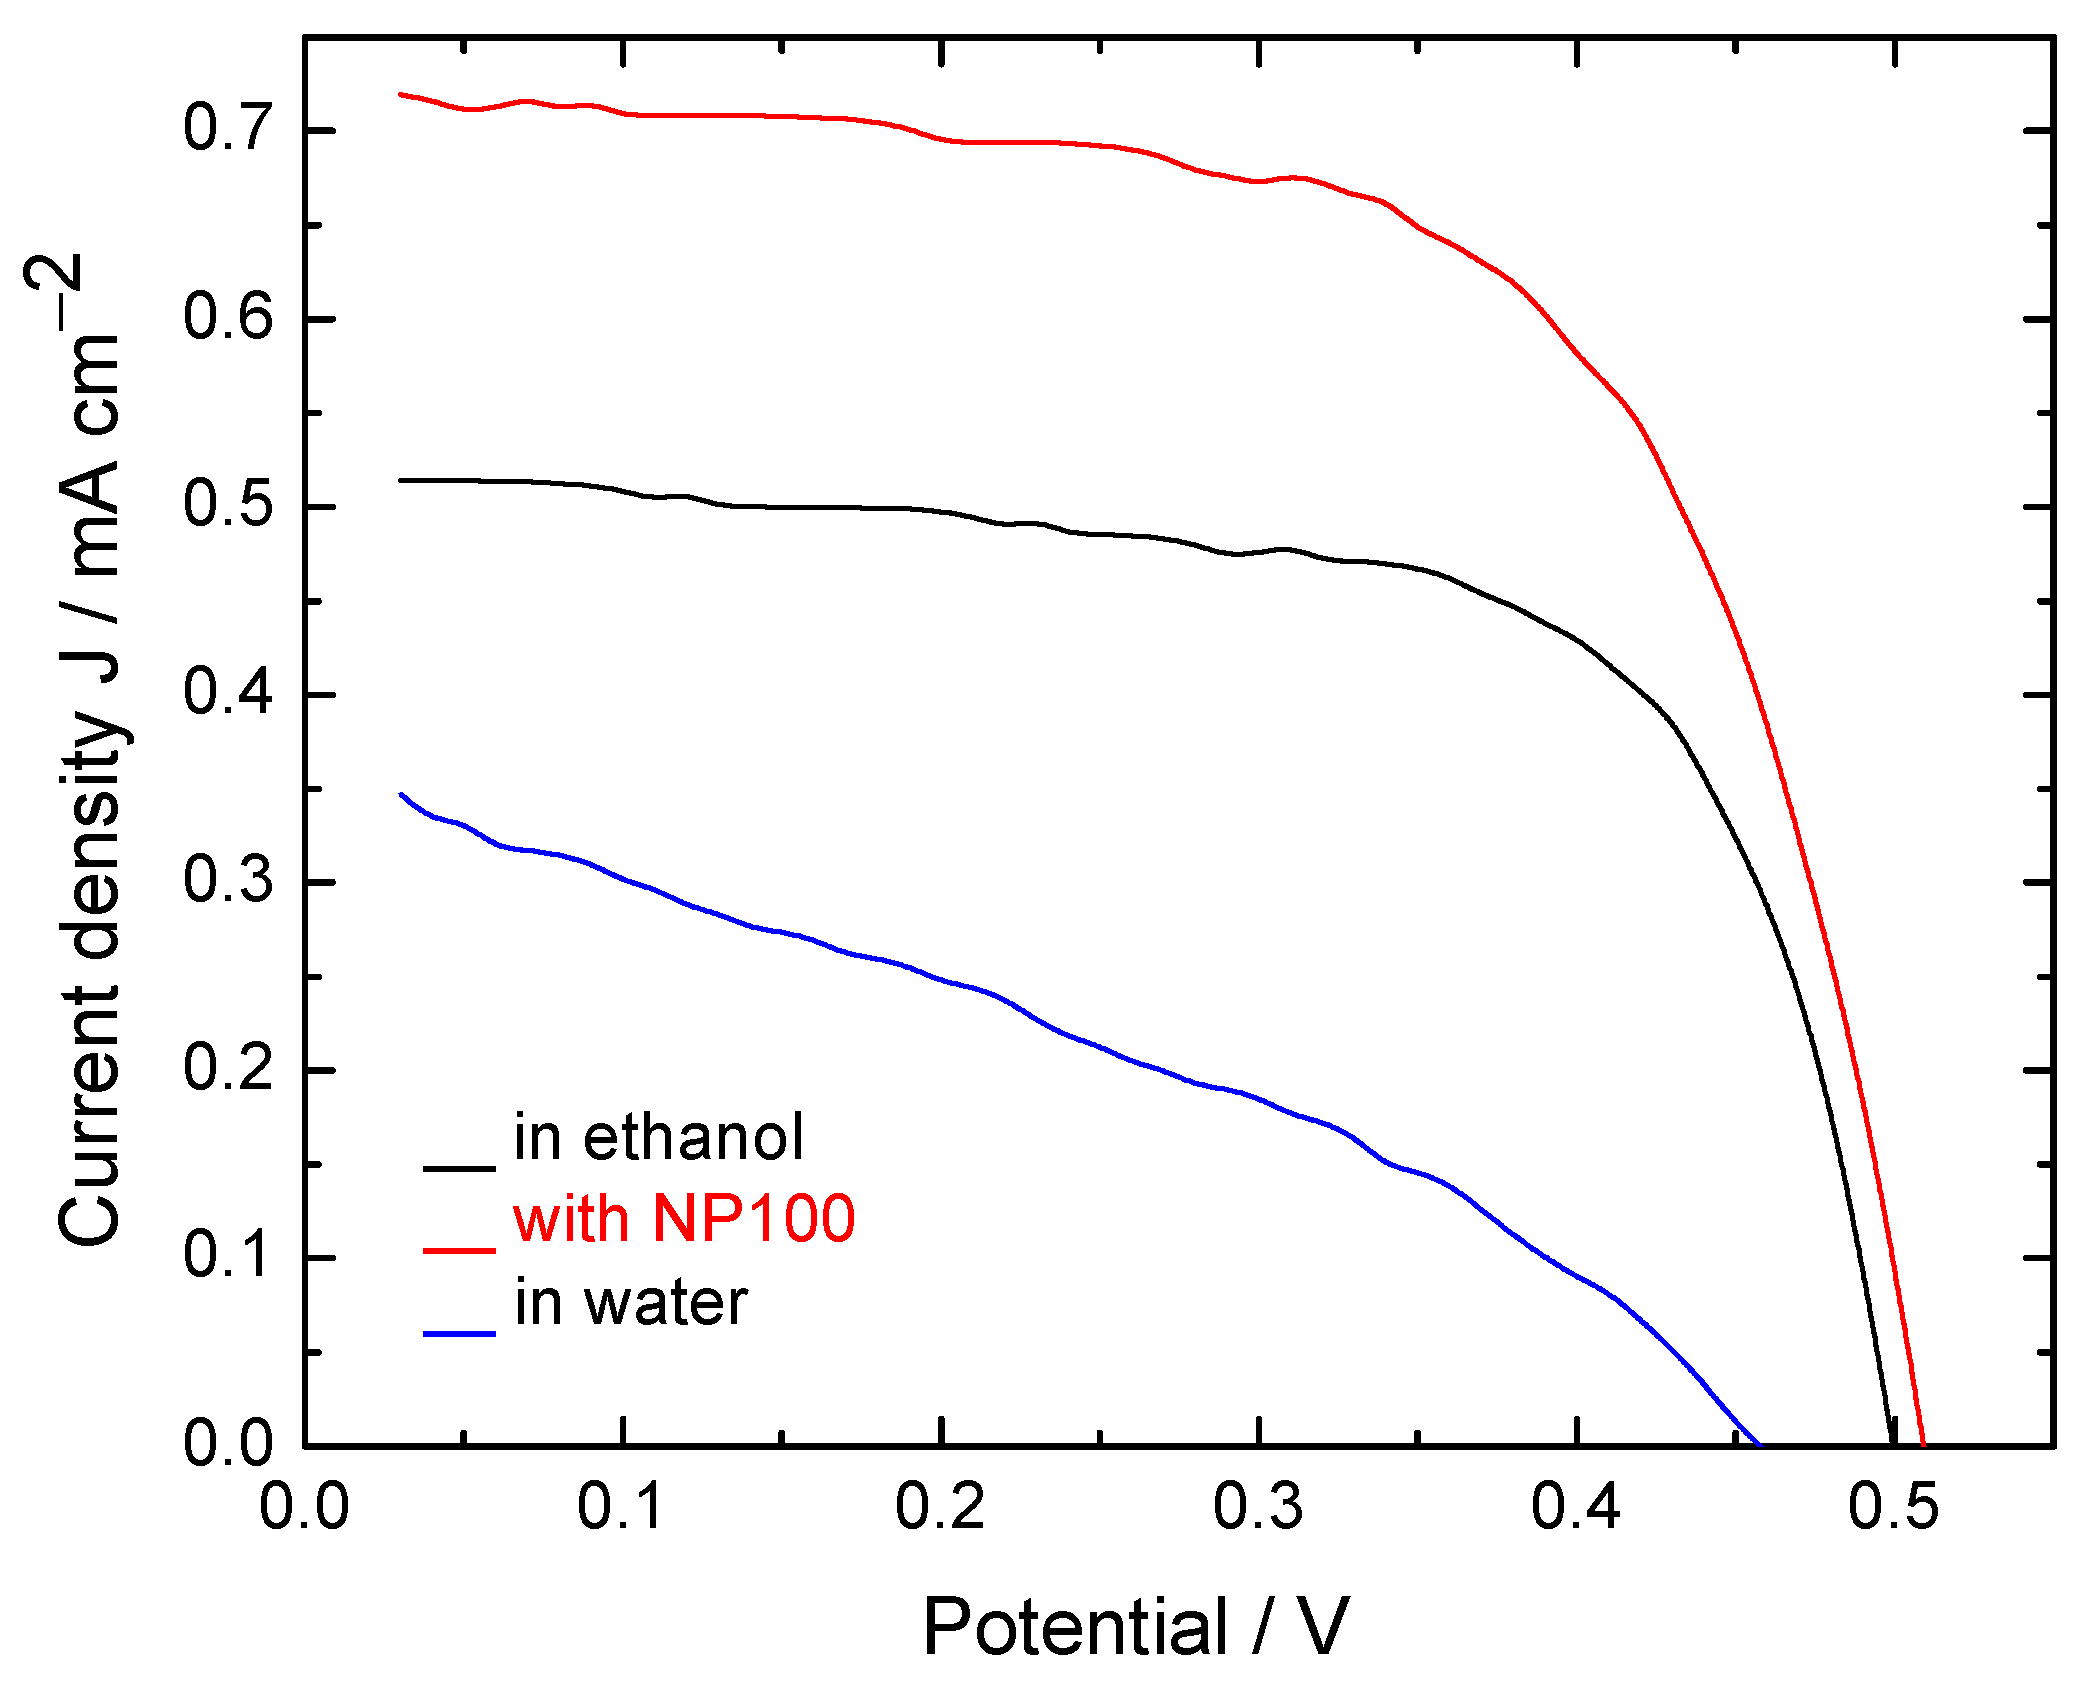
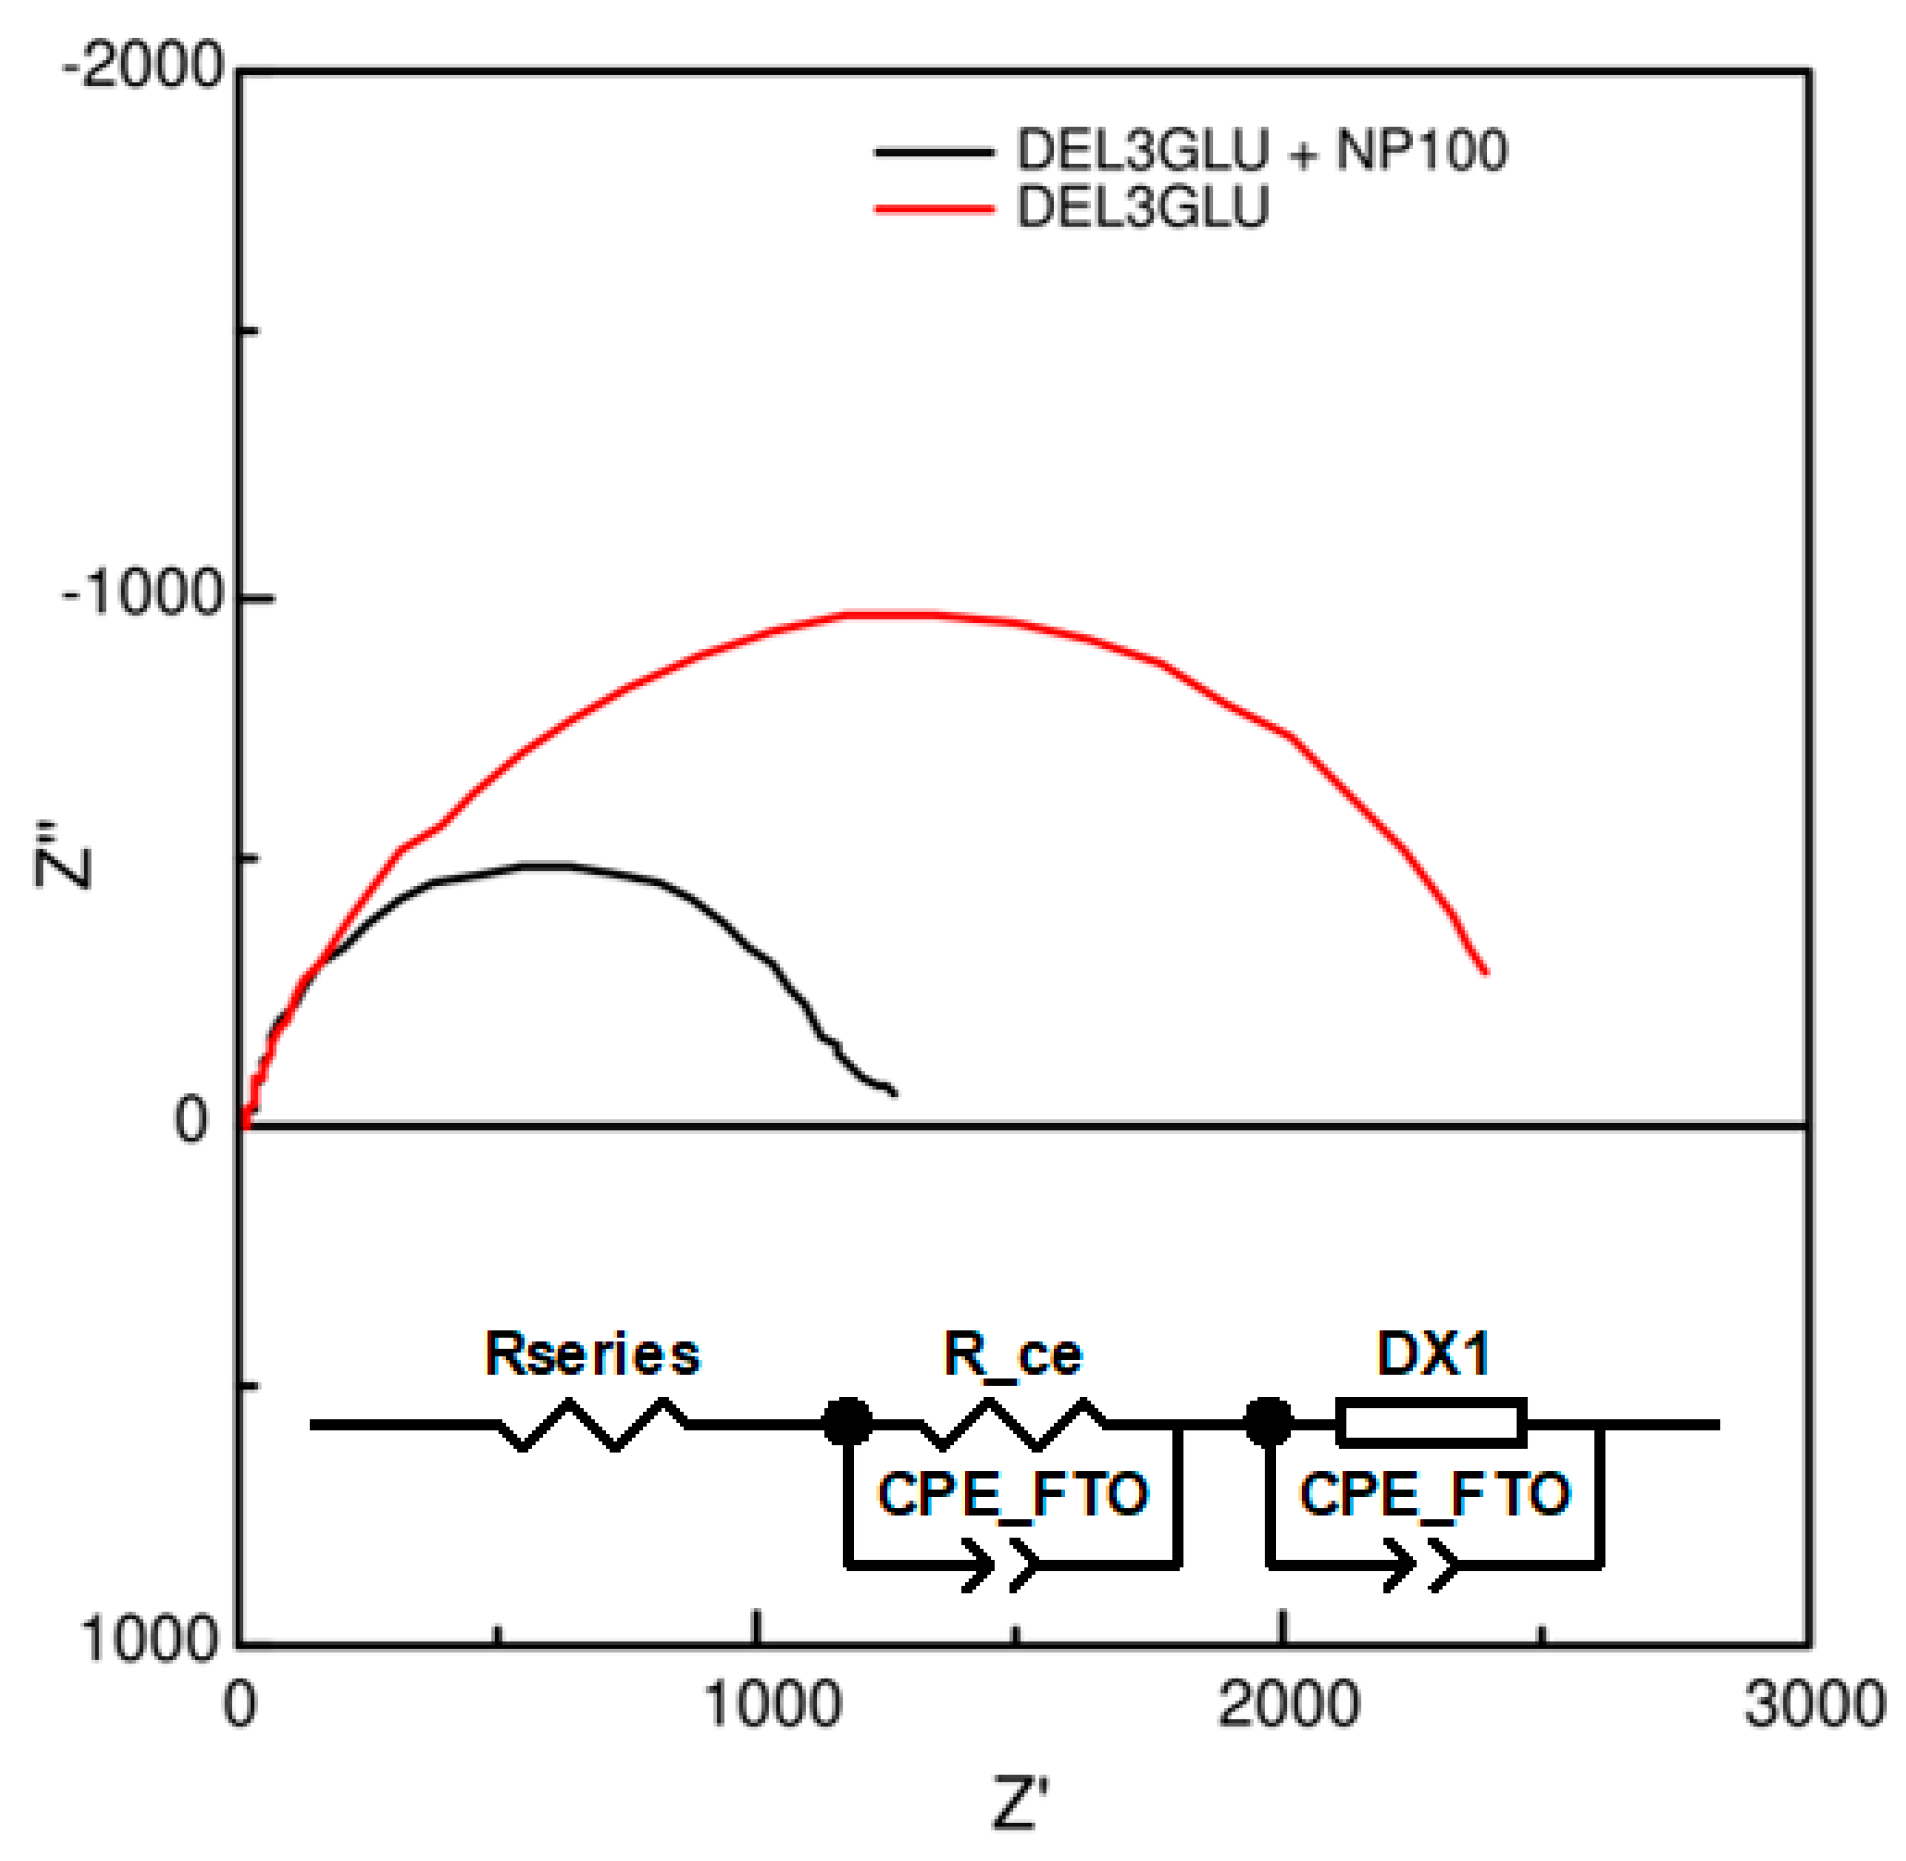
3.6. DSSC Characterization

Once built up, the cells were evaluated via the recording of their J vs. V profiles and use of EIS. The results depend on the sensitizers applied: DEL3GLU or co-mixed with silver nanoparticles (Table 3, Figure 6).
Figure 6 shows the current density profiles vs. the applied potential for DSSCs sensitized with different DEL3GLU extracts or after adding silver nanoparticles sequentially. The conversion efficiency is raised in the presence of NP100; thus, a relationship between surface coverage and electron exchange can be corroborated. It is meaningful to mention that DSSCs sensitized only in the presence of NP100 reached efficiency values of 0.013%. This being the case, co-adsorption interestingly increases the measured PCE values. The best efficiency is reached when the photoanode’s surface is fully covered (see an example of sensitization on Scheme 2).
Once the anthocyanins adsorb onto the FTO/TiO2 electrode, some surface defects will remain. Using silver nanoparticles as co-sensitizers covers the remaining bare spots on the FTO/TiO2 electrode and improves the electron transference from DEL3GLU to the semiconductor, increasing cell performance. Consequently, the current density of DSSCs is raised in the presence of NP100 [63].
More details about the electronic processes occurring at the DSSCs are obtained by applying EIS techniques (Figure 7). As previously reported, the impedance registers are fitted via the use of equivalent circuits integrated for several elements [64,65,66,67].
Some particular parameters are useful in understanding the calculated efficiencies (displayed in Table 4):
Rce, the resistance associated with the regeneration of I3 into I at the counter-electrode.
Rct, the charge transport resistance for the recombination of electrons at the TiO2/dye/electrolyte interfaces.
Rt, the electron transport resistance in the photoanode.
Γt, the time constant for the transport of the injected electrons that diffuse through the nanoparticle network. Calculated as Γt = Rt × Cµ (, the chemical capacitance at the TiO2/dye/electrolyte interface associated with the variation in the electron density and the displacement of the Fermi level).
Γrec, the recombination time that reflects the lifetime of an electron in the photoanode. Calculated as Γrec = Rct × Cµ.
Recombination implies a process of injecting electrons from the TiO2 into the electrolyte. Then, once generated, the electrons in the dye would follow an undesired path through the mesoporous titania towards the FTO/TiO2 interface.
High recombination times and time constants for transporting the injected electrons explain good performance efficiency.
For the analyzed samples, the electron transport times increased in the presence of the nanoparticles, affecting the cell’s performance [63,68,69]. Incorporating nanoparticles improves the surface coverage; the electron mobility increases, and the electron transfer increases.
The ratio between the Rct and Rt resistances helps in understanding efficiency values. In both cases (i.e., in the presence or absence of NP100), ratios are high; thus, when electrons are generated, they follow transference across the semiconductor instead of recombining with the electrolyte.
The resistance connected to iodide regeneration at the counter-electrode (Rce) must also be contemplated in order to explain the calculated η values. The adsorption of molecules onto the Pt surface increases the Rce values. In our case, cells assembled with silver nanoparticles displayed higher Rce values. Once NP100 are adsorbed to the counter-electrode, the area of the electrode increases, resulting in a higher surface extent available and necessary for the I3- transformation into iodide; however, electron conduction through silver is worse than that through platinum, increasing Rce.
In summary, anthocyanins, such as delphinidin-3-glucoside, fulfill the characteristics necessary for them to be utilized as sensitizers in DSSCs, in particular, joined to silver nanoparticles.

4. Conclusions

The adsorption of delphinidin-3-glucoside extracted from blueberries (Southern Highbush type) and silver rounded nanoparticles to FTO/TiO2 electrodes was proven from absorbance spectra recorded via the use of a reflection optic probe. FTIR measurements showed molecular interactions between the semiconductor and the delphinidin-3-glucoside through the phenolic -OH moieties of the anthocyanin. DSC and TG also confirmed the adsorption of anthocyanins to the semiconductor.
Additionally, cyclic voltametric measurements showed an anodic contribution at 0.98 V raised from the oxidation of -OH groups of the delphinidin-3-glucoside, enough to assure the electronic transfer inside DSSCs via the use of a sensitizer in the photoelectrode. Additionally, regarding its application as a light harvester in a device exposed to the sun and, therefore, its capacity to warm up, the stability of delphinidin-3-glucoside was evaluated by heating the solutions to 80 °C without any significant change.
Once assembled in DSSCs, the photoelectrodes sensitized with delphinidin or co-sensitized with nanoparticles showed high recombination times and time constants for transporting the injected electrons; however, power conversion efficiencies were higher in the presence of NP100, probably due to obtaining a better surface coverage.
The exposed results indicated the possibility of applying delphinidin-3-glucoside extracted from blueberries following a straightforward path as potential impregnation dyes in DSSCs, particularly in the presence of co-adsorbents, such as silver nanoparticles, offering a technological application of discarded and not commercialized fruits for countries where agricultural production provides an abundant origin of extraction.

Author Contributions

Conceptualization, methodology, supervision, formal analysis, preparation, and writing—original draft, review, and editing, M.F.C.; investigation, formal analysis, and writing—original draft, T.M.; formal analysis and writing—original draft, M.R.C. All authors have read and agreed to the published version of the manuscript.

Funding

This research received no external funding.

Institutional Review Board Statement

Not applicable.

Informed Consent Statement

Not applicable.

Data Availability Statement

Not applicable.

Acknowledgments

M.F.C. and M.R. are ANII (Agencia Nacional de Investigación e Innovación) and PEDECIBA (Programa de Desarrollo de las Ciencias Básicas) researchers.

Conflicts of Interest

The authors declare no conflict of interest.

References

  1. Bisquert, J.; Cahen, D.; Hodes, G.; Rühle, S.; Zaban, A. Physical Chemical Principles of Photovoltaic Conversion with Nanoparticulate, Mesoporous Dye-Sensitized Solar Cells. J. Phys. Chem. B 2004, 108, 8106–8118. [Google Scholar] [CrossRef]
  2. Muñoz-García, A.B.; Benesperi, I.; Boschloo, G.; Concepcion, J.J.; Delcamp, J.H.; Gibson, E.A.; Meyer, G.J.; Pavone, M.; Pettersson, H.; Hagfeldt, A.; et al. Dye-sensitized solar cells strike back. Chem. Soc. Rev. 2021, 50, 12450–12550. [Google Scholar] [CrossRef] [PubMed]
  3. Yella, A.; Lee, H.W.; Tsao, H.N.; Yi, C.; Chandiran, A.K.; Nazeeruddin, M.K.; Diau, E.W.G.; Yeh, C.Y.; Zakeeruddin, S.M.; Grätzel, M. Porphyrin-sensitized solar cells with cobalt (II/III)-based redox electrolyte exceed 12 percent efficiency. Science 2011, 334, 629–634. [Google Scholar] [CrossRef]
  4. Mahalingam, S.; Manap, A.; Lau, K.S.; Omar, A.; Chelvanathan, P.; Chia, C.H.; Amin, N.; Mathews, I.J.; Afandi, N.F.; Rahim, N.A. Mixture deposition method for graphene quantum dots-based dye-sensitized solar cell. Electrochim. Acta 2022, 404, 139732. [Google Scholar] [CrossRef]
  5. Mahalingam, S.; Nugroho, A.; Floresyona, D.; Lau, K.S.; Manap, A.; Chia, C.H.; Afandi, N. Bio and non bio materials based quasi solid state electrolytes in DSSC: A review. Int. J. Energy Res. 2022, 46, 5399–5422. [Google Scholar] [CrossRef]
  6. Mahalingam, S.; Manap, A.; Rabeya, R.; Lau, K.S.; Chia, C.H.; Abdullah, H.; Amin, N.; Chelvanathan, P. Electron transport of chemically treated graphene quantum dots-based dye-sensitized solar cells. Electrochim. Acta 2023, 439, 141667. [Google Scholar] [CrossRef]
  7. Syrrokostas, G.; Leftheriotis, G.; Yannopoulos, S.N. Lessons learned from 25 years of development of photoelectrochromic devices: A technical review. Renew. Sustain. Energy Rev. 2022, 162, 112462. [Google Scholar] [CrossRef]
  8. O'Regan, B.; Grätzel, M. A low-cost, high-efficiency solar cell based on dye-sensitized colloidal TiO2 films. Nature 1991, 353, 737–740. [Google Scholar] [CrossRef]
  9. Chang, H.; Wu, H.M.; Chen, T.L.; Huang, K.D.; Jwo, C.S.; Lo, Y.J. Dye-sensitized solar cell using natural dyes extracted from spinach and ipomoea. J. Alloys Compd. 2010, 495, 606–610. [Google Scholar] [CrossRef]
  10. Wang, X.-F.; Matsuda, A.; Koyama, Y.; Nagae, H.; Sasaki, S.; Tamiaki, H.; Wada, Y. Effects of plant carotenoid spacers on the performance of a dye-sensitized solar cell using a chlorophyll derivative: Enhancement of photocurrent determined by one electron-oxidation potential of each carotenoid. Chem. Phys. Lett. 2006, 423, 470–475. [Google Scholar] [CrossRef]
  11. Zhang, D.; Stojanovic, M.; Ren, Y.; Cao, Y.; Eickemeyer, F.T.; Socie, E.; Vlachopoulos, N.; Moser, J.-E.; Zakeeruddin, S.M.; Hagfeldt, A.; et al. A molecular photosensitizer achieves a Voc of 1.24 V enabling highly efficient and stable dye-sensitized solar cells with copper(II/I)-based electrolyte. Nat. Commun. 2021, 12, 1777. [Google Scholar] [CrossRef] [PubMed]
  12. Ghann, W.; Kang, H.; Sheikh, T.; Yadav, S.; Chavez-Gil, T.; Nesbitt, F.; Uddin, J. Fabrication, Optimization and Characterization of Natural Dye Sensitized Solar Cell. Sci. Rep. 2017, 7, 41470. [Google Scholar] [CrossRef] [PubMed]
  13. Calogero, G.; Bartolotta, A.; DiMarco, G.; Di Carlo, A.; Bonaccorso, F. Vegetable-based dye-sensitized solar cells. Chem. Soc. Rev. 2015, 44, 3244–3294. [Google Scholar] [CrossRef] [PubMed]
  14. Zhou, H.; Wu, L.; Gao, Y.; Ma, T. Dye-sensitized solar cells using 20 natural dyes as sensitizers. J. Photochem. Photobiol. A Chem. 2011, 219, 188–194. [Google Scholar] [CrossRef]
  15. Singh, S.; Maurya, I.C.; Sharma, S.; Kushwaha, S.P.S.; Srivastava, P.; Bahadur, L. Application of new natural dyes extracted from Nasturtium flowers (Tropaeolum majus) as photosensitizer in dye-sensitized solar cells. Optik 2021, 243, 167331. [Google Scholar] [CrossRef]
  16. Concepcion, R.; Alejandrino, J.; Mendigoria, C.H.; Dadios, E.; Bandala, A.; Sybingco, E.; Vicerra, R.R. Lactuca sativa leaf extract concentration optimization using evolutionary strategy as photosensitizer for TiO2-filmed Grätzel cell. Optik 2021, 242, 166931. [Google Scholar] [CrossRef]
  17. Hernández-Martínez, A.R.; Estevez, M.; Vargas, S.; Quintanilla, F.; Rodríguez, R. Natural Pigment-Based Dye-Sensitized Solar Cells. J. Appl. Res. Technol. 2012, 38, 38–47. [Google Scholar] [CrossRef]
  18. Bekele, E.T.; Sintayehu, Y.D. Recent Progress, Advancements, and Efficiency Improvement Techniques of Natural Plant Pigment-Based Photosensitizers for Dye-Sensitized Solar Cells. J. Nanomat. 2022, 2022, 1024100. [Google Scholar] [CrossRef]
  19. Pinto, A.L.; Cruz, H.; Oliveira, J.; Araújo, P.; Cruz, L.; Gomes, V.; Silva, C.P.; Silva, G.T.M.; Mateus, T.; Calogero, G.; et al. Dye-sensitized solar cells based on dimethylamino-π-bridgepyrano anthocyanin dyes. Sol. Energy 2020, 206, 188–199. [Google Scholar] [CrossRef]
  20. Barichello, J.; Mariani, P.; Matteocci, F.; Vesce, L.; Reale, A.; Di Carlo, A.; Lanza, M.; Di Marco, G.; Polizzi, S.; Calogero, G. The Golden Fig: A Plasmonic Effect Study of Organic-Based Solar Cells. Nanomaterials 2022, 12, 267. [Google Scholar] [CrossRef]
  21. Golshan, M.; Osfouri, S.; Azin, R.; Jalali, T.; Moheimani, N.R. Co-sensitization of natural and low-cost dyes for efficient panchromatic light-harvesting using dye-sensitized solar cells. J. Photochem. Photobiol. A Chem. 2021, 417, 113345–113356. [Google Scholar] [CrossRef]
  22. Orona-Navar, A.; Aguilar-Hernandez, I.; Nigam, K.D.P.; Cerdan-Pasar, A.; Ornelas-Soto, N. Alternative sources of natural pigments for dye-sensitized solar cells: Algae, cyanobacteria, bacteria, archaea and fungi. J. Biotechnol. 2021, 332, 29–53. [Google Scholar] [CrossRef] [PubMed]
  23. Amogne, N.Y.; Ayele, D.W.; Tsigie, Y.A. Recent advances in anthocyanin dyes extracted from plants for dye sensitized solar cell. Mater. Renew. Sustain. Energy 2020, 9, 23–39. [Google Scholar] [CrossRef]
  24. Leite, A.M.B.; da Cunha, H.O.; Rodrigues, J.A.F.C.R.R.; Babu, S.; de Barros, A.L.F. Construction and characterization of organic photovoltaic cells sensitized by Chrysanthemum based natural dye. Spectrochim. Acta A Mol. Biomol. Spectrosc. 2023, 284, 121780–121788. [Google Scholar] [CrossRef]
  25. Prakash, P.; Balasundaram, J.; Al-Enizi, A.M.; Ubaidullah, M.; Pandit, B. Effect of photovoltaic performance of plant-based cocktail DSSCs and adsorption of nano TiO2 onto the solvent-influenced dye sensitizers. Opt. Mater. 2022, 133, 113031–113040. [Google Scholar] [CrossRef]
  26. Bist, A.; Chatterjee, S. Review on Efficiency Enhancement Using Natural Extract Mediated Dye-Sensitized Solar Cell for Sustainable Photovoltaics. Energy Technol. 2021, 9, 2001058–2001077. [Google Scholar] [CrossRef]
  27. Cho, K.-C.; Chang, H.; Chen, C.-H.; Kao, M.-J.; Lai, X.-R. A Study of Mixed Vegetable Dyes with Different Extraction Concentrations for Use as a Sensitizer for Dye-Sensitized Solar Cells. Int. J. Photoenergy 2014, 2014, 492747. [Google Scholar] [CrossRef]
  28. Pereira, A.G.; Fraga-Corral, M.; Garcia-Oliveira, P.; Lourenço-Lopes, C.; Carpena, M.; Prieto, M.A.; Simal-Gandara, J. The Use of Invasive Algae Species as a Source of Secondary Metabolites and Biological Activities: Spain as Case-Study. Mar. Drugs 2021, 19, 178. [Google Scholar] [CrossRef]
  29. Milledge, J.; Nielsen, B.; Bailey, D. High-value products from macroalgae: The potential uses of the invasive brown seaweed, Sargassum muticum. Rev. Environ. Sci. Bio/Technol. 2016, 15, 67–88. [Google Scholar] [CrossRef]
  30. Sankaranarayanan, S.; Kathiravan, I.; Balasundaram, J. An analysis of the dye-sensitized solar cells fabricated with the dyes extracted from the leaves and flowers of Amaranthus cruentus. Environ. Sci. Pollut. Res. 2022, 29, 44271–44281. [Google Scholar] [CrossRef]
  31. Vardan, M.K.; Garg, S. Performance of Dye-Sensitized Solar Cell using Hamelia Patens leaves as natural dye. IOP Conf. Ser. Mater. Sci. Eng. 2022, 1248, 012105. [Google Scholar] [CrossRef]
  32. Parisi, M.L.; Sinicropi, A.; Basosi, R. Life cycle assessment of Graetzel-type cell production for non conventional photovoltaics from novel organic dyes. Int. J. Heat Technol. 2011, 29, 161. [Google Scholar]
  33. Shanmugam, V.; Manoharan, S.; Sharafali, A.; Anandan, S.; Murugan, R. Green grasses as light harvesters in dye sensitized solar cells. Spectrochim. Acta A Mol. Biomol. Spectros. 2015, 135, 947–952. [Google Scholar] [CrossRef] [PubMed]
  34. Lim, A.; Haji-Manaf, N.; Tennakoon, K.; Chandrakanthi, R.L.; Lim, L.B.; Bandara, J.M.; Ekanayake, P. Higher Performance of DSSC with Dyes from Cladophora sp. as Mixed Cosensitizer through Synergistic Effect. J. Biophys. 2015, 2015, 510467. [Google Scholar] [CrossRef] [PubMed]
  35. Shanmugapriya, T.; Balavijayalakshmi, J. Efficiency Studies of Galinsoga Parviflora Pigments as a Sensitizer in Pt Free Graphene Oxide/Nickel Oxide Counter Electrode: Dye Sensitized Solar Cell Applications. J. Clust. Sci. 2021, 32, 1277–1288. [Google Scholar] [CrossRef]
  36. Mariotti, B.N.; Gerbaldi, C.; Bonomo, M.; Bella, F.; Fagiolari, L.; Barbero, N.; Barolo, C. Recent advances in eco-friendly and cost-effective materials towards sustainable dye-sensitized solar cells. Green Chem. 2020, 22, 7168–7218. [Google Scholar] [CrossRef]
  37. Parisi, M.L.; Maranghi, S.; Basosi, R. The evolution of the dye sensitized solar cells from Grätzel prototype to up-scaled solar applications: A life cycle assessment approach. Renew. Sustain. Energy Rev. 2014, 39, 124–138. [Google Scholar] [CrossRef]
  38. Ursu, D.; Vajda, M.; Miclau, M. Highly efficient dye-sensitized solar cells for wavelength-selective greenhouse: A promising agrivoltaic system. Int. J. Energy Res. 2022, 46, 18550–18561. [Google Scholar] [CrossRef]
  39. Dissanayake, A.K.L.; Kumari, J.M.K.; Senadeera, G.K.R.; Thotawatthage, C.A. Efficiency enhancement in plasmonic dye-sensitized solar cells with TiO2 photoanodes incorporating gold and silver nanoparticles. J. Appl. Electrochem. 2016, 46, 47–58. [Google Scholar] [CrossRef]
  40. Cerdá, M.F.; Botasini, S. Co-sensitized cells from Antarctic resources using Ag nanoparticles. Surf. Interface Anal. 2020, 52, 980–984. [Google Scholar] [CrossRef]
  41. Saravanan, S.; Kato, R.; Balamurugan, M.; Kaushik, S.; Soga, T. Efficiency improvement in dye sensitized solar cells by the plasmonic effect of green synthesized silver nanoparticles. J. Sci. Adv. Mater. Devices 2017, 2, 418–424. [Google Scholar] [CrossRef]
  42. Lucioli, S.; Di Bari, C.; Forni, C.; Di Carlo, A.; Barrajón-Catalán, E.; Micol, V.; Nota, P.; Teoli, F.; Matteocci, F.; Frattarelli, A.; et al. Anthocyanic pigments from elicited in vitro grown shoot cultures of Vaccinium corymbosum L., cv. Brigitta Blue, as photosensitizer in natural dye-sensitized solar cells (NDSSC). J. Photochem. Photobiol. B Biol. 2018, 188, 69–76. [Google Scholar] [CrossRef] [PubMed]
  43. Enciso, P.; Decoppet, J.D.; Grätzel, M.; Wörner, M.; Cabrerizo, F.M.; Cerdá, M.F. A cockspur for the DSS cells: Erythrina crista-galli sensitizers. Spectrochim. Acta A Mol. Biomol. Spectros. 2017, 176, 91–98. [Google Scholar] [CrossRef] [PubMed]
  44. Calogero, G.; Di Marco, G. Red Sicilian orange and purple eggplant fruits as natural sensitizers for dye-sensitized solar cells. Sol. Energy Mater Sol. Cells 2008, 92, 1341–1346. [Google Scholar] [CrossRef]
  45. Pinto, A.L.; Oliveira, J.; Araújo, P.; Calogero, G.; de Freitas, V.; Pina, F.; Parola, A.J.; Lima, J.C. Study of the multi-equilibria of red wine colorants pyranoanthocyanins and evaluation of their potential in dye-sensitized solar cells. Sol. Energy 2019, 191, 100–108. [Google Scholar] [CrossRef]
  46. Calogero, G.; Citro, I.; Crupi, C.; Carini, G.; Arigò, D.; Spinella, G.; Bartolotta, A.; Di Marco, G. Absorption spectra, thermal analysis, photoelectrochemical characterization and stability test of vegetable-based dye-sensitized solar cells. Opt. Mater. 2019, 88, 24–29. [Google Scholar] [CrossRef]
  47. Teoli, F.; Lucioli, S.; Nota, P.; Frattarelli, A.; Matteocci, F.; Di Carlo, A.; Caboni, E.; Forni, C. Role of pH and pigment concentration for natural dye-sensitized solar cells treated with anthocyanin extracts of common fruits. J. Photochem. Photobiol. A Chem. 2016, 316, 24–30. [Google Scholar] [CrossRef]
  48. González Steffano, M.; Alvarez, E.; Sosa, P.; Vázquez, C.; Cerdá, M.F. Pitanga anthocyanins as sensitizers for DSSC. Innotec 2022, 23, e584. [Google Scholar] [CrossRef]
  49. Santiago, M.C.P.d.A.; Gouvêa, A.C.M.S.; Godoy, R.L.d.O.; Borguini, R.G.; Pacheco, S.; Nogueira, R.I.; Nascimento, L.d.S.d.M.; Freitas, S.P. Analytical standards production for the analysis of pomegranate anthocyanins by HPLC. Braz. J. Food Technol. 2014, 17, 51–57. [Google Scholar] [CrossRef]
  50. Kähkönen, M.P.; Heinämäki, J.; Ollilainen, V.; Heinonen, M. Berry anthocyanins: Isolation, identification and antioxidant activities. J. Sci. Food Agric. 2003, 83, 1403–1411. [Google Scholar] [CrossRef]
  51. Yazie, N.; Ayele, D.; Woldu, A. Natural dye as Light-Harvesting pigments for Quasi-Solid-State Dye-Sensitized solar cells. Mater. Renew. Sustain. Energy 2016, 5, 13. [Google Scholar] [CrossRef]
  52. Escobar, M.A.M.; Jaramillo, F. Thermally and UV Stable Natural Dyes with Potential Use in Efficient Photoelectrochemical Devices. J. Renew. Mater. 2015, 3, 302–317. [Google Scholar] [CrossRef]
  53. Abdel-Aal, E.-S.M.; Hucl, P. A Rapid Method for Quantifying Total Anthocyanins in Blue Aleurone and Purple Pericarp Wheats. Cereal Chem. 1999, 76, 350–354. [Google Scholar] [CrossRef]
  54. Welch, C.R.; Wu, Q.; Simon, J.E. Recent Advances in Anthocyanin Analysis and Characterization. Curr. Anal. Chem. 2008, 4, 75–101. [Google Scholar] [CrossRef] [PubMed]
  55. Bastús, N.G.; Merkoçi, F.; Piella, J.; Puntes, V. Synthesis of Highly Monodisperse Citrate-Stabilized Silver Nanoparticles of up to 200 nm: Kinetic Control and Catalytic Properties. Chem. Mater. 2014, 26, 2836–2846. [Google Scholar] [CrossRef]
  56. Agatonovic-Kustrin, S.; Morton, D.W.; Yusof, A.P.M. The Use of Fourier Transform Infrared (FTIR) Spectroscopy and Artificial Neural Networks (ANNs) to Assess Wine Quality. Mod. Chem. Appl. 2013, 1, 4. [Google Scholar] [CrossRef]
  57. Favaro, L.; Balcão, V.; Rocha, L.; Silva, E.; Oliveira, J., Jr.; Vila, M.; Tubino, M. Physicochemical Characterization of a Crude Anthocyanin Extract from the Fruits of Jussara (Euterpe edulis Martius): Potential for Food and Pharmaceutical Applications. J. Braz. Chem. Soc. 2018, 29, 2072–2088. [Google Scholar] [CrossRef]
  58. Bu, C.; Zhang, Q.; Zeng, J.; Cao, X.; Hao, Z.; Qiao, D.; Xu, H.; Cao, Y. Identification of novel anthocyanins synthesis pathway from fungus, Aspergillus sydowii H-1. BMC Genomics 2020, 21, 29. [Google Scholar] [CrossRef]
  59. Horbowicz, M.; Kosson, R.; Grzesiuk, A.; Dębski, H. Anthocyanins of Fruits and Vegetables—Their Occurrence, Analysis and Role in Human Nutrition. J. Fruit Ornam. Plant Res. 2008, 68, 5–22. [Google Scholar] [CrossRef]
  60. Wang, D.; Ma, Y.; Zhang, C.; Zhao, X. Thermal characterization of the anthocyanins from black soybean (Glycine max L.) exposed to thermogravimetry. LWT—Food Sci. Technol. 2014, 55, 645–649. [Google Scholar] [CrossRef]
  61. Silva Dos Passos, A.P.; Madrona, G.S.; Marcolino, V.A.; Baesso, M.L.; Matioli, G. The Use of Thermal Analysis and Photoacoustic Spectroscopy in the Evaluation of Maltodextrin Microencapsulation of Anthocyanins from Juçara Palm Fruit (Euterpe edulis Mart.) and Their Application in Food. Food Technol. Biotechnol. 2015, 53, 385–396. [Google Scholar] [CrossRef] [PubMed]
  62. Osorio, C.; Acevedo, B.; Hillebrand, S.; Carriazo, J.; Winterhalter, P.; Morales, A.L. Microencapsulation by Spray-Drying of Anthocyanin Pigments from Corozo (Bactris guineensis) Fruit. J. Agric. Food Chem. 2010, 58, 6977–6985. [Google Scholar] [CrossRef] [PubMed]
  63. Borbon, S.; Lugo, S.; Pourjafari, D.; Pineda Aguilar, N.; Oskam, G.; Lopez, I. Open-Circuit Voltage (VOC) Enhancement in TiO2-Based DSSCs: Incorporation of ZnO Nanoflowers and Au Nanoparticles. ACS Omega 2020, 5, 10977–109986. [Google Scholar] [CrossRef] [PubMed]
  64. Marizcurrena, J.J.; Castro-Sowinski, S.; Cerdá, M.F. Improving the performance of dye-sensitized solar cells using nanoparticles and a dye produced by an Antarctic bacterium. Environ. Sustain. 2021, 4, 711–721. [Google Scholar] [CrossRef]
  65. Yañuk, J.G.; Cabrerizo, F.M.; Dellatorre, F.G.; Cerdá, M.F. Photosensitizing role of R-phycoerythrin red protein and β-carboline alkaloids in Dye sensitized solar cell. Electrochemical and spectroscopic characterization. Energy Rep. 2020, 6, 25–36. [Google Scholar] [CrossRef]
  66. Montagni, T.; Enciso, P.; Marizcurrena, J.J.; Castro-Sowinski, S.; Fontana, C.; Davyt, D.; Cerdá, M.F. Dye sensitized solar cells based on Antarctic Hymenobacter sp. UV11 dyes. Environ. Sustain. 2018, 1, 89–97. [Google Scholar] [CrossRef]
  67. Bisquert, J. Theory of the impedance of charge transfer via surface states in dye-sensitized solar cells. J. Electroanal. Chem. 2010, 646, 43–51. [Google Scholar] [CrossRef]
  68. Chowdhury, F.I.; Buraidah, M.H.; Arof, A.K.; Mellander, B.E.; Noor, I.M. Impact of tetrabutylammonium, iodide and triiodide ions conductivity in polyacrylonitrile based electrolyte on DSSC performance. Sol. Energy 2020, 196, 379–388. [Google Scholar] [CrossRef]
  69. Lana-Villarreal, T.; Boschloo, G.; Hagfeldt, G.A. Nanostructured Zinc Stannate as Semiconductor Working Electrodes for Dye-Sensitized Solar Cells. J. Phys. Chem. C 2007, 111, 5549–5556. [Google Scholar] [CrossRef]
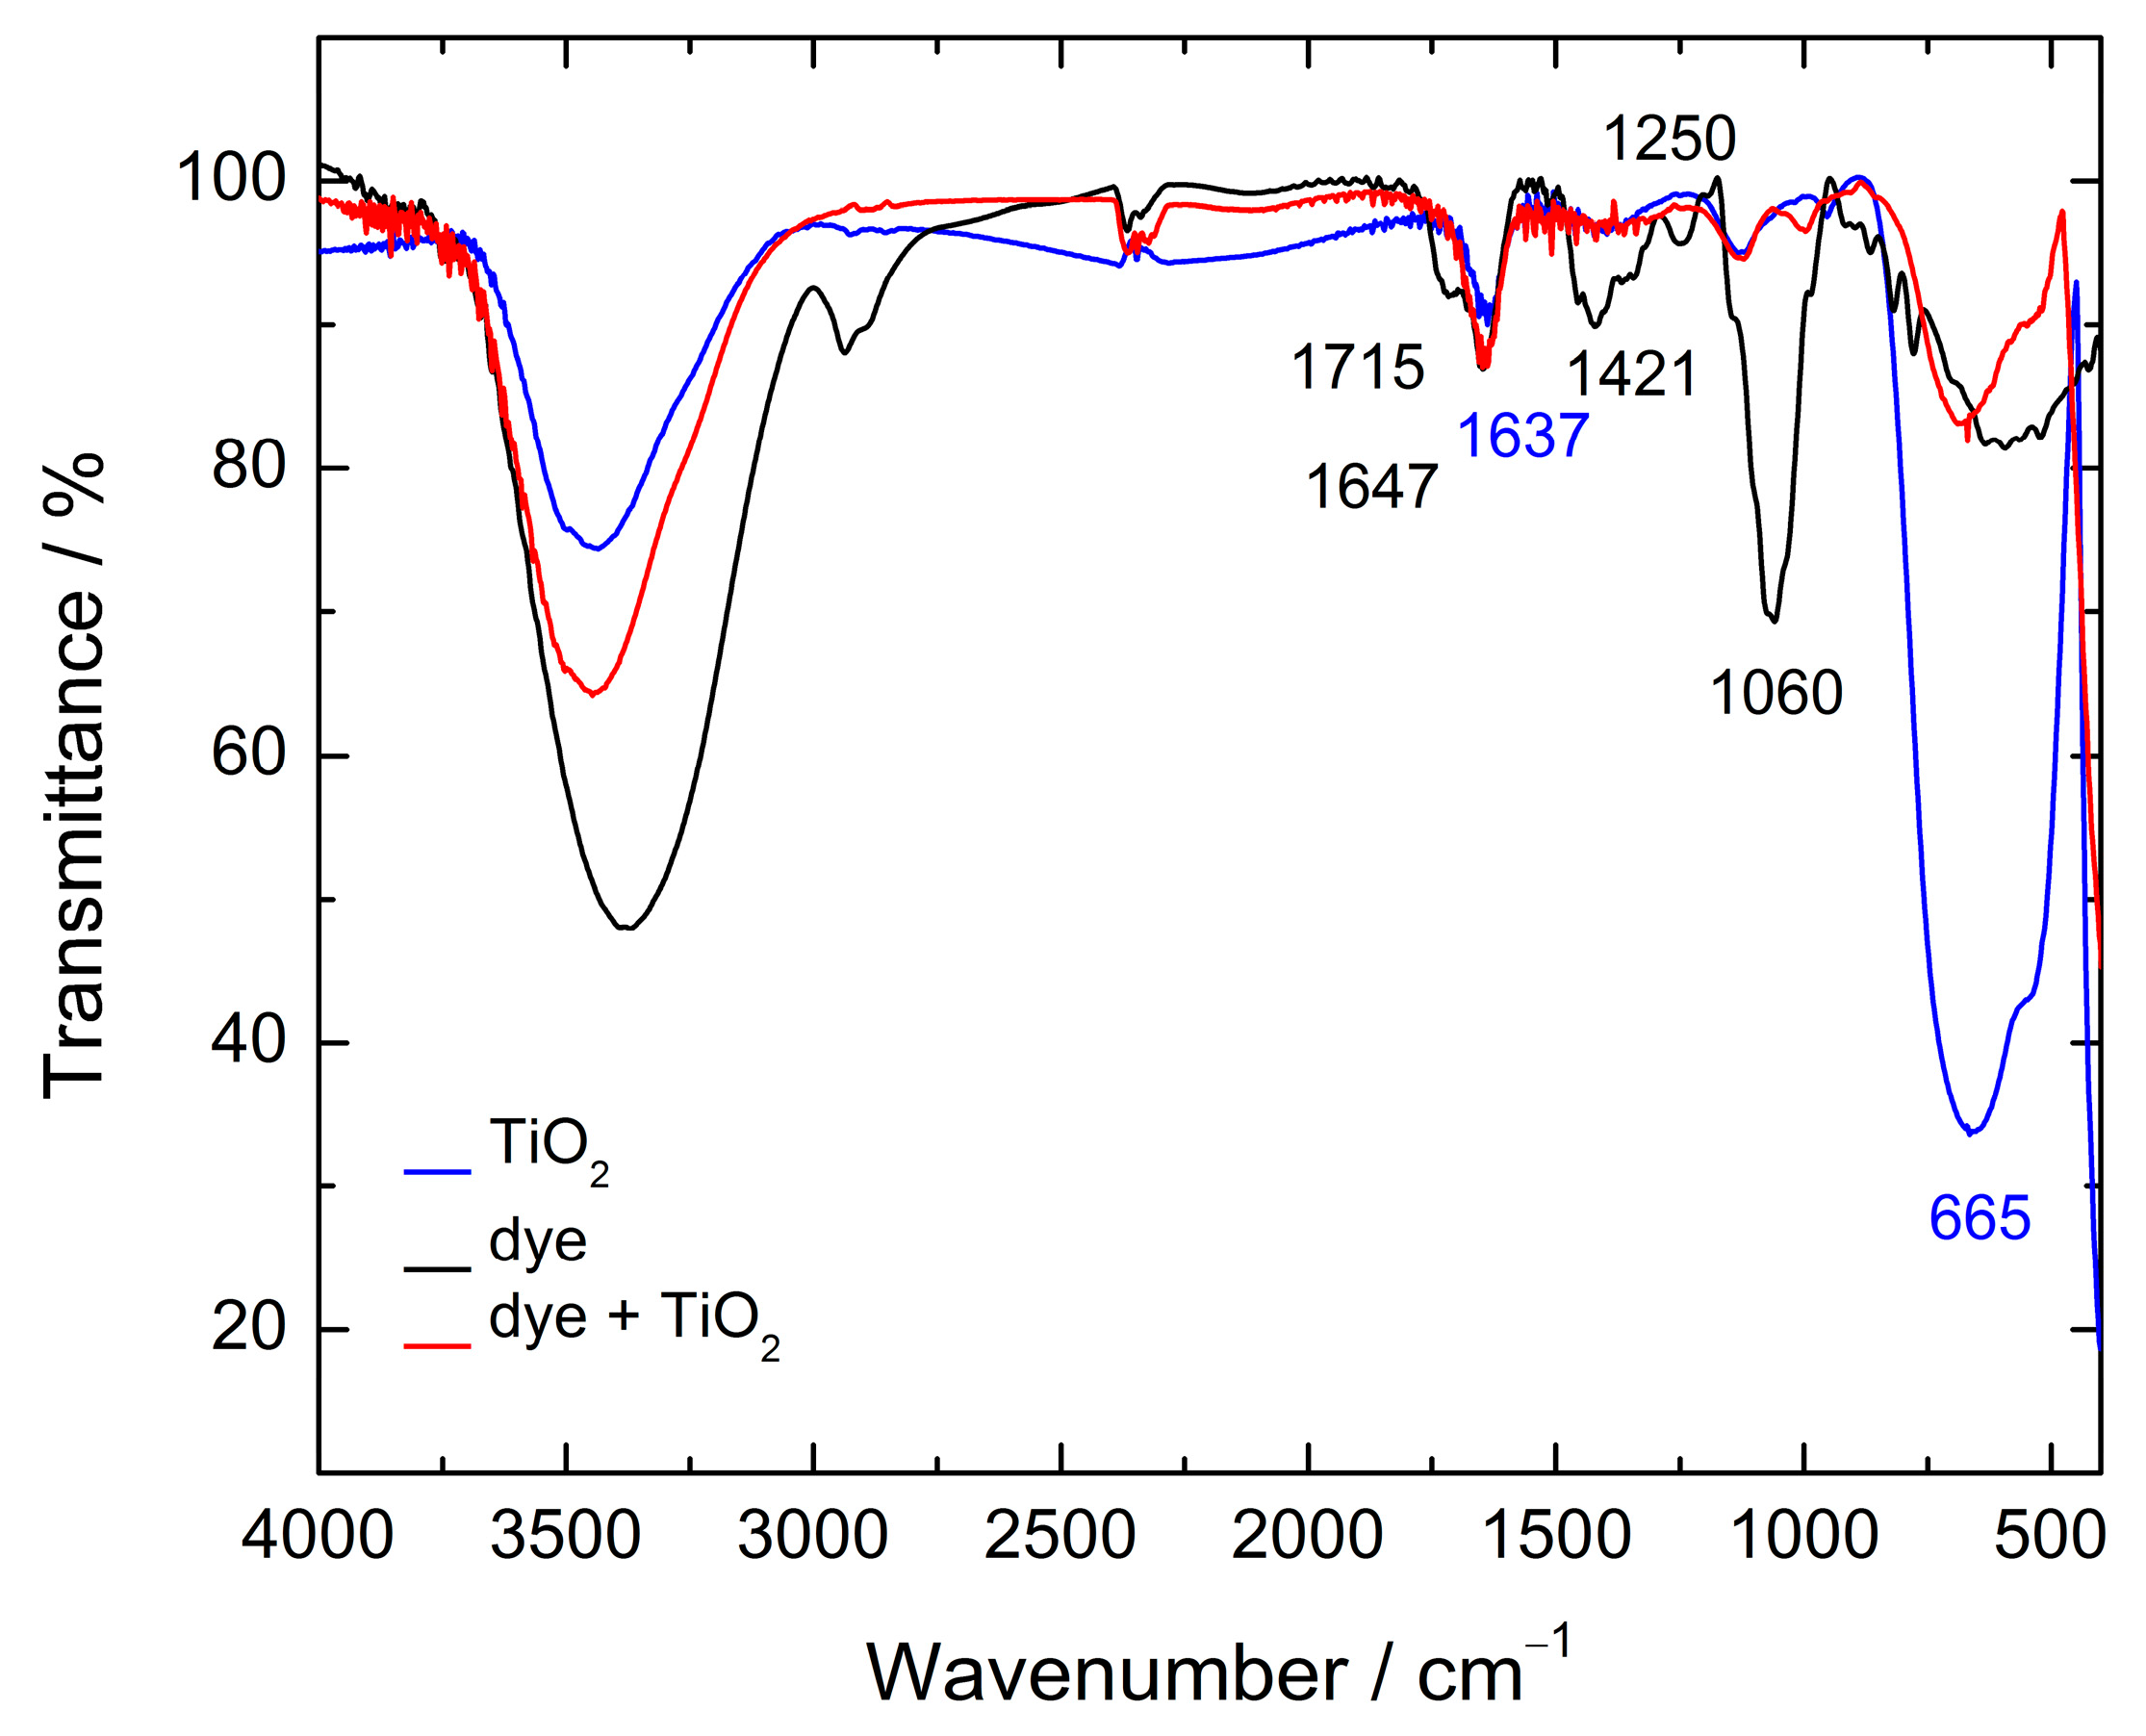
Scheme 1. Structure of delphinidin-3-glucoside (Glu = glucose).
Solar 03 00017 sch001
Figure 1. (a) Recorded visible spectra for the anthocyanin sample extracted via the use of ethanol (black line) and after purification via the use of a C18 column (red line). (b) Absorbance spectrum recorded using a reflection optic probe from the FTO/TiO2 electrodes dipped overnight inside cocktail solutions prepared from anthocyanins and NP100.
Solar 03 00017 g001
Figure 2. FTIR spectra for 1% KBr (w/w) samples. The black line corresponds to the purified DEL3GLU; the blue line to pure TiO2 (anatase form); and the red line to the measured spectra for the dish prepared from the scraped TiO2 sensitized with DEL3GLU.
Solar 03 00017 g002
Figure 3. Voltametric profiles at v = 0.05 Vs−1 for Au-pc in the supporting electrolyte ethanol/0.1 M NaClO4 in Milli-Q water 50/50 (red line) and for a DEL3GLU solution in the supporting electrolyte (black line).
Solar 03 00017 g003
Figure 4. Thermal stability of delphinidin-3-glucoside (DEL3GLU) extracted with ethanol (black points) and water (red points), and of DEL3GLU extracted with ethanol after the addition of NP100, followed recording the absorbance values at 550 nm.
Solar 03 00017 g004
Figure 5. TG (a) and DSC (b) of different samples: purified delphinidin-3-glucoside (DEL3GLU), DEL3GLU after incubation for 24 h onto TiO2 electrodes, and pure TiO2 (anatase form) at a heating rate of 10 °C min. Inset: numbers I to IV denotes the events mentioned above.
Solar 03 00017 g005
Scheme 2. Photoanode sensitized with DEL3GLU after overnight immersion in the solution.
Solar 03 00017 sch002
Figure 6. Photocurrent density vs. potential profiles for DSSCs under 1 sun, AM 1.5, v = 0.05 Vs−1. Cells sensitized with DEL3GLU extracted with ethanol (black line), DEL3GLU extracted using Milli-Q water (blue line), and those co-sensitized using a sequential approach (DEL3GLU first extracted from ethanol and then silver nanoparticles, NP100, red line).
Solar 03 00017 g006
Figure 7. Nyquist representation for the impedance results measured at 0.5 V in darkness, for sensitized cells using DEL3GLU extracted with ethanol (red line), and those using DEL3GLU co-sensitized with NP100 (black line). Inset: equivalent circuit used to fit the experimental results.
Solar 03 00017 g007
Table 1. Main FTIR signals detected and their correspondence with the functional groups existent in the analyzed compounds.
Signal Wavenumber/cm−1Functional GroupChange after the Adsorption of DEL3GLU onto TiO2
1715C=ODisappeared
1647C=OMoves to 1637 cm−1
1454 and 1421C-C=C phenolicDisappeared
1250C-O phenolicDisappeared
1060 sharpC-O primary alcohol
C-O-C carbohydrates or flavylium
Splits in two weak signals at 1130 and 1000 cm−1
665Ti-O-TiRatio between 1647/665 decreased
Table 2. Main events raised from the TG thermograms for the analyzed samples.
Sample EventsNr.Temperature Range/°C Mass %
DEL3GLU410–1000.5
2100–160 and 160–25043
3250–40017
4400–60025
DEL3GLU + TiO2310–1001.3
2115–24011
3240–45014
TiO2- --
Table 3. Photovoltaic properties for DCC cells assembled using different anthocyanin concentrations or extraction solvents. Measured under an intensity of 100 mW cm−2, AM 1.5 G. Electrodes’ active areas: 0.36 cm2. Jsc is the current density, Voc is the open-circuit potential, FF is the fill factor, and η is the conversion efficiency. Results come from at least three independent experiments performed for each sensitizer. The estimated error is ± 0.005%.
DEL3GLU in EtOHDEL3GLU in EtOH + NP100DEL3GLU in MilliQ Water
[ ]/M × 1052.2–16.02.2–16.013.0
Jsc/mA cm−20.510.710.33
Voc/V0.500.510.46
FF0.680.660.33
η/%0.1700.2400.050
Table 4. Determined EIS parameters for DSSCs assembled with DEL3GLU (extracted with ethanol) and also co-sensitized with NP100. Measured at 0.5 V in darkness. Results arise from at least three independent experiments performed for each sensitizer.
EIS ParameterDEL3GLUDEL3GLU + NP100
Rce89686
Ratio Rct/Rt17050
Γrec/s0.130.08
Γt/s7.7 × 10−41.6 × 10⁻³
Disclaimer/Publisher’s Note: The statements, opinions and data contained in all publications are solely those of the individual author(s) and contributor(s) and not of MDPI and/or the editor(s). MDPI and/or the editor(s) disclaim responsibility for any injury to people or property resulting from any ideas, methods, instructions or products referred to in the content.

