Article

The Evolution of Life History Traits and Their Thermal Plasticity in Daphnia

by
Larry L. Bowman, Jr.
1,2,* and
David M. Post
2
1
Marine Institute, University of Georgia, Athens, GA 31327, USA
2
Department of Ecology and Evolutionary Biology, Yale University, New Haven, CT 06520, USA
*
Author to whom correspondence should be addressed.
Hydrobiology 2023, 2(1), 55-74; https://doi.org/10.3390/hydrobiology2010005
Submission received: 22 November 2022 / Revised: 26 December 2022 / Accepted: 29 December 2022 / Published: 6 January 2023

Abstract

:
Few studies have explored the relative strength of ecogeographic versus lineage-specific effects on a global scale, particularly for poikilotherms, those organisms whose internal temperature varies with their environment. Here, we compile a global dataset of life history traits in Daphnia, at the species-and population-level, and use those data to parse the relative influences of lineage-specific effects and climate. We also compare the thermal response (plasticity) of life history traits and their dependence on climate, temperature, precipitation, and latitude. We found that the mode of evolution for life history traits varies but that the thermal response of life history traits most often follows a random walk model of evolution. We conclude that life history trait evolution in Daphnia is not strongly species-specific but is ecogeographically distinct, suggesting that life history evolution should be understood at the population level for Daphnia and possibly for other poikilotherms.

1. Introduction

Life history traits are among the most frequently studied traits of organisms because of their direct relevance to fitness via reproduction and survival. Variation among life history traits provides many solutions and strategies to similar problems. The diversity and specificity of life history traits provide glimpses into the evolutionary history of organisms, whereas the evolutionary history of organisms phylogenetically constrains the parameter space for those life history traits [1]. Predicting how organisms’ life histories will respond to environmental changes is important for understanding the generation and maintenance of biodiversity broadly.
Despite the variability in life history traits across taxa, some life history traits are constrained by the evolutionary histories of specific lineages, deemed lineage-specific effects [1]. These effects are important constraints on organisms’ ability to respond to their environment evolutionarily. However, many organisms have evolved ways to overcome environmental pressures by exhibiting phenotypic plasticity. Moreover, life history traits are among the most plastic traits and, while some are thought are thought to be highly heritable, others are not [2]. It is unclear how different life history traits and their plasticity are inherited in Daphnia and across the tree of life more broadly.
While life history traits are constrained by the evolutionary lineages in which they evolve and respond plastically to the environment, it is therefore interesting to understand the independent contributions of lineage-specific effects and climate on the evolution and expression of life history traits. For example, some traits like body size may be heavily constrained by lineage-specific effects, limited by deep ancestral divergences, such as endo-versus exoskeletons [3]. Other traits may exhibit strong variability due to local environmental conditions or resource availability, such as clutch size or interclutch (interlitter) intervals [4]. Finally, some traits may vary in response to both lineage and local environmental constraints, such as somatic (juvenile) growth rate [5].
Increasing and increasingly variable rates of global temperature change [6] are likely to interact strongly with the extreme plasticity of life history traits [7,8] to influence or mediate population and species responses to climate change [9]. Despite the central role of life history traits and their sensitivity to temperature variation, the extent of the plastic responses to temperature and subsequent trait evolution remains an open question. With variable changes in climate, life history trait plasticity and evolution will be especially important for invertebrates and poikilotherms, those organisms whose metabolism and internal temperature depend on the environmental temperature.
Temperature should affect poikilotherms and homeotherms differently [1], and for the purposes of this study, a common poikilotherm microcrustacean genus, Daphnia, is known to respond with dramatic plasticity to different temperatures making it a useful lens for exploring lineage-specific and latitudinal variation in life history traits [10,11,12]. Daphnia is particularly well-suited as a study system due to the deep understanding of their ecology and their use in thermal experiments and toxicology studies as indicator species (Table S1)—resulting in an abundance of life history data experimentally tested in different environments.
Prevailing theories from community and ecosystem ecology suggest that local conditions, or ecogeography, should be the strongest signal in predicting the life history variation in poikilotherms [13,14]. Meanwhile, population ecology theory suggests that there is significant intra-and interspecific variation, and therefore, lineage-specific effects and ecogeography must both be known to predict life history variation [15]. We hypothesize that life history traits follow a mixture of these trends with rate-limited traits, such as juvenile growth and interclutch intervals being closely aligned with climatic/latitudinal gradients [16] and other allometrically linked traits, like size and age at first reproduction and clutch size to be closely aligned with species identity [17].
Here, we test the effects of lineage, local environment, and the mode of evolution on life history traits in Daphnia. We use a phylogenetic framework to test for evolutionary constraint in life history traits across the Daphnia phylogeny. We then test for local environmental signals in life history trait evolution by incorporating precipitation, temperature, and latitude data. We repeat these analyses for thermal responses in life history traits to explore if there are lineage-specific or local environmental effects on the evolution of trait plasticity. Finally, we explore whether the evolutionary trends of life history traits and their plasticity is stronger at the species or population level for Daphnia. A mixture of local adaptation and evolutionary history undoubtedly influences life history traits [18], but exploring the relative effects of each on trait variation will allow for better predictions of how life history traits may evolve in a changing thermal environment.

2. Materials and Methods

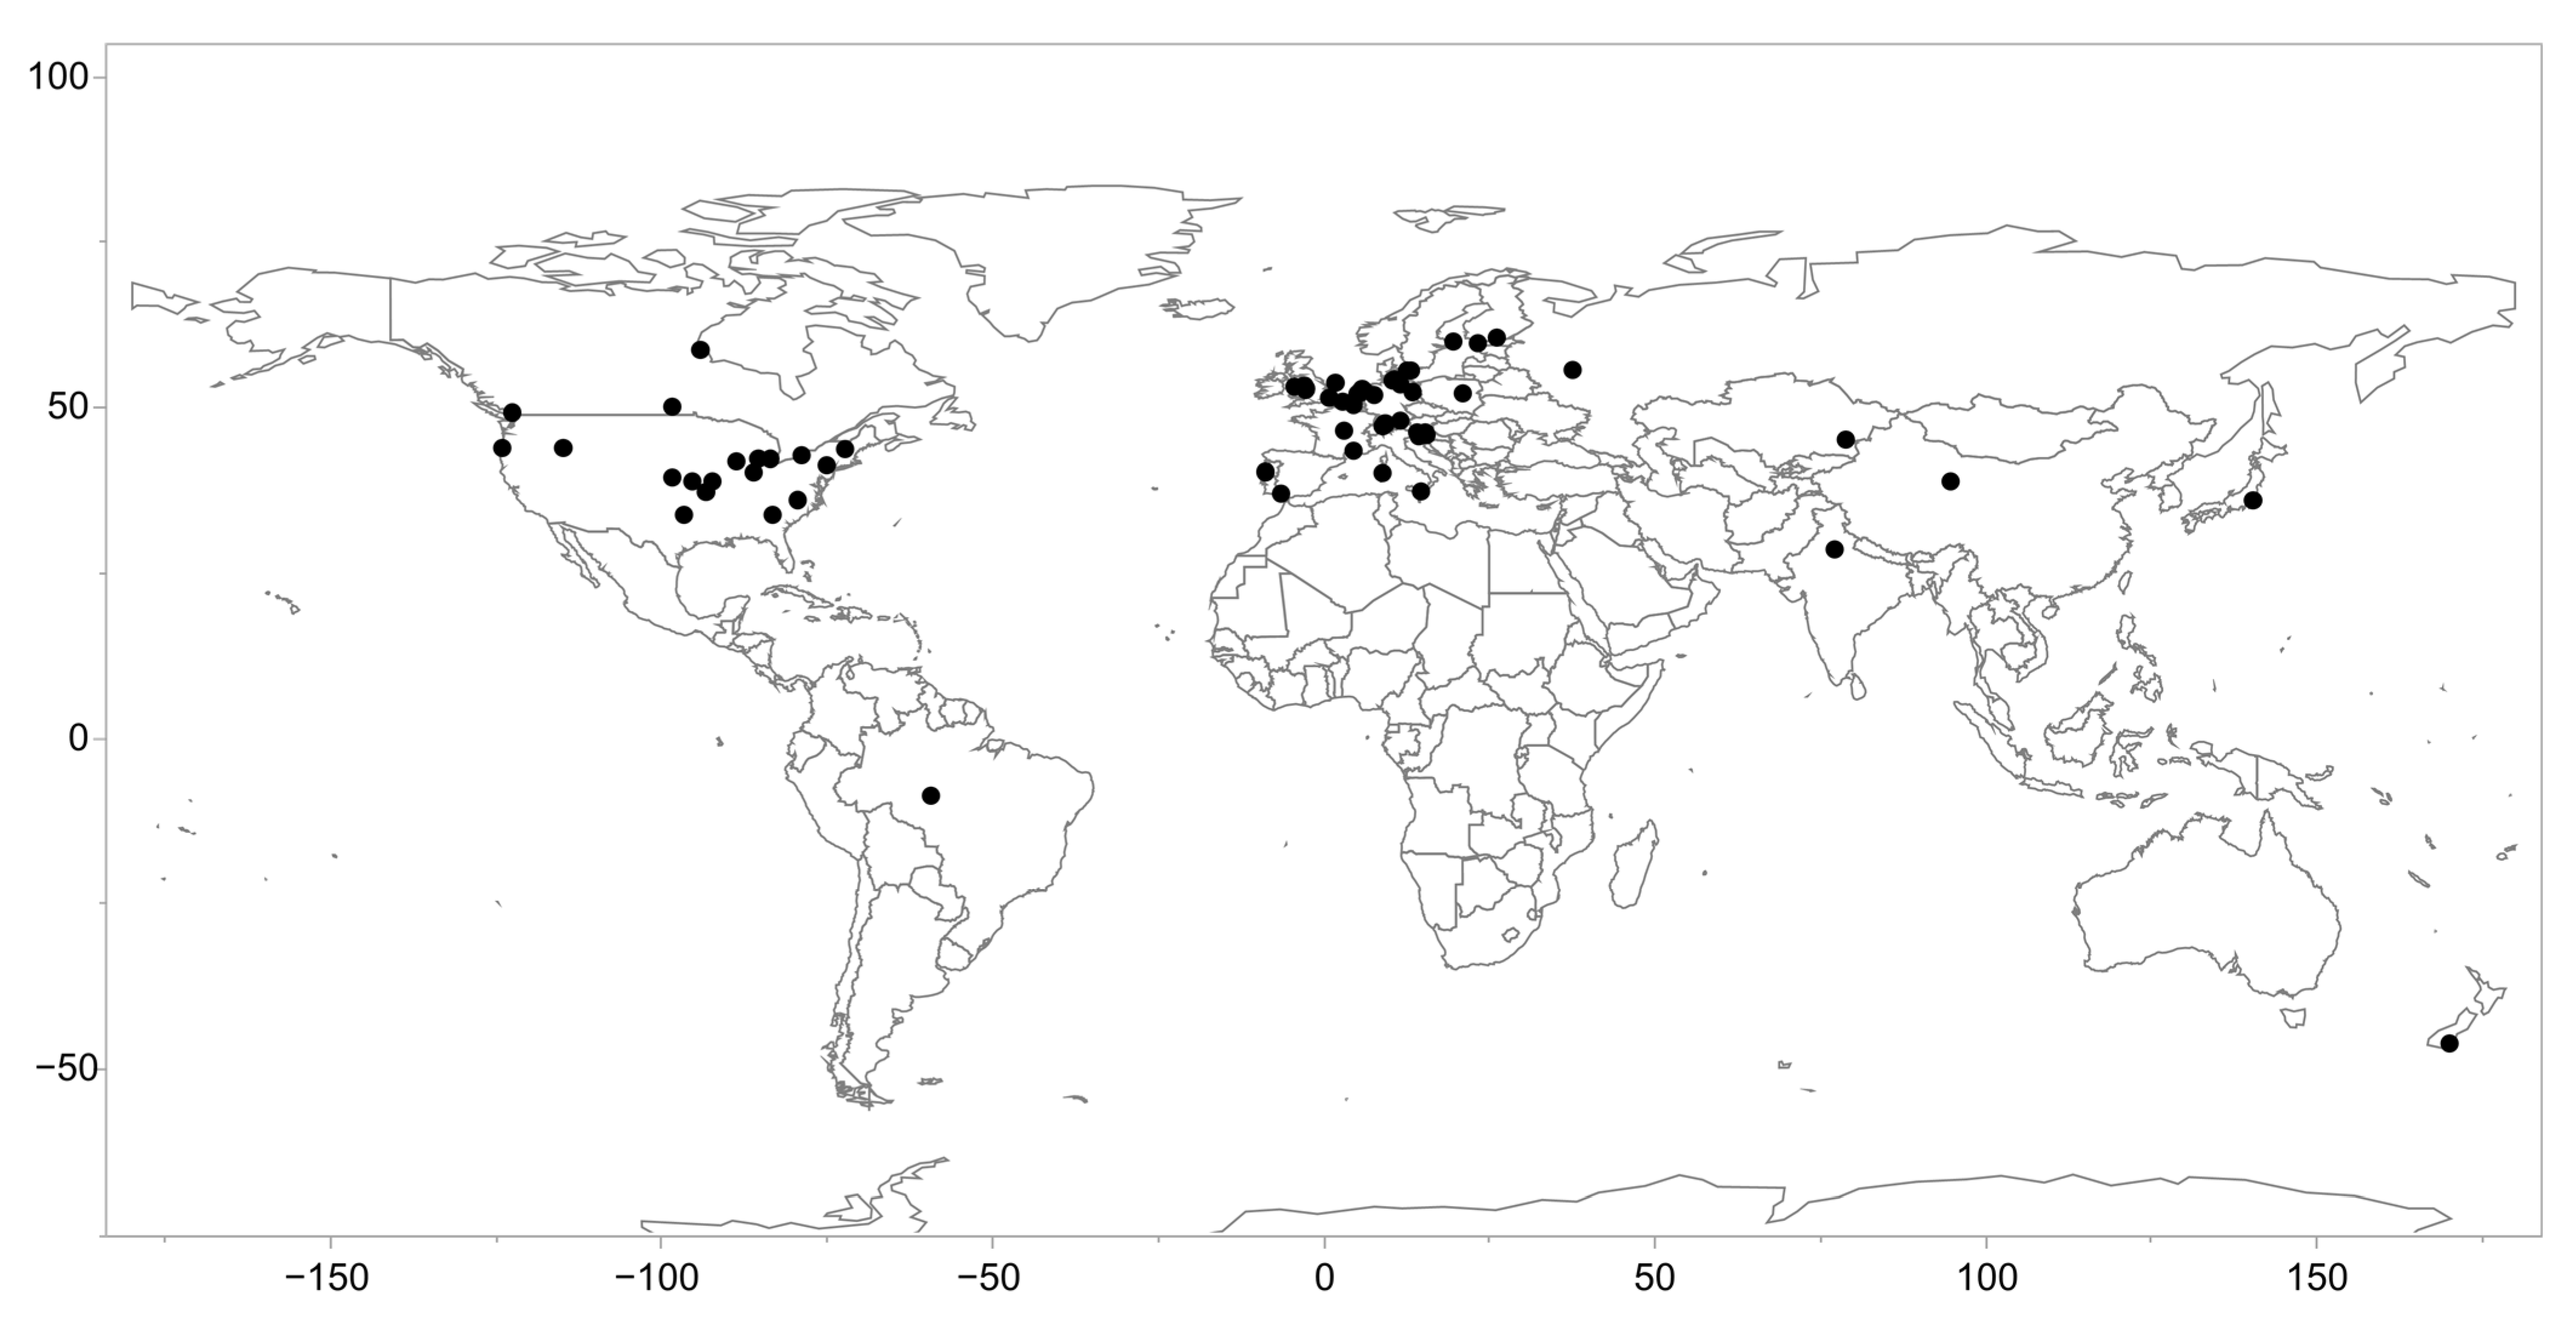
2.1. The Life History Dataset and Literature Review
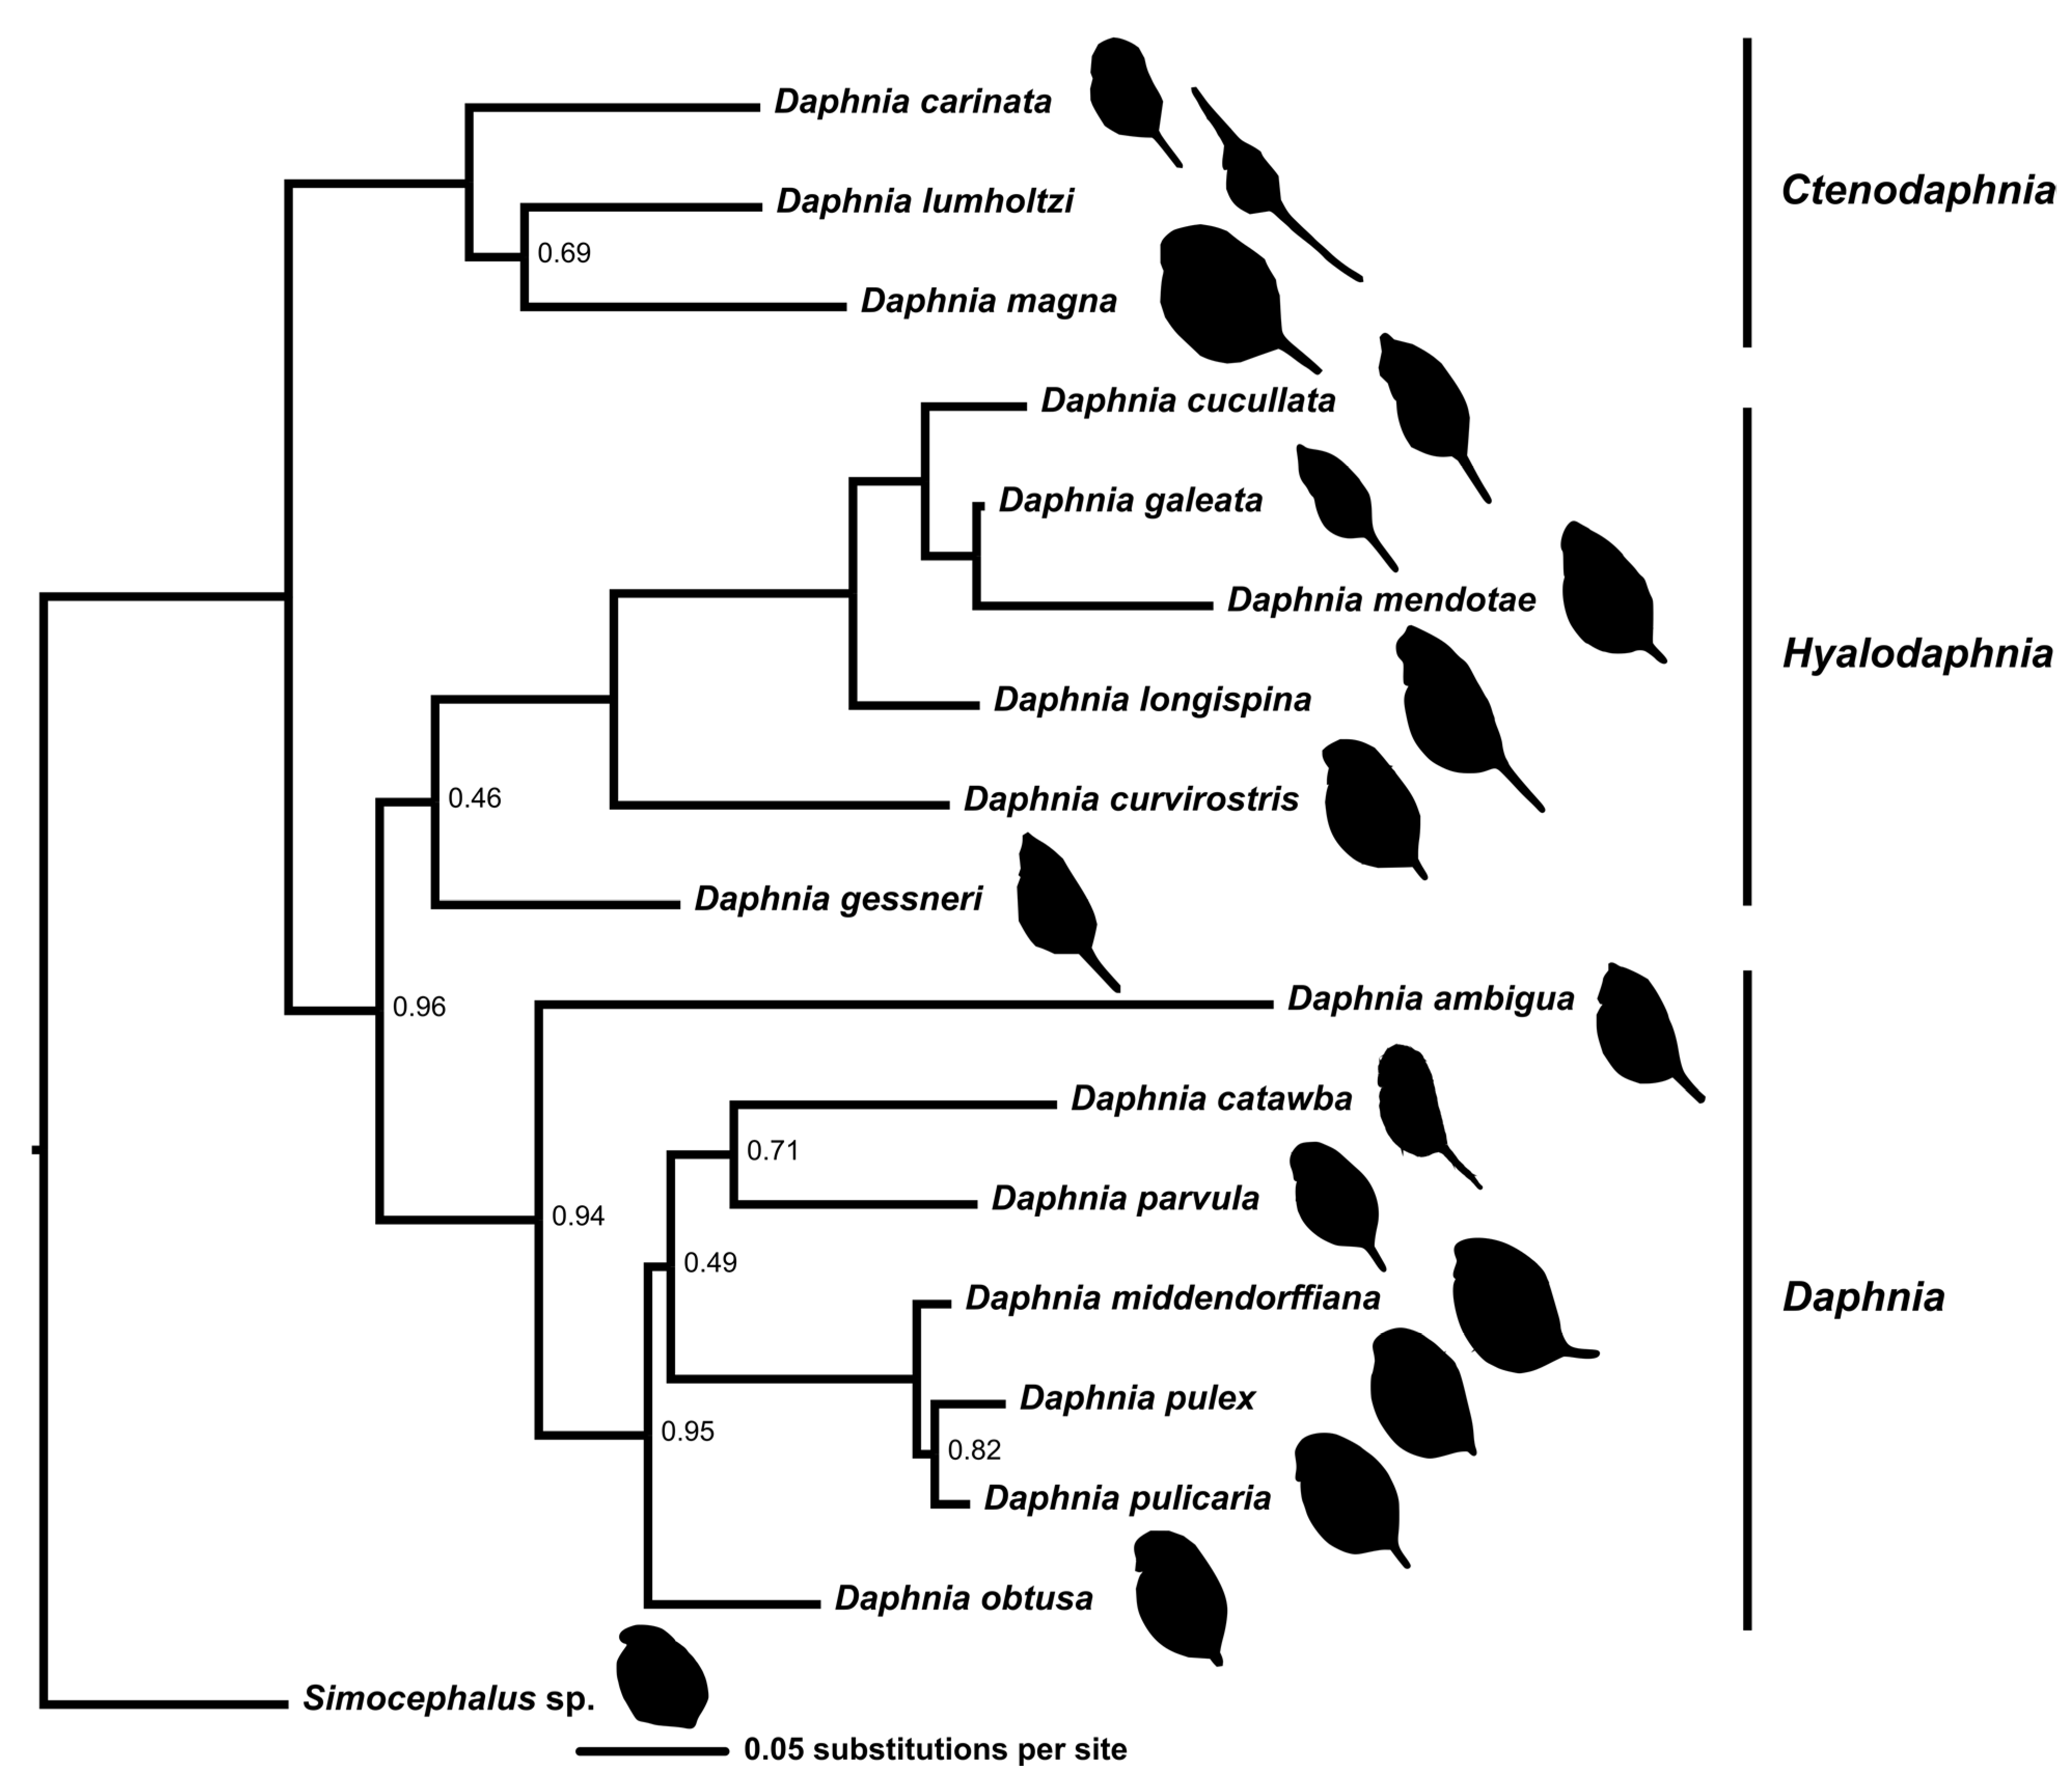
We collected data for this meta-analysis from a search of Web of Science and Google Scholar using the search term: temperature AND response AND Daphnia. The literature search returned 89 articles that were then assessed for quality standards, resulting in 70 studies useful for further analysis, representing 342 controlled laboratory temperature measurements from 75 individual populations across 20 species of Daphnia (Figure 1). A full set of articles used in these analyses can be found in the Supplement (Table S1). Quality standards included research studies reporting means, standard deviations, and sample sizes, (or means of extracting these values) for any of 8 life history traits, similar to methods in [19].
Life history traits included in the analysis were age at first reproduction (AFR), size at first reproduction (SFR), clutch size, juvenile growth rate, population growth rate, size at death, interclutch interval, and lifespan. Trait variation data were recorded across all reported temperatures. Where data were not reported directly in tabular form, they were extracted from plots using WebPlotDigitizer [20].
Latitude and longitude measurements were obtained from sampling locations reported in the original research studies. For a robust measurement of latitude, research must also have been conducted on wild-caught, lab-manipulated Daphnia. We did not include long-term lab-maintained clonal lines because of the potential effects of long-term lab culturing. We extracted climate data from the Global Climate Data (WorldClim) dataset [21]. These data include temperature, precipitation, and elevation information at a 10s latitude resolution. Variables BIO1-BIO11 were used in this analysis to define the temperature aspect of climate, and variable BIO12-BIO19 represent the precipitation aspect of climate, similar to [22]. We analyzed monthly temperature and precipitation readings from the last 50 years of available data—more information about individuals variables and how they are obtained can be found in [21].
We grouped all species together for most analyses for the interest of elucidating the importance of phylogenetic constraints on life history traits. We averaged across all population-level measurements with averages weighted for samples size and corrected using the standard error measurements calculated from the original research articles. For climate variables, we averaged all temperature and precipitation variables across these same populations to obtain a measurement of the average environmental condition experienced by the species. Thus, the final species-level dataset included in the phylogenetic analyses included single measurements for all life history traits and all climate variables. For population-level analyses, we used individual population measurements for life history traits, climate, and laboratory (experimental) temperature measurements.

2.2. Phylogeny

We created a Daphnia phylogeny for subsequent species-level analyses which account for shared ancestry in lineages [23] (Figure 2). We downloaded sequence data for six loci from Genbank for the Daphnia species in our analyses. Our phylogeny contains data for three nuclear loci: 18 s, 28 s, 5.8 s and three mitochondrial loci: 12 s, COI, and ND2 (Supplemental Table S2). We downloaded Simocephalus sp. sequences and added them to the dataset as outgroups. We trimmed the resulting sequences by eye for low quality bases and created consensus sequences for each locus using Geneious v.11.1.5 (http//www.geneious.com, accessed on 1 December 2018). We created consensus sequences because subsequent phylogenetic analyses required single tips for each species and to avoid oversampling issues with more heavily sampled species. We aligned sequences using MUSCLE v.3.8.425 [24] with Simocephalus sp. as the outgroup. We used PartitionFinder 2 [25] to designate seven data partitions to correspond to the three separate codon positions for each of the six loci. Phylogenies were inferred using MrBayes v. 3.2 [26], and we ran the analysis on the concatenated dataset of all 6 loci for two independent runs of 107 MCMC generations, sampling every 1000 generations. We checked for convergence of the runs using Tracer v.1.7.1 (http://tree.bio.ed.ac.uk/software/tracer/, accessed on 1 December 2018) and plotted the final phylogeny using FigTree v.1.4.4 (http://tree.bio.ed.ac.uk/software/figtree/, accessed on 1 December 2018).
We rooted the tree with Simocephalus sp. as an outgroup and checked the resulting tree with Colbourne and Hebert 1996 [27] for agreement. Hybrid species were dropped from phylogenetic (species-level) analysis, and trait values were separated into both of the species categories to which they purportedly belong. Additionally, more recent genetic analysis has grouped Daphnia hyalina and D. rosea into the D. longispina species complex [28,29], and these species are also grouped in our analysis.

2.3. Statistical Analyses

2.3.1. Phylogenetic Signal

We tested the phylogenetic signal of each life history trait against the phylogeny we generated using two different statistical models. We categorized all of our life history traits as continuous traits and used the R package phytools [23] to test for the signal of life history traits and climate variables on our phylogeny using two different phylogenetic statistics: Pagel’s λ [30,31] and Blomberg’s K [32] (Table 1). Both of these statistics calculate the phylogenetic independence probability given a null or random distribution of the tips in the tree. Values near zero indicate phylogenetic independence, or that traits are unrelated to inheritance; values closer to 1 indicate that the tested signal follows a random walk or Brownian motion model of evolution; values greater than 1 indicate that relatives show higher similarity to each other than Brownian motion would suggest, e.g., traits are highly conserved in lineages [22]. We then tested for significance of Blomberg’s K by setting our null model to that of phylogenetic independence (K ≈ 0) and simulated 1000 randomizations of the tree where species identities at the tips are randomly sampled [22,32].To test the significance of Pagel’s λ, we used a likelihood ratio of our model (the true tree) to the null (λ ≈ 0) and to a neutral model of evolution (λ ≈ 1), similar to [22].

2.3.2. Climate and Temperature Variables

We included studies that measured life history at experimentally manipulated (non-ambient) temperatures (Tempexp) in order to understand the effect of temperature alone versus climate. To avoid overfitting, climate variables from the WorldClim database were condensed into two predictor variables via principal components analysis (PCA) for both temperature and precipitation, resulting in four principal components (PCs) used in subsequent regression analyses [22].
The temperature principal components (BIO1-BIO11) collectively explained 84.9% of the variation in the temperature data. PC1temp (51.0%) is positively correlated to the minimum and mean temperature of the coldest month(s) and negatively correlated to the annual temperature range and temperature seasonality, creating an axis from less variable and warmer to more variable and cooler climates. PC2temp (33.9%) is strongly positively correlated to maximum and mean temperature of the warmest month(s), creating a secondary axis from milder to hotter climates.
The precipitation principal components (BIO12-BIO19) collectively explained 84.3% of the variation in the precipitation data. PC1precip (50.5%) is positively correlated to annual precipitation and the wettest continuous 3-month period (quarter) creating an axis from drier climate to wetter climates. PC2precip (33.8%) is strongly negatively correlated to precipitation of the driest month, creating a secondary axis from driest to wettest absolute precipitation climates. The factor scores for the first two principal components were used for subsequent analyses for each population or species.

2.3.3. Life History Response Variables

We were also interested in the response of life history trait reaction norms to temperature. For each life history trait, we collected the reaction norms for each species and averaged their responses across the temperature span reported in the literature. We fit general linear models (GLMs) to the data accounting for differential sampling size among the reported data. We extracted the slope of the model as the species’ average thermal reaction norm and used this as the life history response in subsequent species-level analyses. Because we expect several life history traits to exhibit nonlinear relationships with temperature (e.g., population growth rate), we also fitted generalized nonlinear models (GNLMs) to the data. Linear models explained significantly more variation in the data and were used for further analyses. We expect the linearity of our collected thermal responses was due to the restricted range of temperatures used in most studies, which does not explore the full thermal parameter space that Daphnia may tolerate.

2.3.4. Life History Traits and Climate Variables Regressions

  • Species-level analyses—To test how climate affects life history traits, we used three different modeling structures. We used ordinary least squares (OLS) regressions to examine the predictive power of climate for life history traits. However, OLS models do not account for the known issues of phylogenetic relatedness among closely related lineages [33,34,35], more especially those that may have recent introgression events due to Daphnia’s elevated rate of hybridization. OLS models were conducted in JMP Pro 13.2 [36].
To account for common ancestry, we used two phylogenetic least squares regression approaches [37] using the R package nlme [38], one with an underlying Brownian motion model of evolution and the other with an Ornstein–Uhlenbeck model of evolution [22]. The phylogenetic generalized least squares model with Brownian motion (PGLSBM) accounts for phylogenetic relatedness while trait variance increases linearly through time [39]—this represents an evolutionary model where evolution occurs as a random walk, indicative of either drift or adaptation to a variable adaptive peak. The phylogenetic generalized least squares model with Ornstein–Uhlenbeck evolution (PGLSOU) similarly accounts for phylogenetic relatedness while trait variance does not change over time [40]—this represents an evolutionary model where evolution occurs as a process whose value may vary around a mean but whose mean trait value remains constant over evolutionary time, indicative of a trait that is evolving to an invariable adaptive peak [22]. We used these two models to elucidate not only the specific signals of these traits across the phylogeny but also to understand the evolutionary constraints on these traits.
Both PGLS models were constructed using phytools [23] in R with the corresponding variance-covariance matrices built in the R package ape [41] using the corBrownian function for Brownian motion (based on [42]) and the corMartins function for Ornstein–Uhlenbeck (based on [43]). Prior to running each model, input trees were trimmed to include only species with complete data, i.e., missing data were excluded from the analyses. We performed Box-Cox transformations on variables whose data did not pass tests for normality and homoscedasticity [22] using the R package MASS [44]. Finally, we account for model efficiency using an information theory approach using the Akaike information criterion (AIC) for model choice using the R package geiger [45] (Table 2 and Table 3).
  • Population-level analyses—We expected climate variables to be good predictor variables on a global scale or species-level, but when assessing individual populations, we were interested in whether climate, temperature, or latitude alone were enough, regardless of species, to predict variation in life history traits. We used a stepwise model selection approach for our population-level analysis. We built a full model for each life history trait that included the four climate variables (PC1temp, PC2temp, PC1precip, PC2precip), the reported experimental temperature, the latitude, and species identity as a fixed effect. Then, we added and reduced the model by individual variables and compared the Akaike information criterion corrected for small sample sizes (AICc) scores to choose the optimum model for each trait (Table 4). Individual species identity coefficients can be found in the Supplement (Table S3). All statistical analyses were performed in JMP Pro 13.2 [36] or R [46]; we used a 5% significance level to reject null hypotheses.

3. Results

3.1. Phylogeny

Our phylogeny recapitulated all of the major groups outlined by [27] (Figure 2). We were able to reconstruct the Ctenodaphnia including Daphnia lumholtzi and D. magna with the addition of D. carinata, not appearing in the Colbourne and Hebert tree [27]. Colbourne and Hebert [27] had weak support for the separation between the Hyalodaphnia and the Daphnia, which we greatly improve in our tree (0.96 posterior probability). Finally, as expected, we see close grouping between readily hybridizing species D. galeata and D. longispina and the D. pulexD. pulicaria group which also includes D. middendorffiana, commonly found at high northern latitudes (Figure 2).

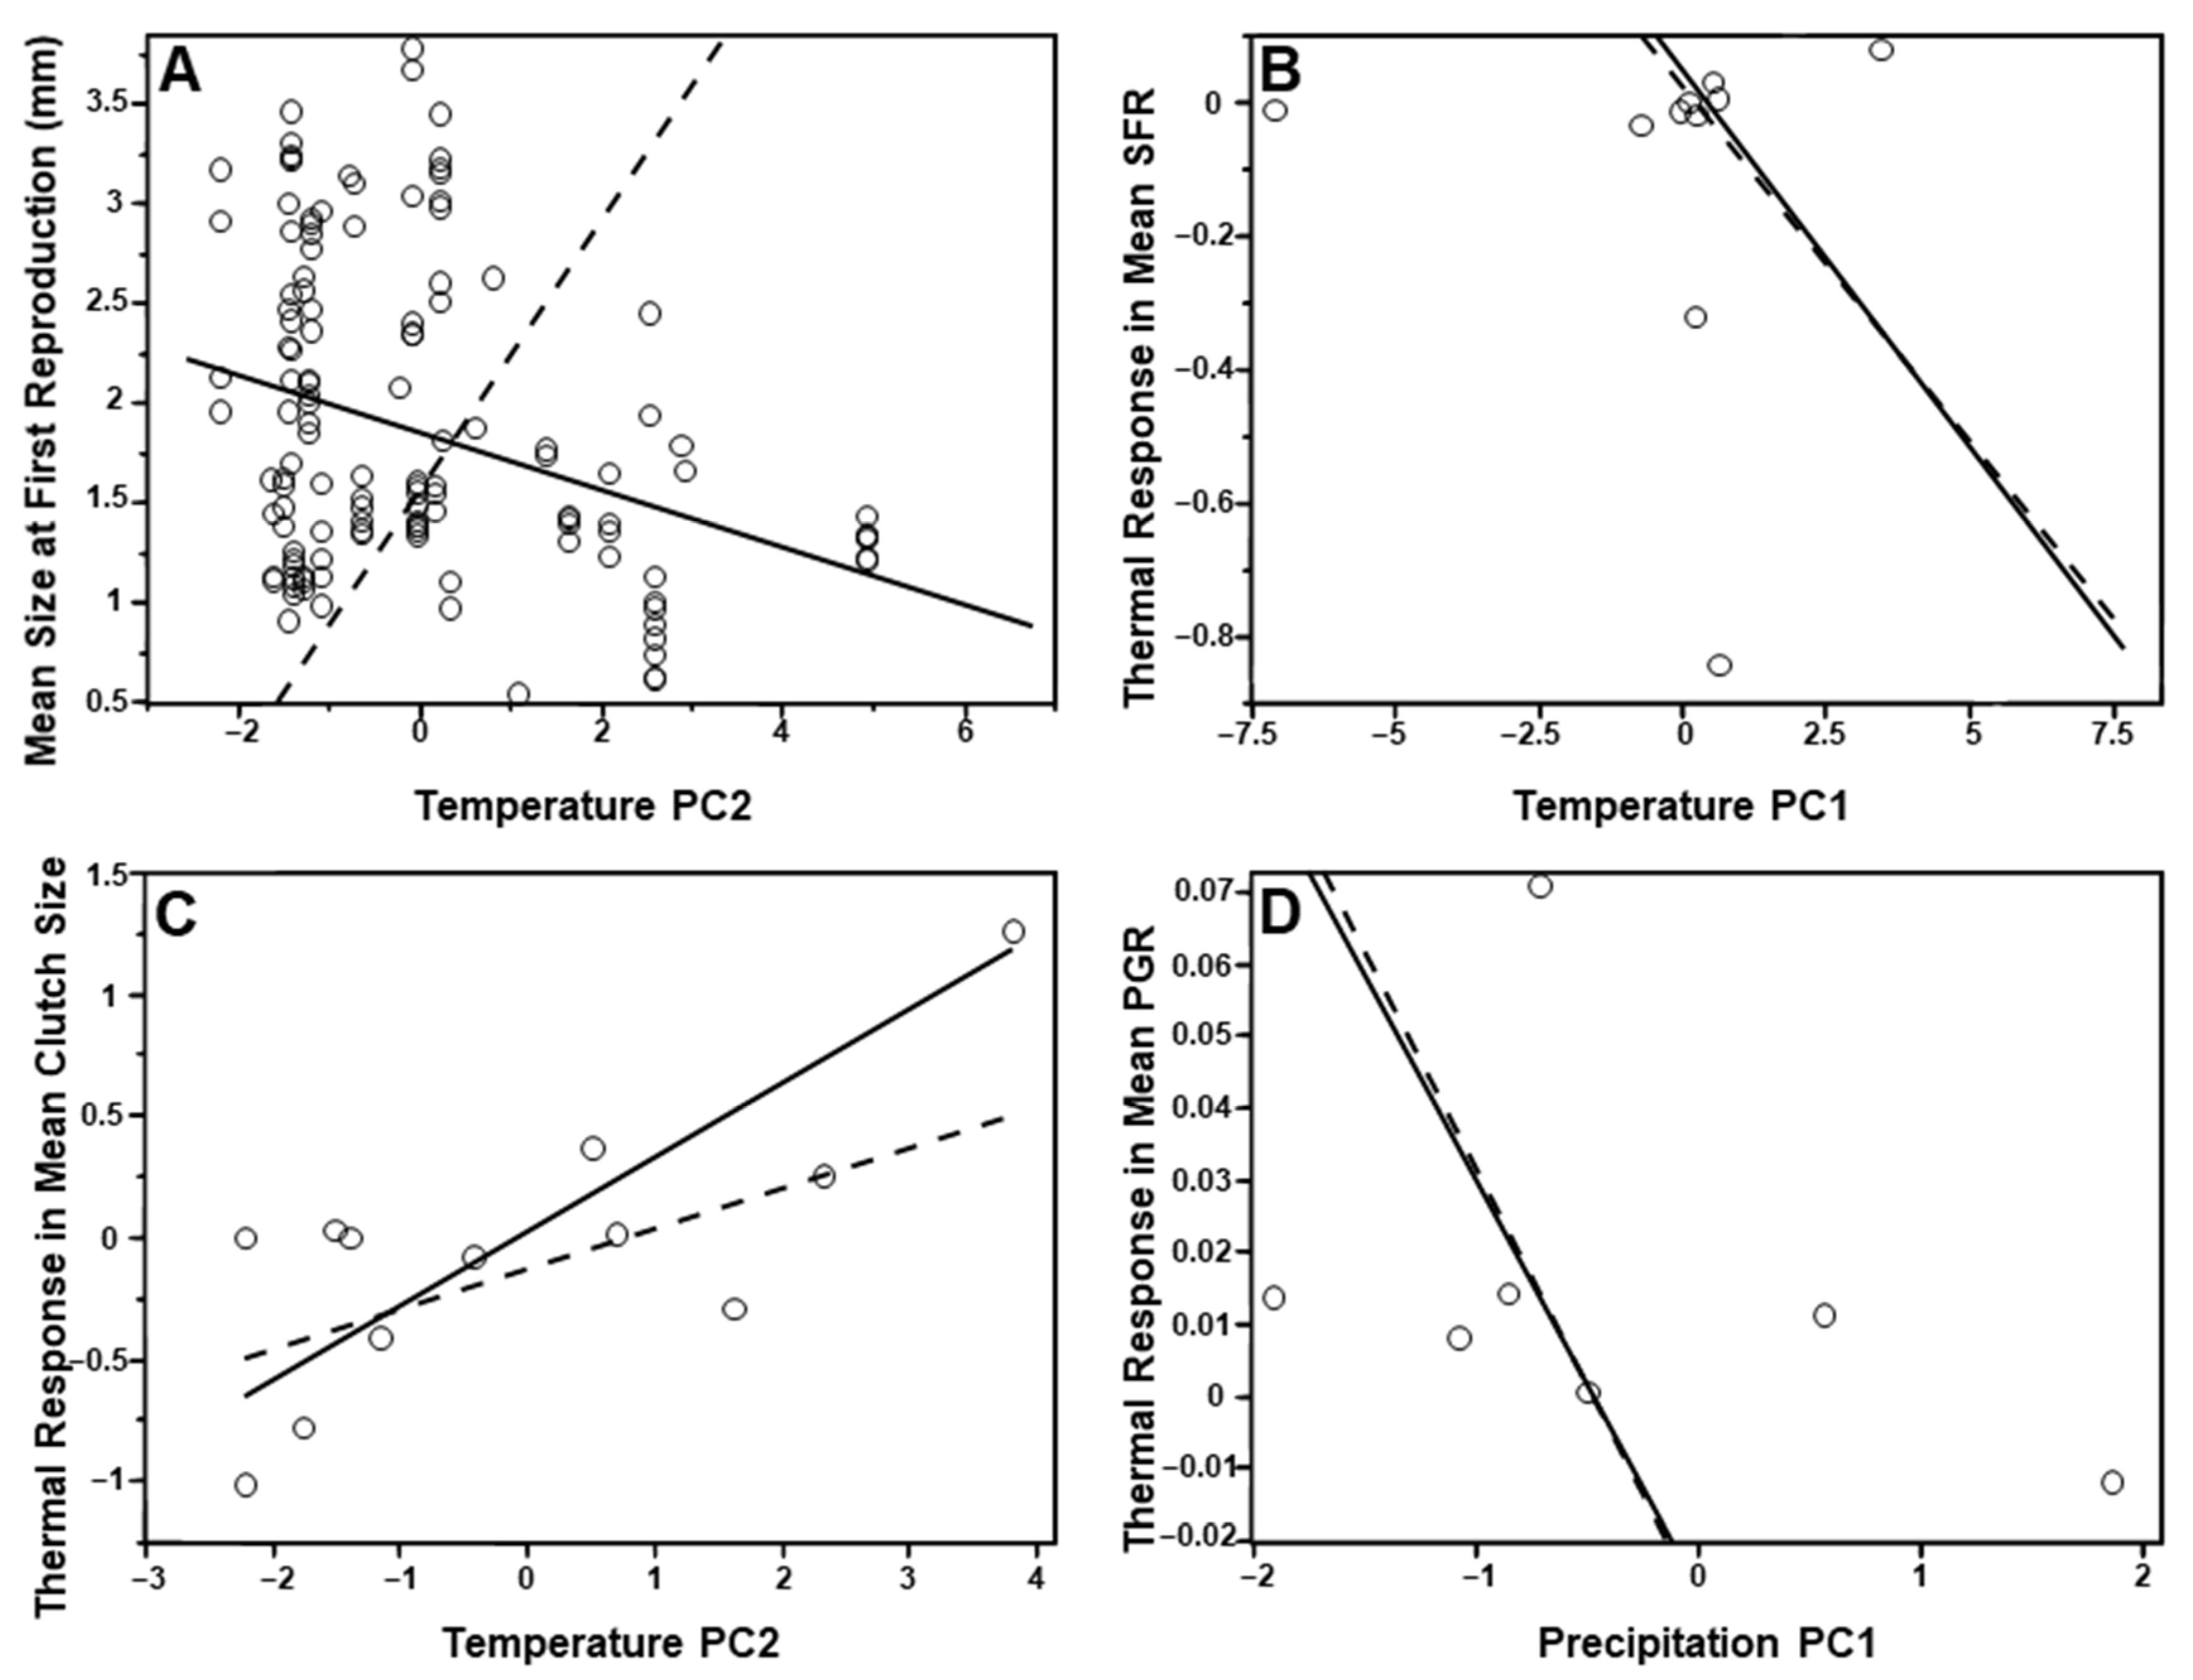
3.2. Life History Traits and Climate

Daphnia have a cosmopolitan global distribution, but most reported research in strongly represented by northern hemisphere studies (Figure 1). Most life history traits examined did not exhibit a strong phylogenetic signal (Table 1). Size at first reproduction was the only life history trait we found to have strong phylogenetic signal among life history traits (Table 1). We also found no phylogenetic signal of climate, temperature, or precipitation.
The modes of evolution varied among the life history traits that we examined. Age at first reproduction, size at first reproduction, size at death, and lifespan were all better predicted by simple Brownian motion models, while clutch size, juvenile growth rate, population growth rate, and interclutch interval were all better predicted by the Ornstein–Uhlenbeck models (as determined by AIC values; Table 2). However, the thermal plasticity of life history traits was better explained by Brownian motion, except for clutch size which was better explained by the Ornstein–Uhlenbeck model (Table 3).

3.3. Species-Level Analyses

Climate variables showed no phylogenetic signal in our species-level analysis. Climatic variables were not significant predictors of life history variation (generalized least squares regressions), except for size at first reproduction which was negatively correlated to maximum and mean summer temperatures (β = −0.364, Table 2, Figure 3A). Best performing models were effective at explaining variance in the dataset (R2 = 0.38–0.99), but climate (PCs) had little explanatory power for all other life history traits (Table 2).
In contrast, climate variables explained significant variation in the thermal response of life history traits models, including thermal response of size in first reproduction, thermal response of clutch size, and thermal response of population growth rate (Table 3). All four of climate variables were significant predictors of the thermal response of size at first reproduction (negative correlation with temperature; positive correlation with precipitation; Table 3, Figure 3B). Thermal response of clutch size was positively correlated with mean and maximum summer temperatures (Table 3, Figure 3C). Thermal response in population growth rate was negatively correlated with minimum and maximum precipitation (Table 3, Figure 3D).

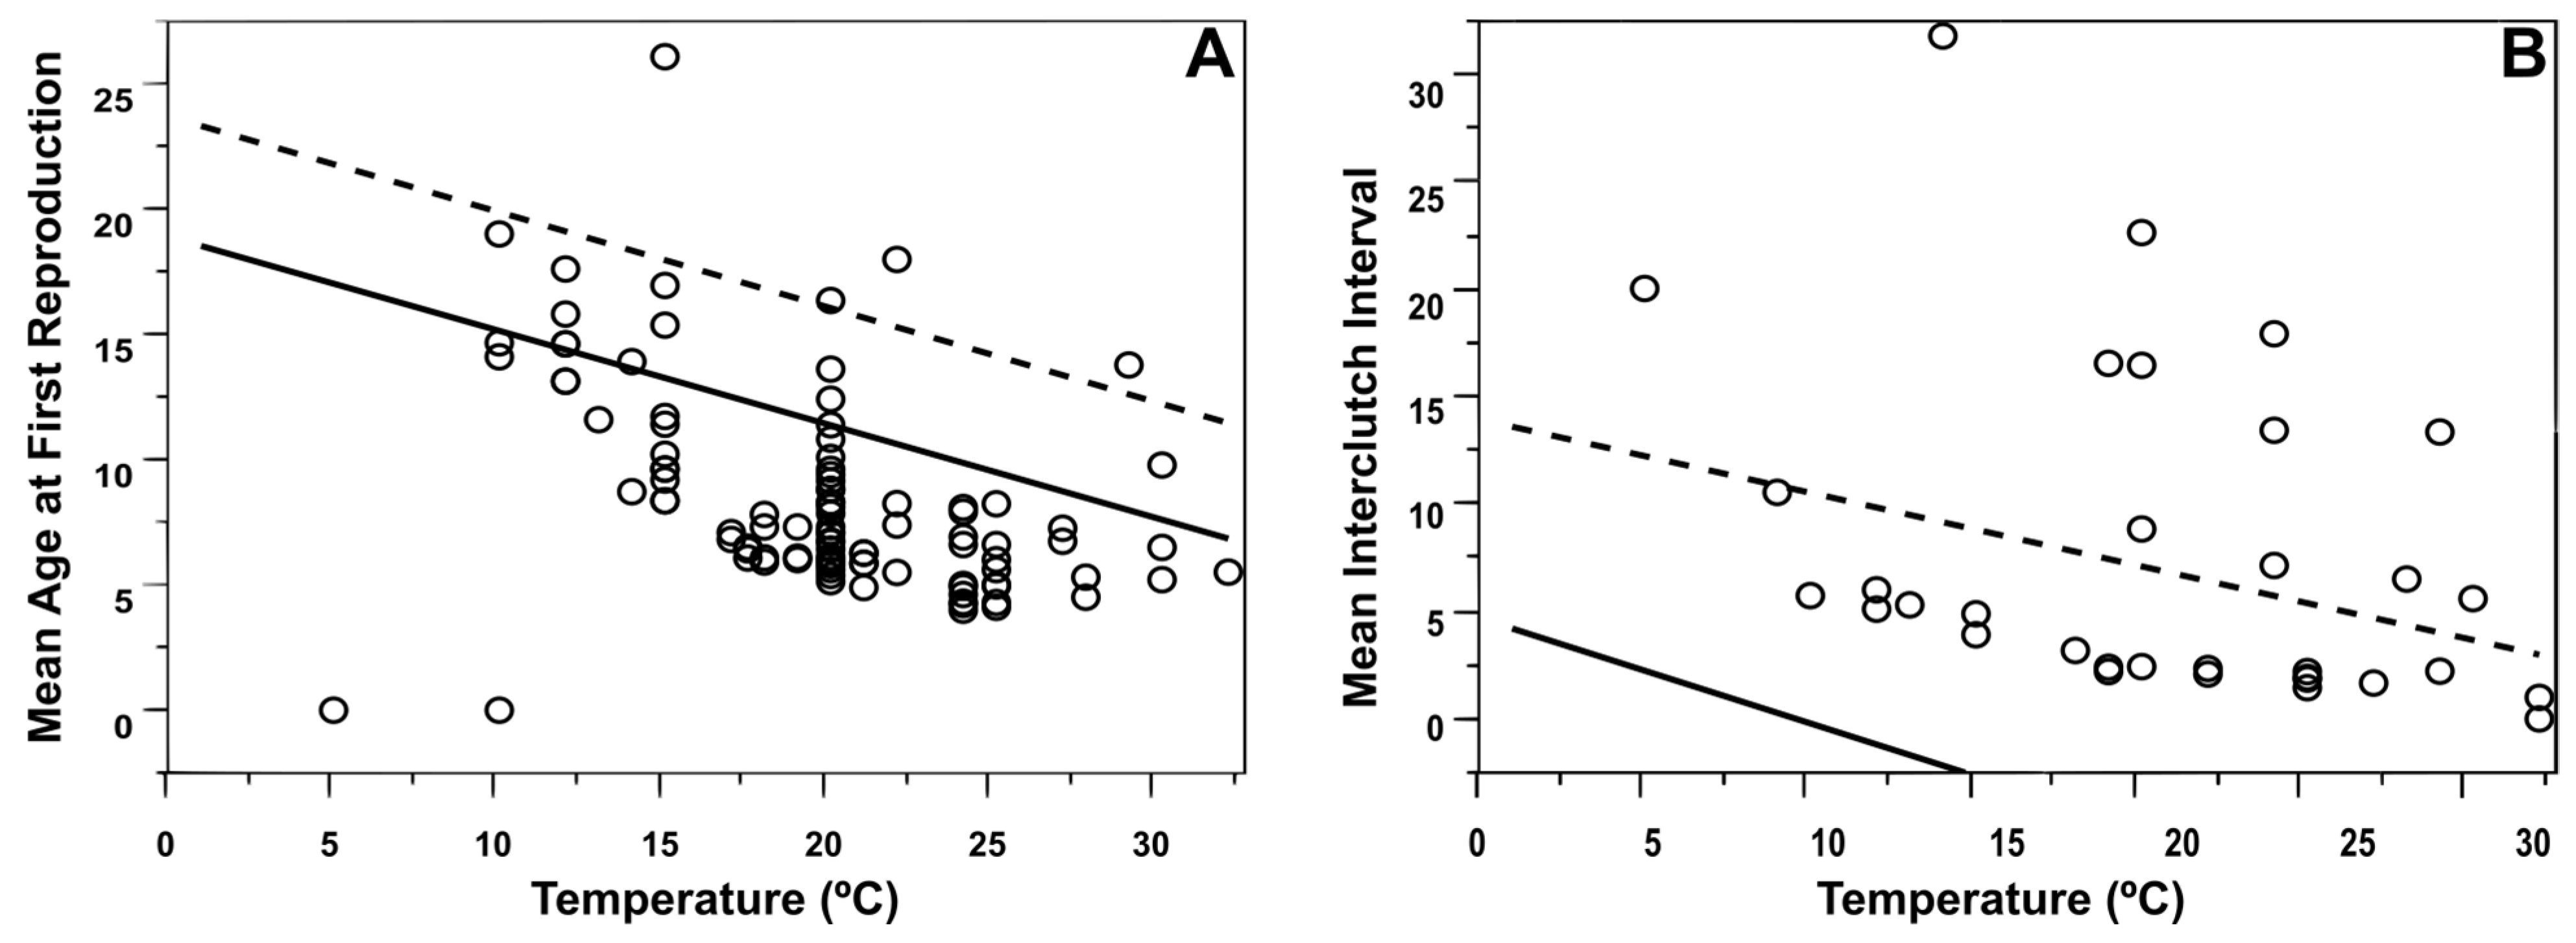
3.4. Population-Level Analyses

At the population level, most life history traits were strongly correlated to climate, temperature, and latitude; however, adding species identity to the models increased the predictive power of the model for size at first reproduction, clutch size, and juvenile growth rate (Table 4 and Table 5). Age at first reproduction was strongly negatively correlated to experimental temperature (Tempexp), temperature, and latitude, independent of species identity (Table 4, Figure 4A). Size at first reproduction was negatively correlated to minimum temperatures and latitude; clutch size was positively correlated with annual precipitation seasonality and experimental temperature, and negatively correlated with latitude; and juvenile growth rate was positively correlated with maximum temperatures, minimum temperatures, annual precipitation, and latitude (Table 4). Population growth rate was positively correlated with experimental temperature, but the effect size was very low, predicting 2% of the variance in the data (Table 4); the full model performed equally as well (similar AICc values) but explained little more variance at 12% (Table 4).
Size at death, interclutch interval, and lifespan all were highly correlated with experimental temperature (Tempexp) and the model fits were not improved by adding species identity as a fixed effect. Size at death was strongly negatively correlated to experimental temperature, which explained >93% of the variance in the data (Table 4). Interclutch interval was strongly correlated with experimental temperature and negatively correlated with latitude with 80% effect size (Table 4, Figure 4B). Meanwhile, lifespan was highly correlated to all climatic variables, experimental temperature, and latitude, but was not improved by adding species identity (Table 4). Lifespan was negatively correlated with maximum and minimum temperatures, annual precipitation, experimental temperature, and latitude; and positively correlated with precipitation seasonality (Table 4).

4. Discussion

We found little support for phylogenetic or climatic signals in life history trait evolution but strong support for the effects of climate on life history trait plasticity at the species-level in Daphnia. We found strong support for the effects of climate, rearing temperature, and latitude on individual Daphnia populations, and species identity improved the predictive power of few models. Therefore, the evolution of life history traits and their thermal plasticity may best be tested and understood at the level of individual populations rather than generalizing across species or even groups of species (Table 5). We found little support for the general rules that allometric life history traits are associated with phylogenetic lineage and rate-limited life history traits are associated with temperature. Instead, life history trait evolution and thermal plasticity may better be predicted by mode of evolution in Daphnia (Table 1) and possibly other poikilotherms.

4.1. Species-Level Analyses

Life history traits can vary considerably among species, yet we find that species groups perform less like their closest relatives than predicted [22,31,32,47]. This could be explained by the group’s cosmopolitan distribution or the extreme climate variability across its range [48]. We found that the size at first reproduction was highly dependent on their species identity—a commonly held theoretical prediction [49,50,51,52]. We did not find that groups that were more closely related were more similar in their size at first reproduction, simply that species identity has a strong effect.
Both of our phylogenetic approaches (Blomberg’s K and Pagel’s λ) indicated that juvenile growth rate has a marginally significant phylogenetic signal, and therefore closely related species were more similar in their juvenile growth rate than a null Brownian motion evolution model would predict. This suggests that there is a strong selective pressure on juvenile growth rate in certain clades, and given Daphnia’s long-documented history of portfolio effects [53,54,55], allee effects [56,57], and seasonal growth [16,58,59,60,61,62], our findings corroborate a strong selective pressure for Daphnia species to grow quickly in order to reproduce early and often. Size-dependent life history traits seem to be phylogenetically constrained, and of course, juvenile growth rate and size at first reproduction are linked traits, supporting previous assertions that body size is particularly phylogenetically constrained [63,64,65].
The weak phylogenetic signal (p = 0.13) in the thermal response of age at first reproduction where again, groups that are more closely related have more similar responses to temperature (Table 1) deserves further investigation. This signal may be due to Daphnia’s phenotypic plasticity [66] ability to change reproductive strategies dependent on the current environment [67,68]. Daphnia have two major reproductive strategies: asexual reproduction resulting in genetic clones of the mother and sexual reproduction resulting in genetically distinct individuals. However, these two strategies also represent income versus capital breeding strategies, respectively [69,70,71]. If environmental (particularly temperature) conditions are beneficial, Daphnia tend to grow and reproduce rapidly [72,73]; whereas, if environmental conditions (temperature) are suboptimal, Daphnia can store resources as lipids or reduce growth rates [74], resulting in longer times to first clutch or sexual mating, producing resting eggs (ephippia) instead of a first clutch. The plasticity necessary to invoke these two strategies may explain why we see a strong phylogenetic signal particularly in the thermal response (plasticity) to age at first reproduction with but not the trait itself.
We also make meaningful inferences about life history trait evolution modes from these results. Age at first reproduction, size at first reproduction, size at death, and lifespan are all better predicted by the phylogenetic generalized least squares model with Brownian motion (Table 2). This suggests that these four traits are randomly walking (drift) to shifting optima through time. This result may be attributable to the phenotypic plasticity we see across the Daphnia clade [75]. We expect these traits to have variable optima due to the wide range of environments that Daphnia inhabit [48,75], resulting in the variation we see in these traits. Notably, it has been suggested that individual lake environments can produce independently evolving Daphnia lineages based on local environmental differences, such as predation [76,77], and our results strongly support that assertion for these life history traits.
Conversely, clutch size, interclutch interval, and juvenile and population growth rates are all better predicted by the phylogenetic generalized least squares model with Ornstein–Ulhenbeck evolution (Table 2). This suggests that these traits have an absolute evolutionary adaptive peak, and though individual lineages may deviate from the peak, the mean trait value is maintained through time [78,79]. We might expect this to be true for clutch-related traits given the physical limitations of making vast changes to clutch size [80,81], and, as previously stated, growth rates are phylogenetically constrained but likely faster growth rates are always selected for given Daphnia’s ecology [82]. Our model outputs support stationary mean trait values for these life history traits, where the elevation of the adaptive peak is always evolving to become steeper (faster rates or a specific egg number/frequency) but not moving from specific mean trait values.
If we consider that the thermal response of life history traits represents phenotypic plasticity to locally variable environments [83], then the near unanimous output that thermal response traits evolve under Brownian motion makes intuitive sense. The thermal response in all life history traits (except clutch size) evolve as a random walk (Table 2), further supporting the assertion that individual Daphnia species are ecological distinct yet locally adapted [84]. Individual lakes present specific and different selective pressures, be them predatory size-selection [85], thermal variation [15,86], or extreme seasonality [87,88]. These local selective pressures likely result in an evolutionary random walk for phenotypic plasticity in life history traits [89]. However, we do see the phylogenetic generalized least squares (PGLS) models under Ornstein–Uhlenbeck evolution again being more predictive for clutch size, further underscoring the physical constraints on an optimum egg number per species, as previously stated (Table 2).
Though the PGLS models account for phylogenetic dependence, we also calculated simple phylogenetic independent contrasts (PICs) pairwise for each life history trait (Supplemental Table S4). We found significant differences in pairings of size at first reproduction and size at death; population growth rate and interclutch interval; and growth rate and size at death (Supplemental Figure S1). We found a marginally significant difference in age at first reproduction and clutch size (Supplemental Figure S1A).
All other pairwise comparisons were not significant (Supplemental Table S4), implying that most life history traits in Daphnia are phylogenetically independent across species. For size at first reproduction and size at death (trait pairs that showed significant phylogenetic dependence) there was overdispersion of those life history traits in closely related taxa (Supplemental Figure S1). Species that are more closely related to each other show more divergent life history traits than one would expect via evolutionary history, suggesting that some species pairs may be undergoing niche partitioning or that the evolution of these life history traits were important in speciation.

4.2. Phylogeny

Though we constructed this phylogeny primarily for subsequent analyses, the phylogeny demonstrates the need to understand species delimitation in extremely plastic and readily hybridizing groups such as the Daphnia. We left low bootstrap support branches in our analysis to test for species-level effects but recognize that many of these clades would be condensed to single species or need more concerted sampling for proper delimitation (Figure 2). With species known to be readily hybridizing, it is extremely difficult to delimit them based on genetic analyses alone, and this phylogeny supports that notion [90,91,92]. The evolutionary history of this group is yet complicated by an extremely skewed sex ratio, identification issues due to phenotypic plasticity, mixtures of sexual and asexual reproduction, and historic and recent introgression events, all making genetic species delimitation very difficult.

4.3. Life History Traits and Climate Dataset

The final dataset constructed here is, to our knowledge, the largest repository of Daphnia life history traits. Over 360 individual populations of Daphnia from over 75 research articles were assembled for eight life history traits across 20 species. Our final dataset captured an important portion of Daphnia species (N = 20), but there are also notable weaknesses including an overabundance of studies on D. magna and D. pulex-pulicaria, accompanied by an abundance of Northern hemispheric sampling.
One of the attractive advantages of Daphnia is their extreme accessibility for meaningful ecological and evolutionary research; however, much like in Drosophila, we are missing much of the naturally occurring genetic and phenotypic variability in this group due to a lack of sampling in the Southern hemisphere, particularly with species of invasive concern like D. lumholtzi, believed to be native to central Africa. Capturing more parameter space in these ecological and evolutionary contexts may enable us to better understand this group’s incredible ability to adapt to changing environments and hybridize between divergent lineages.

4.4. Population-Level Analyses

Most of our ordinary least squares models were improved by adding species identity as a fixed effect, despite the fact that most life history traits have no phylogenetic signal (Table 4 and Table 5). This would be consistent with species identity having strong predictive power for how local population respond to their environment, particularly temperature, but that pattern is not recapitulated across the phylogeny in a meaningful way. This result also may be indicative of population-level signals being masked at the global (species) level due to averaging [93], particularly in large ecological datasets [94].
At the population level, we observed the temperature at which the Daphnia are reared (local temperature) has significant predictive power in all life history traits except size at first reproduction and clutch size (Table 4), consistent with our previous conclusions that size at first reproduction is particularly constrained by phylogeny and that thermal response in clutch size has low variability and species-dependence.
The models generated by the population-level analyses explain between 27% (age at first reproduction) to 94% (size at death) of the variation in the dataset (Table 4), with the exception of population growth rate with very low predictive power at 12%. We understand this high effect size to be attributable to the importance of temperature to the evolution of life history traits. All models contain temperature (either annual or experimental) as significant predictors with high predictive power.
Only half of the population-level life history trait models were improved by the addition of species identity as a fixed effect (Table 4). Even in cases where the model was improved (via AICc score), the predictive value did not substantially improve nor was AICc value substantially decreased by adding species identity. This suggests that species identity is valuable information, even at the population level, but that temperature is a significantly more important driver in life history trait evolution for Daphnia, as can be seen by the effect size and significance values for experimental temperature (Table 4). This phenomenon has been well-documented for decades (Table S1), but this analysis, in particular, adds further evidence that it is rarely climatic temperature or temperature variability that predicts life history traits, but absolute temperature instead [95,96]. Notable exceptions to this include size at first reproduction and juvenile growth rate which are more significantly correlated with temperature range (PC2temp) than constant absolute temperature (Tempexp). Given these two traits’ phylogenetic signal and thermal response at the species-level, these findings support their susceptibility to variation in temperature. Additionally, the high predictive value of our population-level life history models (Table 4) along with their species-specific coefficients (Supplement Table S3) will be a valuable resource for understanding Daphnia populations and local adaptation broadly.

5. Conclusions

Life history traits are some of the most complex traits yet most important for organisms’ evolutionary success [1]. Understanding how they evolve is of utmost importance particularly for cosmopolitan species that experience wide ranges of environmental conditions and those that exhibit life history plasticity [88], particularly to temperature variability [10,12,97]. Especially for poikilothermic organisms, such as Daphnia, we expect environmental changes to have drastic implications for their ongoing success due to global climate change [88] and yet their important trophic position to many freshwater ecosystems makes them of particular concern [98]. Our analyses are an attempt to understand Daphnia life history traits through several different lenses: species versus populations and traits versus trait responses (to temperature). Daphnia is a particularly useful system in this regard because we have studied the thermal phenotypic plasticity of Daphnia for more than 5 decades (Table S1) which gives an abundance of data to test for not only the phylogenetic signal of life history traits but also the phylogenetic signal of the thermal response of life history traits. These analyses add to previous work in understanding global trends in life history trait evolution [1,22,99], but make important additions to our understanding of life history trait evolution in aquatic system, which we know are warming on increased climate trajectories [100], and to the global phylogenetic trends in thermal plasticity of life history traits.
We found that our hypotheses about rate-limited life history traits versus allometric life history traits is too simplistic to fully capture the evolution of life history traits that we see in Daphnia. We find that a more apt hypothesis is that considering the mode of life history trait evolution may be a more illustrative way of predicting life history trait response to temperature. Identifying whether traits having shifting optima versus static optima may be more indicative of life history trait trends than allometry or rate limitations alone. However, our global analysis is consistent with previous work with global terrestrial groups [22] that mode of evolution may be more useful than trait associations with allometry or rate limitation, which concurs with findings from small studies [101,102]. Unlike previous global analyses with terrestrial groups [22], we have high predictive power on the majority of our models, despite having few traits with phylogenetic signal, suggesting that these life history trait conclusions may be especially pertinent to aquatic systems or to poikilothermic organisms, more broadly. Despite the successful predictive power of many of our models, in most cases, they remain quite complex, needing to retain long-term temperature and precipitation data, rearing temperature (Tempexp), latitude, and species identity, further underscoring the complexity of life history traits and their evolution.

Supplementary Materials

The following supporting information can be downloaded at: https://www.mdpi.com/article/10.3390/hydrobiology2010005/s1, Figure S1: Phylogenetic Independent Contrasts (PICs) of marginally significant (p < 0.10: A) and significant (p < 0.05; B–D) pairwise life history trait comparisons; Table S1: Full citations for extracted meta-analysis data for Daphnia life history traits; Table S2: GenBank accession numbers for sequences used to generate six-loci molecular phylogeny for Daphnia; Table S3: Species-specific coefficients from population-level ordinary least squares (OLS) regressions comparing life history reaction norms and climate variables; Table S4: Phylogenetic independent contrast (PIC) pairwise trait comparisons.

Author Contributions

Conceptualization, L.L.B. and D.M.P.; methodology, L.L.B.; formal analysis, L.L.B.; resources, L.L.B. and D.M.P.; data curation, L.L.B.; writing—original draft preparation, L.L.B.; writing—review and editing, L.L.B. and D.M.P.; visualization, L.L.B.; supervision, L.L.B. and D.M.P. All authors have read and agreed to the published version of the manuscript.

Funding

This research received no external funding.

Institutional Review Board Statement

Not applicable.

Informed Consent Statement

Not applicable.

Data Availability Statement

No new data were created or analyzed in this study. Data sharing is not applicable to this article.

Acknowledgments

We would like to thank Stephen Stearns for his contributions to the manuscript from its inception as part of his Life Histories Evolution course at Yale University. We would also like to thank Erica Holdridge, Daniel Wieczynski, Daniel MacGuigan, Stephen Gaughran, Colin Kremer, and Ava Ghezelayagh for their help and support throughout the project.

Conflicts of Interest

The authors declare no conflict of interest.

References

  1. Stearns, S.C. The Evolution of Life Histories; Oxford University Press: Oxford, UK, 1992. [Google Scholar]
  2. Price, T.; Schluter, D. On the low heritability of life-history traits. Evolution 1991, 45, 853–861. [Google Scholar] [CrossRef]
  3. Stearns, S.C. Life history evolution: Successes, limitations, and prospects. Naturwissenschaften 2000, 87, 476–486. [Google Scholar] [CrossRef]
  4. Van Noordwijk, A.J.; de Jong, G. Acquisition and allocation of resources: Their influence on variation in life history tactics. Am. Nat. 1986, 128, 137–142. [Google Scholar] [CrossRef] [Green Version]
  5. Metcalfe, N.B.; Monaghan, P. Compensation for a bad start: Grow now, pay later? Trends Ecol. Evol. 2001, 16, 254–260. [Google Scholar] [CrossRef]
  6. Pinsky, M.L.; Worm, B.; Fogarty, M.J.; Sarmiento, J.L.; Levin, S.A. Marine taxa track local climate velocities. Science 2013, 341, 1239–1242. [Google Scholar] [CrossRef] [PubMed] [Green Version]
  7. Nylin, S.; Gotthard, K. Plasticity in life-history traits. Annu. Rev. Entomol. 1998, 43, 63–83. [Google Scholar] [CrossRef] [PubMed] [Green Version]
  8. Partridge, L.; Barrie, B.; Barton, N.H.; Fowler, K.; French, V. Rapid laboratory evolution of adult life-history traits in Drosophila melanogaster in response to temperature. Evolution 1995, 49, 538–544. [Google Scholar] [CrossRef] [PubMed]
  9. Sponaugle, S.; Grorud-Colvert, K.; Pinkard, D. Temperature-mediated variation in early life history traits and recruitment success of the coral reef fish Thalassoma bifasciatum in the Florida Keys. Mar. Ecol. Prog. Ser. 2006, 308, 1–15. [Google Scholar] [CrossRef]
  10. Bernot, R.J.; Dodds, W.K.; Quist, M.C.; Guy, C.S. Temperature and kairomone induced life history plasticity in coexisting Daphnia. Aquatic Ecology 2006, 40, 361–372. [Google Scholar] [CrossRef]
  11. Mitchell, S.E.; Lampert, W. Temperature adaptation in a geographically widespread zooplankter. Daphnia Magna. J. Evol. Biol. 2000, 13, 371–382. [Google Scholar] [CrossRef]
  12. Sakwińska, O. Plasticity of Daphnia magna life history traits in response to temperature and information about a predator. Freshw. Biol. 1998, 39, 681–687. [Google Scholar] [CrossRef]
  13. Arnett, A.E.; Gotelli, N.J. Geographic variation in life-history traits of the ant lion, Myrmeleon immaculatus: Evolutionary implications of Bergmann’s rule. Evolution 1999, 53, 1180–1188. [Google Scholar] [PubMed]
  14. Lombardi-Carlson, L.A.; Cortés, E.; Parsons, G.R.; Manire, C.A. Latitudinal variation in life-history traits of bonnethead sharks, Sphyrna tiburo,(Carcharhiniformes: Sphyrnidae) from the eastern Gulf of Mexico. Mar. Freshw. Res. 2003, 54, 875–883. [Google Scholar] [CrossRef]
  15. Geller, W.; Müller, H. Seasonal variability in the relationship between body length and individual dry weight as related to food abundance and clutch size in two coexisting Daphnia species. J. Plankton Res. 1985, 7, 1–18. [Google Scholar] [CrossRef]
  16. Gillooly, J.F.; Dodson, S.I. Latitudinal patterns in the size distribution and seasonal dynamics of new world, freshwater cladocerans. Limnol. Oceanogr. 2000, 45, 22–30. [Google Scholar] [CrossRef]
  17. Dodson, S. Predicting crustacean zooplankton species richness. Limnol. Oceanogr. 1992, 37, 848–856. [Google Scholar] [CrossRef]
  18. Hessen, D.O.; Faafeng, B.A.; Smith, V.H.; Bakkestuen, V.; Walseng, B. Extrinsic and intrinsic controls of zooplankton diversity in lakes. Ecology 2006, 87, 433–443. [Google Scholar] [CrossRef] [Green Version]
  19. Weber, A.; Declerck, S. Phenotypic plasticity of Daphnia life history traits in response to predator kairomones: Genetic variability and evolutionary potential. Hydrobiologia 1997, 360, 89–99. [Google Scholar] [CrossRef]
  20. Rohatgi, A. Webplotdigitizer: Version 4.4. 2020. Available online: https://automeris.io/WebPlotDigitizer (accessed on 1 December 2018).
  21. Hijmans, R.J.; Cameron, S.E.; Parra, J.L.; Jones, P.G.; Jarvis, A. Very high resolution interpolated climate surfaces for global land areas. Int. J. Climatol. 2005, 25, 1965–1978. [Google Scholar] [CrossRef]
  22. Mesquita, D.O.; Faria, R.G.; Colli, G.R.; Vitt, L.J.; Pianka, E.R. Lizard life-history strategies. Austral Ecol. 2016, 41, 1–5. [Google Scholar] [CrossRef]
  23. Revell, L.J. Phylogenetic signal and linear regression on species data. Methods Ecol. Evolution. 2010, 1, 319–329. [Google Scholar] [CrossRef]
  24. Edgar, R.C. MUSCLE: Multiple sequence alignment with high accuracy and high throughput. Nucleic Acids Res. 2004, 32, 1792–1797. [Google Scholar] [CrossRef] [PubMed] [Green Version]
  25. Lanfear, R.; Frandsen, P.B.; Wright, A.M.; Senfeld, T.; Calcott, B. PartitionFinder 2: New methods for selecting partitioned models of evolution for molecular and morphological phylogenetic analyses. Mol. Biol. Evol. 2016, 34, 772–773. [Google Scholar] [CrossRef] [PubMed] [Green Version]
  26. Huelsenbeck, J.P.; Ronquist, F. MRBAYES: Bayesian inference of phylogenetic trees. Bioinformatics 2001, 17, 754–755. [Google Scholar] [CrossRef] [Green Version]
  27. Colbourne, J.K.; Hebert, P.D. The systematics of North American Daphnia (Crustacea: Anomopoda): A molecular phylogenetic approach. Philos. Trans. R. Soc. London. Ser. B Biol. Sci. 1996, 351, 349–360. [Google Scholar]
  28. Petrusek, A.; Hobæk, A.; Nilssen, J.P.; Skage, M.; ČErný, M.; Brede, N.; Schwenk, K. A taxonomic reappraisal of the European Daphnia longispina complex (Crustacea, Cladocera, Anomopoda). Zool. Scr. 2008, 37, 507–519. [Google Scholar] [CrossRef]
  29. Taylor, D.J.; Hebert, P.D. Genetic assessment of species boundaries in the North American Daphnia longispina complex (Crustacea: Daphniidae). Zool. J. Linn. Soc. 1994, 110, 27–40. [Google Scholar] [CrossRef]
  30. Pagel, M. Inferring evolutionary processes from phylogenies. Zool. Scr. 1997, 26, 331–348. [Google Scholar] [CrossRef]
  31. Pagel, M. Inferring the historical patterns of biological evolution. Nature 1999, 401, 877. [Google Scholar] [CrossRef]
  32. Blomberg, S.P.; Garland, T.; Ives, A.R. Testing for phylogenetic signal in comparative data: Behavioral traits are more labile. Evolution. 2003, 57, 717–745. [Google Scholar]
  33. Webb, C.O.; Ackerly, D.D.; McPeek, M.A.; Donoghue, M.J. Phylogenies and community ecology. Annu. Rev. Ecol. Syst. 2002, 33, 475–505. [Google Scholar] [CrossRef] [Green Version]
  34. Ives, A.R.; Garland, T., Jr. Phylogenetic logistic regression for binary dependent variables. Syst. Biol. 2009, 59, 9–26. [Google Scholar] [CrossRef] [PubMed]
  35. Ives, A.R.; Midford, P.E.; Garland, T., Jr. Within-species variation and measurement error in phylogenetic comparative methods. Syst. Biol. 2007, 56, 252–270. [Google Scholar] [CrossRef] [PubMed] [Green Version]
  36. SAS Institute Inc. JMP® Pro 13, 13.0.0 (64-bit); SAS Institute Inc.: Cary, NC, USA, 2016.
  37. Grafen, A. The phylogenetic regression. Philos. Trans. R. Soc. Lond. B. Biol. Sci. 1989, 326, 119–157. [Google Scholar]
  38. Pinheiro, J.; Bates, D.; DebRoy, S.; Sarkar, D. R Core Team Nlme: Linear and Nonlinear Mixed Effects Models. R Package Version 3.1-117. 2014. Available online: https://CRAN.R-project.org/package=nlme. (accessed on 1 December 2018).
  39. Cavalli-Sforza, L.L.; Edwards, A.W. Phylogenetic analysis: Models and estimation procedures. Evolution 1967, 21, 550–570. [Google Scholar] [CrossRef] [Green Version]
  40. Lande, R. Natural selection and random genetic drift in phenotypic evolution. Evolution 1976, 30, 314–334. [Google Scholar] [CrossRef]
  41. Paradis, E.; Claude, J.; Strimmer, K. APE: Analyses of phylogenetics and evolution in R language. Bioinformatics 2004, 20, 289–290. [Google Scholar] [CrossRef] [Green Version]
  42. Felsenstein, J. Phylogenies and the comparative method. Am. Nat. 1985, 125, 1–15. [Google Scholar] [CrossRef]
  43. Martins, E.P.; Hansen, T.F. Phylogenies and the comparative method: A general approach to incorporating phylogenetic information into the analysis of interspecific data. Am. Nat. 1997, 149, 646–667. [Google Scholar] [CrossRef] [Green Version]
  44. Ripley, B.; Venables, B.; Bates, D.M.; Hornik, K.; Gebhardt, A.; Firth, D. R Package ‘mass’. 2013. Available online: https://CRAN.R-project.org/package=MASS (accessed on 1 December 2018).
  45. Harmon, L.J.; Weir, J.T.; Brock, C.D.; Glor, R.E.; Challenger, W. GEIGER: Investigating evolutionary radiations. Bioinformatics 2007, 24, 129–131. [Google Scholar] [CrossRef] [Green Version]
  46. R Development Core Team, R stats. RA Lang Environ. Stat Comput. 2013, 55, 275–286.
  47. Freckleton, R.P.; Harvey, P.H.; Pagel, M. Phylogenetic analysis and comparative data: A test and review of evidence. Am. Nat. 2002, 160, 712–726. [Google Scholar] [CrossRef]
  48. Colbourne, J.K.; Pfrender, M.E.; Gilbert, D.; Thomas, W.K.; Tucker, A.; Oakley, T.H.; Tokishita, S.; Aerts, A.; Arnold, G.J.; Boore, J.L.; et al. The ecoresponsive genome of Daphnia pulex. Science 2011, 331, 555–561. [Google Scholar] [CrossRef] [PubMed] [Green Version]
  49. Gliwicz, Z.M.; Boavida, M.J. Clutch size and body size at first reproduction in Daphnia pulicaria at different levels of food and predation. J. Plankton Res. 1996, 18, 863–880. [Google Scholar] [CrossRef]
  50. Shine, R. “Costs” of reproduction in reptiles. Oecologia 1980, 46, 92–100. [Google Scholar] [CrossRef] [PubMed]
  51. McNab, B.K. On the ecological significance of Bergmann’s rule. Ecology 1971, 52, 845–854. [Google Scholar] [CrossRef]
  52. Blackburn, T.M.; Gaston, K.J.; Loder, N. Geographic gradients in body size: A clarification of Bergmann’s rule. Divers. Distrib. 1999, 5, 165–174. [Google Scholar] [CrossRef]
  53. Steiner, C.F. Temporal stability of pond zooplankton assemblages. Freshwat. Biol. 2005, 50, 105–112. [Google Scholar] [CrossRef]
  54. Vasseur, D.A.; Gaedke, U. Spectral analysis unmasks synchronous and compensatory dynamics in plankton communities. Ecology 2007, 88, 2058–2071. [Google Scholar]
  55. Drake, J.M.; Lodge, D.M. Effects of environmental variation on extinction and establishment. Ecol. Lett. 2004, 7, 26–30. [Google Scholar] [CrossRef]
  56. Kramer, A.M.; Drake, J.M. Experimental demonstration of population extinction due to a predator-driven Allee effect. J. Anim. Ecol. 2010, 79, 633–639. [Google Scholar] [CrossRef]
  57. Hanski, I.; Ranta, E. Coexistence in a patchy environment: Three species of Daphnia in rock pools. J. Anim. Ecol. 1983, 52, 263–279. [Google Scholar] [CrossRef]
  58. West, D.C.; Post, D.M. Impacts of warming revealed by linking resource growth rates with consumer functional responses. J. Anim. Ecol. 2016, 85, 671–680. [Google Scholar] [CrossRef]
  59. Luecke, C.; Vanni, M.J.; Magnuson, J.J.; Kitchell, J.F.; Jacobson, P.T. Seasonal regulation of Daphnia populations by planktivorous fish: Implications for the spring clear-water phase. Limnol. Oceanogr. 1990, 35, 1718–1733. [Google Scholar] [CrossRef]
  60. Scheffer, M.; Rinaldi, S.; Kuznetsov, Y.A.; van Nes, E.H. Seasonal dynamics of Daphnia and algae explained as a periodically forced predator-prey system. Oikos 1997, 80, 519–532. [Google Scholar] [CrossRef]
  61. Müller-Navarra, D.; Lampert, W. Seasonal patterns of food limitation in Daphnia galeata: Separating food quantity and food quality effects. J. Plankton Res. 1996, 18, 1137–1157. [Google Scholar] [CrossRef] [Green Version]
  62. Edmondson, W. The seasonal life history of Daphnia in an arctic lake. Ecology 1955, 36, 439–455. [Google Scholar] [CrossRef]
  63. Fairbairn, D.J. Allometry for sexual size dimorphism: Pattern and process in the coevolution of body size in males and females. Annu. Rev. Ecol. Syst. 1997, 28, 659–687. [Google Scholar] [CrossRef]
  64. Gould, S.J. Allometry and size in ontogeny and phylogeny. Biol. Rev. 1966, 41, 587–638. [Google Scholar] [CrossRef]
  65. Ryan, M.J.; Brenowitz, E.A. The role of body size, phylogeny, and ambient noise in the evolution of bird song. Am. Nat. 1985, 126, 87–100. [Google Scholar] [CrossRef]
  66. Scheiner, S.M.; Berrigan, D. The genetics of phenotypic plasticity. VIII. The cost of plasticity in Daphnia pulex. Evolution 1998, 52, 368–378. [Google Scholar] [CrossRef] [PubMed]
  67. Giesel, J.T. Reproductive strategies as adaptations to life in temporally heterogeneous environments. Annu. Rev. Ecol. Syst. 1976, 7, 57–79. [Google Scholar] [CrossRef]
  68. Zhang, L.; Baer, K. The influence of feeding, photoperiod and selected solvents on the reproductive strategies of the water flea, Daphnia magna. Environ. Pollut. 2000, 110, 425–430. [Google Scholar] [CrossRef] [PubMed]
  69. Jönsson, K.I. Capital and income breeding as alternative tactics of resource use in reproduction. Oikos 1997, 78, 57–66. [Google Scholar] [CrossRef]
  70. Bonnet, X.; Bradshaw, D.; Shine, R. Capital versus income breeding: An ectothermic perspective. Oikos 1998, 83, 333–342. [Google Scholar] [CrossRef]
  71. Bowman, L.L.; Kondrateva, E.S.; Silow, E.A.; Wilburn, P.; Yampolsky, L.Y. A capital breeder in a heterogeneous environment: Lipid reserves and RNA: DNA ratio in Lake Baikal’s endemic Epischura. J. Great Lakes Res. 2017, 43, 280–288. [Google Scholar] [CrossRef] [Green Version]
  72. Craddock, D.R. Effects of increased water temperature on Daphnia pulex. Fish. Bull 1976, 74, 403–408. [Google Scholar]
  73. Burns, C.W. Relation between filtering rate, temperature, and body size in four species of Daphnia. Limnol. Oceanogr. 1969, 14, 693–700. [Google Scholar] [CrossRef]
  74. Tessier, A.J.; Henry, L.L.; Goulden, C.E.; Durand, M.W. Starvation in Daphnia: Energy reserves and reproductive allocation1. Limnol. Oceanogr. 1983, 28, 667–676. [Google Scholar] [CrossRef]
  75. Scheiner, S.M.; Yampolsky, L.Y. The evolution of Daphnia pulex in a temporally varying environment. Genet. Res. 1998, 72, 25–37. [Google Scholar] [CrossRef]
  76. Adamowicz, S.J.; Hebert, P.D.; Marinone, M.C. Species diversity and endemism in the Daphnia of Argentina: A genetic investigation. Zool. J. Linn. Soc. 2004, 140, 171–205. [Google Scholar] [CrossRef] [Green Version]
  77. Hebert, P.D.; Wilson, C.C. Provincialism in plankton: Endemism and allopatric speciation in Australian Daphnia. Evolution. 1994, 48, 1333–1349. [Google Scholar] [CrossRef]
  78. Beaulieu, J.M.; Jhwueng, D.; Boettiger, C.; O’Meara, B.C. Modeling stabilizing selection: Expanding the Ornstein–Uhlenbeck model of adaptive evolution. Evol. Int. J. Org. Evol. 2012, 66, 2369–2383. [Google Scholar] [CrossRef] [PubMed]
  79. Ingram, T.; Mahler, D.L. SURFACE: Detecting convergent evolution from comparative data by fitting Ornstein-Uhlenbeck models with stepwise Akaike Information Criterion. Methods Ecol. Evol. 2013, 4, 416–425. [Google Scholar] [CrossRef]
  80. Sinervo, B.; Licht, P. Hormonal and physiological control of clutch size, egg size, and egg shape in side-blotched lizards (Uta stansburiana): Constraints on the evolution of lizard life histories. J. Exp. Zool. 1991, 257, 252–264. [Google Scholar] [CrossRef]
  81. Monaghan, P.; Bolton, M.; Houston, D. Egg production constraints and the evolution of avian clutch size. Proc.R.Soc.Lond.B. 1995, 259, 189–191. [Google Scholar]
  82. Stoks, R.; De Block, M.; Van De Meutter, F.; Johansson, F. Predation cost of rapid growth: Behavioural coupling and physiological decoupling. J. Anim. Ecol. 2005, 74, 708–715. [Google Scholar] [CrossRef]
  83. Schulte, P.M.; Healy, T.M.; Fangue, N.A. Thermal performance curves, phenotypic plasticity, and the time scales of temperature exposure. Integr. Comp. Biol. 2011, 51, 691–702. [Google Scholar] [CrossRef] [PubMed] [Green Version]
  84. De Meester, L.; Boersma, M.; Spaak, P. Environmental stress and local adaptation in Daphnia magna. Limnol. Oceanogr 1999, 44, 393–402. [Google Scholar] [CrossRef] [Green Version]
  85. Tessier, A.J.; Young, A.; Leibold, M. Population dynamics and body-size selection in Daphnia. Limnol. Oceanogr. 1992, 37, 1–13. [Google Scholar] [CrossRef]
  86. Stibor, H.; Lampert, W. Components of additive variance in life-history traits of Daphnia hyalina: Seasonal differences in the response to predator signals. Oikos 2000, 88, 129–138. [Google Scholar] [CrossRef]
  87. Lennon, J.T.; Smith, V.H.; Williams, K. Influence of temperature on exotic Daphnia lumholtzi and implications for invasion success. J. Plankton Res. 2001, 23, 425–433. [Google Scholar] [CrossRef] [Green Version]
  88. Duffy, M.A.; Hall, S.R.; Cáceres, C.E.; Ives, A.R. Rapid evolution, seasonality, and the termination of parasite epidemics. Ecology 2009, 90, 1441–1448. [Google Scholar] [CrossRef] [PubMed] [Green Version]
  89. Borenstein, E.; Meilijson, I.; Ruppin, E. The effect of phenotypic plasticity on evolution in multipeaked fitness landscapes. J. Evol. Biol. 2006, 19, 1555–1570. [Google Scholar] [CrossRef]
  90. Duggan, I.C.; Robinson, K.V.; Burns, C.W.; Banks, J.C.; Hogg, I.D. Identifying invertebrate invasions using morphological and molecular analyses: North American Daphnia ‘pulex’ in New Zealand fresh waters. Aquat. Invasions 2012, 7, 585–590. [Google Scholar] [CrossRef] [Green Version]
  91. Adamowicz, S.J.; Gregory, T.R.; Marinone, M.C.; Hebert, P.D. New insights into the distribution of polyploid Daphnia: The Holarctic revisited and Argentina explored. Mol. Ecol. 2002, 11, 1209–1217. [Google Scholar] [CrossRef]
  92. Penton, E.; Hebert, P.; Crease, T. Mitochondrial DNA variation in North American populations of Daphnia obtusa: Continentalism or cryptic endemism? Mol. Ecol. 2004, 13, 97–107. [Google Scholar] [CrossRef]
  93. Gilbert, B.; Bennett, J.R. Partitioning variation in ecological communities: Do the numbers add up? J. Appl. Ecol. 2010, 47, 1071–1082. [Google Scholar] [CrossRef]
  94. Guisan, A.; Zimmermann, N.E. Predictive habitat distribution models in ecology. Ecol. Model. 2000, 135, 147–186. [Google Scholar] [CrossRef]
  95. Vasseur, D.A.; DeLong, J.P.; Gilbert, B.; Greig, H.S.; Harley, C.D.; McCann, K.S.; Savage, V.; Tunney, T.D.; O’Connor, M. Increased temperature variation poses a greater risk to species than climate warming. Proc. Biol. Sci. 2014, 281, 20132612. [Google Scholar] [CrossRef] [Green Version]
  96. Wieczynski, D.J.; Vasseur, D.A. Environmental fluctuations promote intraspecific diversity and population persistence via inflationary effects. Oikos 2016, 125, 1173–1181. [Google Scholar] [CrossRef]
  97. Lampert, W. Phenotypic plasticity of the size at first reproduction in Daphnia: The importance of maternal size. Ecology 1993, 74, 1455–1466. [Google Scholar] [CrossRef]
  98. Post, D.M.; Palkovacs, E.P.; Schielke, E.G.; Dodson, S.I. Intraspecific variation in a predator affects community structure and cascading trophic interactions. Ecology 2008, 89, 2019–2032. [Google Scholar] [CrossRef] [PubMed]
  99. Roff, D.A.; Heibo, E.; Vøllestad, L. The importance of growth and mortality costs in the evolution of the optimal life history. J. Evol. Biol. 2006, 19, 1920–1930. [Google Scholar] [CrossRef] [PubMed]
  100. Hampton, S.E.; Galloway, A.W.; Powers, S.M.; Ozersky, T.; Woo, K.H.; Batt, R.D.; Labou, S.G.; O’Reilly, C.M.; Sharma, S.; Lottig, N.R.; et al. Ecology under lake ice. Ecol. Lett. 2017, 20, 98–111. [Google Scholar] [CrossRef] [PubMed]
  101. Sainte-Marie, B. A review of the reproductive bionomics of aquatic gammaridean amphipods: Variation of life history traits with latitude, depth, salinity and superfamily. Hydrobiologia 1991, 223, 189–227. [Google Scholar] [CrossRef]
  102. Costa, D.P. Reproductive and foraging energetics of high latitude penguins, albatrosses and pinnipeds: Implications for life history patterns. Am. Zool. 1991, 31, 111–130. [Google Scholar] [CrossRef]
Figure 1. Sampling sites from data synthesis where life history traits were reported for Daphnia. Each marker represents an individual population (or set of populations) included in these analyses. N = 75. References for each location can be found in Table S1.
Hydrobiology 02 00005 g001
Figure 2. Bayesian-estimated molecular phylogeny of Daphnia from three nuclear (18 s, 28 s, 5.8 s) and three mtDNA (12 s, COI, ND2) genes (concatenated). Bayesian posterior probabilities appear at nodes; nodes without values are equal to 1. The tree is rooted at Simocephalus sp., which also serves as outgroup. The three major subgenera are labeled (right) and recapitulate findings from earlier molecular phylogenies [27,28,29].
Hydrobiology 02 00005 g002
Figure 3. Bivariate scatterplots of select life history traits exhibiting high correlations with climatic variables at the species-level. Climatic principal components (PCs) as defined in Methods. Mean size at first reproduction (A) and the thermal response of mean clutch size (C) to temperature PC2, their most significant predictive variable. Thermal response in mean of size at first reproduction (SFR) against temperature PC1 (B), and the thermal response of population growth rate (PGR) against precipitation PC1 (D), their highest predictive variables, respectively. Solid lines represent the intercept and slope (partial regressions) from the phylogenetic generalized least squares models. Dashed lines represent partial regressions for ordinary least squares models. See Table 2 and Table 3 for more info; all relationships p < 0.05.
Hydrobiology 02 00005 g003
Figure 4. Bivariate scatterplots of select life history traits exhibiting high correlations with climatic variables at the population-level. Temperature is experimentally controlled rearing temperature as reported in the literature, see Methods. Mean age at first reproduction (A) and mean interclutch interval (B) to Temperature, their most significant predictive variable. Solid lines represent the intercept and slope (partial regressions) from the best ordinary least squares model after stepwise model selection (via AICc, see Methods). Dashed lines represent partial regressions for full ordinary least squares models. See Table 4 for more info; all relationships p < 0.05.
Hydrobiology 02 00005 g004
Table 1. Phylogenetic signal in life history traits and climatic data for Daphnia and mode of evolution that best describes current trait values as supported by best model AICc scores. BM = Brownian Motion; OU = Ornstein–Uhlenbeck.
VariableNBlomberg’s KpPagel’s λpMode of Evolution
Life History Traits:
      Age at First Reproduction1110.7730.091.000.08BM
      Size at First Reproduction1440.6350.03 *1.000.06BM
      Clutch Size1160.3040.56<0.0011.0OU
      Juvenile Growth Rate1200.8720.071.000.26OU
      Population Growth Rate1400.7690.151.000.40OU
      Size at Death2810.140.081.000.26BM
      Interclutch Interval370.7180.58<0.0011.0OU
      Lifespan380.6710.83<0.0011.0BM
Temperature Response
         Age at First Reproduction1110.7990.130.5360.33BM
         Size at First Reproduction1440.3820.32<0.0011.0BM
         Clutch Size1160.2570.61<0.0011.0OU
         Juvenile Growth Rate1200.3970.45<0.0011.0BM
         Population Growth Rate1400.6690.44<0.0011.0BM
         Size at Death2810.270.230.9750.29BM
         Interclutch Interval370.7350.56<0.0011.0BM
         Lifespan380.6370.79<0.0011.0BM
Climate:
         Temp PC1 0.3370.500.3540.69
         Temp PC2 0.3550.39<.0011.0
         Precip PC1 0.5260.170.8090.56
         Precip PC2 0.2970.59<0.0011.0
         * p < 0.05
Table 2. Results from species-level regressions comparing life history traits and climate variables. PCs as defined in Methods from BioClim variables.
Response Variable and ModelRegression Summariesβ (Explanatory Variables)
Adj r2F/χ2dfpInterceptPC1tempPC2tempPC1precipPC2precipAIC
Age at First Reproduction
         OLS0.4783.065, 100.1268.60 ***1.16 *0.946−0.292−1.98 *639
         PGLSBM0.6405.035 0.0398.401.201.22−0.190−2.1247.75
         PGLSOU0.93013.25<0.0018.47 **1.261.12−0.219−2.2450.50
Size at First Reproduction
         OLS−0.1330.6784, 110.6281.52 ***0.1670.6560.2220.019304
         PGLSBM0.3351.8140.4601.52 **0.058−0.2230.202−0.04637.67
         PGLSOU0.86810.44<0.0011.55 **0.035−0.258 *0.173−0.05039.97
Clutch Size
         OLS0.6065.224, 110.24614.9 ***0.0891.70 *1.68 *0.850730
         PGLSBM0.6334.9140.04310.30.669−1.362.790.66244.99
         PGLSOU0.5974.4640.06310.6 **0.534−1.432.890.94647.07
Juvenile Growth Rate
         OLS−0.2100.7404, 60.644−0.1610.0750.0330.3490.161147
         PGLSBM0.99315.04<0.0011.250.4461.04−0.973−0.2759.94
         PGLSOU−0.31510.34<0.0011.250.4491.05−0.975−0.27811.94
Population Growth Rate
         OLS−0.5650.3684, 70.8210.1250.3940.0370.2710.373517
         PGLSBM0.6633.8140.1070.2740.101−0.027−0.0850.01619.61
         PGLSOU0.4942.3940.1890.2730.111−0.0270.064. . .17.18
Size at Death
         OLS. . .. . .. . .. . .. . .. . .. . .. . .. . .. . .
         PGLSBM0.6591.7420.1752.10−0.2490.337. . .. . .11.09
         PGLSOU0.6211.5920.0752.50*−0.943. . .. . .. . .11.05
Interclutch Interval
         OLS0.1191.204, 60.5018.060.2820.5210.3000.483234
         PGLSBM0.3681.3840.6015.801.78−0.827−1.41−2.0329.53
         PGLSOU0.0720.22440.9306.510.115−0.976−0.430. . .31.93
Lifespan
         OLS0.0421.094, 80.468−0.4840.7160.1340.0900.629352
         PGLSBM0.7563.5230.07029.02.45−6.65−9.22. . .27.14
         PGLSOU0.3911.2430.29031.5−0.665−6.80. . .. . .32.46
* p < 0.05; ** p < 0.01; *** p < 0.001. For OLS models, Akaike Information Criterion corrected for finite sample sizes (AICc) are reported. Omitted values (. . .) represent models with insufficient power.
Table 3. Results from species-level regressions comparing life history reaction norm responses and climate variables. PCs as defined in Methods from BioClim variables.
Response Variable and ModelRegression Summariesβ (Explanatory Variables)
Adj r2F/χ2dfpInterceptPC1tempPC2tempPC1precipPC2precipAIC
Age at First Reproduction
         OLS0.0421.095, 80.468−0.484 *0.1040.0310.017−0.14352.1
         PGLSBM0.2900.68750.849−0.4250.0300.0480.032−0.04731.64
         PGLSOU0.9993.1850.174−0.480 *0.0980.032−0.021−0.14031.66
Size at First Reproduction
         OLS0.8105.344, 90.047−0.015−0.112 *−0.215 *0.347 *0.296 *25.1
         PGLSBM0.96416.74<0.0010.048−0.120 **−0.201 **0.342 **−0.329 **15.14
         PGLSOU0.4232.7540.139−0.136−0.004−0.1830.112. . .23.51
Clutch Size
         OLS0.5814.824, 110.035−0.1250.0990.1690.019−0.21432.7
         PGLSBM0.91411.154<0.001−0.4140.260 *−0.214−0.178−0.551 *34.13
         PGLSOU0.9107.9440.003−0.1280.1010.1690.016−0.21633.83
Juvenile Growth Rate
         OLS−0.1920.7994, 50.674−0.1960.069−0.033−0.234−0.051. . .
         PGLSBM0.8385.4740.027−0.0900.1530.043−0.228−0.11611.10
         PGLSOU0.6012.7640.238−0.1010.1300.022−0.212−0.09513.10
Population Growth Rate
         OLS0.88312.34, 60.076−0.0170.0230.004−0.053 *−0.049 *. . .
         PGLSBM0.95110.64<0.001−0.0150.0220.003−0.050 *−0.0477.39
         PGLSOU0.5883.1040.1020.013−0.003−0.006−0.011. . .4.60
Size at Death
         OLS. . .. . .. . .. . .. . .. . .. . .. . .. . .. . .
         PGLSBM0.2830.66520.5140.034−0.0770.018. . .. . .6.06
         PGLSOU0.2570.59520.2750.012−0.040. . .. . .. . .0.90
Interclutch Interval
         OLS−0.4880.5084, 60.746−0.520−0.2090.1130.1680.225. . .
         PGLSBM0.6772.3640.316−0.538−0.2340.1290.2000.22027.69
         PGLSOU0.4301.3140.455−0.630−0.0570.1560.099. . .25.53
Lifespan
         OLS. . .. . .. . .. . .. . .. . .. . .. . .. . .. . .
         PGLSBM0.8684.8230.022−1.03−0.8390.3481.32. . .22.06
         PGLSOU0.1380.37030.691−1.39−0.3920.369. . .. . .24.04
* p < 0.05; ** p < 0.01; For OLS models, Akaike Information Criterion corrected for small sample sizes (AICc) are reported or are unable to be calculated due to small N. Omitted values (. . .) represent models with insufficient power.
Table 4. Results from population-level ordinary least squares (OLS) regressions comparing life history reaction norms and climate variables. PCs as defined in Methods from BioClim variables.
Response Variable and ModelRegression Summariesβ (Explanatory Variables)
Adj r2F/χ2dfpInterceptPC1tempPC2tempPC1precPC2precTempexpLatSpecies AICc
Age at First Reproduction
         OLSFull0.2322.9717, 111<0.00123.7 ***−0.073−0.2700.119−0.442−0.383 ***−0.196629
         OLSBest0.26521.02, 111<0.00118.9 ***. . .. . .. . .. . .−0.377 ***−0.069 ***. . .602
Size at First Reproduction
         OLSFull0.83238.719, 144<0.0013.81 ***−0.018−0.117 *−0.0020.028−0.005−0.055 ***97.8
Clutch Size
         OLSFull0.5639.3318, 116<0.00146.9 ***−0.026−1.240.3870.684 *−0.180 *−0.691 **674
Juvenile Growth Rate
         OLSFull0.3957.0313, 120<0.001−3.37 *0.232 *0.374 *0.123 **−0.060−0.0050.084 *95.4
Population Growth Rate
         OLSFull0.1232.5213, 1400.0044.26−0.192−0.0440.0020.0110.034−0.010509
         OLSBest0.0224.161, 1400.043−0.152. . .. . .. . .. . .0.041 *. . .. . .509
Size at Death
         OLSFull0.93682.75, 28<0.001−0.656−0.3530.295. . .. . .−0.040 ***0.0748.73
         OLSBest0.938107.15, 28<0.0010.243−0.4060.220. . .. . .−0.040 ***0.056. . .5.39
Interclutch Interval
         OLSFull0.81217.010, 37<0.001−42.52.94 **−4.05 ***8.11 *7.71 *−0.560 ***1.49 *218
         OLSBest0.79825.3 6, 37<0.0014.691.40−1.64−0.1841.46−0.490 ***0.433 **. . .210
Lifespan
         OLSFull0.72412.19, 38<0.0019.326.48−2.20−9.33−13.0−1.85 ***1.81336
         OLSBest0.74719.76, 38<0.0015080 ***−35.1 **−364 ***−142 ***40.3 **−1.91 ***−93.4 ***. . .325
* p < 0.05; ** p < 0.01; *** p < 0.001; Individual species identity coefficients can be found in the Supplement Table S3. Omitted values (. . .) represent models with insufficient power.
Table 5. Data with highest explanatory power for predicting Daphnia life history evolution. Numerical results can be found in population-level analyses (Table 4).
Life History TraitSpecies IdentityPopulation/LatitudeTemperature
Age at First Reproduction
Size at First Reproduction
Clutch Size
Juvenile Growth Rate
Population Growth Rate
Size at Death
Interclutch Interval
Lifespan
Disclaimer/Publisher’s Note: The statements, opinions and data contained in all publications are solely those of the individual author(s) and contributor(s) and not of MDPI and/or the editor(s). MDPI and/or the editor(s) disclaim responsibility for any injury to people or property resulting from any ideas, methods, instructions or products referred to in the content.

