Article

Using Fish Assemblages to Assess the Ecological Effects of Marine Protection on Rocky Habitats in a Portuguese Natural Park

1
MARE—Marine and Environmental Sciences Centre, ARNET—Aquatic Research Network, Agência Regional para o Desenvolvimento da Investigação Tecnologia e Inovação (ARDITI), 9020-105 Funchal, Portugal
2
MARE—Marine and Environmental Sciences Centre, ARNET—Aquatic Research Network, Faculdade de Ciências, Universidade de Lisboa, 1749-016 Lisbon, Portugal
3
MARE—Marine and Environmental Sciences Centre, ARNET—Aquatic Research Network, Laboratório de Ciências do Mar, Universidade de Évora, Apartado 190, 7521-903 Sines, Portugal
4
Departamento de Biologia, Escola de Ciências e Tecnologia, Universidade de Évora, 7004-516 Évora, Portugal
*
Author to whom correspondence should be addressed.
Hydrobiology 2023, 2(1), 181-195; https://doi.org/10.3390/hydrobiology2010012
Submission received: 6 December 2022 / Revised: 29 December 2022 / Accepted: 30 January 2023 / Published: 2 February 2023

Abstract

:
Intensive and regular fishing occurs in the marine area of the natural park “Parque Natural do Sudoeste Alentejano e Costa Vicentina” (PNSACV; SW coast of continental Portugal). In 2011, this area became a marine park with different protection levels (total, partial, and complementary). We assessed in 2011 and 2012 if partial protection (PP) in Marine Protected Areas (MPAs) changed the taxa richness, abundance, size, and community composition of cryptic and non-cryptic fishes. We also determined if these effects were observed outside PP areas in adjacent control areas. Underwater visual censuses (UVC) of cryptic and non-cryptic fish species were conducted in rocky subtidal habitats (~10 m deep) with band transects (25 × 2 m and 25 × 4 m, respectively) to determine abundance and size classes. The northern half of the PNSACV was sampled at a scale of tens (site—two sites per area; 4–6 transects per site) and hundreds (area) of meters. Two PP and six control areas were sampled. The homogeneity and abundance of bottom habitat types were assessed at each site. Effects of protection were not detected in the community structure or univariate analyses (i.e., taxa richness and total abundance) of non-cryptic and cryptic fishes. The early phase of the MPAs may have driven the lack of significant protection effects. Replication in time within a monitoring program is recommended to assess these conservation measures’ ecological effects.

1. Introduction

Worldwide efforts are being made to manage and protect marine environments, since fishing, bycatch, pollution, and other human-induced stressors are changing the ecosystems [1,2,3]. Resource exploitation demands appropriate management measures such as implementing gear selectivity, fishing bans, or marine protected areas (MPAs) [4,5].
MPAs are subtidal or intertidal extents protected by law to assure and/or enhance biodiversity and guarantee proper resource usage [6], where human activities, especially fishing, are restricted or banned [7,8]. Implementing MPAs has been increasingly recognized as a good tool for marine resources management and biodiversity conservation [9,10,11,12,13,14,15,16]. Some studies on MPAs detected an increased abundance of biomass (fishes and invertebrates) and changes in the community structure [17,18,19,20,21,22]. Claudet et al. [23] argued that the MPA size and temporal implementation play a vital role in its effects, with larger and older MPAs usually having higher biomass densities and larger specimens. Nevertheless, in some cases, fish diversity and abundance increased in a short period of two–three years [18]. A recent study [16] verified that buffering areas surrounding no-take zones could enhance spillover and fisheries in the short term (less than five years). Therefore, for an MPA to be successful, especially in a short time, the level of protection, size, and location should be considered when designing it [22].
In mainland Portugal, four marine parks or reserves have oceanic MPAs, although with different protection levels: the “Litoral Norte” Natural Park (implemented in 1987, north coast), the “Berlengas” Natural Reserve (implemented in 1981, central coast), the “Arrábida” Natural Park (implemented in 1998, central coast), and the “Sudoeste Alentejano e Costa Vicentina” Natural Park (PNSACV, implemented in 1995, designated as a Marine Park in 2011, southwestern coast). “Arrábida”, “Berlengas”, and PNSACV include MPAs with total and partial protection areas and buffer areas (recreational and/or commercial fishing allowed). Mainland Portugal MPAs have been the subject of various studies, a few in the “Litoral Norte” and “Berlengas” [24,25,26,27,28], being the majority conducted in “Arrábida”, focusing on fish assemblages [29,30,31,32,33]. The latter MPA was implemented in 1998 without designated protection, having those areas assigned later, in 2005 [34]. Ref. [30], using experimental fishing trials with trammel nets on soft bottoms, observed that in this MPA, diversity and abundance became higher over time in total and partial protection areas compared with buffer and adjacent areas.
The PNSACV was created in 1995, covering over 100 km of the Portuguese coastline between S. Torpes and Burgau and extends 2 km into the Atlantic Ocean (Figure 1). It protects, in total, 60,567 ha of land area and 28,858 ha of marine area. It has an enormous natural diversity, with over one hundred beaches, cliffs, and dunes. This diversity of habitats is responsible for vibrant flora and fauna and for the presence of several rare, endemic, and endangered species [35]. The Mediterranean climate influences the area, resulting in mild winters and cooler summers, with the wind strongly affecting the temperature [35]. Intensive and regular fishing occurs in the marine area of PNSACV, affecting several target species for subsistence, commercial use, or recreation [36]. Specific measures for the protection and conservation-oriented management of the marine fishing resources in PNSACV were initiated in 2006 with the regulation of stalked barnacle (Pollicipes pollicipes) commercial harvesting, the most important Portuguese intertidal living resource [37,38]. Over the years, several legislative changes occurred in the fisheries regulations applied to this park. One of the most relevant occurred in February 2011, when the PNSACV management plan was reviewed, and a marine park was created, designated MPAs with different protection levels (total, partial, and complementary). Therefore, the creation of MPAs in PNSACV is recent. The relative rareness of scientific knowledge regarding this coastal zone is an obstacle to implementing these conservation programs. Studies on the impact of PNSACV MPAs on fish are becoming available, with a focus on commercially important species [22,39,40,41], benthic communities [42], or fisheries [8]. Pereira et al. [43] studied fish abundance and size inside and outside partial protection areas (PP), using different fishing gears at a mean depth of 25 m. However, relevant ecological indicators (i.e., species richness and abundance or community structure) of nearshore fish communities inhabiting the MPAs rocky reefs of PNSACV are particularly scarce [42]. We propose using non-destructive underwater visual censuses (UVC) to assess PNSACV partial protection (PP) areas’ effects in subtidal rocky bottoms to surpass this problem. We aim to determine if PP areas presented altered taxa richness, abundance, size, and community composition of non-cryptic and cryptic fishes and if these effects were observed outside these MPAs.

2. Materials and Methods
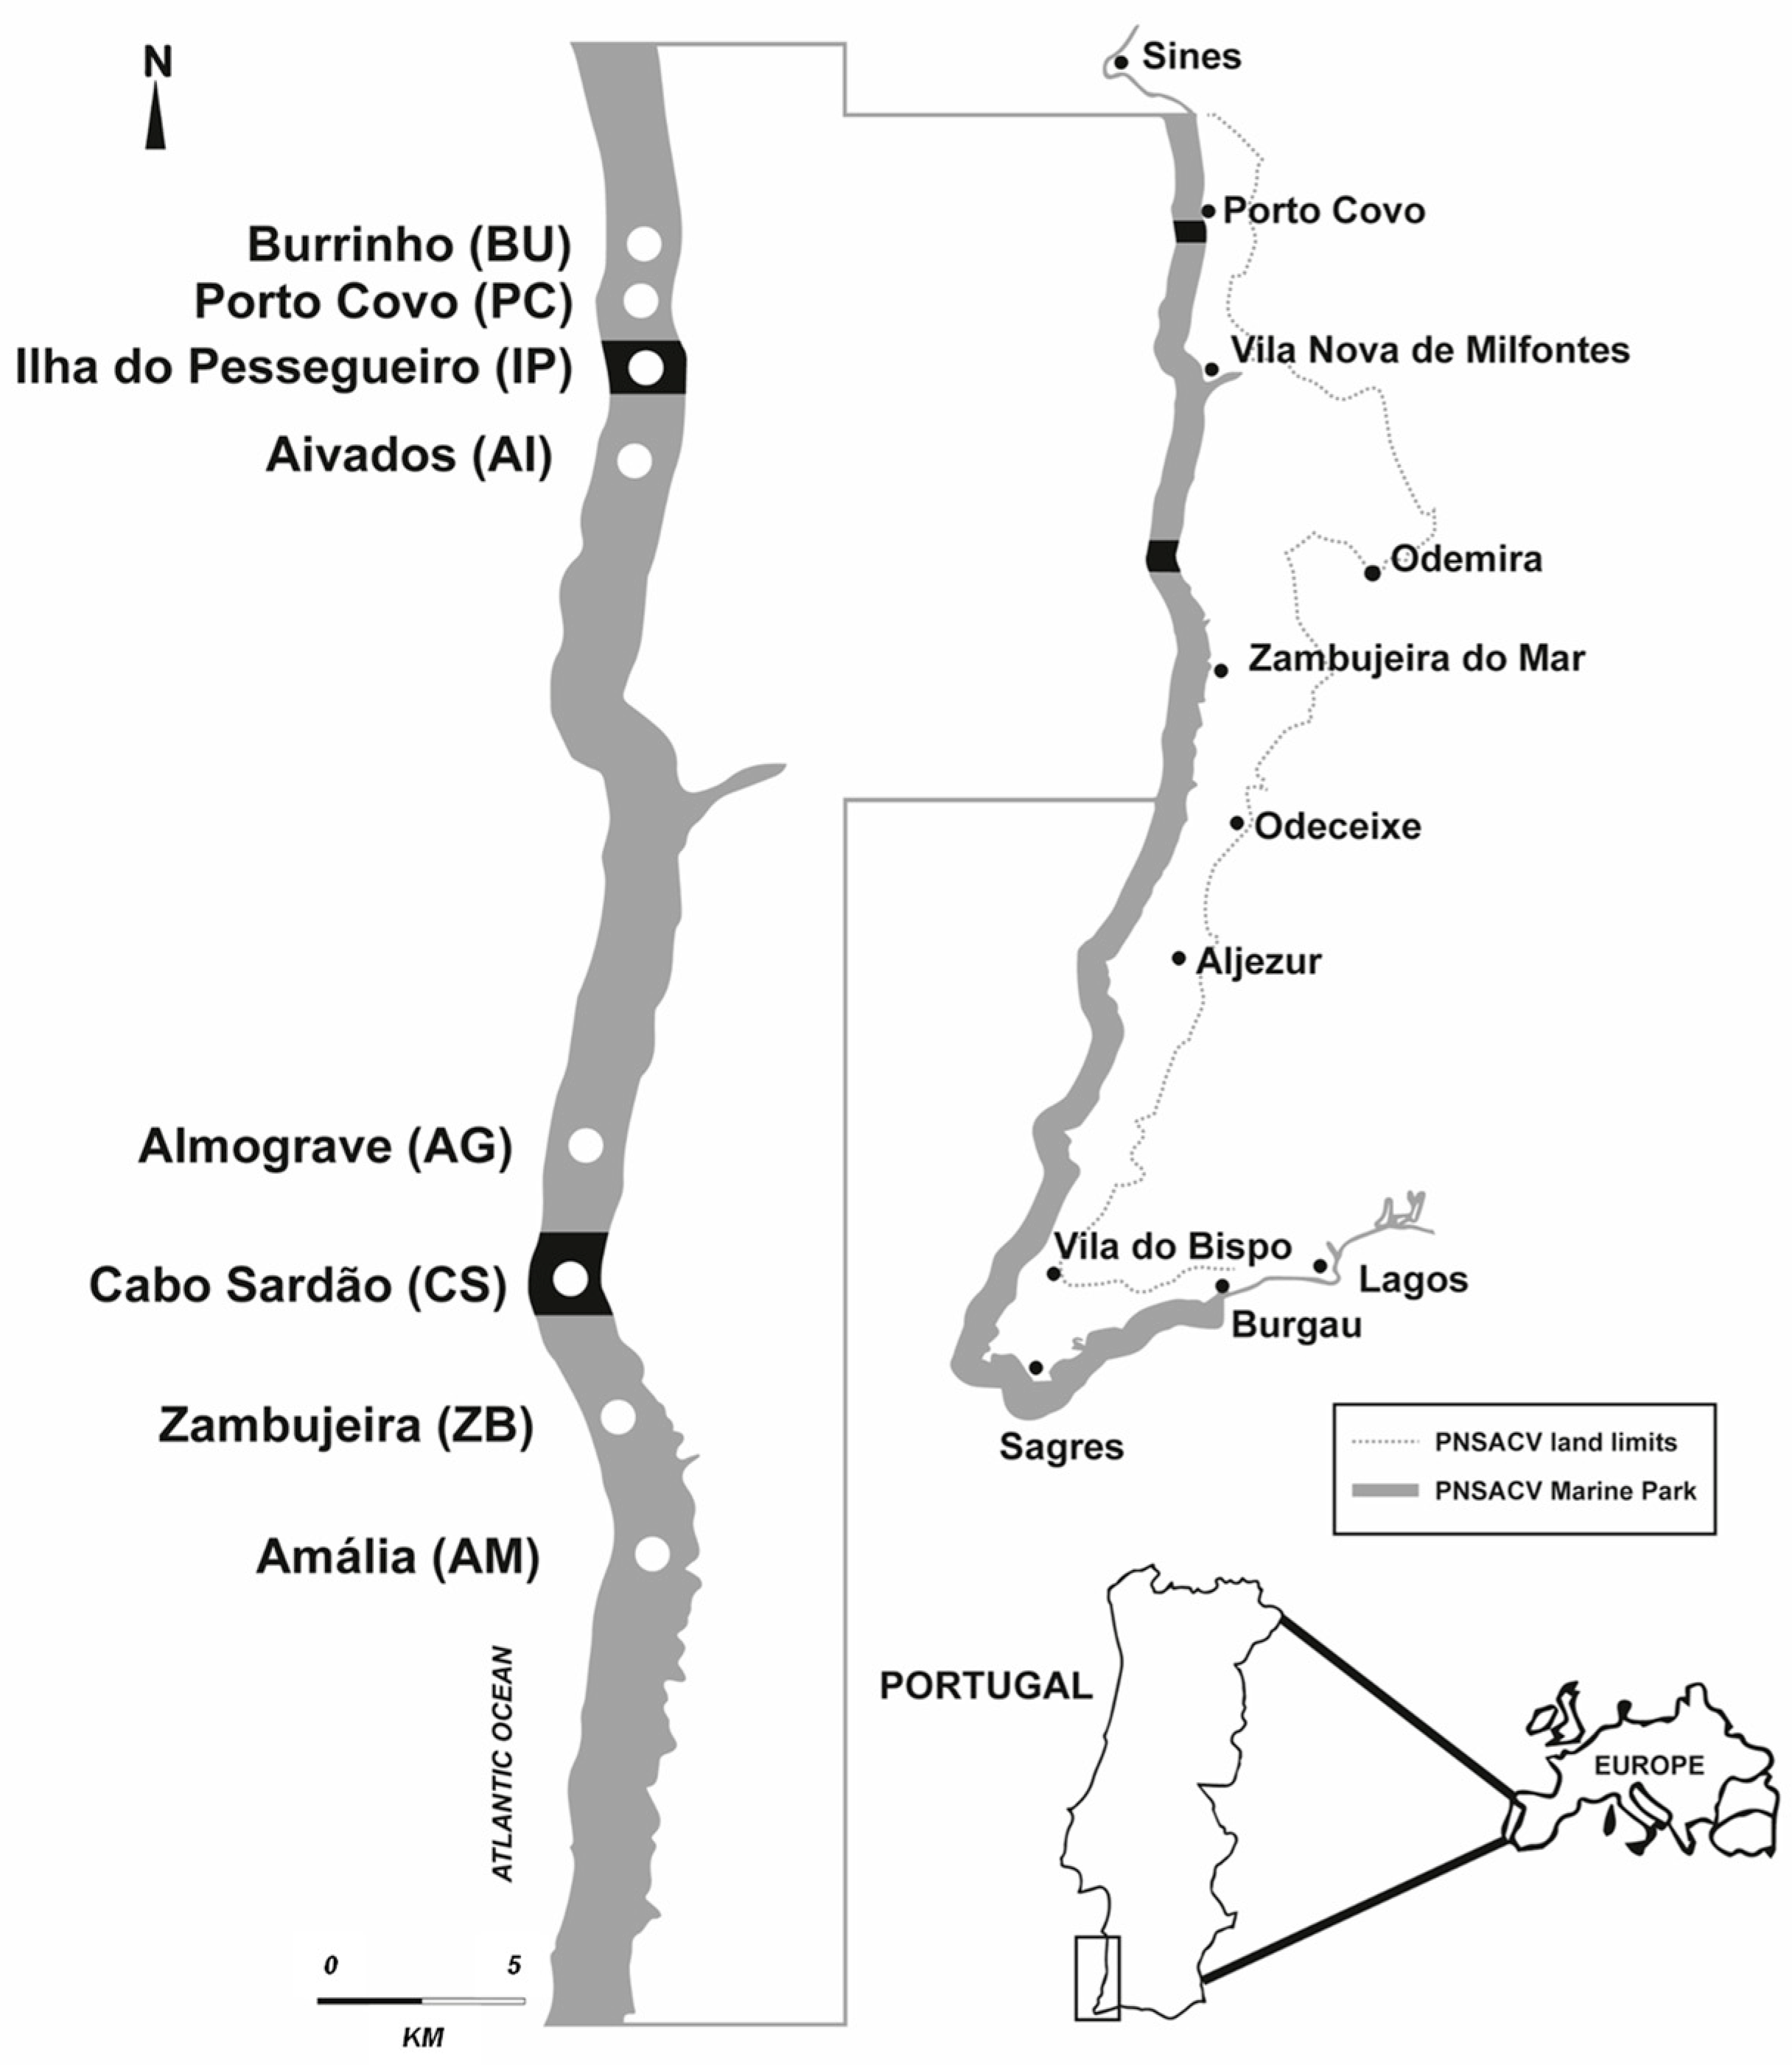
2.1. Study Area

The coastal region studied in this work is located in the region of “Alentejo” (southern mainland Portugal), which includes areas of total, partial, and complementary protection (Figure 1). The total protected areas are small rocky islands with a small surrounding marine zone. In these areas, recreational and commercial fishing is strictly forbidden, and the human presence is highly restricted. In the study region, type I partial protection areas (PP) include “Ilha do Pessegueiro” (IP) and “Cabo Sardão” (CS; Figure 1), where recreational and commercial fishing is prohibited, except for stalked barnacle commercial harvesting on the mainland cliffs. So, regarding the exploitation of fish, these PP areas can be considered no-take areas. Recreational and commercial fishing is allowed in complementary protection areas and has specific PNSACV regulations.
The present study focused on the partial protection areas (PP) of Ilha do Pessegueiro (IP) and Cabo Sardão (CS), also referred to as treatment areas (Figure 1). Control adjacent sampling areas to the North and South were chosen randomly in areas of complementary protection (CP) of the marine PNSACV. CP sampling areas have similar physical features to those of the PP sampling areas, regarding the dominance of hard substrate, direct wave exposure, and low bottom slope. We sampled six adjacent control areas (Figure 1): two areas north of IP (Burrinho (BU) and Porto Covo (PC)); two areas South of IP and North of CS (Aivados (AI) and Almograve (AG)); and two areas South of CS (Zambujeira (ZB) and Amália (AM)). Two sites were randomly chosen in each sampling area, with a few tens of meters of horizontal extension and separated by a few hundreds of meters. The number of replicates was four to six. Big crevices and caves were not sampled.

2.2. Underwater Visual Censuses (UVC)

Cryptic and non-cryptic fishes were assessed by direct visual surveys using scuba diving. Rocky bottoms with a mean depth of 10 m were sampled in 2011 and 2012 between July and October. The abundance of fishes was sampled using a band transect, 25 m long and 4 m wide, defined by a tape measure placed on the sea bottom (2 m sampled on each side of the tape for non-cryptic fishes, 1 m sampled on each side of the tape for cryptic fishes). Fishes were counted along each transect and identified, whenever possible, to the species level. Three-dimensional classes (total length) were considered for the non-cryptic fish species or genera when sampling their abundance: small, medium, and large. For species with minimum landing size (Tm) for commercial and recreational fishing purposes, the dimensional classes considered are as follows: Small, <Tm; 2 Tm > Medium ≥ Tm; Large, ≥2 Tm. For other species, the maximum size (TM) considered was based on the maximum total length stated by [44], and the dimensional classes used were as follows: Small, <TM/3; 2(TM/3) > Medium ≥ TM/3; Large, ≥2(TM/3). Four researchers participated in the UVC, although most sampling was conducted by one of them (>80%). Cryptic counts were made according to [31,45]. Due to their small size and cryptic behavior, no dimensional classes were considered for these fishes. The cryptic species sampled belonged to the families Blenniidae, Callionymidae, Gobiesocidae, Gobiidae (except Pomatoschistus flavescens), Scorpaenidae, Syngnathidae, and Tripterygiidae.

2.3. Substrate Characterization

The substrate’s physical characteristics were sampled in band transects, 25 m long and 2 m wide, defined by a measuring tape on the bottom (1 m sampled on each substrate’s side). The dominant bottom type extension was registered along the transect, considering the following categories: (i) bedrock; (ii) boulders (more than 1 m in length); (iii) pebbles (less than 1 m in length), and (iv) sand. The hard substrate’s heterogeneity was measured with a 25 m long lead rope placed on the bottom along with the measuring tape. The corresponding extension (1 cm precision) was recorded on the stretched metric tape. The number of replicates was three to four.

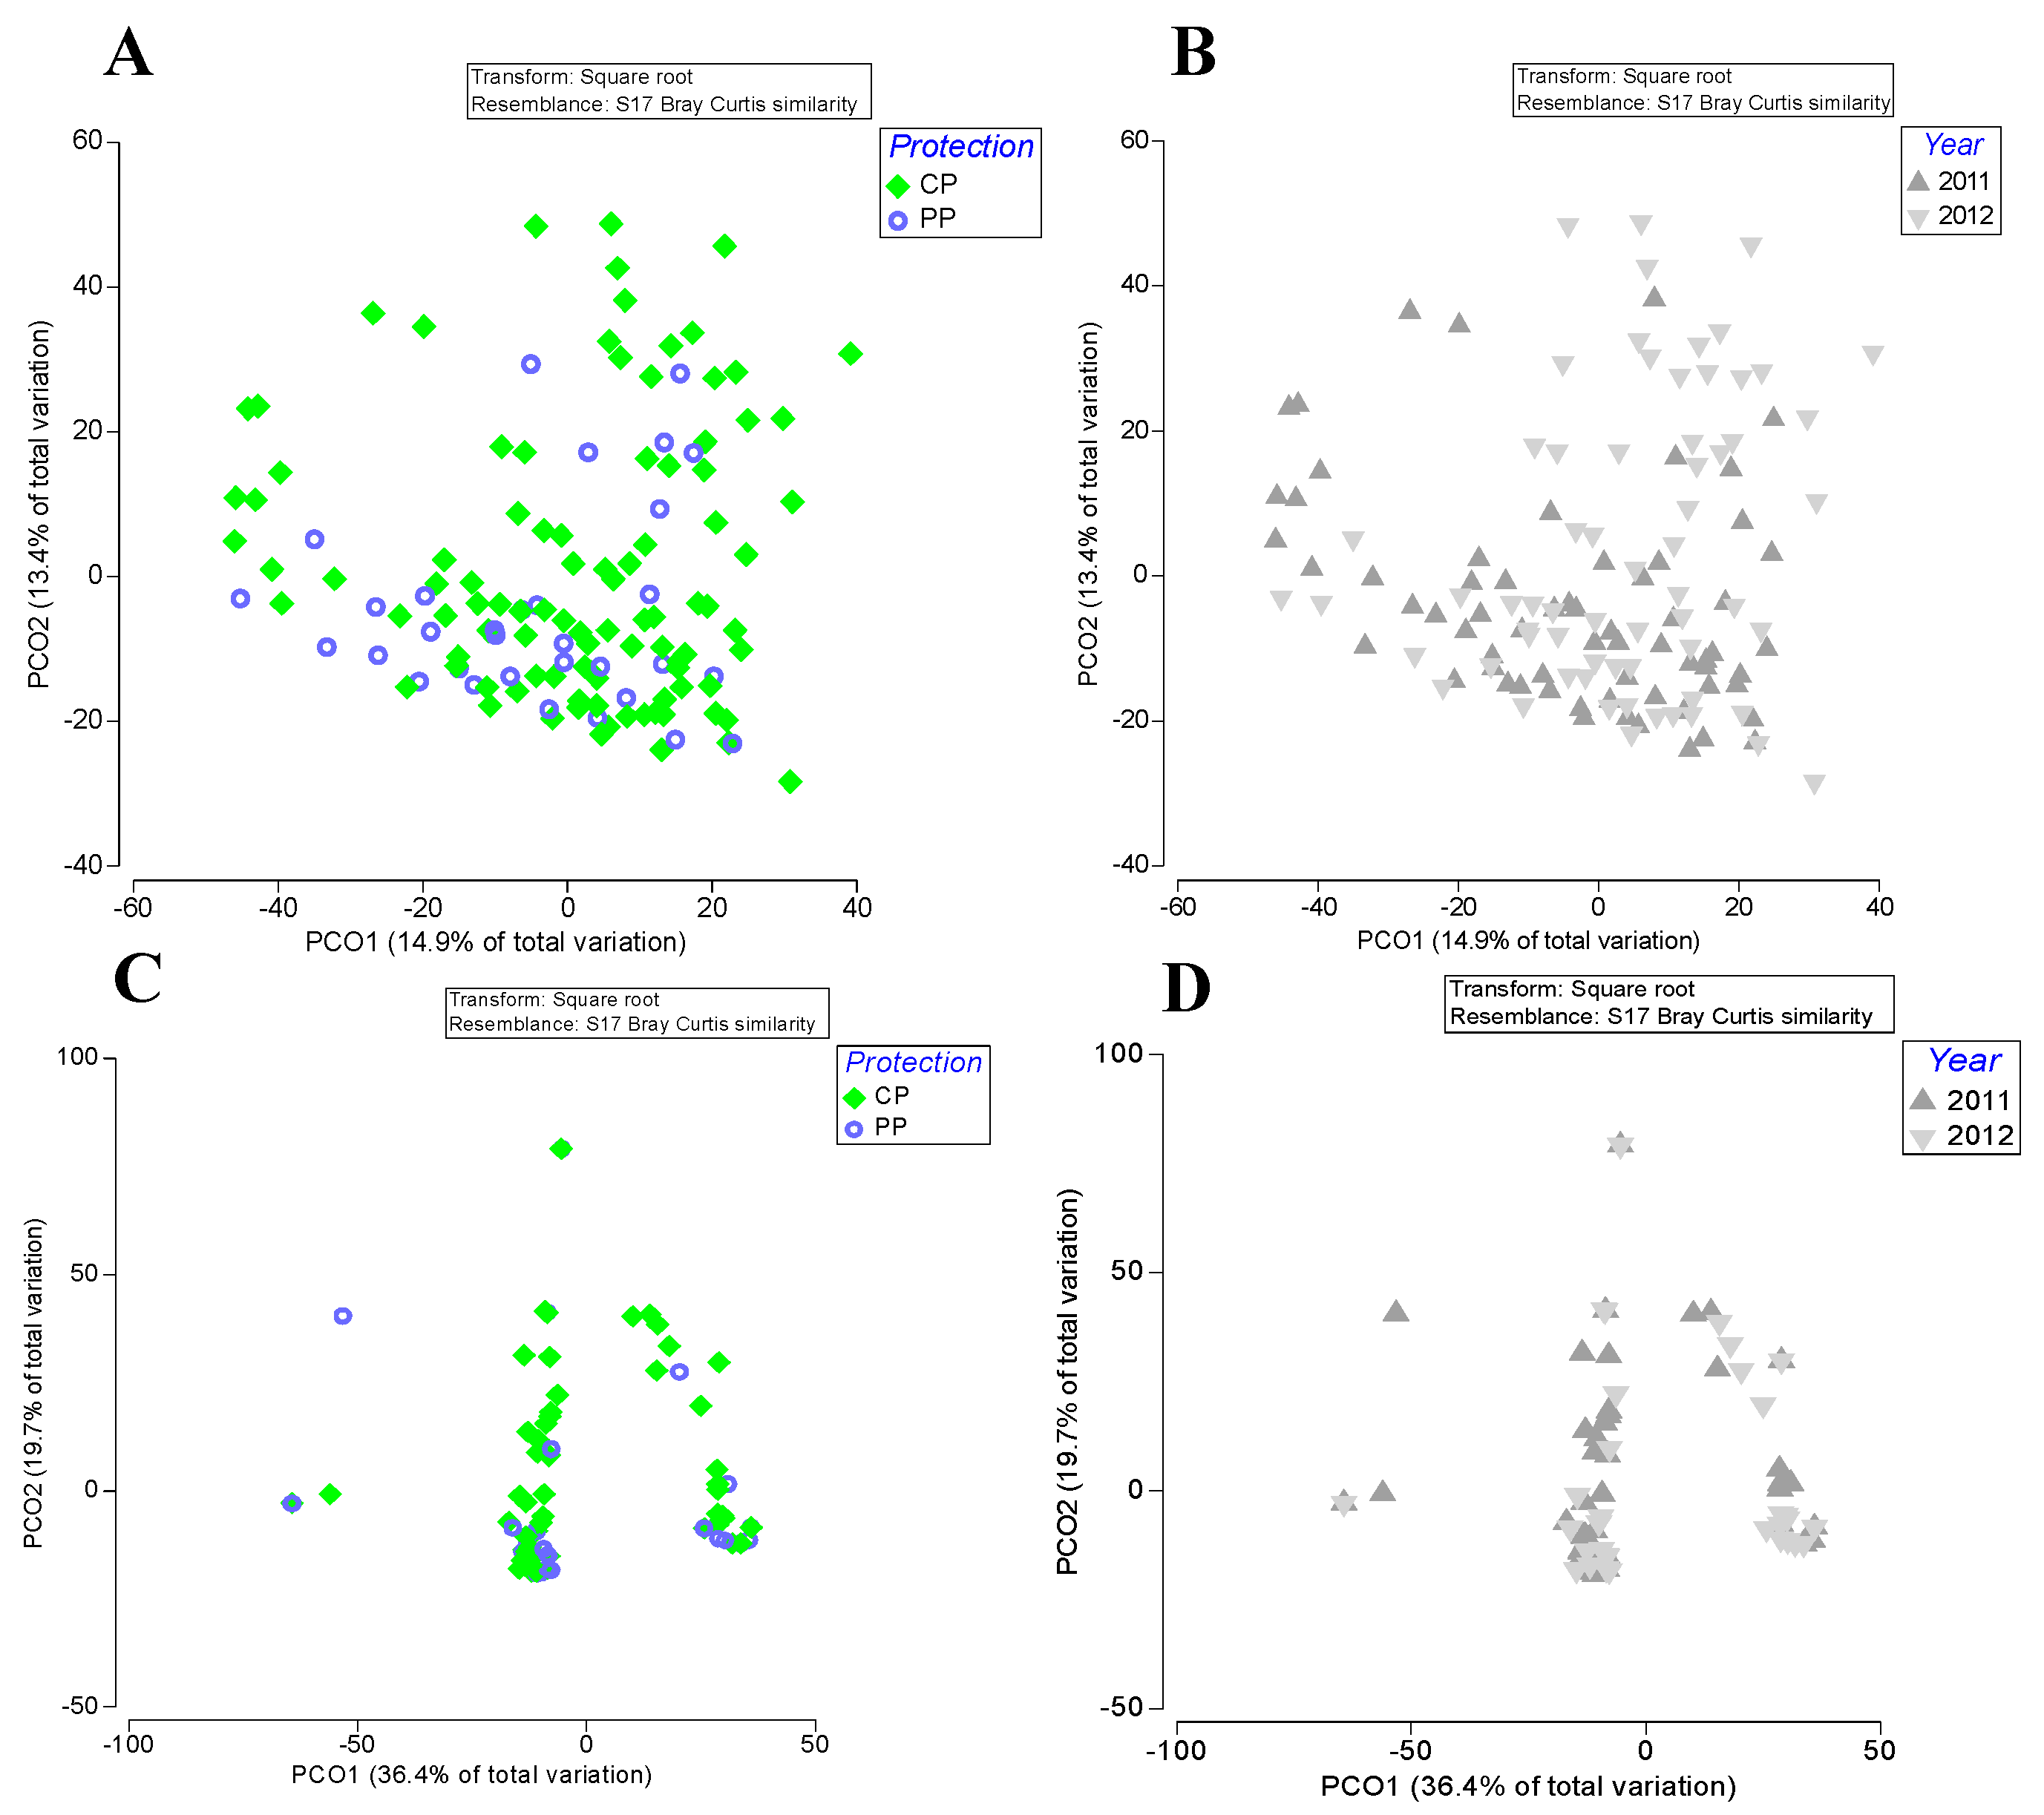
2.4. Statistical Analyses
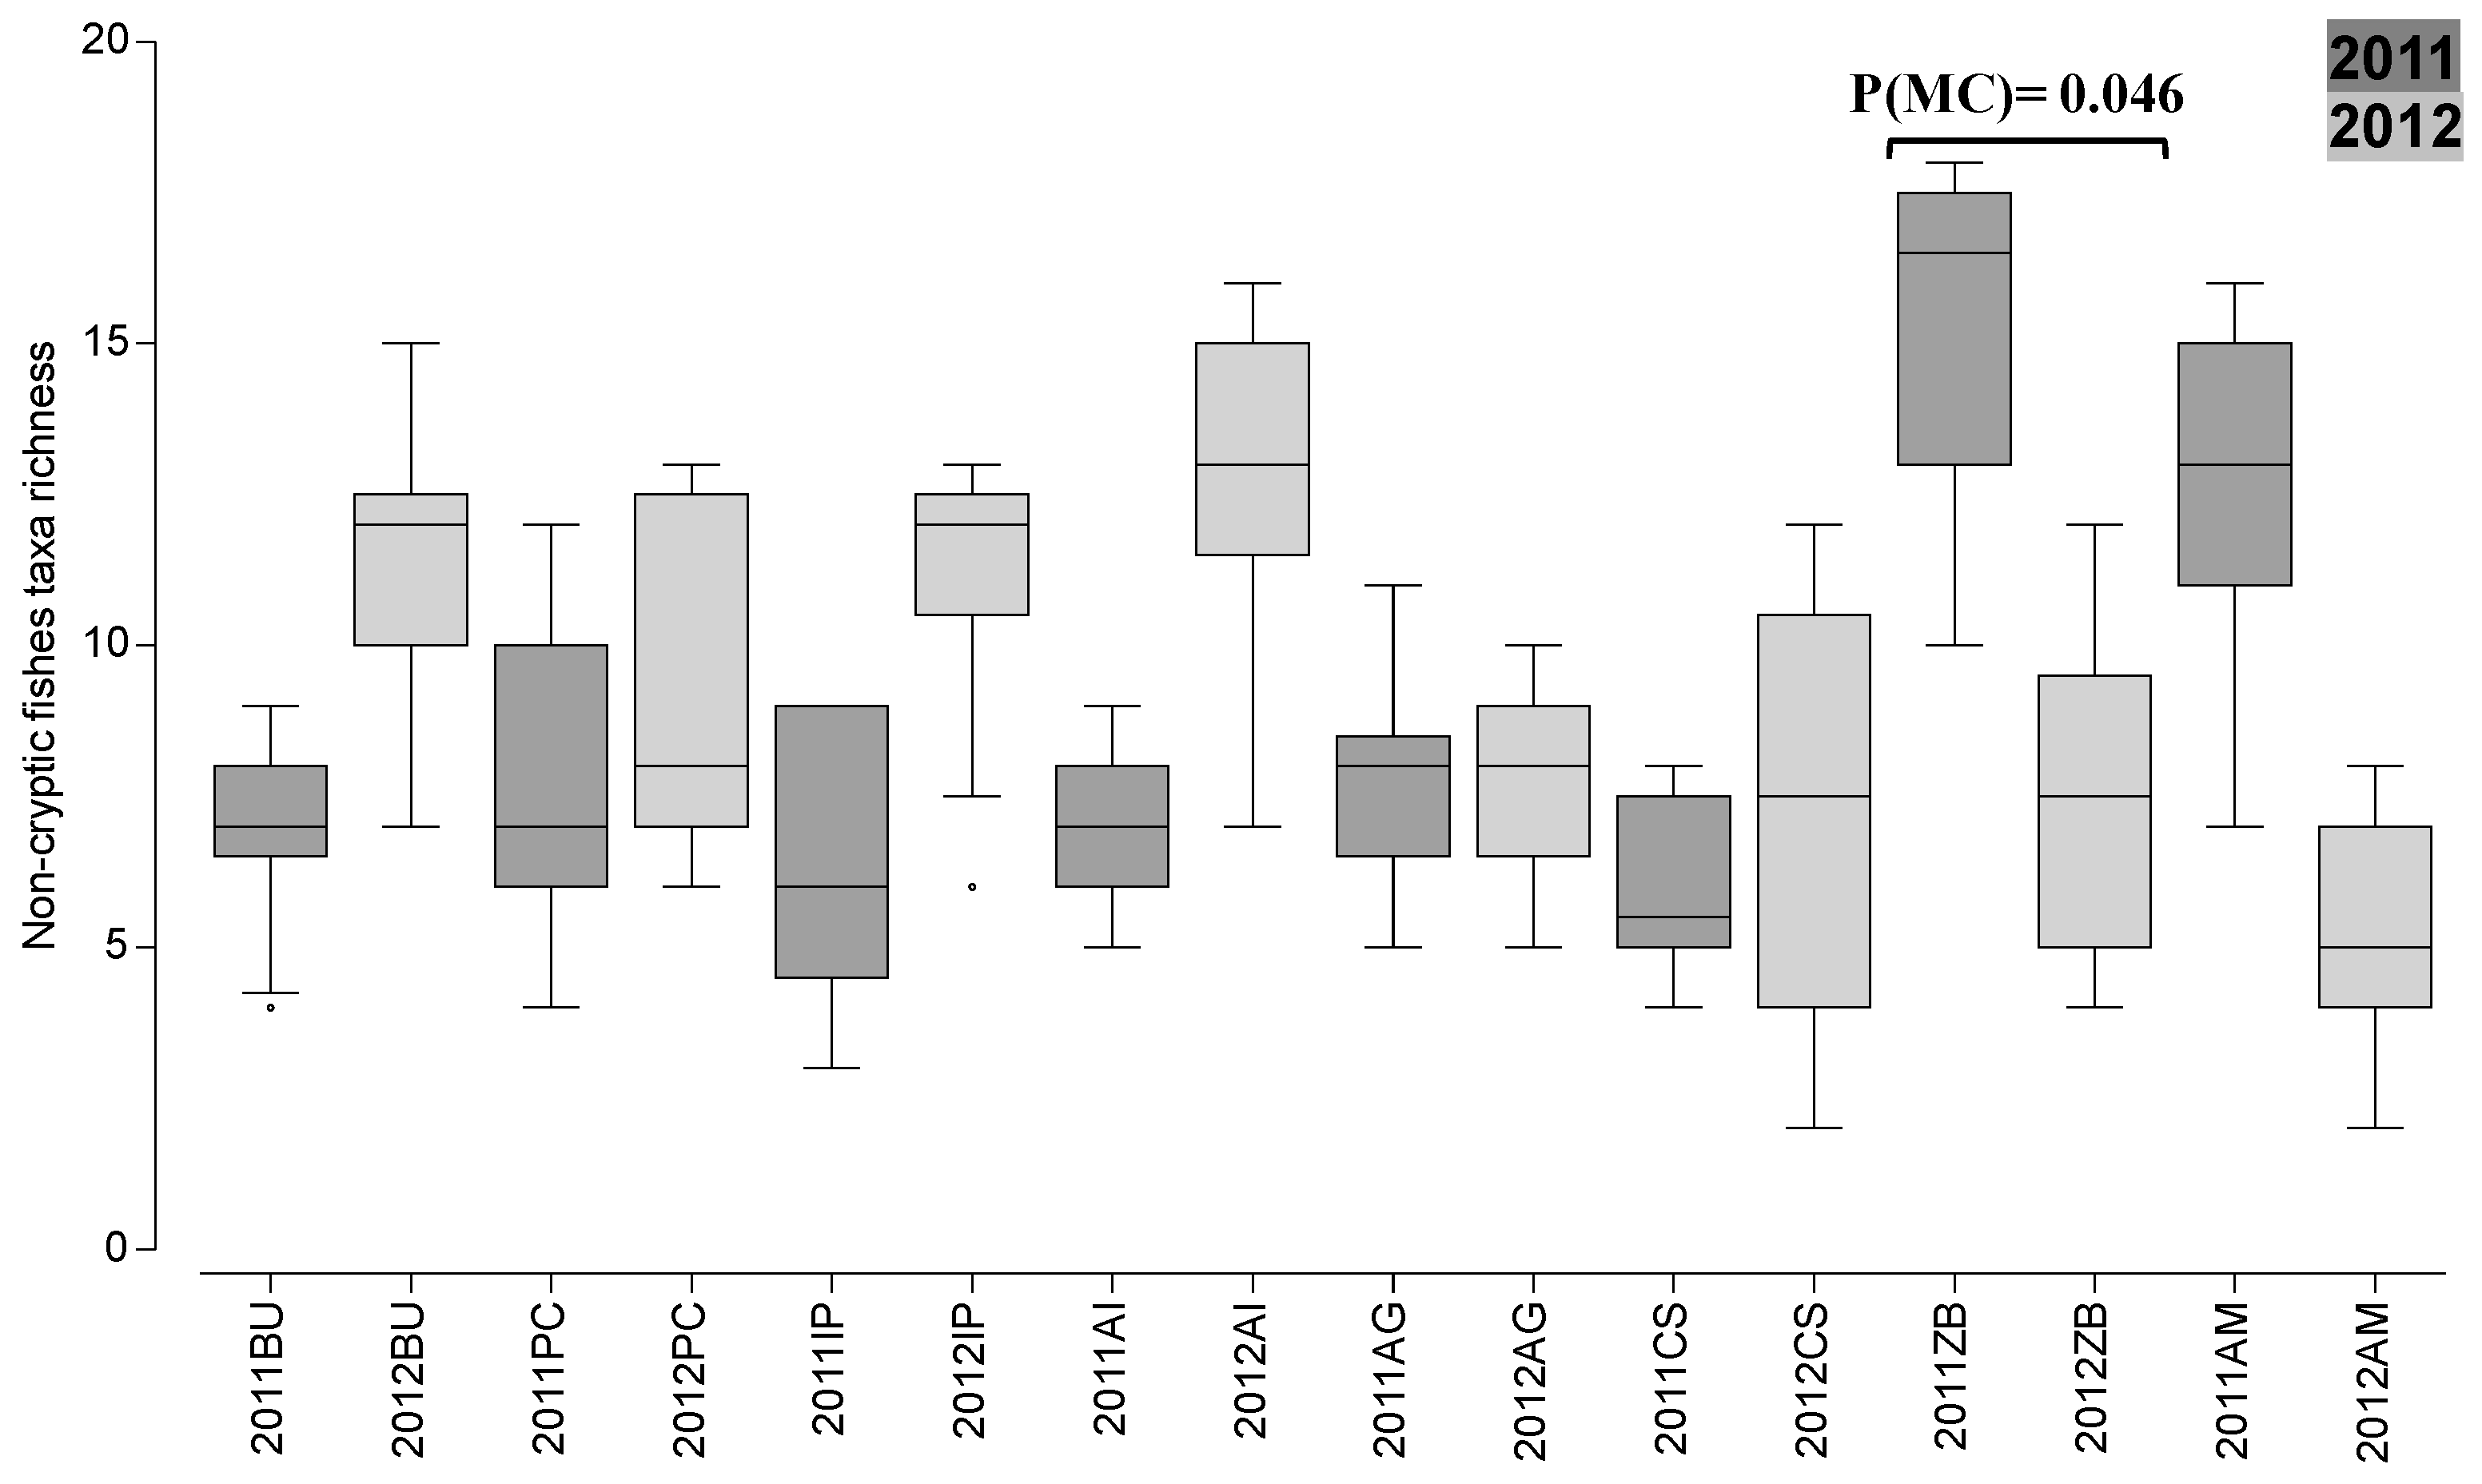
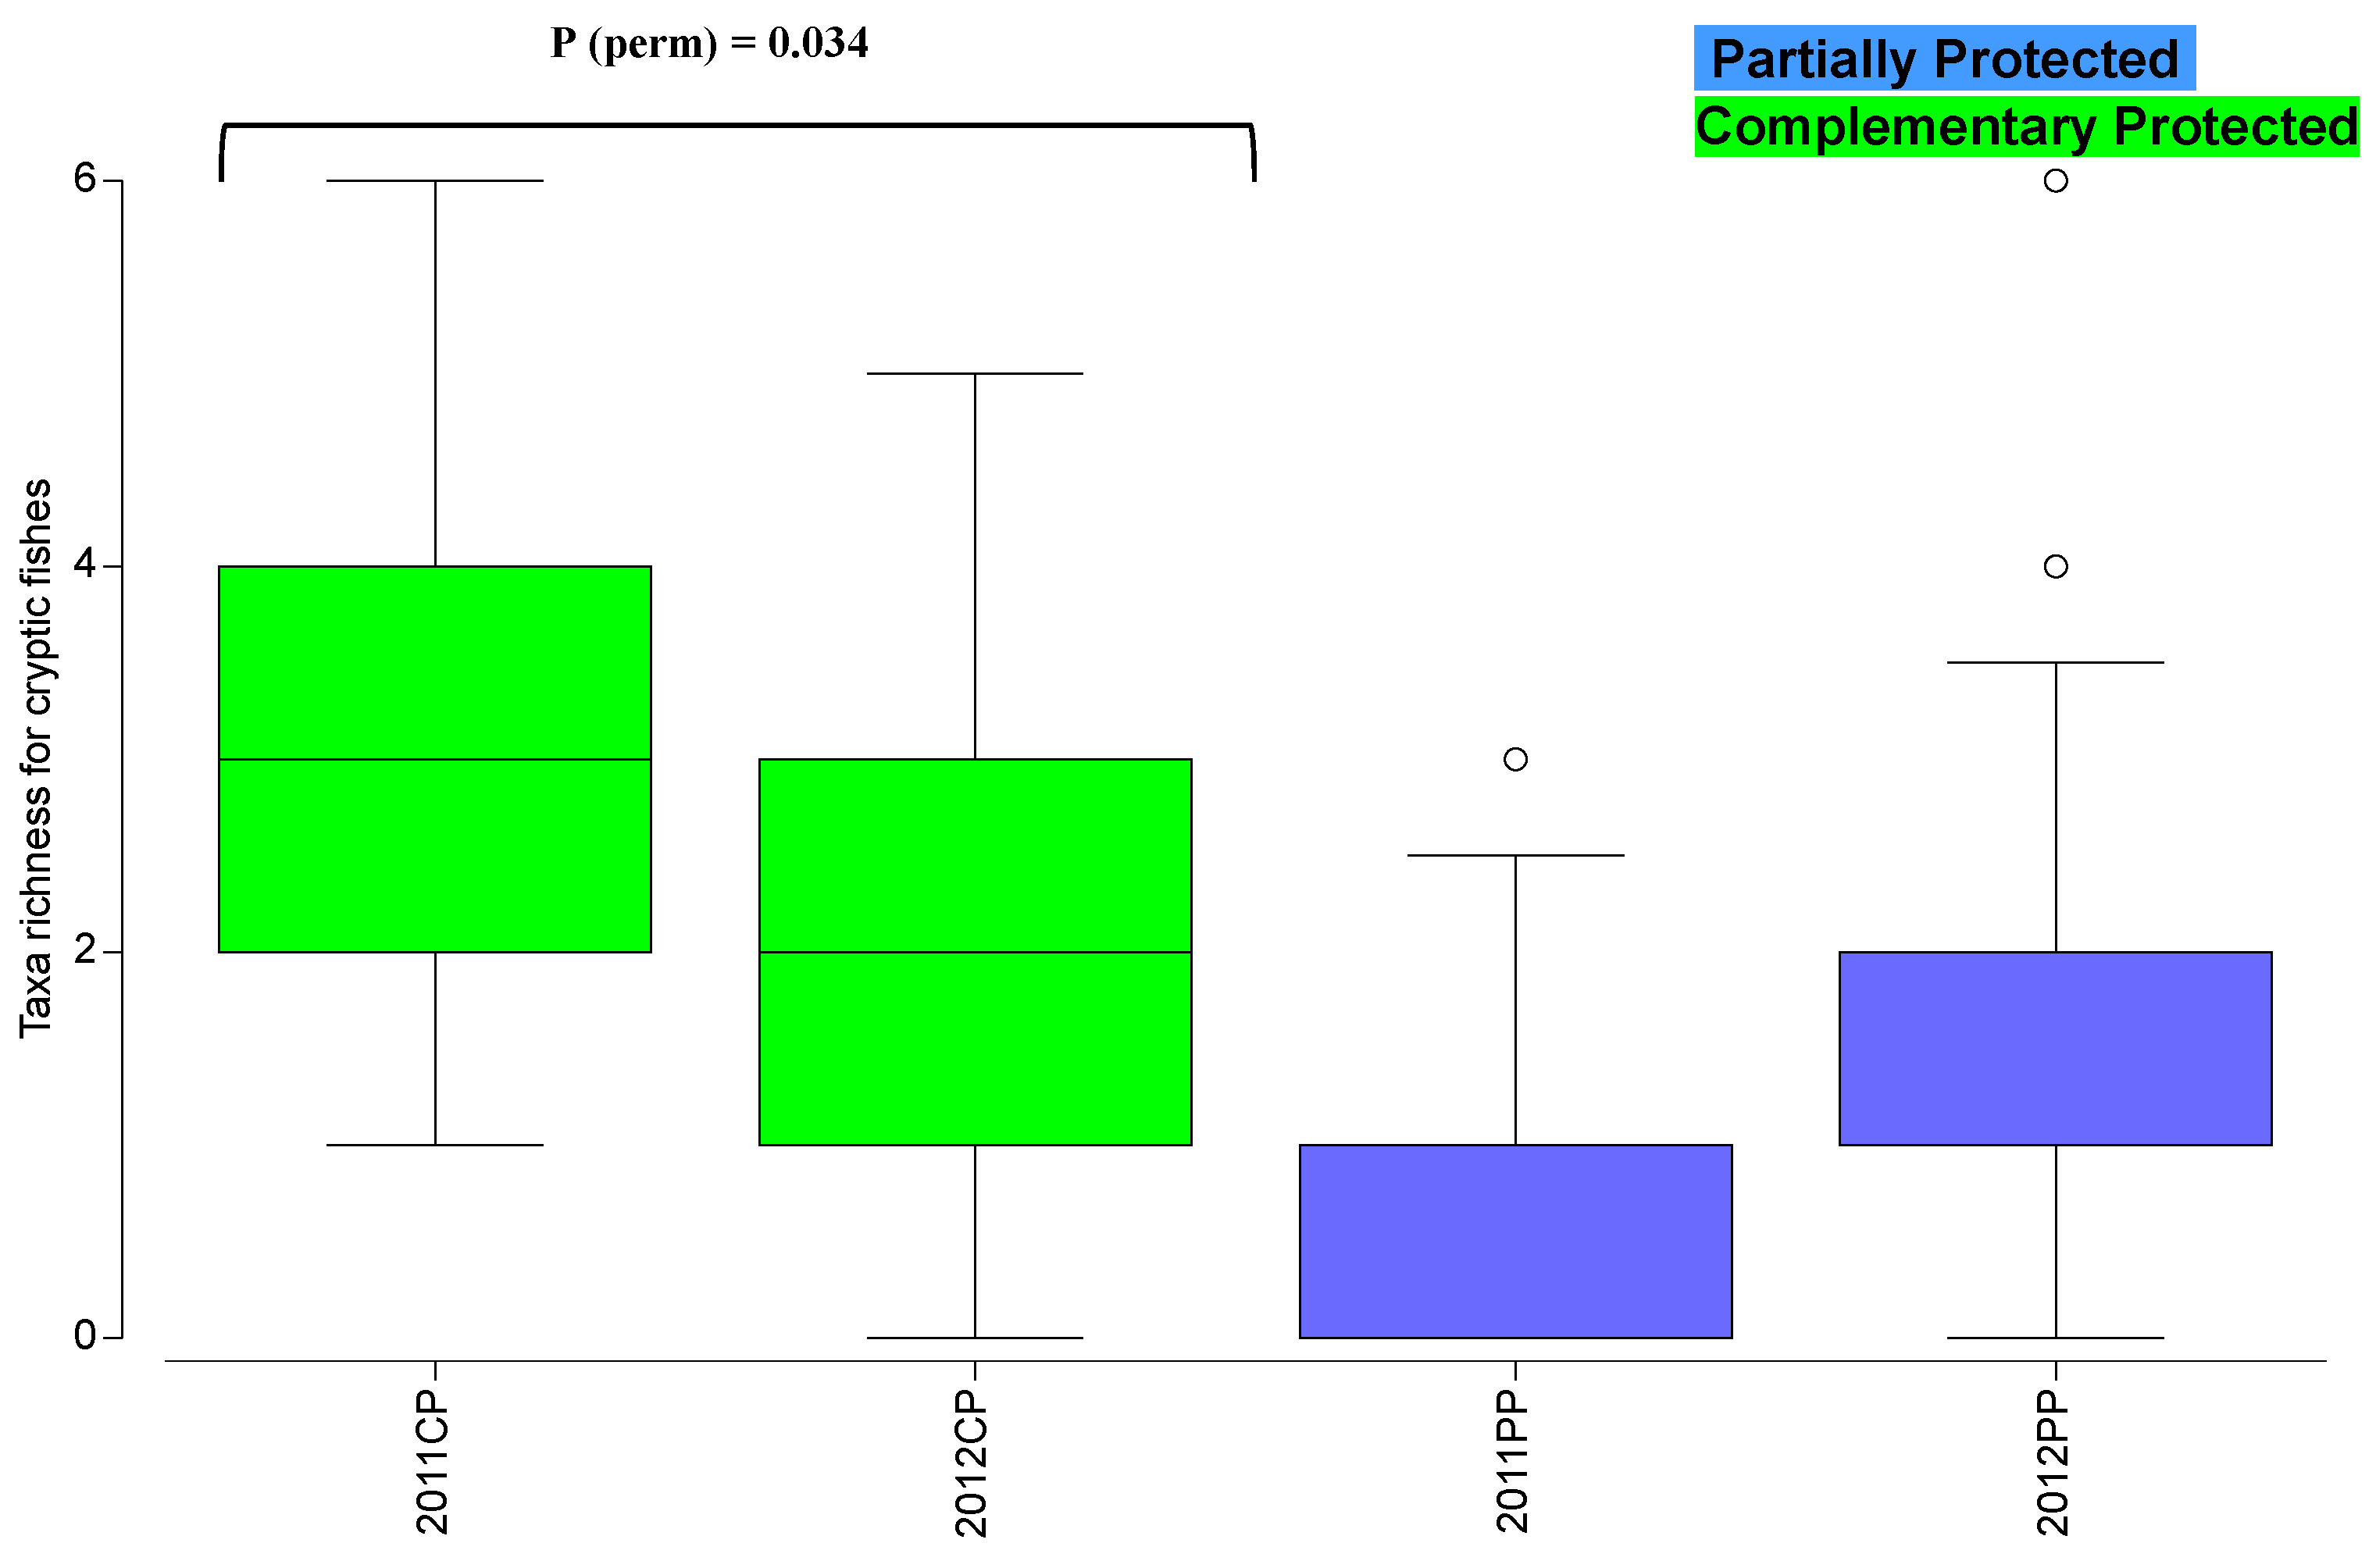
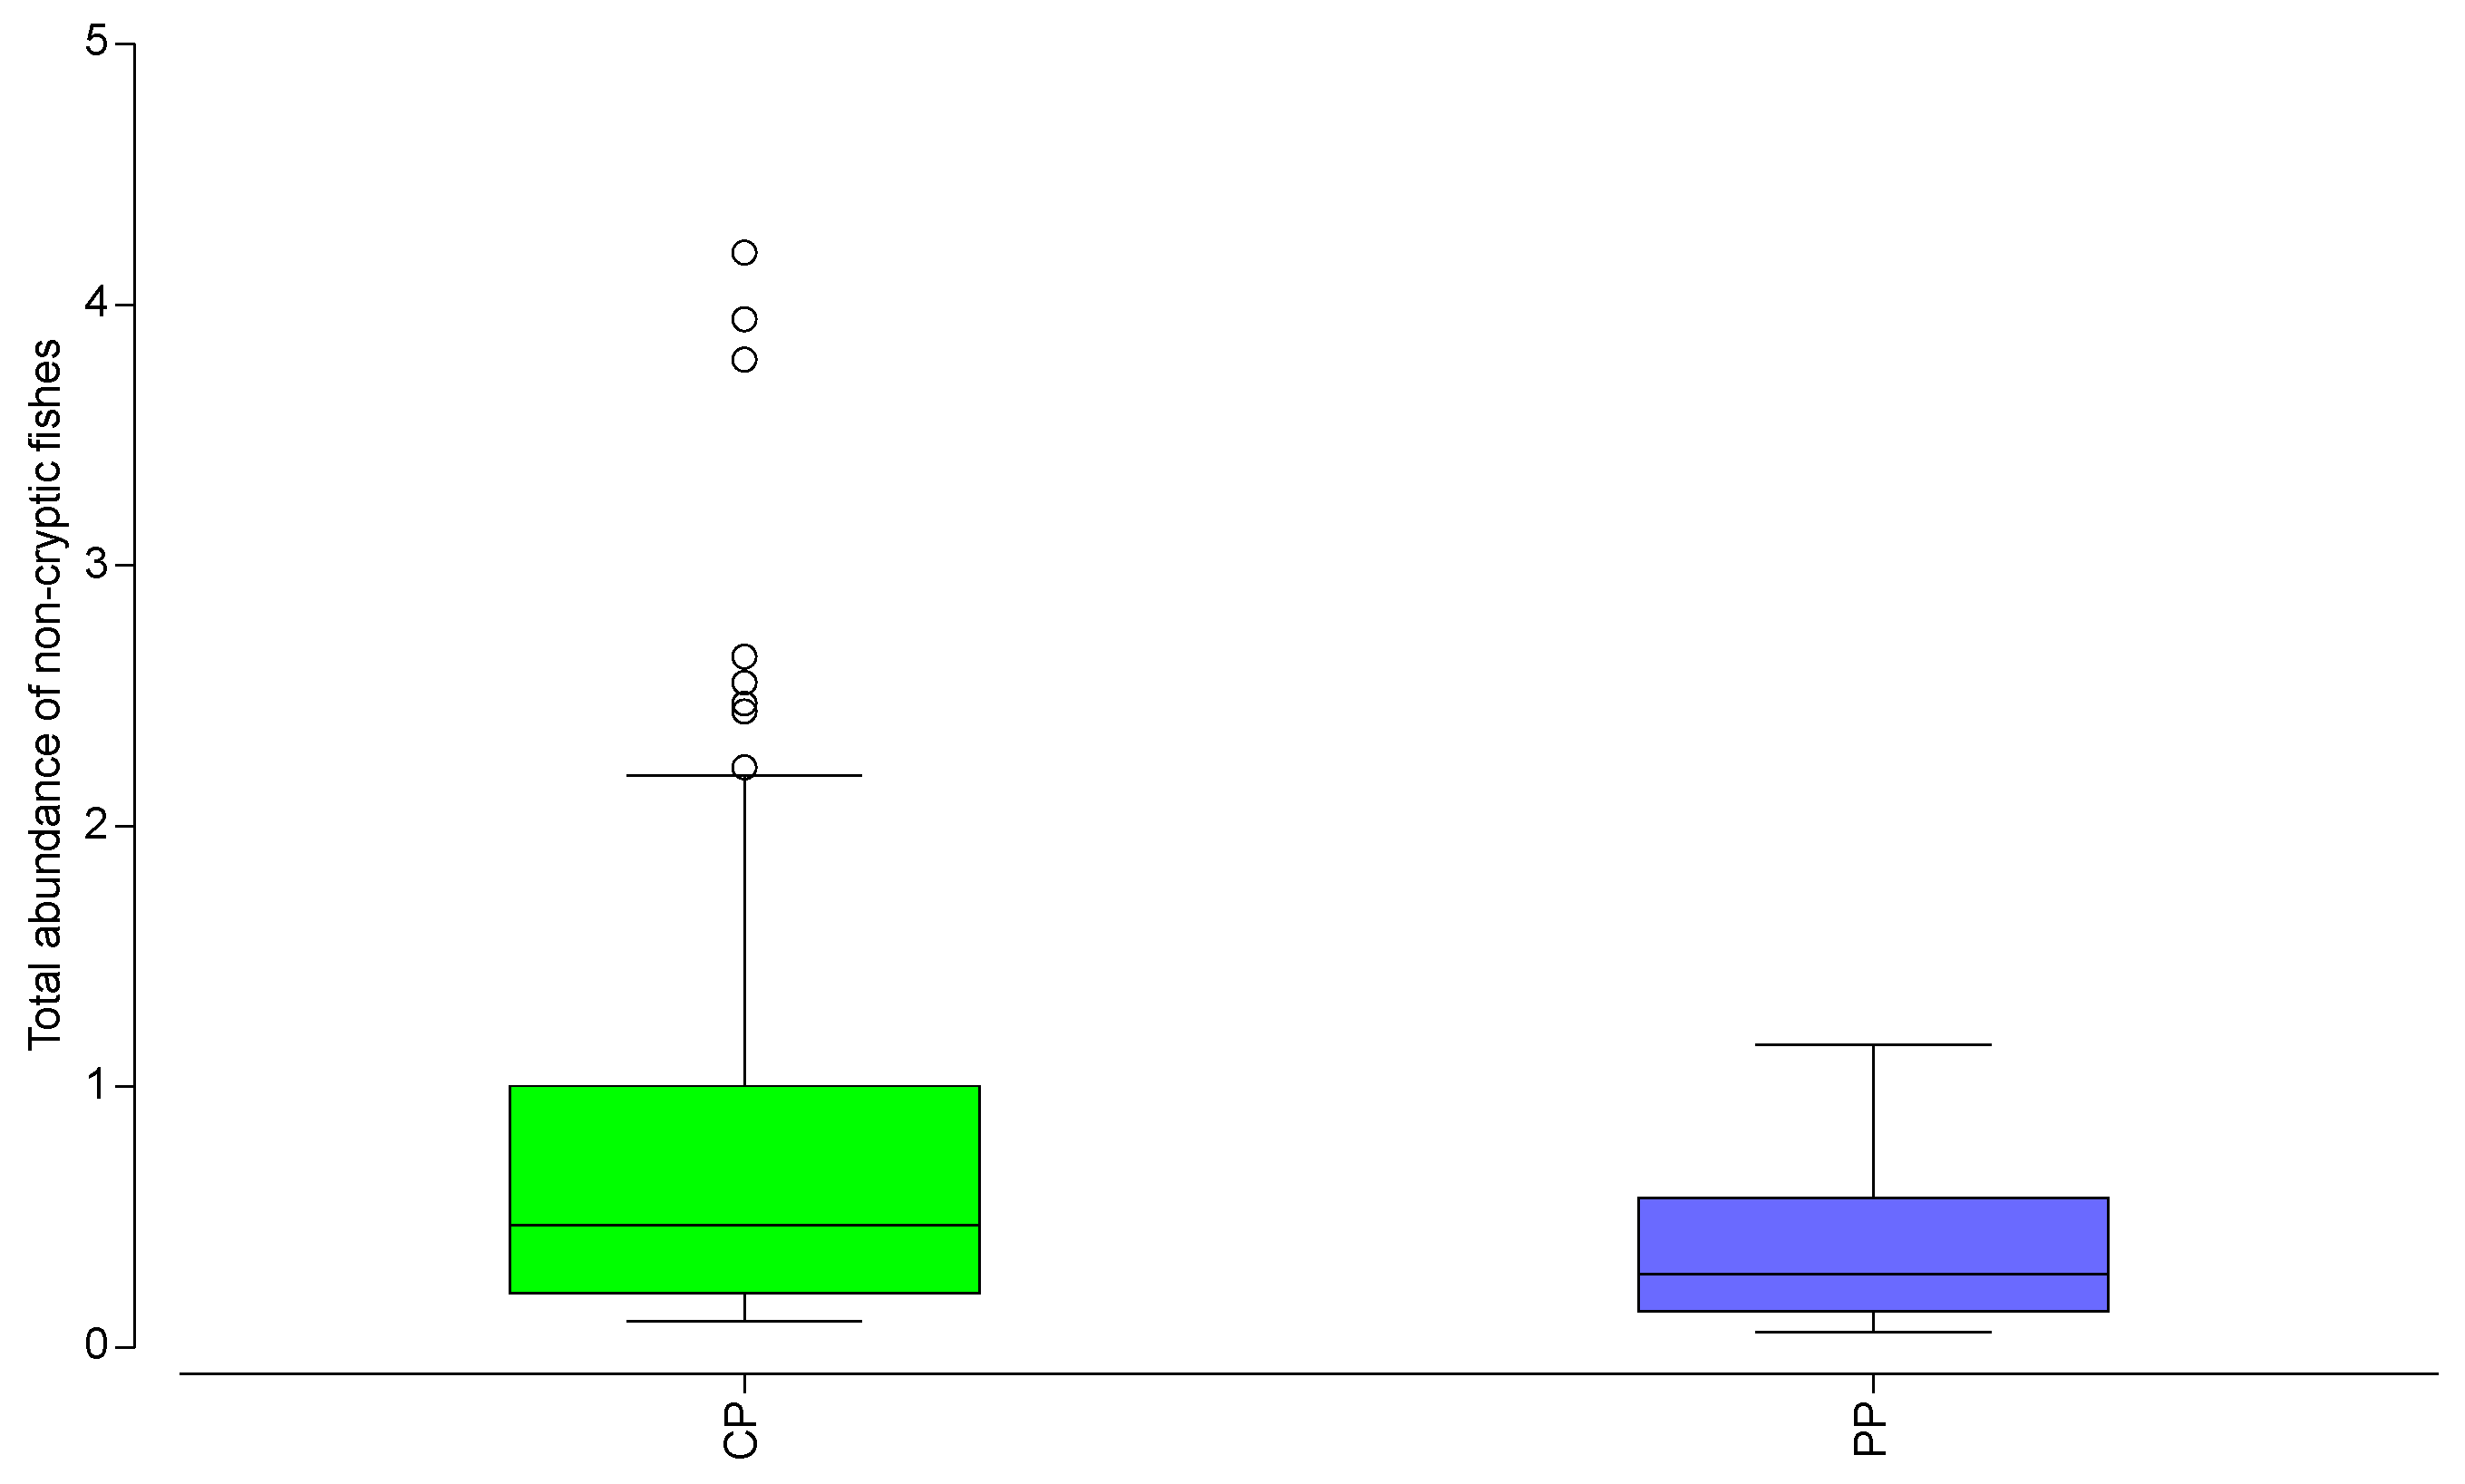
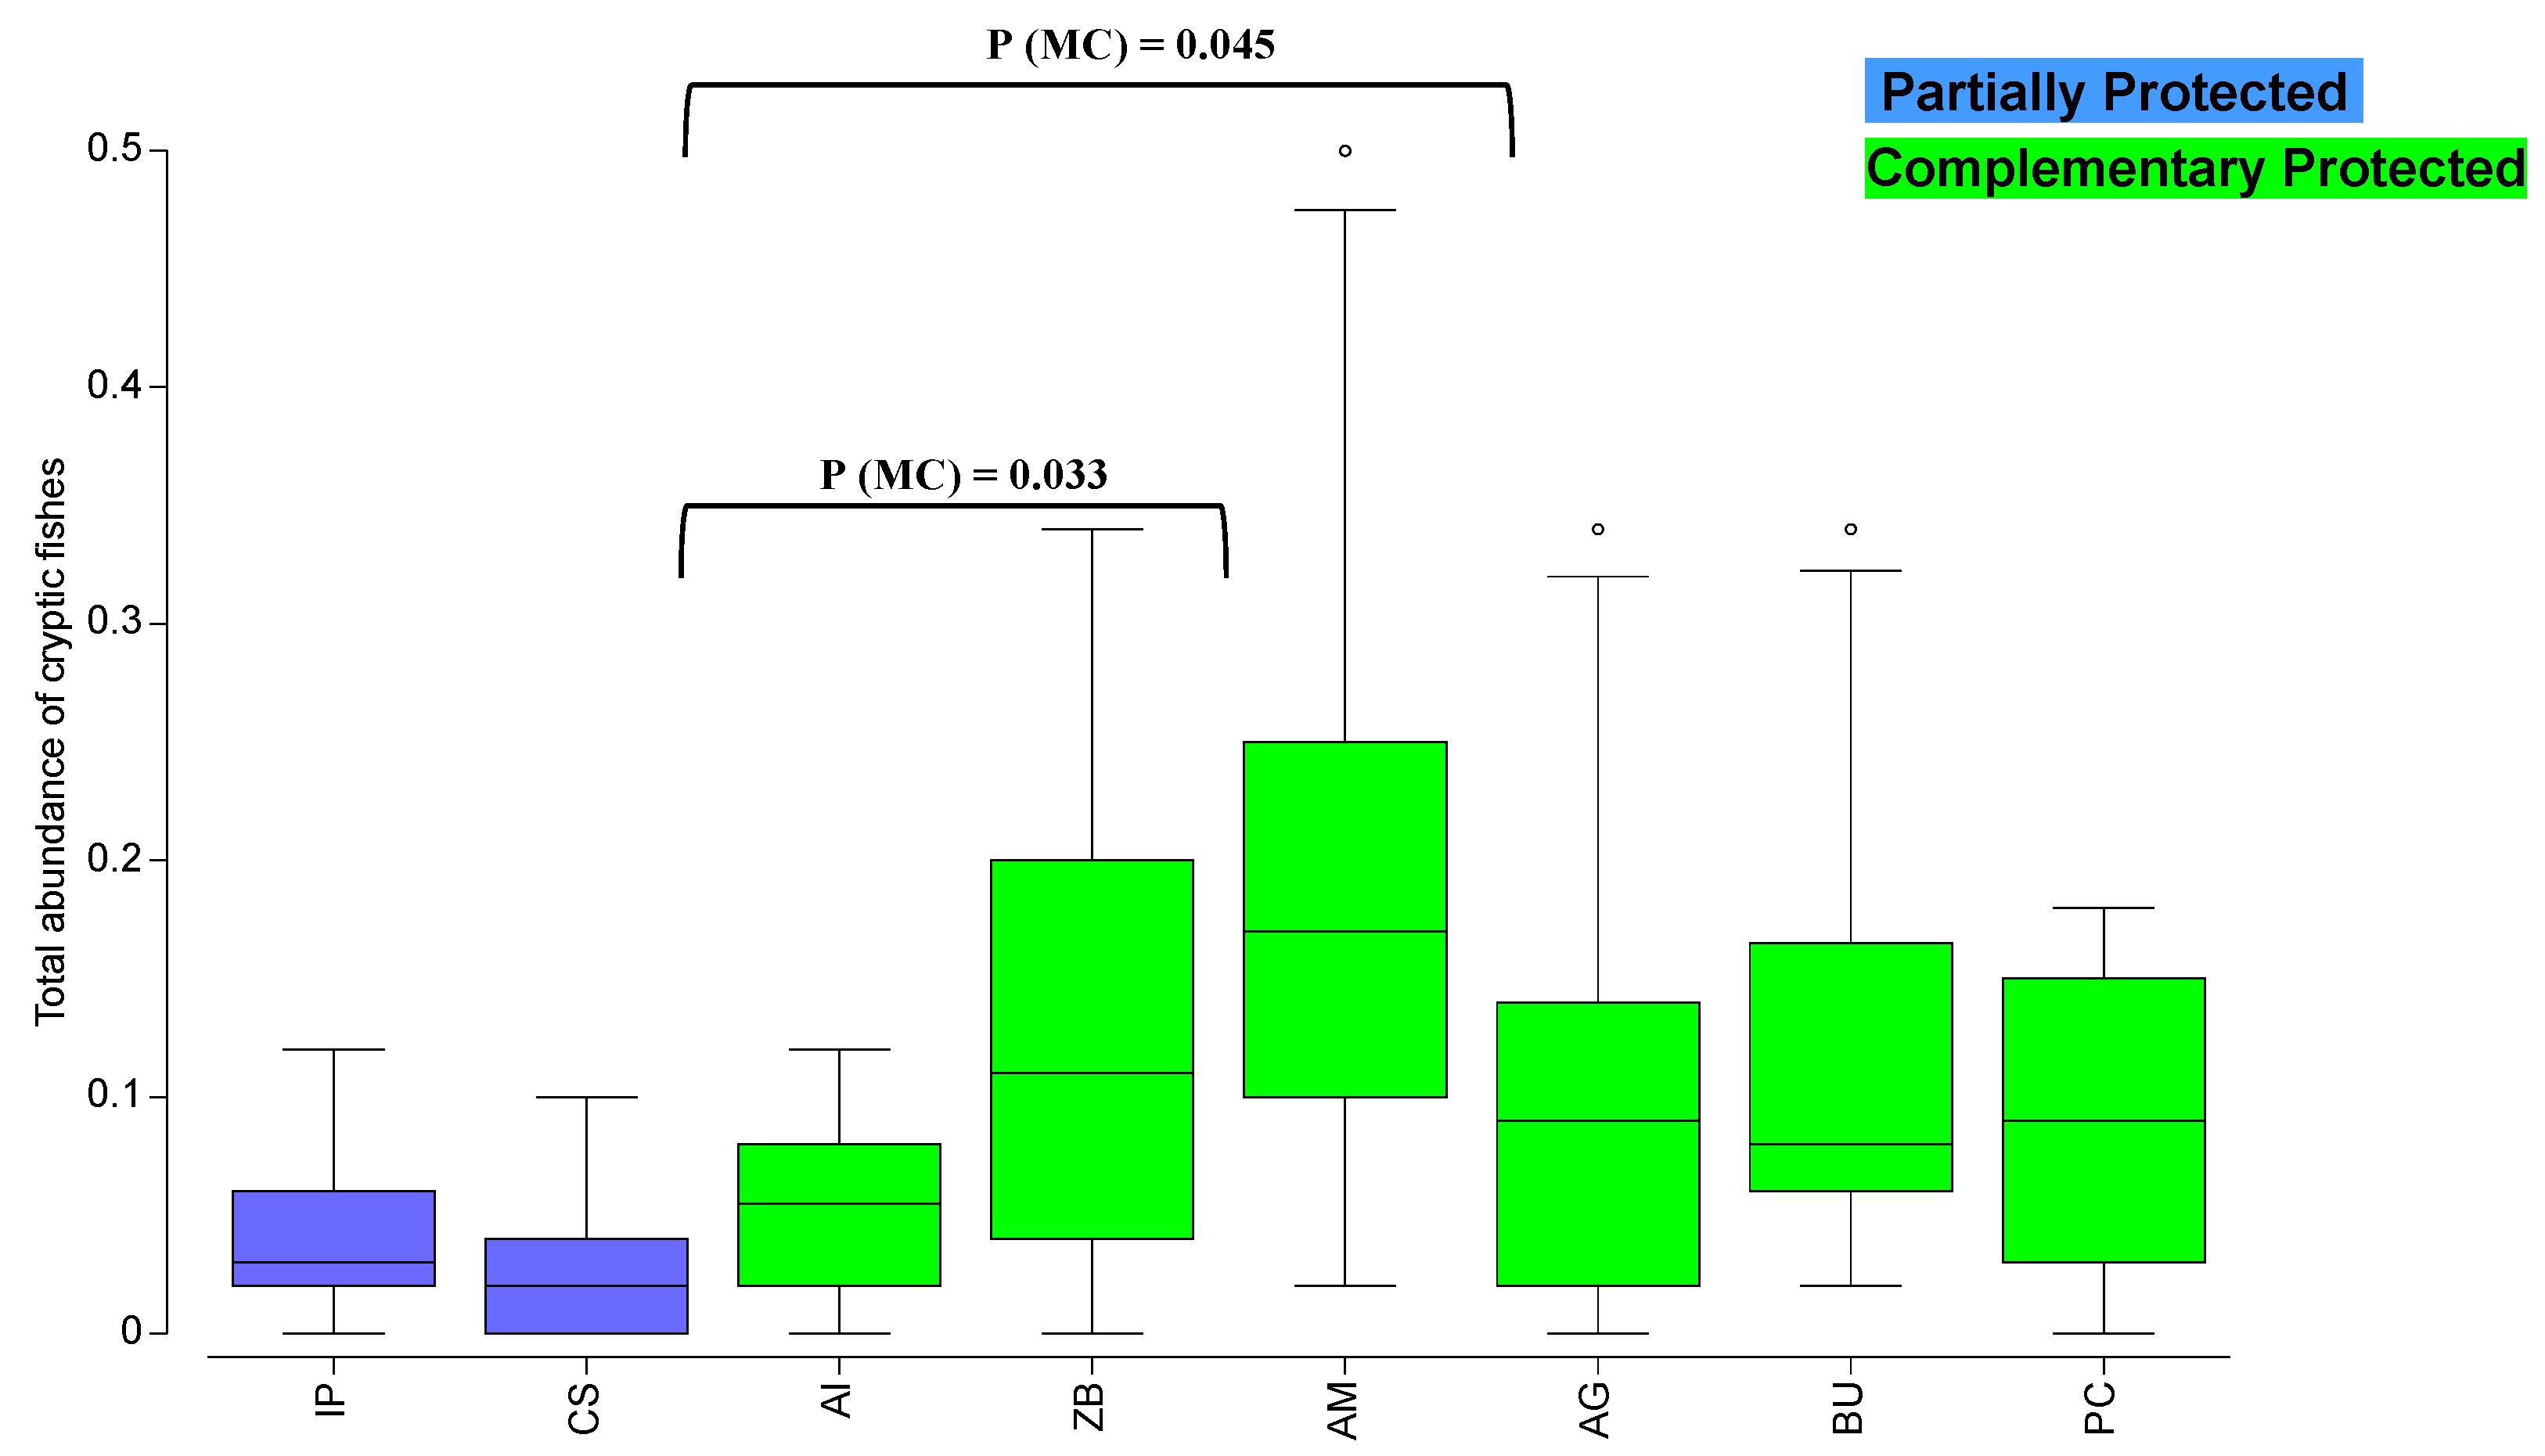
The number of taxa (an indicator of species richness) and the average total fish abundance (individuals per m2) were computed considering the factors Year (two levels: 2011 and 2012; fixed), Protection (two levels: partial and complementary protection; fixed), Area (eight levels; random, nested in Protection; two areas of partial protection; six areas of complementary protection), and Site (two levels: North and South; random, nested in Area). The values of these indexes were compared in spatial and temporal terms by univariate PERMANOVA analysis [46] under Euclidean distance resemblance [47], conducting the main and posteriori tests. The p-values for the pseudo-F ratios were calculated (P(perm)) by permutation of the raw data through 999 permutations. Monte Carlo permutation tests (P(MC)) considering the referred factors were also conducted and chosen when the number of permutations was inferior to 100 [46]. The spatial and temporal patterns of fish community structure were first explored with Principal Coordinates Analysis (PCO). The square-root transformation was applied to the abundance matrix (ind./m2), and the calculations were based on the Bray–Curtis similarity measure [47]. Multivariate PERMANOVA analyses (main and pairwise) were based on the same factors described earlier and performed with a similar methodology. When significant differences were detected for the analyzed factor, a SIMPER (Similarity Percentages) procedure was conducted to assess which species contributed the most to the similarity or dissimilarity within and between the different levels of that factor, respectively (cut-off level of 90%; only species with a percentage contribution of ≥2% are reported; [48]). The temporal and spatial data of the substrate physical characteristics (abundance of bottom types) were analyzed similarly to the multivariate analysis of the fish communities by using the same factors, priorly transformed (Log (x) + 1) and normalized. The calculations were based on the Euclidean distance measure. The substrate’s heterogeneity was related in spatial and temporal terms by univariate PERMANOVA analysis under Euclidean distance resemblance. Permutational analysis of multivariate dispersion (PERMDISP) was used to check the heterogeneity of data dispersions in the significant fixed factors revealed by PERMANOVA. Transformations were applied when necessary [49]. When homogeneity was not achieved even after data transformation, a more rigorous criterion of p < 0.01 was used to reject the null hypothesis [50]. The statistical data analyses were performed using PRIMER v6 software package [51] with PERMANOVA add-on package [46].

3. Results

Throughout the study, we observed a total of 9246 fishes belonging to 17 families, and 45 species (52 taxa), being 8650 in the non-cryptic transects (33 taxa; 12 families, 29 species) and 596 in the cryptic transects (19 taxa; 6 families, 16 species). A total average abundance of 1.930 ± 0.807 ind./m2 was recorded, being 1.164 ± 0.491 ind./m2 in the non-cryptic transects and 0.766 ± 0.316 ind./m2 in the cryptic transects (Tables S1 and S2).
Regarding the non-cryptic fishes in 2011 in CP areas, an average abundance of 0.664 ± 0.276 fishes per m2 belonging to 28 taxa (25 species) was observed (Table S1). In 2012, this indicator increased to 0.854 ± 0.337 fishes/m2 for 28 taxa (25 species) (Table S1). Inside PP areas, these records were lower but with a higher increment with time: in 2011, an average abundance of 0.177 ± 0.089 fishes per m2 and 17 taxa (16 species) was observed, and in 2012, an average abundance of 0.633 ± 0.337 fishes/m2 and 17 taxa (16 species) was sampled (Table S1). The most observed non-cryptic taxa in CP areas were medium Boops boops ([15,16,17,18,19,20,21,22,23,24,25,26,27,28,29,30] cm) and small Coris julis (<8.3 cm) in 2011, while in 2012, small Atherina sp. (<5 cm) and small B. boops (<15 cm) dominated (Table S1). In PP areas, medium C. julis ([8.3–16.7] cm) and medium Diplodus vulgaris ([15,16,17,18,19,20,21,22,23,24,25,26,27,28,29,30] cm) were the most abundant in 2011 (Table S1). The year after, in the same areas, small and medium Pomastochistus flavescens (<2 cm and ([2–4 cm]) were the most detected (Table S1). Overall, the most abundant taxa were medium D. vulgaris ([15,16,17,18,19,20,21,22,23,24,25,26,27,28,29,30] cm) and small and medium P. flavescens (<2 cm and [2–4 cm]) inside PP areas. In comparison, outside those areas, small B. boops (<15 cm) and small C. julis (<8.3 cm) were the most spotted fishes (Table S1).
For the cryptic sampling in 2011 in CP areas, we registered an average abundance of 0.148 ± 0.029 fishes/m2 belonging to 12 species and two genera (Table S2). In 2012, this abundance decreased to 0.069 ± 0.018 fishes/m2, 12 species, and one genus (Table S2). The average abundance of cryptic fishes in PP was 0.043 ± 0.030 and 0.049 ± 0.027 fishes/m2 in 2011 and 2012, respectively. In 2011, eight fish species were observed, and ten fish species in the year after (Table S2). The blennid Parablennius gattorugine was the cryptic species with the most records in both areas and years, followed by Parablennius pilicornis (Table S2).
The PCO ordination plots do not reflect a distinct pattern of the non-cryptic community structure (Figure 2A,B) between partially protected areas (PP) and adjacent complementary protected areas (CP) (Figure 2A). Even between consecutive years, no clear pattern could be observed (Figure 2B).
For the non-cryptic fish community structure, the PERMANOVA analysis detected significant “Year” vs. “Area” and “Year” vs. “Site” interactions (Table 1). Pairwise tests applied to the interaction “Year” vs. “Area” only detected significant differences with a Monte-Carlo (MC) permutation test in the areas ZB (P(MC) = 0.027) and CS (P(MC) = 0.04) between 2011 and 2012.
The respective SIMPER analysis verified that the differences in CS between years were mainly due to a higher abundance, in 2012, of small C. julis (<8.3 cm), medium D. vulgaris (15–30 cm), and small P. flavescens (<2 cm), amongst other taxa (Table S3). As for the differences found in ZB, those were related to a reduction in abundance or even to the absence of some taxa from 2011 to 2012, namely, medium B. boops (15–30 cm), small and medium C. julis (<8.3 cm and 8.3–16.7 cm), small C. exoletus (<4.3 cm), medium P. flavescens (2–4 cm), medium S. salpa (18–36 cm), and small D. vulgaris (<15 cm), along with other fish taxa (Table S4).
The PCO plots showed no distinct spatial or temporal patterns in the cryptic fish community structure (Figure 2C,D). The respective PERMANOVA test showed no significant differences in all factors considered (Table 2).
Concerning non-cryptic fishes’ average taxa richness, the PERMANOVA analysis revealed a significant interaction between “Year” and “Area” (Table S5). The pairwise tests for this interaction revealed only significant differences between years in ZB (CP area) (2011 > 2012; Figure 3).
For the average taxa richness for cryptic fishes, the PERMANOVA analysis detected significant “Year” vs. “Protection” and “Year” vs. “Site” interactions (Table S6). The pairwise tests for “Year” vs. “Protection” showed differences in CP areas over the years (P(perm) = 0.034), where the average taxa richness of cryptic fishes was higher in 2011 (2011—3.95 ± 0.57; 2012—2.01 ± 0.72; Figure 4).
Regarding the average total abundance of non-cryptic fishes, the PERMANOVA analysis detected significant differences in “Protection” (Table S7 and Figure 5). On average, PP areas had less abundance (0.41 ± 0.07 nº/m2) of non-cryptic fishes than CP areas (0.73 ± 0.23 nº/m2) (Figure 5).
Regarding the total abundance of cryptic fishes, the PERMANOVA analysis verified significant differences in the factor “Area” and a significant “Year” vs. “Site” interaction (Table S8). Pairwise tests for the factor “Area” revealed significant differences between AI and A, and between AI and ZB (P(MC) < 0.05) in all CP areas (Figure 6).
The PERMANOVA analysis of the temporal and spatial data of the substrate’s physical characteristics, considering the abundance of substrate types (sand, boulders, pebbles, and bedrock), showed significant differences for the factors “Protection” and “Area” and a significant interaction between “Year” and “Site” (Table S9). The SIMPER analyses presented in Tables S10 and S11 show that these differences between PP and CP areas were mainly due to the abundance of sand and boulders, higher in PP, and the abundance of pebbles, higher in CP, although the abundance of bedrock made the major contribution to the similarity between PP an CP areas. A pairwise analysis of that interaction verified that six sites had annual differences, most of them in CP areas (Table S12). The respective SIMPER analysis showed that the annual differences detected in the different sites were due to the higher abundance of boulders and pebbles in 2012 (Table S13).
The substrate’s heterogeneity PERMANOVA analysis detected a significant interaction between “Year” and “Area” (Table S14). Pairwise tests applied to this interaction revealed no significant temporal or spatial differences.

4. Discussion

This study used fish assemblages to assess marine protection’s ecological effects on northern PNSACV’s shallow rocky habitats. The effects of protection were not evident in the metrics applied in the present work, namely, taxa richness, abundance, size and community composition of non-cryptic and cryptic fishes. Due to the current exploitation of marine resources, effective and appropriate management measures must be executed. MPAs and other spatial control measures have been identified as adequate instruments for marine resources management and biodiversity conservation [52,53]. MPAs protect habitats, and ecological interactions and components from major anthropogenic influences [54]. One of the benefits of MPAs is the spillover effect by some species, demonstrating a significant response to protection and concurrent higher yields near the MPA borders [52,55].
The PNSACV became a marine park in 2011, when MPAs with different protection levels (total, partial, and complementary) were designated in it [56]. In recent years, authors [43], also studying PP MPAs in PNSACV, mentioned that their major difficulty was assessing the protective effects in a recently implemented PP MPA without any background information. It is imperative to use fish assemblages before MPA establishment, as they provide baseline information for future monitoring and assessment [57,58]. The same applies to our study, where an MBACI (Multiple Before–After, Control–Impact) strategy should have been applied [59,60,61]. Since this was not done, we used the best next option to start the present study a few months after the MPAs were designated. Our chosen methodology to tackle this study was UVC. Worldwide, UVC has been accepted as an effective monitoring tool to assess fish communities, particularly in no-take MPAs, since this methodology is non-destructive and cost-efficient and allows the detection of a high number of species [62,63,64]. According to Pais et al. [65], there are two common errors while conducting a UVC: systematic errors due to low detectability and random errors due to fish mobility around the transects. To obviate this, we used the same highly trained divers in most dives and a robust study design with a well-defined depth range to account for fish communities’ differences [66].
Our goal was to determine if partially protected MPAs altered taxa richness, abundance, size, and community composition of non-cryptic and cryptic fishes and if these effects were detected outside those areas. With two-year data, we found no effects of protection regarding rocky reefs at an average depth of 10 m. The two univariate indicators used in the present study, taxa richness and total abundance, provided inconclusive results regarding the study questions.
Community structure had no significant spatial or temporal differences for the cryptic fishes. For non-cryptic fishes, the analysis of community structure found significant interactions (“Year” vs. “Area” and “Year” vs. “Site”). Two close areas, CS and ZB, showed temporal differences; CS is a partially protected area (PP), and ZB is located in a complementary protection area (CP). In CS, these differences were mainly due to an increase in abundance, in 2012, of several fish taxa, including the commercially and recreationally relevant D. vulgaris (medium and small size classes). This increase could be a hint for favoring area protection. Other authors verified that in the southwestern part of the PNSACV, Diplodus spp. were larger inside the protected areas [42]. Belo et al. [40] confirmed that the IP area (PP) was a critical feeding and refuge area for D. sargus. These authors also demonstrated that this protected area had an adequate size to safeguard this species. In the region, Diplodus spp. are some of the most targeted species by fishermen [8,67] due to their abundance and high commercial value [43]. In ZB, an opposite temporal pattern was found, as these differences were mainly due to a decrease in abundance, in 2012, of several fish taxa. This pattern may be indirectly related to fishing exploitation, as most of the fish taxa affected are not crucial for fisheries.
The analysis of non-cryptic taxa richness verified only significant temporal differences in the ZB area, where the number of taxa decreased from 2011 to 2012. The cryptic fishes’ taxa richness analysis showed a significant interaction between the “Protection” and “Year” factors. Only CP areas showed significant temporal differences, and the number of taxa of cryptic fishes also decreased from 2011 to 2012. In some MPAs, an increase in the abundance of predatory fishes can cause ecosystem-wide effects such as trophic cascades [20] and decreases in small cryptic fishes [68]. When dealing with tropic cascade phenomena, the impact of fishing and environmental differences is very complex to analyze [31,42]. That was one of the reasons why we considered two types of fish in the present study to scrutinize such effects (i.e., decrease in the abundance of cryptic fishes with an increase in non-cryptic ones). The present study did not verify such evidence. CP areas had a higher total abundance of non-cryptic fishes. These differences might be related to the abundance of some fish species that form schools (i.e., Atherina sp. and Boops boops), which were the main observations in those areas. The cryptic fishes’ significant differences in total abundance were only found between some CP areas. Changes in fish indicators (i.e., biomass) can only be observed after several years of protection [69]. The increase in abundance may be even slower, depending on several factors, such as the configuration of the MPAs, their management, enforcement, public acceptance, and compliance with protection [17,69,70]. The authors recorded several illegal fishing activities inside the studied PP areas. Fishing in these areas may reduce the protection effects, making protection less effective [71].
The MPAs recency could account for most of the results detected in the present study, where no significant protection effects were found. Edgar and Barrett [72], when examining Tasmania MPAs, only found differences between MPAs and buffering areas after five years. Other authors, such as Claudet et al. [59], found differences in fish communities after three years using underwater visual censuses. Pereira et al. [43], when studying PP areas in the PNSACV, found significant differences within the same time frame as the latter authors. Changes in fish structure assemblages (abundance and fish size) between PP locations and neighboring areas were observed [43]. Therefore, the period in which the real effects of MPAs are assessed can be variable [73].
The data obtained in the present work provided a baseline for non-cryptic and cryptic fish communities on the Alentejo coast of the PNSACV shortly after the marine park implementation in 2011. Several fish attributes, such as taxa richness, abundance, size, and community composition, are now available. Thus, this work establishes a reference for future studies concerning the marine park’s ecological evolution, including PP and adjacent CP areas, and phenomena such as spillover that could be reflected in the regional fishing fleet’s revenues. Replication in time within a monitoring program is recommended to assess the evolution and success of the MPAs in the Alentejo PNSACV and verify the ecological effects of these conservation measures.

Supplementary Materials

The following supporting information can be downloaded at: https://www.mdpi.com/article/10.3390/hydrobiology2010012/s1, Supplementary Material contains Table S1—Non-cryptic fish’s average abundance (ind./m2 ± standard error) observed in partially protected areas (PP) and adjacent complementary protected areas (CP) sampled in the northern marine PNSACV (2011, 2012, and total); Table S2—Cryptic fish’s average abundance (nº/m2 ± standard error) observed in partially protected areas (PP) and adjacent complementary protected areas (CP) sampled in the northern marine PNSACV (2011, 2012, and total); Table S3—Results of the SIMPER analysis showing the averaged dissimilarity between “Years” (2011 and 2012) for Cabo Sardão (CS) partially protected area, considering the abundance of non-cryptic fishes in the northern marine PNSACV; Table S4—Results of the SIMPER analysis showing the averaged dissimilarity between “Years” (2011 and 2012) for Zambujeira (ZB) complementary protection area, considering the abundance of non-cryptic fishes in the northern marine PNSACV; Table S5—Results of the four-factor PERMANOVA test considering the “Year” (2 levels, fixed), “Protection” (2 levels, fixed), “Area” (8 levels, random and nested in “Protection”), and “Site” (2 levels, random and nested in “Area) factors for the analysis of the average taxa richness of non-cryptic fishes in the northern marine PNSACV; Table S6—Results of the four-factor PERMANOVA test considering the “Year” (2 levels, fixed), “Protection” (2 levels, fixed), “Area” (8 levels, random and nested in “Protection”), and “Site” (2 levels, random and nested in “Area”) factors for the analysis of the average taxa richness of cryptic fishes in the northern marine PNSACV; Table S7—Results of the four-factor PERMANOVA test considering the “Year” (2 levels, fixed), “Protection” (2 levels, fixed), “Area” (8 levels, random and nested in “Protection”), and “Site” (2 levels, random and nested in “Area”) factors for the analysis of the average total abundance (nº/m2) of non-cryptic fishes in the northern marine PNSACV; Table S8—Results of the four-factor PERMANOVA test considering the “Year” (2 levels, fixed), “Protection” (2 levels, fixed), “Area” (8 levels, random and nested in “Protection”), and “Site” (2 levels, random and nested in “Area”) factors for the analysis of the average total abundance (nº/m2) of cryptic fishes in the northern marine PNSACV; Table S9—Results of the four-factor PERMANOVA test considering the “Year” (2 levels, fixed), “Protection” (2 levels, fixed), “Area” (8 levels, random and nested in “Protection”), and “Site” (2 levels, random and nested in “Area) factors for the analysis of the substrate physical characteristics in the northern marine PNSACV; Table S10—SIMPER analysis showing the averaged dissimilarity between complementary protection areas (CP) and partially protected areas (PP) in the northern marine PNSACV, considering the abundance of the substrate types (sand, boulders, pebbles, and bedrock); Table S11—SIMPER analysis showing the averaged similarity of complementary protection areas (CP) and partially protected areas (PP) in the northern marine PNSACV, considering the abundance of the substrate types (sand, boulders, pebbles, and bedrock); Table S12—Results of pairwise tests applied to the “Year” (2011 and 2012, fixed) vs. “Site” (two levels: North and South; random, nested in Area) interaction for the analysis of the substrate physical characteristics in the northern marine PNSACV between years; Table S13—Results of the SIMPER analysis showing the average dissimilarity of the significant differences detected for “Year” (2011 and 2012, fixed) vs. “Site” (two levels: North (N) and South (S); random, nested in the Areas (Burrinho (BU), Porto Covo (PC), Zambujeira (ZB), and Ilha do Pessegueiro (IP)), in the northern marine PNSACV, considering the abundance of the substrate types (sand, boulders, pebbles and bedrock) between years; Table S14—Results of the four-factor PERMANOVA test considering the “Year” (2 levels, fixed), “Protection” (2 levels, fixed), “Area” (8 levels, random and nested in “Protection”), and “Site” (2 levels, random and nested in “Area) factors for the analysis of substrate heterogeneity in the northern marine PNSACV.

Author Contributions

Conceptualization: J.J.C.; Methodology: N.C., T.J.P., A.C., J.S., A.F., M.J.T. and J.J.C.; Analyses: N.C. and J.J.C.; Visualization: N.C. and J.J.C.; Writing—original draft preparation: N.C.; Writing-review and editing: N.C., T.J.P., A.C., J.S., A.F., M.J.T. and J.J.C.; Resources and Funding Acquisition: J.J.C.; Supervision: J.J.C. All authors have read and agreed to the published version of the manuscript.

Funding

Nuno Castro was funded by a doctoral grant (SFRH/BD/146881/2019) awarded by Fundação para a Ciência e Tecnologia (FCT). This study is part of the project PROTECT (www.protect.uevora.pt) co-funded by Programme PROMAR (31-03-05-FEP-0012). Finally, this study was supported by FCT through the strategic project UIDB/04292/2020 awarded to MARE and through project LA/P/0069/2020 granted to the Associate Laboratory ARNET.

Institutional Review Board Statement

Not applicable.

Informed Consent Statement

Not applicable.

Data Availability Statement

Data will be made available on request.

Conflicts of Interest

The authors declare no conflict of interest.

References

  1. Halpern, B.S.; Walbridge, S.; Selkoe, K.A.; Kappel, C.V.; Micheli, F.; D’Agrosa, C.; Bruno, J.F.; Casey, K.S.; Ebert, C.; Fox, H.E.; et al. A global map of human impact on marine ecosystems. Science 2008, 319, 948–952. [Google Scholar] [CrossRef]
  2. Ojaveer, H.; Galil, B.S.; Minchin, D.; Olenin, S.; Amorim, A.; Canning-Clode, J.; Chainho, P.; Copp, G.H.; Gollasch, S.; Jelmert, A.; et al. Ten recommendations for advancing the assessment and management of non-indigenous species in marine ecosystems. Mar. Policy 2014, 44, 160–165. [Google Scholar] [CrossRef]
  3. Nielsen, P.; Nielsen, M.N.; McLaverty, C.; Kristensen, K.; Geitner, K.; Olsen, J.; Saurel, C.; Petersen, J.K. Management of bivalve fisheries in marine protected areas. Mar. Policy 2021, 124, 104357. [Google Scholar] [CrossRef]
  4. White, T.D.; Ong, T.; Ferretti, F.; Block, B.A.; McCauley, D.J.; Micheli, F.; De Leo, G.A. Tracking the response of industrial fishing fleets to large marine protected areas in the Pacific Ocean. Conserv. Biol. 2020, 34, 1571–1578. [Google Scholar] [CrossRef]
  5. Turnbull, J.W.; Johnston, E.L.; Clark, G.F. Evaluating the social and ecological effectiveness of partially protected marine areas. Conserv. Biol. 2021, 35, 921–932. [Google Scholar] [CrossRef] [PubMed]
  6. Kelleher, G.; Kenchington, R. Guidelines for Establishing Marine Protected Areas. In A Marine Conservation and Development Report; IUCN: Gland, Switzerland, 1992. [Google Scholar]
  7. Agardy, T.; Bridgewater, P.; Crosby, M.P.; Day, J.; Dayton, P.K.; Kenchington, R.; Laffoley, D.; McConney, P.; Murray, P.A.; Parks, J.E.; et al. Dangerous targets? Unresolved issues and ideological clashes around marine protected areas. Aquat. Conserv. 2003, 13, 353–367. [Google Scholar]
  8. Castro, N.; Romão, F.; Castro, J.J.; Pereira, T.J.; Pedro, S.; Viegas, V.; Costa, J.L. Catches, sales and discards: Small-scale fisheries in a Portuguese Marine Park. Reg. Stud. Mar. Sci. 2021, 42, 101643. [Google Scholar] [CrossRef]
  9. Agardy, M.T. Advances in marine conservation: The role of marine protected areas. Trends Ecol. Evol. 1994, 9, 267–270. [Google Scholar] [CrossRef]
  10. Murray, S.N.; Ambrose, R.F.; Bohnsack, J.A. No-take reserve networks: Sustaining fishery populations and marine ecosystems. Fisheries 1999, 24, 11–25. [Google Scholar] [CrossRef]
  11. Murawski, S.A.; Brown, R.; Lai, H.L.; Rago, P.J.; Hendrickson, L. Large-scale closed areas as a fishery-management tool in temperate marine systems: The Georges Bank experience. Bull. Mar. Sci. 2000, 66, 775–798. [Google Scholar]
  12. Sumaila, U.R.; Guenette, S.; Adler, J.; Chuenpagdee, R. Addressing ecosystem effects of fishing using marine protected areas. ICES J. Mar. Sci. 2000, 57, 752–760. [Google Scholar] [CrossRef]
  13. Roberts, C.M.; Bohnsack, J.A.; Gell, F.; Hawkins, J.P.; Goodridge, R. Effects of marine reserves on adjacent fisheries. Science 2001, 294, 1920–1923. [Google Scholar] [CrossRef] [PubMed] [Green Version]
  14. Garcia-Charton, J.; Perez-Ruzafa, A.; Marcos, C.; Claudet, J.; Badalamentic, F.; Benedetti-Cecchid, L.; Falcon, J.M.; Milazzo, M.; Schembrig, P.; Stobarth, B.; et al. Effectiveness of European Atlanto-Mediterranean MPAs: Do they accomplish the expected effects on populations, communities and ecosystems? J. Nat. Conserv. 2008, 16, 193–221. [Google Scholar] [CrossRef]
  15. Fenberg, P.; Caselle, J.; Claudet, J.; Clemence, M.; Gaines, S.; García-Charton, J.; Gonçalves, E.; Grorud-Colvert, K.; Guidetti, P.; Jenkins, S.; et al. The science of European marine reserves: Status, efficacy, and future needs. Mar. Policy 2012, 36, 1012–1021. [Google Scholar] [CrossRef]
  16. Di Lorenzo, M.; Guidetti, P.; Di Franco, A.; Calò, A.; Claudet, J. Assessing spillover from marine protected areas and its drivers: A meta-analytical approach. Fish Fish 2020, 21, 906–915. [Google Scholar] [CrossRef]
  17. Palumbi, S.R. The ecology of marine protected areas. In Marine Community Ecology; Bertness, M.D., Gaines, S.D., Hay, M.E., Eds.; Sinauer Associates: Sunderland, MA, USA, 2001; pp. 509–530. [Google Scholar]
  18. Halpern, B.S. The impact of marine reserves: Do reserves work and does reserve size matter? Ecol. Appl. 2003, 13, 117–137. [Google Scholar] [CrossRef]
  19. Hilborn, R.; Stokes, K.; Maguire, J.J.; Smith, T.; Botsford, L.W.; Mangel, M.; Orensanz, J.; Parma, A.; Rice, J.; Bell, J.; et al. When can marine reserves improve fisheries management? Ocean. Coast Manag. 2004, 47, 197–205. [Google Scholar] [CrossRef]
  20. Guidetti, P.; Sala, E. Community-wide effects of marine reserves in the Mediterranean Sea. Mar. Ecol. Prog. Ser. 2007, 335, 43–56. [Google Scholar] [CrossRef]
  21. Edgar, G.J.; Stuart-Smith, R.D. Ecological effects of marine protected areas on rocky reef communities—A continental-scale analysis. Mar. Ecol. Prog. Ser. 2009, 388, 51–62. [Google Scholar] [CrossRef]
  22. Pereira, T.J.; Manique, J.; Quintella, B.R.; Castro, N.; Almeida, P.R.; Costa, J.L. Changes in trophic ecology of fish assemblages after no take Marine Protected Area designation in the southwestern coast of Portugal. Ocean Coast Manag. 2017, 137, 144–153. [Google Scholar] [CrossRef]
  23. Claudet, J.; Osenberg, C.; Benedetti-Cecchi, L.; Domenici, P.; Garcıía-Charton, J.; Perez-Ruzafa, A.; Badalamenti, F.; Bayle-Sempere, J.; Brito, A.; Bulleri, F.; et al. Marine reserves: Size and age do matter. Ecol Lett. 2008, 11, 481–489. [Google Scholar] [CrossRef] [PubMed]
  24. Jacinto, D.; Cruz, T.; Silva, T.; Castro, J.J. Management of the stalked barnacle (Pollicipes pollicipes) fishery in the Berlengas Nature Reserve (Portugal): Evaluation of bag and size limit regulation measures. Sci. Mar. 2011, 75, 439–445. [Google Scholar] [CrossRef] [Green Version]
  25. Bertocci, I.; Dominguez, R.; Freitas, C.; Sousa-Pinto, I. Patterns of variation of intertidal species of commercial interest in the Parque Litoral Norte (north Portugal) MPA: Comparison with three reference shores. Mar. Environ. Res. 2012, 77, 60–70. [Google Scholar] [CrossRef] [PubMed]
  26. Rodrigues, N.; Mendes, S.; Franco, J.; Castanheira, M.; Castro, N.; Maranhão, P. Fish diversity in the Berlengas Natural Reserve (Portugal), a marine protected area. Ecologia 2011, 3, 35–43. [Google Scholar]
  27. Sousa, A.; Jacinto, D.; Penteado, N.; Pereira, D.; Silva, T.; Castro, J.J.; Leandro, S.M.; Cruz, T. Temporal variation of the fishers’ perception about the stalked barnacle (Pollicipes pollicipes) fishery at the Berlengas Nature Reserve (Portugal). Reg. Stud. Mar. Sci. 2020, 38, 101378. [Google Scholar] [CrossRef]
  28. Mendes, R.; Pereira da Silva, C.; Fonseca, C.; Gil, A. Managing and Monitoring the Recreational Use of Coastal Protected Areas: The Case of Berlengas Nature Reserve (Portugal). In Global Coastal Issues of 2020; Malvárez, G., Navas, F., Eds.; Journal of Coastal Research: Coconut Creek, FL, USA, 2020; Special Issue No. 95; pp. 123–127. [Google Scholar]
  29. Gonçalves, E.; Henriques, M.; Almada, V. Use of Temperate Reef-Fish Community to Identify Priorities in the Establishment of a Marine Area. In Aquatic Protected Areas: What Works Best and How Do We Know? Proceedings of the World Congress on Aquatic Protected Areas, Cairns, Australia; Beumer, J., Grant, A., Smith, D., Eds.; Australian Society for Fish Biology: Cairns, Australia, 2003; pp. 262–272. [Google Scholar]
  30. Sousa, I. Assessment of Reserve Effect in a Marine Protected Area: The Case Study of the Professor Luiz Saldanha Marine Park (Portugal). Master’s Thesis, Universidade do Algarve, Faro, Portugal, 2011. [Google Scholar]
  31. Henriques, S.; Pais, M.P.; Costa, M.J.; Cabral, H.N. Seasonal variability of rocky reef fish assemblages: Detecting functional and structural changes due to fishing effects. J. Sea Res. 2013, 79, 50–59. [Google Scholar] [CrossRef]
  32. Sousa, I.; Gonçalves, J.M.S.; Claudet, J.; Coelho, R.; Gonçalves, E.J.; Erzini, K. Soft-bottom fishes and spatial protection: Findings from a temperate marine protected area. PeerJ 2018, 6, e4653. [Google Scholar] [CrossRef] [PubMed]
  33. Priester, C.R.; Martínez-Ramírez, L.; Erzini, K.; Abecasis, D. The impact of trammel nets as an MPA soft bottom monitoring method. Ecol. Indic. 2021, 120, 106877. [Google Scholar] [CrossRef]
  34. Horta e Costa, B.; Erzini, K.; Caselle, J.E.; Folhas, H.; Gonçalves, E.J. Reserve effect’ within a temperate marine protected area in the north-eastern Atlantic (Arrábida Marine Park, Portugal). Mar. Ecol. Prog. Ser. 2013, 481, 11–24. [Google Scholar] [CrossRef]
  35. ICN. Turismo de Natureza: Enquadramento Estratégico, Parque Natural Do Sudoeste Alentejano e Costa Vicentina, 2000–2006; Instituto de Conservação da Natureza: Lisbon, Portugal, 2001. [Google Scholar]
  36. Castro, J.J.; Cruz, T. Marine conservation in a Southwest Portuguese natural park. J. Coast. Res. 2009, 56, 385–389. [Google Scholar]
  37. Cruz, T. Biologia e Ecologia do Percebe, Pollicipes pollicipes (Gmelin, 1790), no Litoral Sudoeste Português. Ph.D. Thesis, University of Évora, Évora, Portugal, 2000. [Google Scholar]
  38. Cruz, T.; Jacinto, D.; Sousa, A.; Penteado, N.; Pereira, D.; Fernandes, J.N.; Silva, T.; Castro, J.J. The state of the fishery, conservation and management of the stalked barnacle Pollicipes pollicipes in Portugal. Mar. Environ. Res. 2015, 112, 73–80. [Google Scholar] [CrossRef]
  39. Silva, J. Alterações na composição e na estrutura trófica das comunidades de peixes das áreas Marinhas Protegidas da Ilha do Pessegueiro e Cabo Sardão após a proibição da pesca. Master’s Thesis, Faculty of Sciences, University of Lisbon, Lisbon, Portugal, 2015. [Google Scholar]
  40. Belo, A.F.; Pereira, T.J.; Quintella, B.R.; Castro, N.; Costa, J.L.; Almeida, P.R. Movements of Diplodus sargus (Sparidae) within a Portuguese coastal marine protected area: Are they really protected? Mar. Environ. Res. 2016, 114, 80–94. [Google Scholar] [CrossRef] [PubMed]
  41. Pereira, T.J.; Silva, A.F.; Belo, A.F.; Castro, N.; Costa, J.L.; Almeida, P.R.; Quintella, B.R. Assessing the size adequacy of a small no-take Marine Protected Area for Mediterranean moray and European conger. Mar. Ecol. Prog. Ser. 2017, 584, 213–227. [Google Scholar] [CrossRef]
  42. Fernández, C.G.; Paulo, D.; Serrão, E.A.; Engelen, A.H. Limited differences in fish and benthic communities and possible cascading effects inside and outside a protected marine area in Sagres (SW Portugal). Mar. Environ. Res. 2016, 114, 12–23. [Google Scholar] [CrossRef] [PubMed]
  43. Pereira, T.J.; Manique, J.; Quintella, B.R.; Castro, N.; Almeida, P.R.; Costa, J.L. Changes in fish assemblage structure after implementation of Marine Protected Areas in the south western coast of Portugal. Ocean Coast. Manag. 2017, 135, 103–112. [Google Scholar] [CrossRef]
  44. Whitehead, P.J.; Bauchot, M.-L.; Hureau, J.-C.; Nielsen, J. (Eds.) Fishes of the North-East Atlantic and the Mediterranean; UNESCO: Paris, France, 1989; Volume I–III, p. 1473. [Google Scholar]
  45. Edgar, G.J.; Stuart-Smith, R.D.; Cooper, A.; Jacques, M.; Valentine, J. New opportunities for conservation of handfishes (Family Brachionichthyidae) and other inconspicuous and threatened marine species through citizen science. Biol. Conserv. 2017, 208, 174–182. [Google Scholar] [CrossRef]
  46. Anderson, M.J.; Gorley, R.N.; Clarke, K.R. PERMANOVA for PRIMER: Guide to Software and Statistical Methods; PRIMER-E: Plymouth, UK, 2008. [Google Scholar]
  47. Clarke, K.R.; Somerfield, P.J.; Chapman, M.G. On resemblance measures for ecological studies, including taxonomic dissimilarities and a zero-adjusted Bray–Curtis coefficient for denuded assemblages. J. Exp. Mar. Biol. Ecol. 2006, 330, 55–80. [Google Scholar] [CrossRef]
  48. Clarke, K.R. Non-parametric multivariate analyses of changes in community structure. Aust. J. Ecol. 1993, 18, 117–143. [Google Scholar] [CrossRef]
  49. Anderson, M.J. Permutational Multivariate Analysis of Variance (PERMANOVA). In Wiley StatsRef: Statistics Reference Online; Balakrishnan, N., Colton, T., Everitt, B., Piegorsch, W., Ruggeri, F., Teugels, J.L., Eds.; Wiley: Hoboken, NJ, USA, 2014. [Google Scholar]
  50. Underwood, A.J. Experiments in Ecology; Cambridge University Press: Cambridge, UK, 1997. [Google Scholar]
  51. Clarke, K.; Gorley, R. PRIMER v6: User Manual/Tutorial; PRIMER-E: Plymouth, UK, 2006. [Google Scholar]
  52. Di Lorenzo, M.; Claudet, J.; Guidetti, P. Spillover from marine protected areas to adjacent fisheries has an ecological and a fishery component. J. Nat. Conserv. 2016, 32, 62–66. [Google Scholar] [CrossRef]
  53. Corrales, X.; Vilas, D.; Piroddi, C.; Steenbeek, J.; Claudet, J.; Lloret, L.; Calò, A.; Di Franco, A.; Font, T.; Ligas, A.; et al. Multi-zone marine protected areas: Assessment of ecosystem and fisheries benefits using multiple ecosystem models. Ocean Coast. Manag. 2020, 193, 105232. [Google Scholar] [CrossRef]
  54. Friedlander, A.M.; Ballesteros, E.; Clemente, S.; Gonçalves, E.J.; Estep, A.; Rose, P.; Sala, E. Contrasts in the marine ecosystem of two Macaronesian islands: A comparison between the remote Selvagens Reserve and Madeira Island. PLoS ONE 2017, 12, e0187935. [Google Scholar] [CrossRef]
  55. Forcada, A.; Valle, C.; Bonhomme, P.; Criquet, G.; Cadiou, G.; Lenfant, P.; Sánchez-Lizaso, J.L. Effects of habitat on spillover from marine protected areas to artisanal fisheries. Mar. Ecol. Prog. Ser. 2009, 379, 197–211. [Google Scholar] [CrossRef]
  56. Silva, A.F.; Horta e Costa, B.; Costa, J.L.; Pereira, E.; Marques, J.P.; Castro, J.J.; Lino, P.G.; Candeias-Mendes, A.; Pousão-Ferreira, P.; Sousa, I.; et al. Movements of Hatchery-Reared Dusky Groupers Released in a Northeast Atlantic Coastal Marine Protected Area. J. Mar. Sci. Eng. 2022, 10, 904. [Google Scholar] [CrossRef]
  57. Edgar, G.J.; Bustamante, R.H.; Fariña, J.-M.; Calvopiña, M.; Martínez, C.; Toral-Granda, M.V. Bias in evaluating the effects of marine protected areas: The importance of baseline data for the Galapagos Marine Reserve. Envir. Conserv. J. 2004, 31, 212–218. [Google Scholar] [CrossRef]
  58. Boubekri, I.; Amara, R.; Djebar, A.B.; Mazurek, H. Baseline data for marine protected areas planning and fisheries monitoring: Potential conflicts between recreational IUU and commercial fisheries in the proposed “Taza” MPA (Algeria, SW Mediterranean). Ocean Coast. Manag. 2021, 201, 105425. [Google Scholar] [CrossRef]
  59. Claudet, J.; Pelletier, D.; Jouvenel, J.Y.; Bachet, F.; Galzin, R. Assessing the effects of a marine protected area (MPA) on a reef fish assemblage in a northwestern Mediterranean marine reserve: Identifying community-based indicators. Biol. Conserv. 2006, 130, 349–369. [Google Scholar] [CrossRef]
  60. Moland, E.; Olsen, E.M.; Knutsen, H.; Garrigou, P.; Espeland, S.H.; Kleiven, A.R.; Andre, C.; Knutsen, J.A. Lobster and cod benefit from small-scale northern marine protected areas: Inference from an empirical before– after control-impact study. Proc. R. Soc. B 2013, 280, 20122679. [Google Scholar] [CrossRef]
  61. Roberts, D.A.; Poore, A.G.B.; Johnston, E.L. MBACI sampling of an episodic disturbance: Stormwater effects on algal epifauna. Mar. Environ. Res. 2007, 64, 514–523. [Google Scholar] [CrossRef]
  62. Pelletier, D.; Leleu, K.; Mou-Tham, G.; Guillemot, N.; Chabanet, P. Comparison of visual census and high definition video transects for monitoring coral reef fish assemblages. Fish. Res. 2011, 107, 84–93. [Google Scholar] [CrossRef]
  63. Egerton, J.P.; Johnson, A.F.; Turner, J.; LeVay, L.; Mascareñas-Osorio, I.; Aburto-Oropeza, O. Hydroacoustics as a tool to examine the effects of Marine Protected Areas and habitat type on marine fish communities. Sci. Rep. 2017, 8, 47. [Google Scholar] [CrossRef]
  64. Rojo, I.; Anadón, J.D.; García-Charton, J.A. Exceptionally high but still growing predatory reef fish biomass after 23 years of protection in a Marine Protected Area. PLoS ONE 2021, 16, e0246335. [Google Scholar] [CrossRef]
  65. Pais, M.P.; Henriques, S.; Costa, M.J.; Cabral, H.N. Topographic complexity and the power to detect structural and functional changes in temperate reef fish assemblages: The need for habitat-independent sample sizes. Ecol. Indic. 2014, 45, 18–27. [Google Scholar] [CrossRef]
  66. Henriques, S.; Pais, M.P.; Batista, M.I.; Costa, M.J.; Cabral, H.N. Response of fish-based metrics to anthropogenic pressures in temperate rocky reefs. Ecol. Indic. 2013, 25, 65–76. [Google Scholar] [CrossRef]
  67. Castro, J.J. Predação Humana No Litoral Rochoso Alentejano: Caracterização, Impacte Ecológico e Conservação. Ph.D. Thesis, University of Évora, Évora, Portugal, 2004. [Google Scholar]
  68. Willis, T.J.; Anderson, M.J. Structure of cryptic reef fish assemblages: Relationships with habitat characteristics and predator density. Mar. Ecol. Prog. Ser. 2003, 257, 209–221. [Google Scholar] [CrossRef]
  69. Pierpaolo, C.; Gianluca, S.; Gianfranco, M.; Pietro, B.; Teresa, R.; Vincenzo, I.; Franco, A. The effects of protection measures on fish assemblage in the Plemmirio marine reserve (Central Mediterranean Sea, Italy): A first assessment 5 years after its establishment. J. Sea Res. 2013, 79, 20–26. [Google Scholar] [CrossRef]
  70. de Benito-Abelló, C.; Bentes, L.; Sousa, I.; Pedaccini, M.; Villegas-Ríos, D.; Olsen, E.M.; Gonçalves, J.M.S.; Horta e Costa, B. Among-individual variation in white seabream (Diplodus sargus) spatial behaviour and protection in a coastal no-take area. ICES J. Mar. Sci. 2022, 79, 2265–2276. [Google Scholar] [CrossRef]
  71. Guidetti, P.; Milazzo, M.; Bussotti, S.; Molinari, A.; Murenu, M.; Pais, A.; Spano, N.; Balzano, R.; Agardy, T.; Boero, F.; et al. Italian marine reserve effectiveness: Does enforcement matter? Biol. Conserv. 2008, 141, 699–709. [Google Scholar] [CrossRef]
  72. Edgar, G.J.; Barrett, N.S. Effects of the declaration of marine reserves on Tasmanian reef fishes, invertebrates and plants. J. Exp. Mar. Biol. Ecol. 1999, 242, 107–144. [Google Scholar] [CrossRef]
  73. Halpern, B.S.; Warner, R.R. Marine reserves have rapid and lasting effects. Ecol. Lett. 2002, 5, 361–366. [Google Scholar] [CrossRef] [Green Version]
Figure 1. Study region and sampling areas in partial protected (PP) areas (Ilha do Pessegueiro and Cabo Sardão) and adjacent complementary protected areas (Burrinho, Porto Covo, Aivados, Almograve, Zambujeira, and Amália). The grey color indicates the marine area of the “Sudoeste Alentejano e Costa Vicentina” Natural Park (PNSACV); the PP areas of IP and CS are in black.
Hydrobiology 02 00012 g001
Figure 2. Principal Coordinates Analyses (PCO) of fish community structure (non-cryptic, (A,B); cryptic, (C,D)) regarding the factors “Protection” (partially protected areas (PP) and adjacent control areas, complementary protection areas (CP); (A,C) plots) and “Year” (2011 and 2012; (B,D) plots) in the northern marine PNSACV.
Hydrobiology 02 00012 g002
Figure 3. Non-cryptic fishes’ spatial-temporal variation of taxa richness (boxplot) in 2011 and 2012 in partially protected areas (“Ilha do Pessegueiro” (IP) and “Cabo Sardão” (CS)) and adjacent control areas (complementary protection areas; Burrinho (BU), Porto Covo (PC), Aivados (AI), Almograve (AG), Zambujeira (ZB), and Amália (AM)) of the northern marine PNSACV. Pairwise tests showed significant differences between years in ZB, as indicated.
Hydrobiology 02 00012 g003
Figure 4. Cryptic fishes’ spatial-temporal variation of taxa richness (boxplot) in 2011 and 2012 in partially protected areas (PP) and adjacent control areas (complementary protection areas; CP) of the northern marine PNSACV. Pairwise tests showed significant differences between years in CP areas, as indicated.
Hydrobiology 02 00012 g004
Figure 5. Non-cryptic fishes’ variation of total abundance (boxplot; nº/m2) between partially protected areas (PP; blue) and adjacent control areas (complementary protection areas; CP; green) of the northern marine PNSACV, significant at p = 0.001 (PERMANOVA).
Hydrobiology 02 00012 g005
Figure 6. Spatial variation of the total abundance of cryptic fishes (boxplot; nº/m2) in the partially protected areas of “Ilha do Pessegueiro” (IP) and “Cabo Sardão” (CS) and in adjacent control areas (complementary protection areas; Burrinho (BU), Porto Covo (PC), Aivados (AI), Almograve (AG), Zambujeira (ZB), and Amália (AM)) of the northern marine PNSACV. Pairwise tests showed significant differences between AI and AM and between AI and ZB, as indicated.
Hydrobiology 02 00012 g006
Table 1. Results of the four-factor PERMANOVA test considering the “Year” (2 levels, fixed), “Protection” (2 levels, fixed), “Area” (8 levels, random and nested in “Protection”), and “Site” (2 levels, random and nested in “Area”) factors for the analysis of the abundance (nº/m2) of non-cryptic fishes in the northern marine PNSACV. Bold values highlight significant effects and interactions (p < 0.05).
SourcedfMSPseudo-FP(perm)
Year19508.61.33340.203
Protection17176.81.17550.276
Area (Protection)66127.92.64360.001
Year × Protection15693.40.798360.654
Site (Area (Protection))82316.91.32490.019
Year × Area (Protection)67159.13.04610.001
Year × Site (Area (Protection))82349.11.34330.011
Res971748.7
Total128
Note: df—degrees of freedom; MS—mean squares; Pseudo-F—pseudo-F ratio; P(perm)—p-value based on permutations.
Table 2. Results of the four-factor PERMANOVA test considering the “Year” (2 levels, fixed), “Protection” (2 levels, fixed), “Area” (8 levels, random and nested in “Protection”), and “Site” (2 levels, random and nested in “Area”) factors for the analysis of the abundance of cryptic fishes in the northern marine PNSACV.
SourcedfMSPseudo-FP(perm)
Year13734.81.38930.261
Protection111230.405750.895
Area (Protection)62850.71.67990.094
Year × Protection11989.80.746170.585
Site (Area (Protection))81677.90.858560.692
Year × Area (Protection)52668.41.26180.264
Year × Site (Area (Protection))62125.31.08750.338
Res861954.3
Total114
Note: df—degrees of freedom; MS—mean squares; Pseudo-F—pseudo-F ratio; P(perm)—p-value based on permutations.
Disclaimer/Publisher’s Note: The statements, opinions and data contained in all publications are solely those of the individual author(s) and contributor(s) and not of MDPI and/or the editor(s). MDPI and/or the editor(s) disclaim responsibility for any injury to people or property resulting from any ideas, methods, instructions or products referred to in the content.

