Article

Effects of the Queue Discipline on System Performance

Doctoral School of Transport, Polytechnic University of Bucharest, Splaiul Independentei 313, 060042 Bucharest, Romania
*
Authors to whom correspondence should be addressed.
AppliedMath 2023, 3(1), 37-48; https://doi.org/10.3390/appliedmath3010003
Submission received: 1 December 2022 / Revised: 13 December 2022 / Accepted: 14 December 2022 / Published: 3 January 2023

Abstract

:
Queue systems are essential in the modelling of transport systems. Increasing requirements from the beneficiaries of logistic services have led to a broadening of offerings. Consequently, models need to consider transport entities with priorities being assigned in relation to the costs corresponding to different classes of customers and/or processes. Waiting lines and queue disciplines substantially affect queue system performance. This paper aims to identify a solution for decreasing the waiting time, the total time in the system, and, overall, the cost linked to queueing delays. The influence of queue discipline on the waiting time and the total time in the system is analysed for several cases: (i) service for priority classes at the same rate of service with and without interruptions, and (ii) service for several priority classes with different service rates. The presented analysis is appropriate for increasing the performance of services dedicated to freight for two priority classes. It demonstrates how priority service can increase system performance by reducing the time in the system for customers with high costs. In addition, in the considered settings, the total time in the system is reduced for all customers, which leads to resource savings for system infrastructures.

1. Introduction

Transport systems belong to a large technical system class characterised by complex and problematic facets of performance evaluation. Substantiations of the operating technologies are necessary to ensure the fulfilment of the beneficiaries’ needs with minimum consumption of resources and, as much as possible, to reduce adverse external effects.
The selection of the operating technology of the components of a transport system that leads to efficient use of existing resources under the conditions of multiple requirements and restrictions of the socio-economic environment is conditioned by the implementation of mathematical models for assessing the possible variants concerning different criteria [1,2].
In developing mathematical models related to the different hierarchical levels of the problems within transport systems, modelling the component objects’ functioning is decisive [3,4,5]. The constituent objects can be represented by macrostructures (i.e., transport nodes including equipment and facilities particular to each mode of transport and those used in common) or microstructures (in specialised terminals, e.g., railway stations, port berths, airports, and logistic centres) [1,6]. In these cases, the modelling aims to reveal all the operations performed by each component of an examined subsystem that follows a specific way of processing a request.
The modelling of the processing of traffic entities on the equipment and installations in the transport terminals is designed on the modelling of the elementary traffic system or elementary queuing system (EQS) [1,5]. Consisting of waiting places and service stations, EQS aims to serve the flow of customers by transforming the input flow into the output flow. Cox and Smith, Ackoff and Sasieni, Lee, and Hall [7,8,9,10] substantiated the systematic study of queueing processes and developed the fundamentals of the queueing theory.
Different applications of the queueing theory have been developed for transport and traffic systems in order to provide valuable estimations of system performance [4,6,11]. Complex models address performance issues in transport terminals both for operational optimisation [12,13] and tactical approaches [14]. Due to the complexity of the processes in transport terminals, queue models are applied only for some subsystems (e.g., for humps in marshalling yards [15]). Queuing network models are used to evaluate performances at the transport terminal level (with a detailed formalisation of the terminals) [16,17] and the transport network level (with terminals represented in a simplified manner) [18]. Bychkov et al. [17] developed queueing network models to assess operational performance in railway stations, characterised by non-linear hierarchical configurations. Huisman et al. [18] defined Markovian processes on a queueing network model to evaluate the long-term performance at a railway network level. In queue models associated with transport system components, queuing delay (respective overall time in the system) causes high additional operating costs, supplementary energy and resource consumptions, and adverse environmental effects of these consumptions. Therefore, analysing queue discipline to reduce queuing delay can significantly promote more efficient transport systems, with positive consequences in achieving sustainable development goals [19].
In studying EQS operation, a schedule is necessary to define an ordered set of temporal conditions or conditioning in the service process [10,20]. The continuously increasing requirements from the beneficiaries of logistics services have led to a diversification of services [21]. Consequently, there is an increased need to develop models in which traffic entities have different priorities assigned in relation to the costs associated with various classes of users and/or services. As a result, models, including schedules with and without interruptions, are essential.
Interruption refers to suspending the processing of a low-priority entity to start the processing of a high-priority entity [20]. Service schedules are applied with the aim of increasing the operator’s and beneficiaries’ efficiency (by reducing the waiting times for service and the total times in the systems, and by increasing the use of service stations) [22].
Due to the diversity of real-world conditions, different approaches are applied to identify appropriate priority disciplines for improved quality of service, e.g., for a system with customers divided into two priority classes, a certain level of service quality is established based on a minimum service time [23]. The queue system performance is measured based on blocking probability for non-priority customers and system utilisation. Klimenok et al. [24] consider a single queue with a finite capacity and two types of customers with changing priority after a random time in the service process. After a particular time in the waiting buffer, the switched-off non-priority customer gains a degree of priority. This analysis is suitable for queue issues involved in warehouses for perishable goods.
A dynamic schedule for a queue system with a single server and a finite waiting capacity for several classes of customers has also been modelled. Based on the multi-dimensional Markov chain, the relationships between the system performance and the waiting buffer capacity are analysed [25,26]. More complex analysis is applied to assess the performance of systems with different types of customers (e.g., baulking or re-entering in the queue) and operating vacation (while service is slower) [27,28].
The particularities of transport systems, the considerable heterogeneity of traffic and transport entities (modelled as customers in queue systems), and the dynamic requests of beneficiaries cause difficulties in assigning priorities and defining priority classes. Within this framework, this paper aims to analyse the effect of service discipline in queueing systems where different priorities are established.
The analysis examines freight transport issues in which schedules with and without interruptions can be operated. In the modelling, the customers are represented by transport entities or load units, for which interruptions are determined by the costs associated with the total processing times and how the delivery deadlines are achieved. Therefore, the interruptions do not involve ethical issues, such as in the case of services involving people. Two priority classes of customers are studied, which could be considered a restriction. Nevertheless, applying several categories of priorities in real-world transport operations determines difficulties and potential dysfunctionalities. Consequently, dividing the customers into two types is sufficient and feasible for correctly estimating utilisation value under the assumed conditions.
The first part of this paper examines how the waiting time varies in a system where a category of users has absolute priority, and the service with and without interruptions is applied, assuming that the service rates are the same. However, in real-world transport system operations, service rates differ due to the variation in the transport entity sizes, the heterogeneity of the transport loads, the operating requirements, the different routes involved in the transport terminals, etc. Therefore, the second part of this paper analyses how the waiting time varies in a system where users have different priorities and service rates.

2. Influence of Service Disciplines

2.1. Formulation of the Problem

Implementing the transit functions and processing of traffic entities in transport terminals has led to infrastructures and facilities in which activities and technologies specific to transport modes interact. The modelling of the functions performed by such infrastructures implies defining the links among EQSs whose coordination is necessary for achieving the transport demands. The input into an EQS is represented by G, a generator of customers (or jobs), and the exit by E, the flow of served customers (or completed jobs). The waiting component, W, is represented by facilities with a finite capacity that allow the storage of the customers taken from the generator until the server S can start their processing (Figure 1).
The Kendal–Lee classification [8,10] summarises the diversity of elementary queue systems. It can be noticed that the system in Figure 1 is not included in this classification. The considered approach assumes a queue discipline different from the FIFO (First In-First Out), LIFO (Last In-First Out), or SIRO (Service in Random Order) discipline. In many circumstances, customers have different priorities and the FIFO discipline is not the best processing approach from the viewpoint of users and/or operators [10,29,30]. In order to evaluate how specific disciplines are suitable for queueing systems, it is necessary to consider and compare their performances. Usually, performances are assessed in relation to the time in the system and its associated cost. The presented analysis uses the following measures:
  • Time in the queue, w ¯ .
  • Time in the system t ¯ (between the arrival time and departure time).
The following sections examine how these measures vary in the subsystem of a complex service system if a proportion of input customers have absolute priority, compared to the case when all customers have the same priority. For different levels of priority, a service station may operate in the following ways:
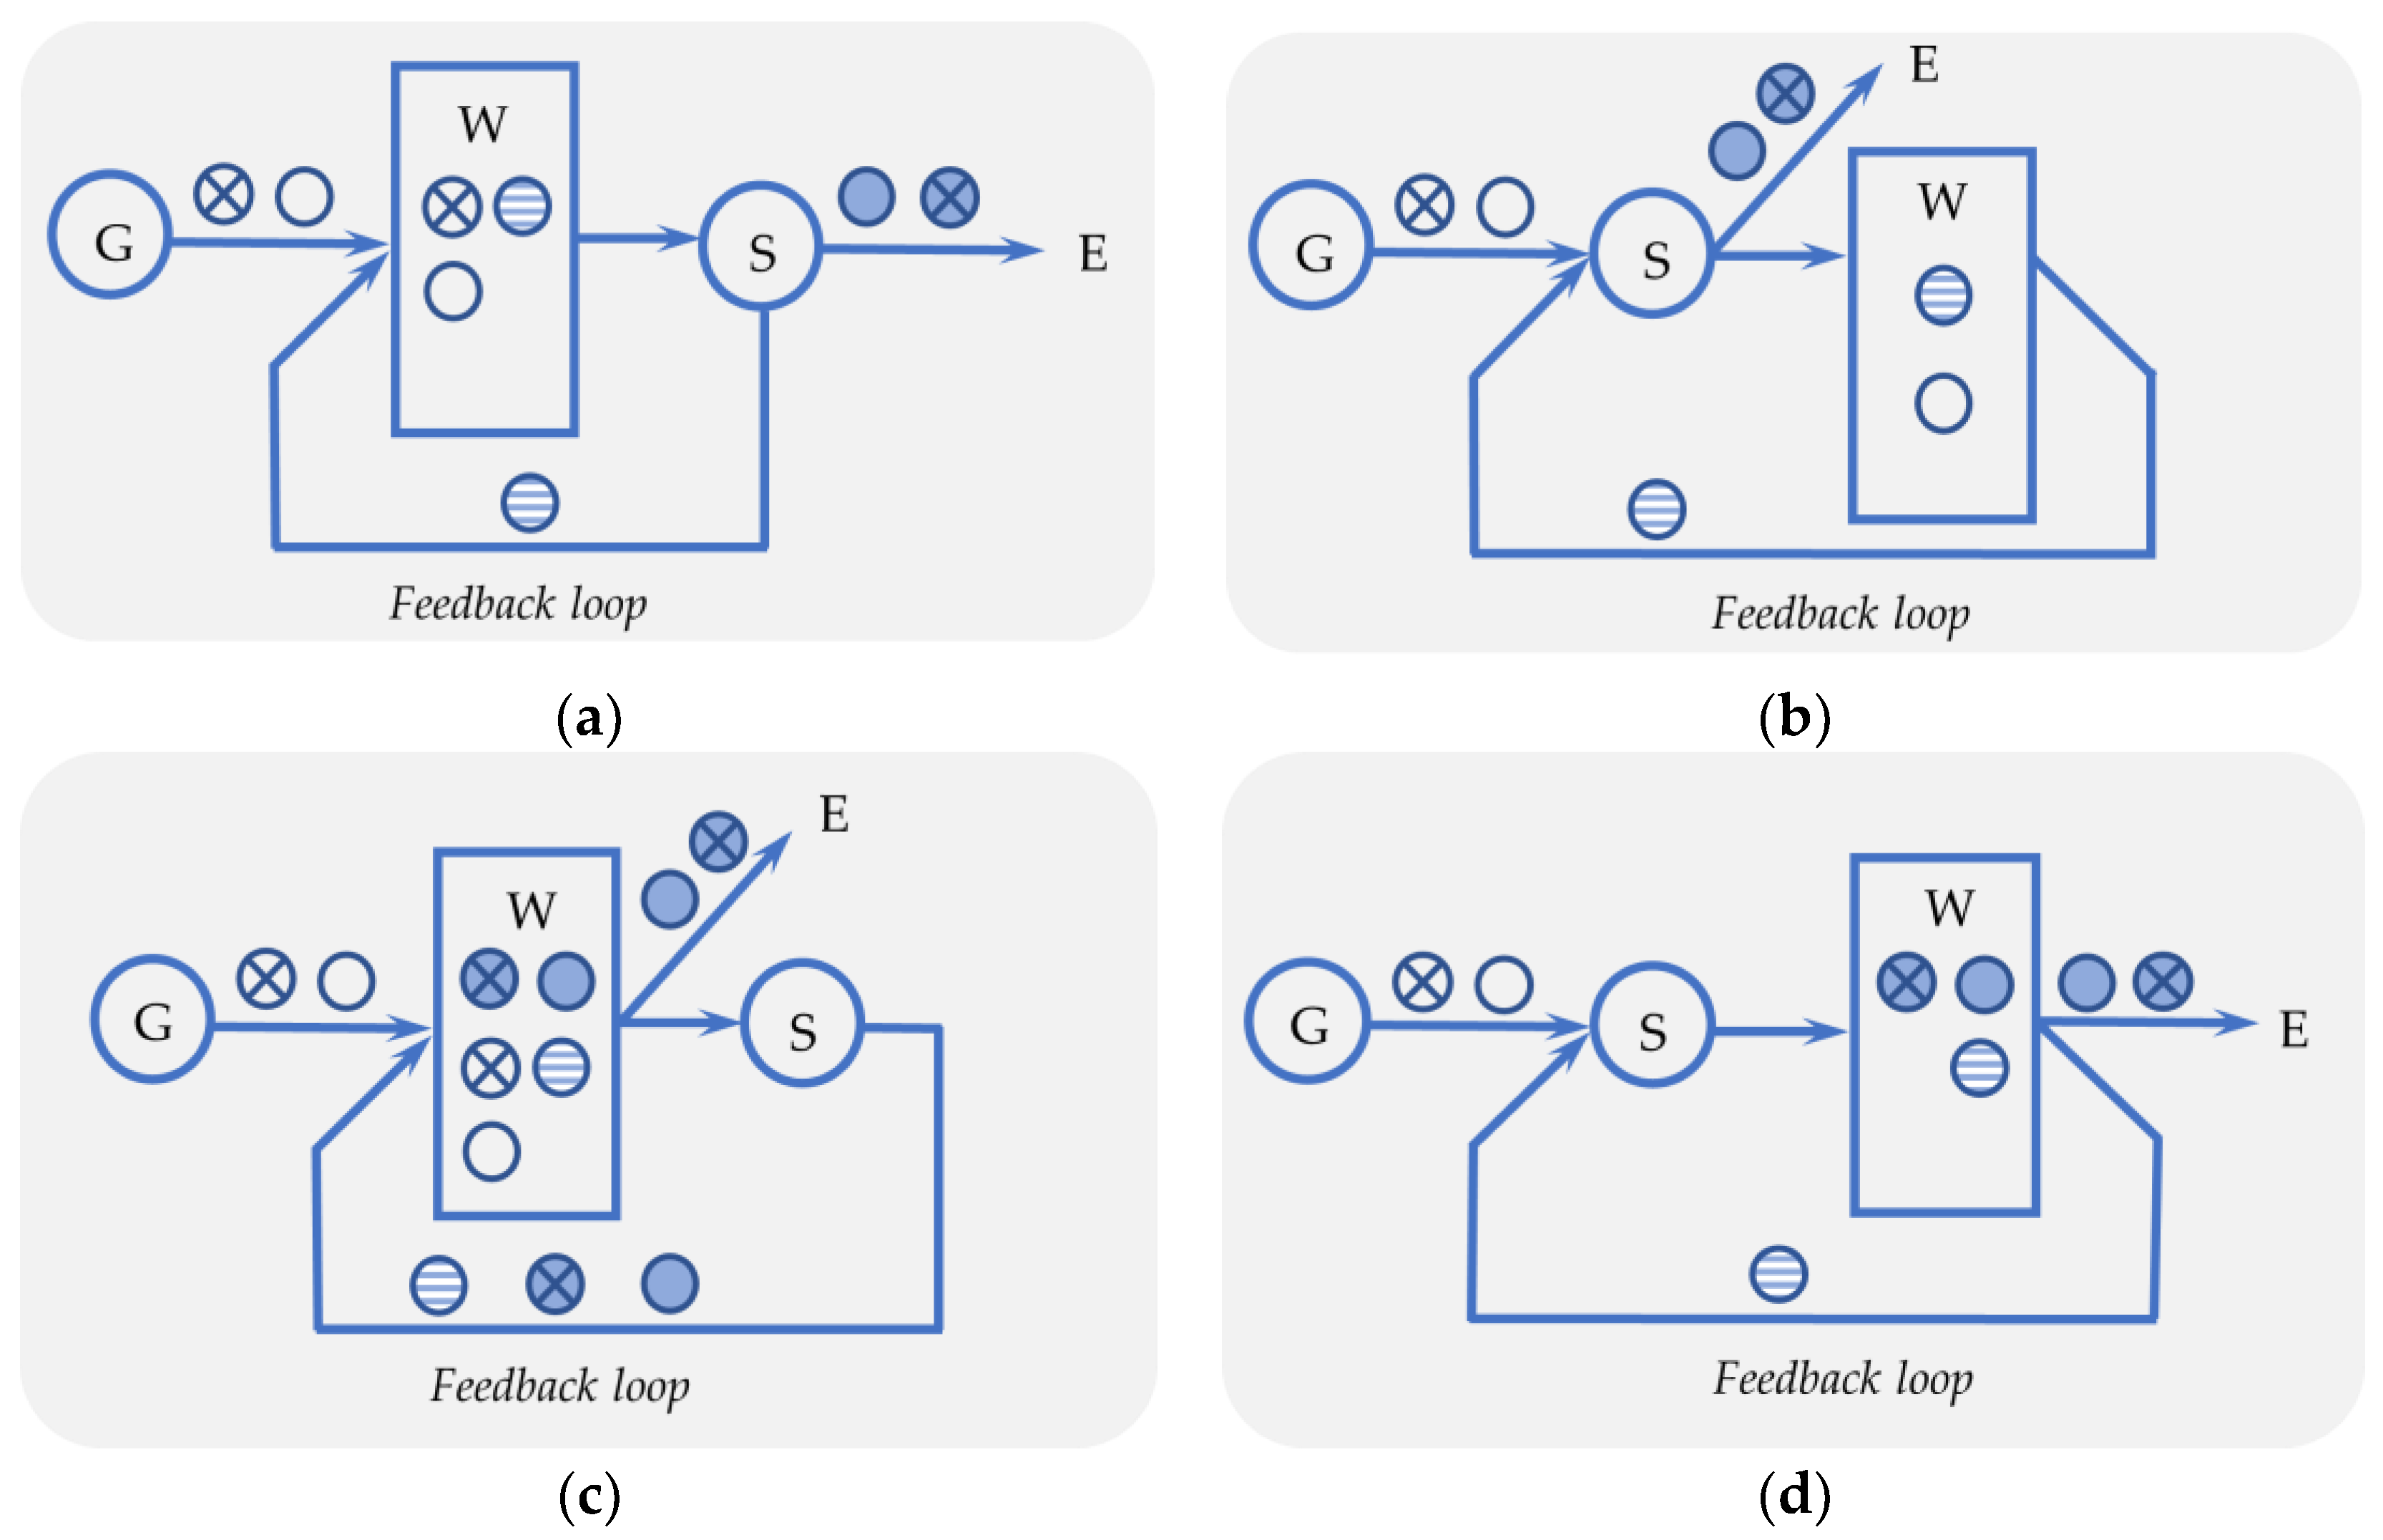
  • Without interruptions: the priorities of customers in the queue are examined; the FIFO discipline is applied to customers in the highest priority class.
  • With interruptions: the arrival of a customer with priority causes the service interruption of a non-priority (or lower priority) customer, which returns to the queue. If several levels of priorities are applied, the customer in service must have the highest priority.

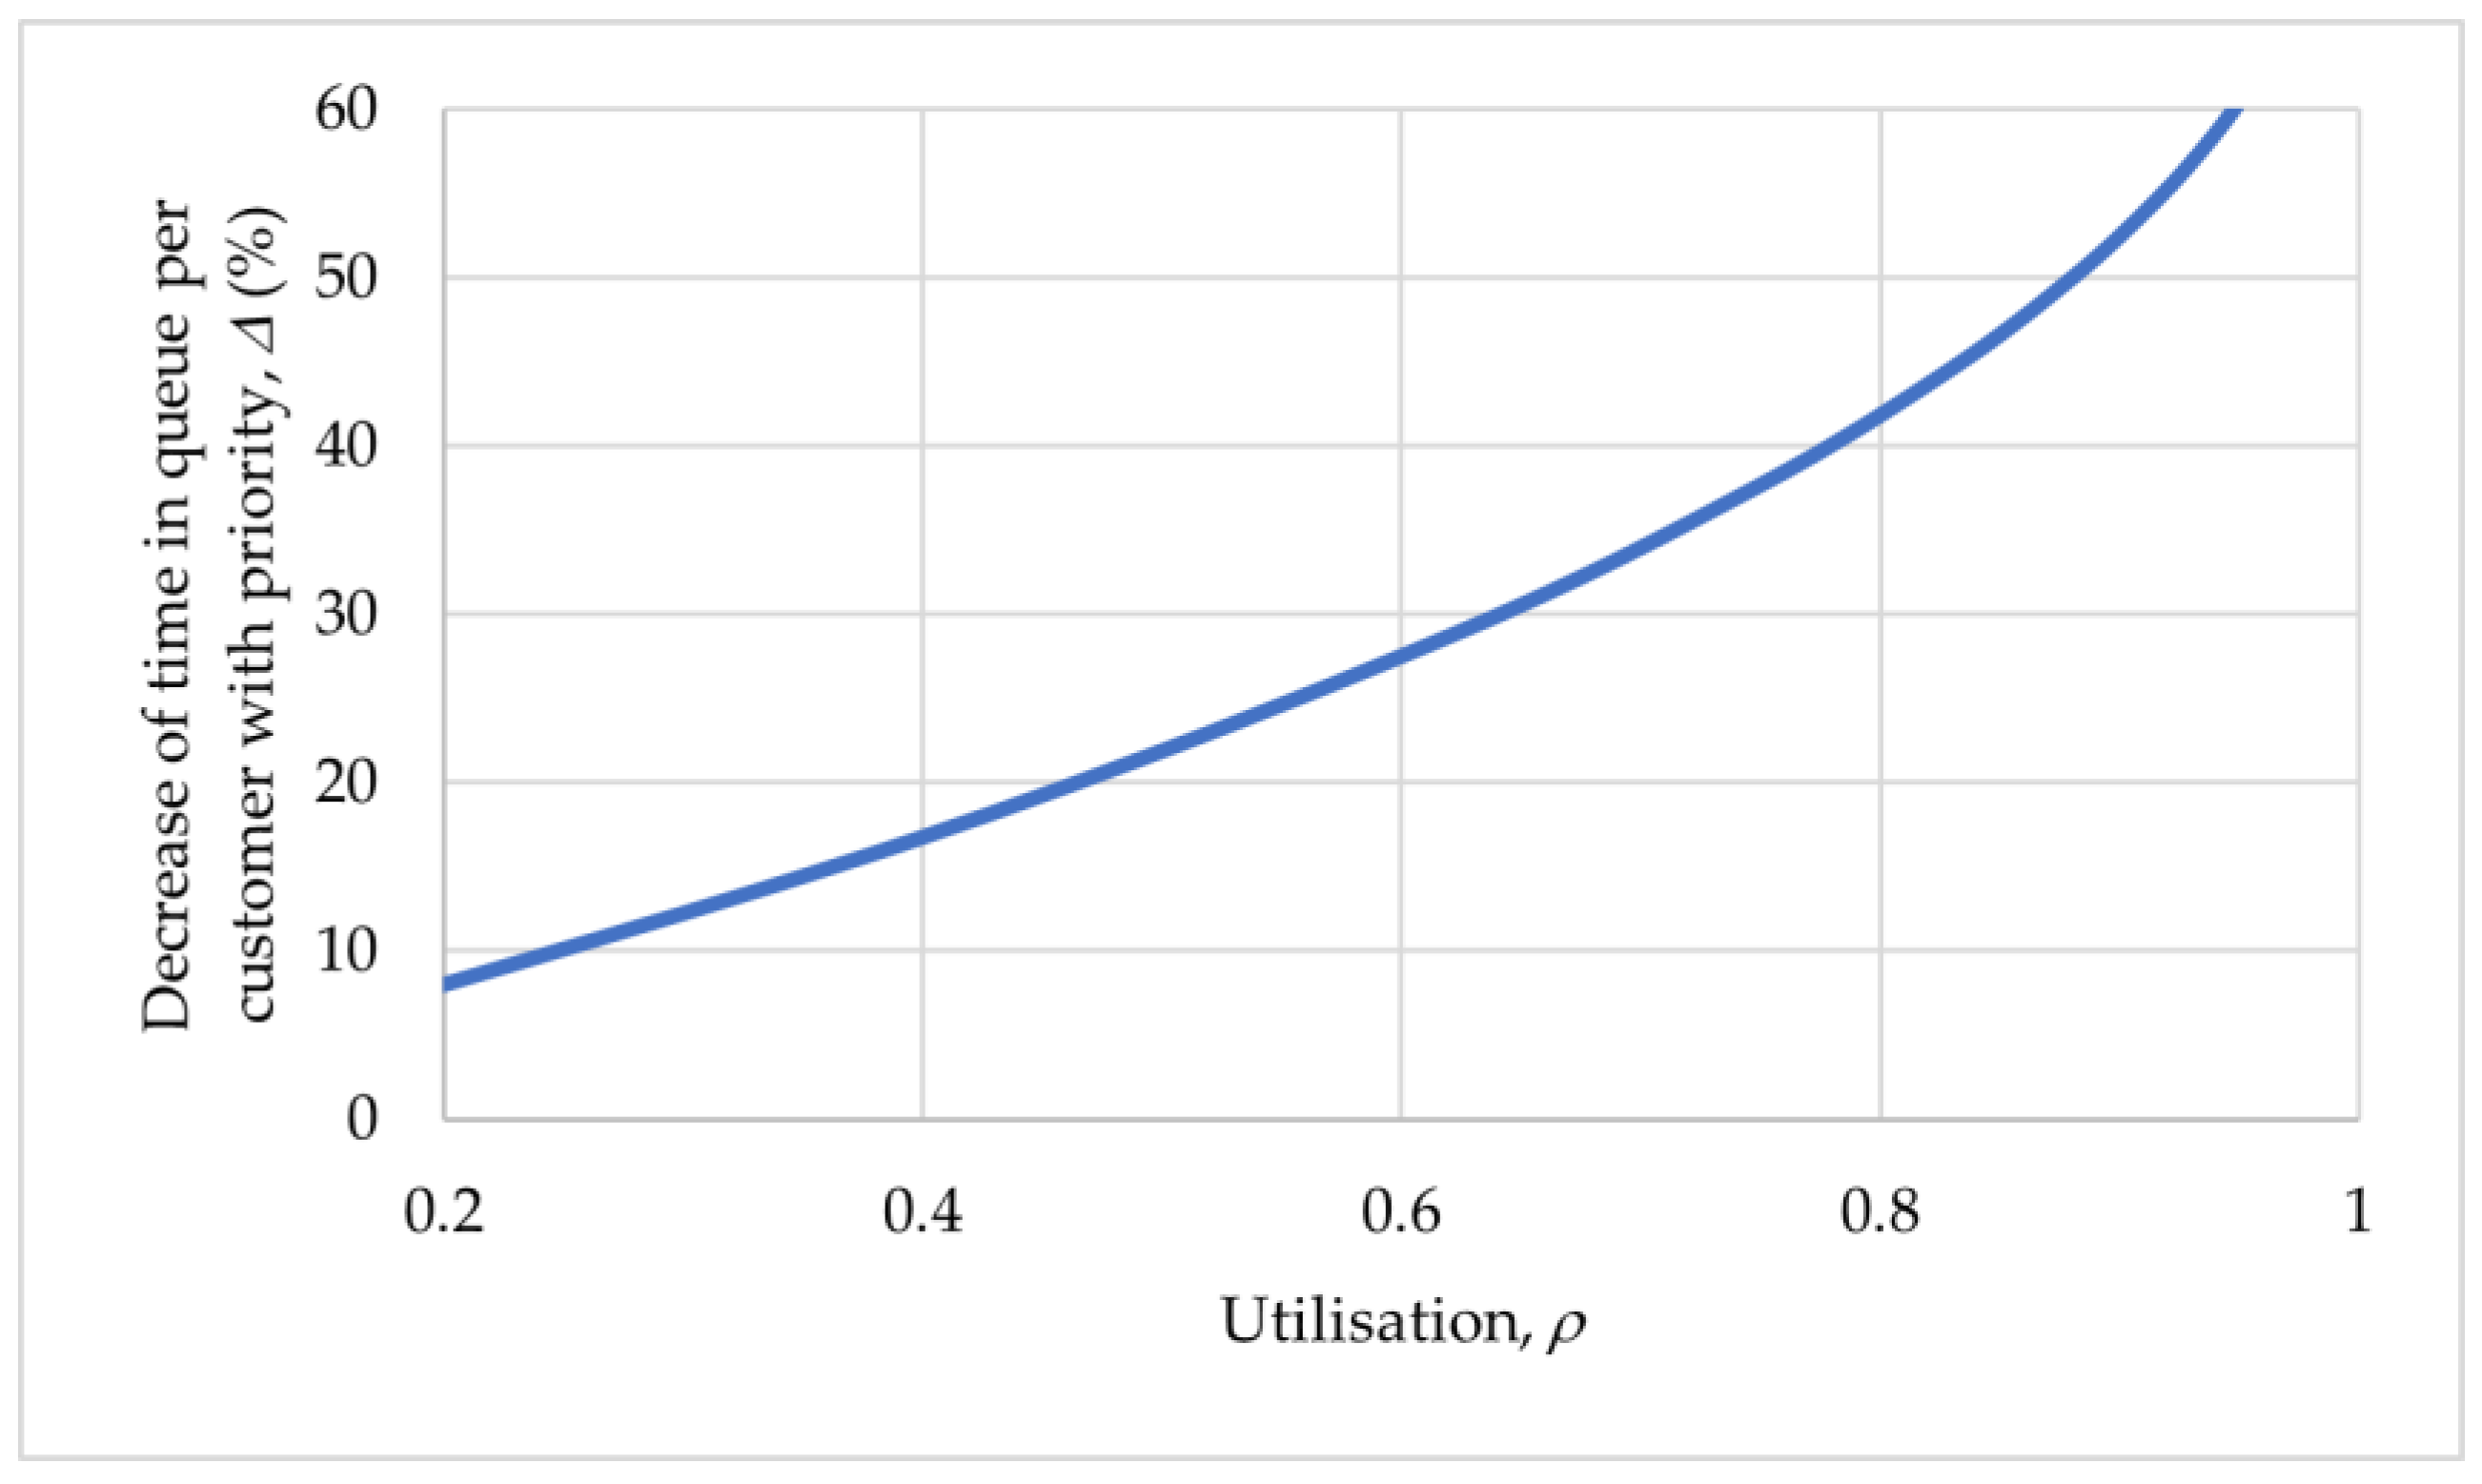
2.2. Priority Service with Same Service Rates

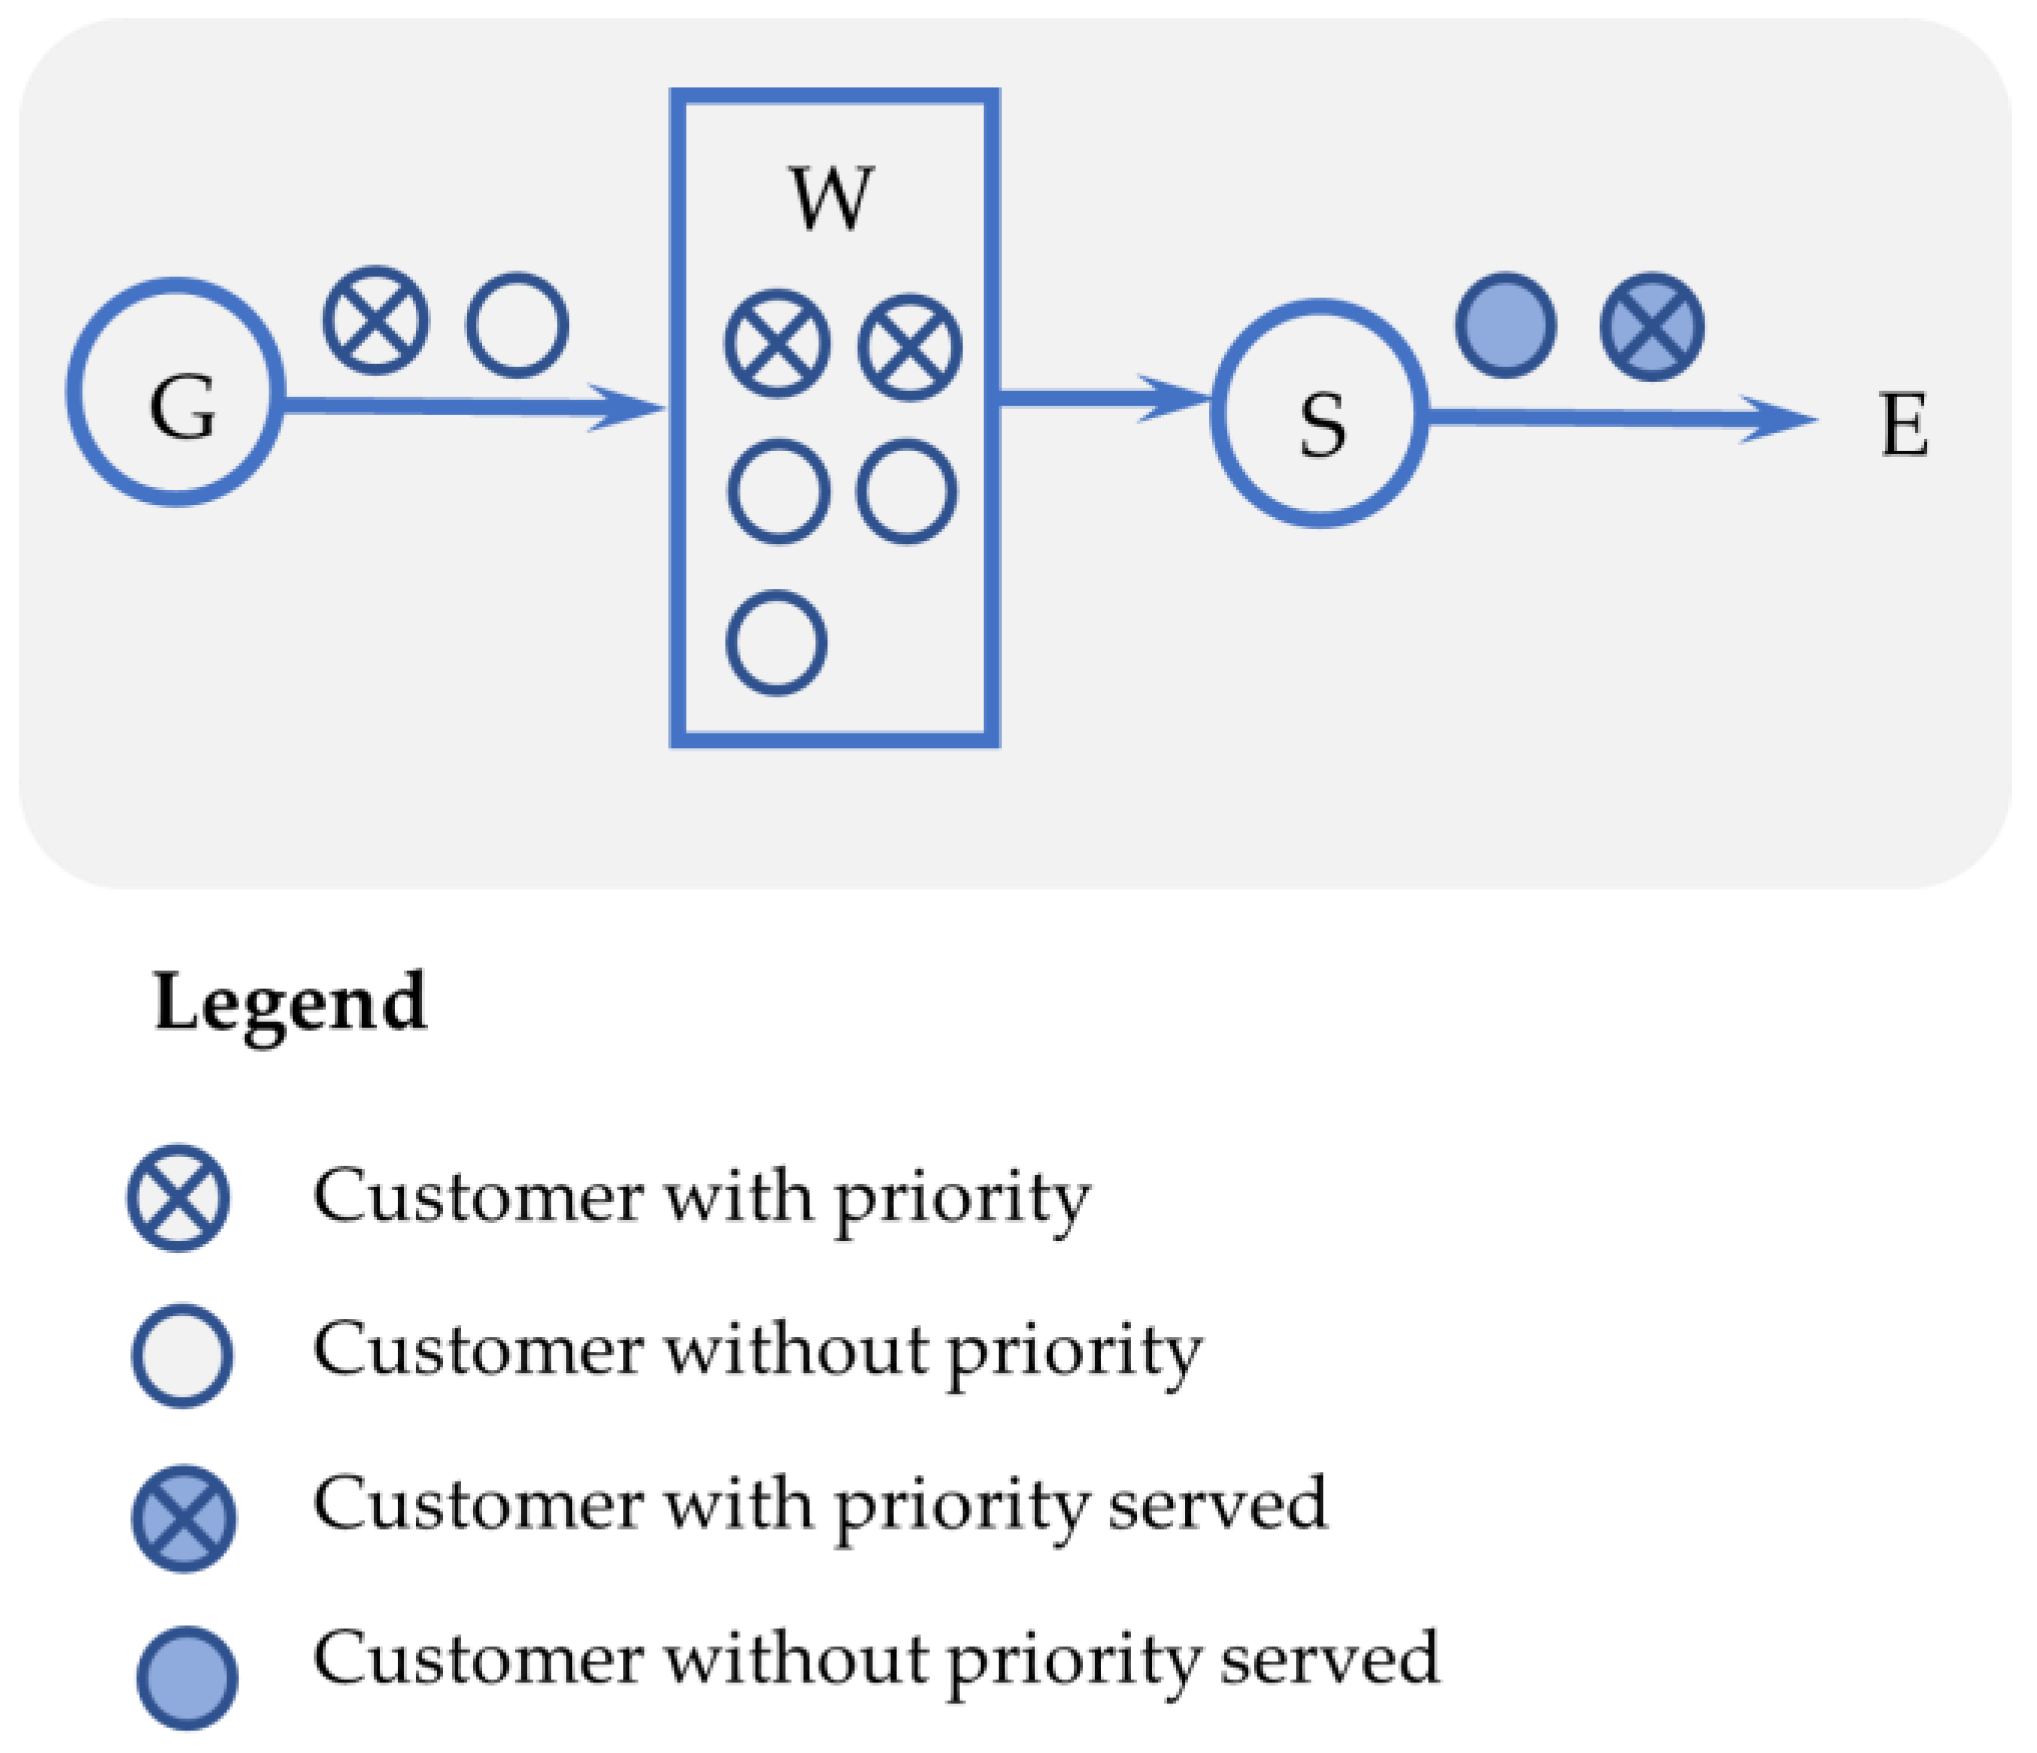
2.2.1. Single Server, Service without Interruptions

Consider that customers are allocated into two classes: class 1 includes customers with priority, and class 2 includes customers without priority. A service without interruptions supposes continuous examination of the customers in the queue, applying the FIFO discipline to customers in class 1 and then applying the FIFO discipline to customers in class 2 as long as no customer from class 1 is in the queue (Figure 1). This is denoted by the following measures:
  • λ k —arrival rate of customers in class k, for k ∈ {1, 2}.
  • μ k —service rate of customers in class k.
  • ρ k —utilisation for customers in class k (ratio between arrival rate and service rate).
  • ρ —system utilisation.
Assuming that arrivals correspond to a Poisson distribution and service corresponds to an exponential distribution, then the average number of customers with priority (class 1) in the queue is
l ¯ 1 = ρ 1 2 1 ρ 1 ,
and the average time in queue per class 1 customer is
w ¯ 1 = l ¯ 1 λ 1 = 1 μ 1 ρ 1 1 ρ 1 .
The average time in the system (after the end of the service process) per customer with priority is
t ¯ 1 = 1 μ 1 + w ¯ 1 = l ¯ 1 λ 1 = 1 μ 1 1 1 ρ 1 .
The average number of customers without priority (class 2) in the system is
l ¯ 2 = ρ 2 1 ρ ( 1 + μ 2 μ 1 ρ 1 1 ρ 1 ) .
The average time in the system (after the end of the service process) per customer without priority is
t ¯ 2 = 1 μ 2 1 1 ρ ( 1 + μ 2 μ 1 ρ 1 1 ρ 1 ) .
It implies that the average waiting time to serve a customer without priority is
w ¯ 2 = t ¯ 2 1 μ 2 ,
meaning
w ¯ 2 = 1 μ 2 μ 2 μ 1 ρ 1 1 ρ 1 + ρ 1 ρ .
The above equations apply only to the steady state of the queueing system. Such a condition exists only if the system utilisation, ρ = ρ 1 + ρ 2 , satisfies the restriction ρ < 1 .
If priorities are not applied in the queueing system, then the average waiting time for service per customer is
w ¯ = 1 μ ρ 1 ρ ,
and the average time in the system per customer is
t ¯ = w ¯ + 1 μ = 1 μ ( 1 ρ ) ,
or
t ¯ = 1 μ λ .
For the same arrival rates, μ 1 = μ 2 = μ   , Equations (2), (7), and (8) for the average waiting time values become
w ¯ 1 = 1 μ ρ 1 1 ρ 1 ,
w ¯ 2 = 1 μ ρ 1 1 ρ 1 + ρ 1 ρ .
The average waiting time in case of the arrival rate of customers with priority, λ 1 , is
w ¯ 1 , 2 = λ 1 w ¯ 1 + λ 2 w ¯ 2 λ 1 + λ 2 ,
which becomes
w ¯ 1 , 2 = ρ 1 2 1 ρ 1 + ( ρ 1 1 ρ 1 + ρ ) ( ρ ρ 1 1 ρ ) ρ μ = 1 μ ρ 1 ρ ,
meaning that the average waiting time per customer is the same as in the case of serving in order of arrivals. This conclusion is anticipated, as it is known that the average waiting time is independent of the service discipline (it is influenced only by the system utilisation and the service time).
By increasing the system utilisation, the average waiting time increases considerably. In the conditions of priority service, the waiting time for customers without priority reaches substantial values if utilisation for customers with priority is high.
In conclusion, the order of serving the customers does not influence the average waiting time per customer to enter the next subsystem. Obviously, assuming different costs of idle time per customer, the queue system would be economical only if priority is assigned to customers with high costs associated with idle time (reducing the waiting time before the start of service for these categories of customers).
Evidently, the service discipline is no longer indifferent if μ 1 μ 2 and w ¯ 1 , 2 w ¯ . This case is analysed in Section 2.3.

2.2.2. Single Sever, Service with Interruptions and Additional Idle Time

Using previous notations, consider that class 1 includes customers with absolute priority. An interruption occurs when a customer with absolute priority arrives during the service of a non-priority customer. The customer that is incompletely served moves to the head of the line of customers without priority, waiting for service to resume (considering the interruption causes no loss in service time).
Besides the direct links between the G, W, S, and E components of an EQS (Figure 1), additional feedback loops intervene between S and A in a system with interruptions (Figure 2).
Assuming Poisson arrivals and service according to an exponential distribution, the average time in queue per class 1 customer is [7,10]
w ¯ 1 = λ 1 2 ( 1 ρ 1 ) = 1 μ 1 ρ 1 1 ρ 1 ,
and the average time in queue per class 2 customer is
w ¯ 2 = λ 1 μ 1 2 + λ 2 μ 2 2 2 ( 1 ρ ) ( 1 ρ 1 ) 1 μ 2 .
The presented equations support the evaluation of a system’s performance with a single server. In the case of complex systems with several servers, simulation models are recommended for performance evaluation.

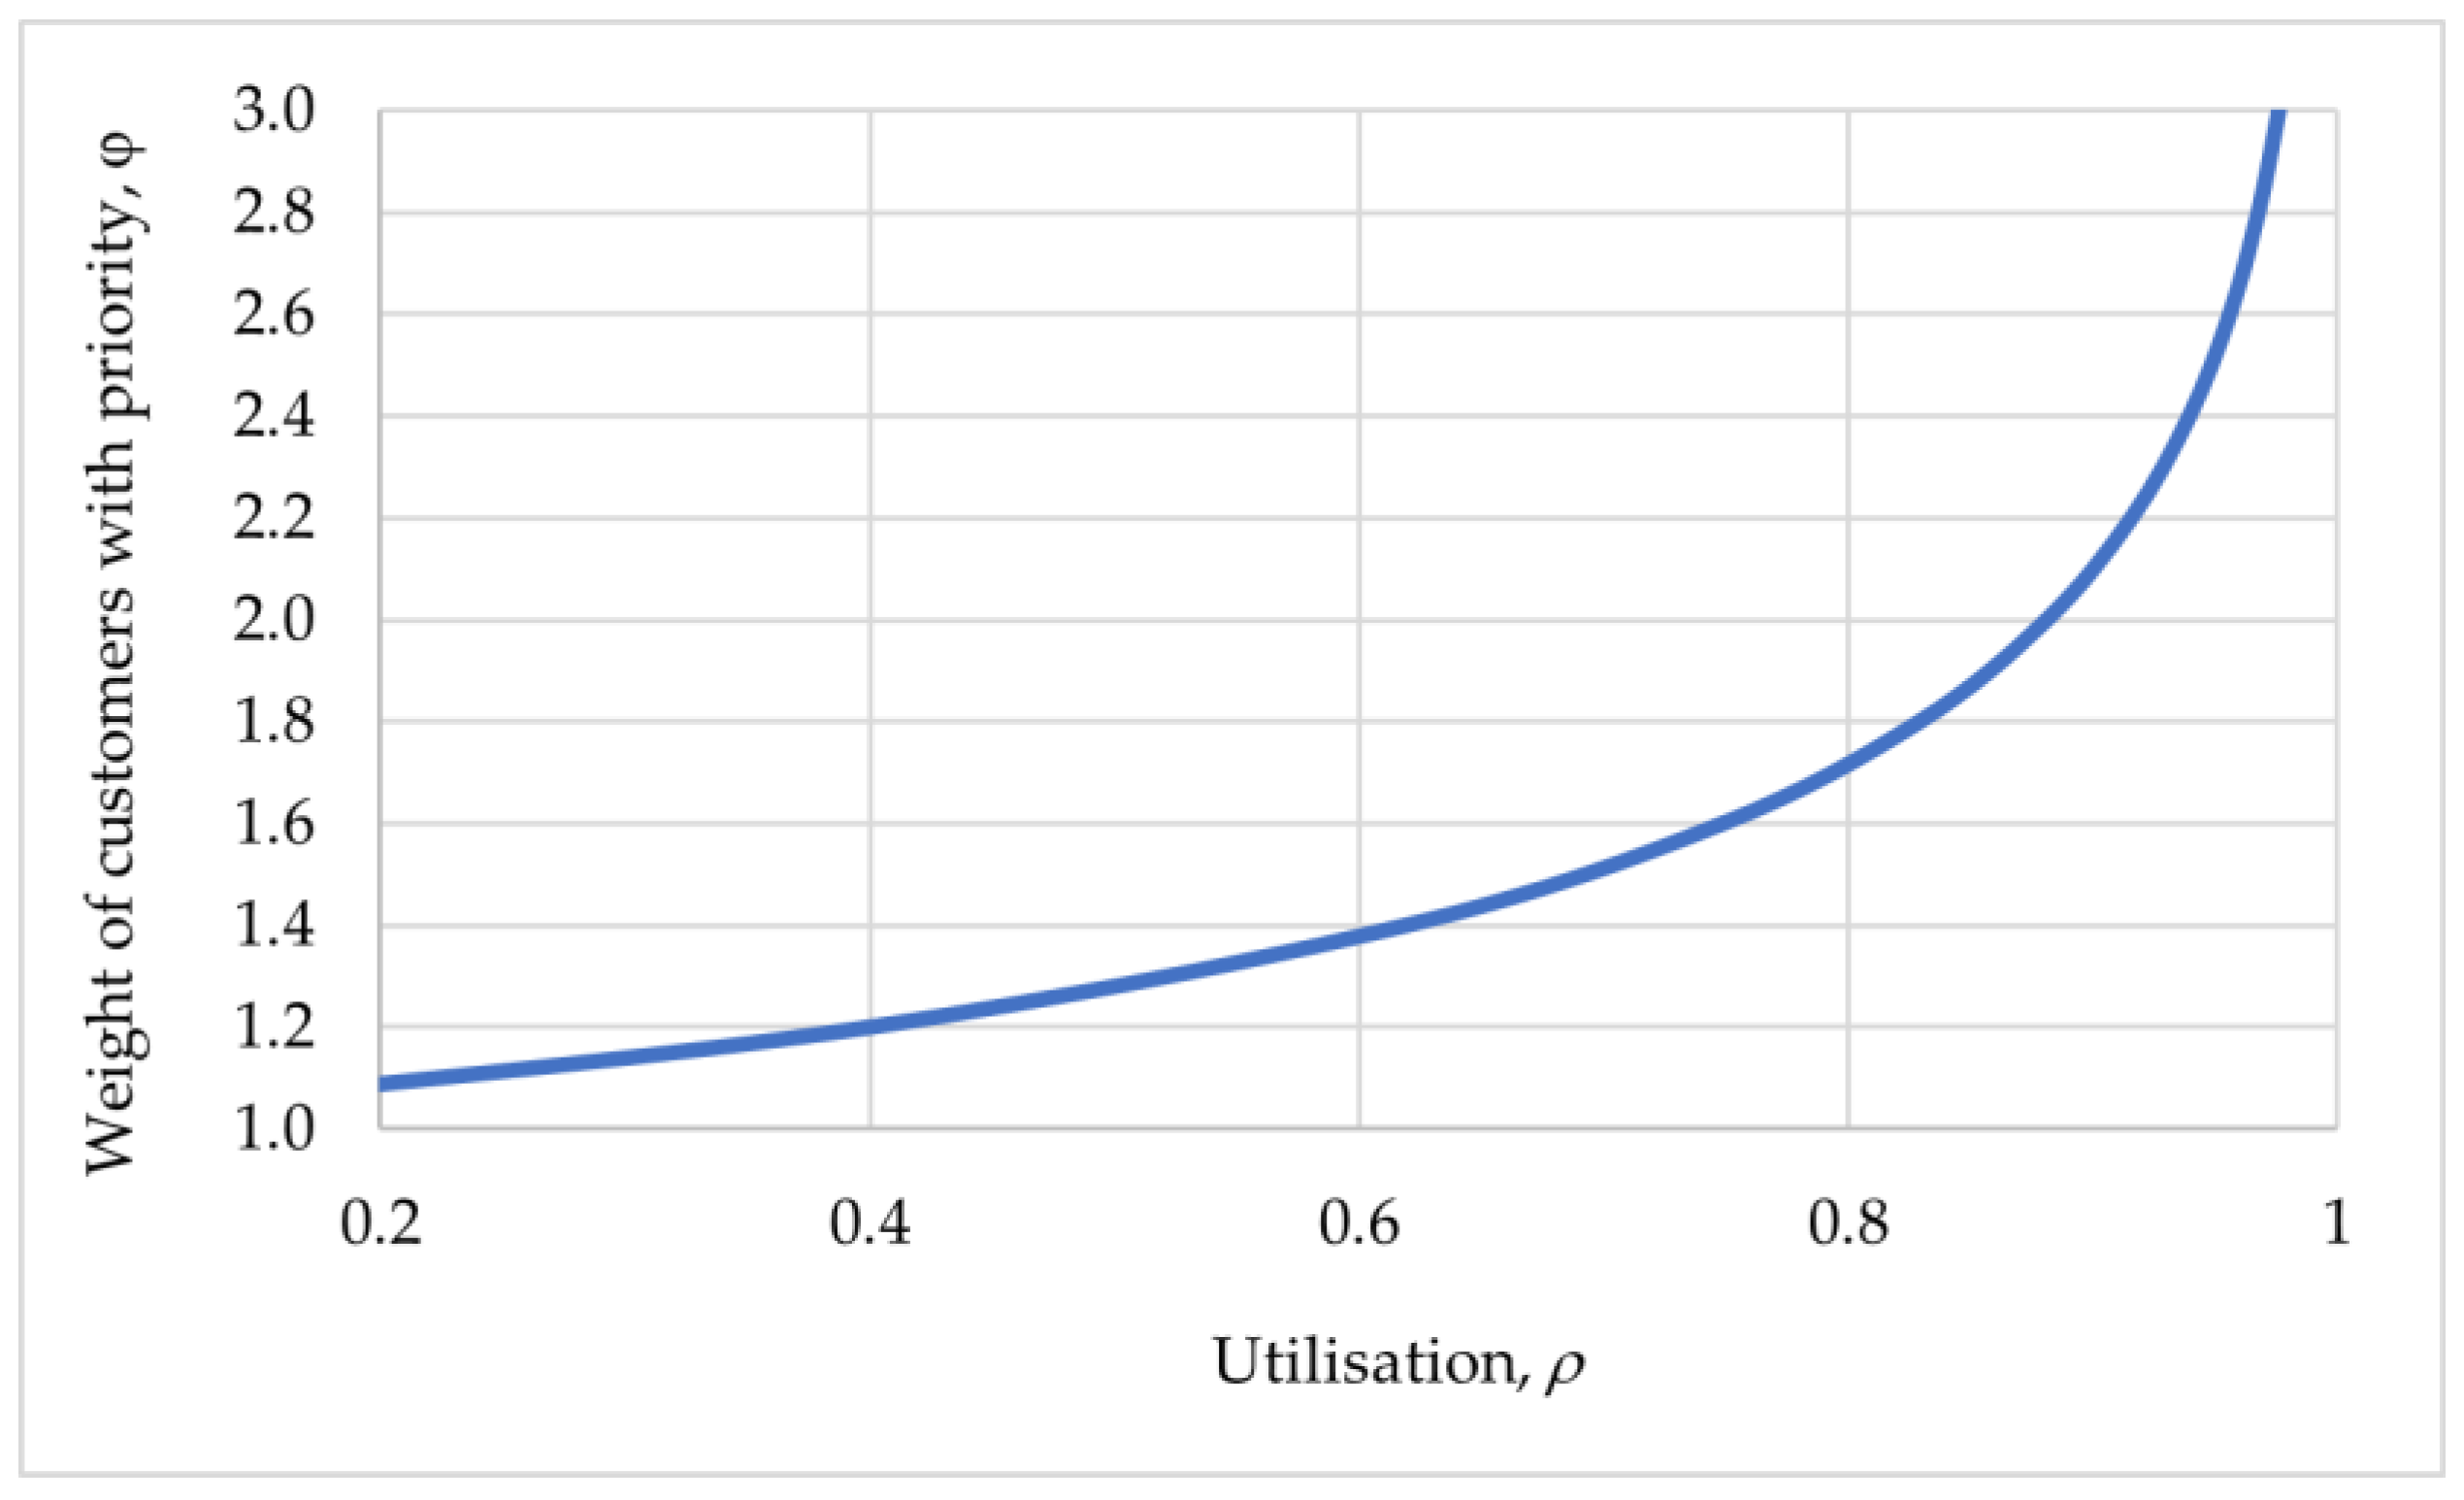
2.3. Priority Service with Different Service Rates

In the previous section, the analysis supposes the same service rate. In practice, service rates are different due to the variation in the operating conditions (transport entity sizes, heterogeneity of the transport loads, various routes, etc.).
Depending on the service time, the customers in a queueing system are classified into k classes. Let us also assume that the customers in these classes determine the independent elementary flows with arrival rates λ i (i = 1, …, k) and that the time unit is set so that the sum of arrival rates is equal to 1, i.e.,
i = 1 k λ i = 1 .
Assume that the service rates of different classes are independent and the distribution of the service rate of class i customers is denoted by B i ( x ) . The distribution of the service rate results in
B ( x ) = i = 1 k λ i B i ( x ) .
bi and ci are the first and second moments of the distribution B i ( x ) , respectively, meaning
b i = 0 x B i ( x ) and   c i = 0 x 2 B i ( x ) .
b and c are the corresponding moments of the distribution function B i ( x ) . Their results are as follows:
b = i = 1 k λ i b i   and   c = i = 1 k λ i c i .
Considering the equality i = 1 k λ i = 1 , the system utilisation, ρ , is equal to b, the average service time.
For a steady state of the queueing system ( ρ < 1 ), it can be demonstrated [7,9] that the average time in queue per customer in class i (customers with relative priority compared to customers in classes i + 1, i + 2, …, k) is
w ¯ i = c 2 ( 1 j = 1 i 1 λ j b j ) ( 1 j = 1 i λ j b j ) .
The average time in queue per customer is
w ¯ = i = 1 k w ¯ i λ i ,
meaning
w ¯ = c 2 i = 1 k λ i ( 1 j = 1 i 1 λ j b j ) ( 1 j = 1 i λ j b j ) .
Equations (21) and (23) represent the basis for assessing the influence of different priority sequences on the average queue time. It has been shown in [7,10] that minimal losses in the waiting process are obtained when the service priorities are ordered in the increasing ratio between the service time and the cost of an idle hour-customer (i.e., the highest priority for customers with a minimum value of the mentioned ratio). Consequently, the optimal prioritisation rule depends neither on the higher-order moments of the serving times nor on the arrival rates λ i (i = 1, …, k). When the cost of an hour entity is the same for all customer classes, the optimal order of priorities is determined only according to the average service time of each type.
If the FIFO discipline is applied, the average time in queue per customer, using the previous notations, is
w ¯ 0 = c ρ 2 ( 1 ρ ) b .
Assume that the service rate corresponds to an exponential distribution, i.e., b ( t ) = μ e μ t , and all customers with a service time shorter than the value φ ρ are included in class 1, and all others in class 2. It can be demonstrated [7] that, for such a priority service, the average time in queue per customer is
w ¯ = c ( 1 ρ + ρ e φ ) 2 ( 1 ρ ) ( 1 ρ + φ ρ e φ ) .
If the waiting cost of all customers is the same, the value φ must be selected to minimise the function w ¯ . Deriving
d w ¯ d φ = 0 ,
its result is
1 ρ = 1 + e φ φ 1 .
Based on Equation (27), the chart in Figure 3 facilitates the interpretation of the relationships between the values of φ and ρ for which the average time in queue is low.
For example, Figure 3 shows that, for ρ = 0.4 , it is necessary to divide customers into two classes. Class 1 contains customers for which the service time does not exceed the value of 0.48. The rest of the customers are included in class 2.
To analyse the decrease in the average time in queue per customer in the case of priority service for customers divided into two classes, denote Δ as the relative decrease in the service time:
Δ = w ¯ 0 w ¯ w ¯ 0 .
Considering Equations (24) and (25), its result is
Δ = 1 b ρ 1 ρ + ρ e φ 1 ρ + ρ e φ + φ ρ e φ .
Because the time scale is set such that the sum i = 1 k λ i is equal to 1, the average service time is equal to system utilisation, ρ . Equation (29) becomes
Δ = 1 1 1 + φ ρ e φ 1 ρ + ρ e φ = 1 1 1 + u ,
where u can be easily identified.
Equation (27) defines the relationships between the values of ρ and φ for which the priority service for the two classes leads to minimum values for the time in queue. Substituting the value ρ from Equation (27), the result for u is
u = φ 1 φ 1 + e φ φ e φ 1 φ 1 φ 1 + e φ ( 1 e φ ) = φ e φ φ 1 + e φ φ 1 1 + e φ ,
where
u = φ 1 .
Using Equation (30), it results in
Δ = 1 1 φ .
Based on the dependence between the values of φ and ρ , given by Equations (27) and (33), Figure 4 depicts the decrease in time in queue per customer in a system with priority service compared to a system with the FIFO discipline.
Figure 4 shows that assigning priority according to service time (dividing customers into two classes) reduces the time in the queue. As seen in Figure 4, the reduction is more substantial for high system utilisation (e.g., for ρ = 0.8 , the decrease reaches 42%). It must be emphasised that the absolute decrease in queue delays is much more significant than the relative reductions shown in Figure 4, since the values of t ¯ r 0 considerably increase for high system utilisation, ρ .

3. Discussion

Mathematical models developed for priority services provide guidelines for reducing the waiting time in queues and the transit time through systems in practice. The results are valuable in the operation of traffic and transport systems. Frequently, such priority service cannot be accepted when people are involved in processes (passengers, customers, car drivers, etc.). People involved in service processes accept only the FIFO discipline. e.g., a single queue is strictly marked for access to several airport boarding desks; in these cases, priorities apply only for specific categories of passengers with reduced mobility, small children, business class, etc.
The presented analysis is appropriate for increasing the performance of services dedicated to freight. Different transport system components can be modelled using the particular EQS considered in this study: a single server, arrivals corresponding to a Poisson distribution, service time exponentially distributed (i.e., M/M/1), and two classes of priorities, e.g., the operation of vessels in dedicated berths represents a service with priorities and interruption. If a vessel with priority arrives during the operation of a non-priority vessel, an interruption occurs. The incompletely served vessel is undocked, waiting for service to resume.
The presented analysis is also useful for complex systems. Such a system with priority queue disciplines is illustrated in Figure 5.
The structure corresponds to the simplified input part of a railway marshalling station (Figure 5). The customers are passenger trains and freight trains of different ranks. Server S0 represents the zone of switches to access the tracks of the receiving yard. Priority discipline is applied for server S0: passenger trains have absolute priority compared to freight trains. In addition, priority disciplines are applied for servers S1 and S2, where customers are represented by coupled groups of wagons waiting in W1 for the shunting process. The customers in priority class 1 are established based on Equation (27).
In modelling such complex systems, it is essential to note that EQS structuring (e.g., EQSs with servers S0, S1, and respective S2) considers that one system’s outputs constitute inputs for the following system. Suppose that the first system corresponds to the queue system considered in the presented analysis, i.e., M/M/1 with νa = νs = 1, but the assumption could not apply to the following systems, then the coefficient of variation characterising the outputs of the first system is
ν e , 1 = ν a , 1 ( ν a , 1 ν s , 1 ) ρ s , 1 2 ν a , 1 .
Consequently, the presented analysis for EQS with two priority classes is helpful for such consecutive systems. However, the results should be used with caution.

4. Conclusions

Different queue disciplines are applied to serve heterogeneous traffic and transport entities in real-world systems. The queuing theory can provide, within certain limits, estimates of the performance of other queue disciplines than those included in the Kendall–Lee classification (respectively, in the case of customers with different priorities). The presented analysis is valuable in evaluating the effects of queue disciplines on the performance of systems in which a non-priority job is not or is interrupted when a priority job arrives.
The presented analysis for two priority classes has practical value. Priority service can increase system performance by reducing time in the system for customers with high costs. In addition, in the considered settings, the total time in the system is reduced for all customers, which leads to resource savings for system infrastructures. For large service demands, the effects are more significant.
Even if it is expected to obtain better performance, applying several categories of priorities in transport system operation leads to ambiguities regarding classifying customers in a priority category.
This study is developed for an EQS (with a single server) corresponding to Markov processes, i.e., exponential distribution for inter-arrivals and service time. In the case of generalised systems with priority discipline, it is necessary to evaluate the Laplace–Stieltjes transform of the time in the system, which can be numerically applied only for particular distributions.
The presented models correspond to the steady state of the system. For some real-world components (e.g., elements of transport terminals), transitive and imperfect states must be considered besides steady states. Often, the only solution in these cases is simulation model development.
Complex systems include successive elementary systems with one or more servers. The sequential study of subsequent elementary systems is complex, and the results are indicative. Simulation model development is also the recommended method in these cases.

Author Contributions

Conceptualisation, S.R., D.C., and M.P.; methodology, S.R., D.C., and M.P.; formal analysis, S.R., D.C., and M.P.; resources, S.R., D.C., and M.P.; writing—review and editing, S.R., D.C., and M.P. All authors have read and agreed to the published version of the manuscript.

Funding

This research received no external funding.

Institutional Review Board Statement

Not applicable.

Informed Consent Statement

Not applicable.

Data Availability Statement

Not applicable.

Conflicts of Interest

The authors declare no conflict of interest.

References

  1. Raicu, S. Transport Systems; AGIR Press: Bucharest, Romania, 2007; pp. 323–385. (In Romanian) [Google Scholar]
  2. Raicu, R.; Raicu, S. Complex Aspects of Transport Quality. In Urban Transport XI. WIT Transactions on the Built Environment; WIT Press: Southampton, UK, 2005; Volume 77, pp. 281–290. [Google Scholar] [CrossRef]
  3. Newell, G.F. Airport capacity and delays. Transp. Sci. 1979, 13, 201–241. [Google Scholar] [CrossRef]
  4. Jacyna, M.; Żak, J.; Gołębiowski, P. The Use of the Queueing Theory for the Analysis of Transport Processes. Log. Transp. 2019, 41, 101–111. [Google Scholar] [CrossRef]
  5. Raicu, S.; Popa, M. Some Difficult Problems in Using the Models of Queuing Theory for the Real Systems Study. In Proceedings of the 9th Symposium on Modelling, Simulation and Identification Systems, “Dunarea de Jos” University, Galati, Romania, 24–25 October 1996; pp. 247–251. [Google Scholar]
  6. Hall, R.W. Transportation Queueing. In Handbook of Transportation Science. International Series in Operations Research & Management Science; Hall, R.W., Ed.; Springer: Boston, MA, USA, 1999; Volume 23, pp. 109–150. [Google Scholar]
  7. Cox, D.R.; Smith, W. Queues, 1st ed.; Chapman & Hall: London, UK, 1991. [Google Scholar]
  8. Lee, A.M. Applied Queueing Theory; Studies in Management; Palgrave: London, UK, 1966. [Google Scholar]
  9. Ackoff, R.L.; Sasieni, M.W. Fundamentals Of Operations Research; John Wiley and Sons Inc.: New York, NY, USA, 1968. [Google Scholar]
  10. Hall, R.W. Queueing Methods for Services and Manufacturing; Prentice Hall: Englewood Cliffs, NJ, USA, 1991. [Google Scholar]
  11. Varghese, V.N.; Verghese, V.; Chandran, A. Application of Queuing Theory in Transportation. Intern. J. Eng. Res. Techn. 2021, 9, 55–58. [Google Scholar]
  12. Itoh, E.; Mitici, M. Queue-Based Modelling of the Aircraft Arrival Process at a Single Airport. Aerospace 2019, 6, 103. [Google Scholar] [CrossRef] [Green Version]
  13. Higasa, K.; Itoh, E. Controlling Aircraft Inter-Arrival Time to Reduce Arrival Traffic Delay via a Queue-Based Integer Programming Approach. Aerospace 2022, 9, 663. [Google Scholar] [CrossRef]
  14. Itoh, E.; Mitici, M. Analyzing tactical control strategies for aircraft arrivals at an airport using a queuing model. J. Air Transp. Manag. 2020, 89, 101938. [Google Scholar] [CrossRef]
  15. Dorda, M.; Teichmann, D. Modelling of Freight Trains Classification Using Queueing System Subject to Breakdowns. Math. Prob. Eng. 2013, 2013, 307652. [Google Scholar] [CrossRef]
  16. Zhao, X.; Wang, Y.; Li, L.; Delahaye, D. A Queuing Network Model of a Multi-Airport System Based on Point-Wise Stationary Approximation. Aerospace 2022, 9, 390. [Google Scholar] [CrossRef]
  17. Bychkov, I.; Kazakov, A.; Lempert, A.; Zharkov, M. Modeling of Railway Stations Based on Queuing Networks. Appl. Sci. 2021, 11, 2425. [Google Scholar] [CrossRef]
  18. Huisman, T.; Boucherie, R.J.; van Dijk, N.M. A solvable queueing network model for railway networks and its validation and applications for the Netherlands. Eur. J. Oper. Res. 2002, 142, 30–51. [Google Scholar] [CrossRef]
  19. Arseni, O.; Racioppi, F. (Coord.). Making THE (Transport, Health and Environment) Link. Transport, Health and Environment Pan-European Programme and the Sustainable Development Goals. World Health Organization Regional Office for Europe, 2018. Available online: https://thepep.unece.org/sites/default/files/2018-09/online%20version.pdf (accessed on 7 December 2022).
  20. Lee, H.W.; Lee, S.S.; Chae, K.C.; Nadarajan, R. On a batch service queue with single vacation. Appl. Math. Modell. 1992, 16, 36–42. [Google Scholar] [CrossRef]
  21. Staniuk, W.; Staniuk, M.; Chamier-Gliszczynski, N.; Jacyna, M.; Kłodawski, M. Decision-Making under the Risk, Uncertainty and COVID-19 Pandemic Conditions Applying the PL9A Method of Logistics Planning—Case Study. Energies 2022, 15, 639. [Google Scholar] [CrossRef]
  22. Barrena, E.; Canca, D.; Coelho, L.C.; Laporte, G. Single-line rail rapid transit timetabling under dynamic passenger demand. Transp. Res. Part B Method. 2014, 70, 134–150. [Google Scholar] [CrossRef]
  23. Alotaibi, F.M.; Ullah, I.; Ahmad, S. Modelling and Performance Evaluation of Multi-Class Queuing System with QoS and Priority Constraints. Electronics 2021, 10, 500. [Google Scholar] [CrossRef]
  24. Klimenok, V.; Dudin, A.; Dudina, O.; Kochetkova, I. Queuing System with Two Types of Customers and Dynamic Change of a Priority. Mathematics 2020, 8, 824. [Google Scholar] [CrossRef]
  25. Lee, S.; Dudin, S.; Dudina, O.; Kim, C.; Klimenok, V. A Priority Queue with Many Customer Types, Correlated Arrivals and Changing Priorities. Mathematics 2020, 8, 1292. [Google Scholar] [CrossRef]
  26. Dudin, A.; Dudina, O.; Dudin, S.; Samouylov, K. Analysis of Single-Server Multi-Class Queue with Unreliable Service, Batch Correlated Arrivals, Customers Impatience, and Dynamical Change of Priorities. Mathematics 2021, 9, 1257. [Google Scholar] [CrossRef]
  27. Afroun, F.; Aïssani, D.; Hamadouche, D.; Boualem, M. Q-matrix method for the analysis and performance evaluation of unreliable M/M/1/N queueing model. Math. Meth. Appl Sci. 2018, 41, 9152–9163. [Google Scholar] [CrossRef]
  28. Jain, M.; Dhibar, S.; Sanga, S.S. Markovian working vacation queue with imperfect service, balking and retrial. J. Amb. Intell. Hum. Comput. 2022, 13, 1907–1923. [Google Scholar] [CrossRef]
  29. Powell, W.B. Analysis of vehicle holding and cancellation strategies in bulk arrival, bulk service queues. Transp. Sci. 1985, 19, 352–377. [Google Scholar] [CrossRef]
  30. Cox, D.R.; Titterington, D.M. Complex Stochastic Systems; Cambridge University Press: Cambridge, UK, 1992. [Google Scholar]
Figure 1. Single server, service without interruption.
Appliedmath 03 00003 g001
Figure 2. Relationships between the components in a system with interruptions: (a,b) Configurations for systems with interruptions and additional idle time; (c,d) Configurations for systems with interruptions and “storage” for departure according to the dispatching schedule.
Appliedmath 03 00003 g002aAppliedmath 03 00003 g002b
Figure 3. Relationship between service utilisation and weight of customers with priority.
Appliedmath 03 00003 g003
Figure 4. Decrease in time in queue per customer in a system with priority service compared to a system with the FIFO discipline.
Appliedmath 03 00003 g004
Figure 5. Connected EQSs corresponding to the receiving component of a complex railway station (G1, …, Gk—convergent links in the railway station; L1, …, Lk—traffic signals for access to S0, the zone of switches; W1, W2—tracks of receiving yard, respective shunting yard; S1—preparing the arrived freight trains for shunting; S2—shunting equipment; νa, νs, νe—coefficients of variation for arrivals, service, dispatching for an EQS).
Appliedmath 03 00003 g005
Disclaimer/Publisher’s Note: The statements, opinions and data contained in all publications are solely those of the individual author(s) and contributor(s) and not of MDPI and/or the editor(s). MDPI and/or the editor(s) disclaim responsibility for any injury to people or property resulting from any ideas, methods, instructions or products referred to in the content.

