Article

A Rule-Based Approach for Mining Creative Thinking Patterns from Big Educational Data

1
School of Computing, Macquarie University, Macquarie Park, NSW 2109, Australia
2
School of Education, Macquarie University, Macquarie Park, NSW 2109, Australia
3
School of Arts and Humanities, Edith Cowan University, Joondalup, WA 6027, Australia
4
Graduate School of Biomedical Engineering, University of New South Wales, Sydney, NSW 2052, Australia
*
Authors to whom correspondence should be addressed.
AppliedMath 2023, 3(1), 243-267; https://doi.org/10.3390/appliedmath3010014
Submission received: 19 February 2023 / Revised: 9 March 2023 / Accepted: 14 March 2023 / Published: 20 March 2023

Abstract

:
Numerous studies have established a correlation between creativity and intrinsic motivation to learn, with creativity defined as the process of generating original and valuable ideas, often by integrating perspectives from different fields. The field of educational technology has shown a growing interest in leveraging technology to promote creativity in the classroom, with several studies demonstrating the positive impact of creativity on learning outcomes. However, mining creative thinking patterns from educational data remains a challenging task, even with the proliferation of research on adaptive technology for education. This paper presents an initial effort towards formalizing educational knowledge by developing a domain-specific Knowledge Base that identifies key concepts, facts, and assumptions essential for identifying creativity patterns. Our proposed pipeline involves modeling raw educational data, such as assessments and class activities, as a graph to facilitate the contextualization of knowledge. We then leverage a rule-based approach to enable the mining of creative thinking patterns from the contextualized data and knowledge graph. To validate our approach, we evaluate it on real-world datasets and demonstrate how the proposed pipeline can enable instructors to gain insights into students’ creative thinking patterns from their activities and assessment tasks.

1. Introduction

Around the world today, original and creative ideas are the best and most important products of any powerful country. This clearly shows the importance of recognizing and nurturing creativity in children from a young age. Creativity is a set of skills that all humans have the capacity to possess, but it must be nurtured and expanded under the right circumstances. Unlike earlier theories that assumed creativity as an inherited and intrinsic process, recent research on creativity via education reveals that creative thinking, i.e., the ability to consider something in a new way, is considered a skill and can be learned by individuals. Therefore, in countries with a dynamic education system, fostering creativity is a highly important task in education [1]. Through an evolving educational structure, students may gain better educational benefits and have more opportunities to grow creativity.
There are various tools and techniques available for measuring and detecting creativity, such as divergent thinking tests [2], self-report measures of creativity [3], or judgment of products [4]. These approaches mostly involve evaluating the quality of ideas and products. Practically, using human evaluators to assess students’ responses to creative tasks, such as rating the uniqueness of ideas from the alternate uses test, is a common element of doing creativity research. Although scoring systems have proven effective, they are susceptible to two fundamental limitations: labor cost and subjectivity, which pose specific psychometric risks to reliability and validity [5].
Recent development in learning management systems has proved to assist different educational assessments and minimize the aforementioned limitations. These technologies have the capacity to gather and visualize a large amount of educational data, e.g., assessments and class activities. In this context, helping instructors to understand the educational data remains a challenging task [6]. There is a large amount of work aiming to discover insight from educational data, with the goal to support traditional learning and educational assessments [7,8]. Most of the publications that have been released recently, particularly during the COVID crisis, also highlight the importance of using adaptive learning management services to analyze students’ behavior while providing a face-to-face learning environment is not possible or hard to acquire [9,10]. However, the current state of the art lacks a significant data-driven strategy to link students’ behavior to creativity patterns.
In this paper, we propose an innovative approach to discover patterns of creativity in educational data by extending the state of the art in graph mining techniques. Our work relies on the expertise of education specialists to build a domain-specific Knowledge Base (KB), which consists of a taxonomy of concepts, instances for each concept, and relationships among them. We then create a creativity graph by linking the concept nodes in the taxonomy to the entities extracted from educational data, which enables us to discover patterns and relationships within the graph. Our approach is based on a motivating scenario in educational assessment, where a knowledge worker (e.g., a teacher) can analyze the activities of students in a classroom and augment that information with the knowledge in the Educational KB. By using a user-guided rule-based technique, the person can link the information extracted from raw educational data to creativity patterns identified in the Educational KB. Building upon our previous work published in the 23rd International Conference on Artificial Intelligence in Education [11], our approach represents an extension of graph mining techniques that focuses on discovering patterns and relationships within the creativity graph that we build using big educational data. The unique contributions of this paper are as follows:
  • We put the first step towards formalizing educational knowledge by constructing a domain-specific (Educational) KB to identify essential concepts, facts, and assumptions in identifying creativity patterns.
  • We introduce a pipeline to turn raw educational data (e.g., assessments and reports) into contextualized data and knowledge.
  • We present a rule-based approach to learning from the KB and facilitate mining creative thinking patterns from contextualized data and knowledge.
  • We evaluate our approach with a real-world dataset and highlight how the proposed framework can help instructors understand creative thinking patterns from students’ activities and assessment tasks.
The rest of the paper is organized as follows: In Section 2, we provide the background and related work. We present the proposed model for mining creative thinking patterns from contextualized educational data in Section 3. In Section 4, we describe the experiment, followed by evaluating our approach in Section 5. We conclude the paper with remarks for future directions in Section 6.

2. Background and Related Work

Numerous studies have been undertaken on creativity and the capabilities that accompany it. This section will first introduce the key terms and background in the field, and then discuss the related works in educational data, educational knowledge, educational data modeling, educational data mining, and learning analytics. The section concludes by outlining the related works and emphasizing the added value of our suggested solution.

2.1. Educational Data

A wide range of educational data is accessible from a number of different sources. By using the educational data, teachers may monitor their students’ academic achievements, learning behaviors, and offer immediate feedback based on the needs and requirements of students. Learning management systems collect a huge quantity of data from students that may be used to improve the learning environment, assist the teacher in teaching and the students in learning, and enhance the learning experience in general. Different learning resources are available, a number of which can be listed as follows [12]:
  • Interaction between students, instructors, and also students and instructors (e.g., chat boxes, discussion forums, navigation behavior).
  • Administrative data (e.g., institution, courses, instructors).
  • Demographic data (e.g., age, nationality, gender).
  • Students’ activities (e.g., assessments, questions, feedback).
  • Students’ dispositions and affectivity (e.g., attitude and motivation).
Since traditional learning analytics are not equipped to handle this volume of data, big data technologies and tools have found their way into education to process this massive amount of data. To deal with different kinds of educational challenges administrative data could be very useful. As a result, experts should acknowledge the influence of big data in education in order to alleviate educational difficulties.
In the big educational data, several research and review studies have been conducted. Highly cited studies investigated themes [13] such as the following. (i) Behavior and performance of learners: dedicated to learner perspectives, fulfillment, methods, and behavior, as well as big data structures, adaptive learning, teaching, data mining, and learning analytics [14,15]. (ii) Educational data modeling and warehouse: introducing big data modeling, educational data warehouses, and cloud environment research, as well as cluster analysis for educational purposes [16,17]. (iii) Improving educational systems: introducing statistical tools, metrics, obstacles, and the usefulness of ICT. It places a strong emphasis on training and its numerous ramifications. It also establishes a rating system that monitors how websites are used in order to enhance the educational system [18,19]. Lastly, (iv) Merging pedagogy with big data: incorporating big data concepts into various courses and emphasizing their educational implications [20,21].
Collecting and combining all these raw data is a time-consuming and tough process in and of itself; therefore, a preparation phase is required before modeling or applying machine learning techniques. The practice of organizing and integrating data from multiple sources in order to make it more useful for data analysis and discovery is known as data curation. In other words, it is the process of transforming raw data into contextualized data and knowledge. Data curation has been also defined as “the active and ongoing management of data through its lifecycle of interest and usefulness” [22]. It encompasses all of the procedures required for regulated data generation, preservation, and administration, as well as the ability to add value to data [23].
As data curation is one of the most significant challenges in data analytics, many organizations and researchers first investigate converting their raw data into useful information and knowledge. Data in a variety of sources with different formats (structured to unstructured) are first stored in a storage repository called Data Lake, which allows the data analysts to decide afterwards on the data curation [24].
Many studies are now focused on curating the stored data in the Data Lakes and making this transformation intelligent, e.g., AsterixDB (http://asterixdb.apache.org/) (accessed on 15 March 2023), Orchestrate (http://orchestrate.io/) (accessed on 1 January 2020), and CoreKG (http://github.com/unsw-cse-soc/CoreKG) [25] (accessed on 15 March 2023). For example, recently, Beheshti et al. [25] presented the Knowledge Lake or Contextualized Data Lake, which automates the curation and preparation of raw data in the Data Lake for analysis, laying the framework for big data analytics. They created CoreKG, an open-source Knowledge Lake service that allows researchers and developers to manage, curate, filter, and query the data and metadata in the Lake and across time via a single REST API.

2.2. Educational Knowledge

Skills and information acquired via education, practice, or experience are referred to as knowledge. It is also defined as recognizing a concept in a theoretical or practical manner [26].
The educational difficulties of the 19th century highlighted the necessity for a learning knowledge foundation to make changes in the educational systems. It should not include a philosophical viewpoint, such as behaviorism or pragmatism. Instead, it should represent theories that explain the impacts on educational learning, research findings condensed into empirical results, and professional opinions about impacts on educational learning.
A variety of factors would need to be assessed such as student skills, inclinations, and past accomplishments; teacher personality and attitude in classroom; methods of teaching and resources; the time spent for teaching and learning; classroom environment; structure of the curriculum; home, school, and social environment; demographic details of students; and educational policy in states and districts [27].
The education hierarchy refers to the hierarchical framework that most of the country’s education system follows, in which students are educated with a comparable set of information based on their age group and maturity. It is involved with formalized learning and teaching in an educational system. For instance, the Australian Standard Classification of Education (ASCED) is an educational hierarchy that consists of two components: fields of education and level of education [28]. It offers a foundation for similar administration and analytical data on educational programs and achievements grouped by level and field.
There is also another concept that is highlighted in the literature, the taxonomy of learning outcomes. It is the process of categorizing educational activities based on the kind of related learning outcomes. A taxonomy is a categorization system that is organized in a hierarchical order which is useful to categorize phenomena from a specific classification standpoint. Educators and educational designers utilize taxonomies to categorize instructional objectives as well as important evaluation factors to see if the objectives are being reached or not.
A wide variety of learning taxonomies have been designed to categorize educational statements [29,30]. Bloom’s and Bloom’s revised taxonomies are two well-known taxonomies in education that assist educators to evaluate students’ abilities.

Creativity in Education

Although creativity has always played a big role in human history, in the present era, due to the rapid change and its link with the concepts of innovation, it has become doubly important. Thus, creativity and invention have become the key measures of a country’s success. With the increasing advancement of knowledge and technology and the widespread flow of information, societies today need training for creative thinking skills with which they can move forward with developments. Hence, the goal should be to foster creativity in people from a young age through education.
Despite the recent research on creativity, it has been challenging for academics and researchers to consent on a definition to define it clearly. Generally, most of the definitions share two common attributes such as “novelty” and “effectiveness” (or usefulness). It is stated that an idea or product is creative if it is both novel (original) and useful for others. In other words, it should add something new and useful to the world that did not exist before [31]. Hence, due to the most recent and clear definition of creativity, it consists of three attributes, including “novelty”, “effectiveness”, and “whole”, or NEW for short. The NEW framework is then introduced to offer a systematic way to evaluate creative products in education.
There are numerous instruments in the literature to evaluate creativity in education, such as divergent thinking tests, self-reported creative activities, judgments of products, ratings by others, etc. [4]. The set of Torrance Tests of Creativity (TTCT) is one of the oldest and still popular methods to evaluate creativity as a divergent thinking test method. The test contains two modes, figural and verbal, to be answered in a limited amount of time (30–40 min), then the scores from each subtest are combined into an overall score that covers four dimensions: Fluency, Elaboration, Originality, and Flexibility. Fluency refers to the amount of produced ideas; Originality refers to the amount of original and unique ideas; Elaboration is the capacity to elaborate on an idea and add details to it; and Flexibility is the capacity to generate a wide range of ideas. Another recent research on creativity measurement was published by Baer J. et al. [32] based on the rating method. The research is focused on the Consensual Assessment Technique by Teresa Amabile [31]. It has been called the “gold standard” of creativity assessment and may be used to assess the originality of students’ research ideas or scientific hypotheses, as well as their creative works and musical compositions, and their poems, essays, and stories.

2.3. Educational Data Modeling

Data modeling is the process of building a data model to be used in an information system. An information system consists of a database that contains stored data and programs for collecting, manipulating, and recovering data. Similarly, a data model describes the type of data to be stored and organized in the database in different formats [33].
Three basic terms and definitions for data modeling are entity, attribute, and relationship:
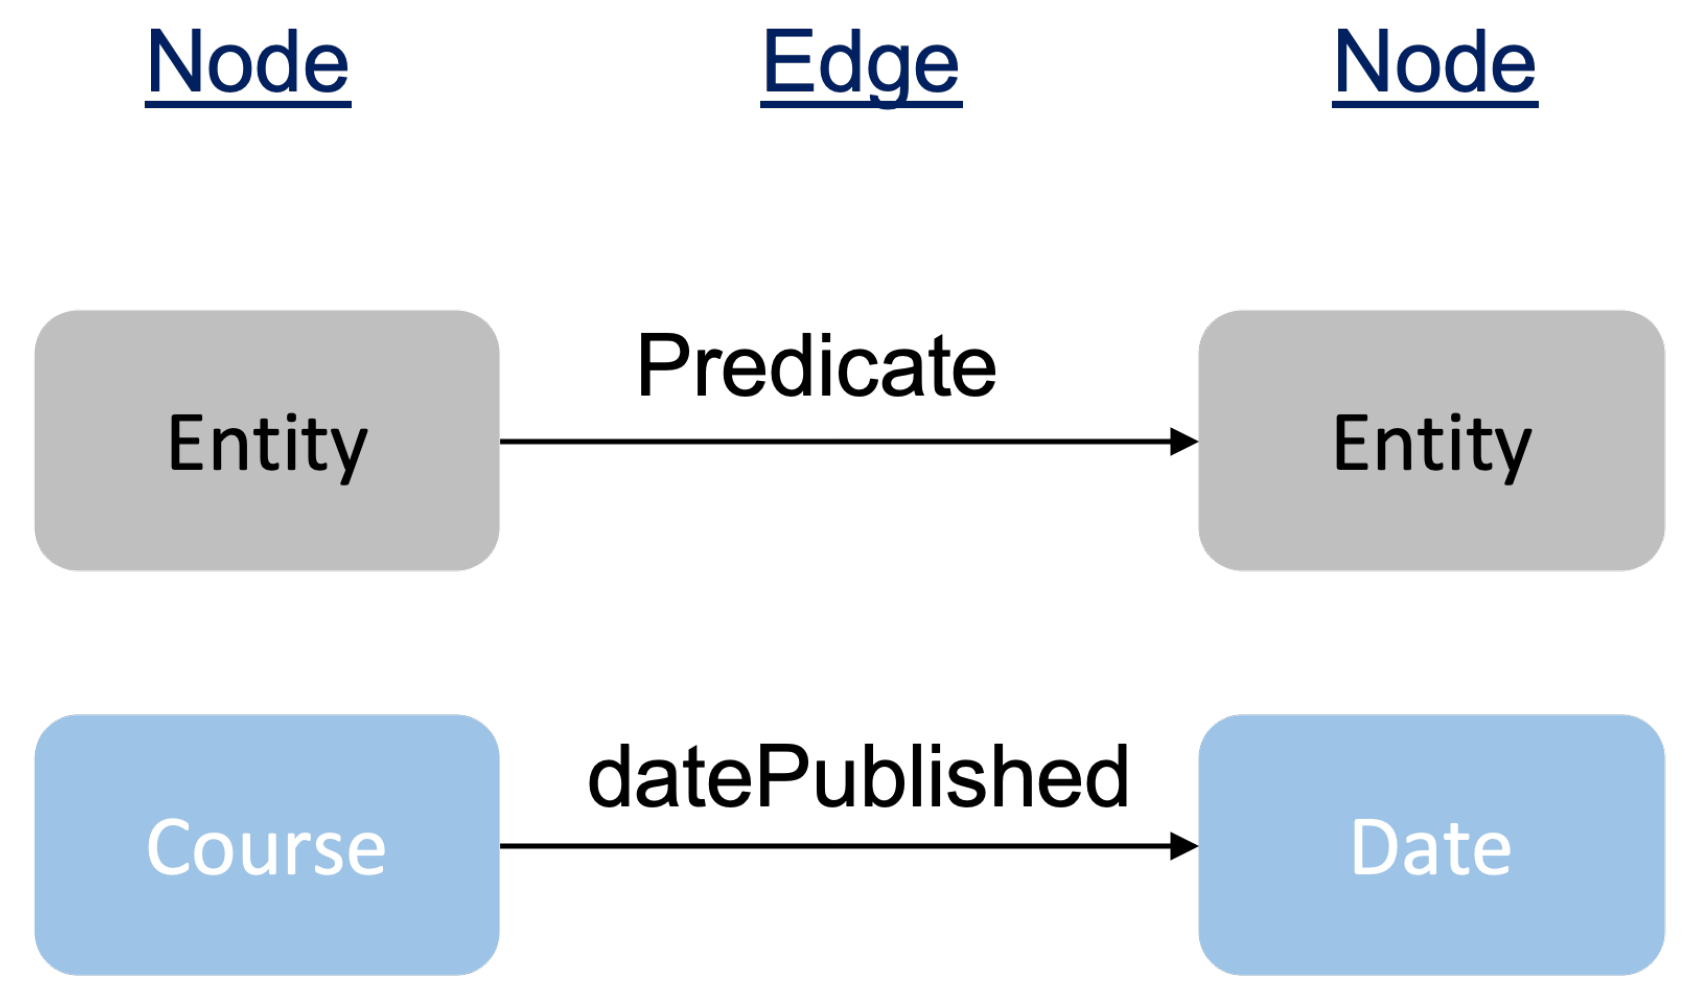
  • Entity: An entity refers to a real-world object such as individuals, products, or organizations.
  • Attribute: An attribute is a property of an entity such as age, color, or address.
  • Relationship: A relationship is a connection between two entities.

2.3.1. Data Modeling Methods

There are several data modeling methods to organize the data which are suitable for a specific data structure. The most well-known data models are:
  • Hierarchical Data Model: This approach is well suited to situations when the information collection is based on an actual hierarchy in a tree shape or parent–child hierarchical structure. The hierarchical model has been used widely in education, e.g., to measure educational service quality [34], and to evaluate extrinsic and intrinsic motivation in students [35].
  • Network Data Model: This approach enhances the hierarchical data model by enabling the existence of numerous parent records, which means allowing each child record to be linked to several parent records. In education, the network model has been used to, e.g., emphasize the importance of education in environmental protection [36] and develop a learning network model for higher education consortia formation and management [37]. Ref. [38] also presented a new framework called Hierarchical Network Models (HNM) for educational research and developed single-network statistical network models to multiple networks.
  • Relational Data Model: A relational data model consists of a set of tables, recognized as relations, consisting of rows and columns. This method is the most used data model in education, e.g., Ref. [39] has introduced a tool that simplified and partially automated the process of designing relational educational data for students, and Ref. [40] examined employing relational model as a data analysis and management tool to study educational environments.
  • NoSQL Data Model: Other non-relational or non-SQL models have been developed such as document model, multivalue model, and graph data model. These three are prominent examples of the NoSQL data model:
    -
    The Document Model stores and manages semi-structured data or documents instead of atomic data [41]. For instance, the background educational data gathered from students’ activities using a document model proved to be helpful to create adaptable educational documents [42].
    -
    The Multivalue Model allows the attributes to take a list of data instead of a single point, which makes it different from the relational data model. In education, this model proved to be useful to make the process of data analysis faster by using multidimensional arrays of student values [43].
    -
    The Graph Data Model allows any node connection with different structures coming from various sources of information [44]. This data model has recently gained popularity in the study of education. In the next subsection, we will explain the terms and concepts related to this model.

2.3.2. Graph Data Modeling

Graph data is a data structure that is composed of nodes (also called vertices) and edges (also called links or connections) that represent the relationships and connections between the nodes. A property as an attribute provides more information about the nodes and edges. The graph can be classified in various ways. They can be directed/undirected, weighted/unweighted, or a combination of both [45].
Graph-based visualizations are able to address a wide range of topics from several fields, including Natural Language Processing (NLP), knowledge discovery, and large network systems [46]. The knowledge graph is distinguished from other knowledge-based information systems by its unique integration of the knowledge visualization system, algorithmic searches, and information management procedures [47].
Although there are several different definitions of a knowledge graph in the literature, an integrated formulated definition is provided by [48] as follows:
“A knowledge graph is a knowledge base that (1) replicates the model of information flow in an organization, (2) stores complex structured and unstructured knowledge, (3) is presented in the form of entities and relations between them, (4) covers a multitude of topical domains, (5) acquires and integrates knowledge, and (6) enables interrelation of arbitrary entities.”
The knowledge graph model is a database that stores information according to a knowledge schema. The knowledge schema supplies the knowledge graph’s basic structure and builds its meta-layer, as well as defines containers as classes for entities of comparable types. Posting and interconnecting data on the Web utilizing the Resource Description Framework (RDF) is one of the approaches to keeping the information in a schema. According to the RDF standard, developed by the Word Wide Web Consortuim (W3C) in 2019, knowledge can be depicted using Triples. The Triples include two entities as head and tail and a predicate that connects them [49]. Figure 1 depicts a Triple with two entities as “Course” and “Date” and a predicate as “datePublished”.
There are several studies using knowledge graphs to address educational problems. For example, Ref. [50] proposed KnowEdu, a system to automatically construct knowledge graphs, using heterogeneous data to extract instructional concepts and identify significant educational relations. In addition, Ref. [51] presented the design of a scientific publication management model to integrate scientific metadata based on the knowledge graph and data analysis technologies. They aimed to improve the effectiveness of scientific retrieval, minimize the learning difficulties in the scientific domains, and encourage non-researchers to use scientific resources in their work.

2.4. Educational Data Mining and Learning Analytics

Recently, Educational Data Mining (EDM) as an application of data mining in education has emerged to improve teaching, learning, and research outcomes. At first, it was introduced by a few workshops and seminars at Artificial Intelligence in Education (AIED) conferences and now it has progressed to the point where it now has its community and societies.
On the subject, there is a substantial and varied body of literature. For example, Bienkowski et al. (2012) [52] offers a widely referenced study in which they introduce EDM, as well as its basis, difficulties, and implications. There are also several books and paper surveys that present applicability, approaches, and the state of the art in EDM [8,53,54].
The application of EDM techniques includes a number of processes. The steps that should be taken in this process are as follows [55]: (1) Designing a plan and identifying the necessary data, (2) Extracting the data from available educational environments, (3) Curating the extracted data since it might originate from a range of sources with different formats, (4) Applying EDM methods to create models/patterns, and (5) Interpreting the models/patterns. In case of inconclusive outcomes, after making changes to the teaching/learning method or the study design, the analysis will be repeated. This might happen due to not properly addressing the problem, inadequate or unsuitable input of raw data, or choosing methods that are not powerful.
There is another related community called Learning Analytics (LA) which shares a common interest with EDM in the way educational data has the potential to make a difference in terms of learning outcomes. It was initially defined as follows: “Learning analytics is the measurement, collection, analysis, and reporting of data about learners and their contexts, for the purposes of understanding and optimizing learning and the environments in which it occurs” in the first International Conference on LA, held in Canada in 2011 [56].
There is a substantial and diverse collection of literature on LA. For, example, Larusson (2014) [57] is a popular book on LA contains the most up-to-date concepts, research, methods, techniques, and case studies. It helps the readers find out how to: (a) improve the performance of students and educators; (b) increase student comprehension of course content; (c) identify and respond to the needs of students who need help; (d) enhance grading accuracy; (e) enable institutions to make better use of their resources; and (f) allow educators to evaluate and improve their own abilities.
The application process of LA is similar to EDM and the steps for testing a hypothesis linked to the learning/teaching process are the same as for EDM. It consists of data extraction from relevant educational environments, preprocessing extracted data, and applying numerical/computational methods to help educators or psychologist to interpret the outcomes and make decisions.

2.4.1. Common Methods in EDM and LA

The communities of EDM and LA are both interested in exploring new methods to enhance the research on big educational data. Furthermore, there are differences in terms of the research questions, methods and techniques, and focuses; the two areas have a lot in common both in goals and the methodologies and strategies employed throughout the research [58]. They can be seen as an intersection of three areas: Education, Statistics, and Computer Science.
The EDM/LA process is a cycle of data mining and knowledge discovery which is involved with students, instructors or academic authorities, and educational environments to produce educational data and ultimately new knowledge. This new knowledge is gained by EDM and LA methods and will be used again by students and instructors in the process [8]. The majority of methods pertinent to educational data are used both in EDM and LA. The most popular methods are (1) clustering, (2) prediction, (3) social network analysis, (4) outlier detection, (5) casual mining, (6) process mining, (7) relationship mining, and (8) text mining. There is also prominent research around discovery with models and distillation of data for human judgment [56,59,60].

2.4.2. Creativity Assessment Using EDM/LA

Although much has been investigated regarding EDM and LA in education and student assessment, there is little study on creativity assessment using EDM or LA. However, there is some research around cognitive processes such as creative thinking and problem-solving skills [61,62,63,64]. For example, Yu [64] performed rule extraction using a rough set as a data mining tool to find the rules between scientific creativity and effective creativity. Deng et al. [61] designed a framework for frequent pattern mining using cognitive-based big data analytics. They claim that the discovered patterns assist in the (i) production or extraction of useful knowledge; (ii) identification of behavior and attitude of users; (iii) comprehension of inference, correlation, inference transmission, and interchange of ideas; and (iv) formulation of suitable decisions and responses.
Singelmann et al. [63] tried to learn more about the way students solve open-ended questions in an engineering course at the graduate level. They asked all students to submit their own products and accompanying project requirements into an online portal. In this way, they are able to check their progress, and then, by applying clustering algorithms, four clusters appeared. The clusters include Surface Level, Surveyors, Learners, and Innovators. Three taxonomy of learning such as Webb’s Depth of Knowledge, Bloom’s taxonomy, and Cynefin Framework have been used to define those clusters. By observing which students fell into which groups, how they moved among the clusters, and key phrases associated with each cluster, they were able to gain a better understanding of how students confront the creative process. This research gives a clearer picture of the way students develop and find solutions, paving the way for improvements in customized learning, group matching, and even evaluation.
Another study [62] investigated the cognitive processes of children by a creativity test using data mining techniques. In this study, they asked 95 fifth-grade students to think and apply scientific facts. A sample board was provided to students to draw as many paths as feasible. The students were also instructed to utilize the fewest possible number of mirrors to hit the target. This variation on the conventional creativity tests allows students to demonstrate their fluency as well as creative thinking. In this experiment, students’ drawings were coded and analyzed using the association rules mining approach to investigate links between different types of optical paths and to determine students’ cognitive abilities in comparison to traditional assessment instruments.

2.5. Summary and Added Value

We examined the current state of the art in education for recognizing and fostering creativity in this part. This is followed by a discussion of some well-known methods including Educational Knowledge, Educational Data Modeling, and EDM/LA techniques. In Educational Knowledge, we focused on the concepts of knowledge hierarchy and taxonomy and introduced the traditional methods for creativity assessment. Next, different data models are explored and we discuss how these models, specifically graph data modeling, are used in the education domain. Finally, a comprehensive overview of data mining in education and learning analytics is presented, encompassing the disclosure of common EDM/LA techniques and an explanation of significant publications related to the detection of creative thinking patterns.
Table 1 shows the publications in the literature. The majority of the papers we reviewed were released recently in prominent peer-reviewed journals (e.g., ACM, IEEE, Elsevier, and Springer) and international conferences (e.g., ACM, IEEE, and VLDB) in the domains of education, artificial intelligence, big data in education, and educational technology. We also looked at older publications (before 2010) which are mostly relevant to Educational Knowledge to provide the evolutionary pattern of definitions and methods relevant to creativity.
In this study, we leverage to address the inherent flaws in the algorithmic approaches by using a rule-based pattern mining technique as a declarative alternative. The approach, as an extended version of our previously published work [11], has relied on the knowledge of education experts and focuses on facilitating the mining creative thinking patterns from contextualized data and knowledge.

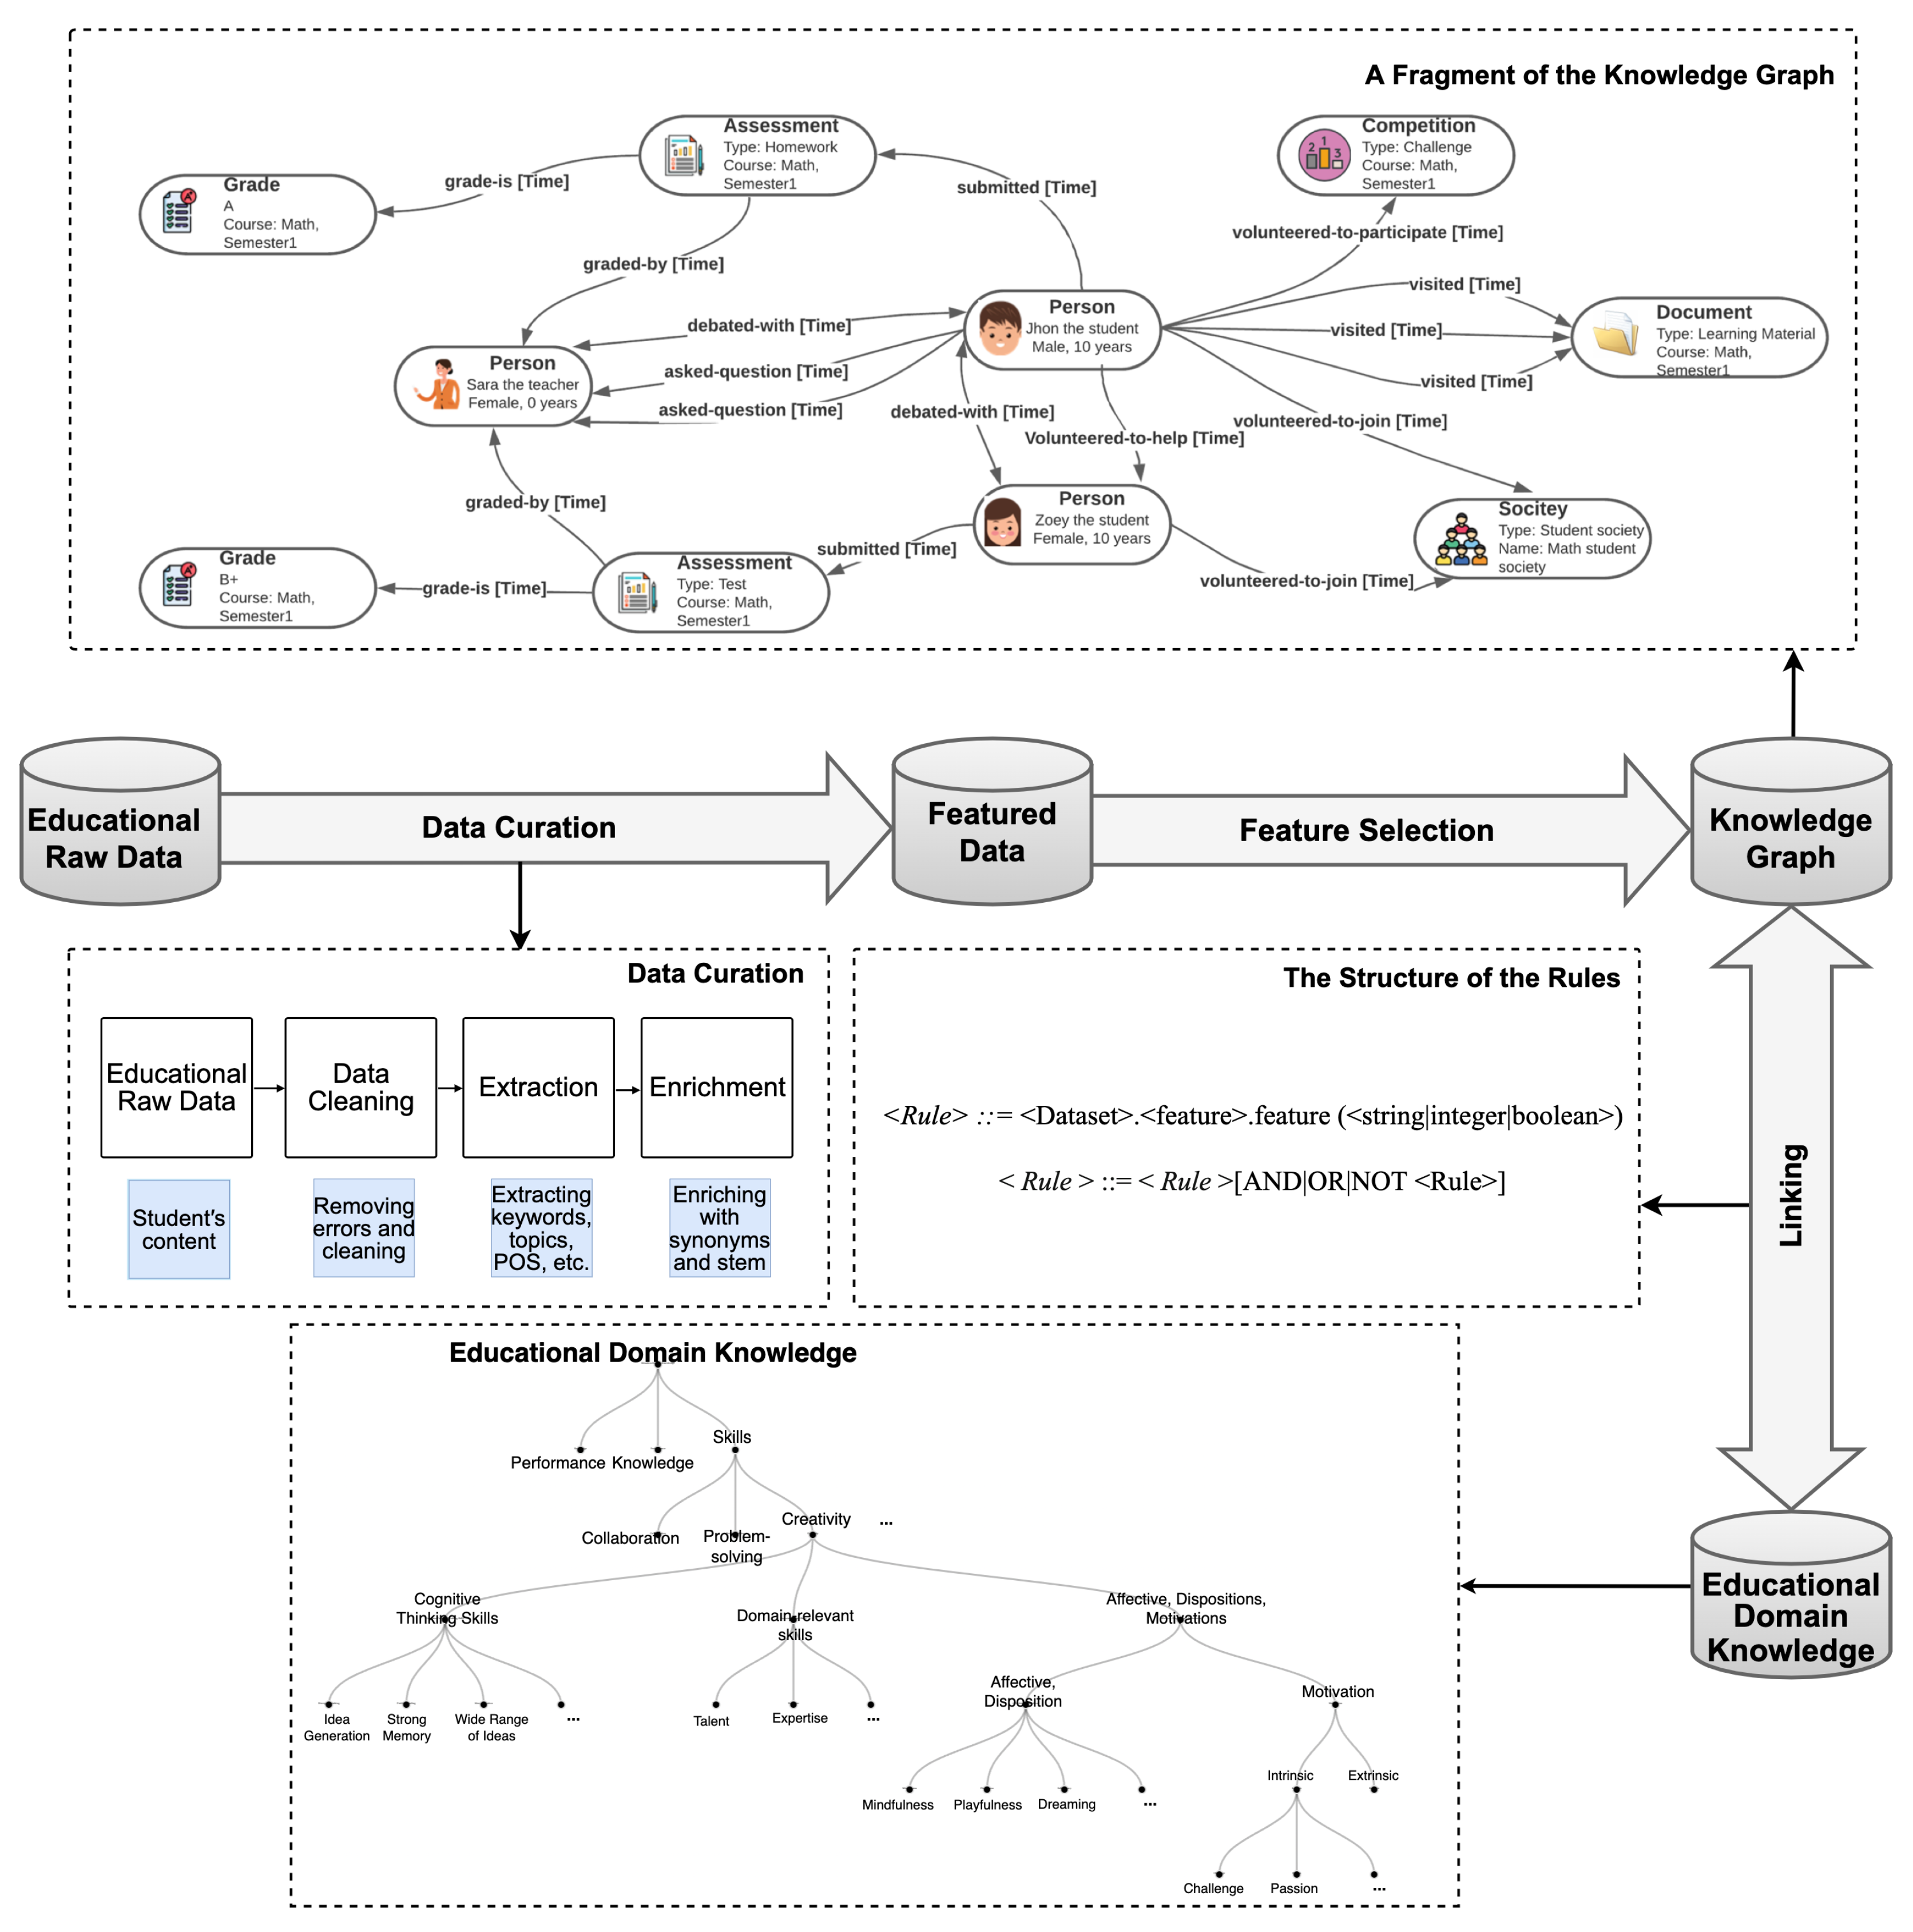
3. Mining Creative Thinking Patterns from Contextualized Educational Data

This section provides a detailed explanation of the proposed model. We put the first step towards formalizing the educational knowledge by constructing a domain-specific KB to identify essential concepts, facts, and assumptions in identifying creative patterns. We introduce a pipeline to contextualize the raw educational data, such as assessments and class activities. Finally, we present a rule-based approach to learning from the KB, and facilitate mining creative thinking patterns from contextualized data and knowledge. Figure 2 illustrates the proposed model, including the data curation, feature selection, domain-specific KB, and linking components.

3.1. Data Curation

In this step, we leverage the state of the art in data curation [24] to turn the raw educational data into contextualized data and knowledge. As shown in Figure 2, the curation pipeline includes cleaning, extraction, and enriching phases. For example, considering a student’s assessment as raw data, the curation pipeline will (i) clean raw data, by identifying and correcting inaccurate or corrupt information, such as missing, erroneous, or irrelevant data, and then correcting them; (ii) extract features (such as keywords, entities, named entities, topics, part of speech) from the contents; and (iii) enrich the extracted features with synonyms, stems, and similar keywords and entities to make them ready for feature selection and further analysis.

3.2. Feature Selection

Reducing the dimensionality of data has multiple benefits, which make the dataset less complex and thus easier to work on. Models are also less prone to overfit on a dataset with fewer dimensions. The simplest technique to minimize dimensionality is to choose only the key features from a huge dataset. Since it is critical to find which features significantly influence the pattern discovery process, the features will be selected from the enriched data. We aim to employ several types of features in education, including: (i) Demographic data, which contains information about the characteristics of students such as age, gender, and class attendance; (ii) Achievement data, which contains information about student achievement and learning outcomes such as test scores, homework, and class-based scores; and (iii) Program data, which contains information about a school’s programs such as its academic programs, teacher training and experience, and extracurricular programming.

3.3. Domain-Specific KB

The next important step here is to imitate the knowledge of education experts into an Educational KB, which provides a rich structure of relevant entities, semantics, and relationships among them. A Domain Knowledge (DK) is a taxonomy of concepts, sub-concepts, and their relationships. In the next section, we focus on a motivating scenario in the education domain and present the construction of such Domain Knowledge.

3.4. Educational Knowledge Graph

As introduced in Section 2.3.2, a Knowledge Graph is a set of interconnected entity descriptions (real-world objects or concepts) that combines characteristics of other data management systems like graph databases. It is basically a knowledge base that has been made machine-readable using logically coherent, connected graphs that form an interconnected set of facts [67]. RDF-based knowledge graphs [68] are the best foundation for data integration and unification in this context. RDF or Resource Description Framework is made to model schemaless databases for the Semantic Web flexibly. Its structure is based on triples, each of which is made up of three entities that formalize semantic data in the form of the subject → predicate → object. A triple also referred to as ‘statements’ or ‘RDF statements’, which signifies a relationship between subject and object predicate captures. As a result, a directed graph, with nodes representing subjects and objects, and edges representing predicates, can be used to describe a set of triples [69]. For example, the RDF statement ‘Sara submitted homework’ can be defined in a triplestore and explains the relationship between the sentence’s subject, “Sara” and the object, “homework”. The predicate “submitted” expresses the relationship between the subject and the object. As a graph database, triplestore stores data as a network of objects connected by materialized connections. As a result, RDF triplestores are the best option for organizing heavily interrelated data.
In this study, based on the aforementioned facts, to extract insight from the contextualized data, we construct an RDF-based Graph to represent the knowledge hidden in the contextualized data (i.e., the result of the proposed data curation pipeline). We call this graph the Educational Knowledge Graph (eKG). Let R = ( E n t , R e l ) be an RDF graph where Ent is a set of entities and Rel is a set of relationship labels. L e t G = ( V , E ) be an Entity–Relationship (ER) attributed graph where V is a set of nodes and E is a set of ordered pairs called edges. An ER graph G e K G = ( V G , f E n t , E R e l ) where V is a set of nodes, f E n t : V G E R e l is an injective function, and E R e l is a set of labeled edges. G e K G with n number of entities is defined as G e K G R , V G = V , and E R R e l . The graph is viewed as a directed graph since it is always possible to interpret the direction of a relationship between two entities in the opposite direction.
The eKG is composed of entities and relationships among them. An entity is a real-world object that has unique existence and can be distinguished from other objects by physical (e.g., a teacher, a student) or conceptual (e.g., a course, a task) existence. They are defined by a set of attributes, e.g., name, age, and gender. A relationship can be defined as a directed link between two or more entities that are defined by a predicate based on the attributes of the entities. We model the featured data as a graph of typed nodes and edges (relationships). The upper part of the Figure 2 depicts a small fragment of a knowledge graph, showing possible relationships between objects in an educational setting. (A comprehensive example of entities and their relationships is presented in Section 4.1.) The entities and relationships create different types of triples. A few examples of the triples depicted in the graph are described as follows:
  • Assessment graded by [ Timestamp ] Person: States that an assessment (e.g., homework) is graded by a person (e.g., a teacher).
  • Person debated with [ Timestamp ] Person: States that two people debated over a topic (e.g., a teacher and a student debated with each other).
  • Assessment grade is [ Timestamp ] Grade: States the grade of an assessment.
  • Person submitted [ Timestamp ] Assessment: States that a person (e.g., a student) submitted an assessment.
  • Person volunteered to join [ Timestamp ] Society: States that a person (e.g., a student) is volunteered to join a society (e.g., a student society).
The Educational Knowledge Graph will make it easier to find, evaluate, and communicate essential patterns in educational data, allowing us to investigate the possibilities for better understanding and evaluating student behavior and performance.

3.5. Rule-Based Insight Discovery

The final step is to derive relevant insights from the data in order to reach a consensus. Insight discovery is the process of extracting evidence from data to help analysts obtain precise and in-depth insight into a specific analytic purpose. To this end, we perform user-guided insight discovery [24] to facilitate the insight discovery process and link extracted featured items to the entities in the domain-specific knowledge by using a simple rule language.
Many of the flaws inherent in algorithmic approaches can be addressed using rule-based techniques as a declarative alternative. Algorithms are suitable for tackling particular tasks, but datasets are huge and changing all the time in reality. There are various advantages of using rule-based techniques over algorithmic designs, such as being easier to produce, faster for correcting errors, and wider coverage of cases [24]. Generally, rules can be defined as follows:
< R u l e > : : = < D a t a s e t > . < f e a t u r e > . f e a t u r e ( < s t r i n g | i n t e g e r | b o o l e a n > )
However, the rules can become more complicated by using conjunction and/or dis-junction of additional rules. Ultimately, an IF…THEN rule can be used to assign a tag and link the extracted featured items to the domain knowledge entities. For example, to identify a creativity pattern (e.g., Using Wide Categories) in a student, two rules can be defined and connected to flag a tag, as shown in Equation (2).
R u l e 1 = S t u d e n t ( I D ) . c l a s s A c t i v i t y ( T y p e ) . d e b a t e d [ i n t ] R u l e 2 = S t u d e n t ( I D ) . c l a s s A c t i v i t y ( T y p e ) . a s k e d Q [ i n t ] I F R u l e 1 A N D R u l e 2 T H E N T A G [ S t u d e n t , C r e a t i v i t y . C o g n i t i v e . w i d e C a t e g r i e s ( T r u e ) ]
Querying RDF Graph. To enable rule-based querying of the RDF stores in the Educational Knowledge Graph, we intend to use the SPARQL query language for analyzing and organizing the extracted–enriched data and linked features. SPARQL is an SQL-like edge-based query language for RDFs that will be used on top of a graph to search through the nodes and edges [70]. A SPARQL query Q is defined as a tuple Q = ( A E , D S , O R ) . It is built around an algebra expression AE that evaluates an RDF graph in a dataset DS. AE is made up of several graph patterns that can include solution modifiers, including LIMIT, ORDER BY, DISTINCT, and PROJECTION. The outcomes of the matching process are handled using the operation result OR (e.g., CONSTRUCT, SELECT, ASK, FILTER, DESCRIBE). A basic SPARQL query has the following format:
  • select ?variable1 ?variable2 ...
  • where { pattern1. pattern2. ... }
Each pattern has three parts: subject, predicate, and object, which can all be variables or literals. The known literals are specified in the query, while the unknowns are left as variables. To answer a query we should locate all potential variable bindings that meet the given patterns. The ‘@’ indication is used to identify attribute edges from the relationship edges between graph nodes. Example 5 presents a sample graph-level query. The triple pattern t is the most straightforward graph pattern specified in SPARQL. The subject, predicate, and object variables can be used in a triple pattern analogous to an RDF triple. Triple patterns, like triples, can be represented as directed graphs. Hence, a SPARQL query is frequently cited as a graph pattern matching problem [71].
t T P = ( R D F T V ) × ( I V ) × ( R D F T V )
where RDF-T denotes the set of RDF terms, I denotes a set of IRIs, and V denotes a set of variables. A basic graph pattern B G P = { t 1 t n } is defined as a set of triple patterns with t 1 t n T P . If all of the enclosed triple patterns match, it matches a subgraph. Value constraints (FILTER) and other graph patterns can be combined with basic graph patterns. Basic graph patterns and value constraints are evaluated in a non-ordered manner. This indicates that a structure consisting of two basic graph patterns BGP1 and BGP2 controlled by constraint C could be converted into a single equivalent basic graph pattern followed by a constraint. Filtered basic graph patterns referred to as FBGP are basic graph patterns that have been modified by one or more constraints.

4. Experiment

In this section, we demonstrate and evaluate the outcomes of the proposed method and examine how this method can be used to mine patterns of creativity in individuals. We first discuss a motivating educational scenario to clarify our approach toward mining creativity patterns. Next, we provide detailed information on the input data and experimental setting, present the experimental results, and finally explain how the results are evaluated.

4.1. Motivating Scenario

Creativity is seen as a fundamental quality that children today must possess in order to excel in school and their career [72]. From big-picture planning to rigorous organizing, this 21st-century talent empowers students to express their inherent strengths. They learn about their creativity as well as how to use it in a healthy and effective manner.
The motivating scenario focuses on detecting creativity patterns in students to help teachers find creative students in the classroom. They can also find struggling students and plan for fostering creativity in those. For example, the plan would be to detect motivated, creative students and get help from them to lead groups of students and share their knowledge with others. The goal of creativity is to inspire students to think outside of the box. To facilitate discovering patterns of creativity in students, we propose three steps:

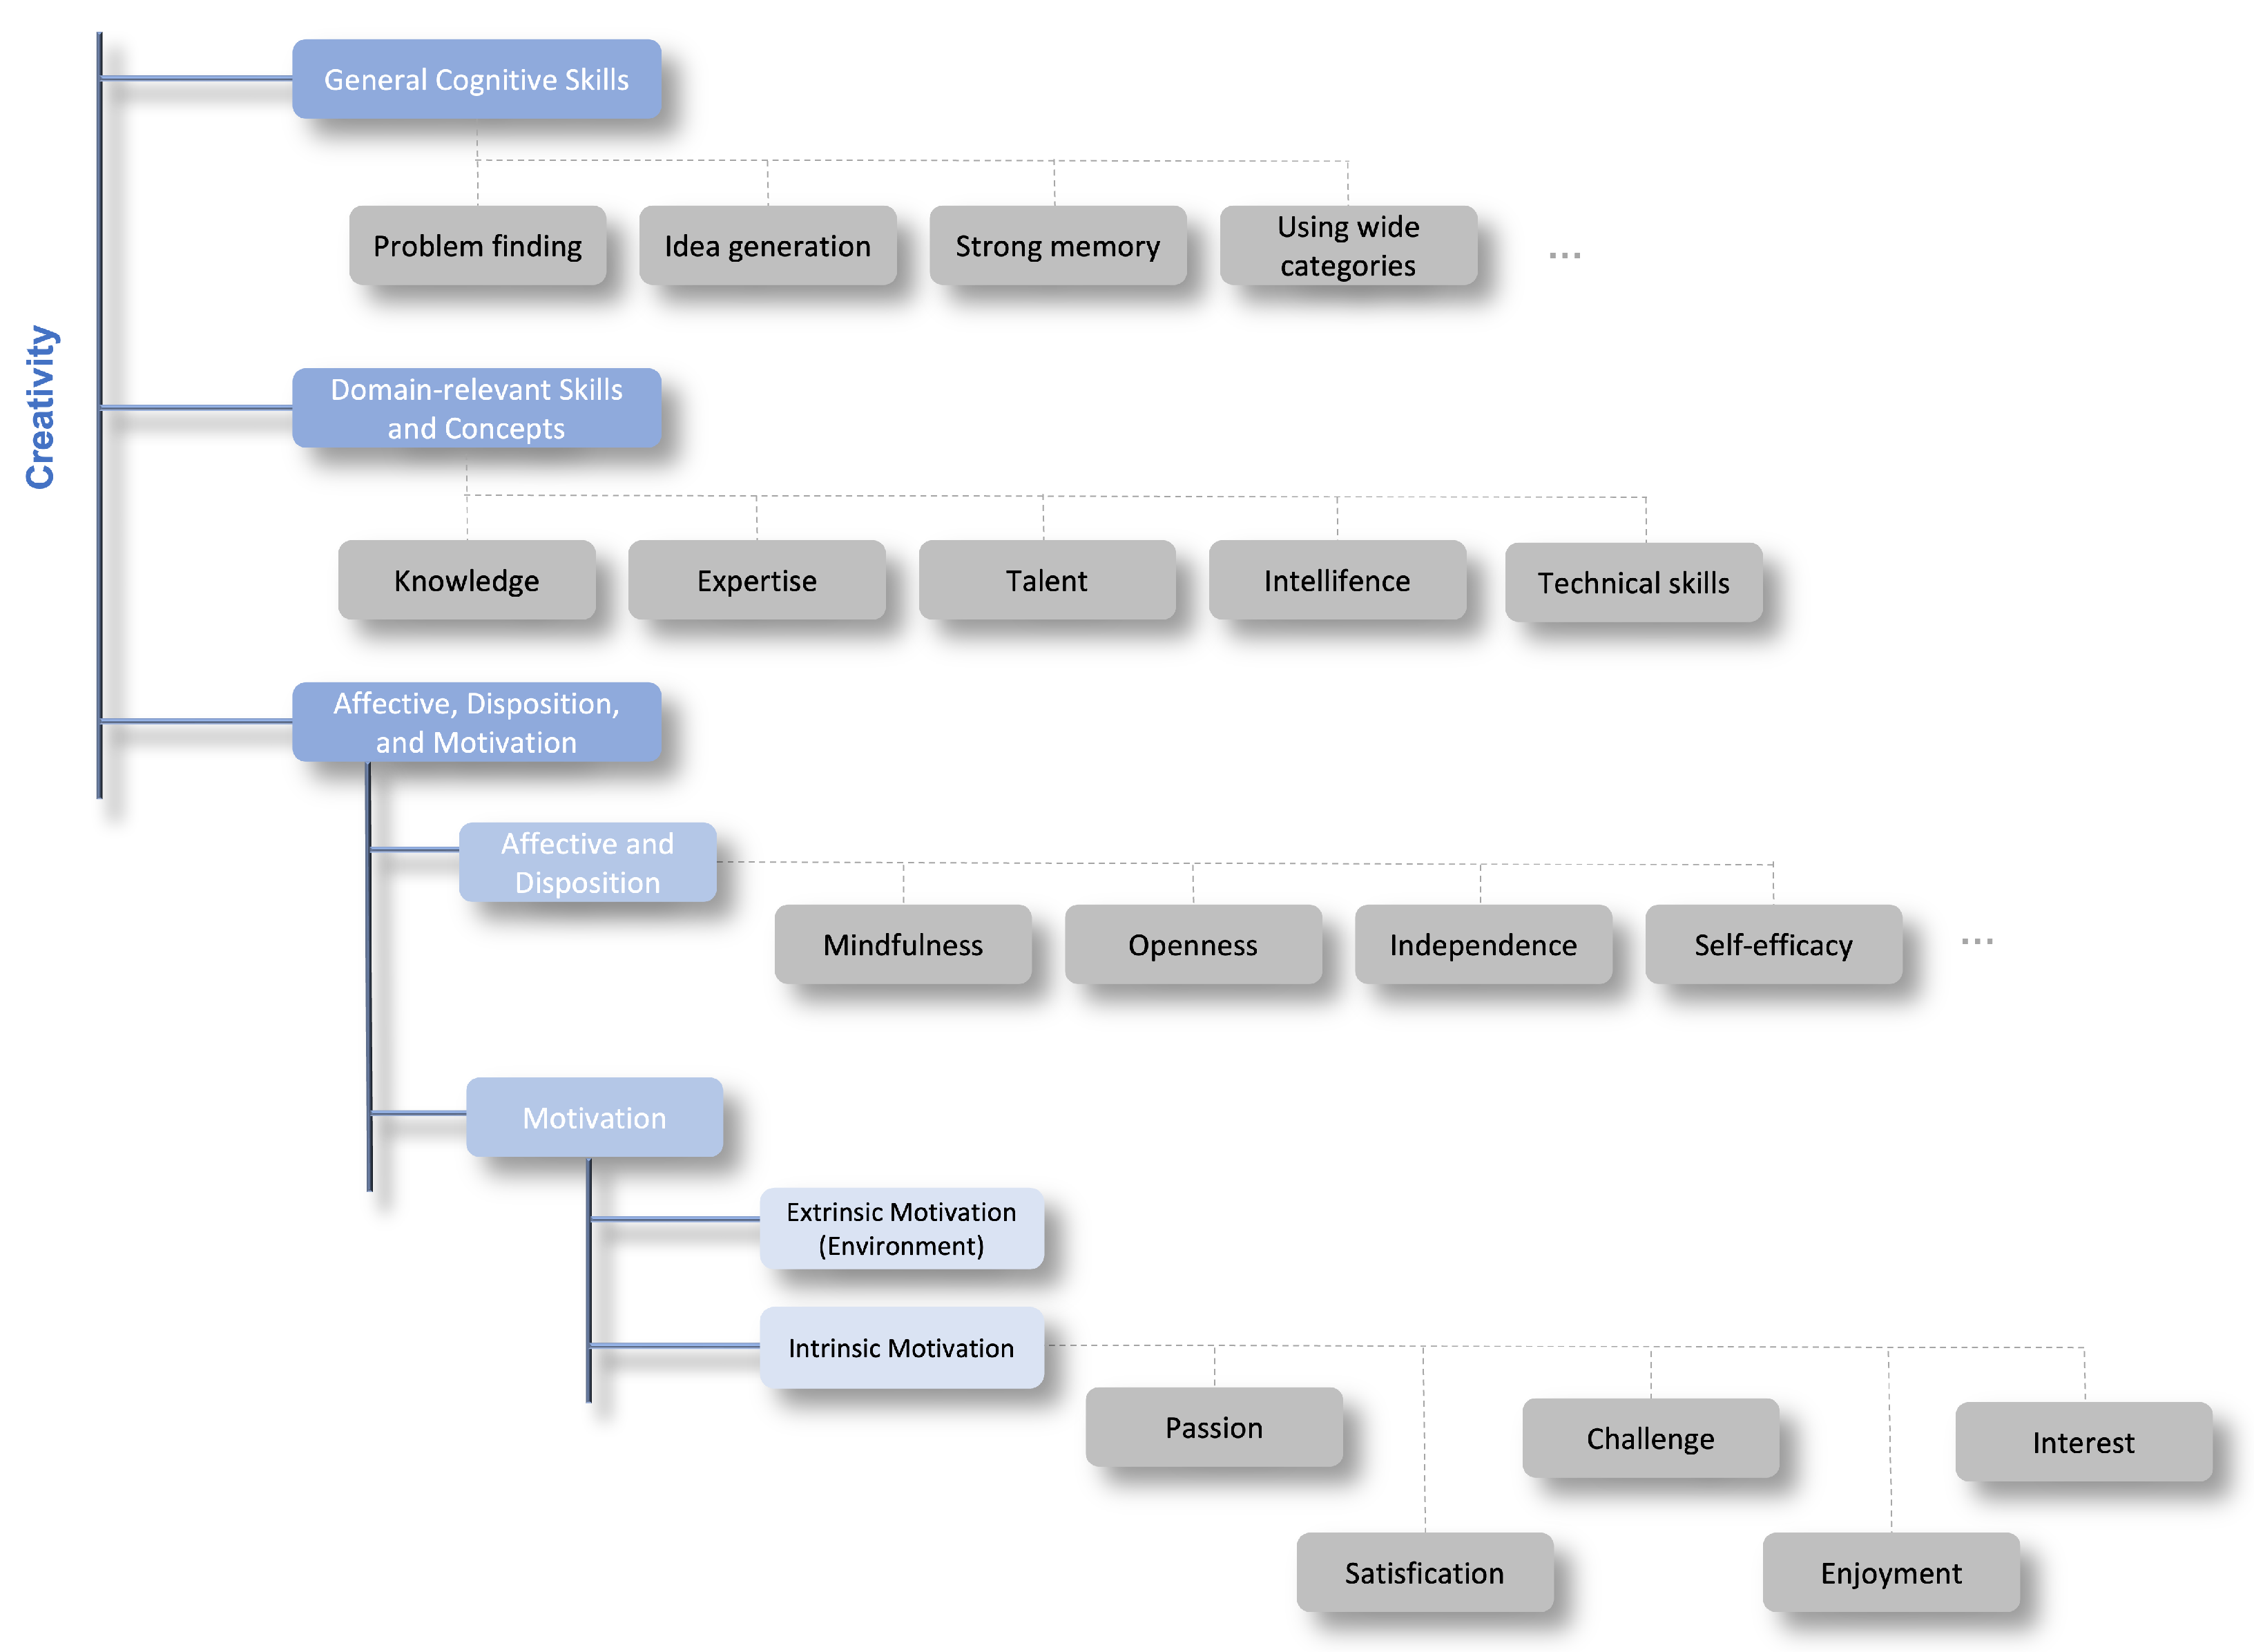
4.1.1. Use Case 1: Imitating the Knowledge of Experts in Education

The initial phase in the pattern discovery is building a KB by imitating the knowledge of education experts who have the best knowledge in education and students’ skills. The KB consists of a set of concepts organized into an educational taxonomy, instances for each concept, and relationships among them. We explain the techniques we used to construct the KB domain knowledge.
We spent several months studying major articles and books in education and cognitive research in order to compile a list of the significant notions of creativity and their sub-concepts. We based our work on the publication series of Teresa Amabile [31] and Bloom’s taxonomies [29] in combination with other major works exploring the instances of creativity [73,74,75]. We finally formalized them with the help of an expert in education and created a creativity taxonomy shown in Figure 3. The main concepts of the taxonomy are identified as follows:
(i)
General Cognitive Thinking Skills: The mental processes involved in gaining knowledge and comprehension. These cognitive thinking processes include idea-generating, remembering, using wide categories, and problem-finding skills.
(ii)
Domain-relevant Skills and Concepts: The amount to which a person’s product or reaction will outperform past responses in the domain is determined by his or her usage of creativity-relevant abilities. It includes expertise, knowledge, technical skills, intelligence, and talent in the particular domain.
(iii)
Affective, Disposition, and Motivation: Affective and Disposition include the ways in which students deal with external and internal phenomena emotionally such as self-efficacy, independence, curiosity, and commitment. Furthermore, motivation encompasses both intrinsic and extrinsic factors such as passion, challenge, interest, enjoyment, and satisfaction.

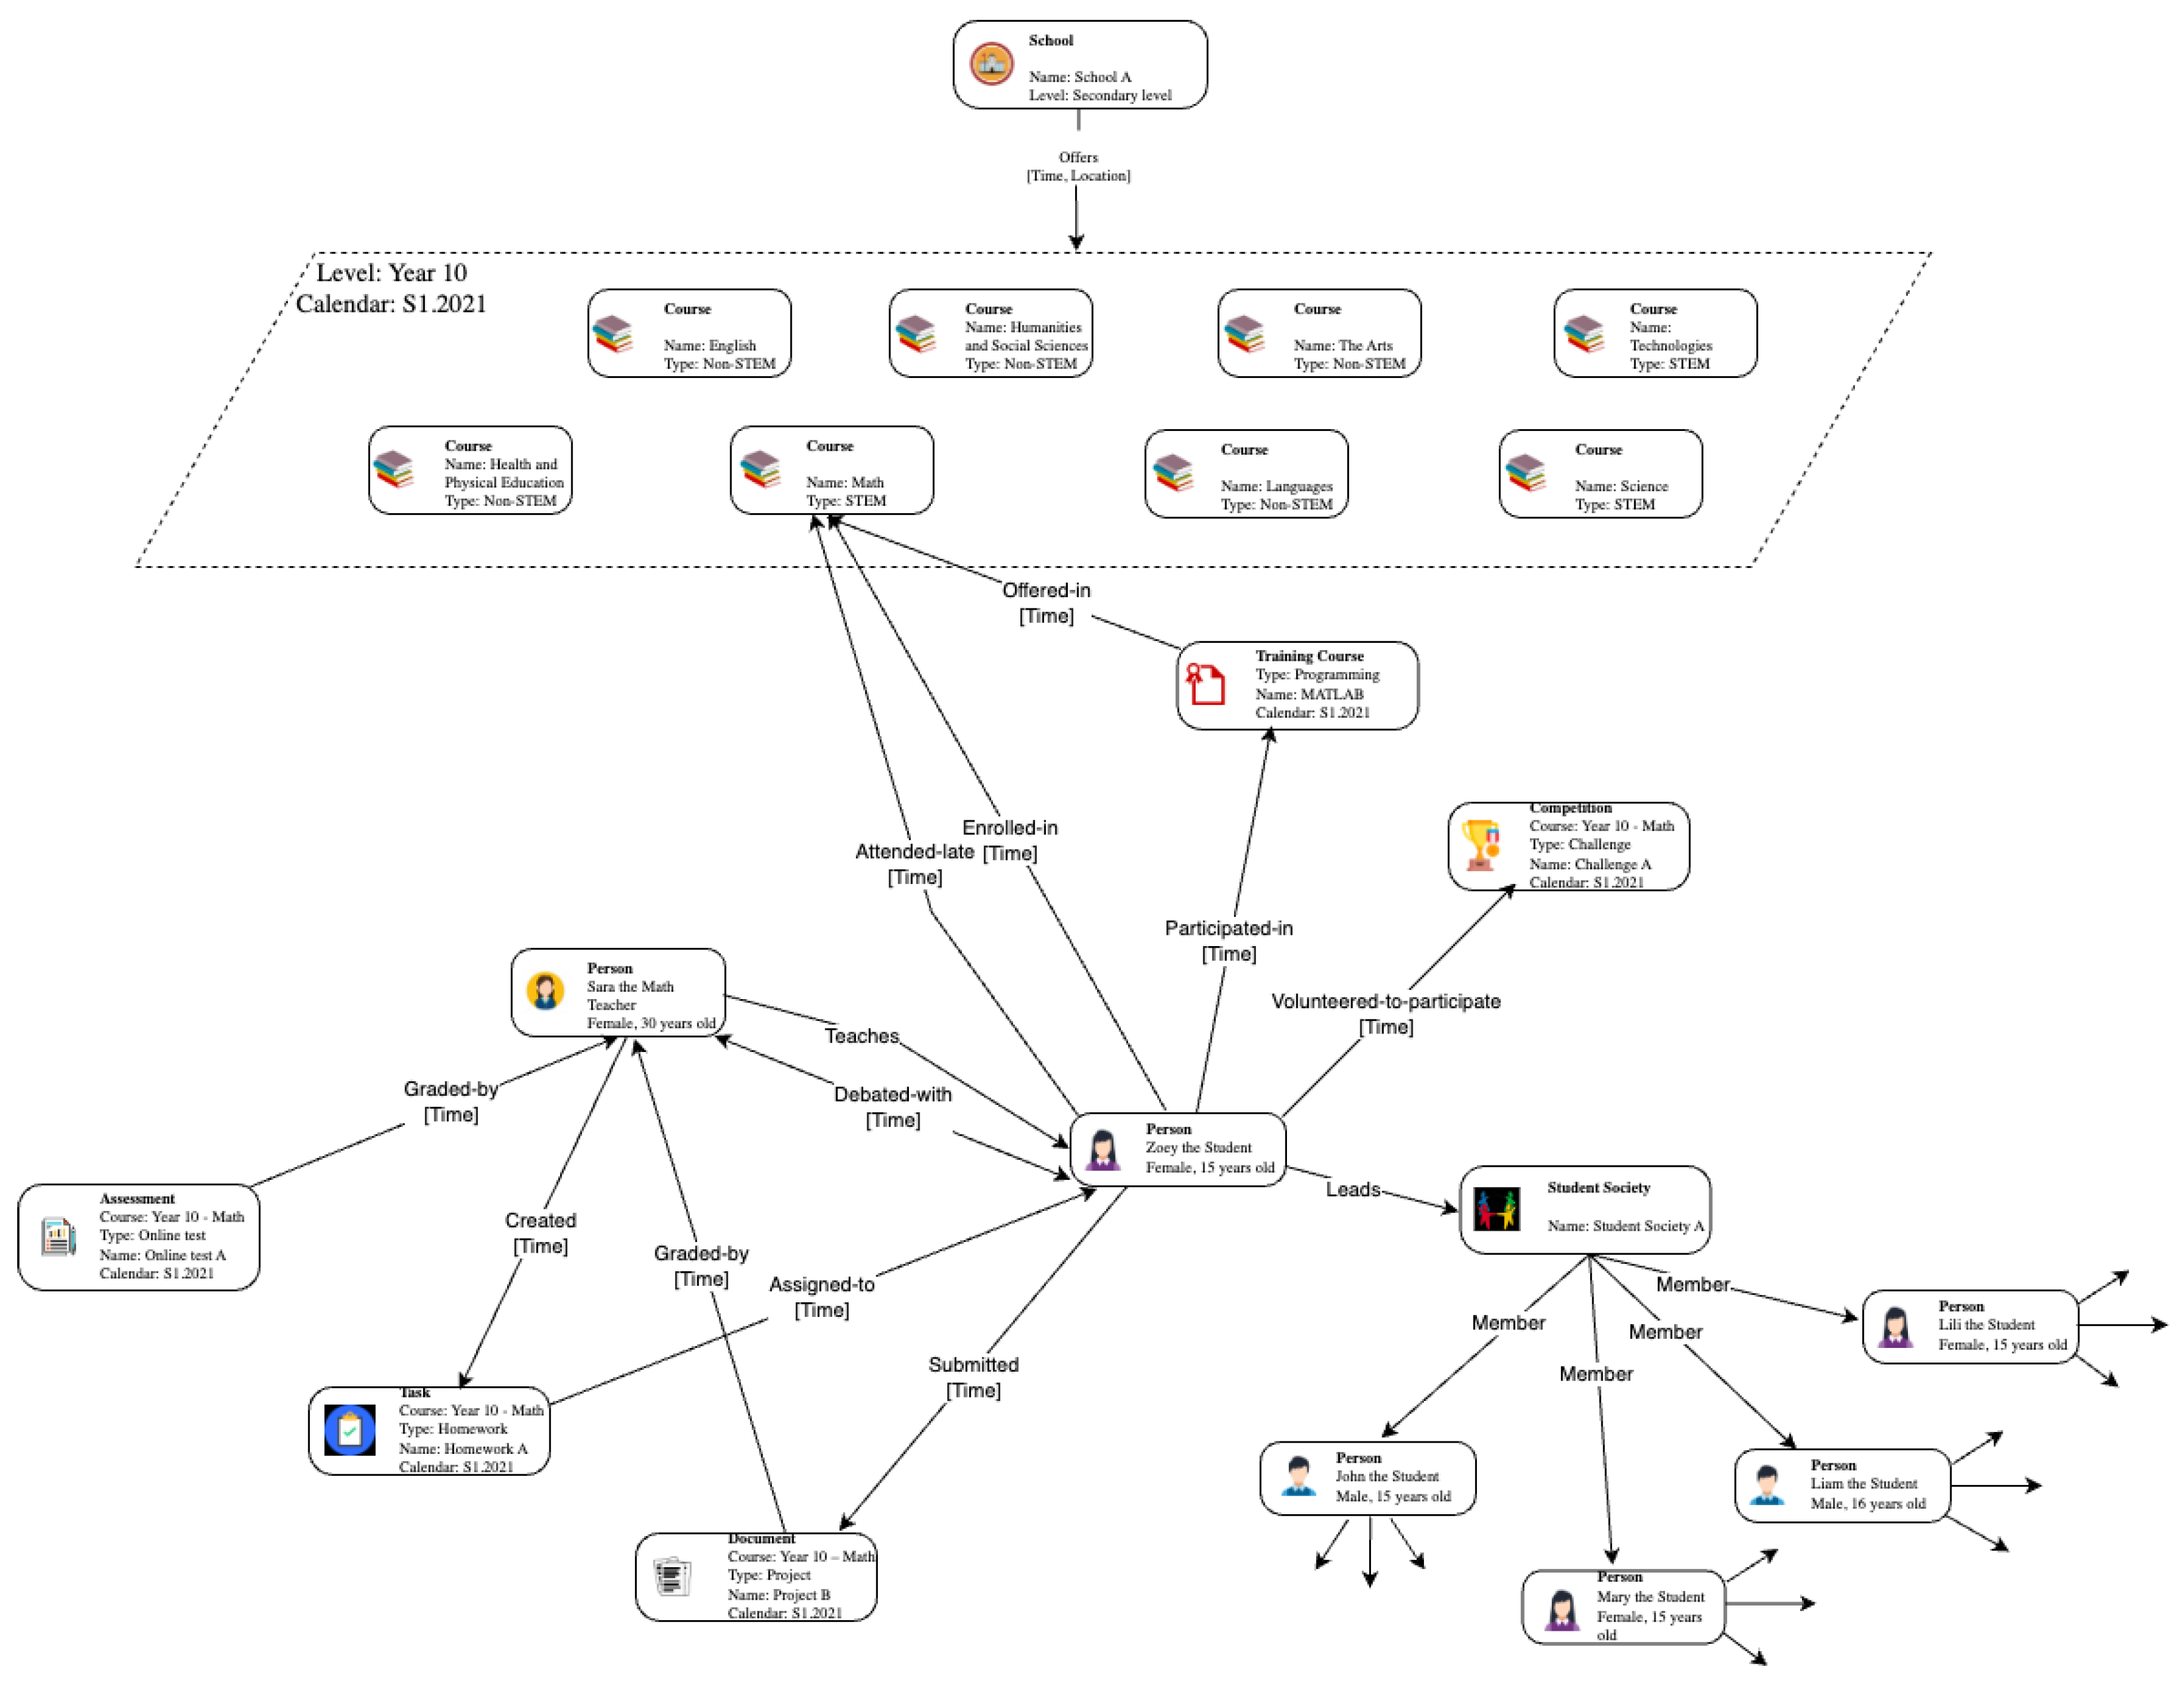
4.1.2. Use Case 2: Educational Knowledge Graph

As explained in Section 3.4, an RDF graph was built from the extracted features. The graph consists of two components, entity and relationship, which together create triples of instances. The entities are real-world objects with a distinctive physical (e.g., a teacher, a student) and conceptual (e.g., a course, a task) identity that distinguishes them from other objects. They are defined by a set of attributes, e.g., name, age, gender, nationality, and student ID. In our scenario, entities have name types such as School, Person, Course, Training Course, Competition, Assessment, Question Block, Tool, Document, Task, Student Society, Time, Typography Error, Assessment Score, Word-count, Keyword, and Sentiment Analysis.
Relationships that are directed links between entities can be defined by a predicate based on the attributes of the entities. Different types of triples that are shown in Figure 4 are described as follows:
  • Course taught by [ Timestamp ] Person: States that a course (e.g., Math) is taught by a person (e.g., a teacher).
  • Person submitted [ Timestamp ] Assignment: States that a person (e.g., a student) submitted his/her assignment (e.g., a homework).
  • Person debated with [ Timestamp ] Person: States that two persons debated.
  • Person volunteered to help [ Timestamp ] Person: States that a person (e.g., a student) volunteered to help another person.
  • Assessment contains QuestionBlock: States that an assessment (e.g., an online math test) contains a question block (e.g., fill-in question, multiple choice).
  • Assessment graded by [ Timestamp ] person: States that an assessment (e.g., an online Math test) is graded by a person (e.g., a teacher).
  • QuestionBlock contains Keyword: States that a question block of an assignment (e.g., a homework) contains desired keywords relevant to the context.
  • Person volunteered to join [ Timestamp ] StudentCommunity: States that a person (e.g., a student) volunteered to join a student community (e.g., Math community of students)
  • QuestionBlock completed in [ Timestamp ] Time: States that a question block of an assessment is completed in a specific amount of time (e.g., 2 min or 120 s).
  • Person volunteered to participate [ Timestamp ] TrainingCourse: States that a person (e.g., a student) volunteered to participate in a training course (e.g., MATLAB programming).

4.1.3. Use Case 3: Linking the Knowledge Base to the Knowledge Graph

We performed a user-guided insight discovery task to analyze the knowledge graph and identify creativity patterns related to each student node. In this step, we linked the extracted features to the concepts of creativity in the eKB. To this end, we received help from educational experts and defined a set of rules for each pattern to guide the process of finding related subgraphs. For example, three extracted subgraphs and related rules are depicted in Figure 5.

4.2. Dataset

We used a Kaggle public educational dataset (https://www.kaggle.com/aljarah/xAPI-Edu-Data) (accessed on 15 March 2023), which is gathered via a learner activity tracker tool (xAPI). The xAPI is a part of the Training and Learning Architecture (TLA) that allows tracking of the learners’ progress and activities, such as reading, watching, and viewing learning materials. The dataset contains information about 480 students with 16 features which are divided into three groups: (1) Academic background features such as educational level, section, and stage; (2) Behavioral features including the number of raised hands in class, involved discussions, and visiting resources; and (3) Demographic features such as nationality, gender, and age.
The dataset is composed of 175 females and 305 males between 7 and 18 years of age. The students are from various countries (e.g., USA, Morocco, Iran, and Venezuela) with different backgrounds and levels of education. The data was gathered over the course of two academic semesters and contains a school attendance feature, in which students are divided into two groups based on the number of days they are absent (under seven days and above seven days). This dataset also includes features related to students’ behavior in the class (e.g., raising a hand, discussion, and visiting resources) in different courses (e.g., IT, Maths, English) during a semester. Based on their overall mark, students are divided into three numerical ranges: Low-Level (marks between 0 to 69), Middle-Level (marks between 70 to 89), and High-Level (marks between 90 to 100).

4.3. Experimental Setting

The experiments were performed on two platforms: Google Colab and GraphDB graph database. We used Python 3.10.0, Pandas 1.3.4, Neworkx 2.6.2, and rdflib 6.0.1 for building the RDF. The .ttl (Turtle RDF graph) version of the graph model was then imported to the GraphDB environment to perform SPARQL queries.

4.4. Experimental Results

Preprocessing and Feature Selection

After importing the mentioned dataset into our database, we performed some preprocessing tasks such as data cleaning, removing noisy inputs to avoid errors, and renaming the column names and instances to make the graph and queries more readable. Then we selected the features that are most relevant to our approach such as the number of Raised hands, Visiting learning materials, Visiting announcements, Participating in debates, Absence days, and their Scores in different semesters. Figure 6 shows the first five rows of the selected features. Since the data is anonymized, the students are identified by numbers and indexes.

4.5. Building the Knowledge Graph

The next step is to build an RDF graph out of the selected features with their relevant attributes (e.g., Gender, Place of birth, and Grade). The entities and relationships of the RDF subgraph are listed as follows (for Student1):
  • @prefix ns1: <http://www.example.org/>.
  • ns1:Student1 ns1:AnnouncementsView 2;
  • ns1:Student1 ns1:Discussion 20;
  • ns1:Student1 ns1:EnrolledIn ns1:IT;
  • ns1:Student1 ns1:Score ns1:Middle-Level;
  • ns1:Student1 ns1:Semester ns1:Semester1;
  • ns1:Student1 ns1:StudentAbsenceDays ns1:Under-7;
  • ns1:Student1 ns1:VisITedResources 16;
  • ns1:Student1 ns1:raisedhands 15.
The completed graph is then saved in .ttl format to be imported into a graph database. To query this huge graph, we make use of SPARQL queries to organize the data and extracted features.

4.6. Linking the Graph to the KB

To link the constructed RDF graph to the Educational KB (as explained in Section 4.1), we define a set of rules to be implemented on top of the RDF graph repository. As a result, students that follow the rules are shown in the result of the queries.
For instance, three rules are applied across the graph, including those about brainstorming, having a great memory, and a lack of motivation. Brainstorming is a concept related to the “Using Wide Categories” concept under “General cognitive thinking skill”. A strong memory is also a concept related to the “Strong Memory” concept under “General cognitive thinking skill”. Furthermore, Motivation is the central concept of creativity that can be found in the creativity hierarchy under the name of “Intrinsic Motivation”.
The related SPARQL queries with their node results are shown in Figure 7. The queries are specifically looking for creative students enrolled in the Math class in Middle School during either semester 1 or 2. As you can see, only four students showed the pattern of “Strong Memory” in their behavior. This rule involves the students’ marks and the number of visiting resources. Students who gained high marks in their assessments and visited resources lower than 20 times (in comparison with others) during a semester are considered to have a strong memory. It is specifically important in Math, Science, and IT courses.
Ten students showed the pattern of “Using Wide Categories” in their behavior. This rule involves the number of asking questions and discussions in groups. Moreover, two students did not show a pattern of “Motivation” in their behavior. This rule involves attending classes and viewing announcements to participate in different events.
The integer values that are considered in the queries are all derived from the education experts’ deduction of the students’ comparable metrics.

5. Evaluation

To evaluate the correctness of the model, we carried out a user study. In this study, we tried to validate the following hypotheses:
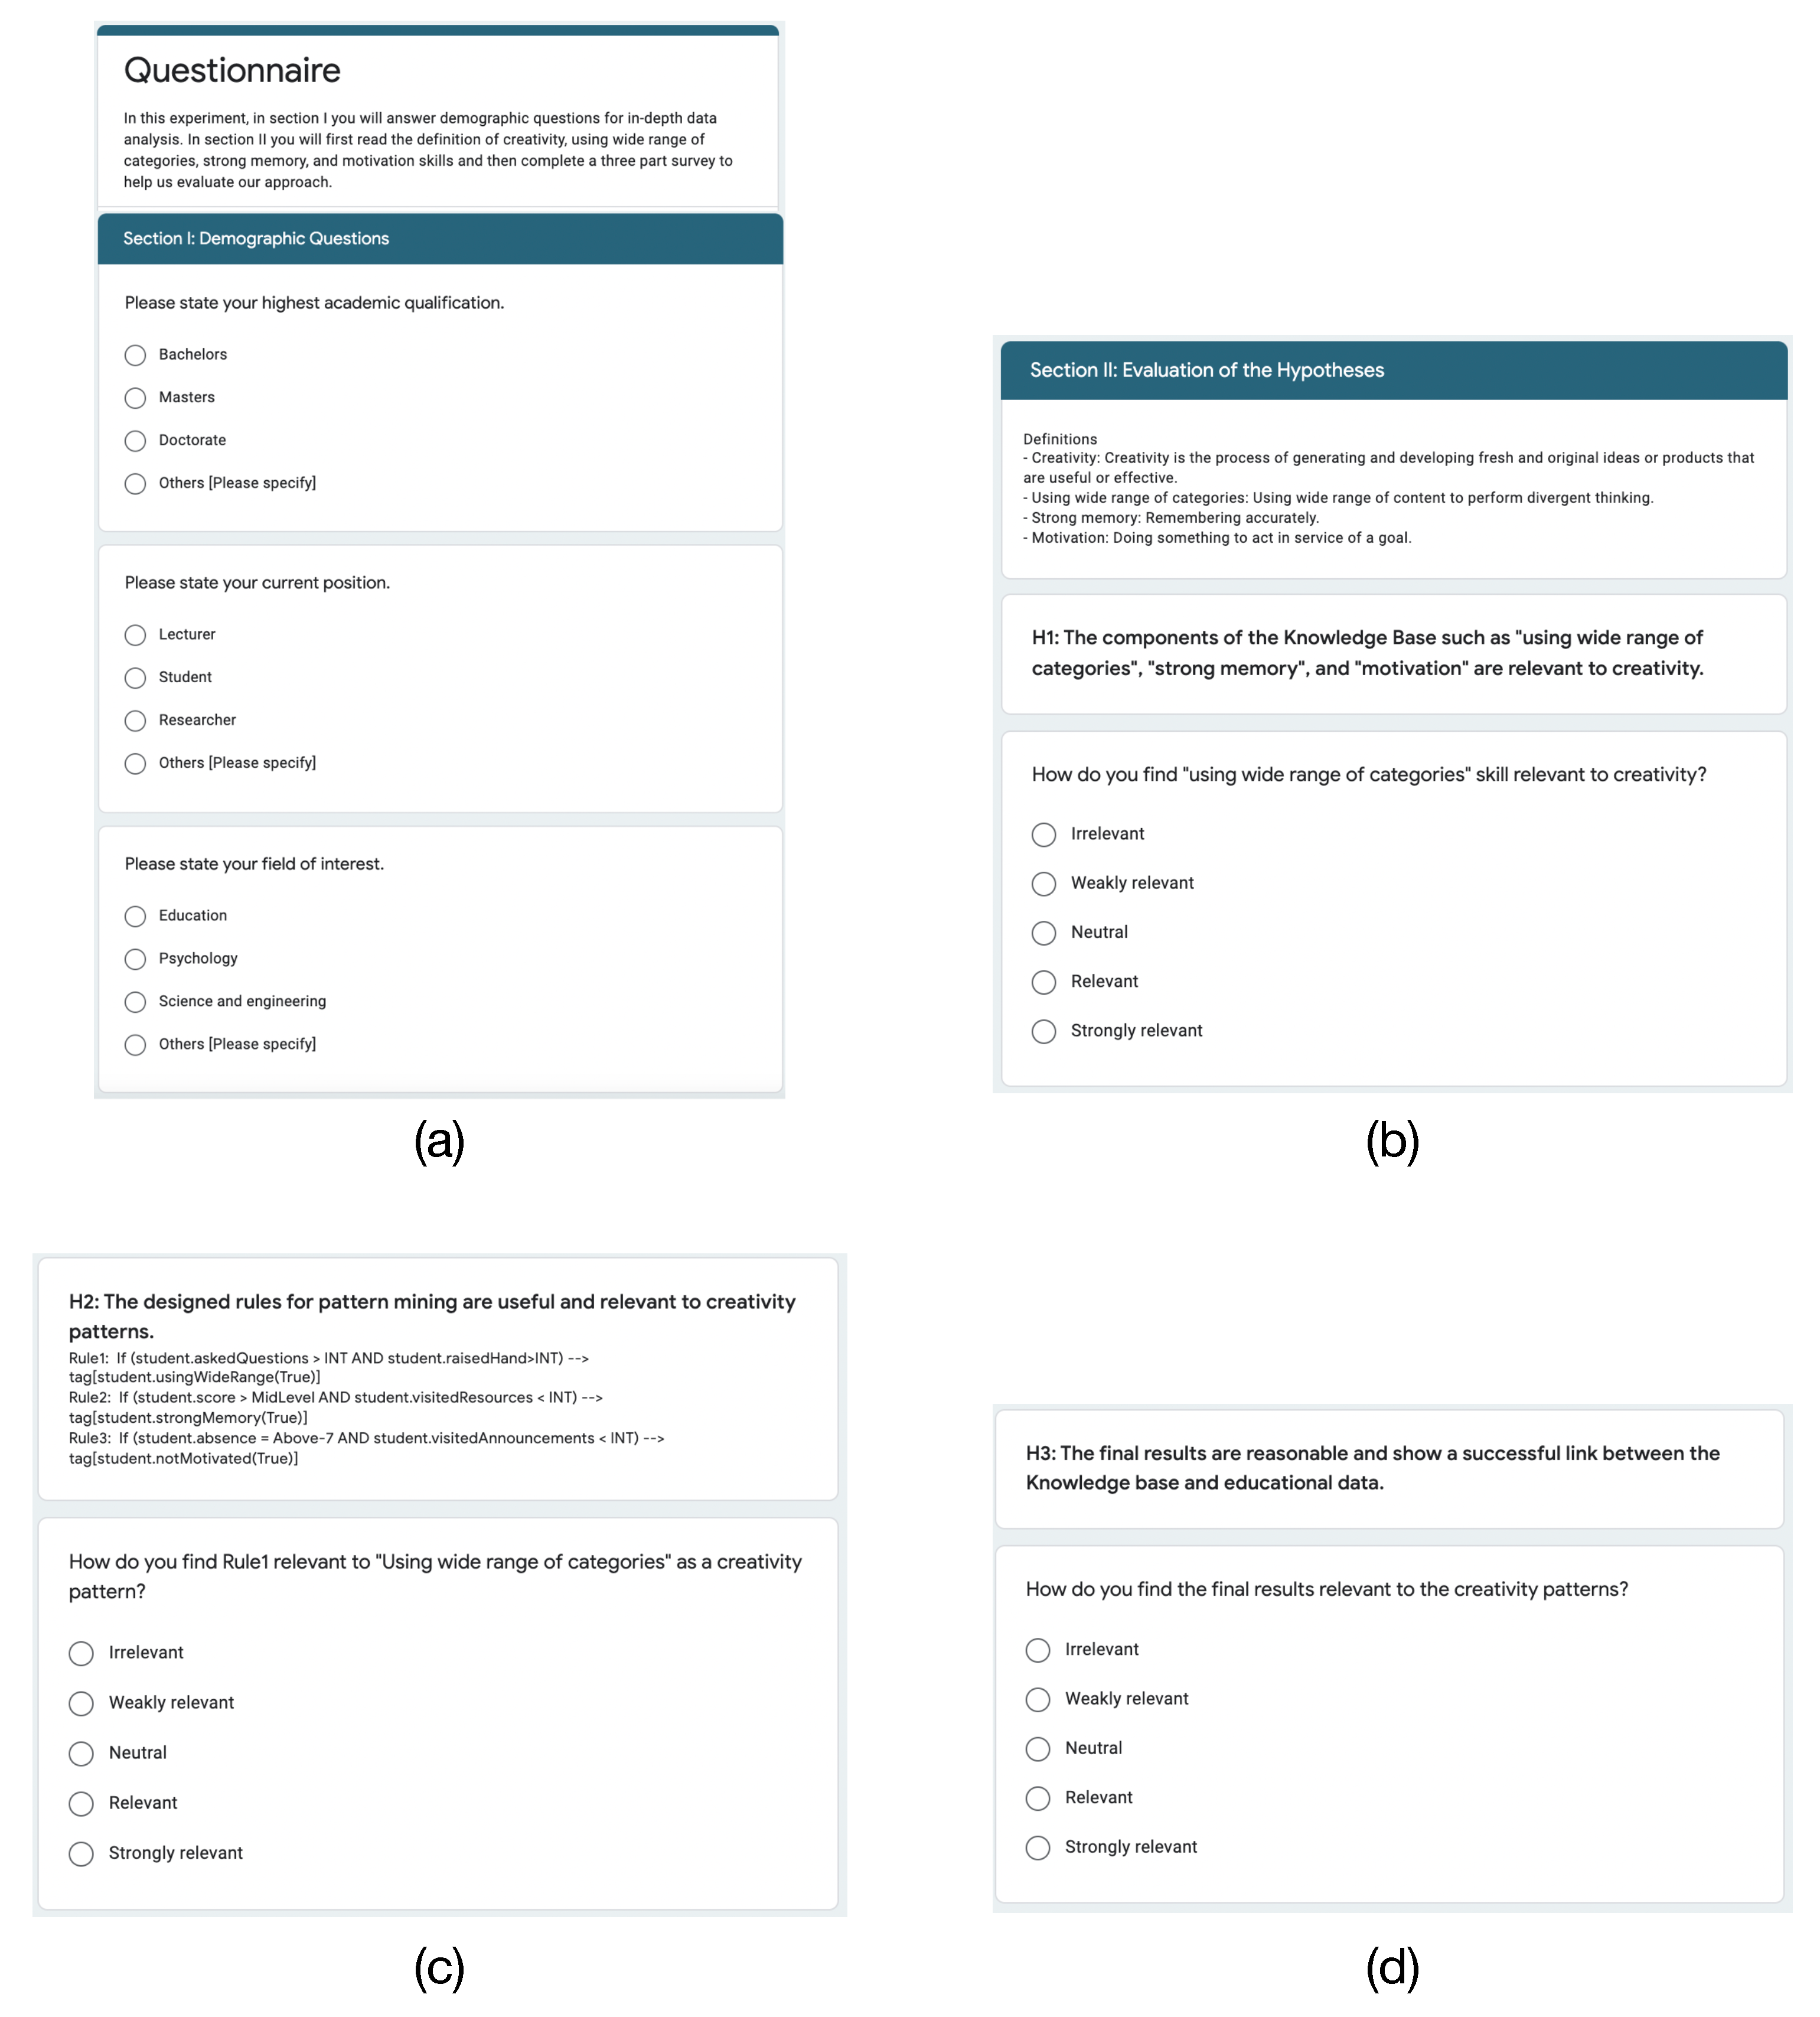
  • H1: The components of the KB are relevant to creativity.
  • H2: The designed rules for pattern mining are useful and relevant to creativity patterns.
  • H3: The query results are reasonable and show a successful link between the KB and educational data.

5.1. Experiment Setup

The experiment was done in a controlled environment to examine our approach. The participants were mostly chosen among academics and students doing research at a research lab with different backgrounds. Hence, among 10 participants, some had strong knowledge in education and cognitive science, some had computing domain expertise, and others had both. This diversity of participants allowed for a broader range of perspectives and opinions to be brought to the study, which can help to make the findings more robust and generalizable to a wider population. Additionally, the use of participants with different backgrounds can help to identify any potential limitations or biases that might be present in the approach being studied.
We first instructed participants about the educational motivating scenario and demonstrated the functionality of the model through a presentation in the following order:
  • Imitating the Knowledge of Educational Experts: We first underlined the importance of building the KB and how this helped us to link related information in the educational data and components of creativity in education.
  • Data Contextualization: We explained how using existing data curation techniques helped us create enriched-contextualized data and knowledge.
  • Linking Data and Finding Patterns: We presented a fragment of the data in a visualized graph-based format to be easily understood. We also demonstrated the results and implemented the defined rules for each creativity pattern.

5.2. Questionnaire

We prepared a questionnaire and shared it with the participants to examine the study’s hypotheses. The questionnaire consisted of four parts having multiple choice questions and participants were instructed to only choose one option based on their interpretation. With each of the participants, we asked them to rate the relevancy of the hypotheses using a Likert scale system which uses a five-point scale to allow the participant to express their opinion (5: Strongly relevant, 4: Relevant, 3: Neutral, 2: Weakly relevant, 1: irrelevant).
The first part of the questionnaire was about participants’ demographic and background information and the rest was designed to evaluate the H1, H2, and H3 hypotheses. The questionnaire was designed via Google Forms and a few snapshots can be found in Figure 8 for evaluating the “Using Wide Categories” creativity pattern. In this survey, we provided definitions and hints for the participants and guided them through the whole process.

5.3. Experiment Results

The results of the evaluation can be seen in Figure 9:
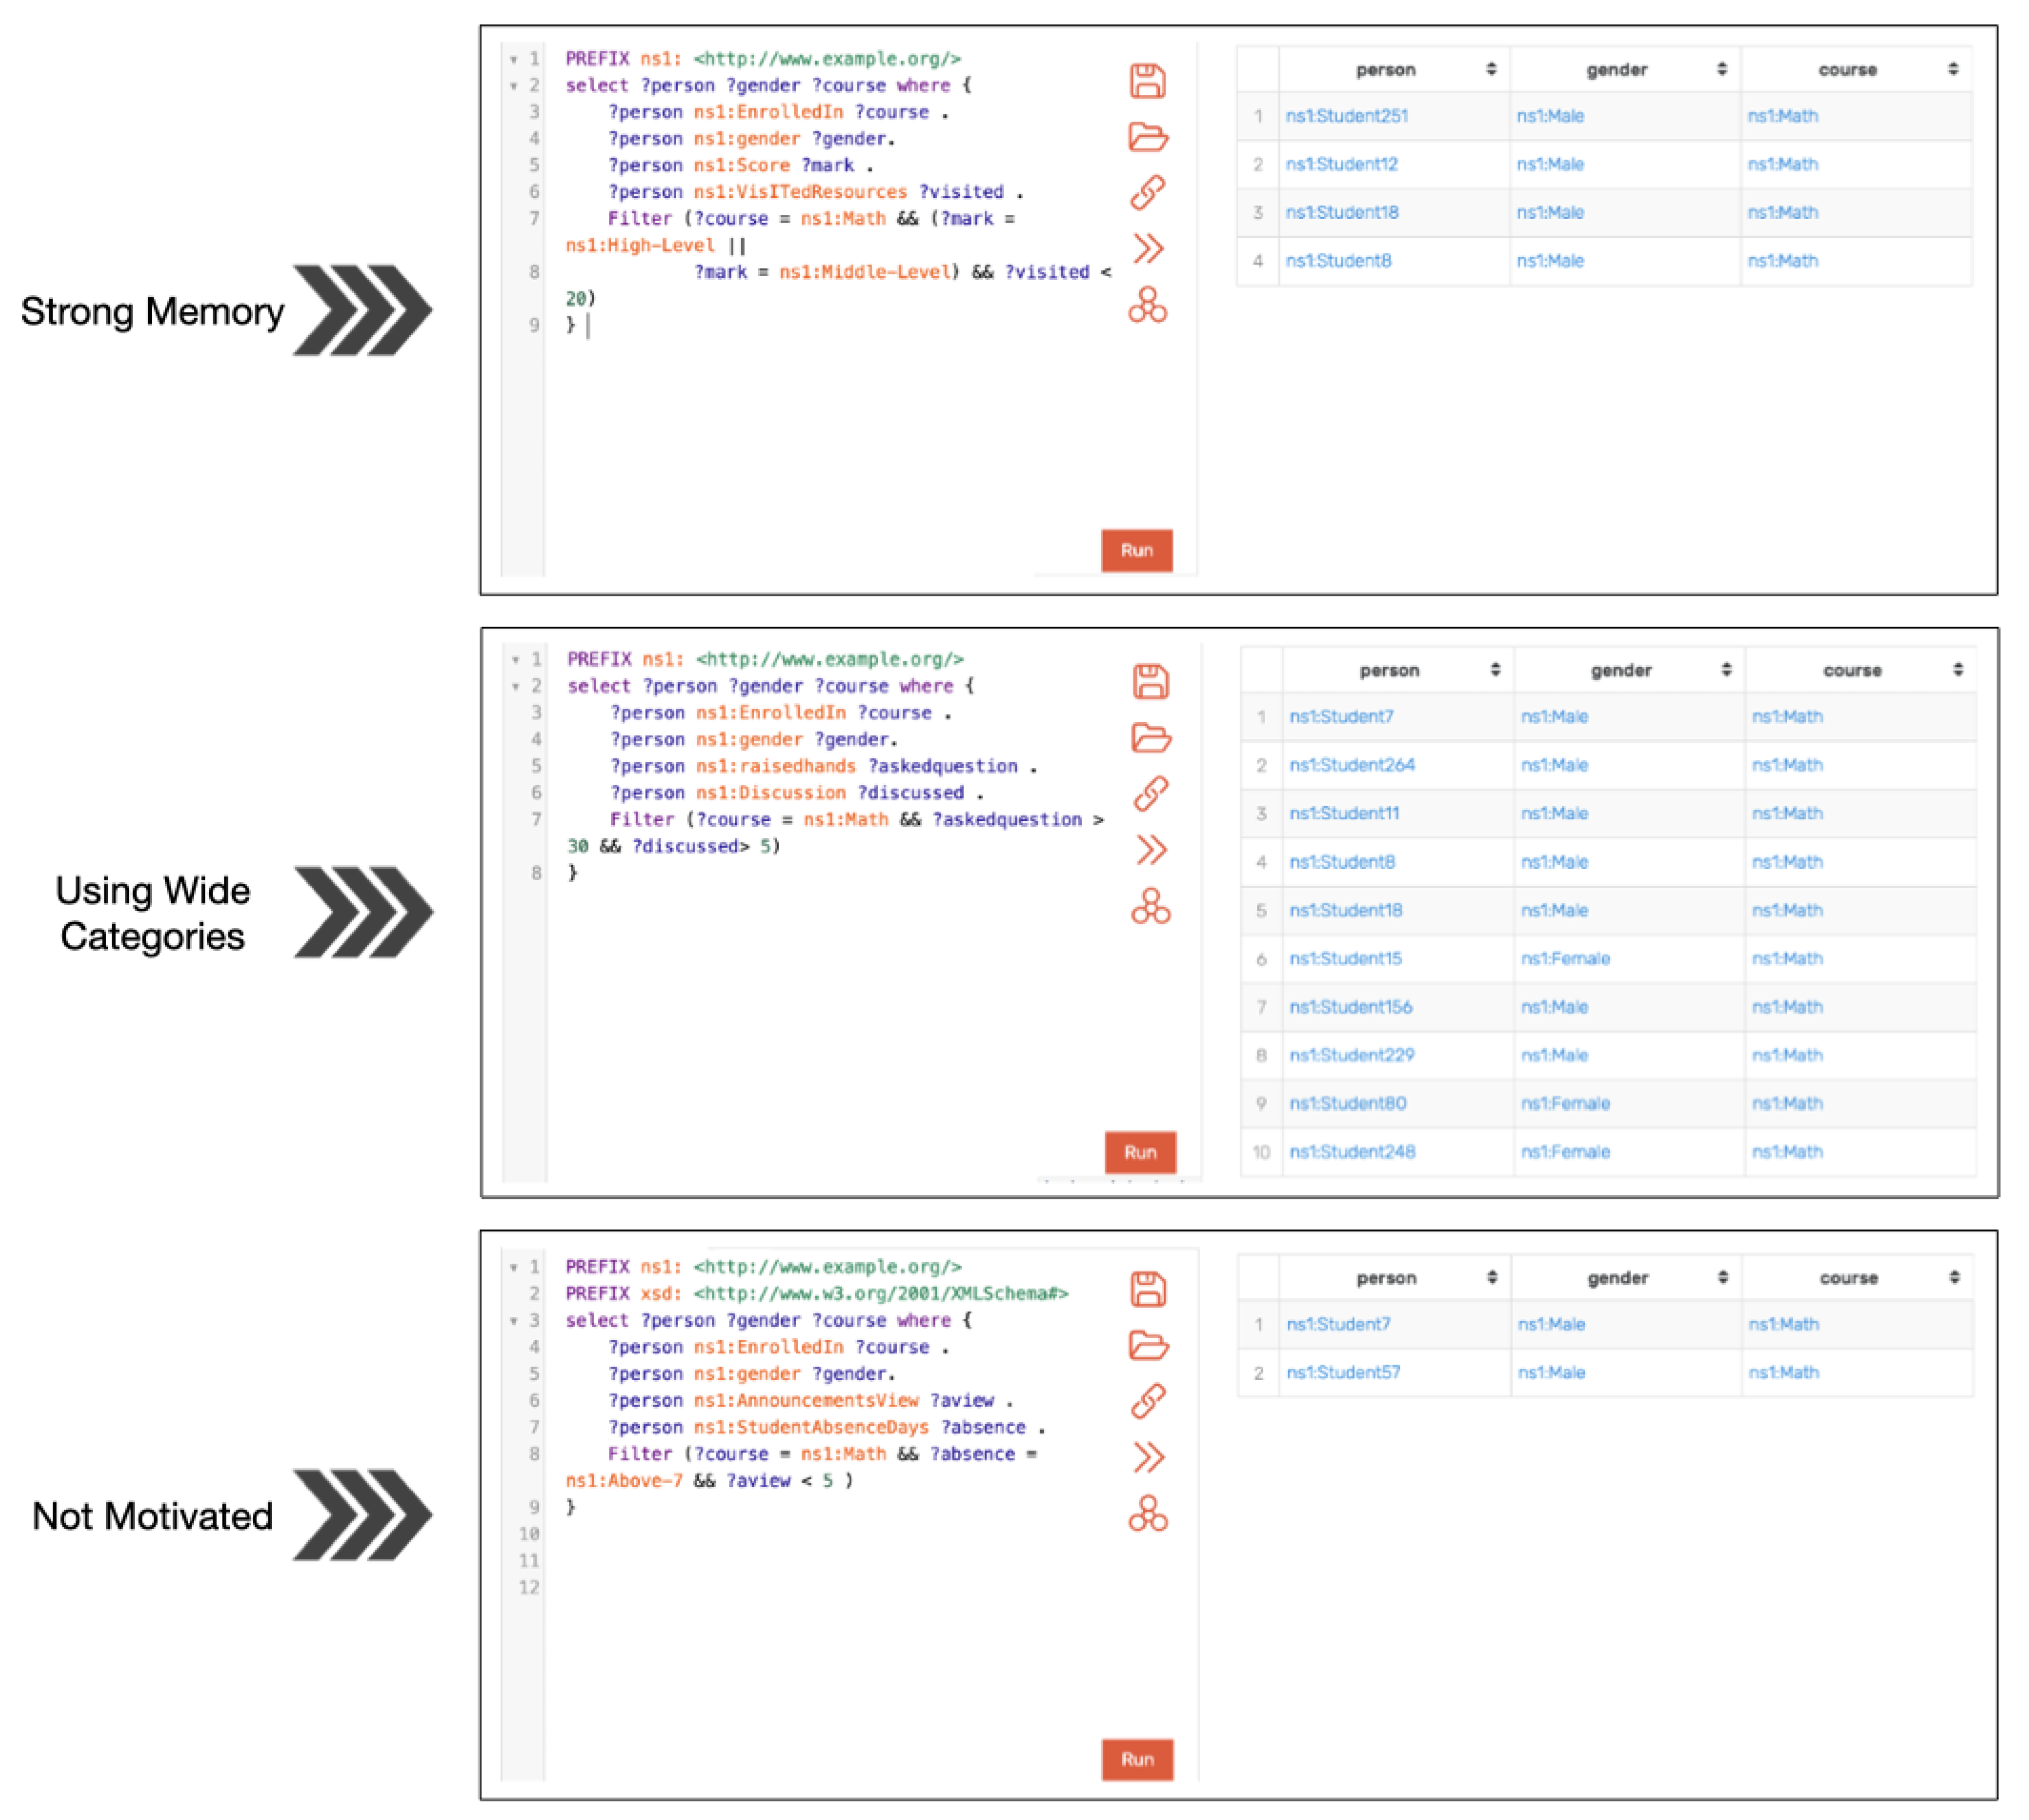
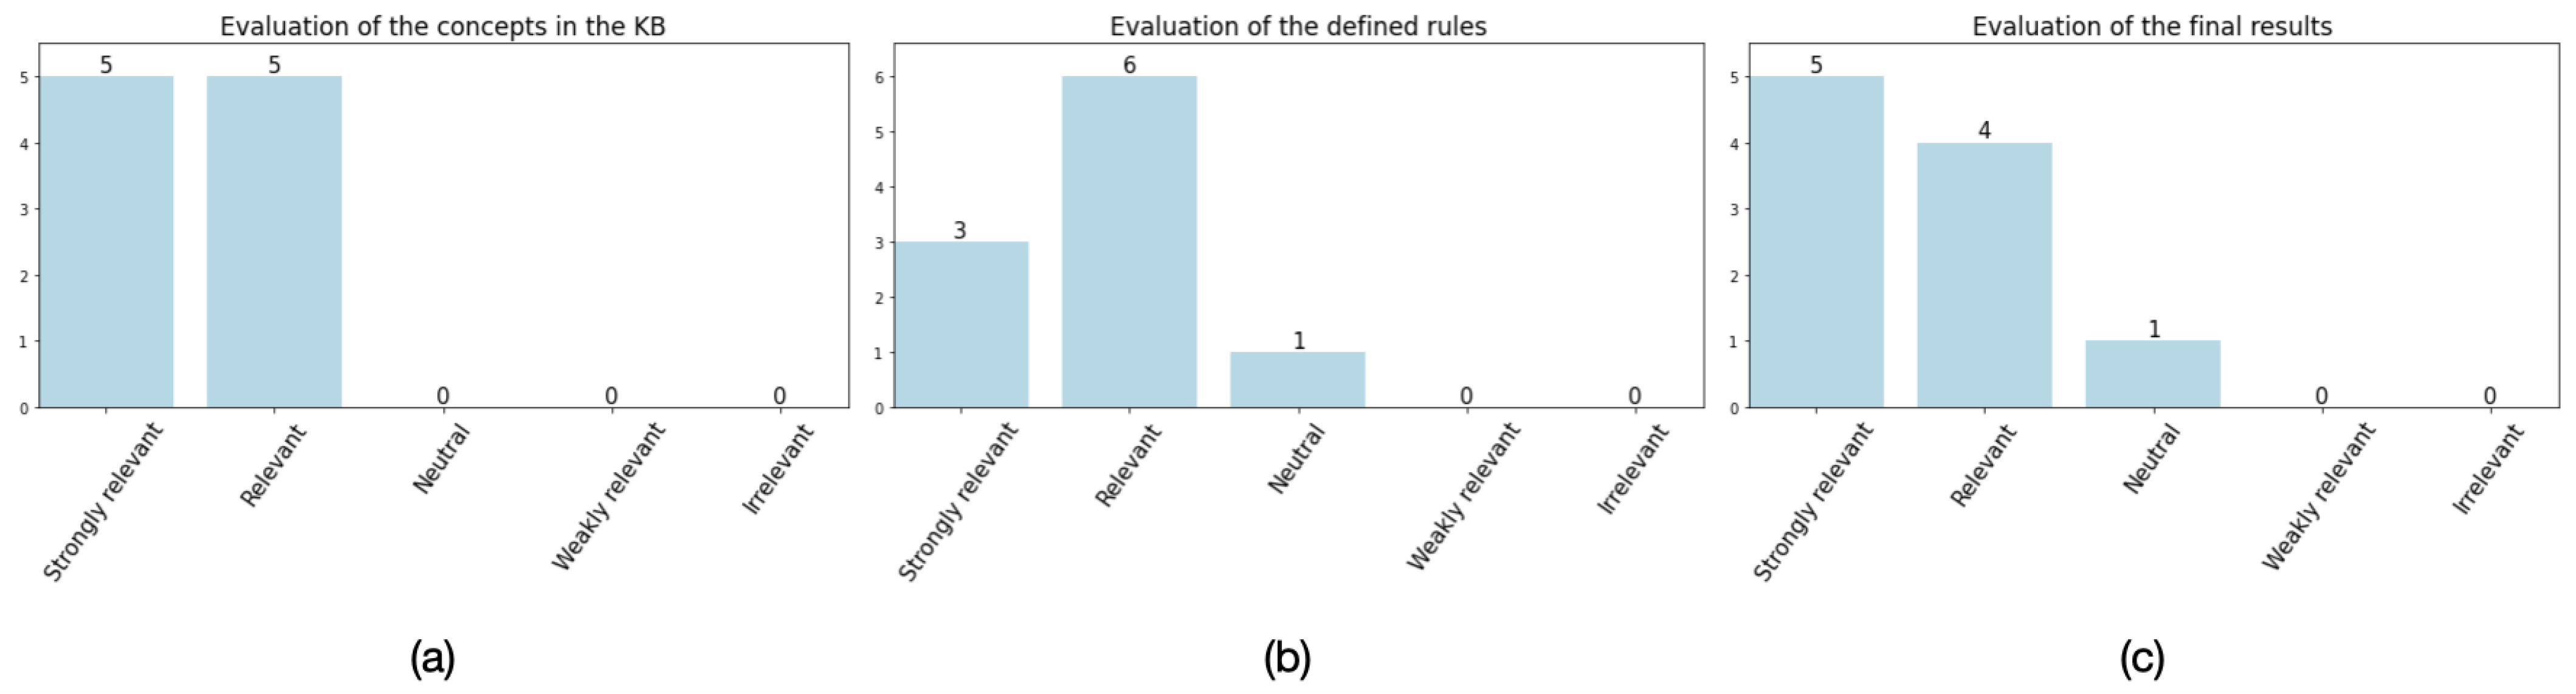
  • Evaluation of H1: H1 assumes that the components of the KB are relevant to creativity. Figure 9a indicates that overall all the participants found that the linked concepts in the KB are relevant to creativity as a skill in education. Concepts such as “Using Wide Categories”, “Strong Memory”, and “Motivation” have been investigated and rated by participants. All the participants found the concepts either strongly relevant or relevant to creativity.
  • Evaluation of H2: H2 states that the designed rules for pattern mining are useful and relevant to creativity patterns. Figure 9b indicates that overall all the participants except one found the rules relevant to “Using Wide Categories”, “Strong Memory”, and “Motivation” concepts in the taxonomy. Except for one, all the participants found the rules either strongly relevant or relevant to creativity.
  • Evaluation of H3: H3 supposes the results of the query are reasonable and show a successful link between the KB and educational data. Figure 9c indicates that, overall, all the participants except one found that the model was successful in detecting those creativity patterns in the students. Except for one, all the participants found the results either strongly relevant or relevant to creativity.

5.4. Discussion

The results suggest that the application of the rules to the RDF graph repository can effectively identify creative students in a specific class and semester. Furthermore, the specific rules related to cognitive thinking skills and intrinsic motivation can provide insight into the characteristics of creative students in the educational domain. However, it is important to note that the results are based on specific metrics derived from the education experts’ deductions and may not be generalizable to other domains or contexts.
Overall, the results section of the paper provides valuable information on the implementation and effectiveness of the rules in identifying creative students in the educational domain. Further discussion and interpretation of the results can provide insights into the characteristics of creative students and inform future research and educational practices.
There are a few challenges towards the validity of the results; hence, the findings of our study may not be regarded as definitive. They do, however, hint at a number of trends:
  • The findings of the user study support hypotheses H1, H2, and H3. However, regarding H2, the rule-based pattern mining techniques require future improvement to gain a higher score in the evaluation.
  • The assigned timeframe for training the most of participants seems to be adequate except for two with no background in computing and education. Eight out of ten participants successfully completed all four sections of the questionnaire in less than half an hour. Those participants with other backgrounds struggled to understand the related concepts and technical concepts. Hence, the training should be improved for future study cases.
  • Based on our findings, mainly education experts with knowledge, expertise, and interest in education and computing found our approach valid and confirmed the hypotheses.
Hence, based on the participants’ feedback and the lessons learned, some future improvements could be considered for the approach. The motivation of participants, time pressure and training, and definition of the rules are important indicators that have a significant impact on the final evaluation results. In addition, we elaborated on implementing the knowledge of experts in the field and evaluating the correctness of the results relied on their opinion. However, in order to improve the evaluation, it is suggested to carry out a well-established traditional creativity assessment (e.g., the Torrance test) and compare the results with the current study. As future work, we intend to provide such an environment and compare the outcomes.

6. Conclusions and Future Work

Creativity is becoming a priority in the educational sector as it promotes cognitive complexity. Creativity requires extensive knowledge as well as the ability to use it effectively. Being creative entails experimenting with new possibilities in the pursuit of desired outcomes utilizing an existing set of knowledge or skills in a specific subject or setting. It takes time to develop and the process is more effective if students have certain knowledge and skills. The education system must provide both policy and educational methods to support students in gaining the required knowledge in their field of study. Teachers here can support creativity in their students by considering the ways that help students use their knowledge and come up with creative products. In the creative process, students require ongoing guidance and training. However, before providing personalized training, it is needed to first detect creativity patterns in students.
In this study, a data-driven technique is provided to relate students’ behavior to creative thinking patterns and assist instructors to understand them from students’ activities and assessment tasks. We concentrated on understanding the big educational data, used existing data curation techniques to turn the raw educational data into contextualized data and knowledge, built a domain-specific KB by leveraging the knowledge of education experts, and linked the contextualized data to the KB using a rule-based technique. As a result, we facilitated mining creative thinking patterns from contextualized data and knowledge and made it possible for educators to find students with creative thinking patterns. We also evaluated our approach through a user study, relying on the knowledge of education experts. Regarding the information provided in this study, several strategies might be used to enhance the performance of the proposed method. This section lays out a plan to identify how these strategies may impact the system’s performance in the future, as well as how they could be applied to the application of pattern mining within the education sector.

6.1. Artificial Intelligence (AI)

A potential future work for this research could be to explore the use of Generative Artificial Intelligence (AI) to enhance the identification and mining of creativity patterns from educational big data. This could involve developing new models and algorithms that leverage the power of Generative AI to generate novel and valuable ideas by analyzing large amounts of educational data. Another potential direction for future research could be to investigate the impact of integrating Generative AI-based creativity tools and techniques into the classroom on student motivation, engagement, and learning outcomes. Furthermore, exploring the ethical implications and challenges associated with the use of Generative AI in education could also be a valuable area of investigation for future work.

6.2. Designing a Framework for Continuous Monitoring of Students’ Performance

As students’ attributes and features change over time, it is crucial for educators to have a framework in place to track and monitor their performance. Attributes such as age, level, grade, attendance, participation in discussions, scores, and volunteering can significantly impact a student’s progress. To ensure that educators can detect any changes in patterns, it is necessary to have a dashboard that considers all relevant features over time. This dashboard can generate alerts that notify educators when action is needed. By visualizing the student’s profile, educators can track their progress, behavior, and performance, and plan their education accordingly.

6.3. Using Association Rule Mining to Discover Relationships among Educational Features

Utilizing the associate rule mining technique can help reveal the relationships among educational features and uncover patterns, correlations, or commonalities among groupings of components or items in educational datasets. As a next step, we plan to implement the associate rule mining technique to identify significant relationships among important features in the process of identifying creativity patterns. This approach can automate the creation of rules and minimize the need for manual efforts.

6.4. Exploring Key Patterns of Creativity

In this study, we focused on identifying three patterns of creativity: “using a wide range of categories”, “strong memory”, and “motivation”. However, to comprehensively evaluate students’ creativity, it is essential to investigate other key patterns as well. These include “self-esteem”, “social poise”, and “suspend judgment”. To complete our investigation, we plan to expand our model and improve data integration. This will allow us to identify and evaluate these patterns of creativity more effectively.

Author Contributions

Conceptualization, N.S. and A.B.; methodology, N.S. and A.B.; validation, N.S. and M.B.;data curation, N.S.; writing—original draft preparation, N.S.; writing—review and editing, A.B., H.F., M.B., M.G. and H.A.-R.; visualization, N.S.; supervision, A.B. and H.F. All authors have read and agreed to the published version of the manuscript.

Funding

This research received no external funding.

Institutional Review Board Statement

Not applicable.

Informed Consent Statement

Not applicable.

Data Availability Statement

Not applicable.

Acknowledgments

We acknowledge the the Centre for Applied Artificial Intelligence (https://www.mq.edu.au/research/research-centres-groups-and-facilities/centres/centre-for-applied-artificial-intelligence) (accessed on 15 March 2023) for funding this research.

Conflicts of Interest

The authors declare no conflict of interest.

References

  1. Hwang, Y. Adoption of Big Data in Higher Education for Better Institutional Effectiveness. Am. J. Creat. Educ. 2019, 2, 31–44. [Google Scholar] [CrossRef]
  2. Torrance, E.P. Predictive validity of the torrance tests of creative thinking. J. Creat. Behav. 1972, 6, 236–252. [Google Scholar] [CrossRef]
  3. Miller, A.L. A self-report measure of cognitive processes associated with creativity. Creat. Res. J. 2014, 26, 203–218. [Google Scholar] [CrossRef]
  4. Henriksen, D.; Mishra, P.; Mehta, R. Novel, effective, whole: Toward a NEW framework for evaluations of creative products. J. Technol. Teach. Educ. 2015, 23, 455–478. [Google Scholar]
  5. Beaty, R.E.; Johnson, D.R. Automating creativity assessment with SemDis: An open platform for computing semantic distance. Behav. Res. Methods 2021, 53, 757–780. [Google Scholar] [CrossRef]
  6. Diana, N.; Eagle, M.; Stamper, J.; Grover, S.; Bienkowski, M.; Basu, S. An instructor dashboard for real-time analytics in interactive programming assignments. In Proceedings of the Seventh International Learning Analytics & Knowledge Conference, Vancouver, BC, Canada, 13–17 March 2017; pp. 272–279. [Google Scholar]
  7. Baker, R. Data Mining. In International Encyclopedia of Education, 3rd ed.; Peterson, P., Baker, E., McGaw, B., Eds.; Elsevier: Oxford, UK, 2010; pp. 112–118. [Google Scholar] [CrossRef]
  8. Romero, C.; Ventura, S. Educational data mining and learning analytics: An updated survey. Wiley Interdiscip. Rev. Data Min. Knowl. Discov. 2020, 10, e1355. [Google Scholar] [CrossRef]
  9. Laili, R.N.; Nashir, M. Higher education students’ perception on online learning during COVID-19 pandemic. Edukatif J. Ilmu Pendidik. 2021, 3, 689–697. [Google Scholar] [CrossRef]
  10. Syafnan, S.; Ritonga, M.; Lubis, F.S. Student Perception of the Online Lecture System during the COVID-19 Period. J. Innov. Educ. Cult. Res. 2022, 3, 80–85. [Google Scholar] [CrossRef]
  11. Shabani, N.; Beheshti, A.; Farhood, H.; Bower, M.; Garrett, M.; Rokny, H.A. iCreate: Mining Creative Thinking Patterns from Contextualized Educational Data. In Proceedings of the International Conference on Artificial Intelligence in Education; Springer: Berlin/Heidelberg, Germany, 2022; pp. 352–356. [Google Scholar]
  12. Baradwaj, B.K.; Pal, S. Mining educational data to analyze students’ performance. arXiv 2012, arXiv:1201.3417. [Google Scholar]
  13. Baig, M.I.; Shuib, L.; Yadegaridehkordi, E. Big data in education: A state of the art, limitations, and future research directions. Int. J. Educ. Technol. High. Educ. 2020, 17, 44. [Google Scholar] [CrossRef]
  14. Cantabella, M.; Martínez-España, R.; Ayuso, B.; Yáñez, J.A.; Muñoz, A. Analysis of student behavior in learning management systems through a Big Data framework. Future Gener. Comput. Syst. 2019, 90, 262–272. [Google Scholar] [CrossRef]
  15. Chaurasia, S.S.; Kodwani, D.; Lachhwani, H.; Ketkar, M.A. Big data academic and learning analytics: Connecting the dots for academic excellence in higher education. Int. J. Educ. Manag. 2018, 32, 1099–1117. [Google Scholar] [CrossRef]
  16. Petrova-Antonova, D.; Georgieva, O.; Ilieva, S. Modelling of Educational Data Following Big Data Value Chain. In Proceedings of the CompSysTech’17: 18th International Conference on Computer Systems and Technologies, Ruse, Bulgari, 23–24 June 2017; Association for Computing Machinery: New York, NY, USA, 2017; pp. 88–95. [Google Scholar] [CrossRef]
  17. Zhang, M. Internet use that reproduces educational inequalities: Evidence from big data. Comput. Educ. 2015, 86, 212–223. [Google Scholar] [CrossRef]
  18. Ong, V.K. Big data and its research implications for higher education: Cases from UK higher education institutions. In Proceedings of the IEEE 2015 IIAI 4th International Congress on Advanced Applied Informatics, Okayama, Japan, 12–16 July 2015; pp. 487–491. [Google Scholar]
  19. Martínez-Abad, F.; Gamazo, A.; Rodríguez-Conde, M.J. Big Data in Education: Detection of ICT Factors Associated with School Effectiveness with Data Mining Techniques. In Proceedings of the TEEM’18: Sixth International Conference on Technological Ecosystems for Enhancing Multiculturality, Salamanca, Spain, 24–26 October 2018; Association for Computing Machinery: New York, NY, USA, 2018; pp. 145–150. [Google Scholar] [CrossRef]
  20. Dinter, B.; Jaekel, T.; Kollwitz, C.; Wache, H. Teaching big data management–an active learning approach for higher education. In Proceedings of the 2017 Pre-ICIS SIGDSA Symposium, Seoul, Republic of Korea, 10–13 December 2017; pp. 1–17. [Google Scholar]
  21. Buffum, P.S.; Martinez-Arocho, A.G.; Frankosky, M.H.; Rodriguez, F.J.; Wiebe, E.N.; Boyer, K.E. CS principles goes to middle school: Learning how to teach “Big Data”. In Proceedings of the 45th ACM Technical Symposium on Computer Science Education, Atlanta, GA, USA, 5–8 March 2014; pp. 151–156. [Google Scholar]
  22. Freitas, A.; Curry, E. Big Data Curation. In New Horizons for a Data-Driven Economy: A Roadmap for Usage and Exploitation of Big Data in Europe; Springer International Publishing: Cham, Switzerland, 2016; pp. 87–118. [Google Scholar] [CrossRef] [Green Version]
  23. Miller, R.J. Big Data Curation. In Proceedings of the COMAD, Hyderabad, India, 17–19 December 2014; p. 4. [Google Scholar]
  24. Beheshti, A.; Benatallah, B.; Tabebordbar, A.; Motahari-Nezhad, H.R.; Barukh, M.C.; Nouri, R. Datasynapse: A social data curation foundry. Distrib. Parallel Databases 2019, 37, 351–384. [Google Scholar] [CrossRef]
  25. Beheshti, A.; Benatallah, B.; Nouri, R.; Tabebordbar, A. CoreKG: A knowledge lake service. Proc. VLDB Endow. 2018, 11, 1942–1945. [Google Scholar] [CrossRef]
  26. Schleicher, A. Measuring Student Knowledge and Skills: A New Framework for Assessment; ERIC: Paris, France, 1999.
  27. Wang, M.C.; Haertel, G.D.; Walberg, H.J. Toward a knowledge base for school learning. Rev. Educ. Res. 1993, 63, 249–294. [Google Scholar] [CrossRef]
  28. Australian Bureau of Statistics (ABS). Australian Standard Classification of Education (ASCED). 2001. Available online: https://www.abs.gov.au/ (accessed on 15 March 2023).
  29. Bloom, B.S. Taxonomy of educational objectives. Vol. 1: Cognitive domain. N. Y. Mckay 1956, 20, 1. [Google Scholar]
  30. Bloom, B.S. Taxonomy of Educational Objectives: Affective Domain; Krathwohl, D.R., Bloom, B.S., Masia, B.B., Eds.; David McKay: New York, NY, USA, 1964; Volume 2. [Google Scholar]
  31. Amabile, T. Componential Theory of Creativity; Harvard Business School: Boston, MA, USA, 2011. [Google Scholar]
  32. Baer, J.; McKool, S.S. The gold standard for assessing creativity. Int. J. Qual. Assur. Eng. Technol. Educ. 2014, 3, 81–93. [Google Scholar] [CrossRef] [Green Version]
  33. Simsion, G.; Witt, G. Data Modeling Essentials; Elsevier: Amsterdam, The Netherlands, 2004. [Google Scholar]
  34. Teeroovengadum, V.; Kamalanabhan, T.; Seebaluck, A.K. Measuring service quality in higher education: Development of a hierarchical model (HESQUAL). In Quality Assurance in Education; Emerald Group Publishing Limited: London, UK, 2016. [Google Scholar]
  35. Vallerand, R.J.; Ratelle, C.F. Intrinsic and Extrinsic Motivation: A Hierarchical Model. In Handbook of Self-Determination Research; Deci, E.L., Ryan, R.M., Eds.; University of Rochester Press: Rochester, NY, USA, 2002; pp. 37–63. [Google Scholar]
  36. Yu, Y.; Tang, Y. The construction of hierarchical network model and wireless activation diffusion optimization model in English teaching. Eurasip J. Wirel. Commun. Netw. 2020, 2020, 1–14. [Google Scholar] [CrossRef]
  37. Sagan, E.L. A Network Model for Planning and Establishing Higher Education Consortiums; The Ohio State University: Columbus, OH, USA, 1969. [Google Scholar]
  38. Sweet, T.M.; Thomas, A.C.; Junker, B.W. Hierarchical network models for education research: Hierarchical latent space models. J. Educ. Behav. Stat. 2013, 38, 295–318. [Google Scholar] [CrossRef] [Green Version]
  39. Bogdanović, M.; Stanimirović, A.; Davidović, N.; Stoimenov, L. The development and usage of a relational database design tool for educational purposes. In Proceedings of the Informing Science & IT Education Conference (InSITE’08), Varna, Bulgaria, 22–25 June 2008; pp. 251–258. [Google Scholar]
  40. Winer, L.R.; Carrière, M. The use of a relational database in qualitative research on educational computing. In Computer Assisted Learning; Elsevier: Amsterdam, The Netherlands, 1990; pp. 213–220. [Google Scholar]
  41. Mason, R.T. NoSQL databases and data modeling techniques for a document-oriented NoSQL database. In Proceedings of the Proceedings of Informing Science & IT Education Conference (InSITE), Tampa, FL, USA, 29 June–5 July 2015; Volume 3, pp. 259–268. [Google Scholar]
  42. Franze, K.; Wehner, F. A Document Model for Generating Adaptable Courseware Using Background Data. In Proceedings of the WebNet World Conference on the WWW and Internet. Association for the Advancement of Computing in Education (AACE), Honolulu, HI, USA, 23–27 October 1999; pp. 1266–1267. [Google Scholar]
  43. Martin, A.J. Examining a multidimensional model of student motivation and engagement using a construct validation approach. Br. J. Educ. Psychol. 2007, 77, 413–440. [Google Scholar] [CrossRef] [PubMed]
  44. Frisendal, T. Graph Data Modeling for NoSQL and SQL: Visualize Structure and Meaning; Technics Publications: Denville, NJ, USA, 2016. [Google Scholar]
  45. Bondy, J.A.; Axler, S.; Ribet, K. Graduate Texts in Mathematics; Springer: London, UK, 2008; Volume 244. [Google Scholar]
  46. Velampalli, S.; Jonnalagedda, M.V. Graph based knowledge discovery using MapReduce and SUBDUE algorithm. Data Knowl. Eng. 2017, 111, 103–113. [Google Scholar] [CrossRef]
  47. Gomez-Perez, J.M.; Pan, J.Z.; Vetere, G.; Wu, H. Enterprise knowledge graph: An introduction. In Exploiting Linked Data and Knowledge Graphs in Large Organisations; Springer: Berlin/Heidelberg, Germany, 2017; pp. 1–14. [Google Scholar]
  48. Rizun, M. Knowledge graph application in education: A literature review. Acta Univ. Lodziensis. Folia Oeconomica 2019, 3, 7–19. [Google Scholar] [CrossRef] [Green Version]
  49. Wu, Y.; Pan, J.S.; Lu, P.; Lin, K.; Yu, X. Knowledge Graph Embedding Translation Based on Constraints. J. Inf. Hiding Multim. Signal Process. 2017, 8, 1119–1131. [Google Scholar]
  50. Chen, P.; Lu, Y.; Zheng, V.W.; Chen, X.; Yang, B. Knowedu: A system to construct knowledge graph for education. IEEE Access 2018, 6, 31553–31563. [Google Scholar] [CrossRef]
  51. Chi, Y.; Qin, Y.; Song, R.; Xu, H. Knowledge graph in smart education: A case study of entrepreneurship scientific publication management. Sustainability 2018, 10, 995. [Google Scholar] [CrossRef] [Green Version]
  52. Bienkowski, M.; Feng, M.; Means, B. Enhancing Teaching and Learning through Educational Data Mining and Learning Analytics: An Issue Brief; Office of Educational Technology, US Department of Education: Washington, DC, USA, 2012.
  53. Peña-Ayala, A. Educational data mining: A survey and a data mining-based analysis of recent works. Expert Syst. Appl. 2014, 41, 1432–1462. [Google Scholar] [CrossRef]
  54. Romero, C.; Romero, J.R.; Ventura, S. A survey on pre-processing educational data. In Educational Data Mining; Springer: Berlin/Heidelberg, Germany, 2014; pp. 29–64. [Google Scholar]
  55. Liñán, L.C.; Pérez, Á.A.J. Educational Data Mining and Learning Analytics: Differences, similarities, and time evolution. Int. J. Educ. Technol. High. Educ. 2015, 12, 98–112. [Google Scholar]
  56. Siemens, G. Learning analytics: The emergence of a discipline. Am. Behav. Sci. 2013, 57, 1380–1400. [Google Scholar] [CrossRef] [Green Version]
  57. Larusson, J.A.; White, B. Learning Analytics: From Research to Practice; Springer: Berlin/Heidelberg, Germany, 2014; Volume 13. [Google Scholar]
  58. Baker, R.S.; Inventado, P.S. Educational data mining and learning analytics. In Learning Analytics; Springer: Berlin/Heidelberg, Germany, 2014; pp. 61–75. [Google Scholar]
  59. Bakhshinategh, B.; Zaiane, O.R.; ElAtia, S.; Ipperciel, D. Educational data mining applications and tasks: A survey of the last 10 years. Educ. Inf. Technol. 2018, 23, 537–553. [Google Scholar] [CrossRef]
  60. Siemens, G.; Baker, R.S.d. Learning analytics and educational data mining: Towards communication and collaboration. In Proceedings of the 2nd International Conference on Learning Analytics and Knowledge, Vancouver, BC, Canada, 29 April–2 May 2012; pp. 252–254. [Google Scholar]
  61. Deng, D.; Leung, C.K.; Wodi, B.H.; Yu, J.; Zhang, H.; Cuzzocrea, A. An innovative framework for supporting cognitive-based big data analytics for frequent pattern mining. In Proceedings of the 2018 IEEE International Conference on Cognitive Computing (ICCC), San Francisco, CA, USA, 2–7 July 2018; pp. 49–56. [Google Scholar]
  62. Lu, Y.L.; Wu, Y.C.; Chen, W.M.; Lien, Y.C.; Lien, C.J. Using data mining to investigate cognitive processes by a creativity test-a preliminary study. In Proceedings of the 9th IEEE International Conference on Cognitive Informatics (ICCI’10), Beijing, China, 7–9 July 2010; pp. 454–457. [Google Scholar]
  63. Singelmann, L.; Alvarez, E.; Swartz, E.; Pearson, M.; Striker, R.; Ewert, D. Innovators, learners, and surveyors: Clustering students in an innovation-based learning course. In Proceedings of the 2020 IEEE Frontiers in Education Conference (FIE), Uppsala, Sweden, 21–24 October 2020; pp. 1–9. [Google Scholar]
  64. Yu, J. Rough set based creativity rule extracting for middle school students. In Proceedings of the IEEE Third International Workshop on Advanced Computational Intelligence, Suzhou, China, 25–27 August 2010; pp. 209–212. [Google Scholar]
  65. Amabile, T.M.; Collins, M.A.; Conti, R.; Phillips, E.; Picariello, M.; Ruscio, J.; Whitney, D. Creativity in Context: Update to the Social Psychology of Creativity; Routledge: New York, NY, US, 2018. [Google Scholar]
  66. Ekwonwune, E.N.; Oparah, C.C. A Multimedia Based Virtual Learning System: A Panacea for Nigerian Tertiary Institutions. Circuits Syst. 2020, 11, 1–9. [Google Scholar] [CrossRef] [Green Version]
  67. Beheshti, A. Knowledge base 4.0: Using crowdsourcing services for mimicking the knowledge of domain experts. In Proceedings of the 2022 IEEE International Conference on Web Services (ICWS), Barcelona, Spain, 11–15 July 2022; pp. 425–427. [Google Scholar]
  68. Hammoud, M.; Rabbou, D.A.; Nouri, R.; Beheshti, S.M.R.; Sakr, S. DREAM: Distributed RDF engine with adaptive query planner and minimal communication. Proc. VLDB Endow. 2015, 8, 654–665. [Google Scholar] [CrossRef]
  69. Beheshti, S.; Benatallah, B.; Nezhad, H.R.M.; Sakr, S. A Query Language for Analyzing Business Processes Execution. In Proceedings of the Business Process Management—9th International Conference, BPM 2011, Clermont-Ferrand, France, 30 August–2 September 2011; Lecture Notes in Computer Science. Springer: Berlin/Heidelberg, Germany, 2011; Volume 6896, pp. 281–297. [Google Scholar]
  70. Farouk, M.; Ishizuka, M. A Rule-based SPARQL Endpoint Wrapper. In Proceedings of the WEBIST, Porto, Portugal, 18–21 April 2012; pp. 729–732. [Google Scholar]
  71. Huang, J.; Abadi, D.J.; Ren, K. Scalable SPARQL querying of large RDF graphs. Proc. VLDB Endow. 2011, 4, 1123–1134. [Google Scholar] [CrossRef]
  72. Amabile, T.M. How to Kill Creativity; Harvard Business School Publishing: Boston, MA, USA, 1998; Volume 87. [Google Scholar]
  73. Guilford, J.P. Characteristics of Creativity. Am. Psychol. 1973, 5, 444–454. [Google Scholar] [CrossRef]
  74. James, K.; Asmus, C. Personality, cognitive skills, and creativity in different life domains. Creat. Res. J. 2001, 13, 149–159. [Google Scholar] [CrossRef]
  75. Sternberg, R.J.; O’Hara, L.A. Creativity and intelligence. In Handbook of Creativity; Springer: Berlin/Heidelberg, Germany, 1999. [Google Scholar]
Figure 1. The structure of a Triple and an example of it.
Appliedmath 03 00014 g001
Figure 2. An overview of the proposed model.
Appliedmath 03 00014 g002
Figure 3. A fragment of the Educational Knowledge Base focusing on creativity concepts.
Appliedmath 03 00014 g003
Figure 4. A canonical graph of the possible relationship between objects in an educational setting.
Appliedmath 03 00014 g004
Figure 5. Three examples of the creativity rules and their related patterns: Strong Memory, Using Wide Categories, and Motivation.
Appliedmath 03 00014 g005
Figure 6. First five rows of the dataset after feature selection.
Appliedmath 03 00014 g006
Figure 7. The SPARQL queries and their results for finding students with three creativity patterns: Strong Memory, Using Wide Categories, and Motivation patterns.
Appliedmath 03 00014 g007
Figure 8. Examples of the questionnaire. (a) Demographic questions. (b) Evaluation of H1 for the “using a wide range of categories” creativity pattern. (c) Evaluation of H2 for the “using wide range of categories” creativity pattern. (d) Evaluation of H3.
Appliedmath 03 00014 g008
Figure 9. Evaluation of the hypotheses using the data acquired throughout the user study: (a) Evaluation of the concepts in the KB, (b) Evaluation of the defined rules, and (c) Evaluation of the final results.
Appliedmath 03 00014 g009
Table 1. The publications of the three research areas in the literature: Educational Knowledge, Educational Data Modeling, and EDM/LA.
DomainDescriptionPublications
Educational KnowledgeUsing traditional tools and techniques for measuring and detecting creativity.The Torrance Tests of Creativity (TTCT) [2], gold standard of creativity assessment [32], self-report measures of creativity [3], and judgment of products [65].
Educational Data ModelingOrganizing the educational data in a way that is suitable for a specific data structure.Hierarchical Data Model [34], Network Data Model [36], Object-oriented Data Model [66], Relational Data Model [39], and NoSQL Data Models [41,42,43,44,50,51].
EDM/LAA cycle of data mining and knowledge discovery which is involved with students, instructors or academic authorities, and educational environments to produce educational data and ultimately new knowledge.Frequent pattern mining using cognitive-based big data analytics [61], rule extraction using a data mining tool [64], clustering students for problem-solving skill [63], and associate rule mining to investigate on cognitive processes [62].
Disclaimer/Publisher’s Note: The statements, opinions and data contained in all publications are solely those of the individual author(s) and contributor(s) and not of MDPI and/or the editor(s). MDPI and/or the editor(s) disclaim responsibility for any injury to people or property resulting from any ideas, methods, instructions or products referred to in the content.

