1. Introduction
Healthcare is a lucrative target for hackers. As a result, the healthcare industry is suffering from massive data breaches [
1,
2,
3,
4]. Healthcare data breaches result in “the loss, theft, or unauthorized access to data containing sensitive personal and health information” [
5]. A data breach is likely to happen when an unauthorized person penetrates a source of data (“location”) and retrieves information he or she is not authorized to access [
3,
6,
7]. This is typically accomplished by tapping into a computing system, device, or network to access files and data in an unauthorized fashion, and with an ulterior motive. Evading security, one may access the data remotely via the Internet or in a wireless fashion. These methods typically target business entities. The typical steps executed during a data breach include researching the site, planning, and then attacking and breaking out [
8,
9,
10]. Because healthcare data breaches carry the risk of a loss of privacy [
11,
12] through personal health information exposure, corruption, or destruction, this study is important to the healthcare field [
13,
14,
15]. Extending this discussion, patients often disclose detailed, sensitive health information online unintentionally. Furthermore, the risk associated with involuntarily disclosure of private data into publicly available sites has been rather ignored. To reiterate, though, in the last two years alone, several billion records have been stolen or made publicly available due to several data breaches [
16].
Health data can be generated in large volumes from a variety of sources, such as wearable devices, online patient groups, social media postings, and web searches. In online patient forums, some participants share wellness information using their own names, while others use pseudonyms for the sake of privacy. Many online participants post data in the belief that it will only be shared with the designated receivers [
17,
18,
19]. However, privacy continues to be an ongoing challenge. For instance, even though mHealth apps facilitate access to real-time monitoring and health resources, they also present an inherent threat to privacy, particularly because of the sensitive nature of the informational content, as well as the lack of enforcement of privacy standards worldwide for online posting [
12]. There is sufficient evidence of healthcare data breaches that have occurred due to a lack of sound security measures [
11]. A patient survey in the U.S. shows that 75% were concerned about health websites sharing unauthorized information [
20]. Additionally, medical data breaches have been shown to be the second highest reported type [
21]. As a measure to address the increasing level of threat to health information privacy in the U.S, several state- and federal-level regulations, such as the Health Insurance Portability and Accountability Act (HIPAA), have been proposed [
11,
22]. While the patient–physician relationship relies on the foundation of privacy, patients are required to disclose all medical information to the physicians so as to facilitate accurate diagnosis and treatment. However, in certain realms, such as mental health and HIV, patients may not be comfortable with such disclosure due to the social stigma associated with the outcomes [
23]. Over time, a patient’s medical record accumulates important personal information relating to identification, medical diagnosis, imaging records, medications, sexual preferences, dietary preferences, and mental assessments [
11,
24,
25]. Such a vast arena of information presents a viable source for data theft and is, therefore, vulnerable to data breaches [
26,
27].
The bottom line is that healthcare institutions remain vulnerable targets for a wide range of cyber threats, including technical, physical, and human issues [
28,
29,
30]. Cyber-perpetrators continue to exploit these vulnerabilities with increasing sophistication, capitalizing on stolen healthcare records [
13,
31]. There are many negative effects caused by data breaches that impact uninvolved populations, organizational assets, and the healthcare environment in general, including monetary and privacy losses [
32]. Because of the vulnerability of healthcare organizations and the many negative consequences for those experiencing a data breach [
33], this work examined factors associated with data breach occurrences. The topic is important because healthcare data breaches expose personal data to theft, modification, or misuse [
34]. By exploring data breach dimensions and factors, this paper may assist healthcare delivery entities in mitigating or preventing data breaches in a proactive manner [
11,
13,
32]. Based on published industry reports, fundamental security safeguards are still considered to be lacking, with many documented data breaches occurring as the result of device and equipment theft, human error, hacking, ransomware attacks, and misuse. Health and medical data are believed to be one of the most vulnerable targets for cybercriminals due to their obvious susceptibility. Furthermore, organizations appear not to be ready to carry out forensic investigations into health data breaches, rendering mitigation and remedial steps rather moot [
5].
In 2017, 12,000 Aetna patients’ human immunodeficiency virus (HIV)-related information was revealed due to a mailing error that exposed personal information through an envelope’s clear window [
28]. In other healthcare and hospital cases, patients’ full names, addresses, social security numbers, contact information, and health insurance numbers were stolen and exposed. Moreover, the size of data breaches is often very large. In August 2015, a cyberattack claimed the private information of approximately 10 million members of Excellus, including medical data, social security numbers, and financial information. Another cyber-attack involving Premera Blue Cross exposed over 11 million customers’ information, including bank account numbers, claims information, social security numbers, and dates of birth. As the largest health data breach case in history, 78.8 million patient records were revealed. In other words, one data breach impacted one in four Americans.
The number of reported data breaches has increased since 2009. The 2546 healthcare industry breaches between 2009 and 2018 exposed 1,899,445,874 healthcare records [
29]. That is more than half of the population of the United States. Therefore, more than half of the nation’s citizens are at risk of identity theft or fraud [
13,
30,
31,
33].
This upward trend was reflected in every year except 2015. However, this does not mean that the number of data breaches improved in 2015. On the contrary, the number of records exposed in 2015 reached a peak of approximately 120 million. The average data breach size in 2015 was 400,000 [
32,
34]. This was a result of the 3 largest healthcare data breaches, including one impacting 78.8 million records [
35]. It also takes a long time to discover breaches. According to an IBM survey, it takes about 55 days for healthcare organizations to detect a data breach [
36]. The Nuix Black Report surveyed 112 hackers. It revealed that 61% of the hackers take less than 15 h to obtain healthcare data. Therefore, this is an imperative challenge when preventing future data breaches [
37,
38].
Healthcare entities, such as doctors’ offices, hospitals, laboratories, health insurance companies, HMOs, and other providers, increasingly face cyberattacks resulting in data loss, identity theft, privacy loss, business disruption, etc., with consequences of monetary and reputational loss. The entities also face lawsuits and litigation. It is, therefore, imperative to proactively understand the nature of data breaches and to take steps to mitigate or prevent such breaches [
3,
8,
30]. According to an Experian Data Breach Industry Forecast, health entities face escalating cyberattacks and data breaches due to the various data access points, such as terminals and front-office computers, and from such applications as electronic health records and wearable devices (
https://www.experian.com/data-breach/2023-data-breach-industry-forecast) (accessed on 16 December, 2022). Likewise, the Third Annual Benchmark Study on Patient Privacy and Data Security by the Ponemon Institute observed that nearly 94% of health entities have had at least one annual data breach in recent years (
https://www.ponemon.org/news-updates/news-press-releases/news/third-annual-benchmark-study-on-patient-privacy-data-security.html) (accessed on 16 December 2022). Interestingly, many of these were intentionally or unintentionally caused by employees (42%). Forty-six percent of individuals responding to the survey mentioned lost or stolen computing devices. Furthermore, third-party errors contributed to a large percentage of the breaches. Additionally, the large-scale utilization of mobile devices is jeopardizing patient data. A vast majority of health entities have authorized employees to use their personal devices to establish connections to their workplace computers [
32]. As mentioned, hacking is the fastest way to obtain unauthorized data. A hacker is:
“an individual who uses computer, networking, or other skills to overcome a technician problem. The term hacker may refer to anyone with technical skills, but it often refers to a person who uses his or her abilities to gain unauthorized access to systems or networks to commit crimes.”
The accelerated adoption of electronic health record systems (EHRs) as a result of the passing of the Health Information Technology for Economic and Clinical Health (HITECH) Act of 2009 has led to the automation of numerous health processes, with large amounts of health and patient data being stored electronically. This has led to them becoming vulnerable to cyberattacks and hacking, with the potential loss and theft of critical data. The demand for health data in the illegal, pirated, or contraband market makes health entities a moneymaking target for criminals [
40,
41]. Internal susceptibilities in hospital systems, for example, can be abused to seize data by both internal sabotage and outside attackers. Typical health data breaches include loss, theft, unauthorized access, and hacking incidents, which are associated with errors or negligence on the part of employees who handle data, or intentional attacks by outsiders [
3]. Entities with critical weaknesses in their cybersecurity initiatives face cyberattacks and data breaches [
4,
9]. Cybersecurity “consists largely of defensive methods used to detect and thwart would-be intruders” [
42]. Currently, it is the most promising countermeasure to hacking or cyberattacks. Another definition of cybersecurity states that “cyber security entails the safeguarding of computer networks and the information they contain from penetration and from malicious damage or disruption [
43].” According to [
44]:
“The activity process, ability or capability, or state whereby information and communication contained therein are protected from and/or defend against damage, unauthorized use or modification, or explanation.”
Companies must plan for data breaches to prevent damage and improve their proactive image. However, developing efficient, thorough countermeasures remains a challenge. Discovering and understanding the process and patterns of data breaches in the healthcare industry is core to developing countermeasures. Research on features and techniques of high-risk healthcare data breaches is imperative [
6,
37,
38].
The main purpose of this applied research is to identify attack patterns of healthcare data breaches. More importantly, the study seeks takeaways on how to address the problem. This study is novel in several ways. First, it utilizes data from a reliable U.S. federal government source, namely the Department of Health and Human Services Office for Civil Rights (OCR). Second, the study involves the application of visualization and visual analytical techniques and tools [
45,
46,
47] to make informed decisions on predicting data breaches. Choi et al., 2019, used the same dataset as is used in this study in addition to the Privacy Rights Clearinghouse (PRC) database, but the focus of their study was on remediation efforts and their effect on quality [
48]. In another study of the same data, a narrative description of the breaches was undertaken [
15]. Therefore, this study attempts to fill the gap in the research on health data breaches. This study develops visual charts to analyze patterns and find features of health data breaches. The rest of the paper is organized as follows. We discuss the methods used in
Section 2. This is followed by an analysis of the results in
Section 3, and a discussion of the implications in
Section 4. The scope and limitations of the study are discussed in
Section 5. Finally, our conclusions and future research directions are offered in
Section 6.
3. Results
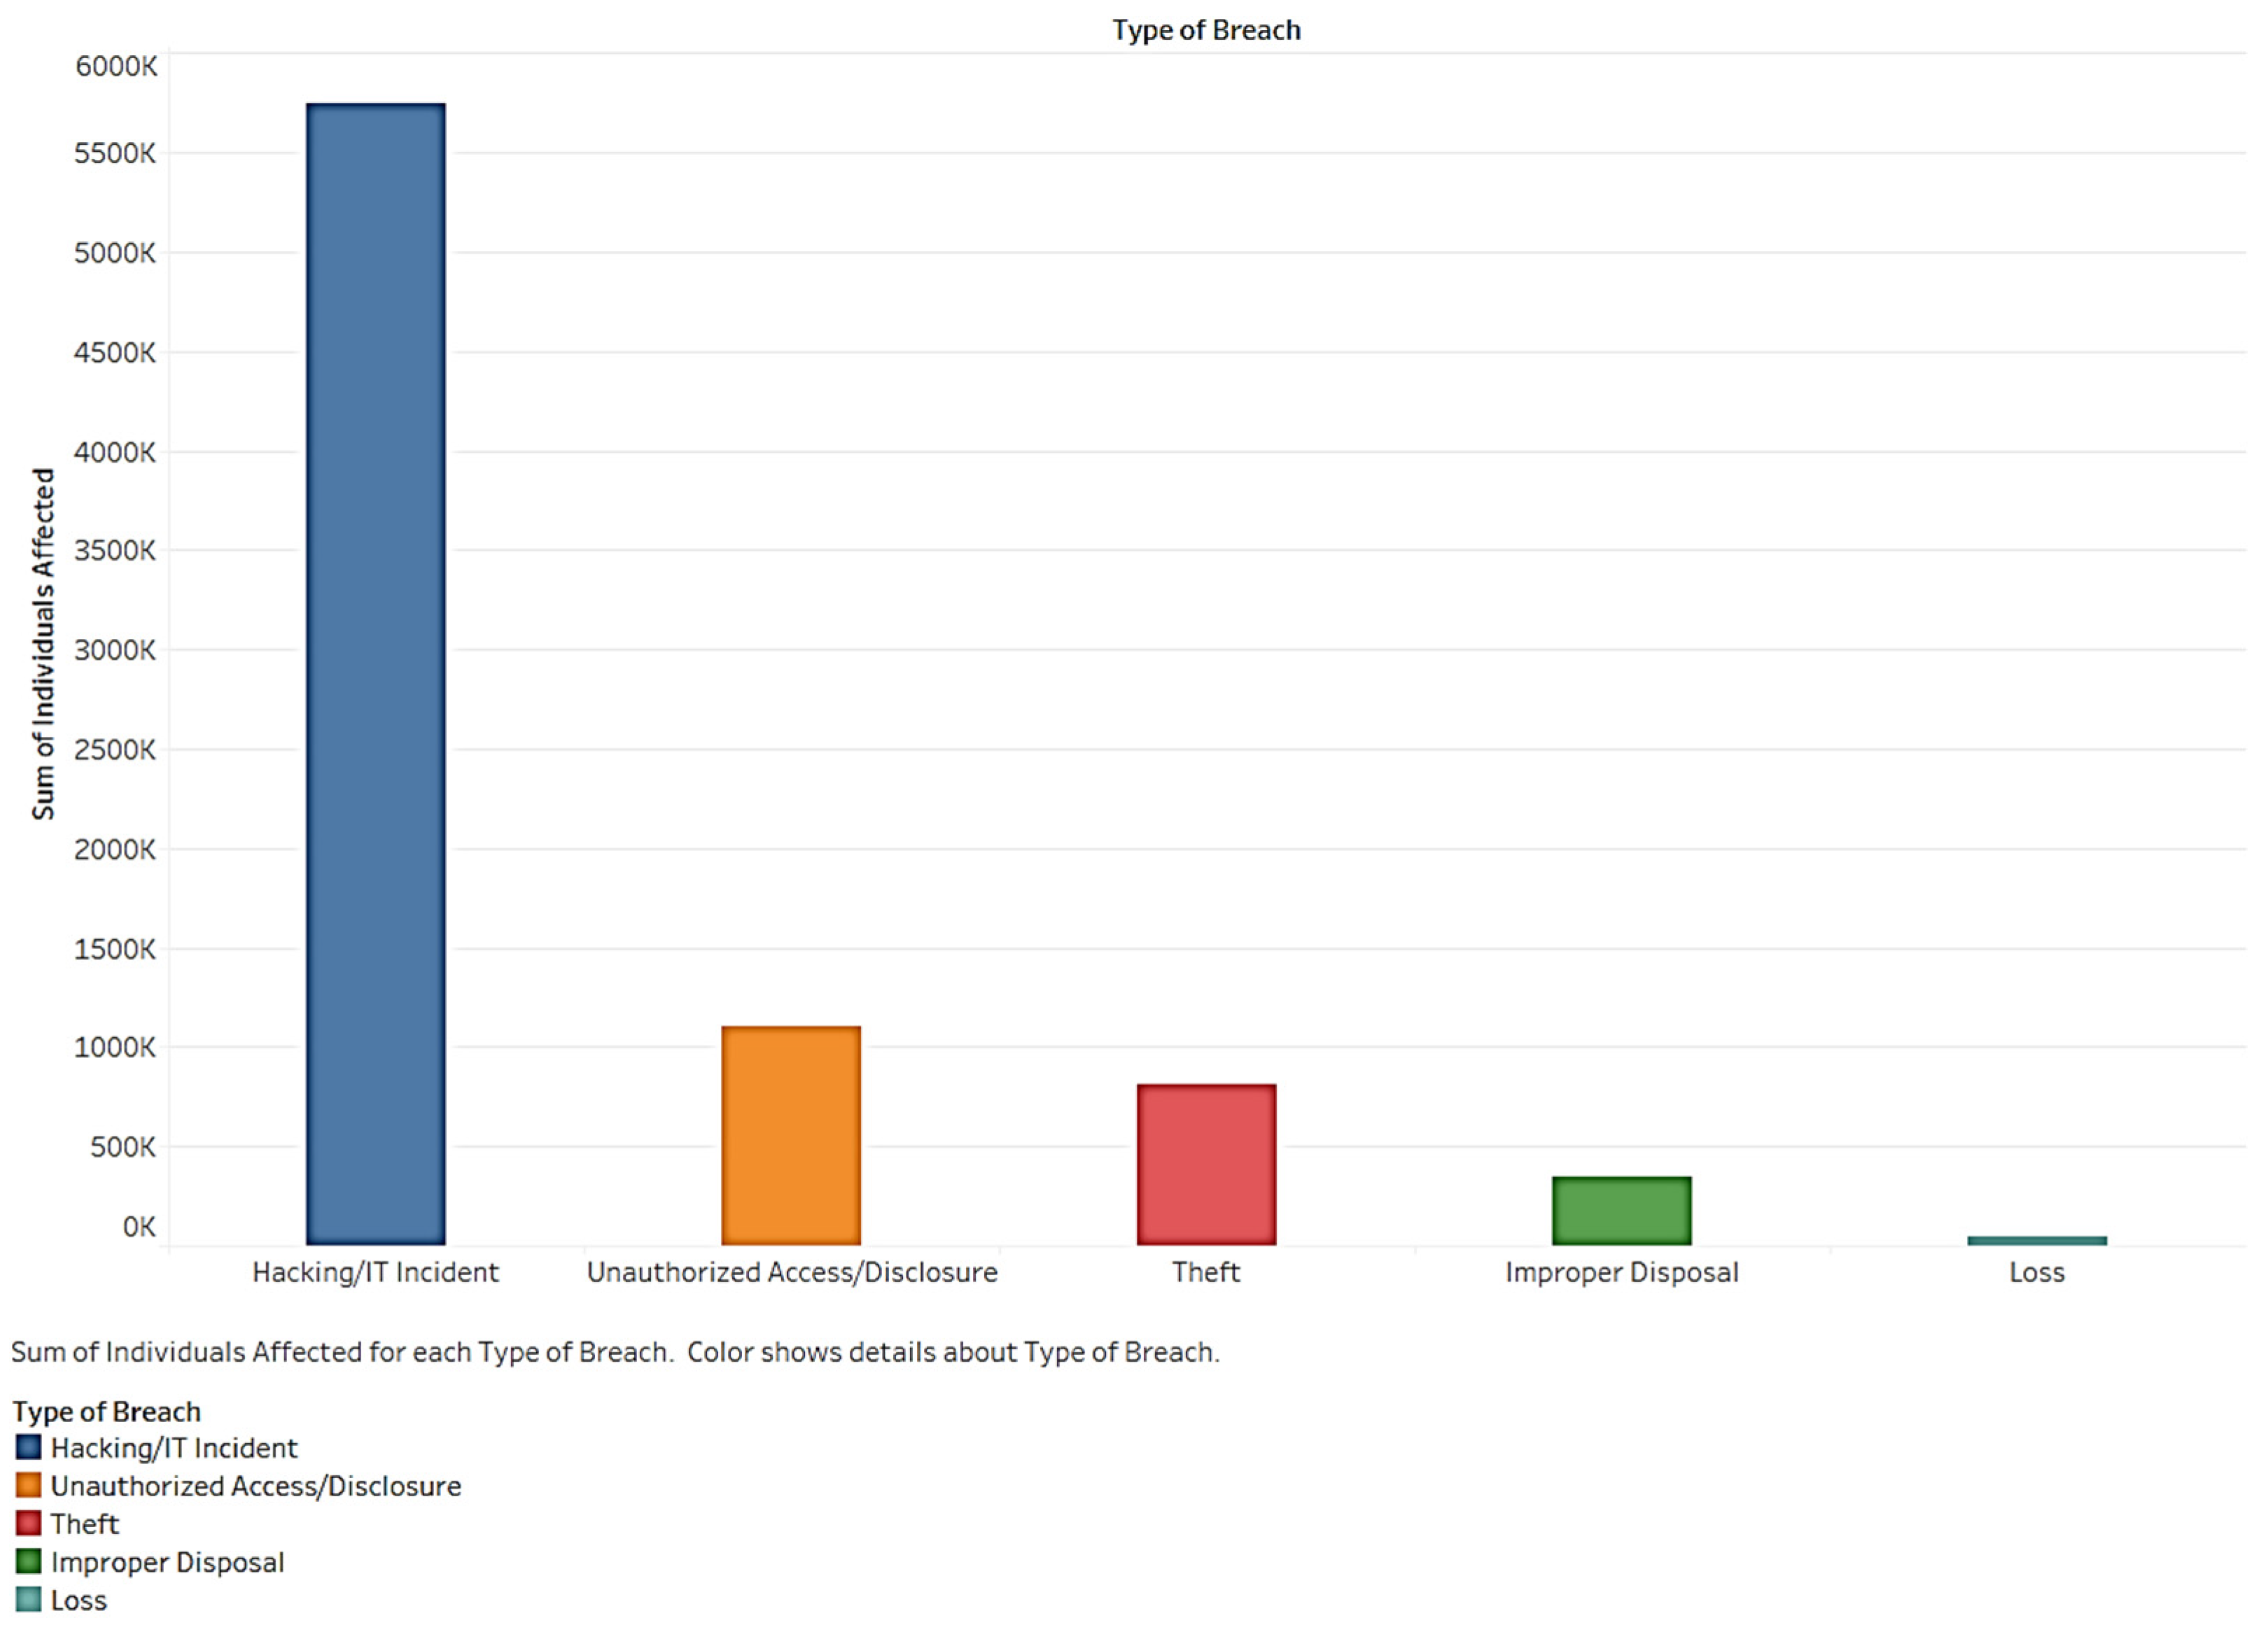
Using visualization, we developed a series of charts to understand the health breach data. Collectively, the charts tell a compelling story about the nature and dimensions of health data breaches. First, we examined breach type and the number of individuals affected.
Figure 1 shows the total number of individuals affected by each type of breach. One of the most significant breach types is a hacking/IT incident. Unauthorized access/disclosure and theft also impact many individuals. About 300,000 people were impacted by the breaches. A smaller amount of data was involved in the loss. However, loss causes severe problems because it cannot be recovered. Hacking, when compared to other types of breaches, accounted for more than twice the number of cases. This indicates that organizations should focus on hacking as an essential entrance for a data breach.
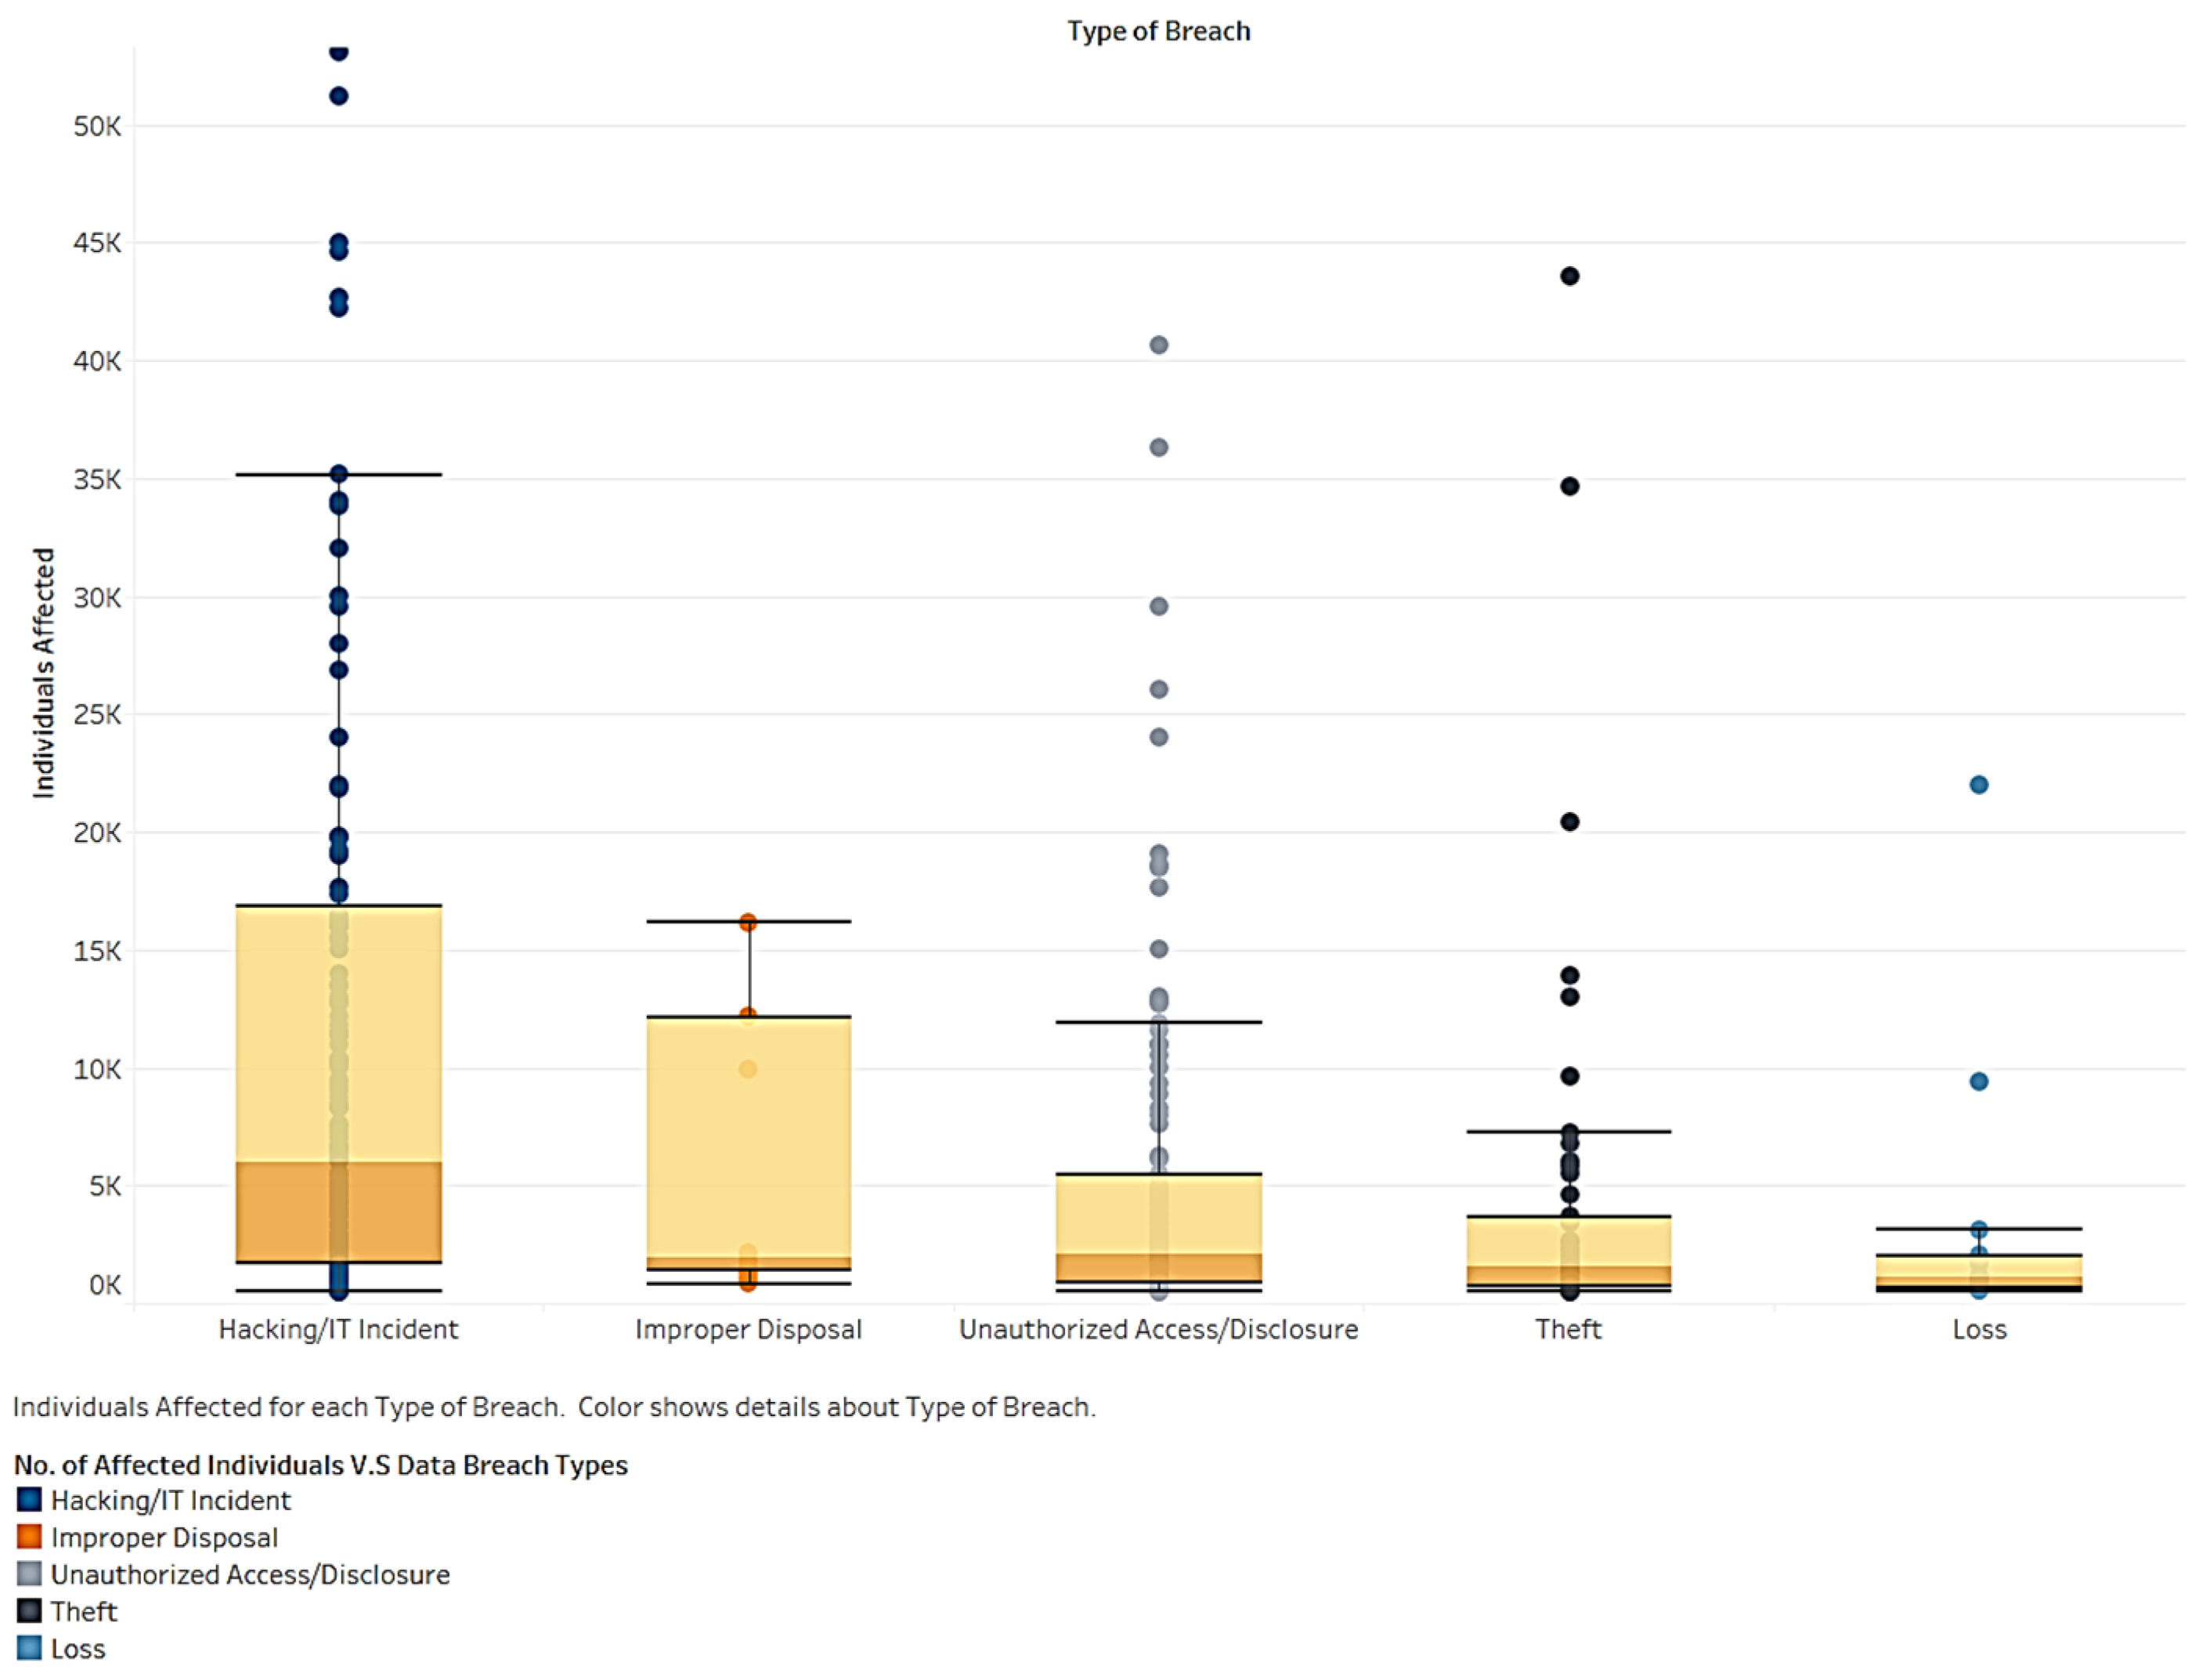
As show in
Figure 2, we examined the distribution and range of affected individuals by type of breach. Hacking has the highest mean and number of individuals among types. The number of records for the improper disposal breach type shows no outlier. This suggests that the size of the breach caused by improper disposal is controllable and rarely results in extreme situations. Records of hacking/IT incidents, unauthorized access, and theft have many outlier records. Therefore, planning for these types of breaches is vital to avoid extreme situations impacting many individuals.
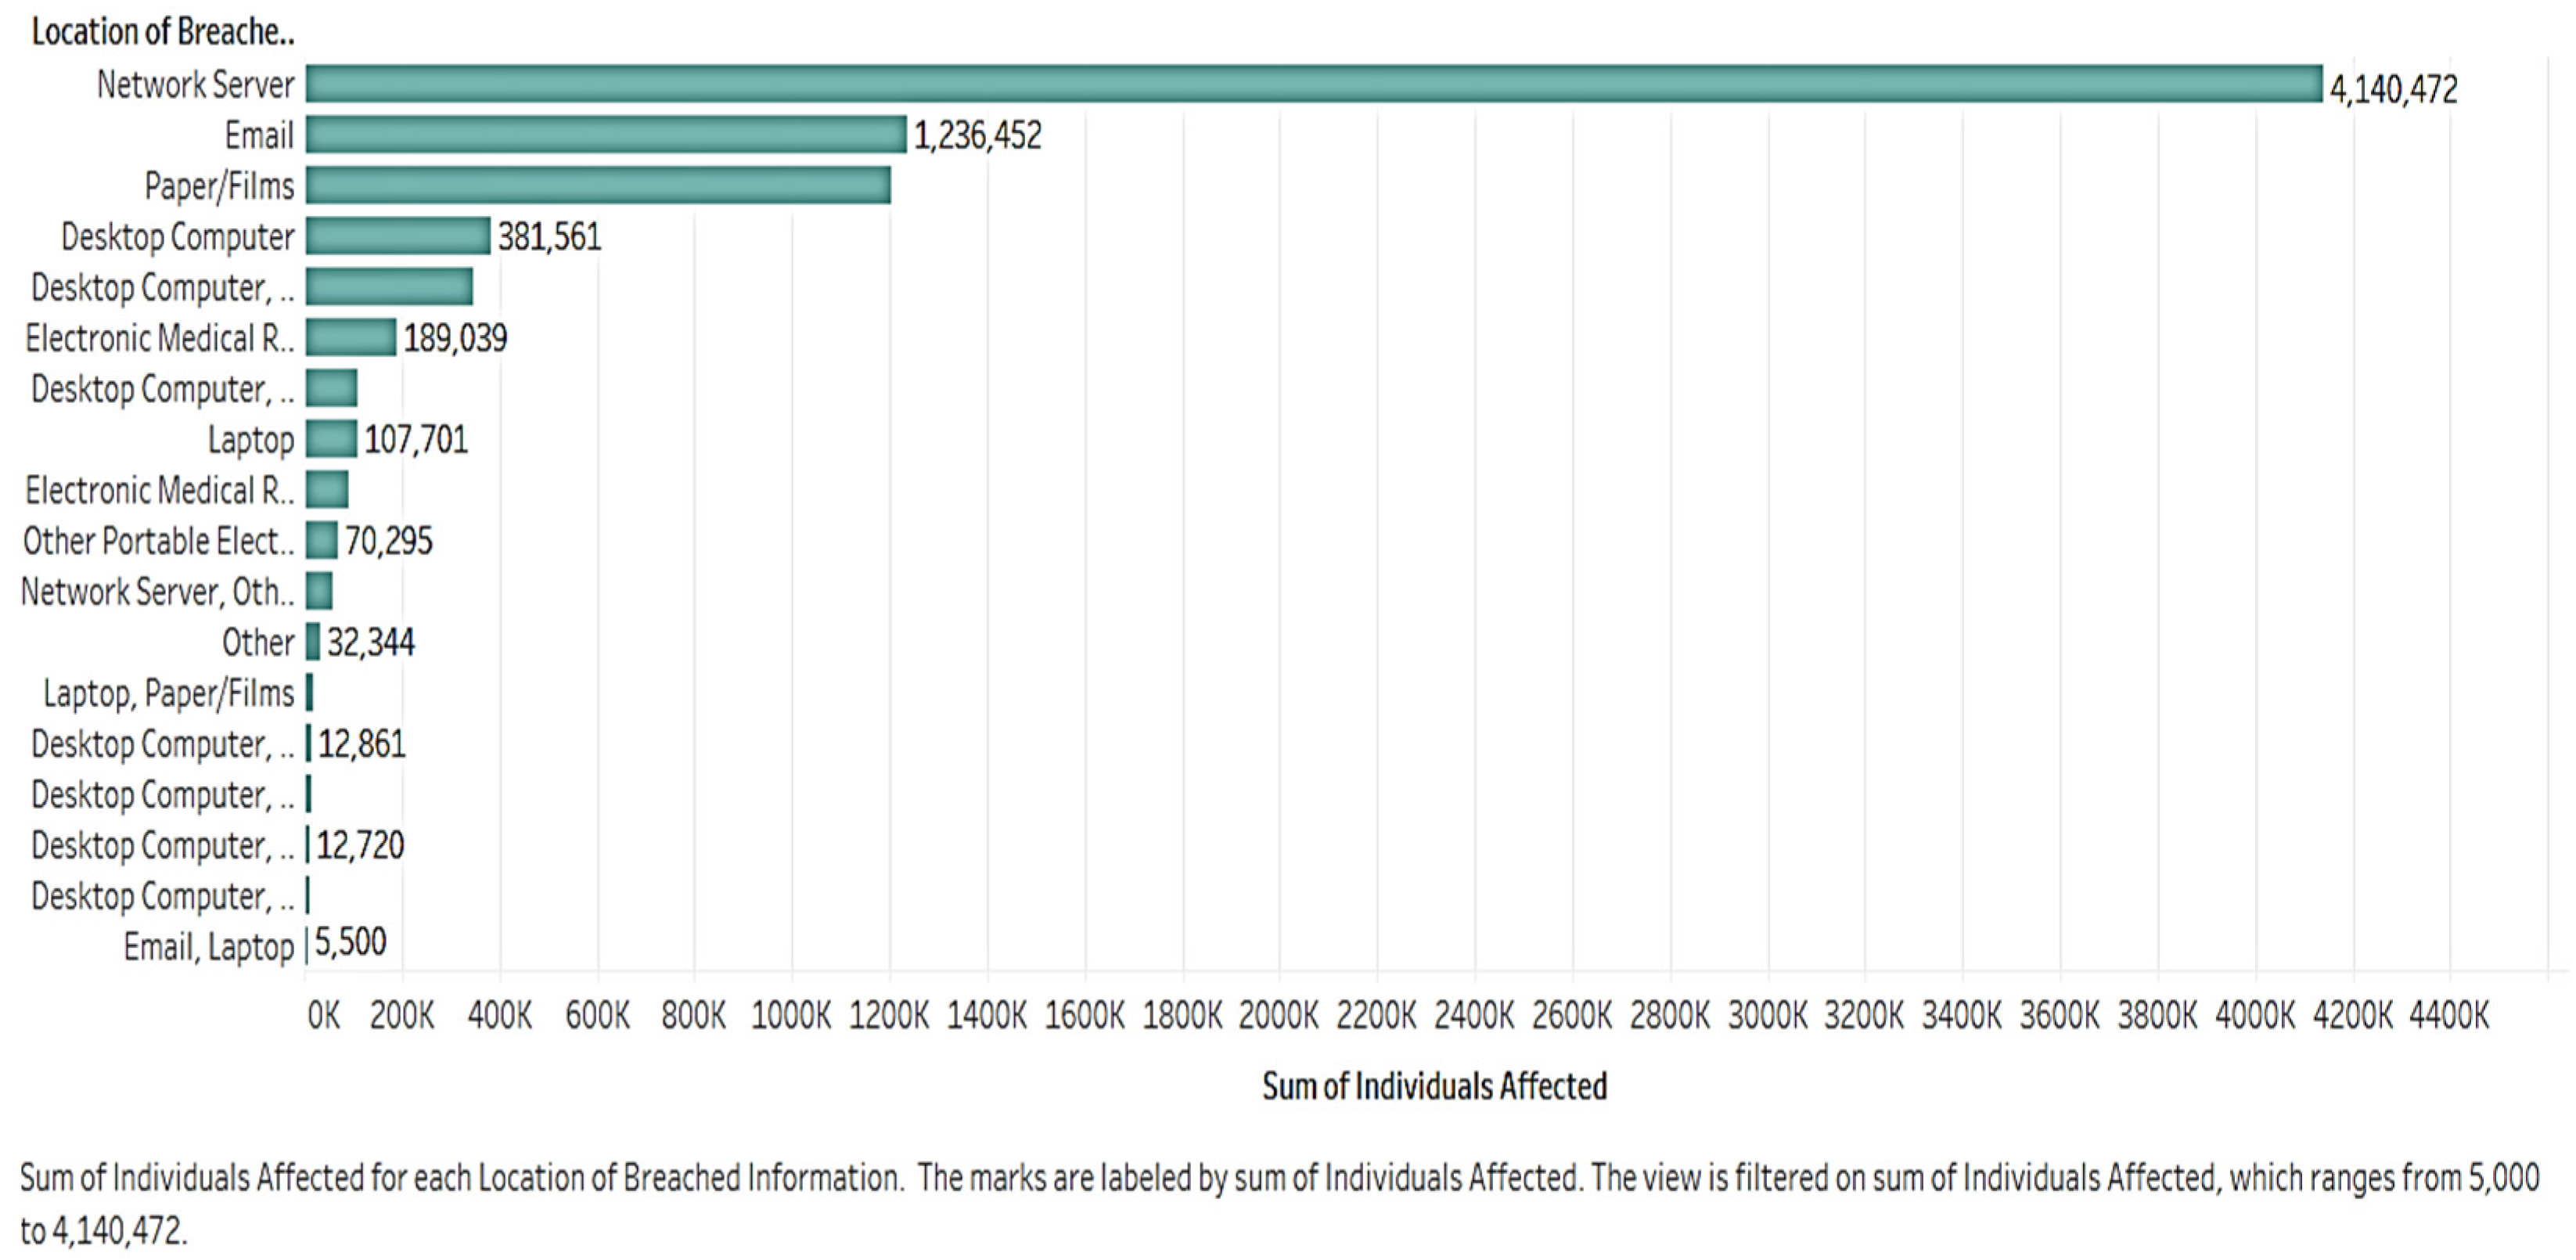
It is necessary to study where and how breaches occur. Analyzing the locations of breach types will offer insights into the prevention of future breaches.
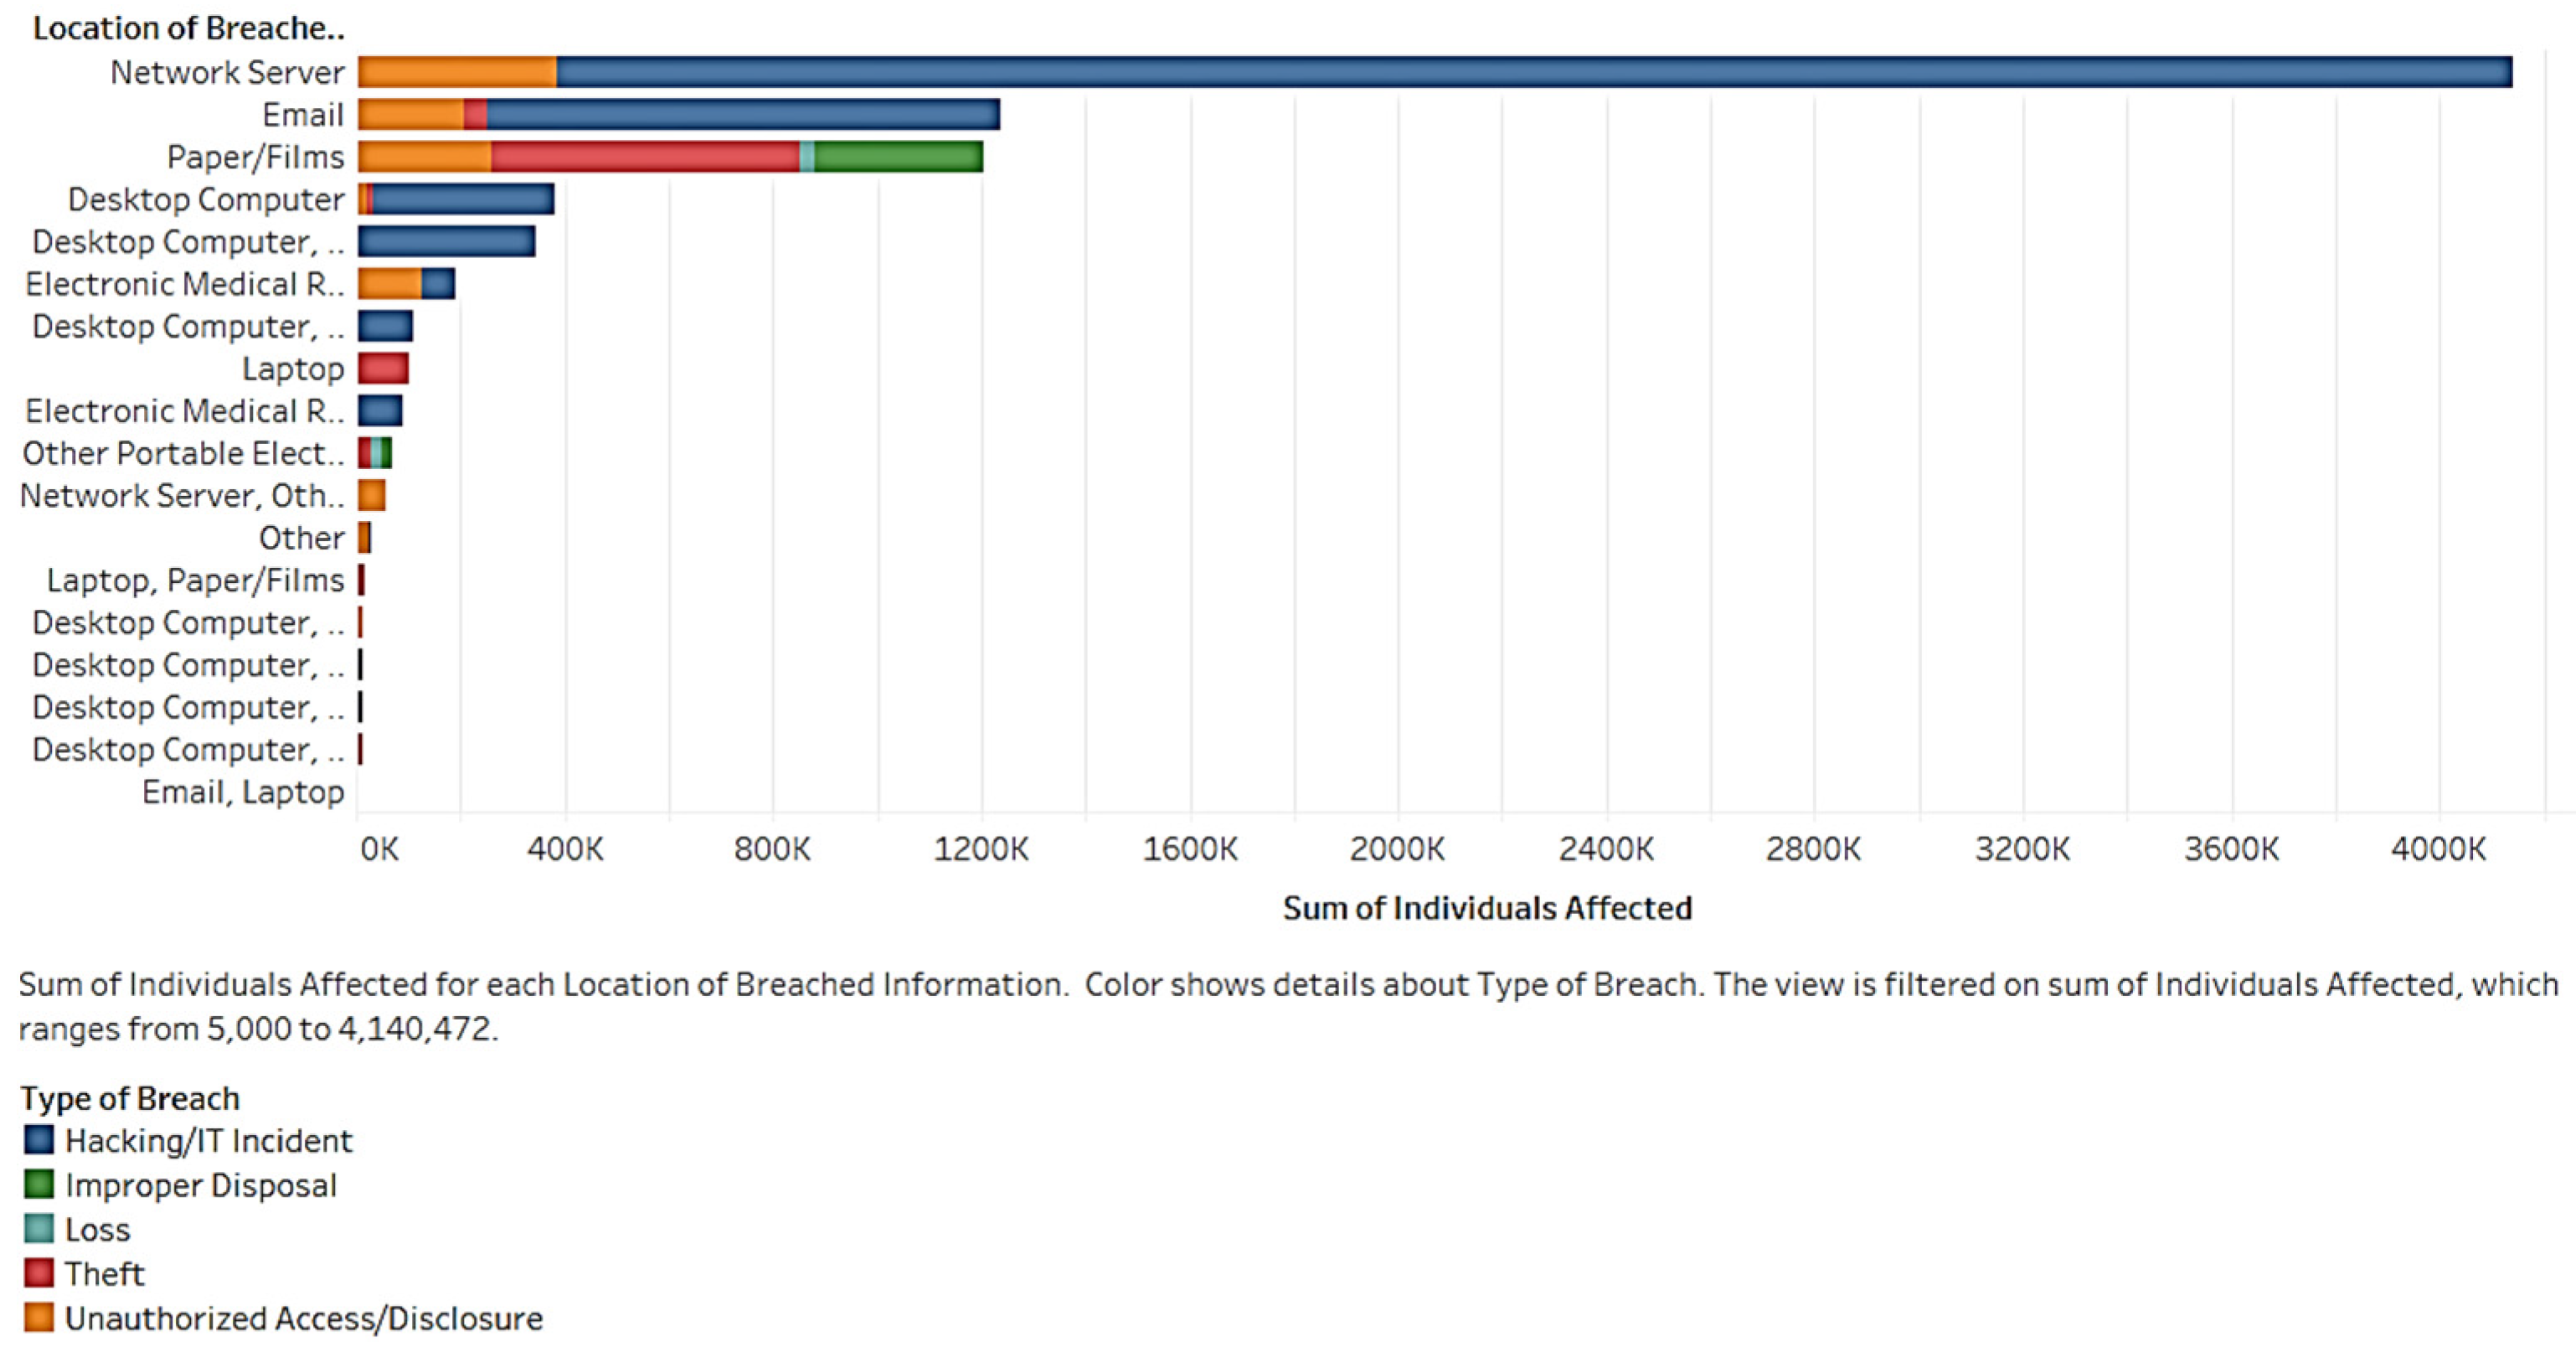
Figure 3 shows the number of affected individuals in each breach location. A location is any of the computing devices or other sources in which a breach occurs. In
Figure 3, the riskiest location is the network server. More than 4 million people are involved in data breaches. This number is almost four times that of the e-mail factor.
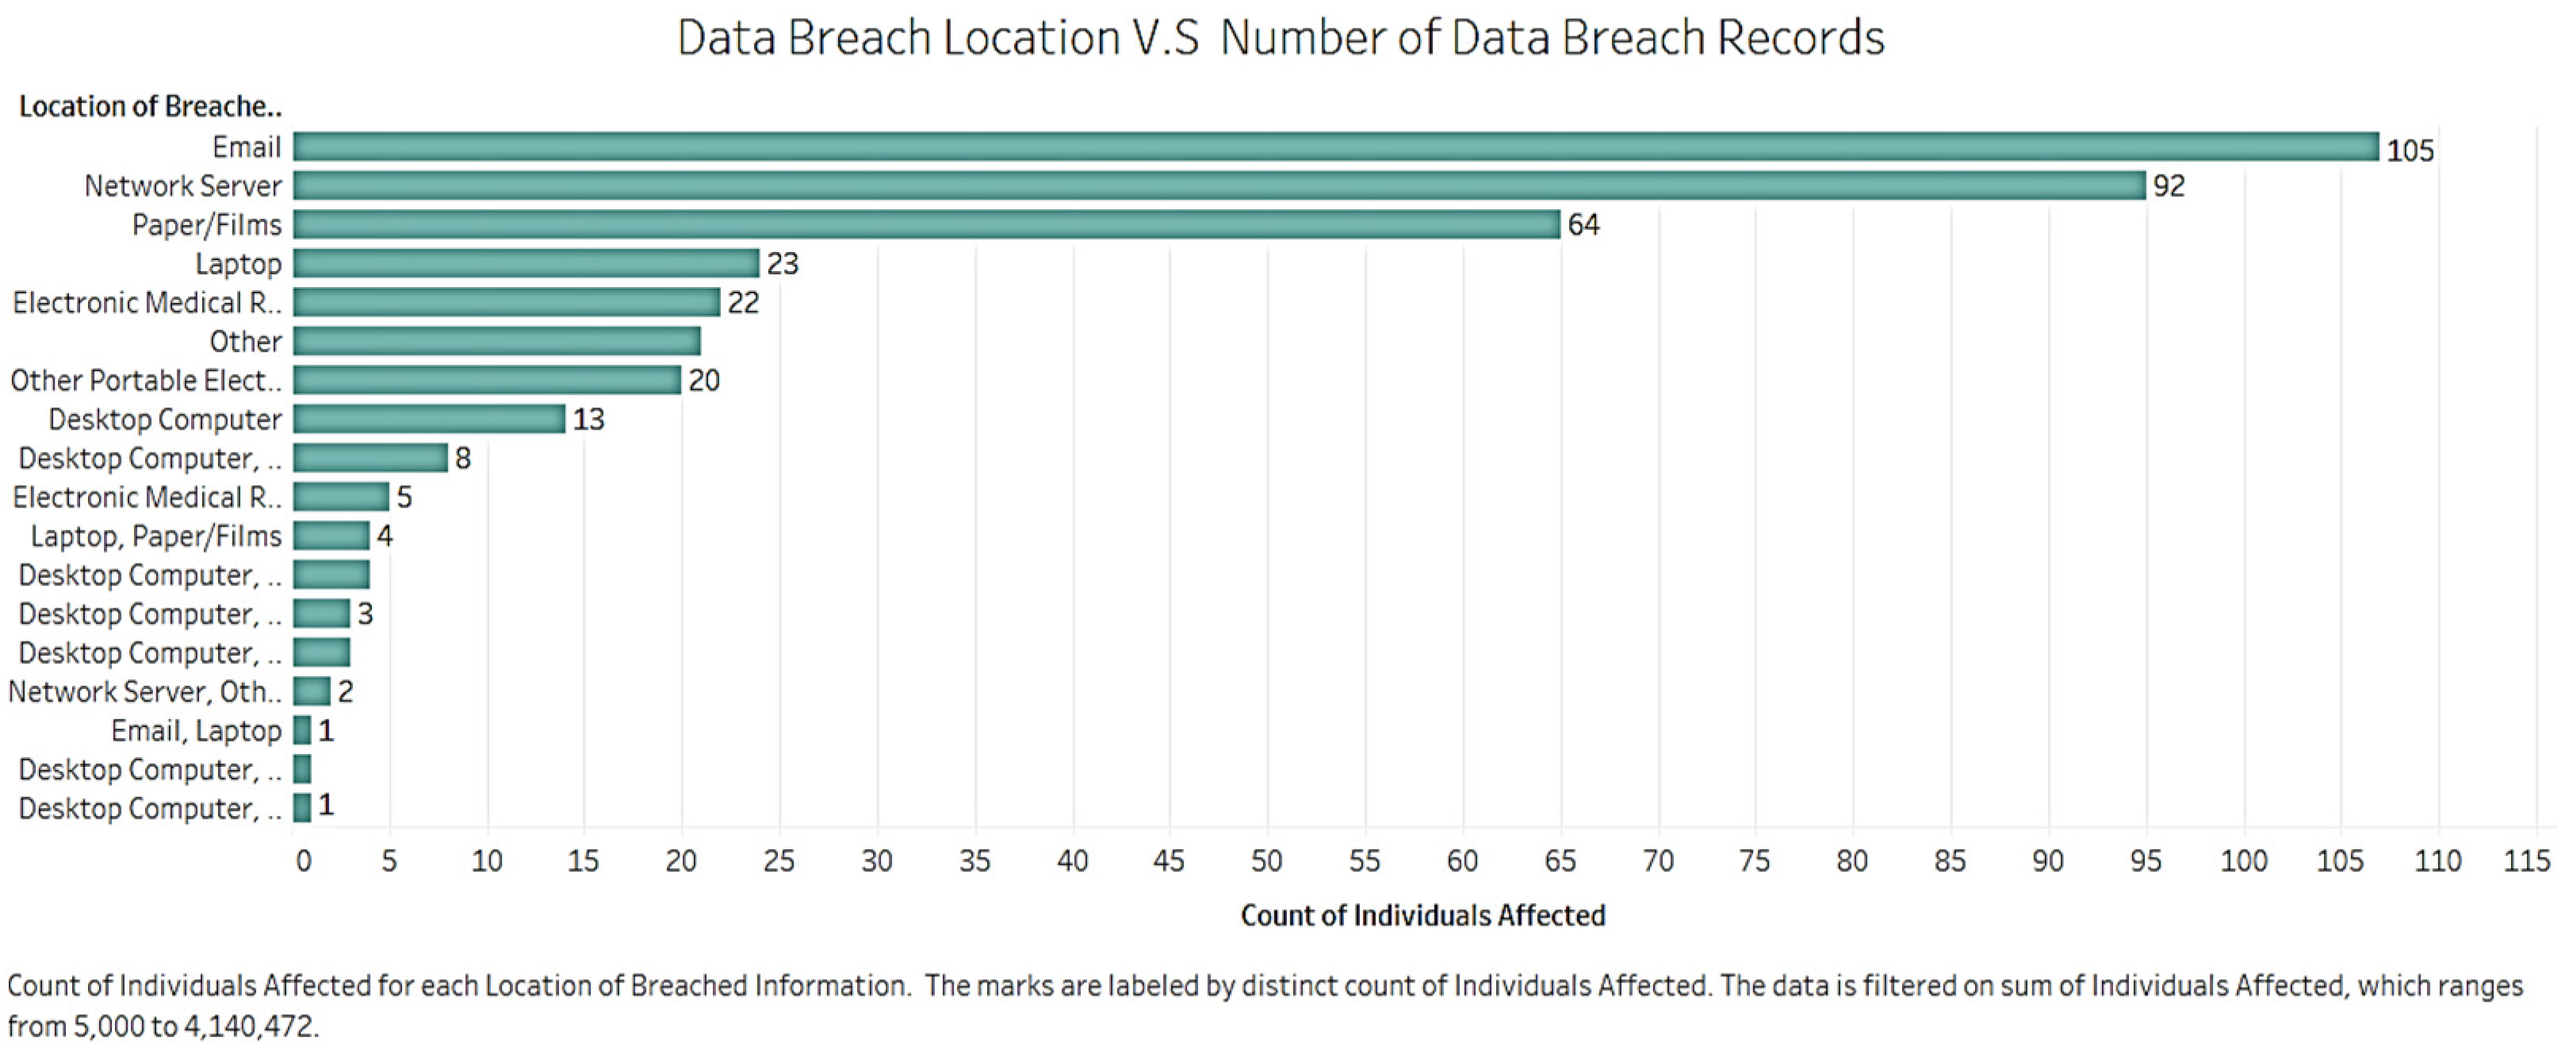
Figure 4 shows the number of records for each breach location. The information was filtered for the locations with less than 5000 affected individuals.
In
Figure 5, there are more records for e-mail than network servers. Most breaches occur via network servers, e-mail, and papers/films, as these are the top three in terms of the number of records and number of affected individuals.
Figure 5 shows the quantity of affected individuals in different places. The bar is colored by type of breach. The network server suffers from hacking/IT incidents and unauthorized access. Most improper disposal incidents occur with papers/films, and rarely exist in other locations. Unauthorized access/disclosure happens through network servers, e-mail, papers/films, electronic medical records, and other locations. The network server is the easiest path to leak data. Business organizations in the healthcare field should take more precautionary actions regarding this path.
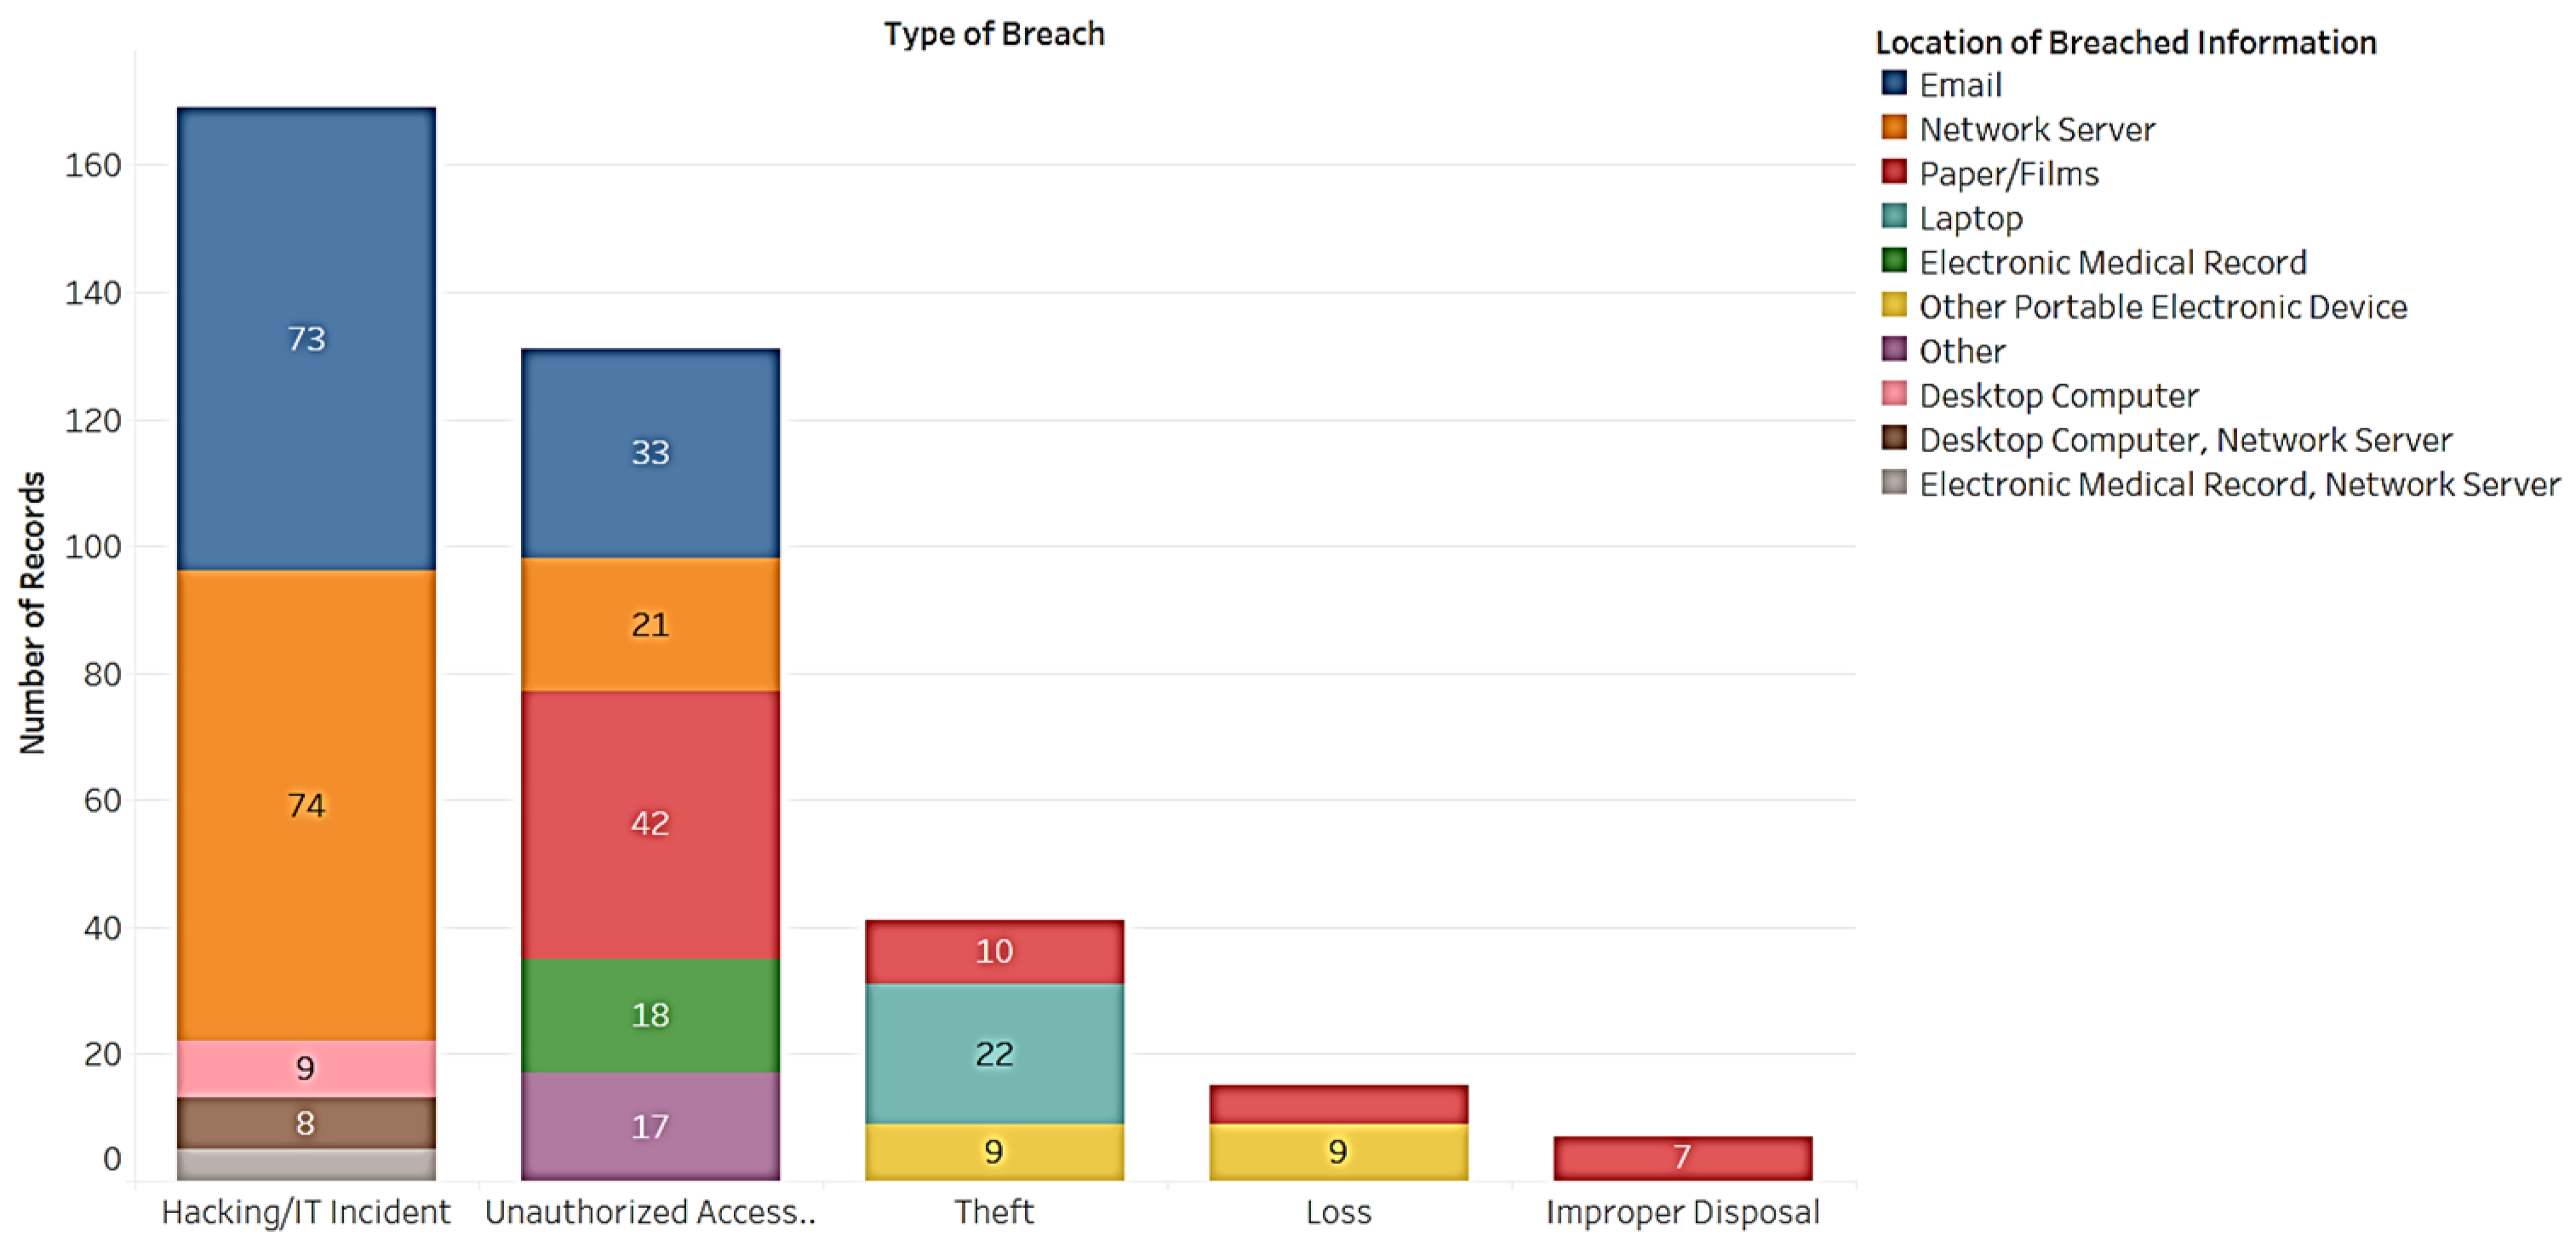
Next, we compared the locations of breached information with breach types. As shown in
Figure 6, the 5 most related locations in hacking/IT incidents are e-mail (73), network servers (74), desktop computers (9), desktop computers and network servers together (8), and electronic medical records (5). Locations of unauthorized access included e-mail (33), network servers (21), papers/films (42), electronic medical records (18), and others (17). The remaining three breach types did not have enough related locations and, thus, did not satisfy the condition. For example, theft happened through papers/films (10), laptops (22), and other portable electronic devices (9). On the other hand, loss occurred with papers/films (6) and other portable electronic devices (9), and improper disposal occurred with papers/films (7). Papers/films appeared with four breach types, whereas e-mails contained the most records. This means that the papers/films category is the easiest manner for leaking information. E-mail reveals the most information among all the locations. E-mail, network servers, and papers/films significantly influence breach types.
Next, we looked at the data breach through the various entity types, such as health plan, healthcare provider, etc. The bubble chart in
Figure 7 shows the distribution of individuals and records affected by the different entities. The bubble with 813,207 datapoints belongs to the business associate category. The bubble with 1,159,715 datapoints belongs to the health plan category. The largest bubble belongs to the healthcare provider category. This chart illustrates specific problems. For example, the number of affected individuals per covered entity type is considerable. However, healthcare providers affect over 6 million individuals. This insight demands further attention. As expected, healthcare providers are significantly related to impacted individuals.
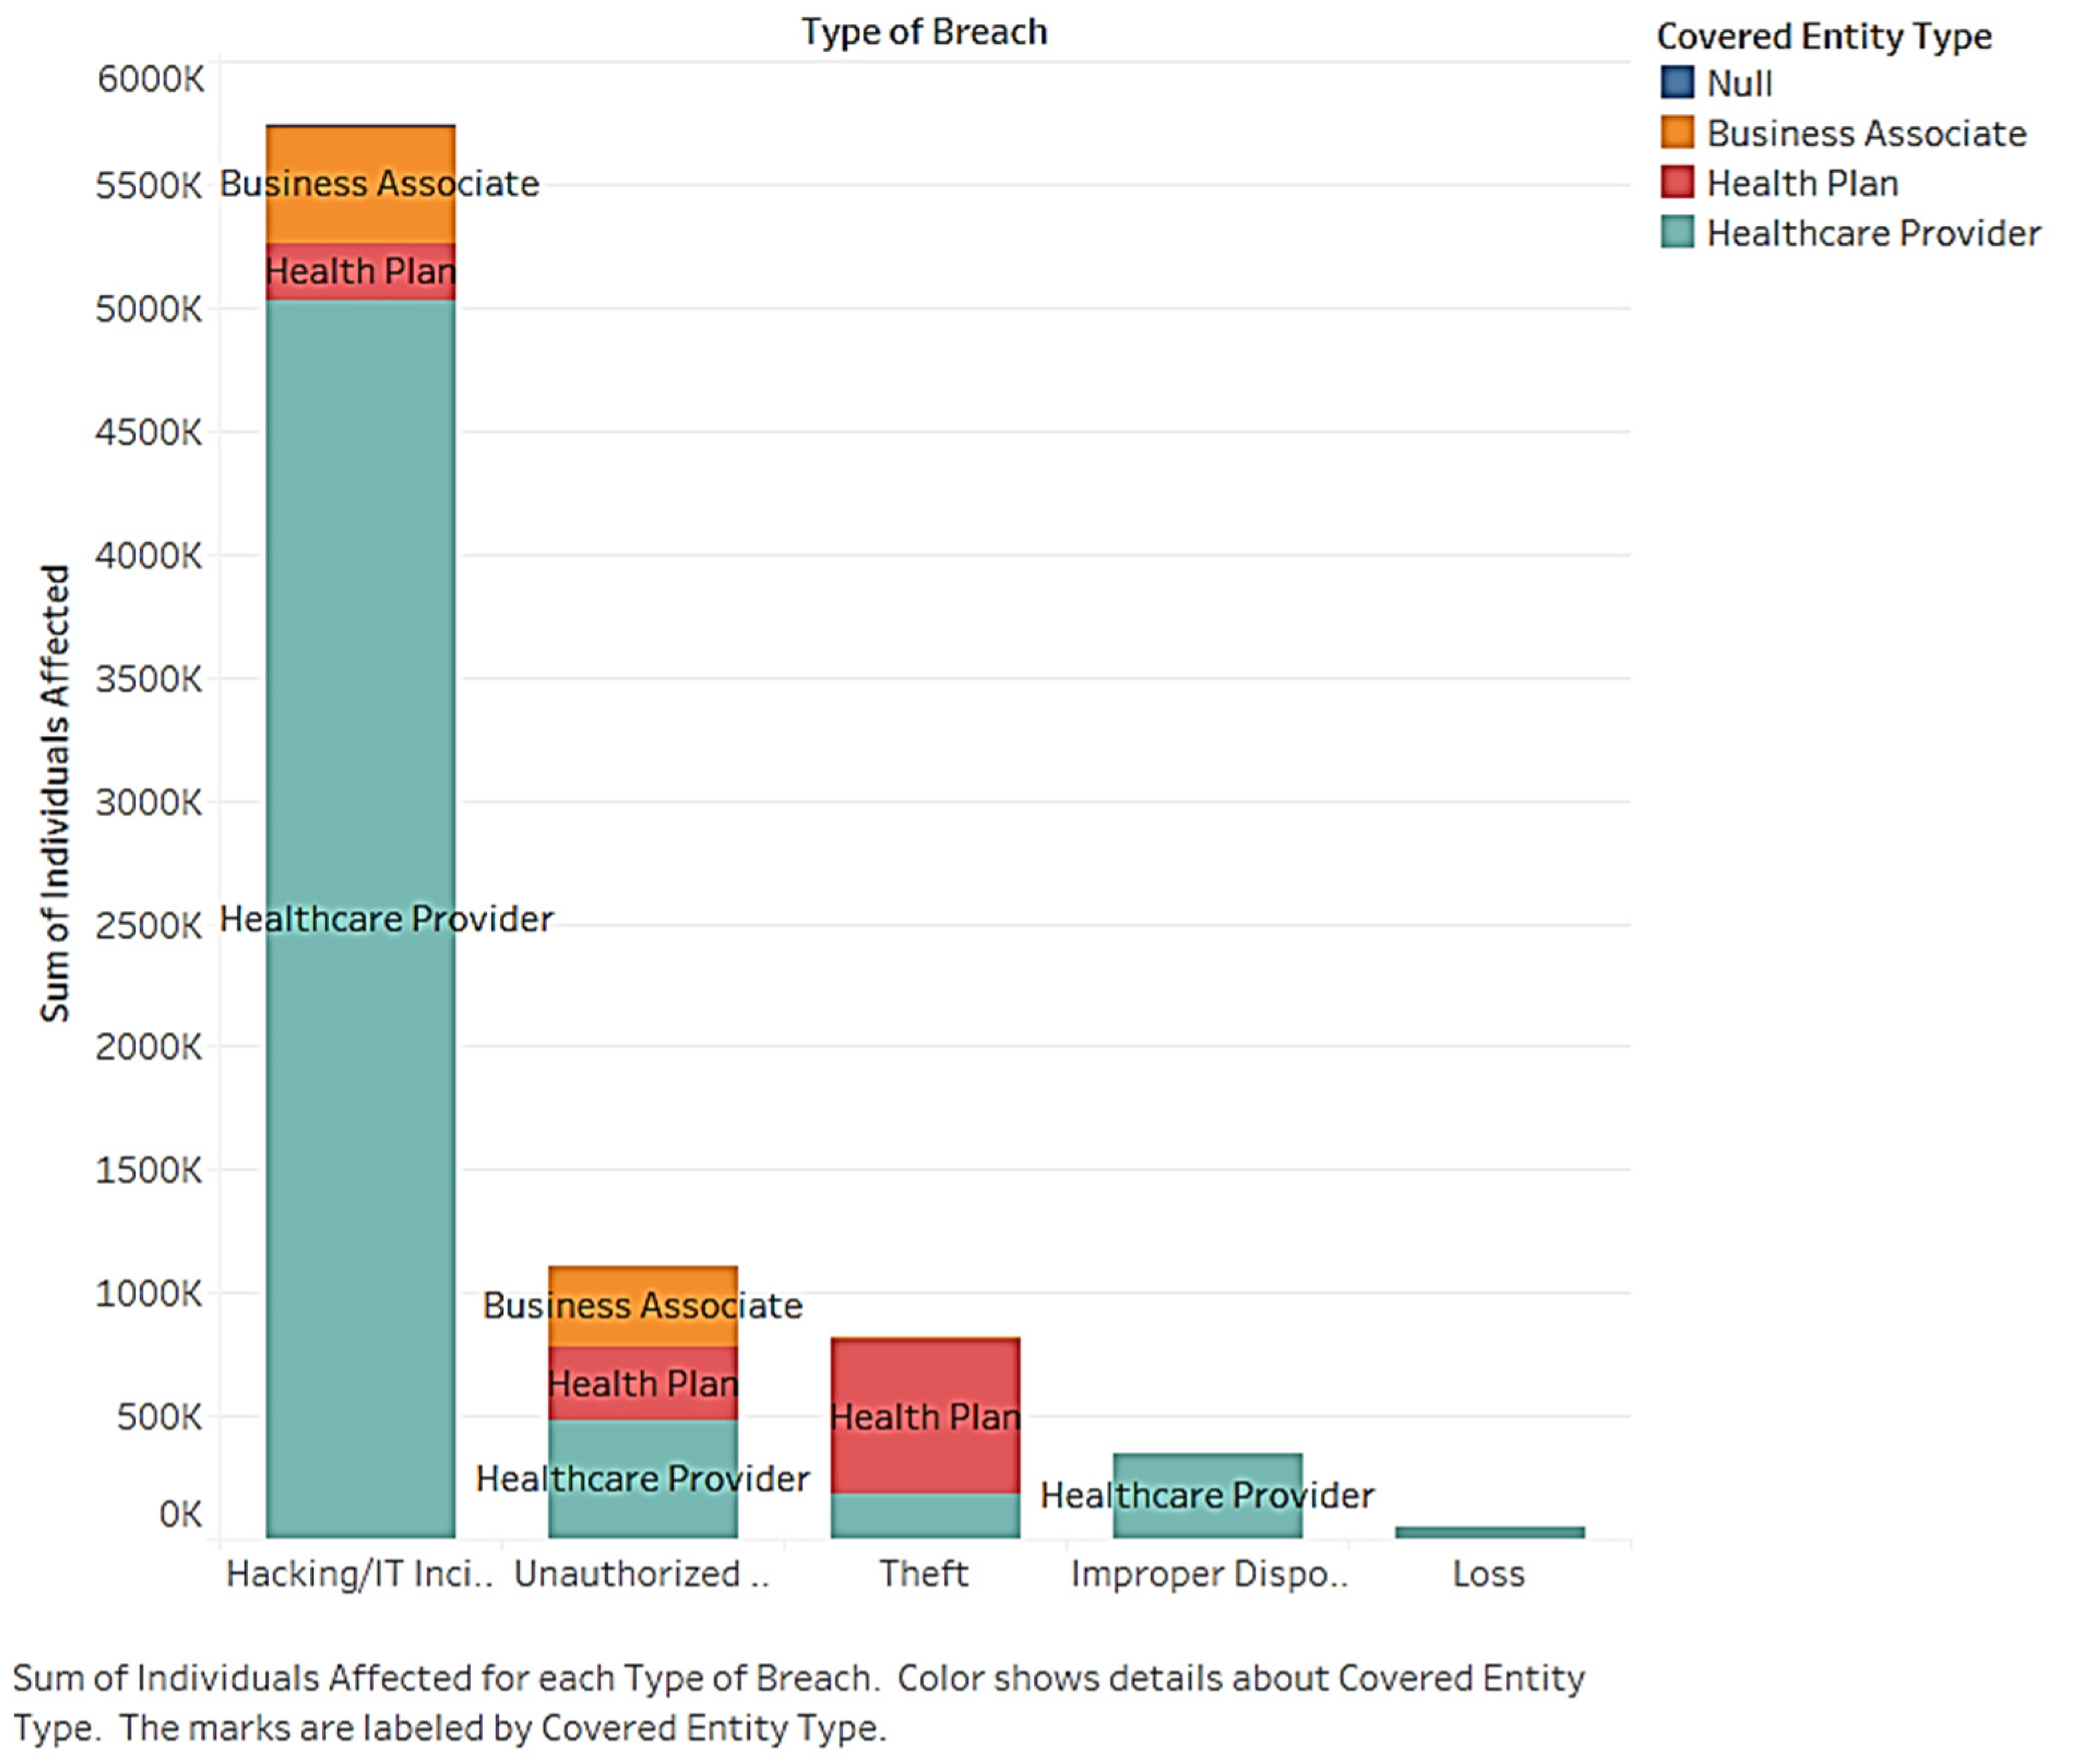
For further insight, we studied the number of affected individuals for each of the five data breach types and the three entities (see
Figure 8). The stacked bar chart shows the secondary distribution of individuals affected by the covered entity under breach type. According to the chart, the healthcare provider category dominates, as it has the most individuals affected by a breach. Therefore, it can be concluded that healthcare providers are the most vulnerable entity for almost all the breach types. This is followed by theft, which significantly affects health plans. The business associate category is affected by hacking and unauthorized access. It must be emphasized that healthcare providers should protect themselves from all types of breaches, especially hacking. The health plan organizations should also focus on the first three types of breaches, and business associates should be concerned with the first two types.
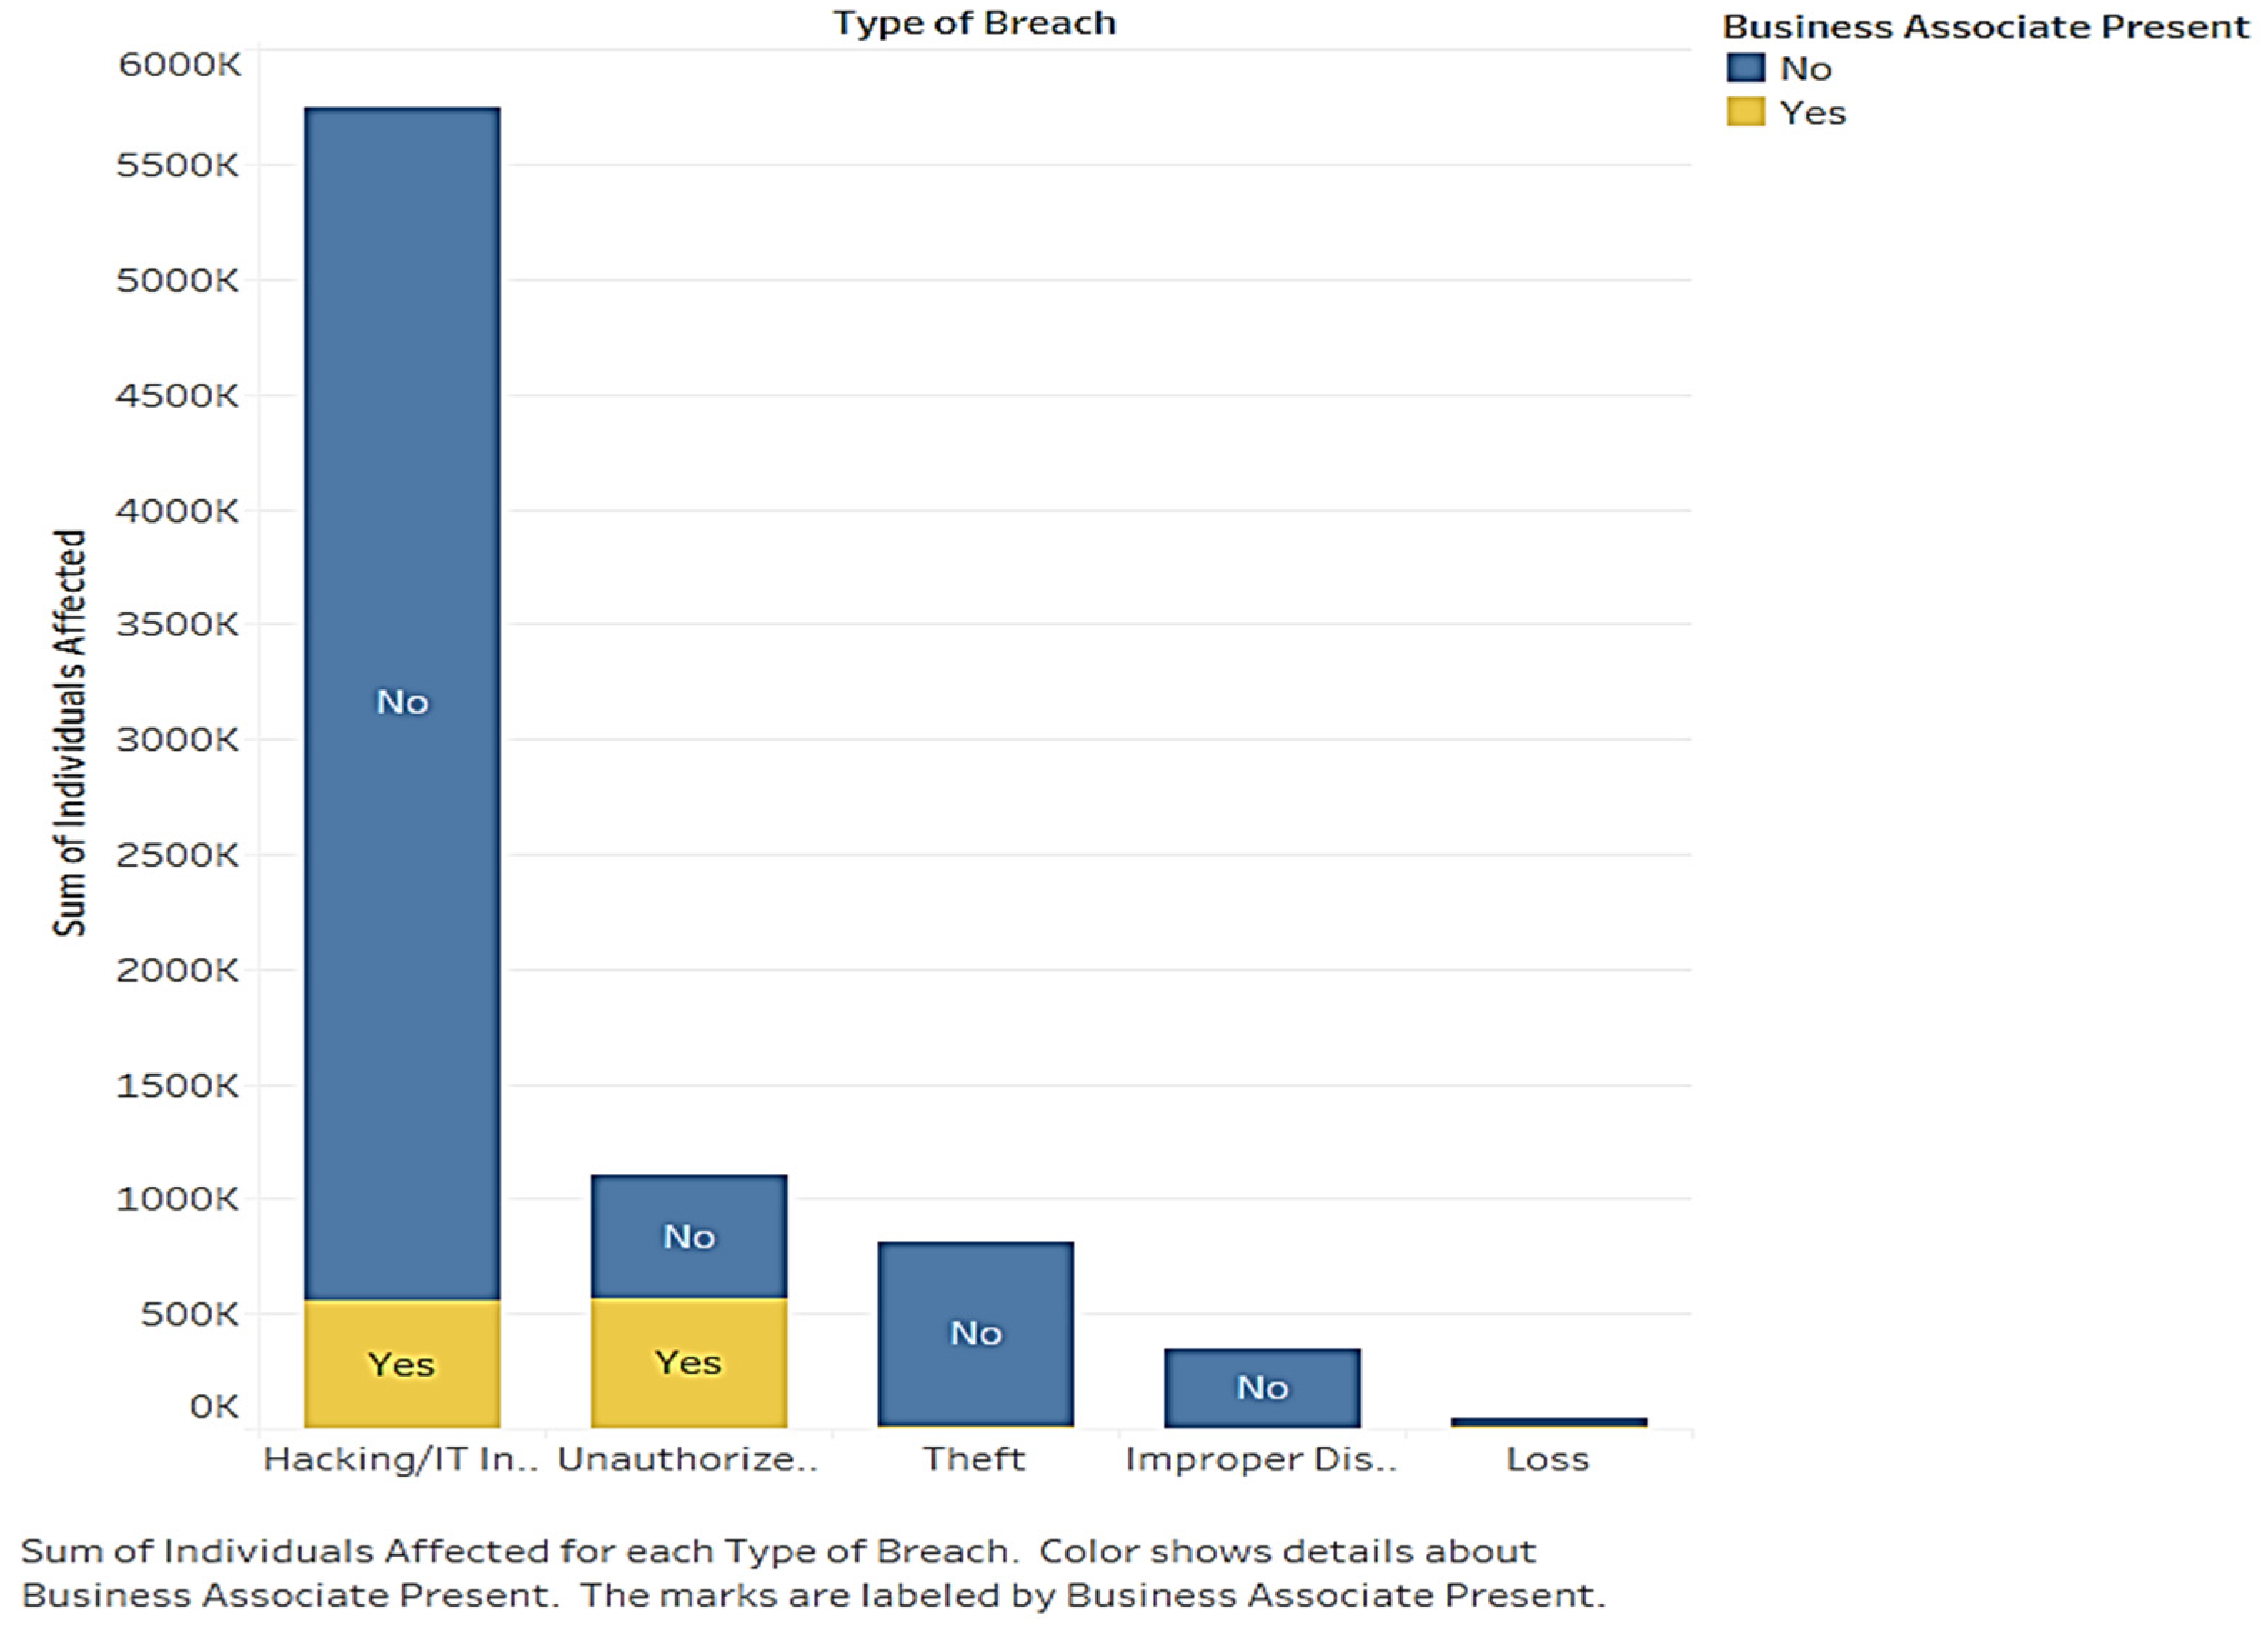
We also shed light on the presence of business associates as a core subject in understanding data breaches and entities. The business associate category presents various behaviors for each type of data breach (see
Figure 9). The stacked bar chart shows the secondary distribution of individuals affected by business associates regarding type of breach. The bars show that business associates are correlated with hacking and unauthorized access. However, most affected individuals are not related to the business associates.
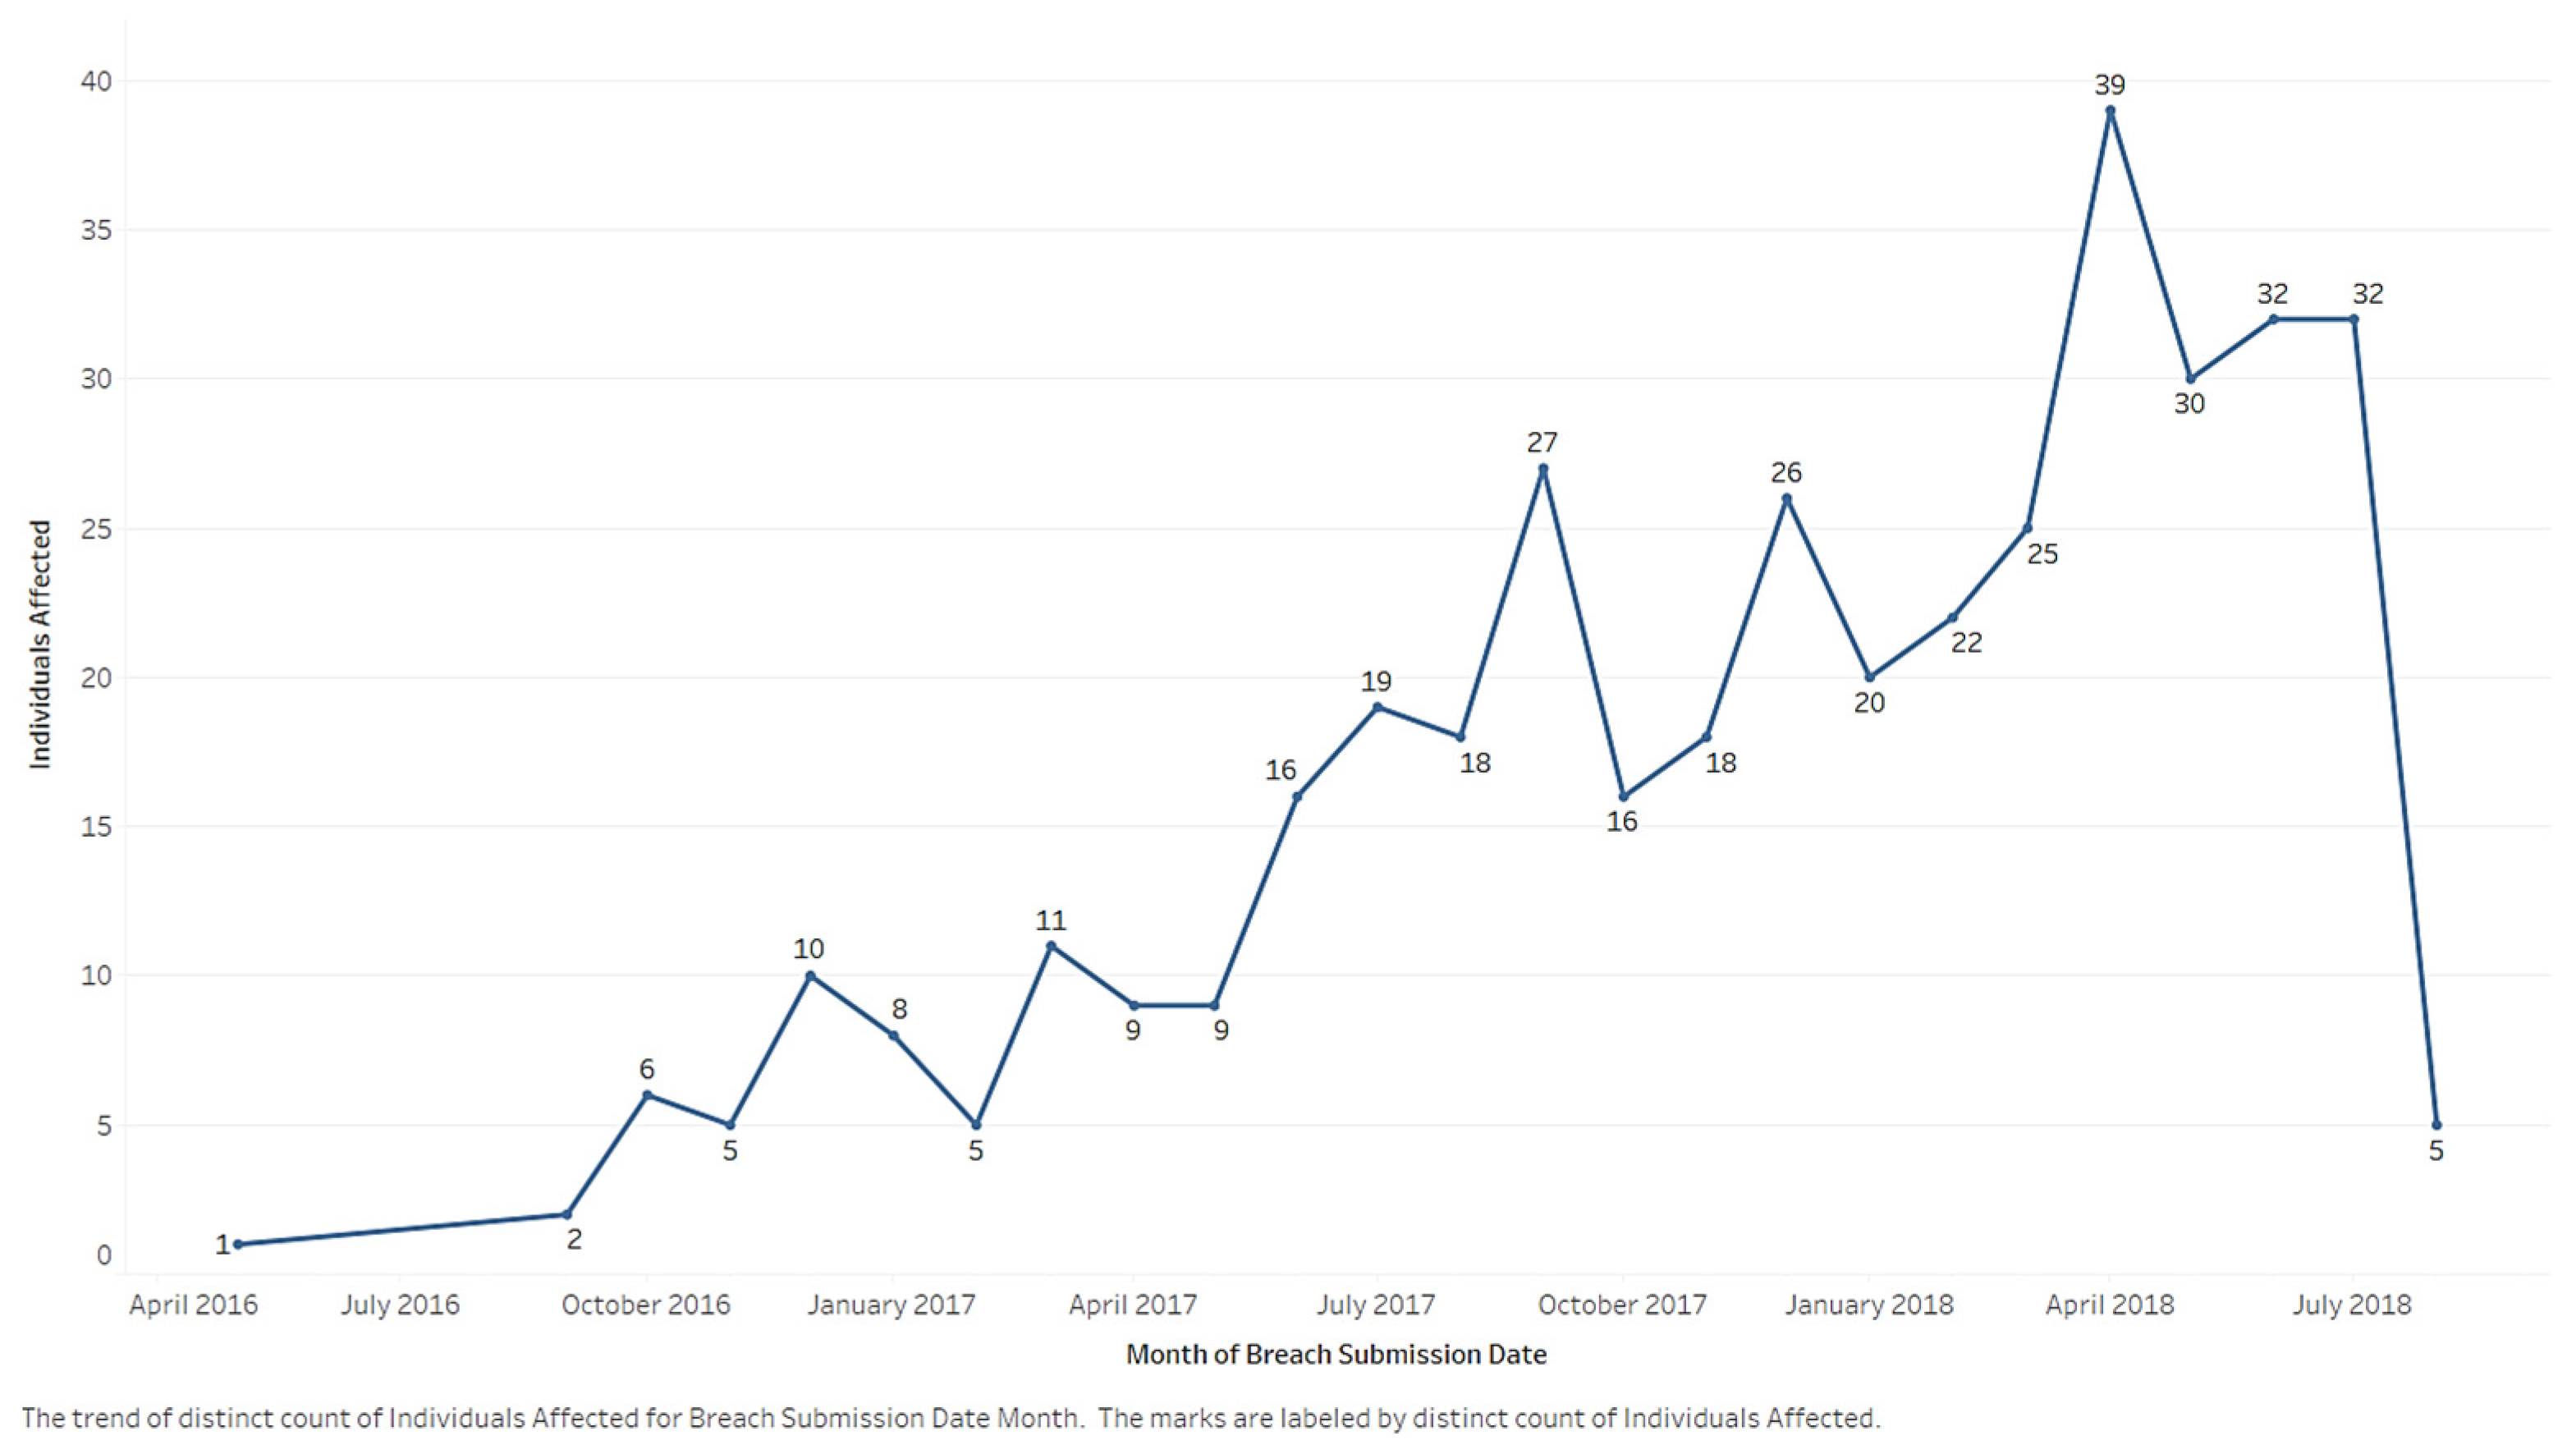
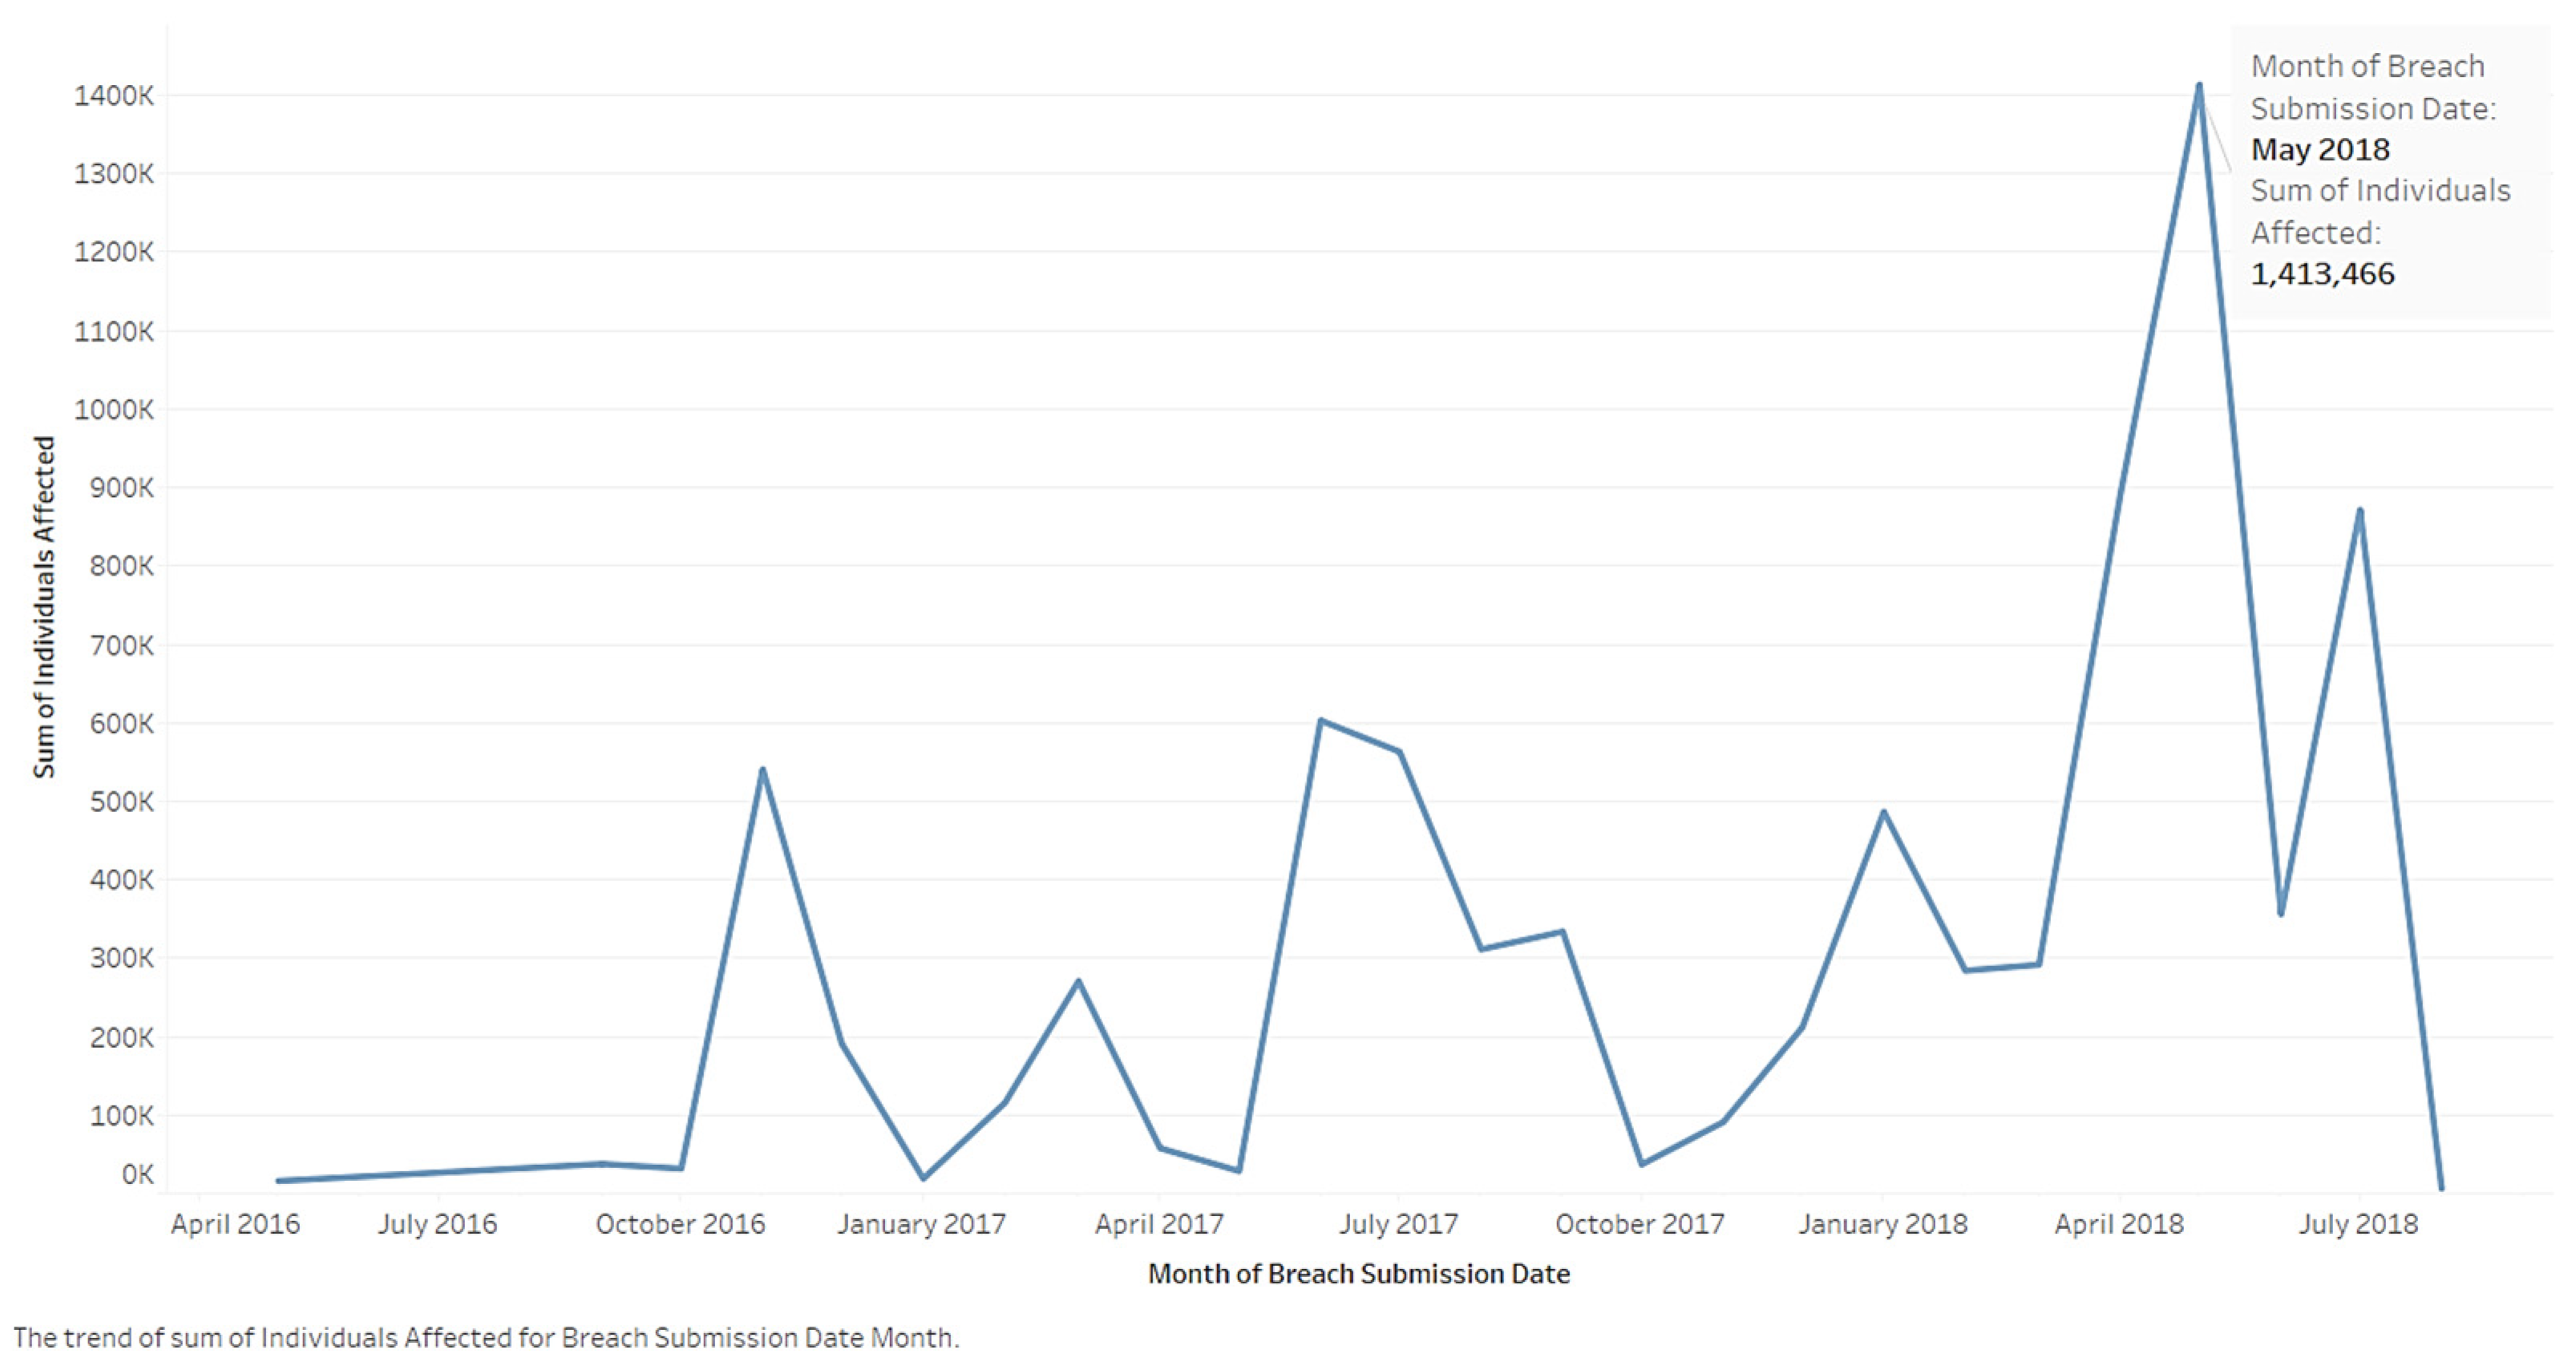
Research on affected individuals in data breaches and breach records depicts a developing trend in breaches over time.
Figure 10 shows the trends in the number of records.
Figure 11 shows the number of affected individuals. Although it varies, there is a near constant increasing trend displayed in
Figure 10. Although the month with the most reported records was April 2018, the month with the most individuals involved in data breaches was May (1,413,466 individuals). The surge in breaches in April–May warrant additional research, including looking at anecdotal evidence.
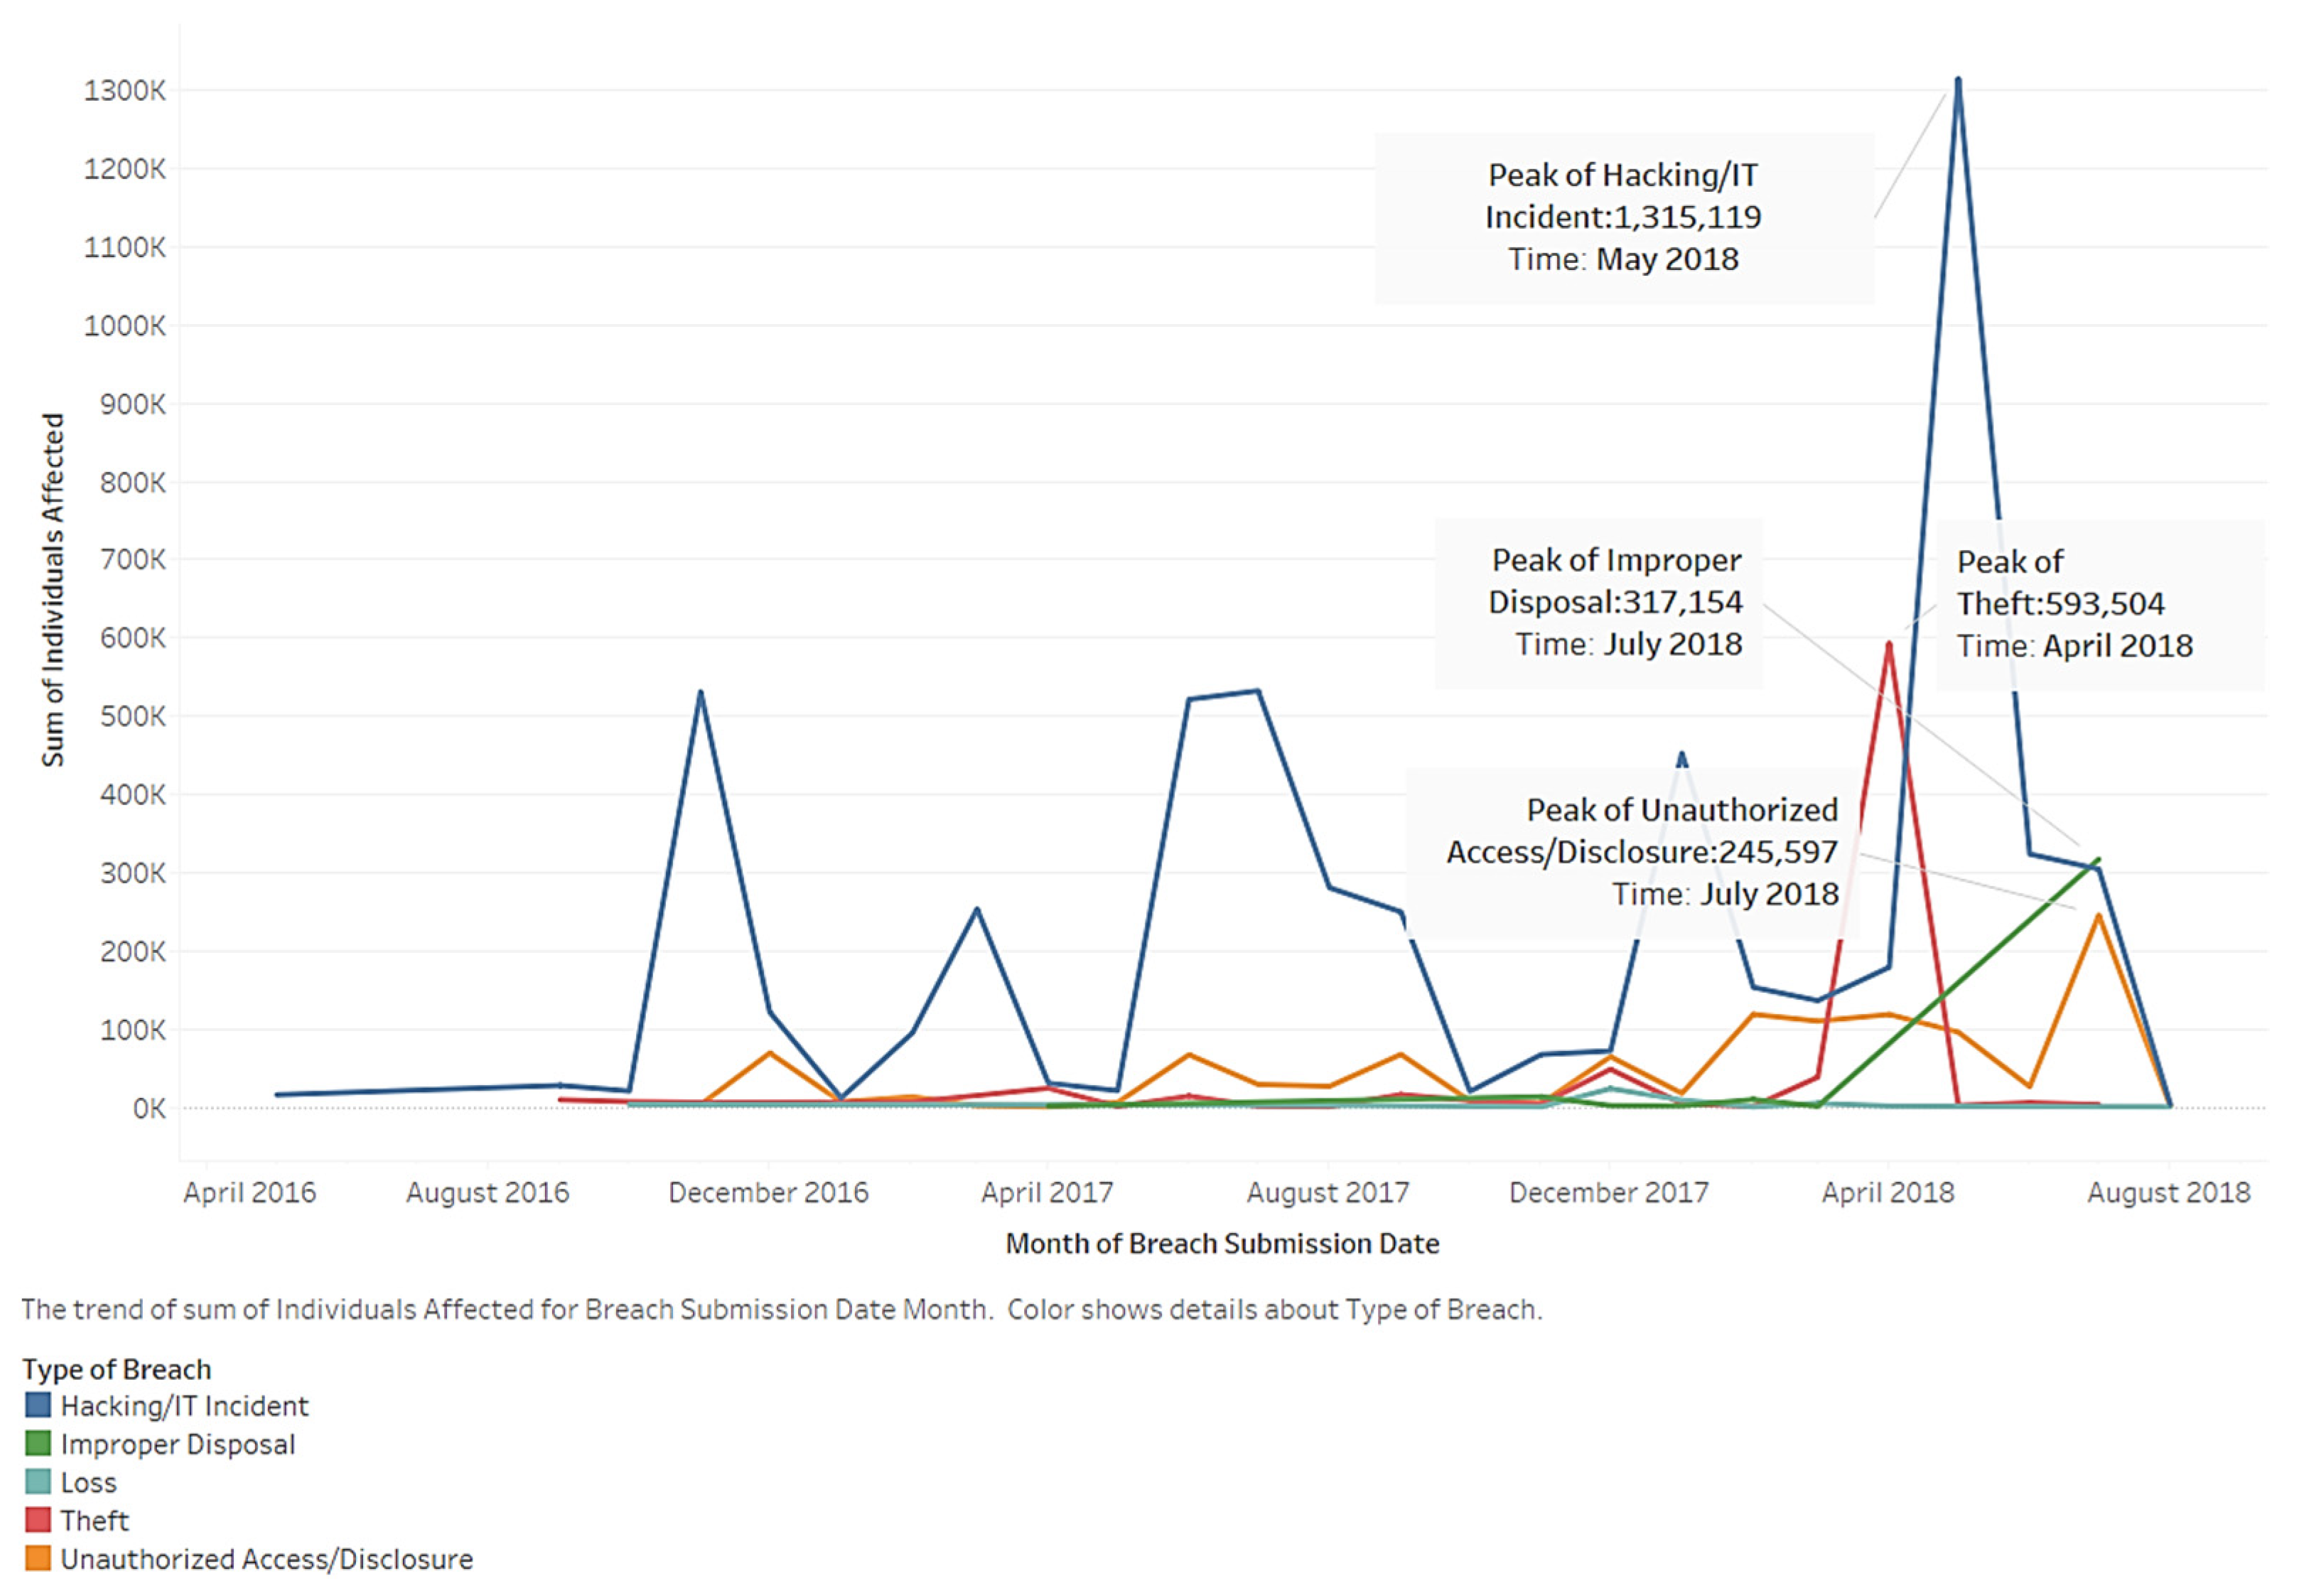
Figure 12 illustrates an analysis of the trend distinguished by breach type. Each of the five lines represent a specific breach type. The line above all the others represents hacking/IT incidents. The line below it represents unauthorized access/disclosure. Peak values for the breaches occurred in the last year. Hacking/IT incidents, improper disposal, theft, and unauthorized access/disclosure show an increasing trend. However, there is a weaker increasing trend related to hacking/IT incidents. Therefore, the other breach types warrant attention. Hacking/IT incidents, improper disposal, theft, and unauthorized access/disclosure show an increasing trend. Loss shows a declining trend in regard to its impact on individuals.
The fluctuation in affected individuals by type is interesting. However, although improper disposal remained stable, there was a sudden rise. Due to this abnormal trend, related companies and entities should pay attention to the overall data and focus on continually monitoring breaches.
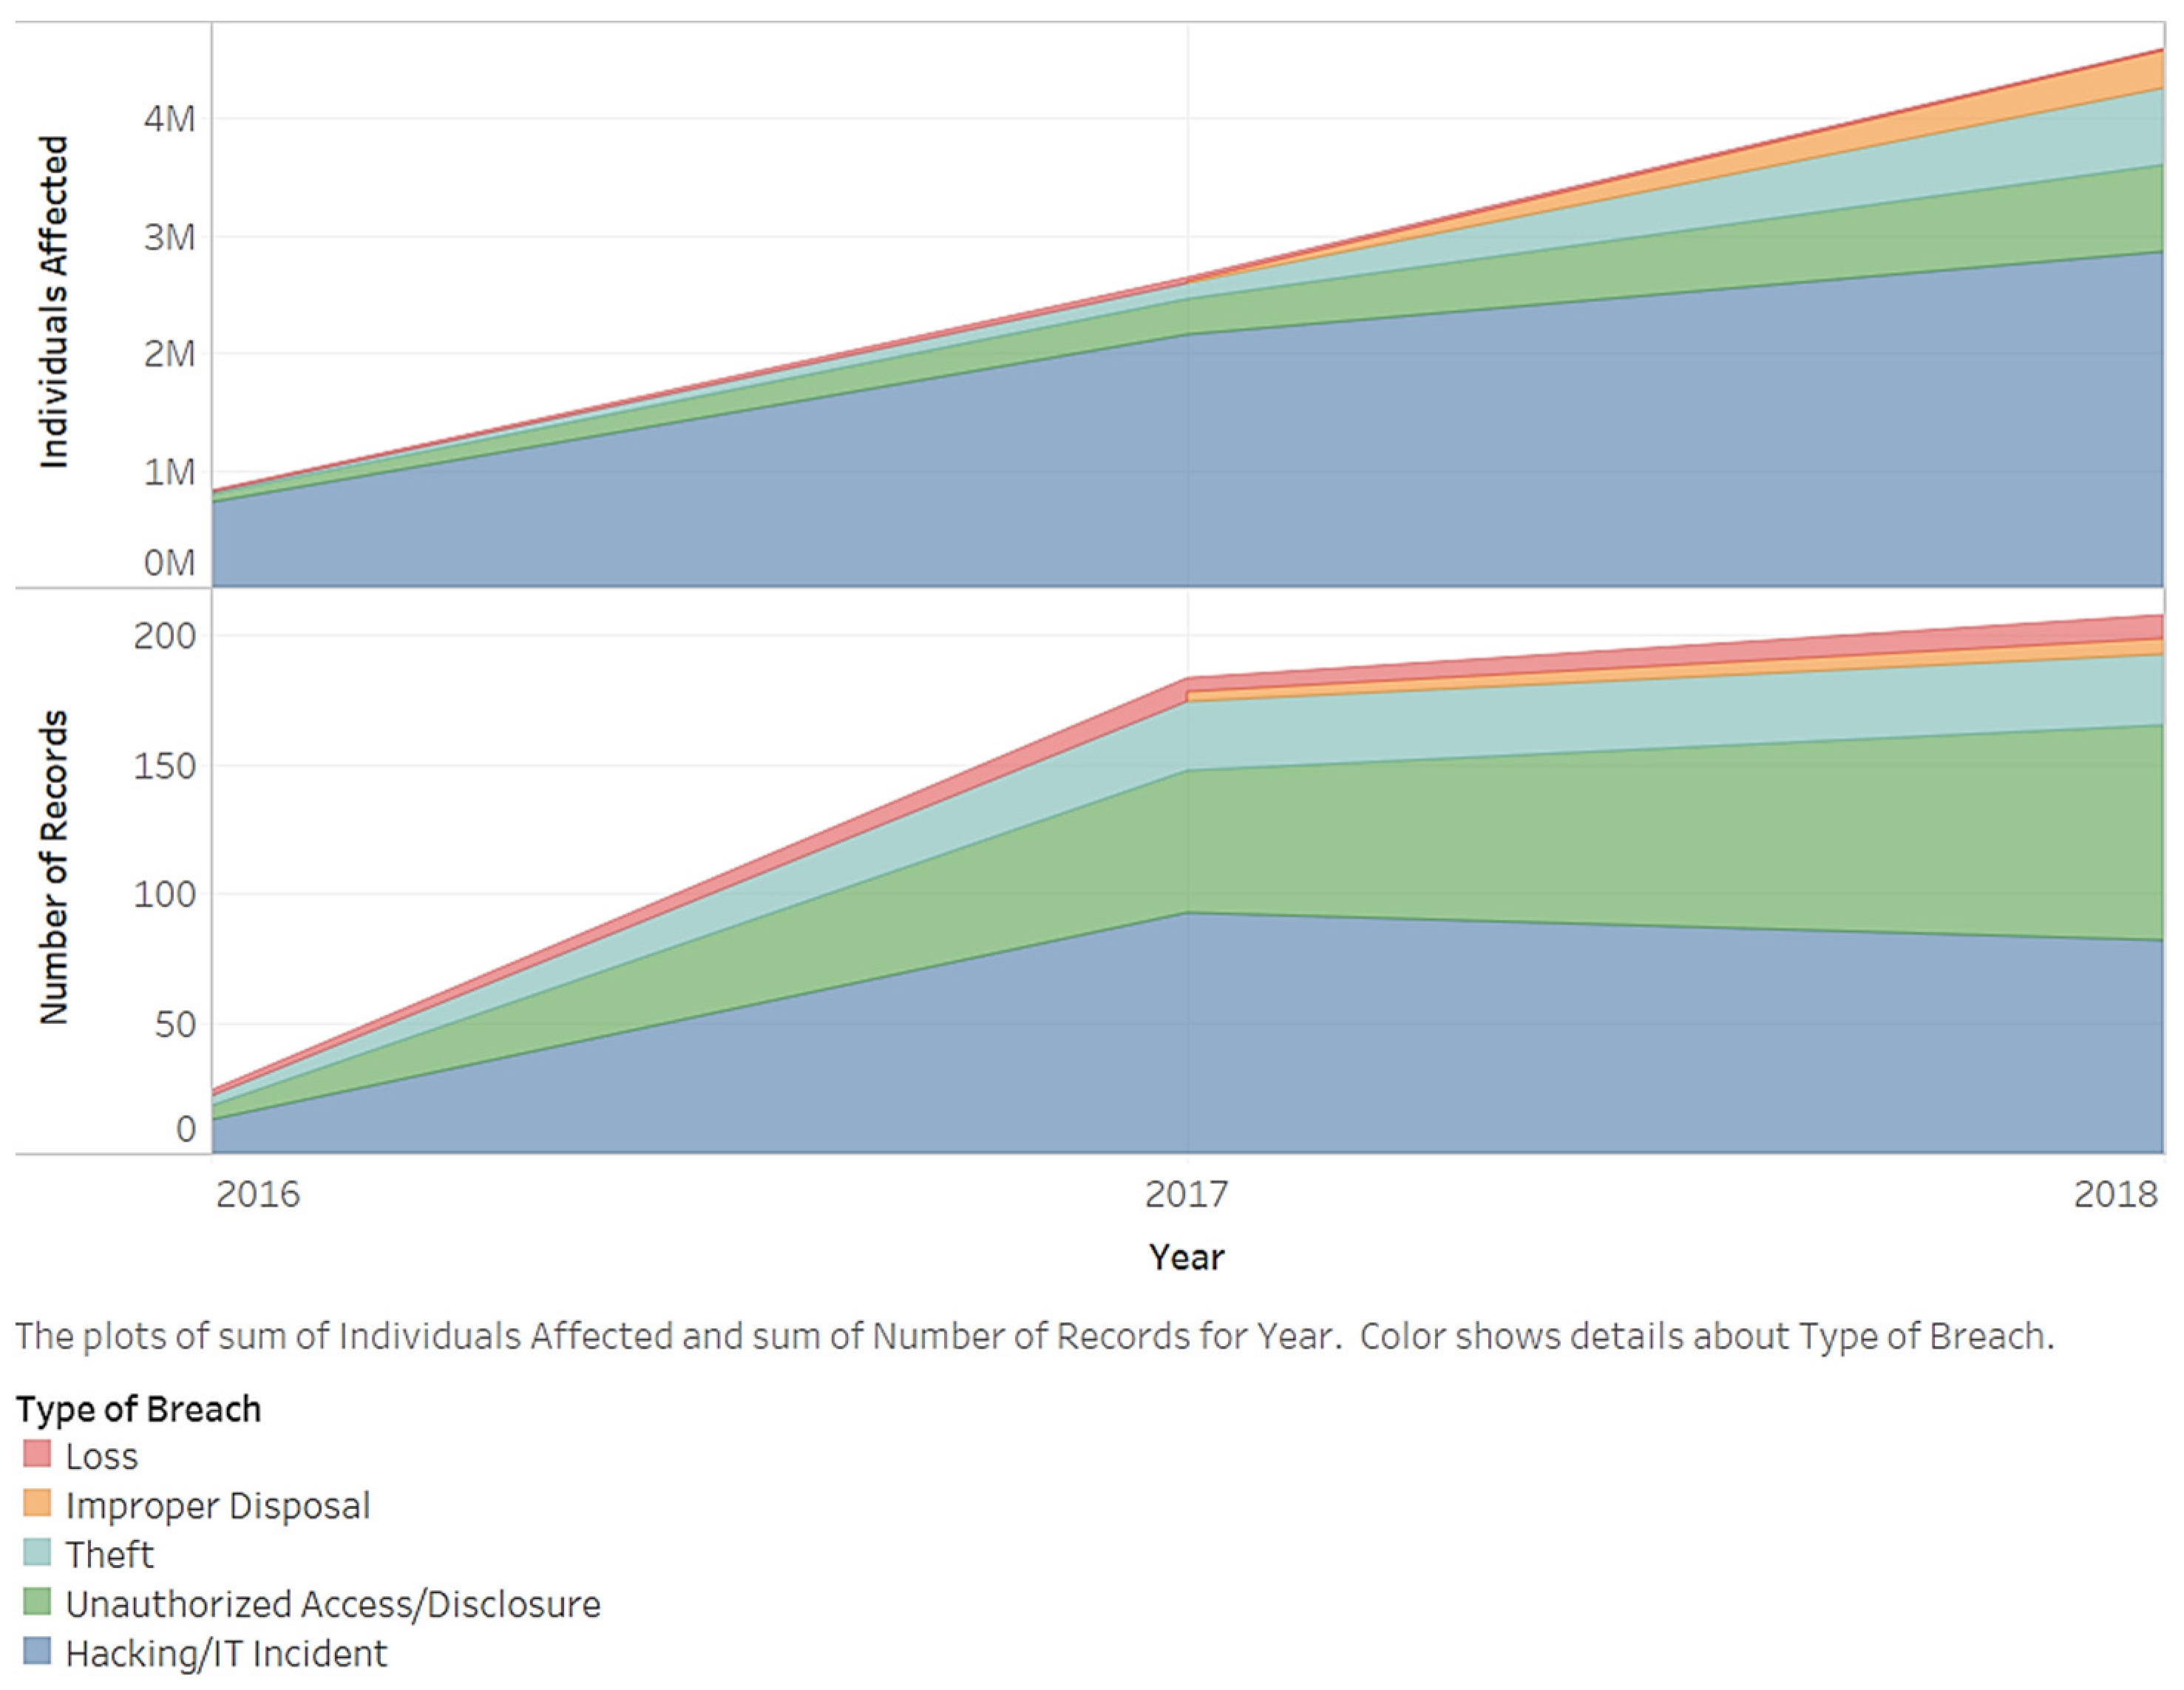
Figure 13 ranks the types of breaches, trends in time, and accumulated values. The ranking of types remained the same for both the number of records and affected individuals. The accumulated values increased over time. However, they occurred at different speeds. Hacking ranked first. Its increasing speed slowed over time. Hacking’s record is smaller in 2018 compared to other times. However, it still has the largest affected record of individuals, including the accumulation of other types.
We also analyzed affected individuals based on locations of data breaches over time. We assumed that some locations deserved more attention because breach conditions continued to evolve.
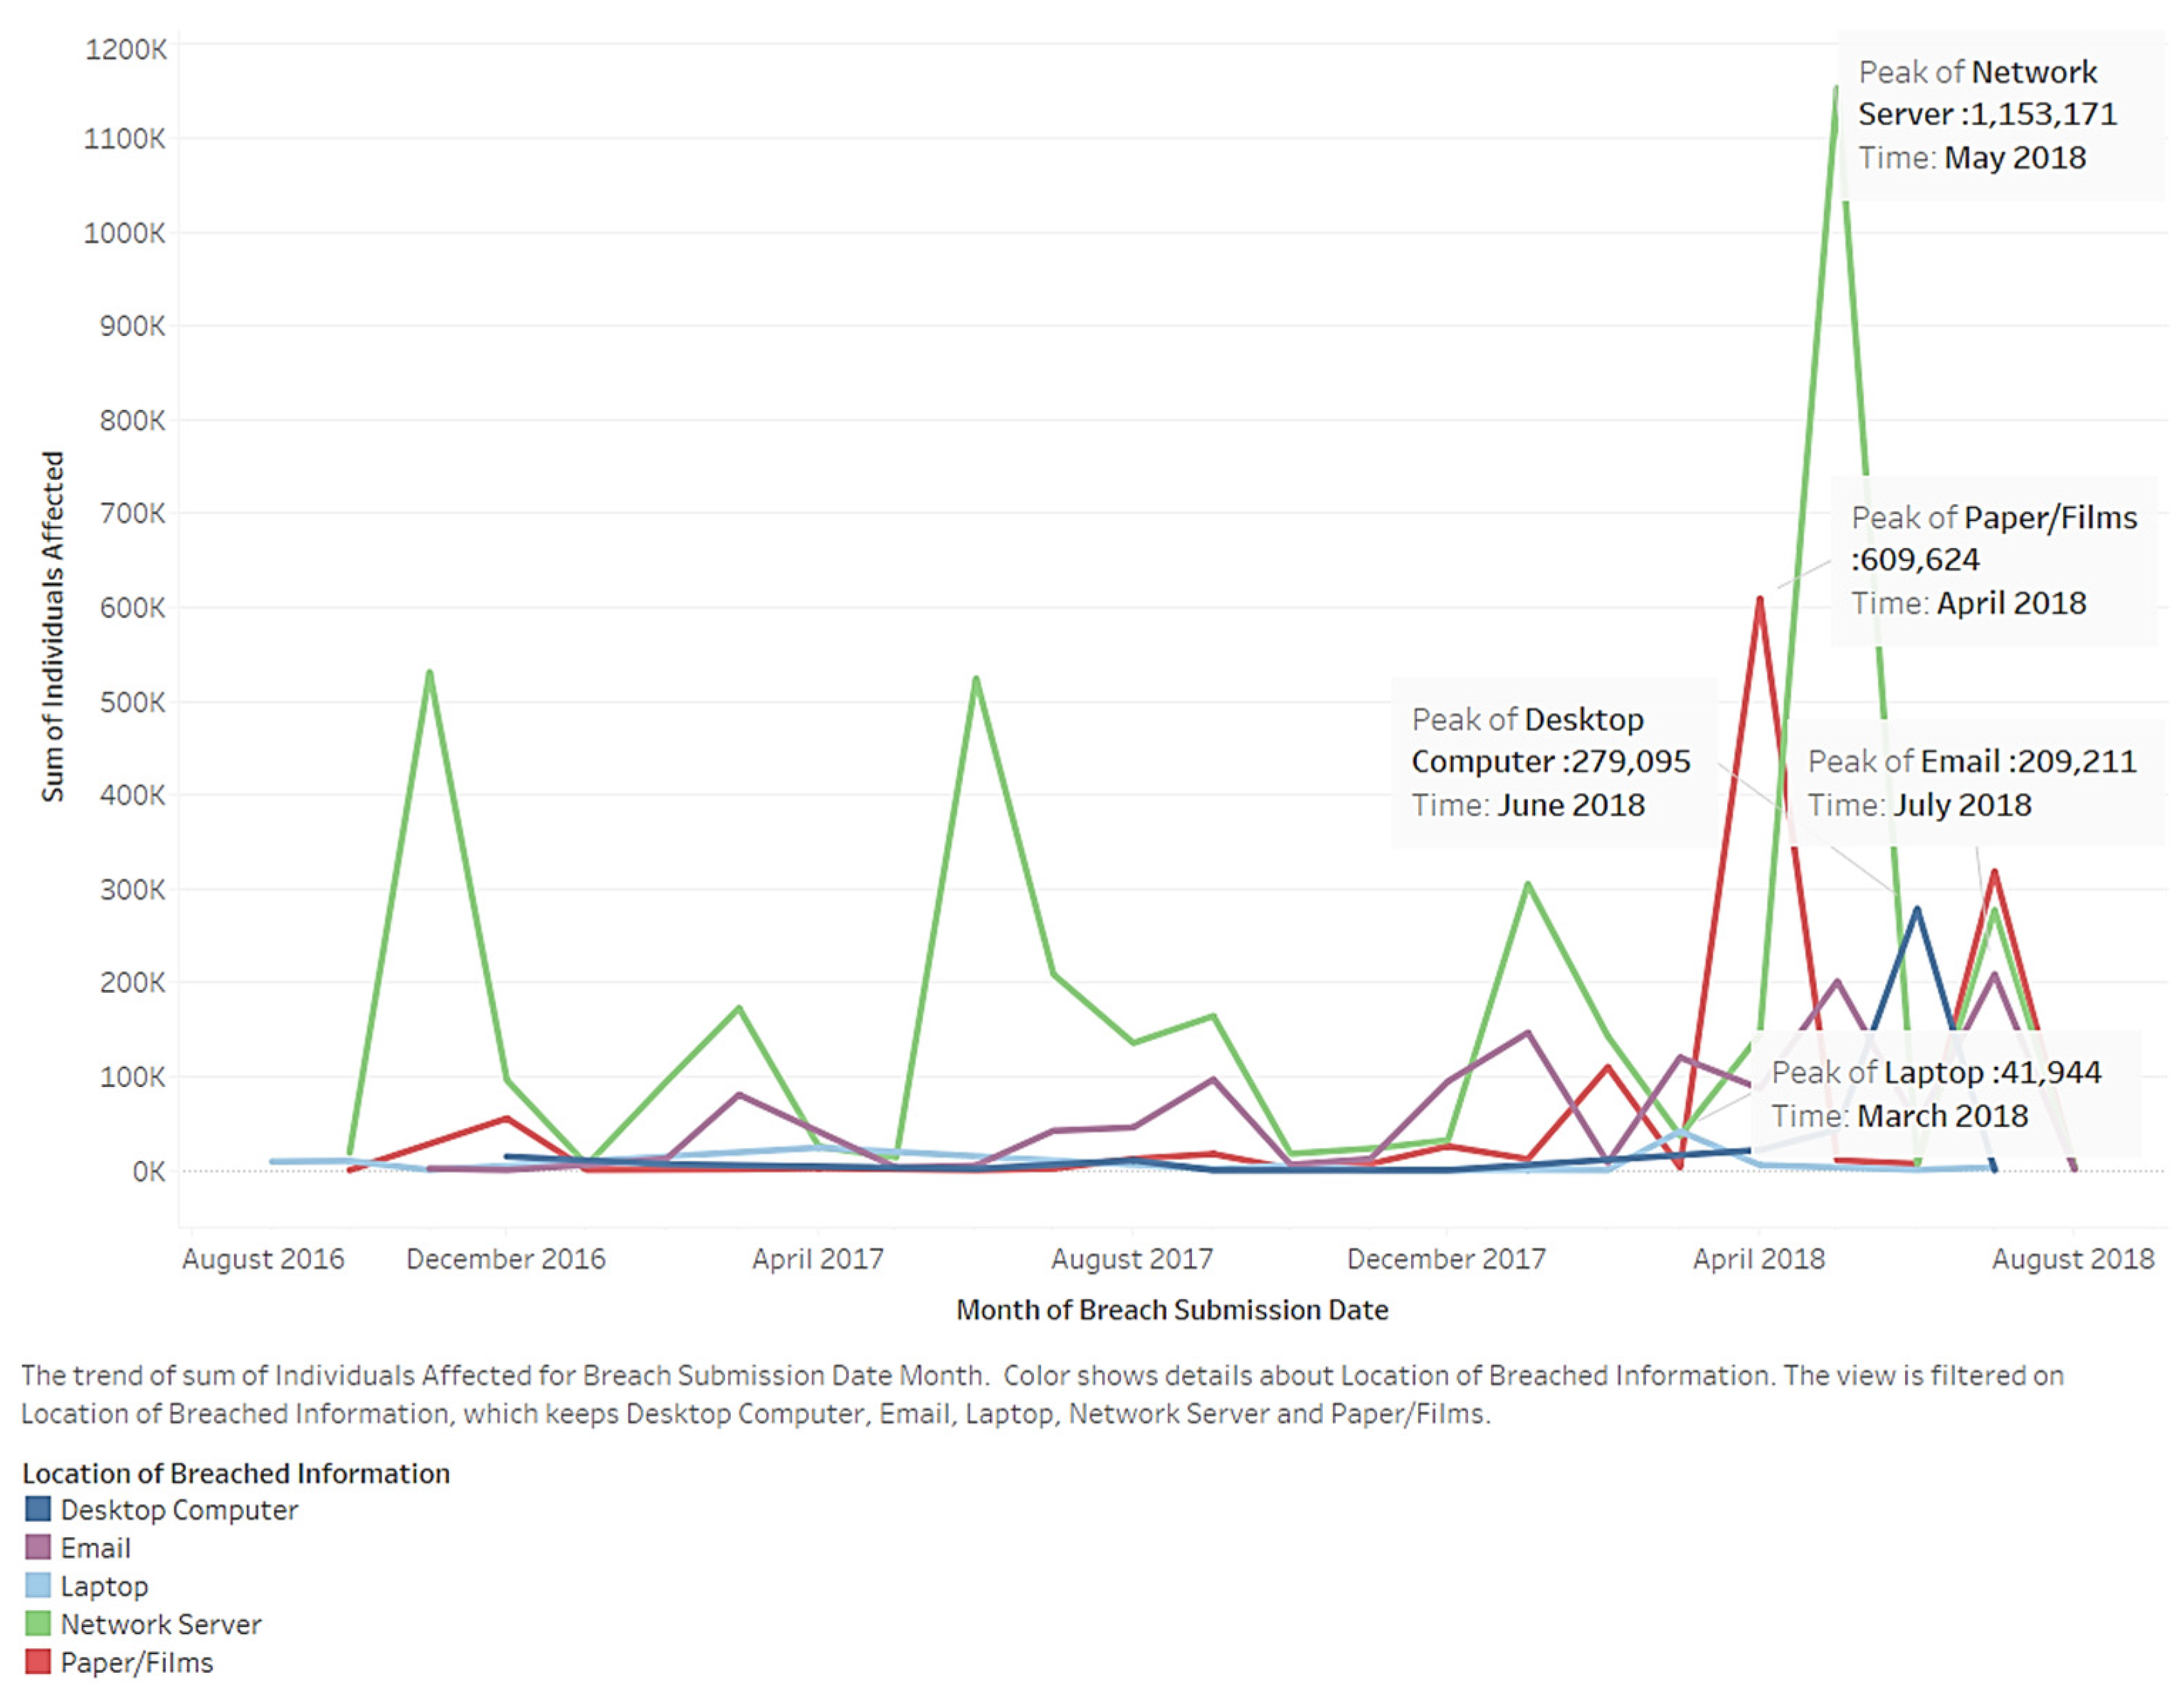
Figure 14 depicts the trends in individuals affected by the location of breached information by time. Common locations of breached information include e-mail, network servers, and papers/films. The use of papers/films increased sharply after 2017; network servers played a large role at all times. In addition, desktop computers and network servers had sudden increases (brown color). Additional attention should be paid to the film industry due to its popularity and absorption of individuals. Affected individuals increased in every location. This shows that issues related to identity theft are becoming more serious.
Figure 15 shows the number of individuals affected by month (colors represent location). The chart shows common locations regarding individuals involved in a data breach. Others are filtered. The use of networks increased sharply in May 2018. In addition, desktop computers and network servers experienced a sudden increase. Peak values appeared in 2018. The film industry gained popularity, absorbing more people over time. Therefore, this location deserves additional attention. Nearly all affected individuals showed an increase in every location. This shows that identity theft issues are becoming more serious.
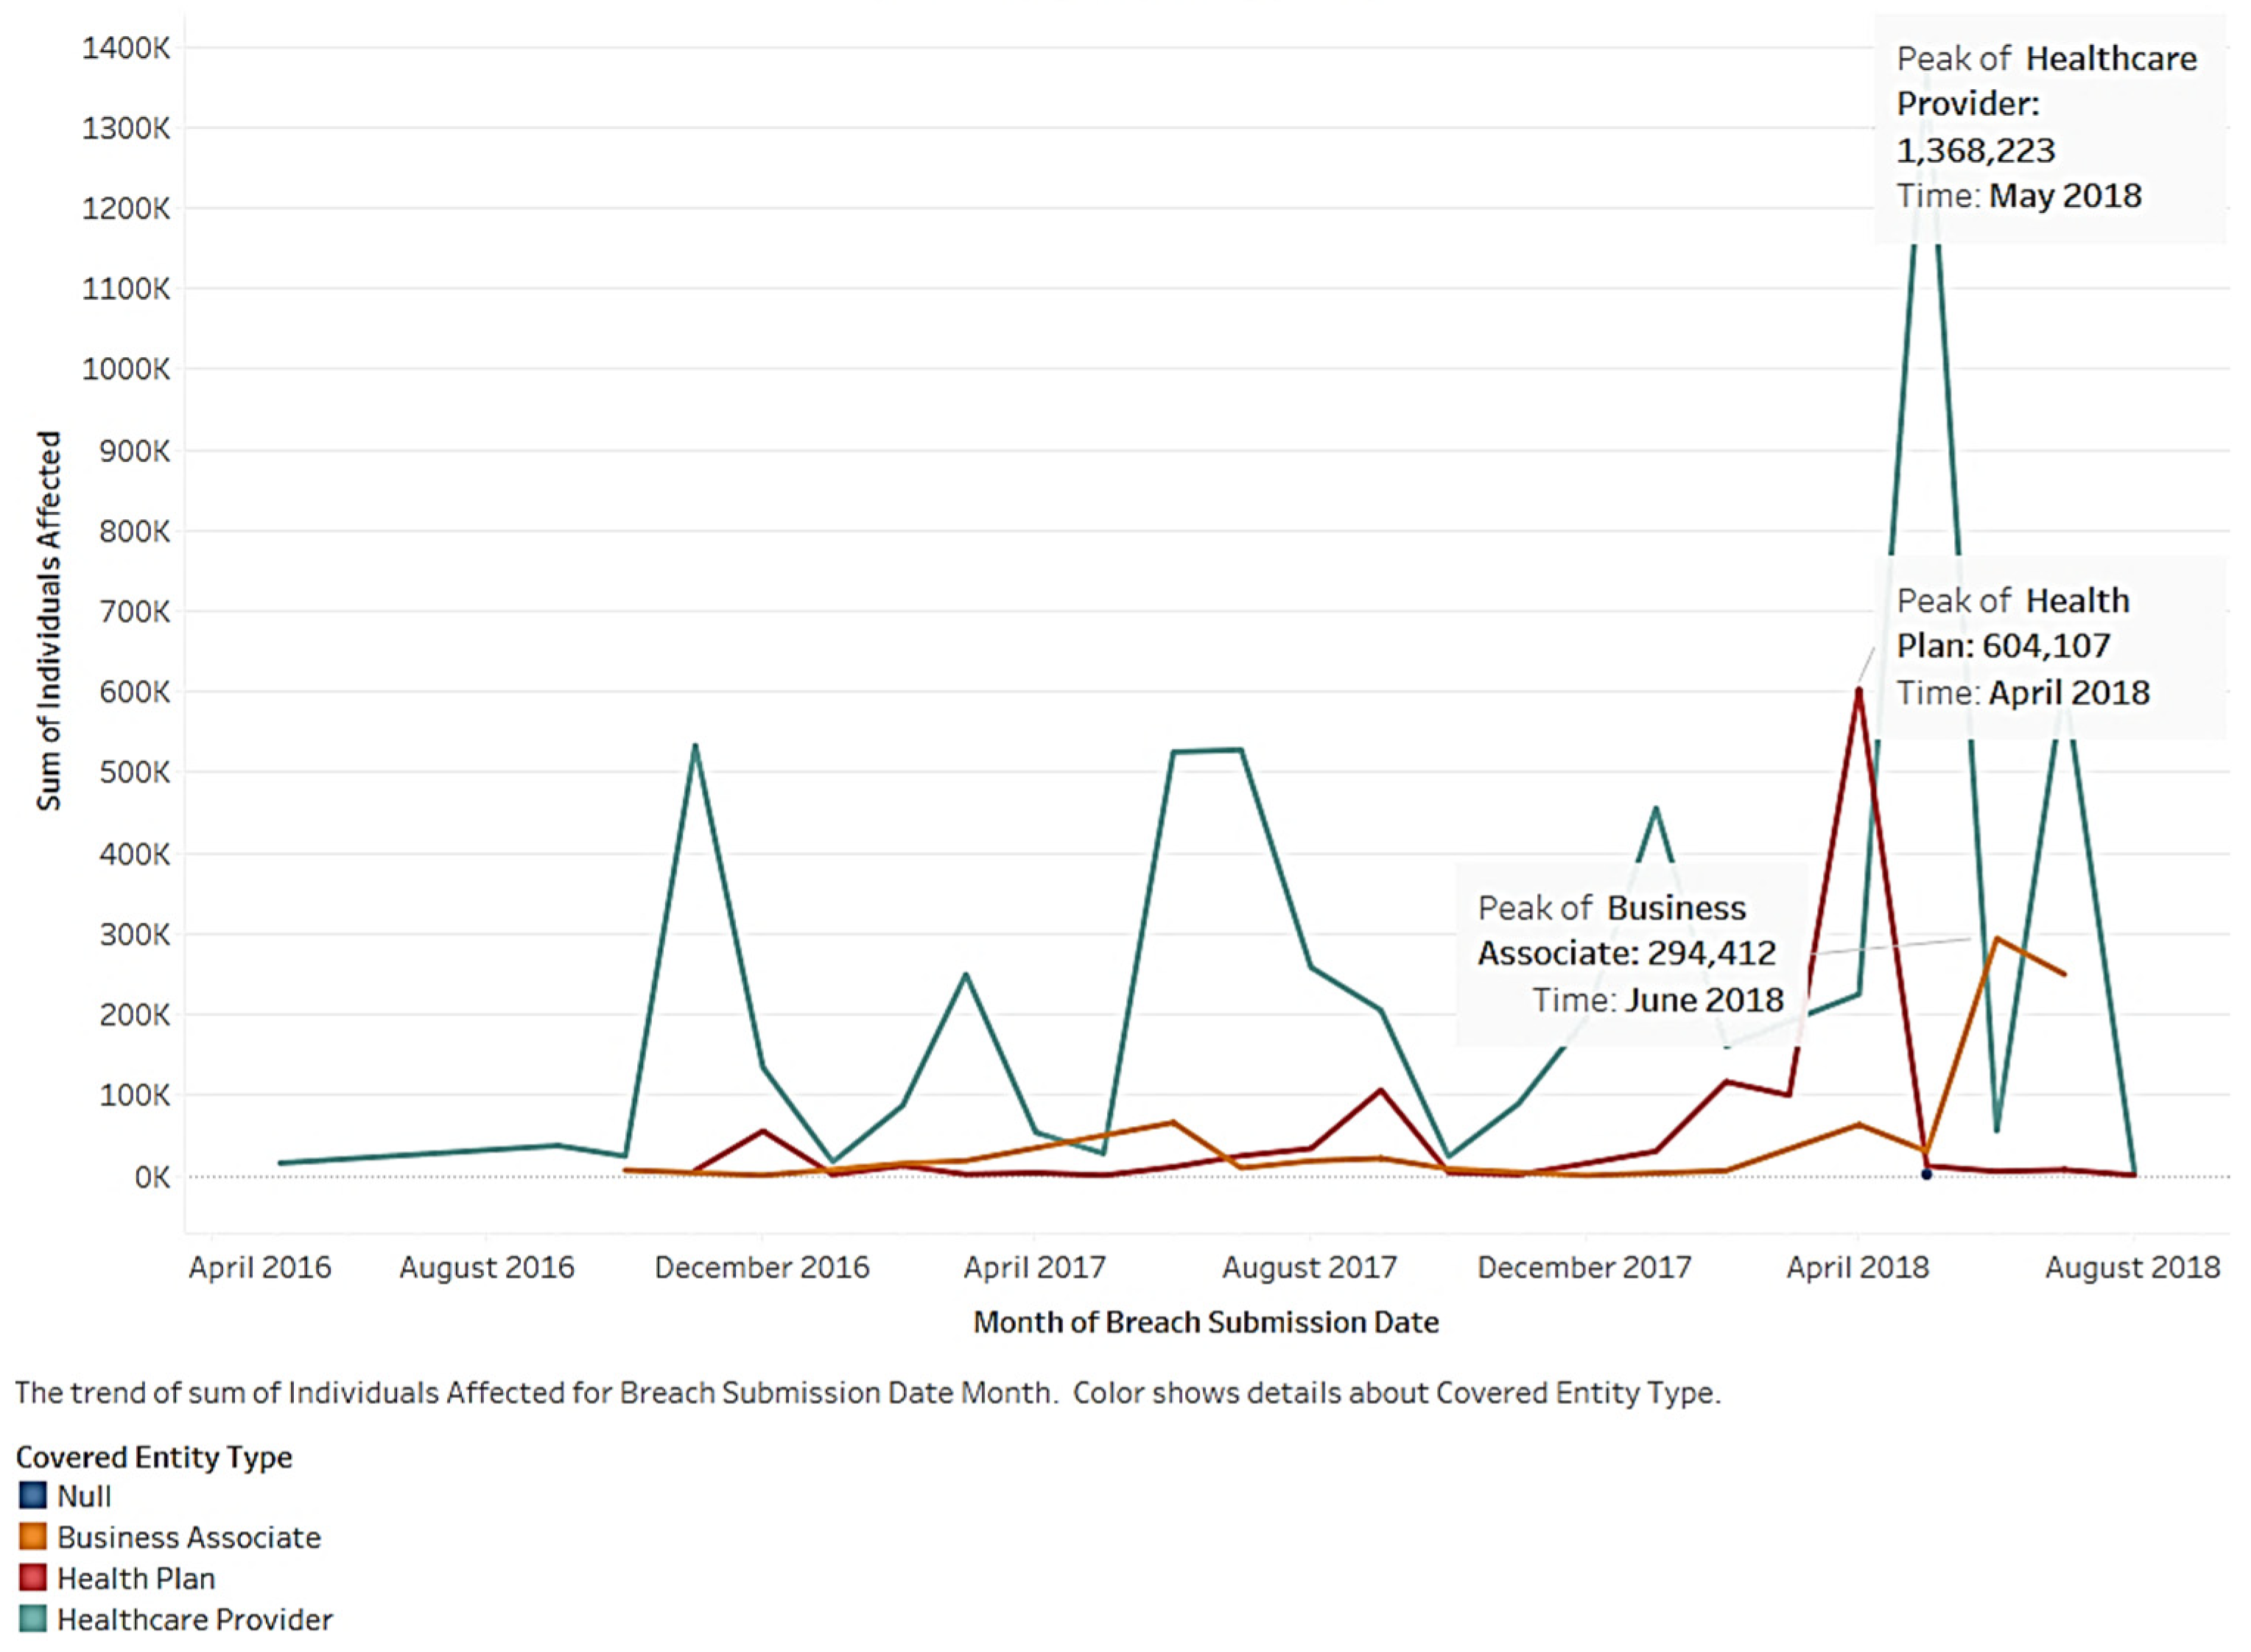
Next, we plotted the breach trends of the covered entity types by month (see
Figure 16). This area chart depicts the trends in individuals affected by the covered entity types. Healthcare providers, as compared to the other entities, continue to have a high volume of affected individuals. The three entities have a peak volume of affected individuals in different months throughout 2018. Overall, there is an increasing three-year trend for all three types. However, the numbers fluctuate each month. Beginning in April 2018, the number of affected health plan individuals maintained a small horizontal trend. Some changes, whether intended or coincidental, controlled the data breach. Additional investigations and monitoring need to be carried out for this trend. Breach accidents affected healthcare providers more compared to the other entities. Therefore, healthcare providers should focus on data breaches.
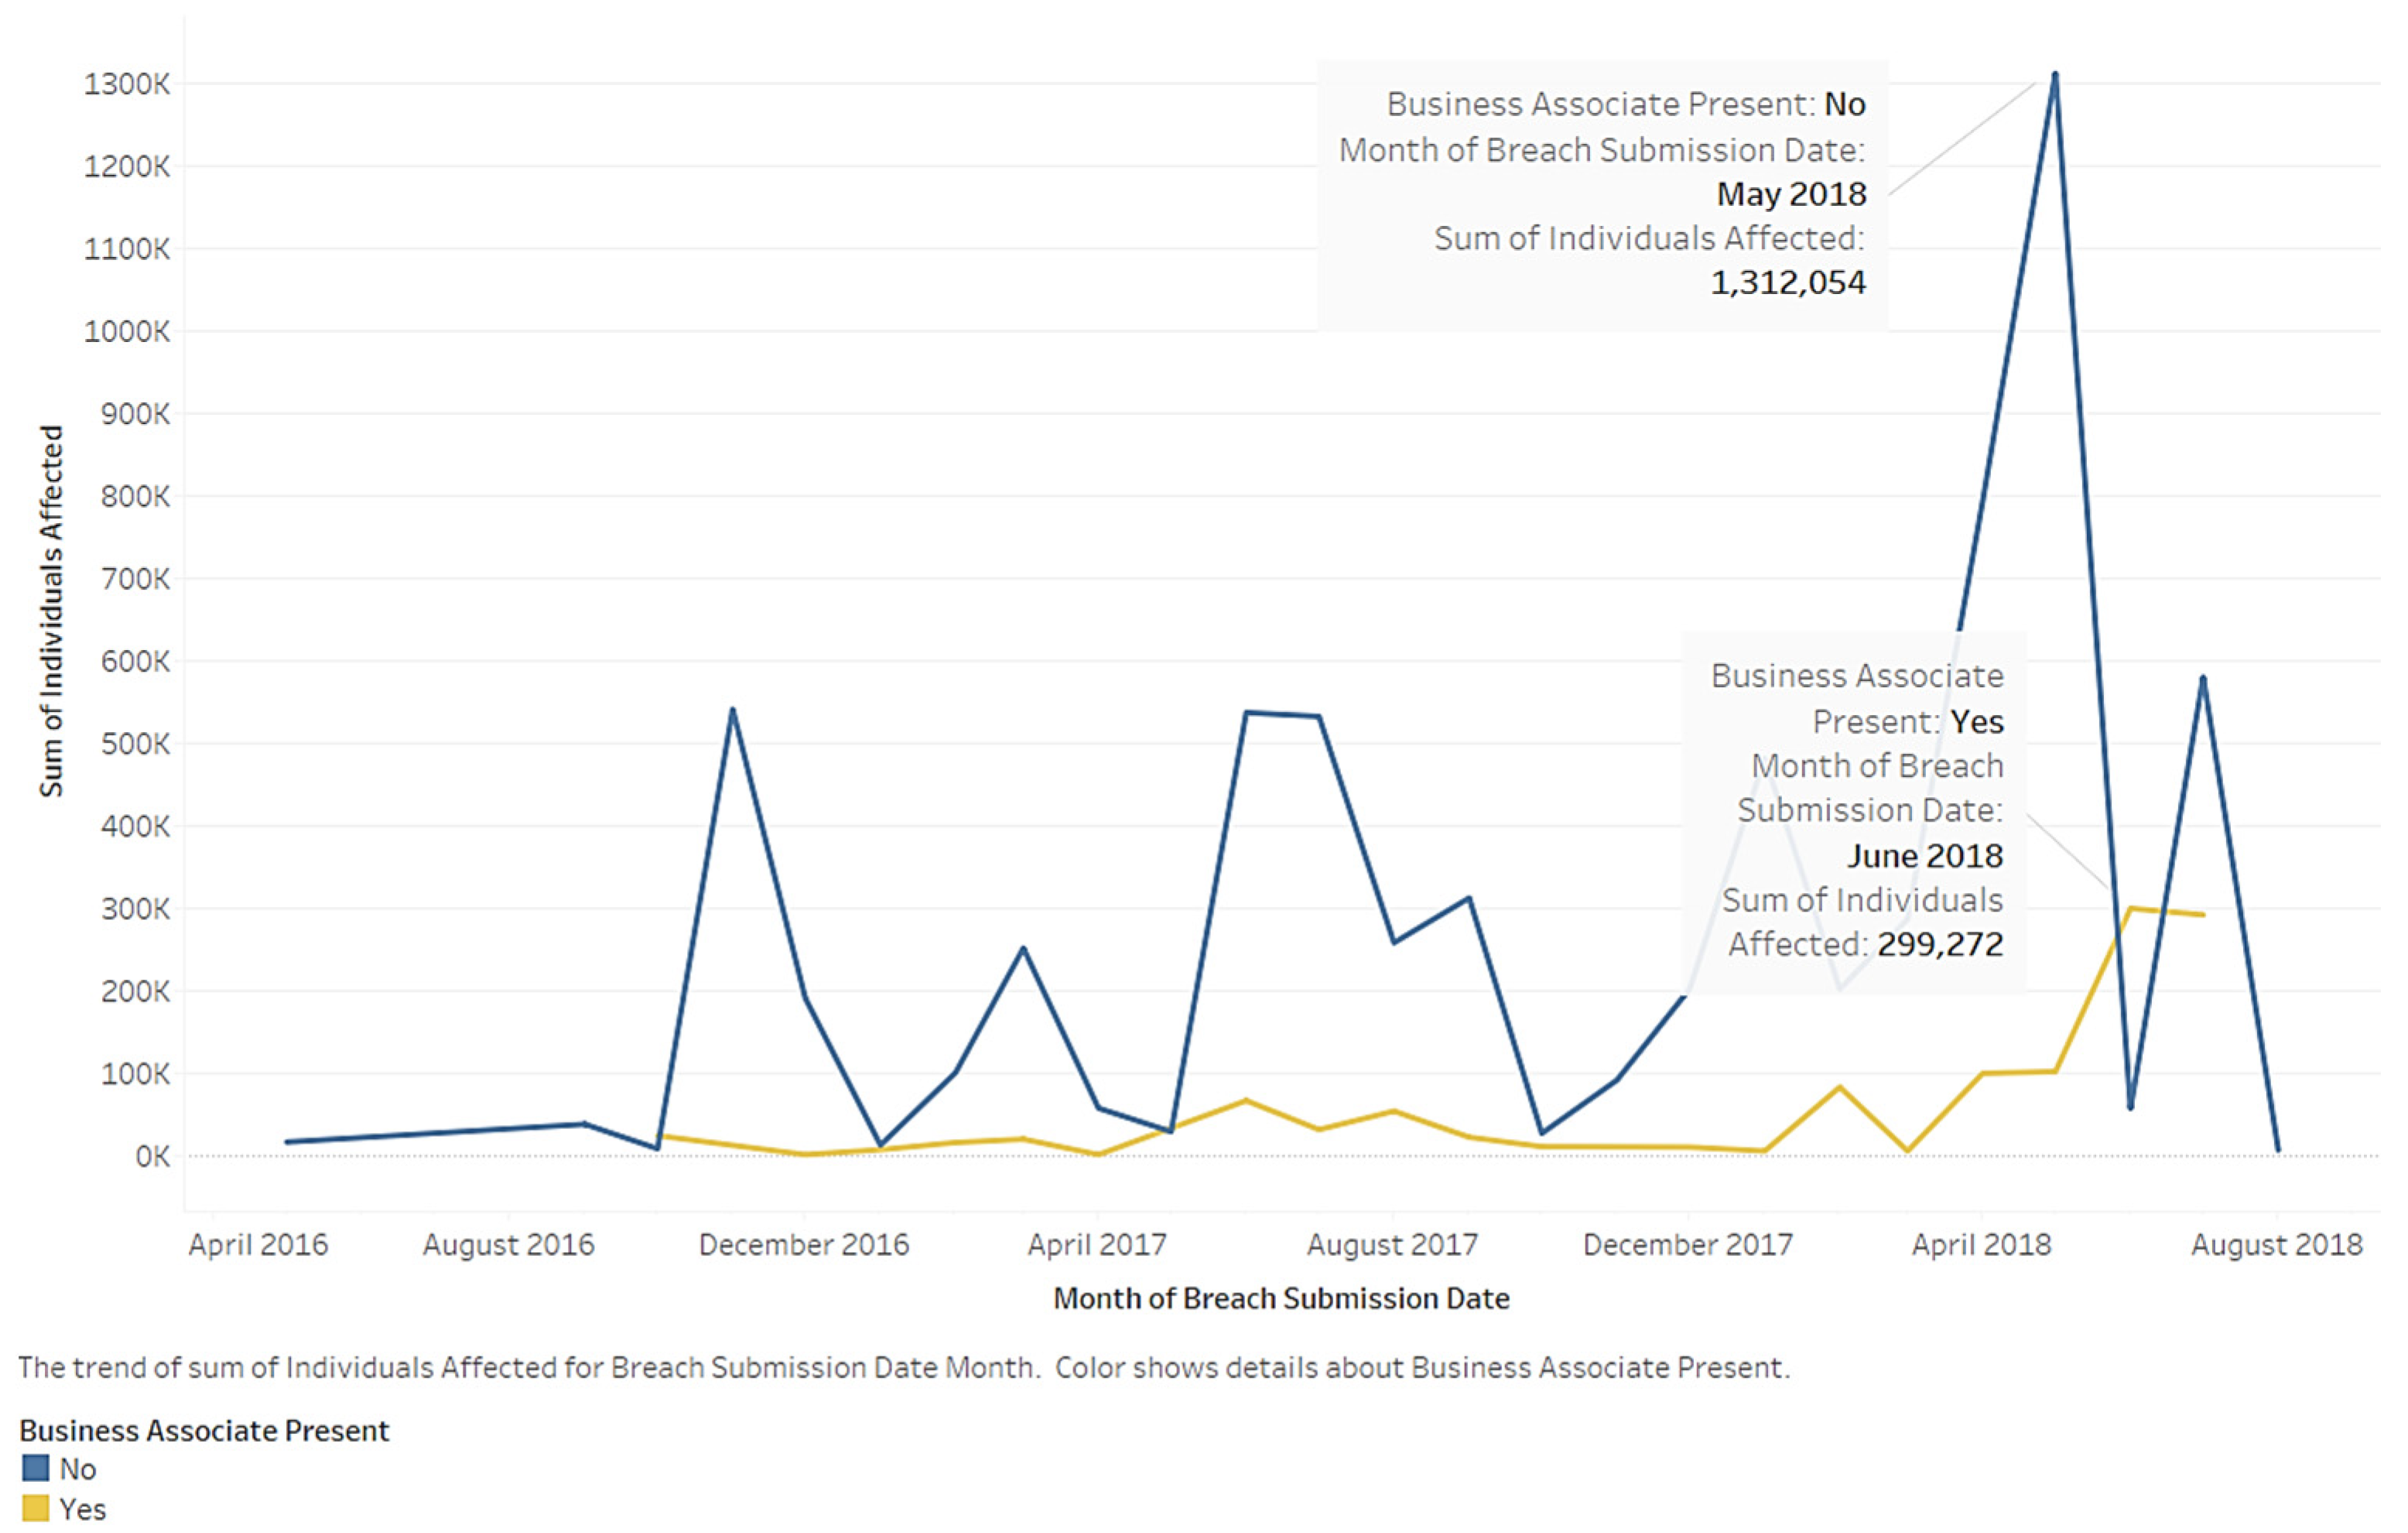
The relationship between a business associate being present and time is another important measurement. The area chart in
Figure 17 depicts the trends in individuals affected by business associates being present. Nonbusiness associates consistently affect a high volume of individuals as compared to business associates. The two lines peak in 2018. After 2018, the business associate category shows an increasing trend; the nonbusiness associate category also displays a significant increase in the affected individuals.
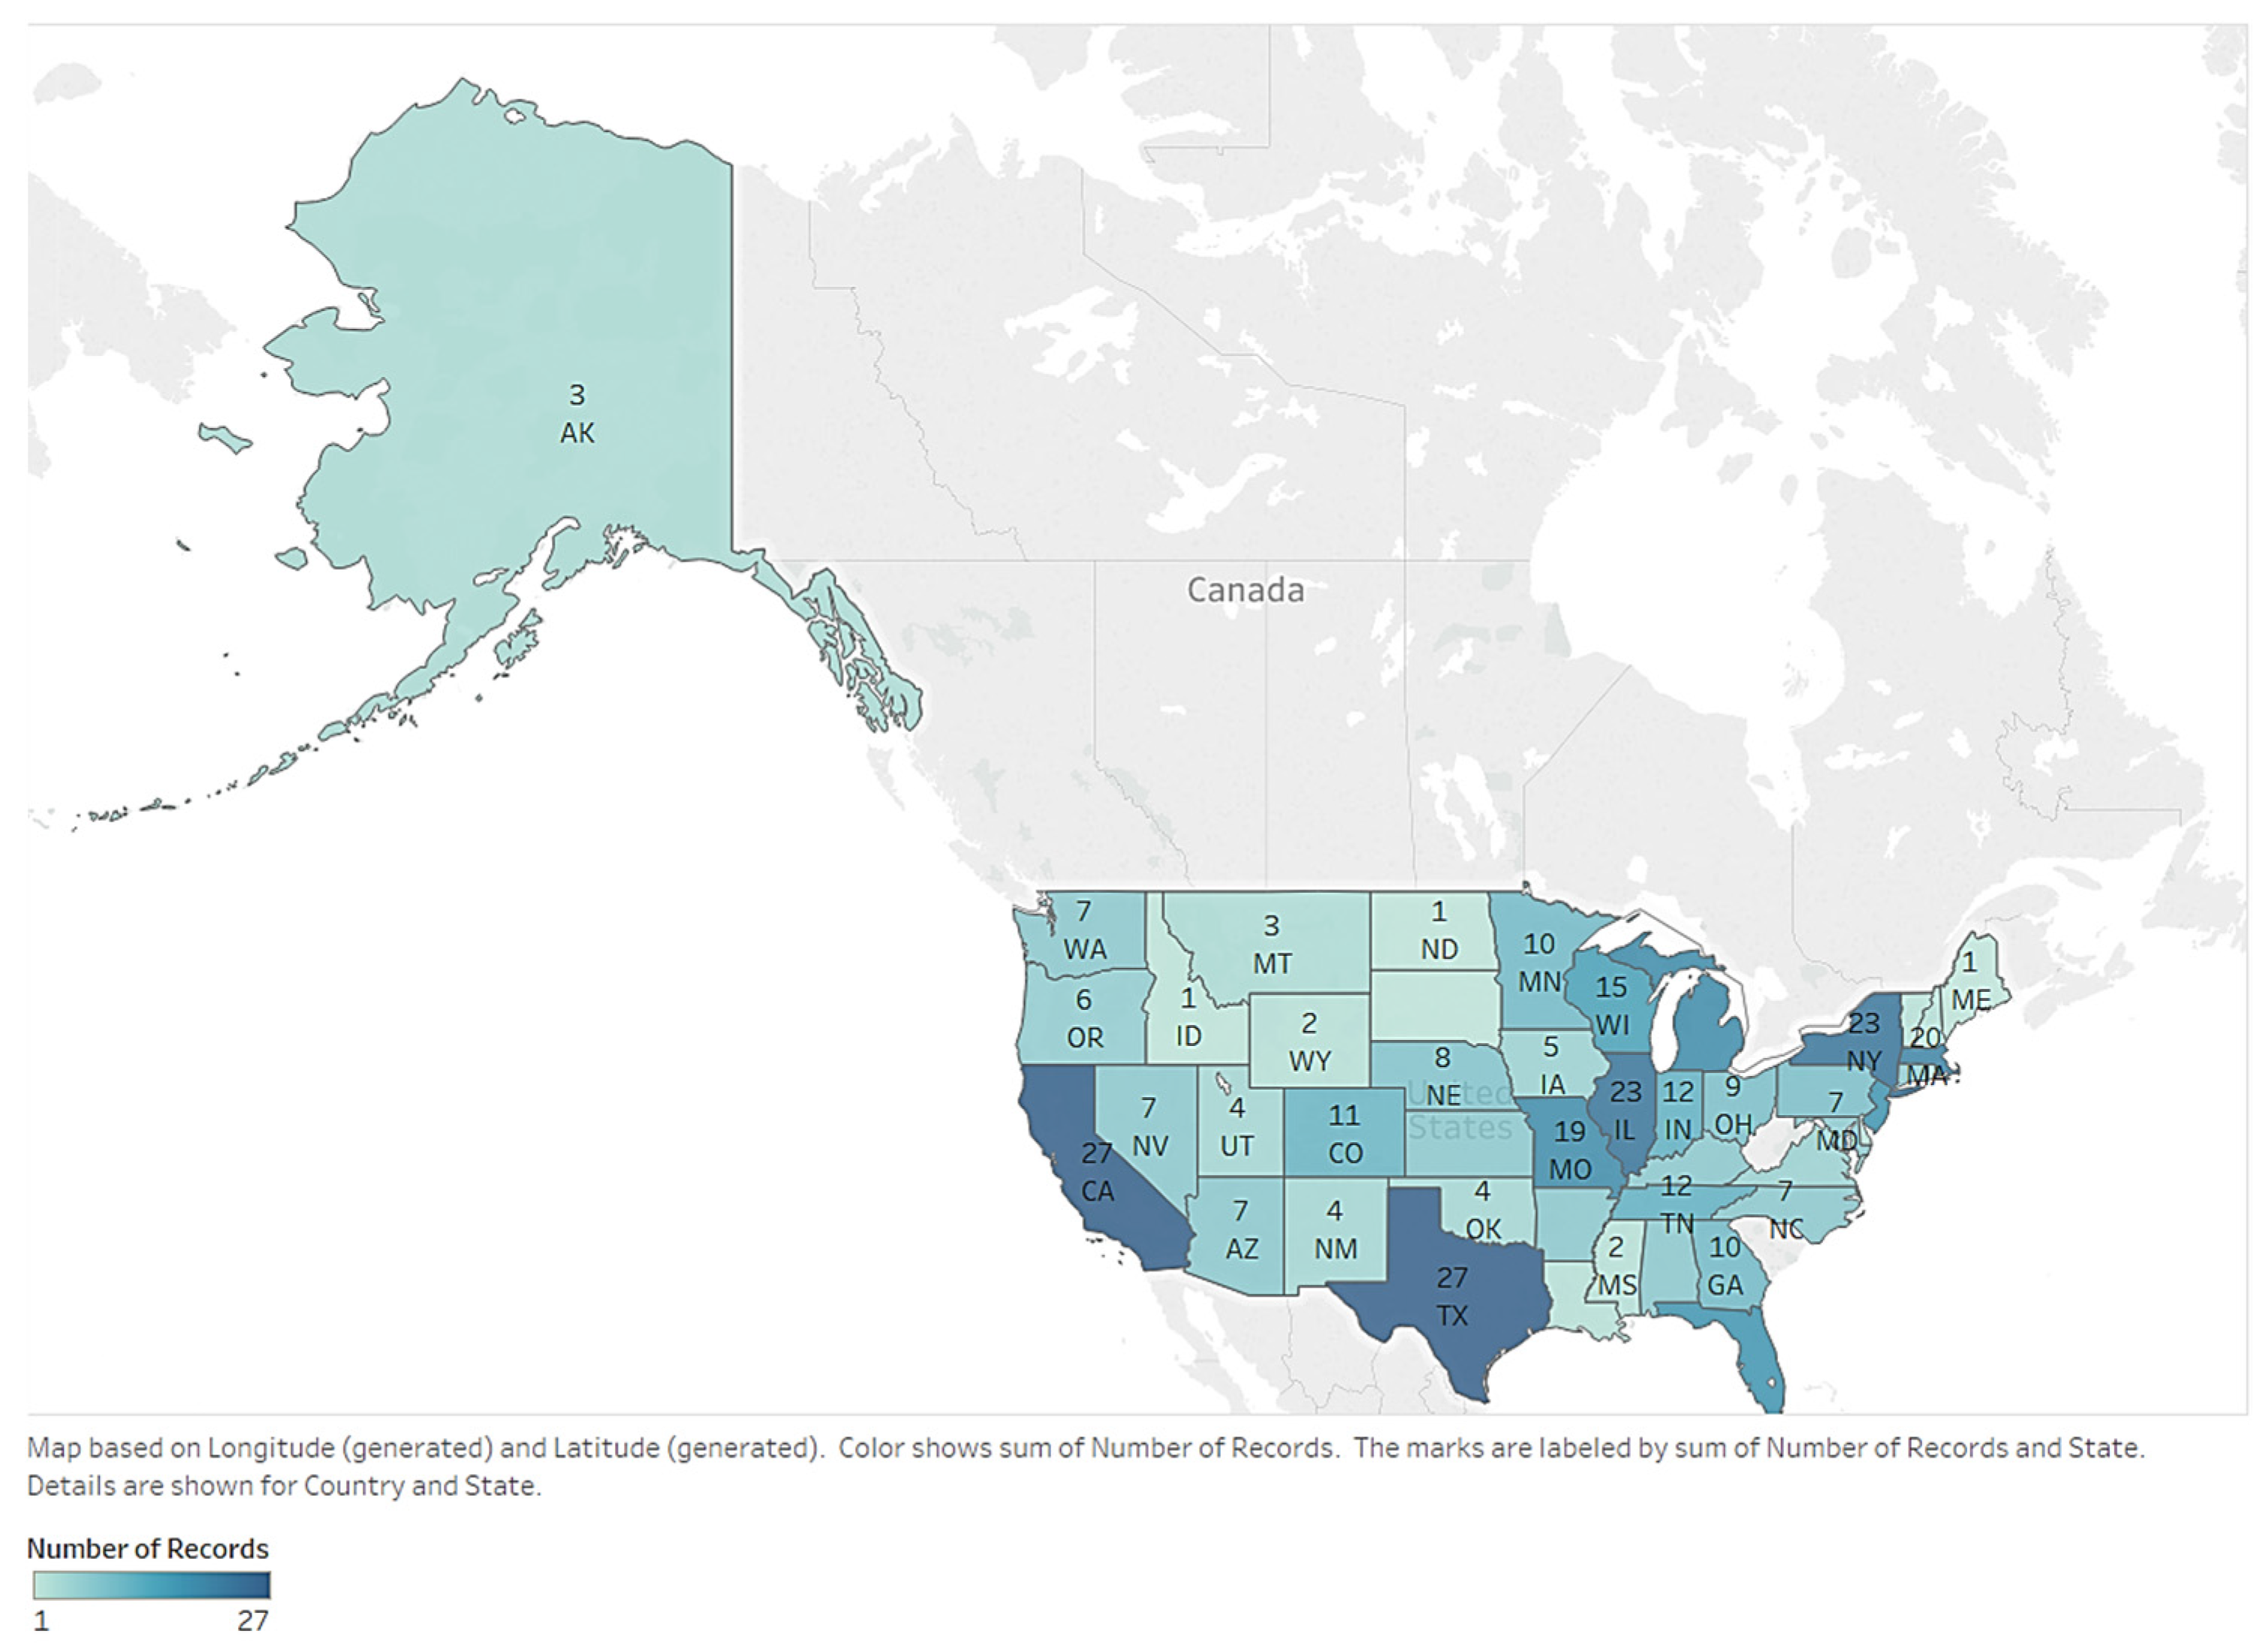
Here, we provide an overview of the geographic distribution of breaches by state.
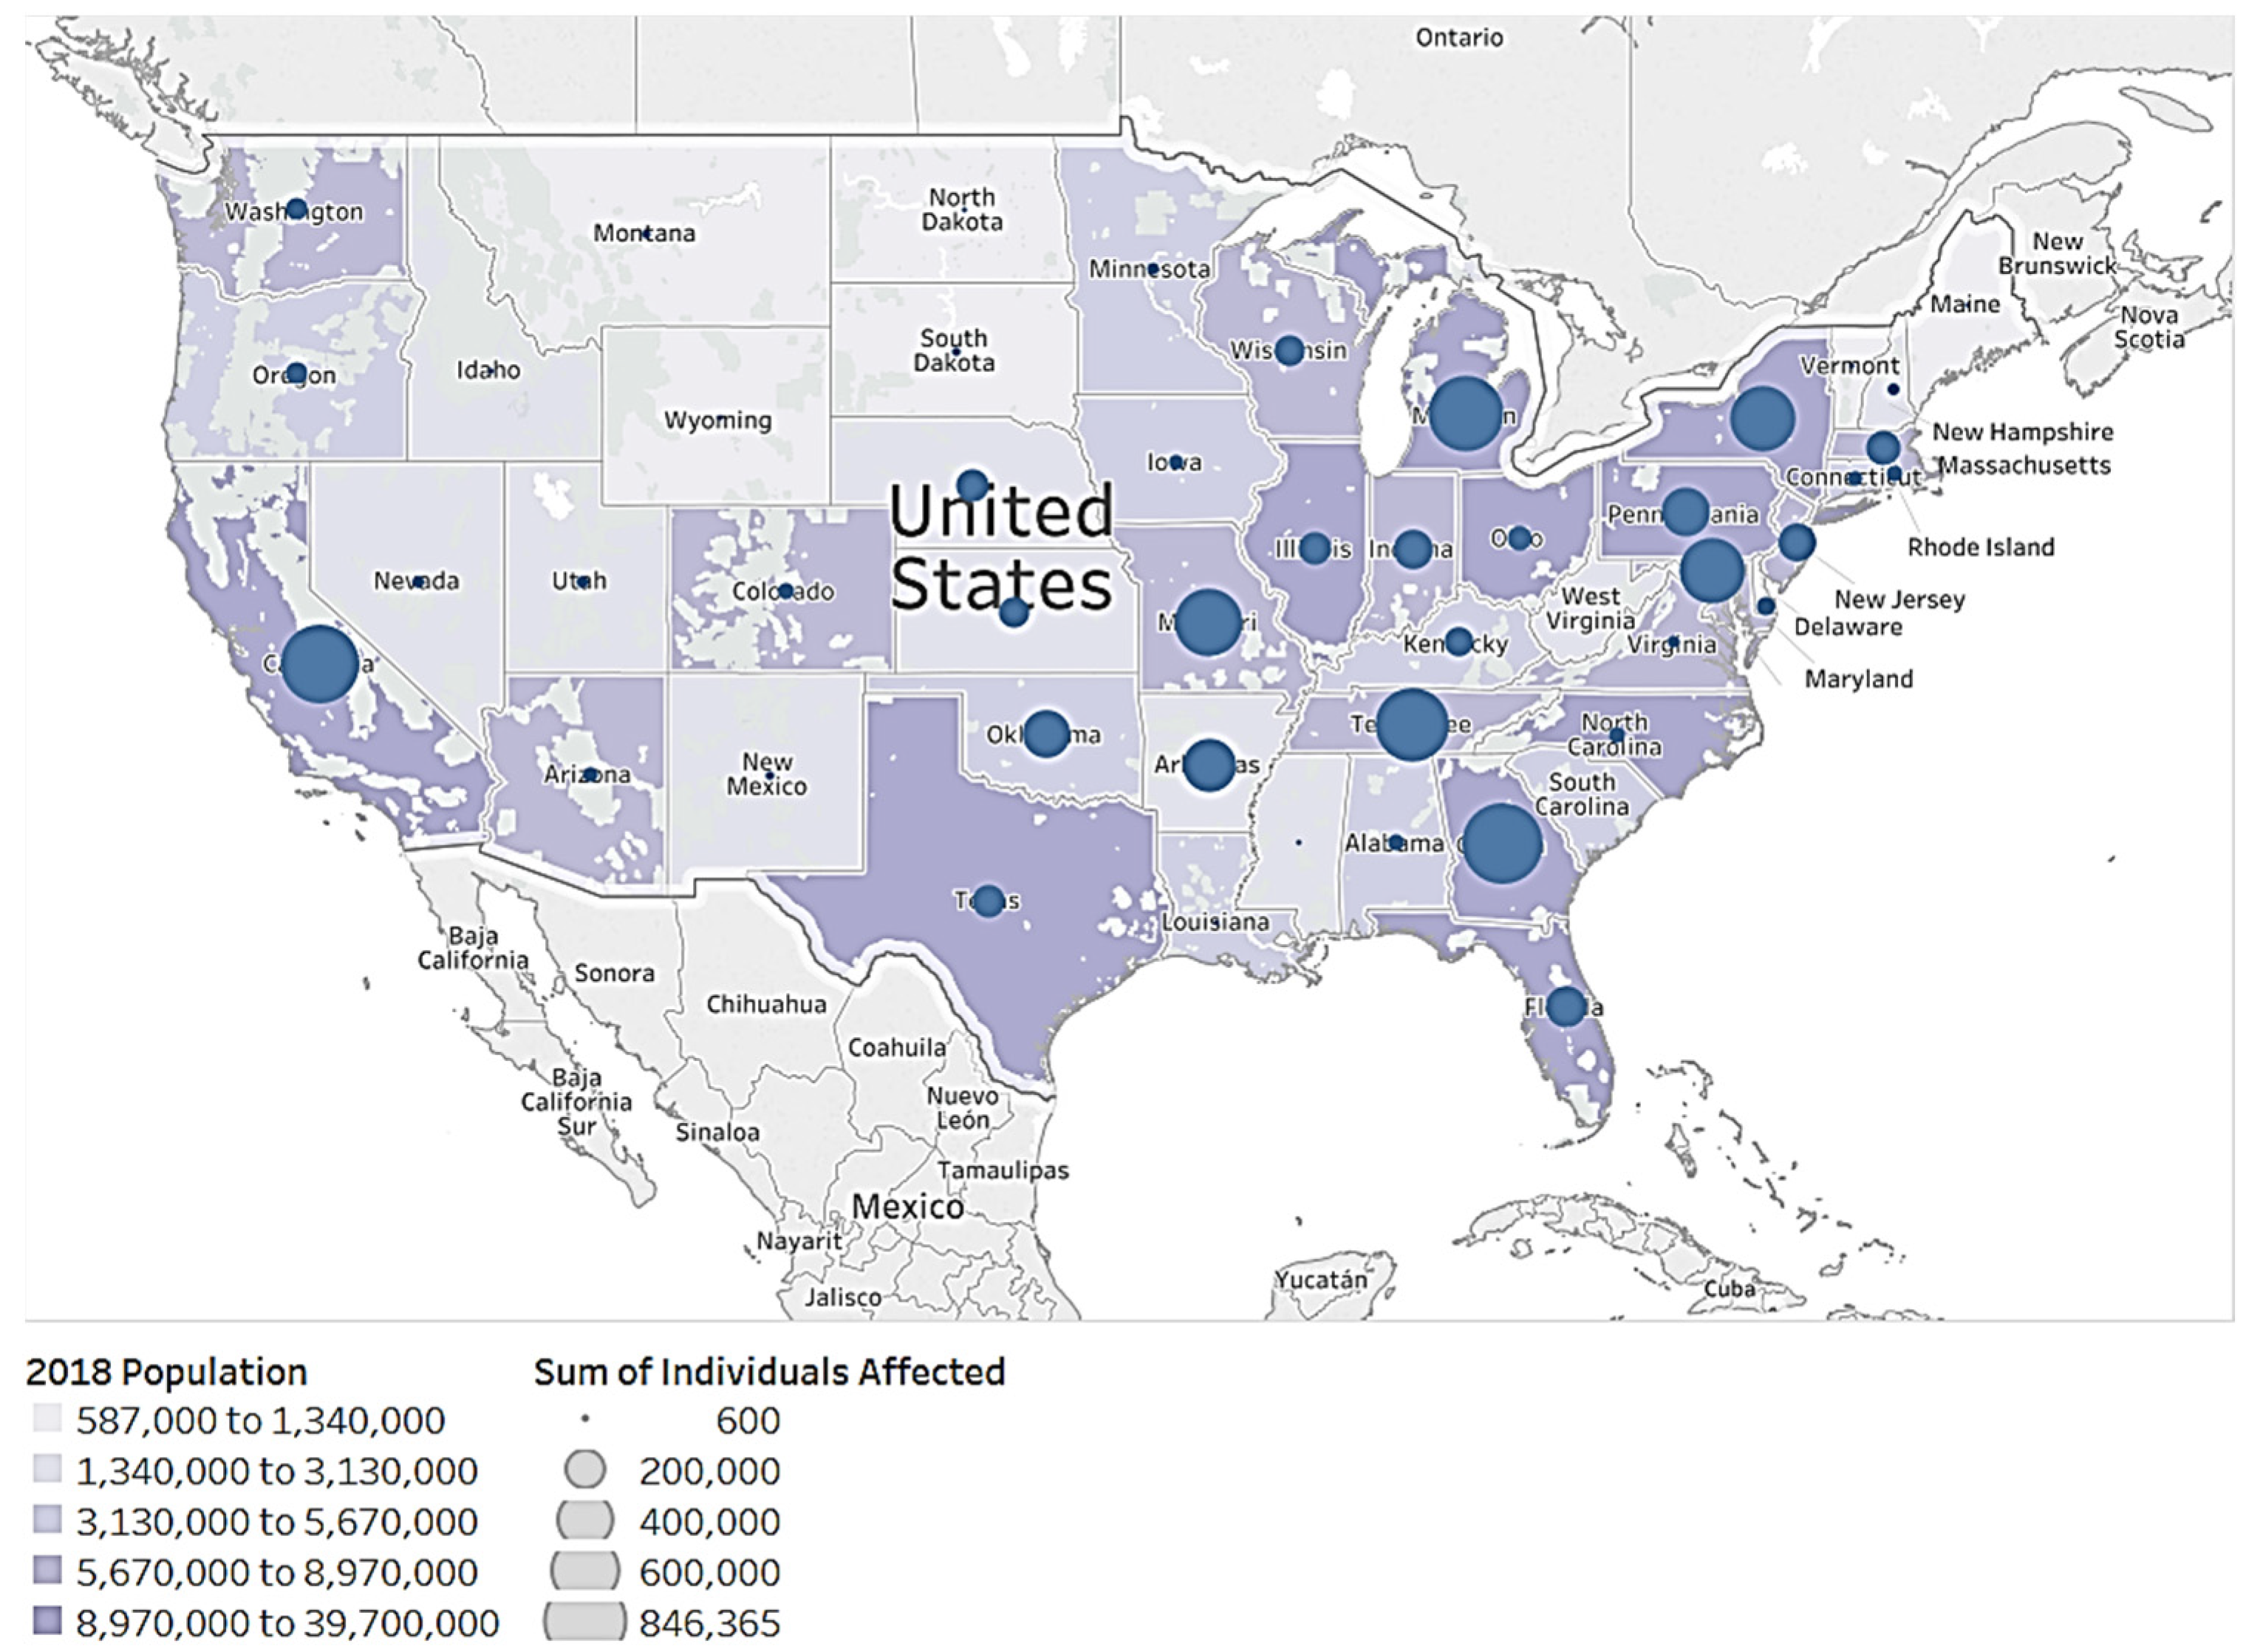
Figure 18 shows the number of submitted records per state. Darker colors represent more records. It is obvious that data breaches happen most frequently in California (CA) and Texas (TX). There are 23 records each in New York (NY) and Illinois (IL). These states have large populations (see
Figure 19). States with dense populations (except TX and IL) may experience more risk. Companies in those states should pay more attention to protective measures.
Figure 18 shows that most affected individuals are located on the nation’s east coast.
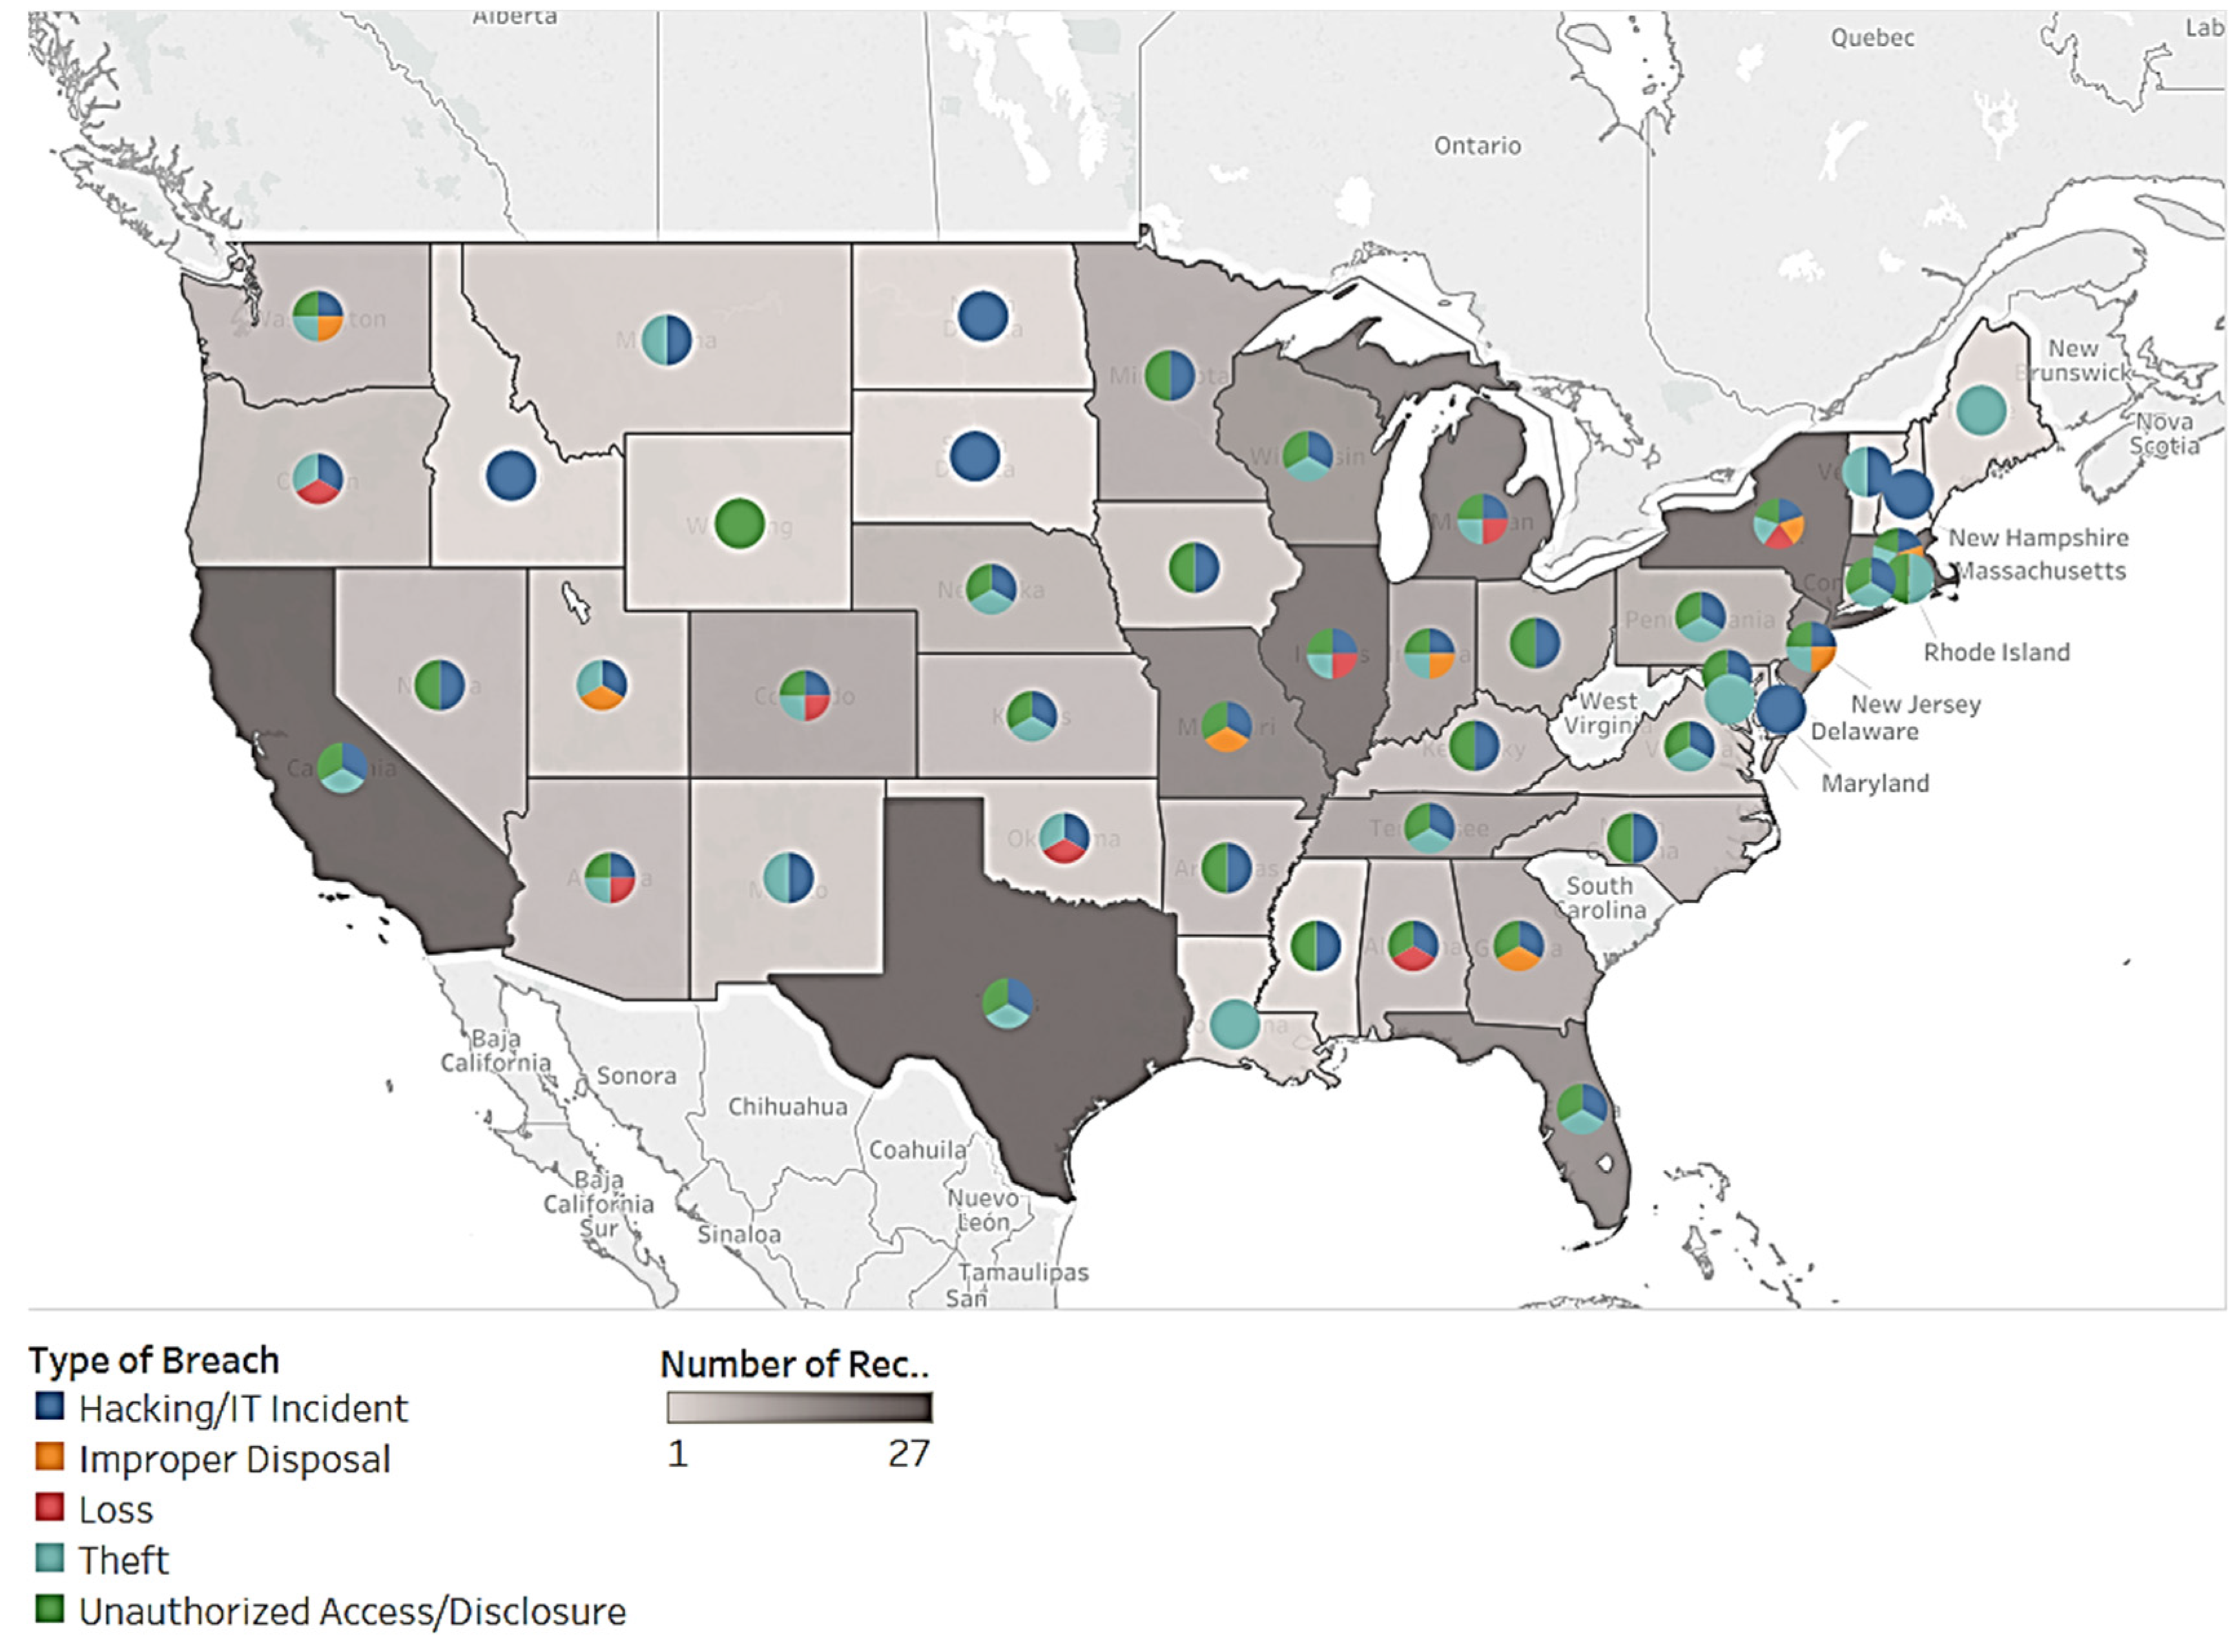
Figure 20 describes the distribution of healthcare breaches by state. The different colors show the number of records. Darker shades represent a higher number of records. The pie chart details the type of breach. First, healthcare breaches are clustered in the most populous states including CA, TX, NY, and IL. Second, some states contain different types of data breaches. Other states contain a single type of breach. For example, Idaho (ID), North Dakota (ND), South Dakota (SD), Delaware (DE), and New Hampshire (NH) experience hacking/IT incidents. Louisiana (LA), Washington, DC (DC), and Maine (ME) experience theft. Most states have more than one type of data breach.
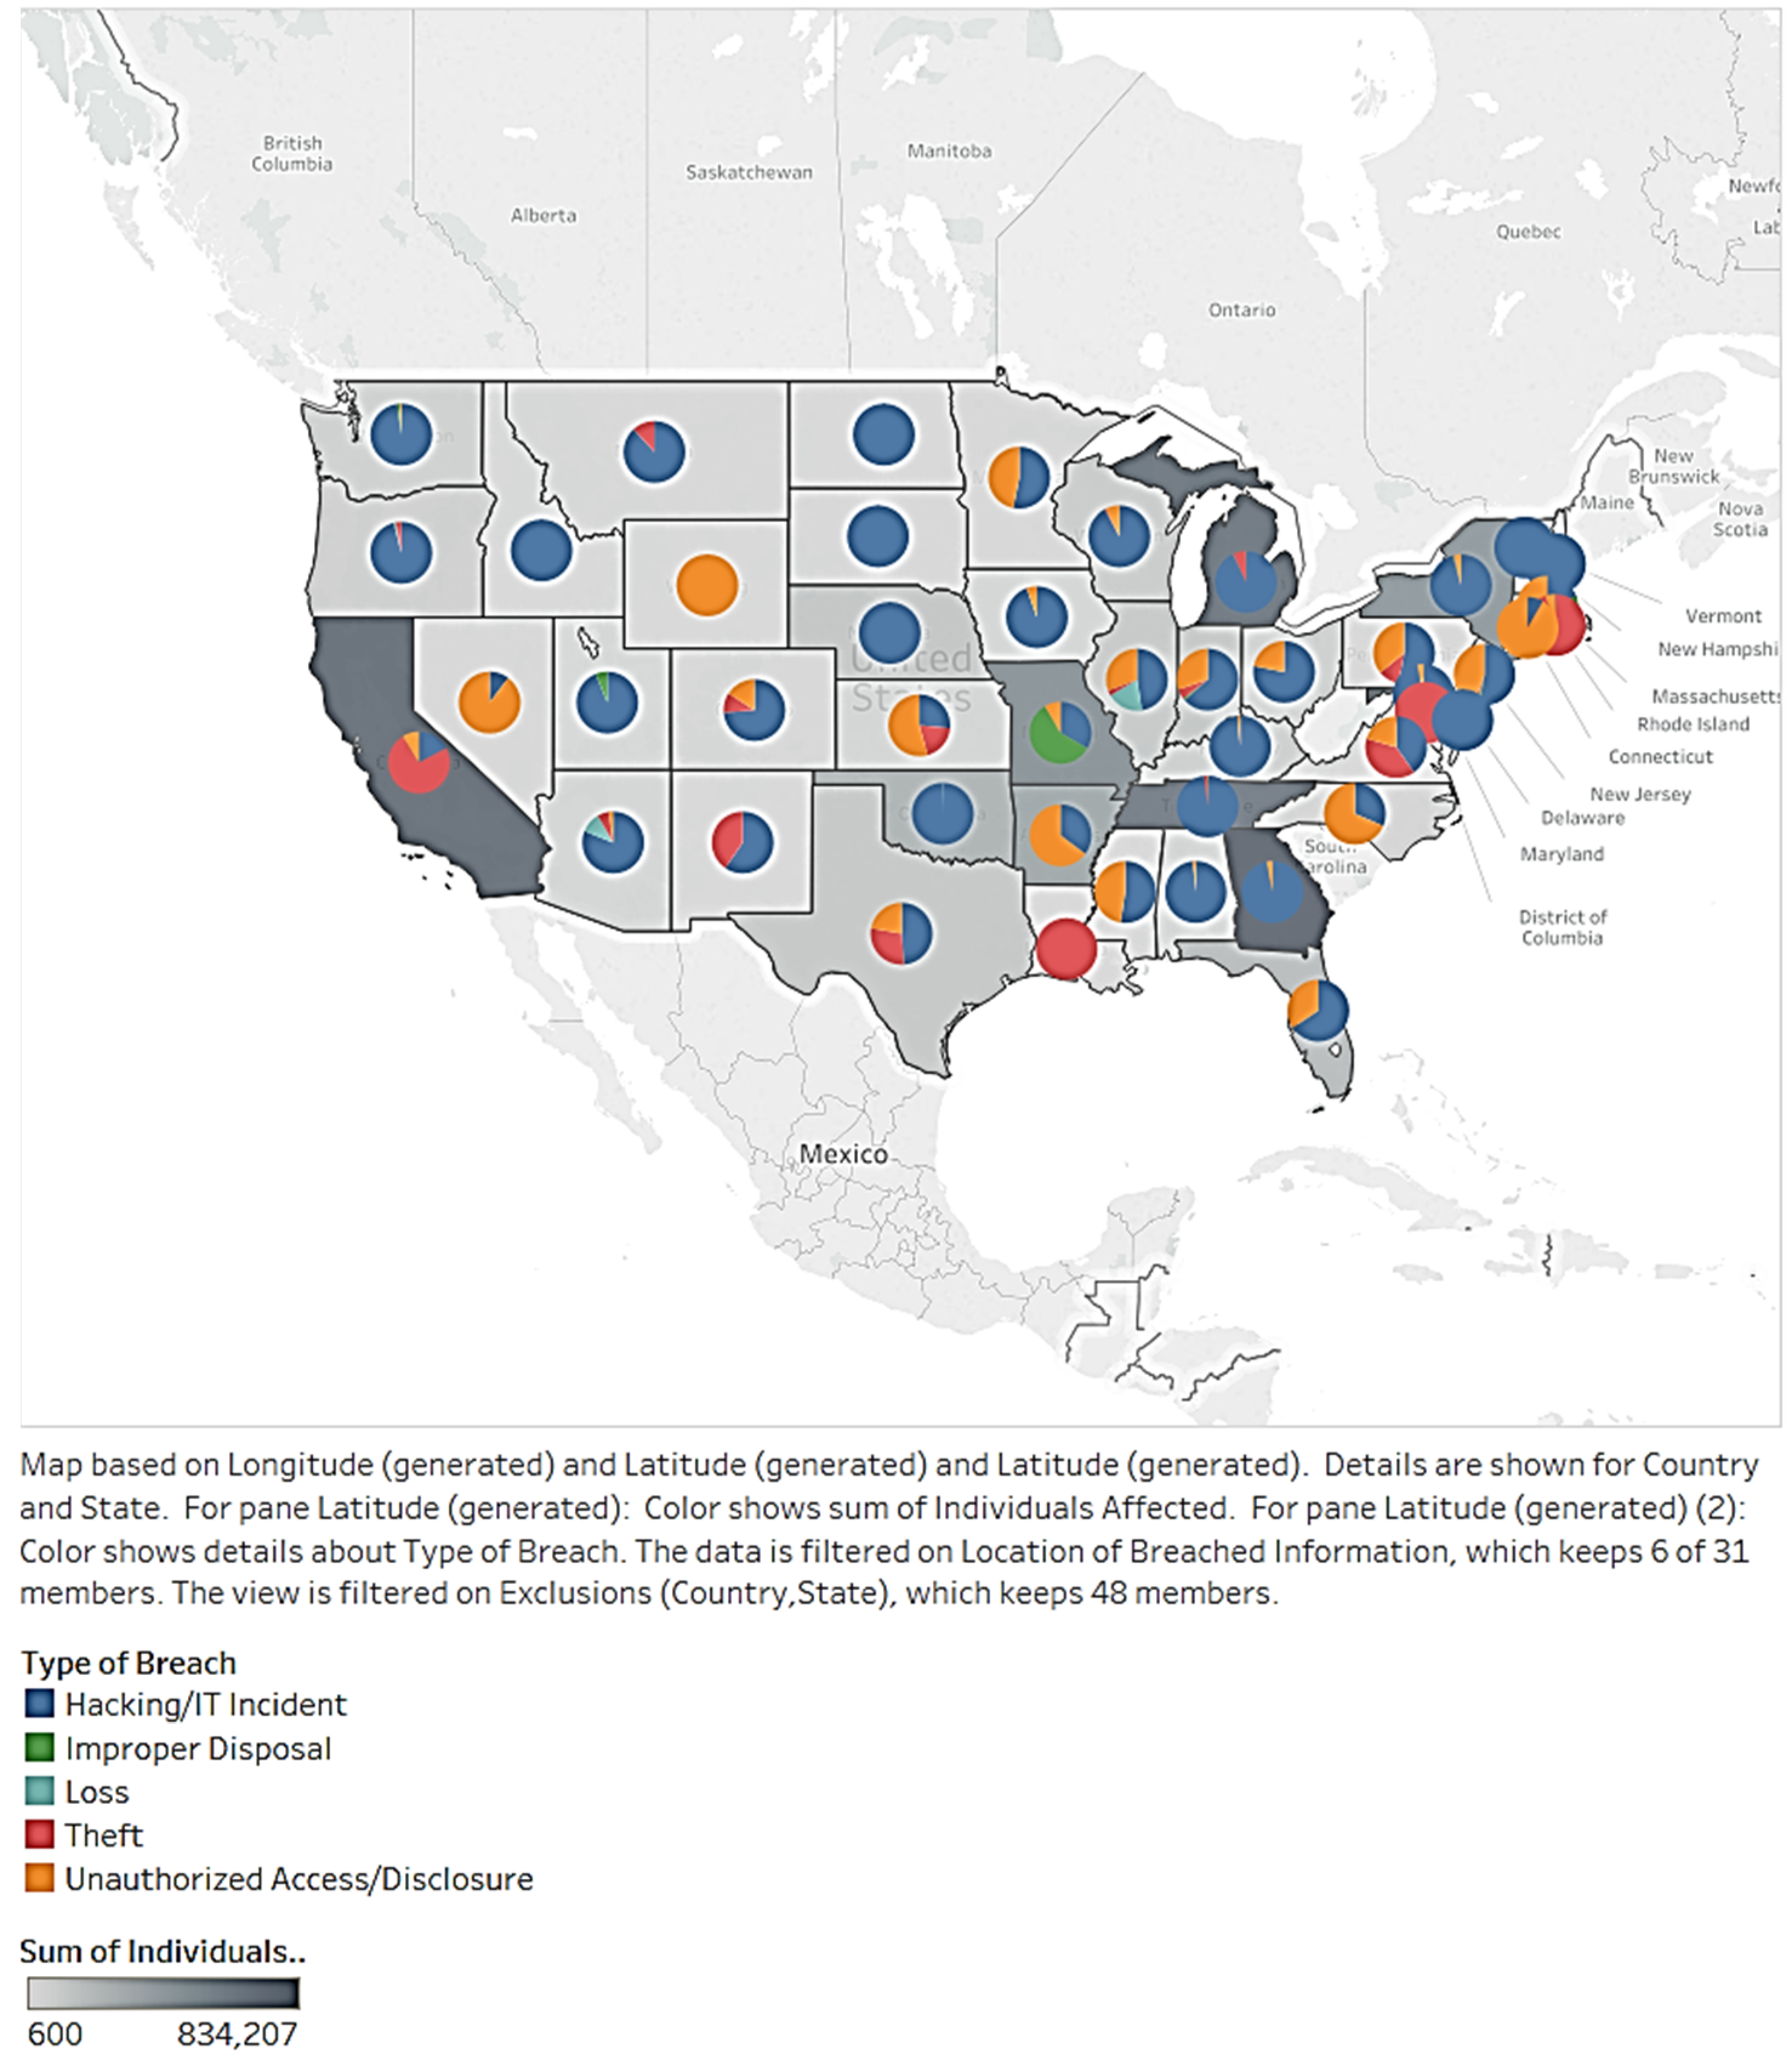
Next, we studied the distribution of individuals by breach type per state. In
Figure 21, the different colors show the number of affected individuals. Darker shades represent a higher number of records. The pie chart details the breach type. The states’ pie charts show that individuals affected by health breaches are clustered in the most populous states, including CA, TX, NY, and IL. Another finding is that, in some states, individuals are affected by only one type of data breach. For example, ID, ND, SD, DE, and NH have hacking/IT incidents. LA, DC, and ME have theft, which affects individuals. States suffer from different types of breaches. Therefore, a variety of countermeasures are required. States with only one breach type should consider their current problem and risks related to other breach types.
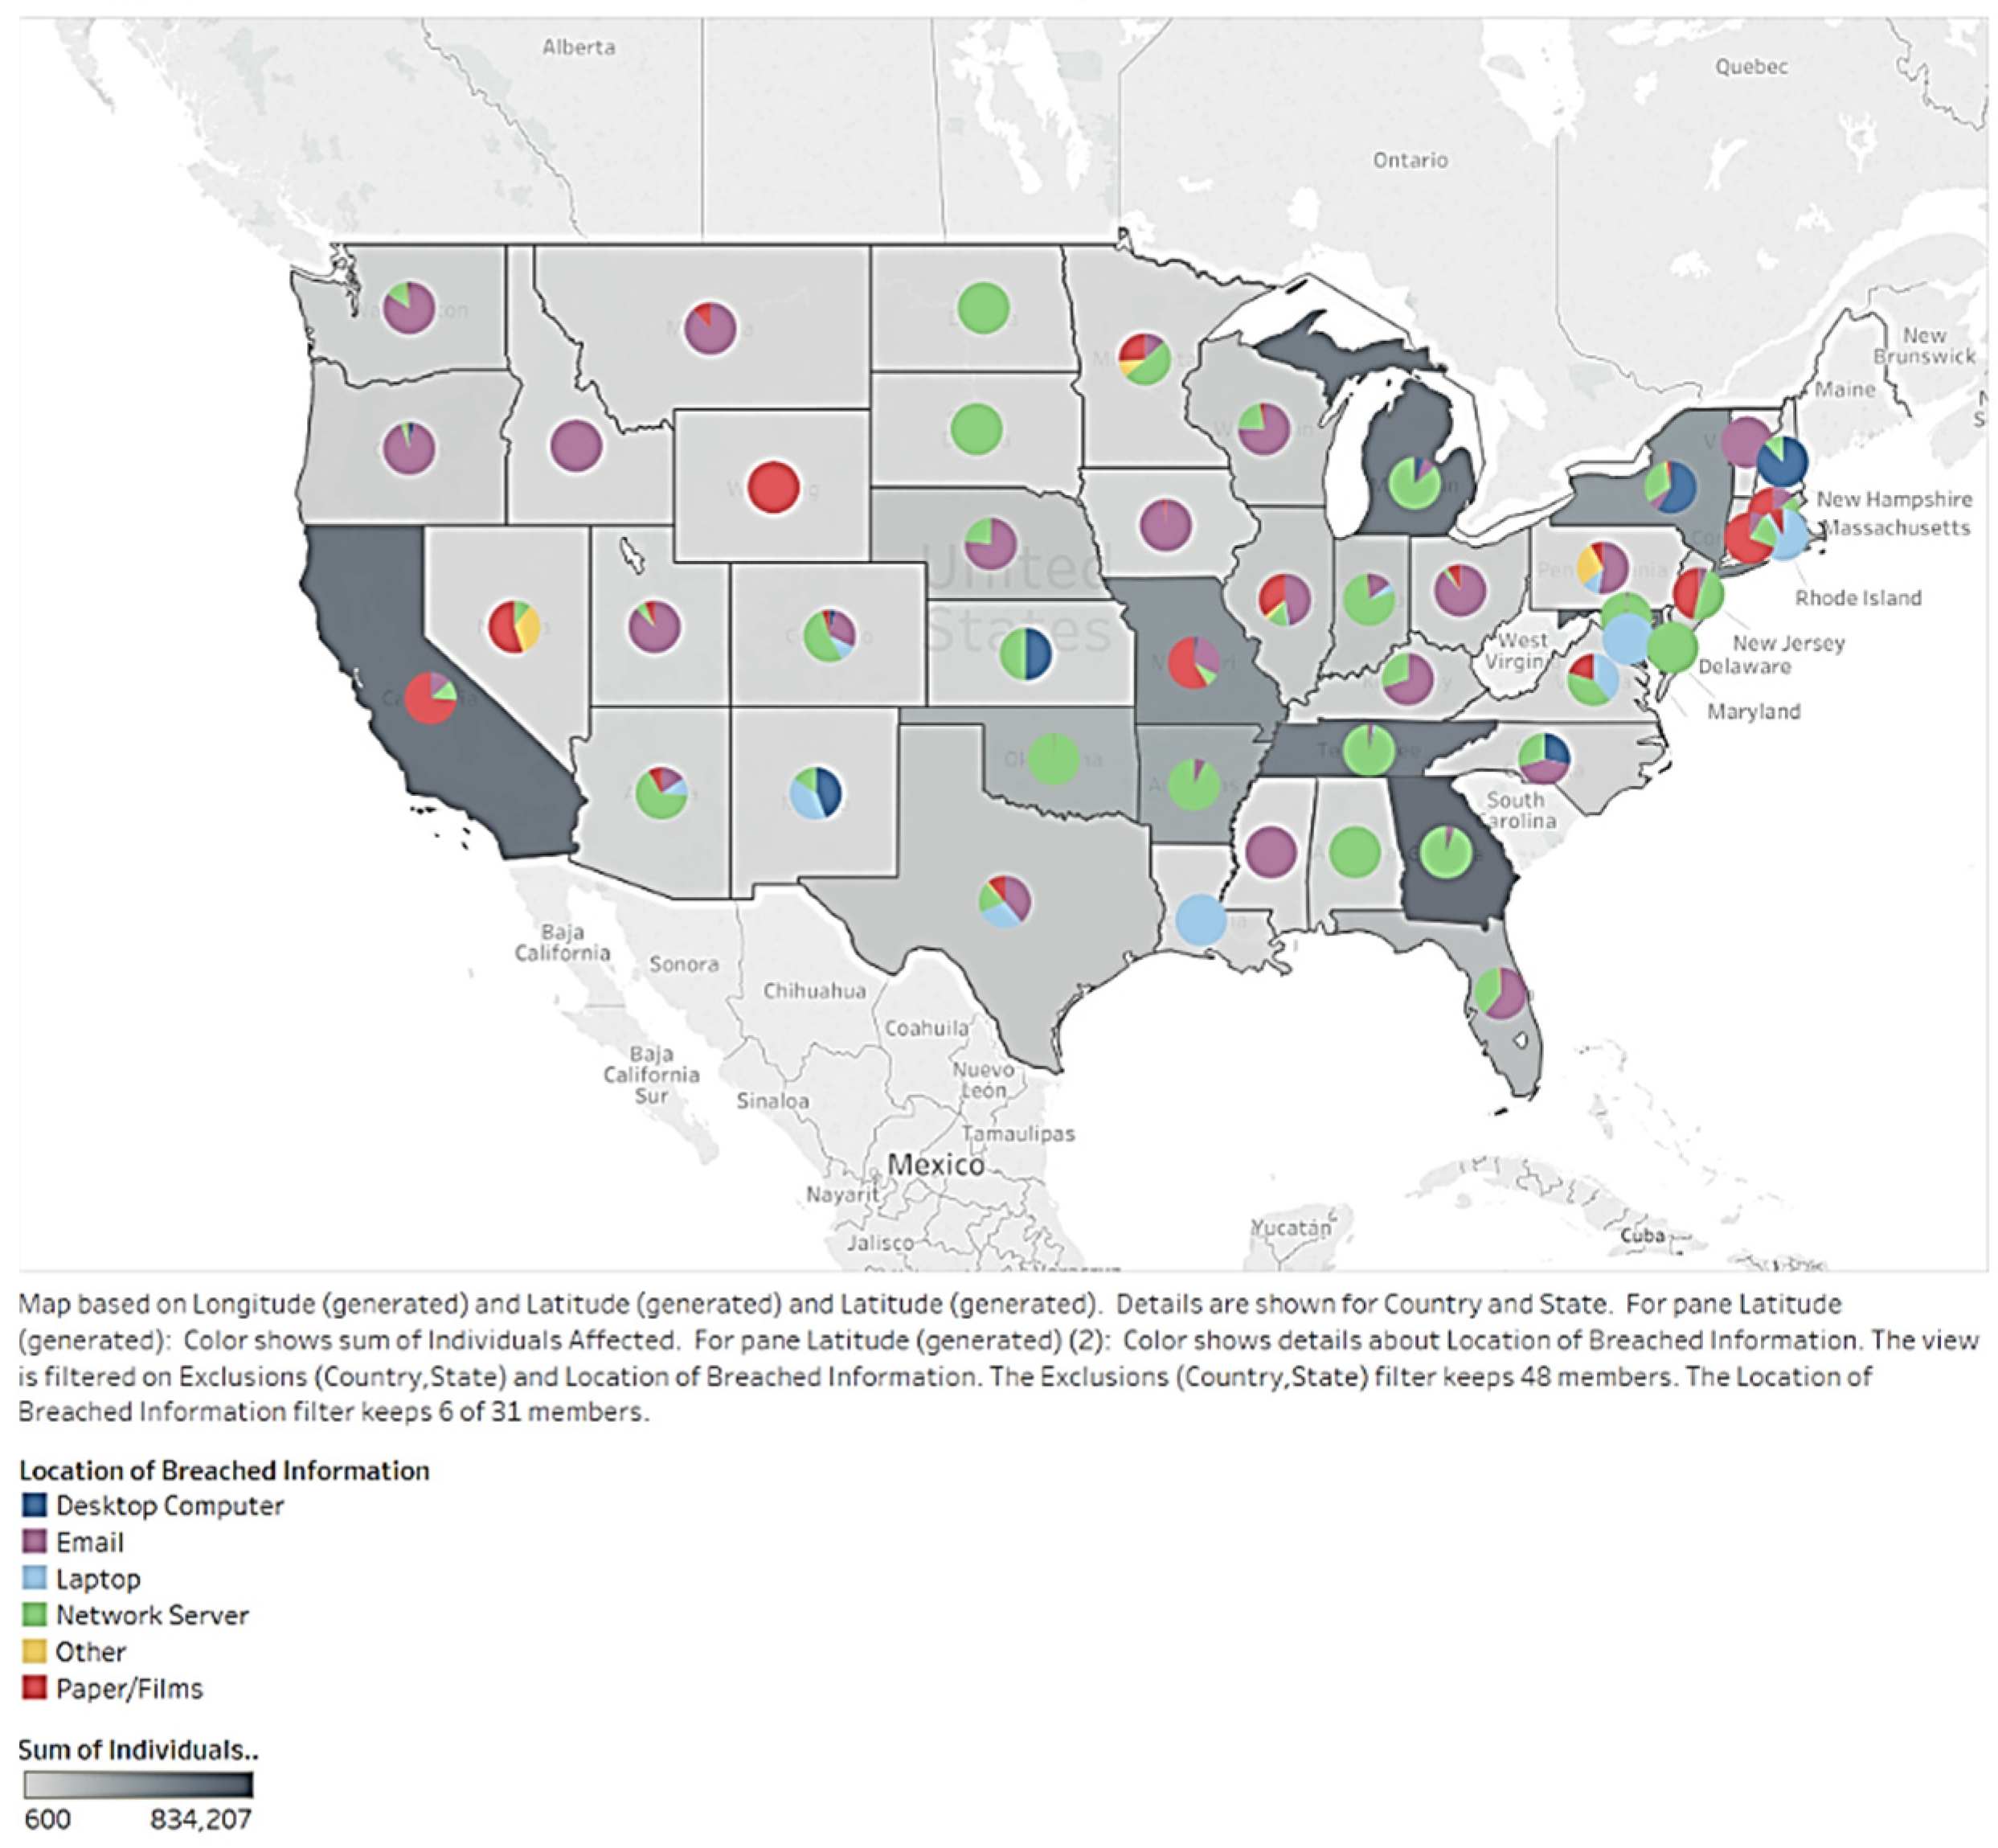
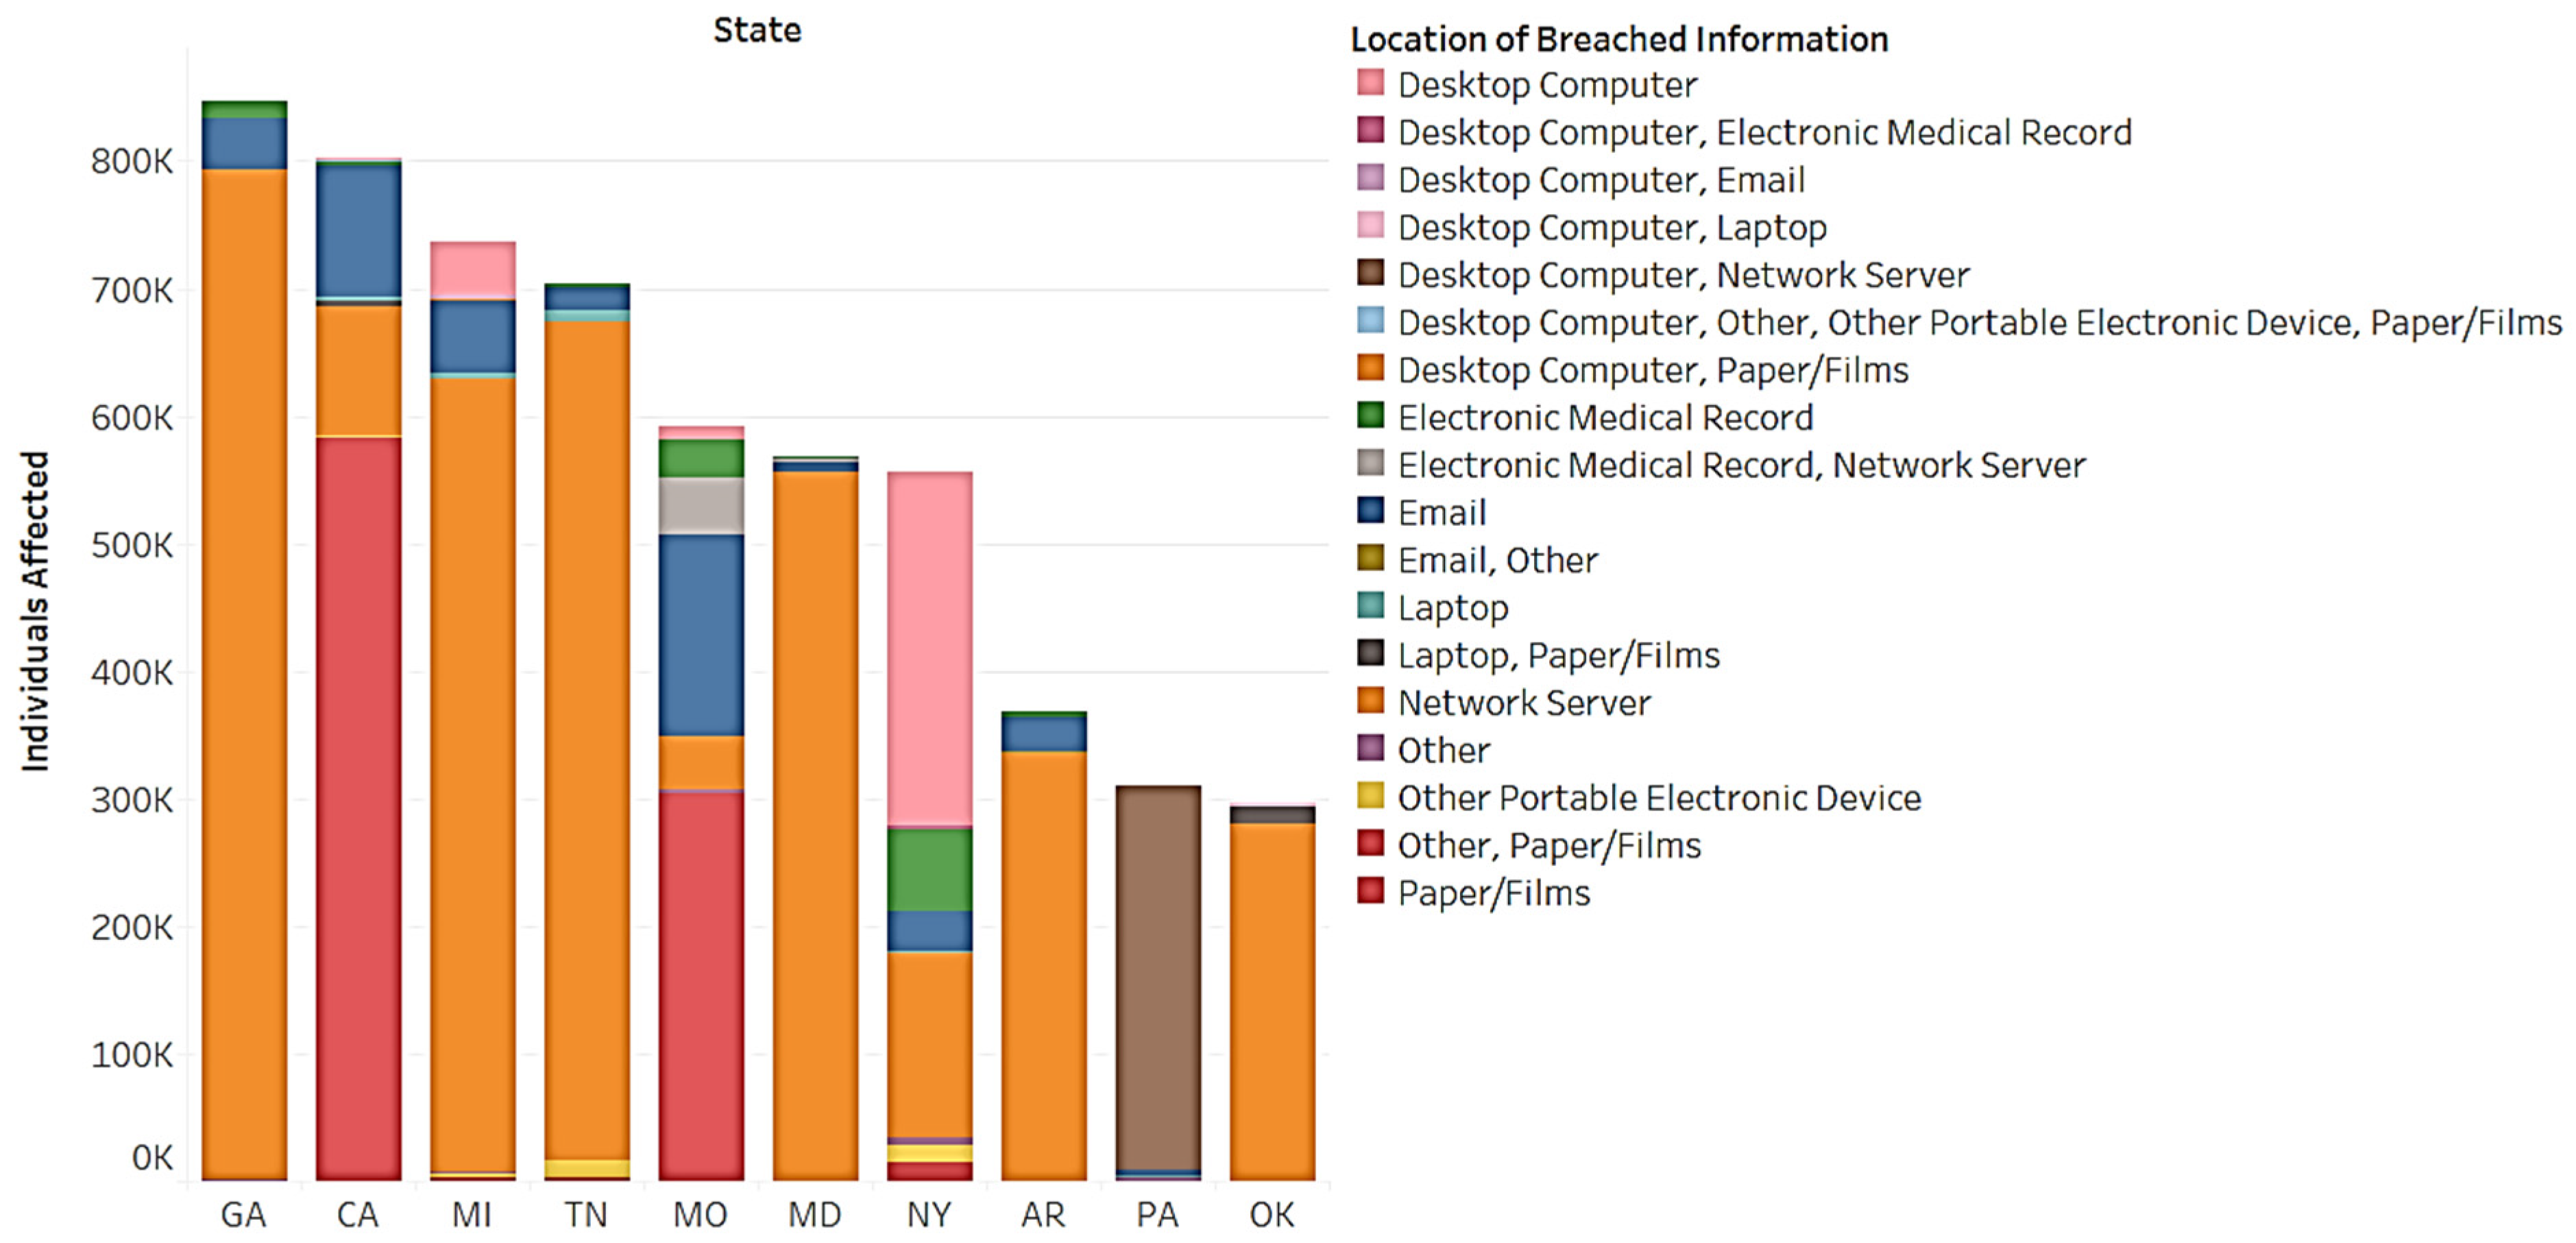
To better understand distribution, we used pie charts to illustrate location type and regional breaches (see
Figure 22). The study found that most states have one dominant location impacting affected individuals. For example, in Washington (WA), Montana (MT), Idaho (ID), Oregon (OR), Iowa (IA), Ohio (OH), and Vermont (VT), disclosure occurs via e-mail. In North Dakota (ND), Oklahoma (OK), South Dakota (SD), Arkansas (AR), Tennessee (TN), Alabama (AL), Georgia (GA), New Jersey (NJ), and NY, data breaches occur through network servers. Some states had multiple locations for breaches. We further created a bar chart that describes the location and distribution of affected individuals in the top 10 affected states (see
Figure 23). There are 18 locations regarding breached information and network servers. Papers/films make up many of the breaches in CA and Missouri (MO). The use of desktop computers impacts half of NY’s individuals. Pennsylvania (PA) is mostly affected by desktop computers and network servers. All states should pay attention to network servers. CA and MO should focus on papers/films. NY should focus on desktop computers. PA should focus on desktop computers and network servers. Network servers are a common trend regarding location and breached information.
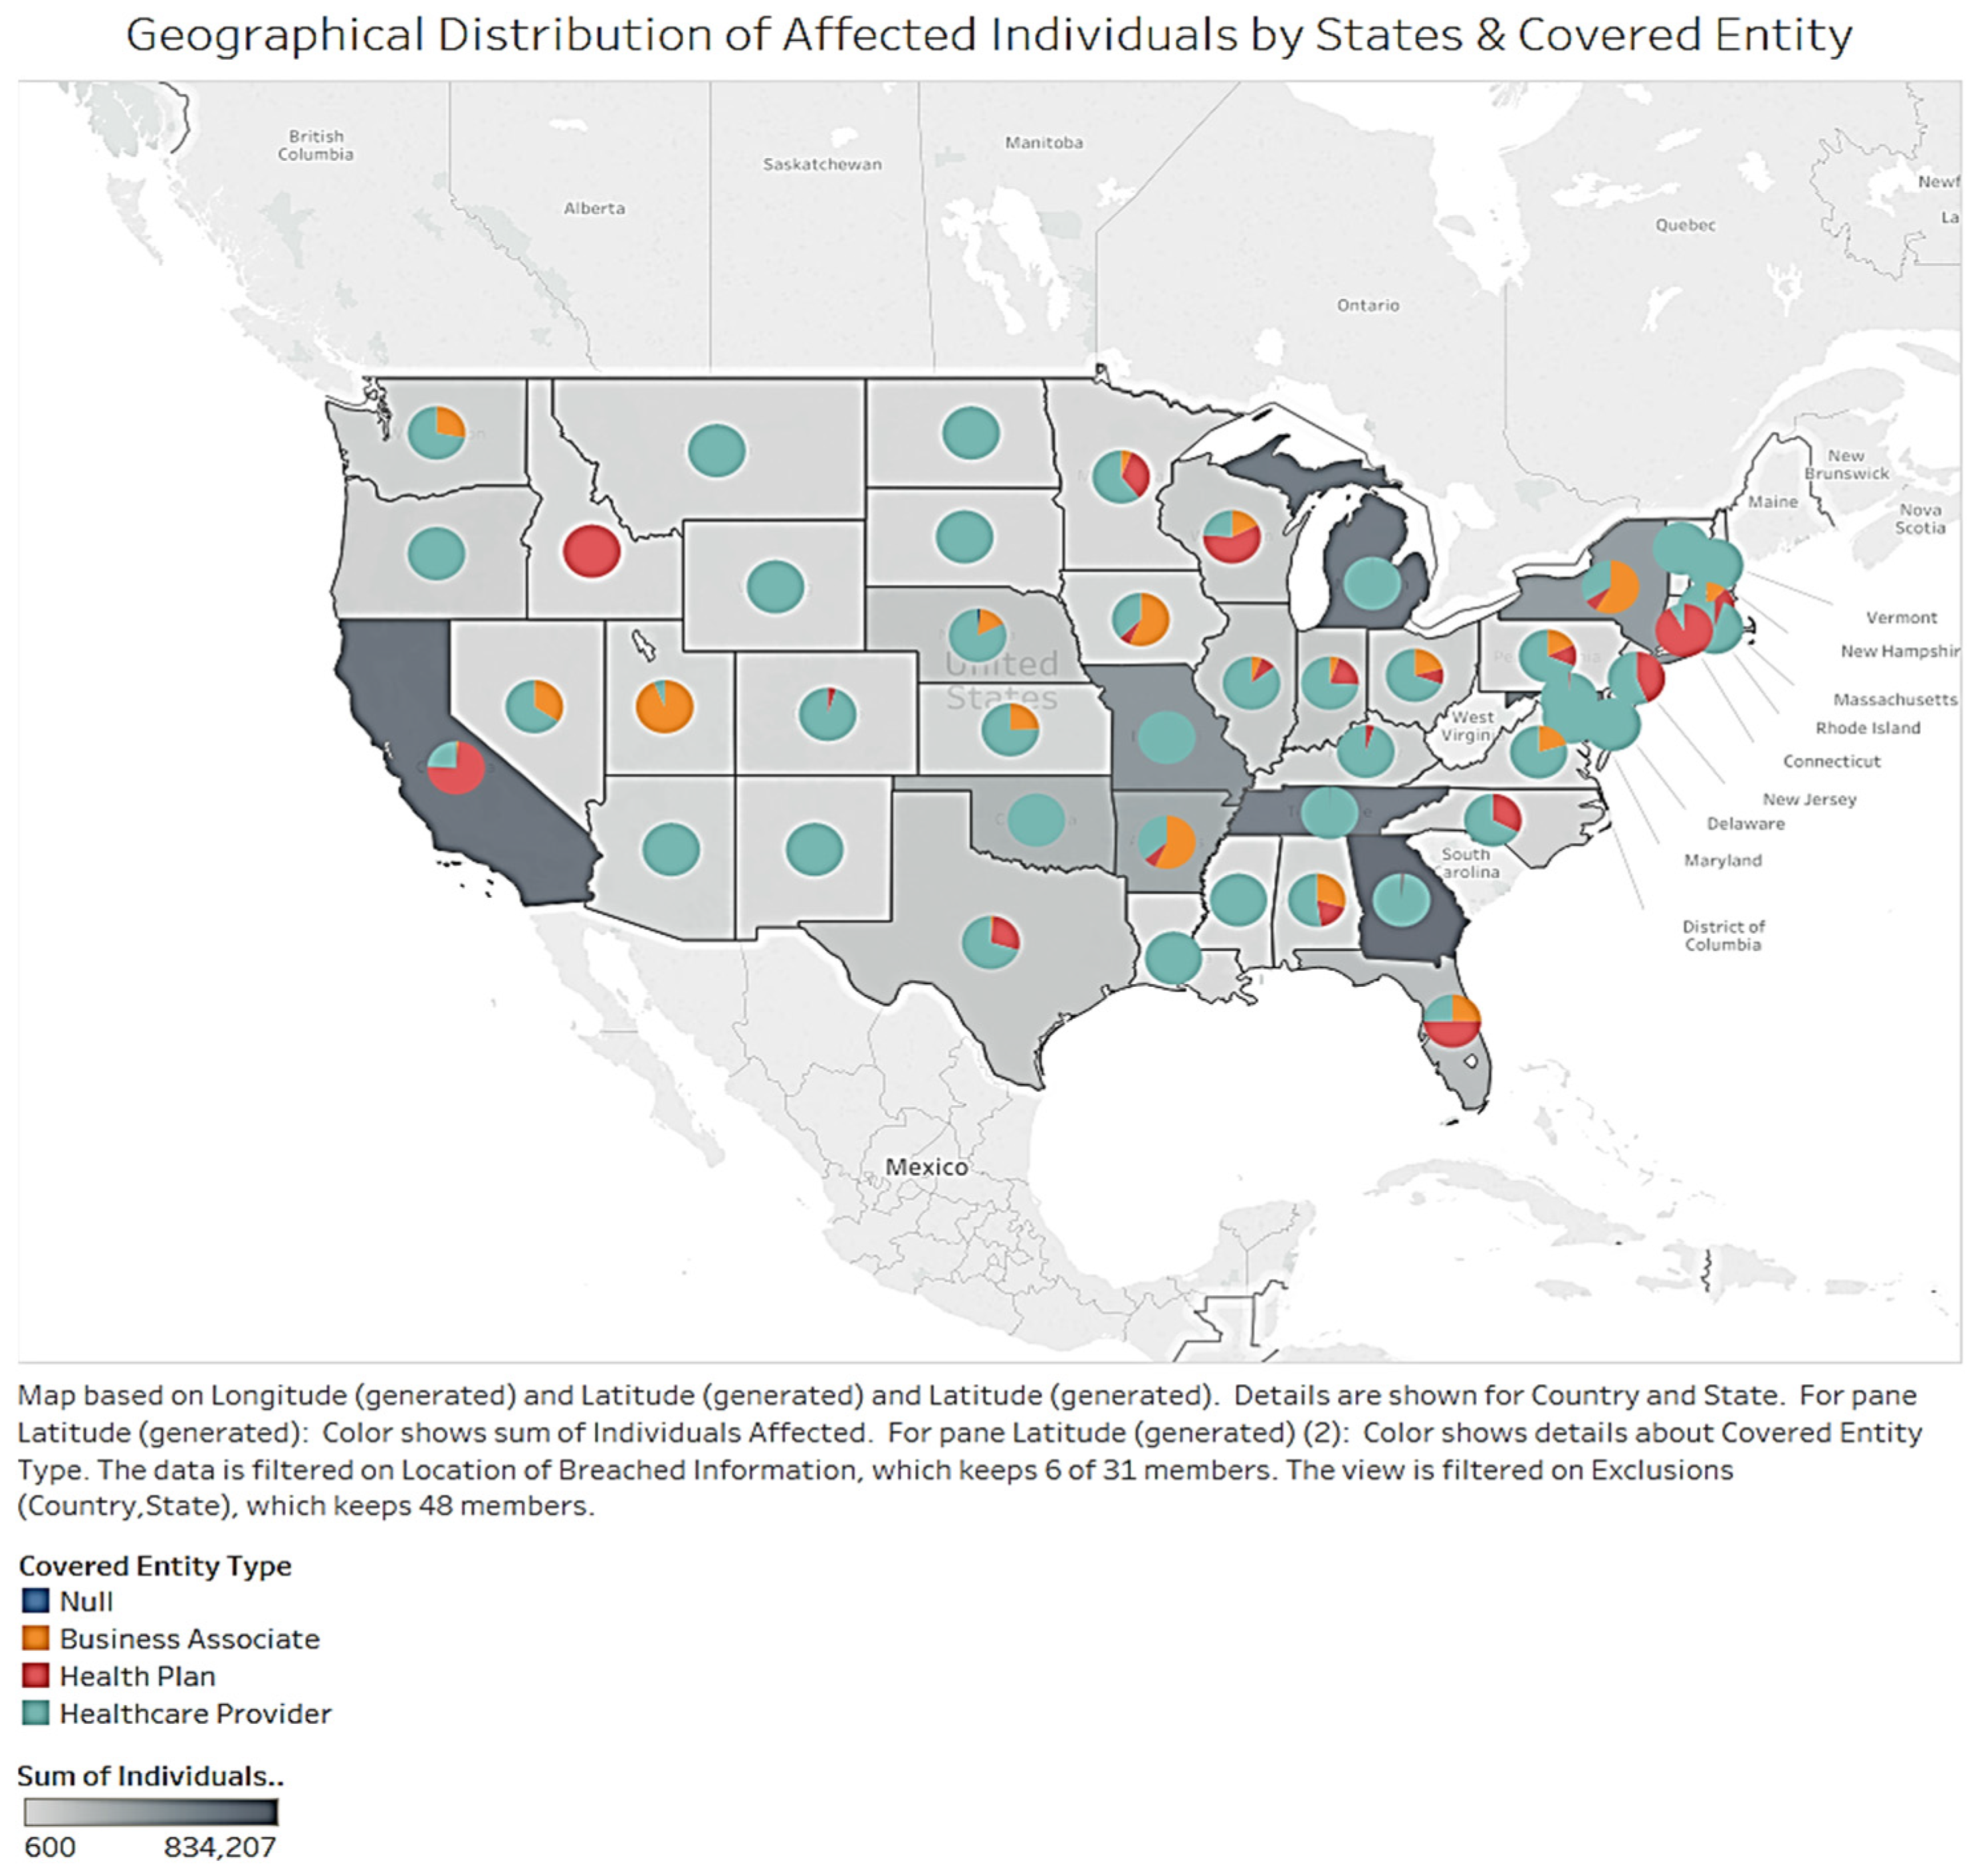
In
Figure 24, the different colors show the number of affected individuals. Darker shades signify a higher number of records. The heat map details the covered entity type. For affected states (i.e., CA, TN, SC, and MO), most show that healthcare providers dominate. Only CA has health plans as the majority type. The business associate entity was randomly distributed throughout the states. Most states affected by data breaches listed the healthcare provider entity. States on the west and east coasts listed the business associate entity. This may be due to the improved economic situations along the coasts as compared to the middle of the country.
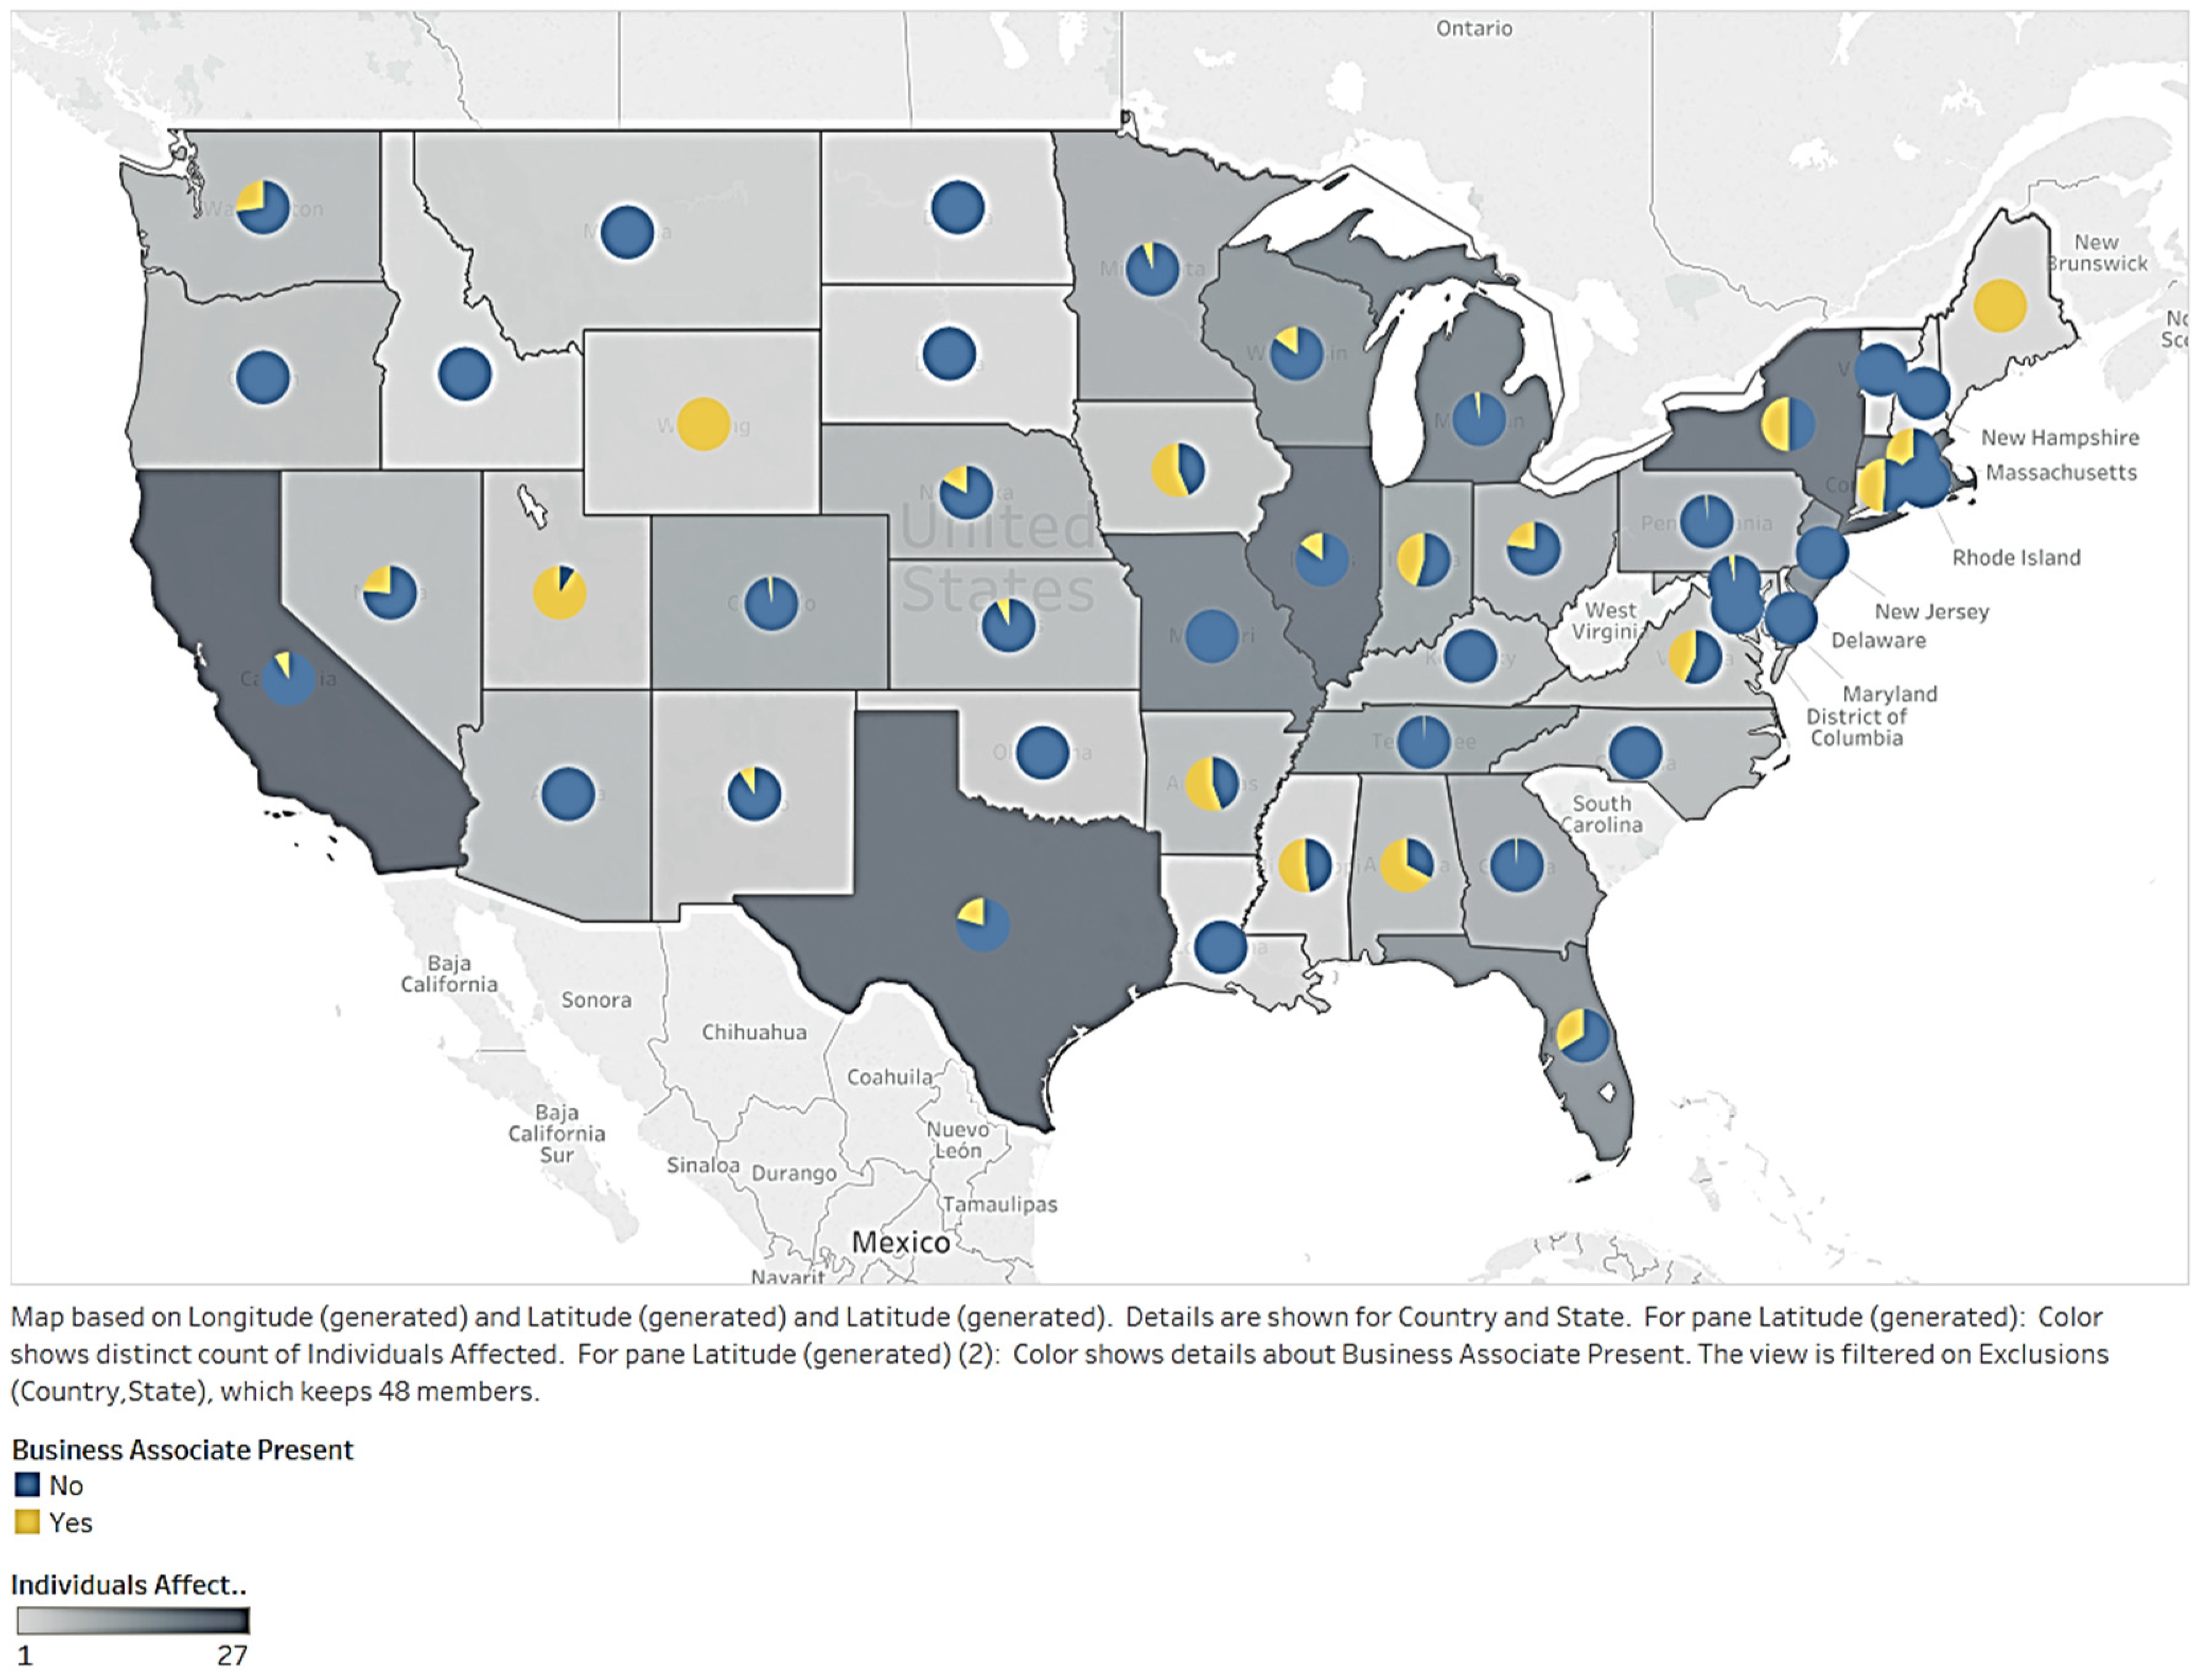
Lastly, we looked at the geographical distribution of affected individuals due to business associates being present. The colors in
Figure 25 represent the number of affected individuals. Darker shades indicate a higher number of records. The pie charts within the heat map detail the presence of business associates. We found that affected states, such as CA, TN, SC, and MO, were dominated by the presence of a nonbusiness associate. Regarding healthcare data breach accidents, business associates were less vulnerable than nonbusiness associates in all U.S. states. This means that the two features are not significantly relevant.
5. Scope and Limitations
Although this research is broad and thorough, it also has limitations. First, data availability is extremely limited. Additionally, meaningful data that can be analyzed are limited to only a few years. Furthermore, this dataset is limited to breaches occurring in the U.S. Nevertheless, we were able to analyze the available data on data breaches and derive meaningful insights. Second, the research considered a limited number of variables related to data breaches. There are possibly more correlated variables to import into the research. Third, many data breaches go undetected. Therefore, the number of records does not represent the current breach situation. Fourth, the data lack predictive capability. Therefore, only a descriptive analysis was conducted. In the future, studies may look at the time factor in spotting a breach to improve record-keeping. Fourth, many outliers exist in the dataset, but these are included in the analysis, since large data breaches need to be included. Future research may investigate a time-series analysis of a lengthier period with additional variables. Due to data limitations, this research was able to only conduct descriptive analytics with visualization. With additional data and variables, predictive modeling with statistics can be conducted. Furthermore, machine learning and text analytics can be incorporated with textual data. While descriptive analytics with visualization offers insight for informed decision-making, more advanced visualization, and visual analytics methods can be applied to health data breach data when more sophisticated and richer data becomes available. For example, ‘visual data mining’ involves the extraction of meaningful information with the application of heuristics and network analysis techniques [
54,
58,
59]. Additionally, in the visual data mining process, users interact with the data and the results of their analysis, namely undertaking network-based inferencing [
54,
59,
60]. A user can navigate through a large corpus of documents through graphs (that represent parts of text) and the relations connecting them [
59,
60]. The sliding treemap is another visualization technique that can present graphical structures on mobile touch devices [
59,
61,
62,
63,
64]. This approach can be used to study the network effects of health data breaches. These and other advanced visual analytic methods can be explored in the future.
Furthermore, although the research focused on the available dimensions of health data breaches, it did not consider the demographic information regarding the impacted stakeholders. Information about the entity as well as the affected individual can be incorporated to ascertain if certain patterns attract more data breaches, or if certain patterns are drawn from certain categories of data breaches. Additionally, specific entity information can be included in the analysis to determine if the relationship between an entity (e.g., a healthcare provider) and an affected individual has any influence on the data breach. Future studies can explore differences in the type of entity, location, breach type, and affected individual type. Information on the insurance coverage of data breaches is another dimension that can be incorporated to evaluate the cost of data breaches and data breach litigation. Finally, our sample consists of data breaches in the U.S. As the phenomenon of health data breaches accelerates, future studies can encompass a diverse set of breaches from countries around the world.
6. Conclusions and Future Research
This study focused on the factors and dimensions of healthcare data breaches by utilizing publicly available data from the U.S. Department of Health and Human Services. We examined the relationships between the characteristics of a breach type, the location (source of data breach), the entity, and the affected individual. We also examined the nature of breaches (breach type) and their association with the entity (e.g., healthcare provider), location (e.g., server), and the affected individual. We obtained a glimpse of the trends in healthcare data breaches through our analysis of the reported data breaches. Our research has significance since the topic of data breaches in the context of cybersecurity is current and rapidly gaining public attention. Regardless of the limitations, this research found correlations between the occurrence of data breaches, breach locations, breach types, and the presence of business associates. Hacking, the most common type of data breach, significantly affects individuals in healthcare organizations. Network servers are the most popular location for information breaches, and they are the most common location for breaches related to hacking and unauthorized access. Healthcare providers, as they are related to the largest group of affected individuals, experience various types of breaches.
Data breaches in the healthcare industry show a sharp upward trend. In fact, they have experienced a recent surge. All types of breaches showed expansion across the period studied. Hacking had the highest peak value and largest fluctuation degree per month. Almost all types showed growth when studying the locations of breached information by year. Network server breaches fluctuated the most per month. Regarding a month analysis for the covered entity type, healthcare providers contributed the most to both the volume of affected individuals and the fluctuation. The same occurred with the presence of nonbusiness associates. Data breaches have a detrimental effect on health data privacy.
This research found a possible correlation between population and affected individuals. CA experienced mostly theft when studying the geographical distribution of records based on the type of breach. Hacking was found in other states, meaning organizations should focus on this type of breach. Papers/films were the riskiest trends in CA. This may be related to the prosperity of the state’s production industry. However, other states also experienced high risk levels related to network servers and location. When analyzing the network server location, GA, MO, and TN were most affected. CA’s health plan organizations had significant data breaches. Other states also experienced high levels of healthcare provider data breaches. According to the study, business has little relation to geographical distribution. Additional research should monitor risky locations and collect historical data. Research should also be applied to the detection process of data breaches. In doing so, patterns of breaches may be revealed. In general, companies should also study their data breach records to prevent future breaches and financial loss. Further research and insights can accelerate the maturing process of our understanding of health data breaches.


