Article

Systems Pharmacology and Network Analysis to Advance Pharmacogenomics and Precision Medicine Decisions in Type-2 Diabetes Therapy

by
Aikaterini Saiti
1,†,
Alexandros Giannopoulos-Dimitriou
1,†,
Ioannis Kazakos
1,
Eleftheria Galatou
2 and
Ioannis S. Vizirianakis
1,2,*
1
Laboratory of Pharmacology, School of Pharmacy, Aristotle University of Thessaloniki, 54124 Thessaloniki, Greece
2
Department of Health Sciences, School of Life and Health Sciences, University of Nicosia, 2417 Nicosia, Cyprus
*
Author to whom correspondence should be addressed.
These authors contributed equally to this work.
Future Pharmacol. 2023, 3(1), 329-363; https://doi.org/10.3390/futurepharmacol3010021
Submission received: 15 February 2023 / Revised: 12 March 2023 / Accepted: 14 March 2023 / Published: 17 March 2023
(This article belongs to the Special Issue Feature Papers in Future Pharmacology)

Abstract

:
Diabetes mellitus type-2 (DMT2) molecular pathophysiology is still challenging since the disease represents a complex, multifactorial metabolic disease caused by polygenic defects and environmental factors. In addition, the resulting secondary organ complications can be affected by various environmental and life-style factors over the years. The metabolic imbalance in DMT2 is manifested by the dysfunction of pancreatic β-cells in secreting insulin and the inability of other tissue cells to respond to insulin and utilize blood glucose. However, over recent years, through the advances in genomics and molecular analysis, several genes and microRNAs have been shown to be correlated as potential biomarkers with DMT2 prognosis, diagnosis, and therapy. Furthermore, drug therapy and clinical pharmacology have benefited from pharmacogenomics in a manner where the molecular knowledge can be translated into clinical information aiming to improve precision and personalized medicine therapeutic methodologies in healthcare. In this work, using systems pharmacology and network analysis approaches, we comprehensively assessed the molecular and genomics data associated with DMT2 to: (a) Better understand miRNA, gene, and drug associations; (b) Create connectivity and interaction maps of practical clinical utility; and (c) Facilitate the application of precision medicine therapeutic decisions in group and individual patients. Moreover, in order for the clinical pharmacology guidelines to be implemented in parallel with the generated molecular data, we also carried out an assessment of drug interactions in specific pharmacological classes that affect DMT2 pharmacotherapy outcomes. Overall, the proposed methodology and the results obtained: (a) Enrich our understanding of DMT2 molecular pathophysiology; (b) Unveil important biomarker and drug-gene pharmacogenomics associations; (c) Help the use of personalized therapy options; and (d) Allow precision medicine concepts to be broadly exploited in new therapeutic developments and within the clinical setting.

1. Introduction

Diabetes Mellitus Type-2 (DMT2) is a complex polygenic metabolic disorder that has increased in prevalence over the last decades and constitutes a major public health issue that is classified as one of the leading causes of high mortality and morbidity rate. Current global estimates indicate that 537-million adults (20–79 years) are living with diabetes; that is projected to escalate to 643 million by 2030 and 783 million by 2045 [1]. DMT2 is characterized by hyperglycemia and metabolism disturbance with a large variation in the relative contributions of insulin resistance, as well as impaired insulin production and secretion by pancreatic β-cells between subgroups and individuals [2]. It is important for diabetes to be diagnosed and managed at the early stage to prevent or delay its potential complications, including macrovascular conditions such as coronary heart disease, cerebrovascular disease, and peripheral vascular disease and microvascular conditions, including retinopathy, neuropathy, and nephropathy [3]. Growing scientific evidence and research data suggest that inflammation, adipokine dysregulation, oxidative stress, and abnormalities in the immune system have emerged as important pathophysiological factors [4,5].
The heterogeneity in the clinical phenotype of DMT2 leads to variations of therapeutic responses to the different drug classes and, sometimes, even serious adverse effects between patients, so there is growing uncertainty regarding the proper selection and screening of antidiabetic agents for each individual. For most patients, there is a wide spectrum of glucose-lowering treatment options, and the choice is based predominantly on costs and average effects in clinical trials. After the initial metformin, in patients with established atherosclerotic cardiovascular and chronic renal disease, current guidelines recommend incretin-related medications, including glucagon-like peptide 1 receptor agonists (GLP-1RA) and dipeptidyl peptidase-4 (DPP-4) inhibitors, or sodium–glucose cotransporter 2 inhibitors (SGLT2i) [6,7]. However, these specific recommendations are applied to only 15–20% of diabetic patients [8,9].
Precision medicine has the potential to optimize the diagnosis, prediction, prevention, or treatment of diabetes by integrating multidimensional data based on genetic factors, clinical features, and biomarkers of specific patient subgroups rather than for the patient population as a whole [10]. Body mass index (BMI), sex, HbA1c, markers of renal function, such as estimated glomerular filtration rate (eGFR) and other biomarkers, and clinical characteristics can be used for the stratification of people with Type 2 diabetes into subgroups showing differential responses to glucose-lowering therapies [11]. It has been suggested that a higher BMI (BMI > 30 kg/m2) could be associated with a greater glucose-lowering response with thiazolidinediones (pioglitazone) than DPP4 inhibitors (sitagliptin), and that patients with lower eGFR (60–90 mL/min/1.73 m2) have a greater response to DPP4 inhibitors than SGLT2i inhibitors compared with patients with higher eGFR (>90 mL/min/1.73 m2) [12].
Nowadays, the advances in genomics, bioinformatics, and nanotechnology promise a more effective approach to prevent, classify, manage, and treat diabetes. Thus, the implementation of pharmacogenomic knowledge of antidiabetic therapeutics in the clinical setting is resulting in new research directions in precision diabetes medicine. Apart from heterogeneity in the pathophysiology of DMT2, patients also showed marked variations in their responses to various blood glucose-lowering drugs due to specific polymorphisms in genes related to metabolism and a response to antidiabetic drugs. With increasing understanding of the molecular mechanisms of diabetes and the documentation of different subphenotypes, there is a case to include this new knowledge to improve the precision of diagnosis and classification to optimize care, maximize treatment efficacy, and reduce undesirable side effects [13,14,15,16].
This study is focused on the use of systems pharmacology and network analysis methodologies to comprehensively analyze the molecular and genomics data associated with DMT2, as well as to assess drug interactions in specific pharmacological classes that affect DMT2 pharmacotherapy outcomes. The disease genes associated with DMT2 were obtained from expert-curated databases and analyzed via bioinformatic tools to identify biological processes and cellular locations, as well as molecular functions and pathways enriched in DMT2-related genes. In addition, the target genes of DMT2-related miRNAs, as validated via experimental procedures, were also retrieved from expert-curated databases and thoroughly studied via bioinformatic analysis accordingly. The unique shared genes between the experimentally validated target genes of DMT2-related miRNAs and the genes associated with DMT2 were identified, studied via a targeted bioinformatics analysis, and visualized in networks that assemble the pharmacogenomics profile of DMT2. Through this approach, the work provided aims to advance our understanding of microRNA, gene, and drug-target associations by presenting connectivity and interaction molecular maps of practical clinical utility. In this way, we also aim to facilitate the application of pharmacogenomic knowledge to guide precision medicine therapeutic decisions in group and individual patients.

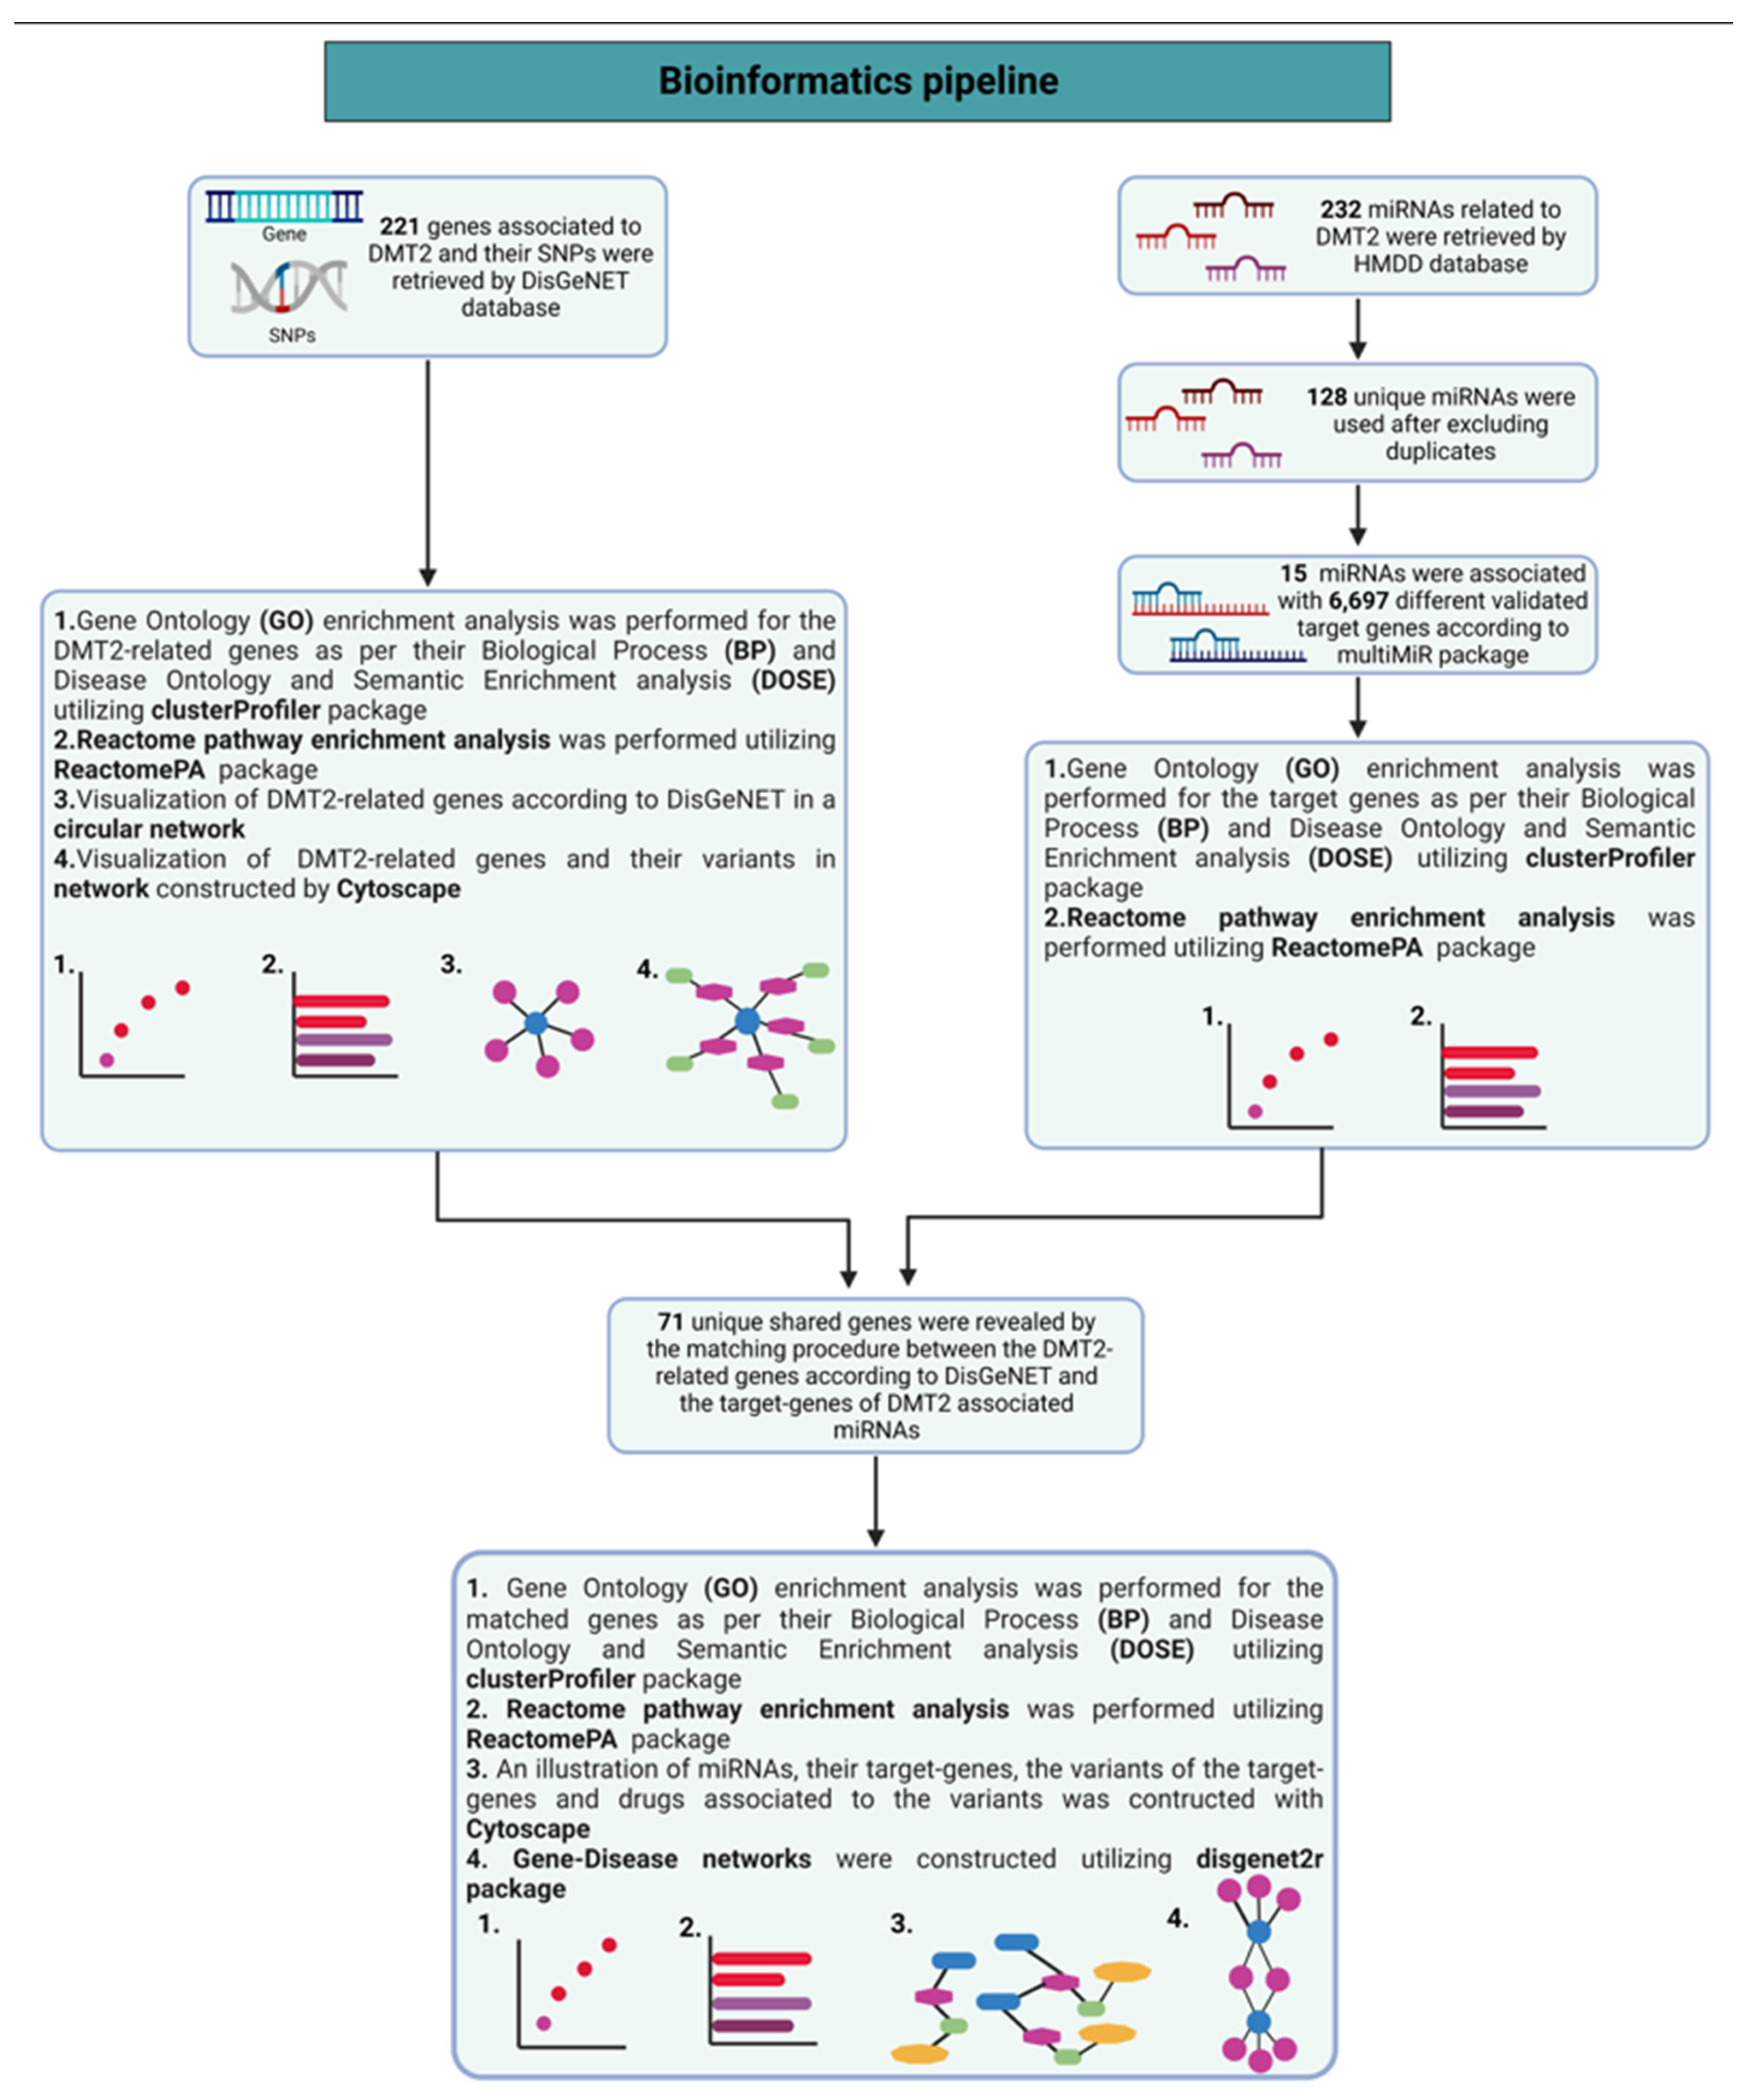
2. Materials and Methods

Methodology to Perform Network Analysis of Pharmacogenomics Data Related to DMT2

The genes and variants associated with Diabetes Mellitus Type 2 were recovered from DisGeNET database (https://www.disgenet.org/ accessed on 12 December 2022) (v7.0) utilizing the disgenet2r package (v099.2) in R. Shared genes involved in multiple diseases, including DMT2, colorectal cancer, kidney disease, and obesity, were also retrieved using the same package. DisGeNET contains disease-associated genes and variants derived from expert-curated repositories, GWAS catalogues, animal models, and the scientific literature. Only the data derived from expert-curated repositories were retrieved and used for the bioinformatics analysis. The overrepresentation analysis of the genes associated with DMT2 for Gene ontology (GO), disease ontology (DOSE), and REACTOME pathways enrichment was performed utilizing clusterProfiler (v4.0.5), DOSE (v3.18.3), and ReactomePA (v1.36.0) R packages, respectively.
MiRNAs associated with Diabetes Mellitus Type 2 (DMT2) were retrieved from the Human microRNA Disease Database (https://www.cuilab.cn/hmdd/ accessed on 12 December 2022) (HMDD v.3.2). This database contains curated experiment-supported evidence for human microRNA-disease associations. The validated target genes of the DMT2-associated miRNAs were recovered from the miRTarBase, miRecords, and TarBase databases using multiMiR package in R. For increased reliability, the target genes of the DMT2-associated miRNAs were further filtered to incorporate only the interactions validated with appropriate experimental molecular methods, including Western Blot analysis, reporter activity assays, qPCR, microarray array, etc. An overrepresentation analysis on the validated target genes of the DMT2-associated miRNAs for gene ontology (GO), disease ontology (DOSE), and REACTOME pathways enrichment was performed, as described previously.
A targeted bioinformatics analysis to reveal unique shared genes between the experimentally validated target genes of DMT2-related miRNAs and the genes implicated in DMT2 pathogenesis was also performed, matching the genes identified in the two groups. An overrepresentation analysis on the matched genes involved in DMT2 pathophysiological mechanisms and targeted by the DMT2-associated miRNAs was performed, as described previously. Curated variant-drug pairs were retrieved by PharmGKB database (https://www.pharmgkb.org/ accessed on 12 December 2022), according to the clinical annotations [17]. The variant-drug pairs corresponding to the genes shared among the two groups were included in the miRNA-target genes network. Cytoscape (v3.9.0) software platform was used for network construction and visualization. Scheme 1 illustrates the detailed pipeline followed to implement the bioinformatics analysis.

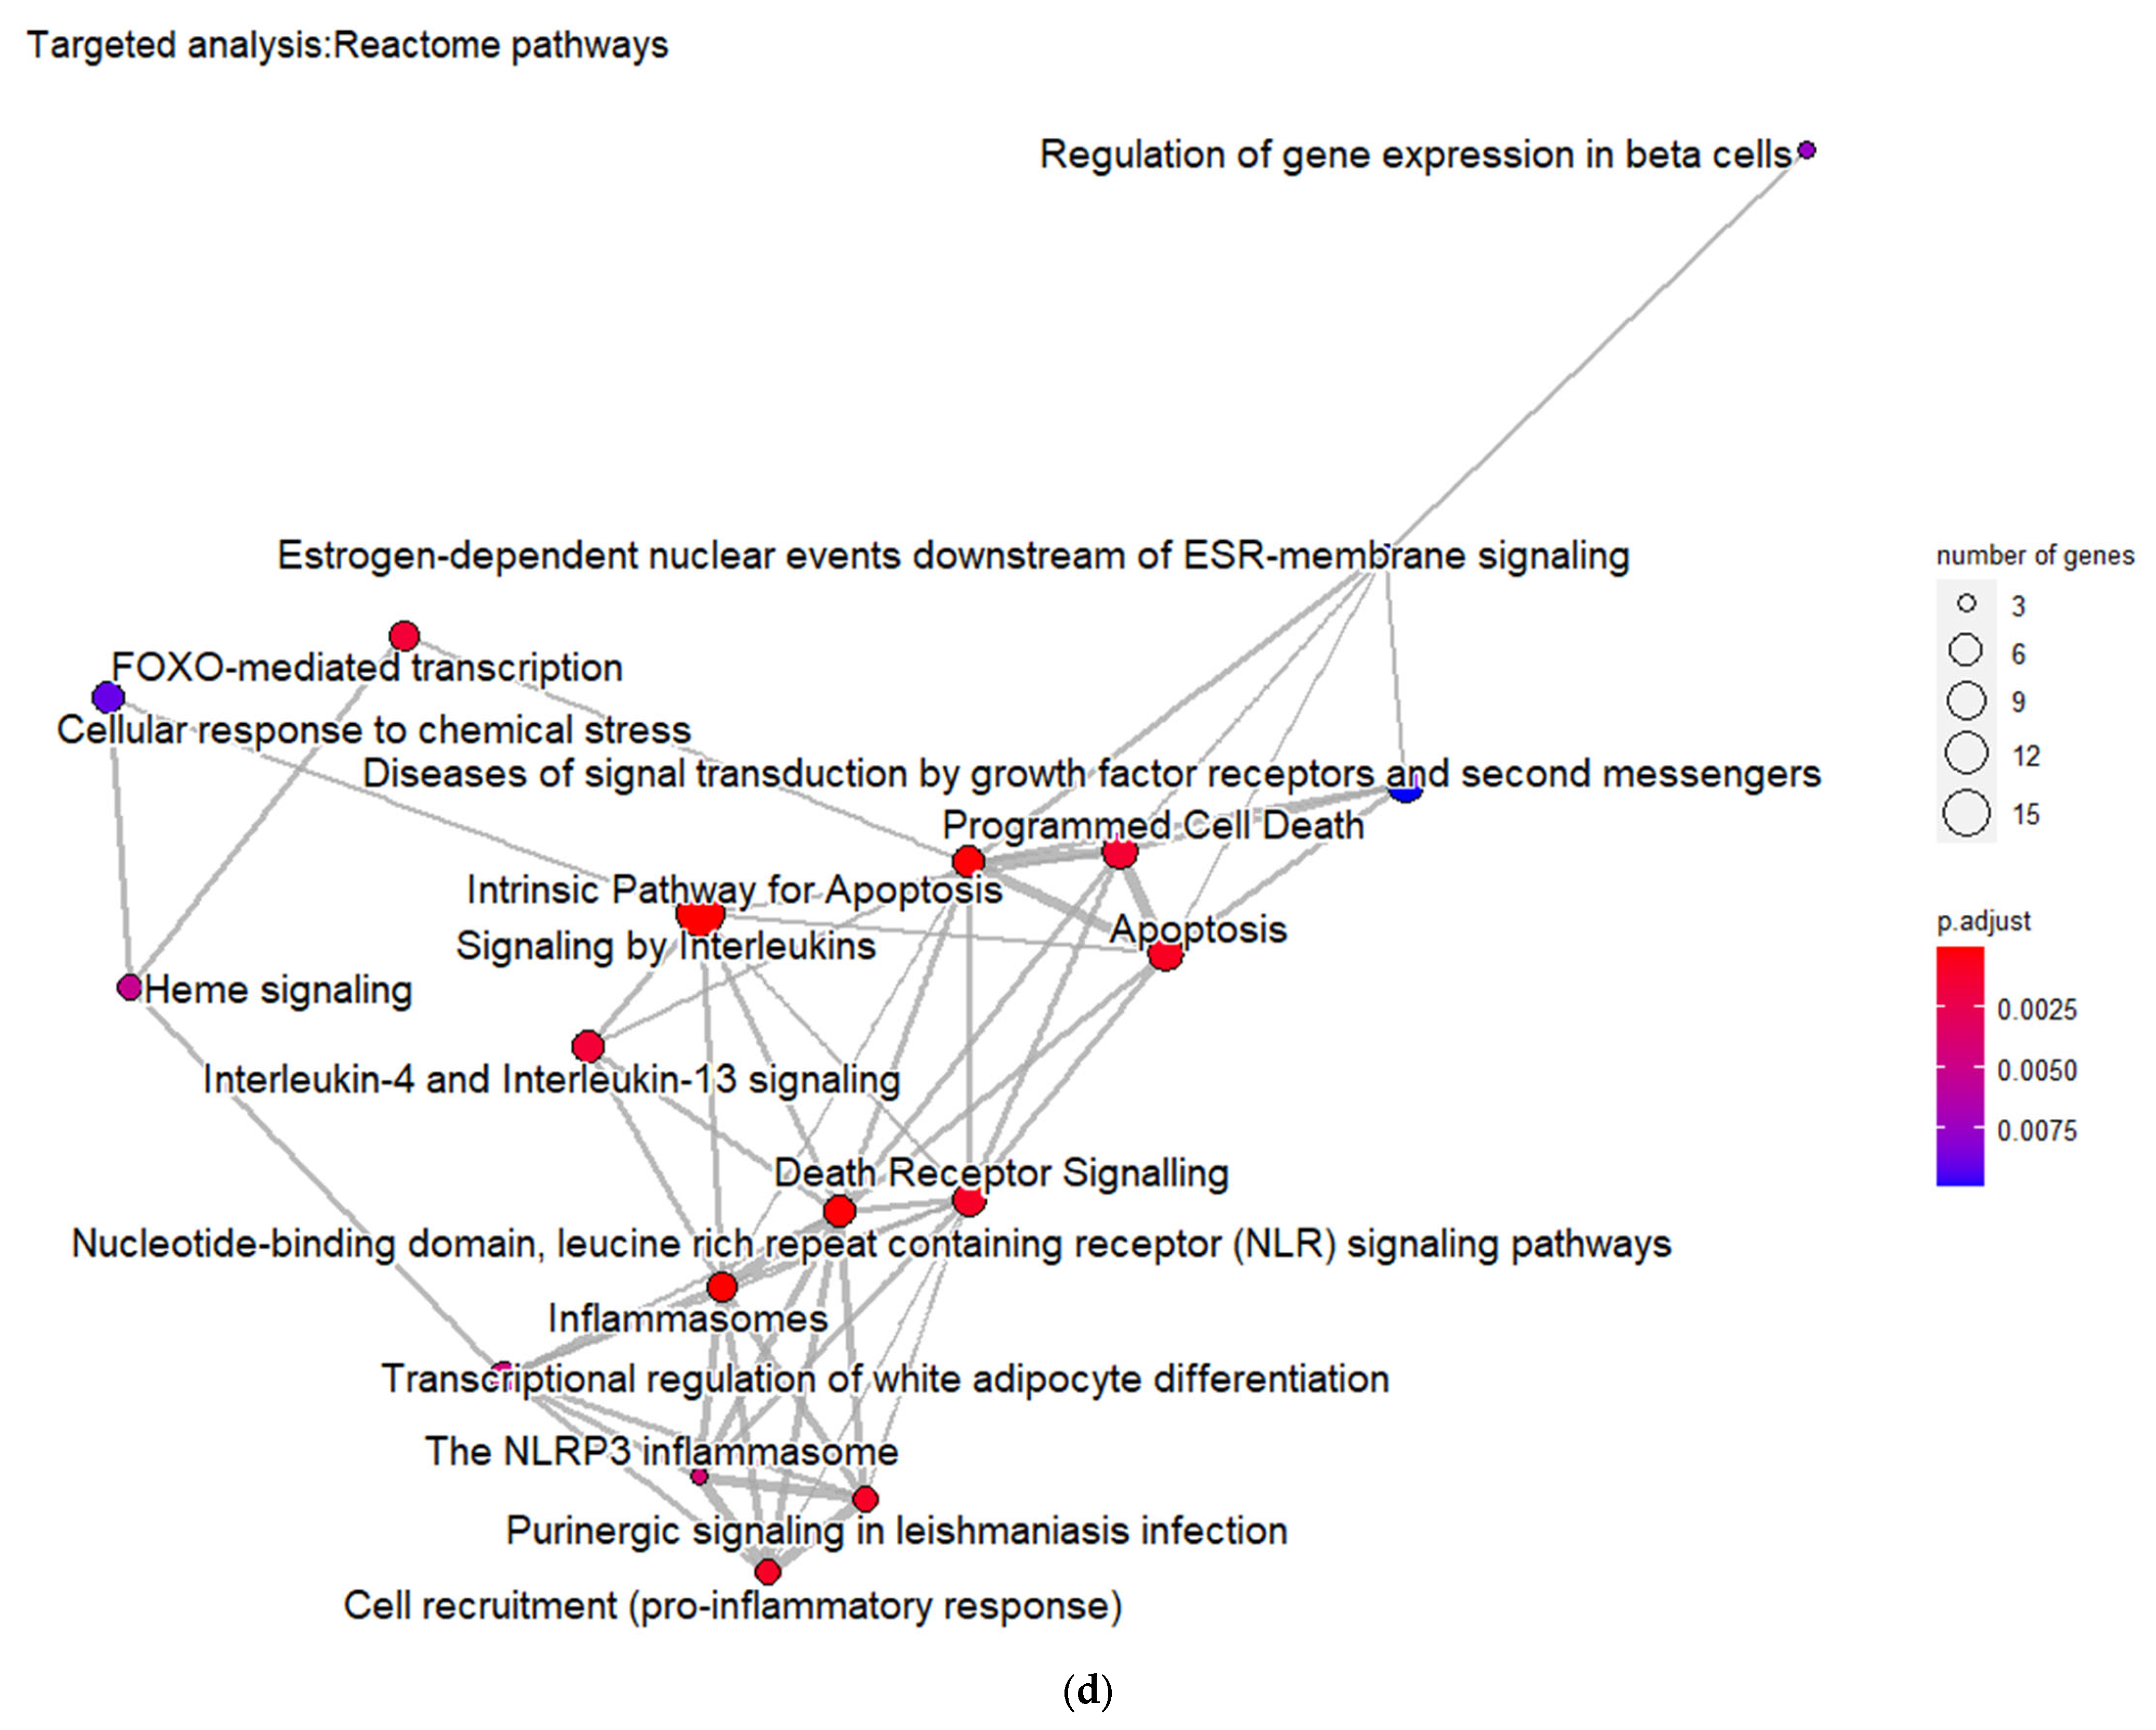
3. Results and Discussion

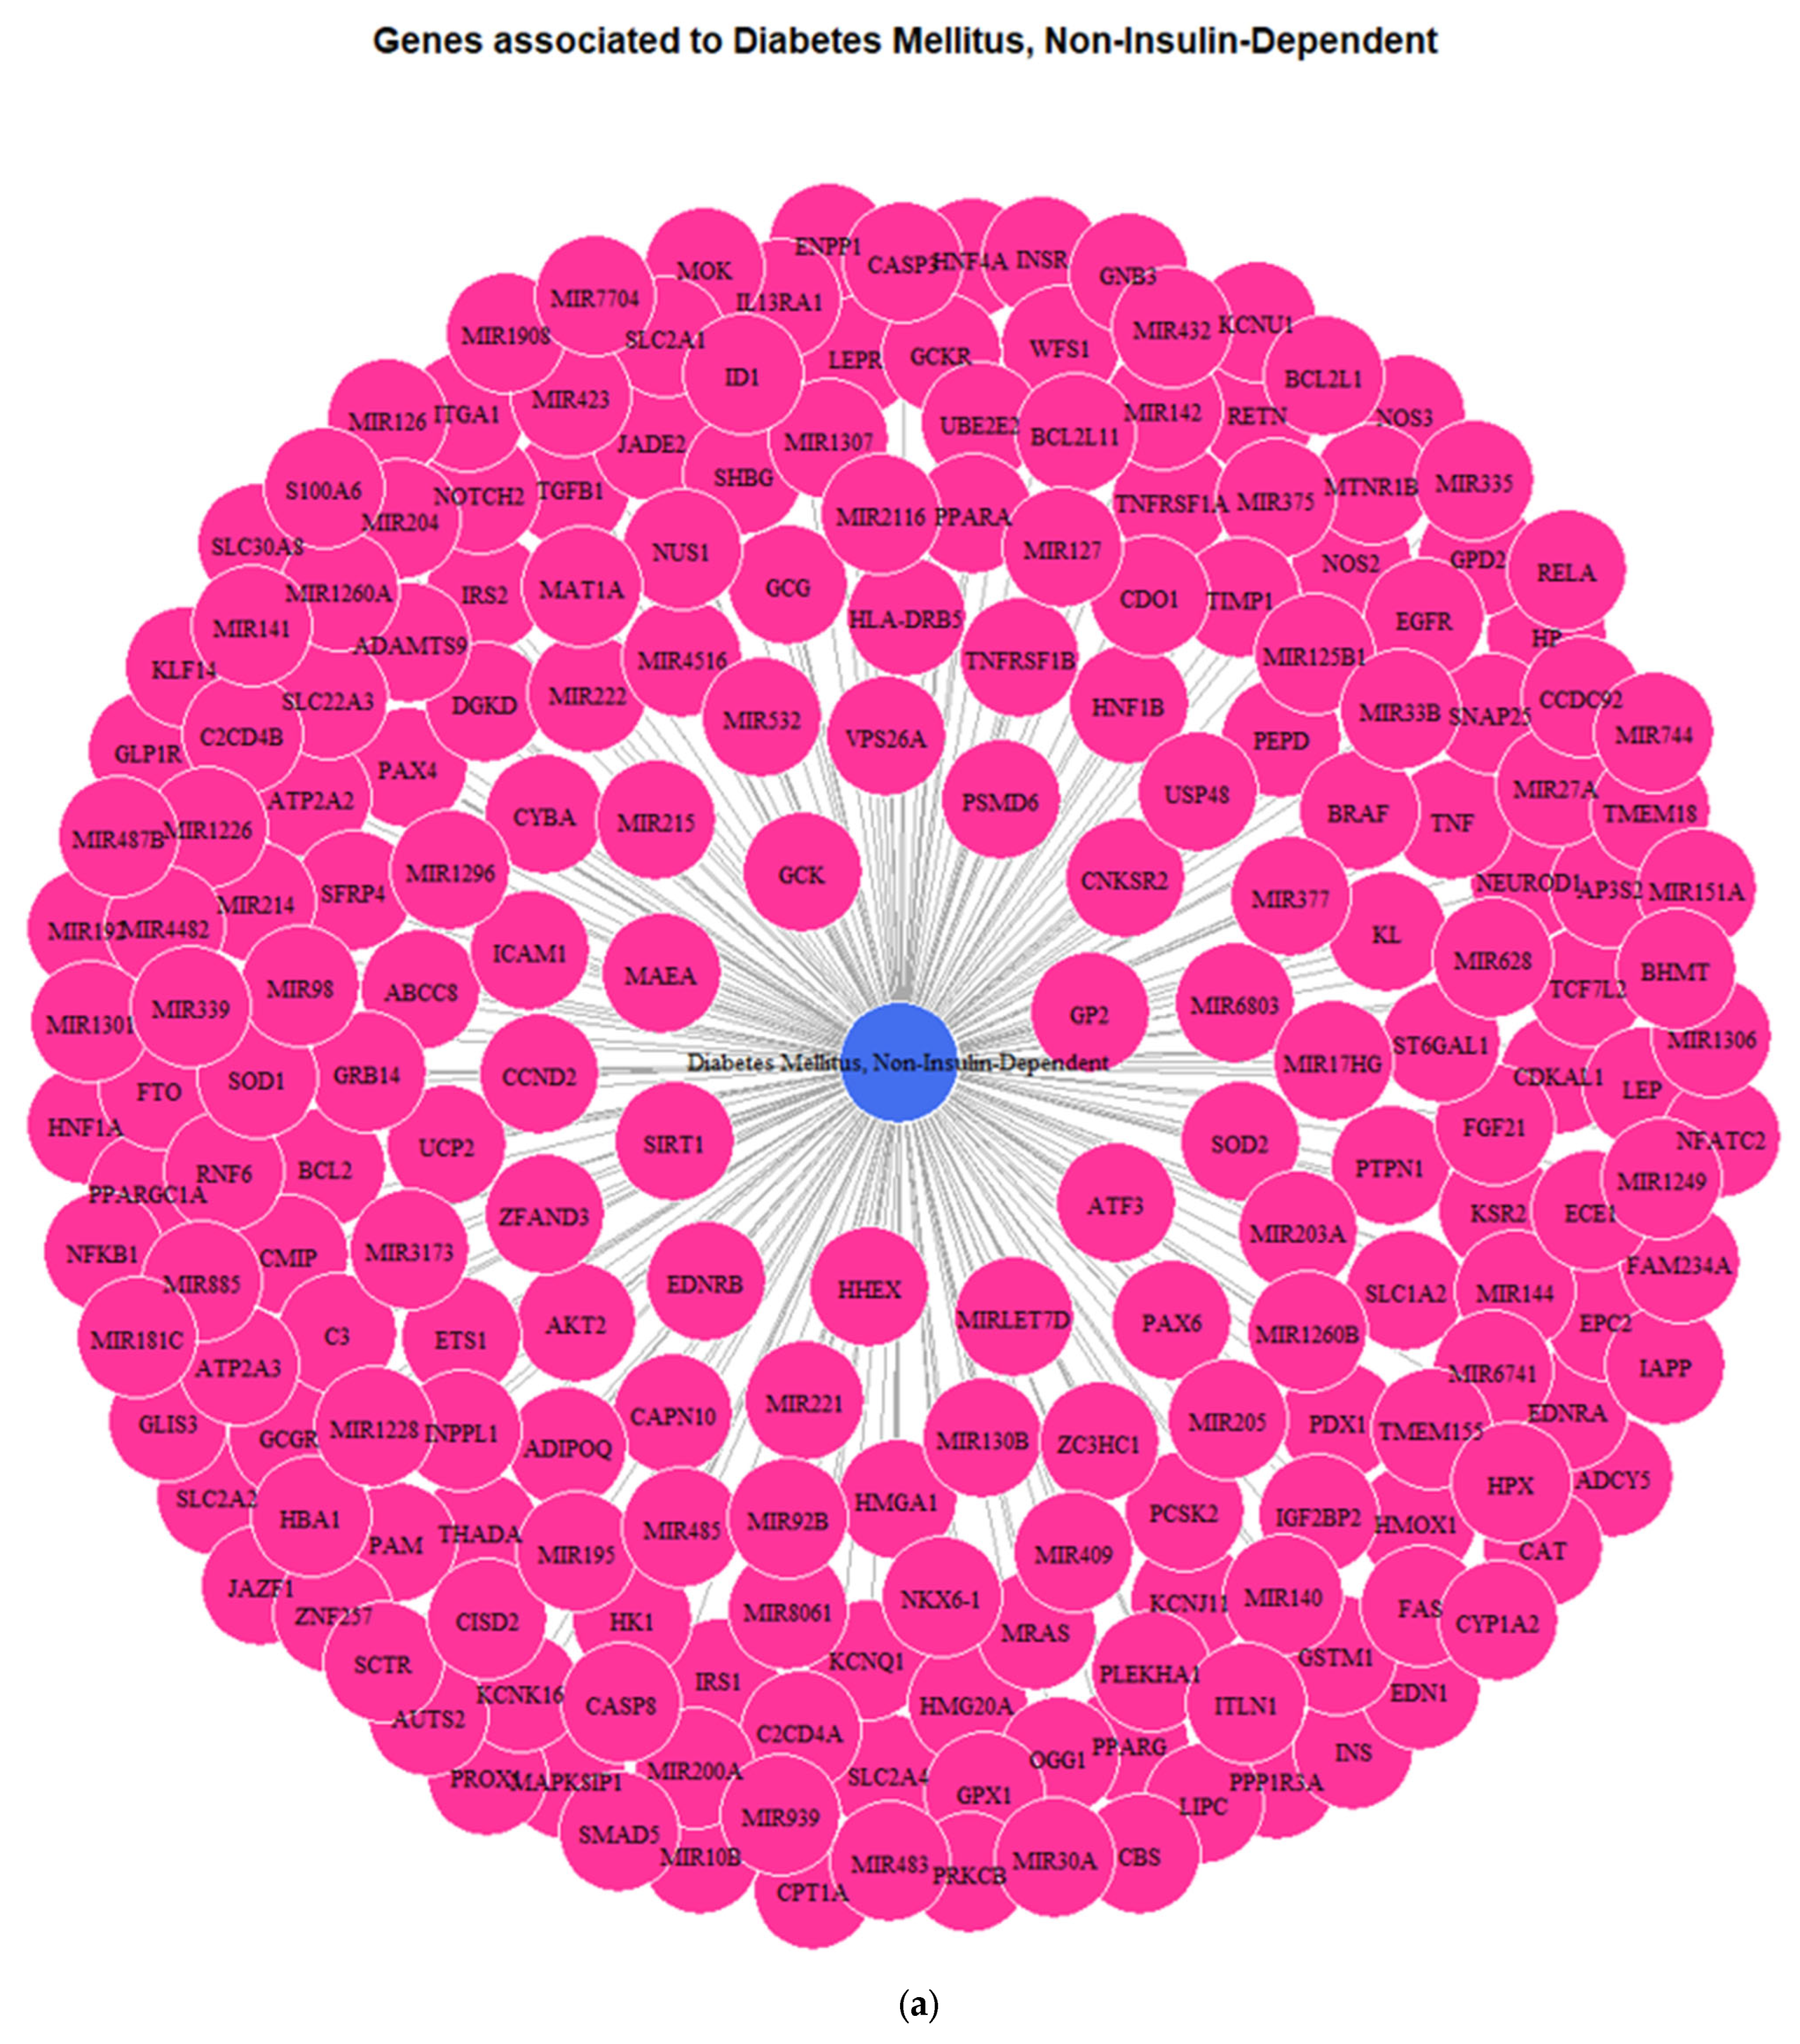
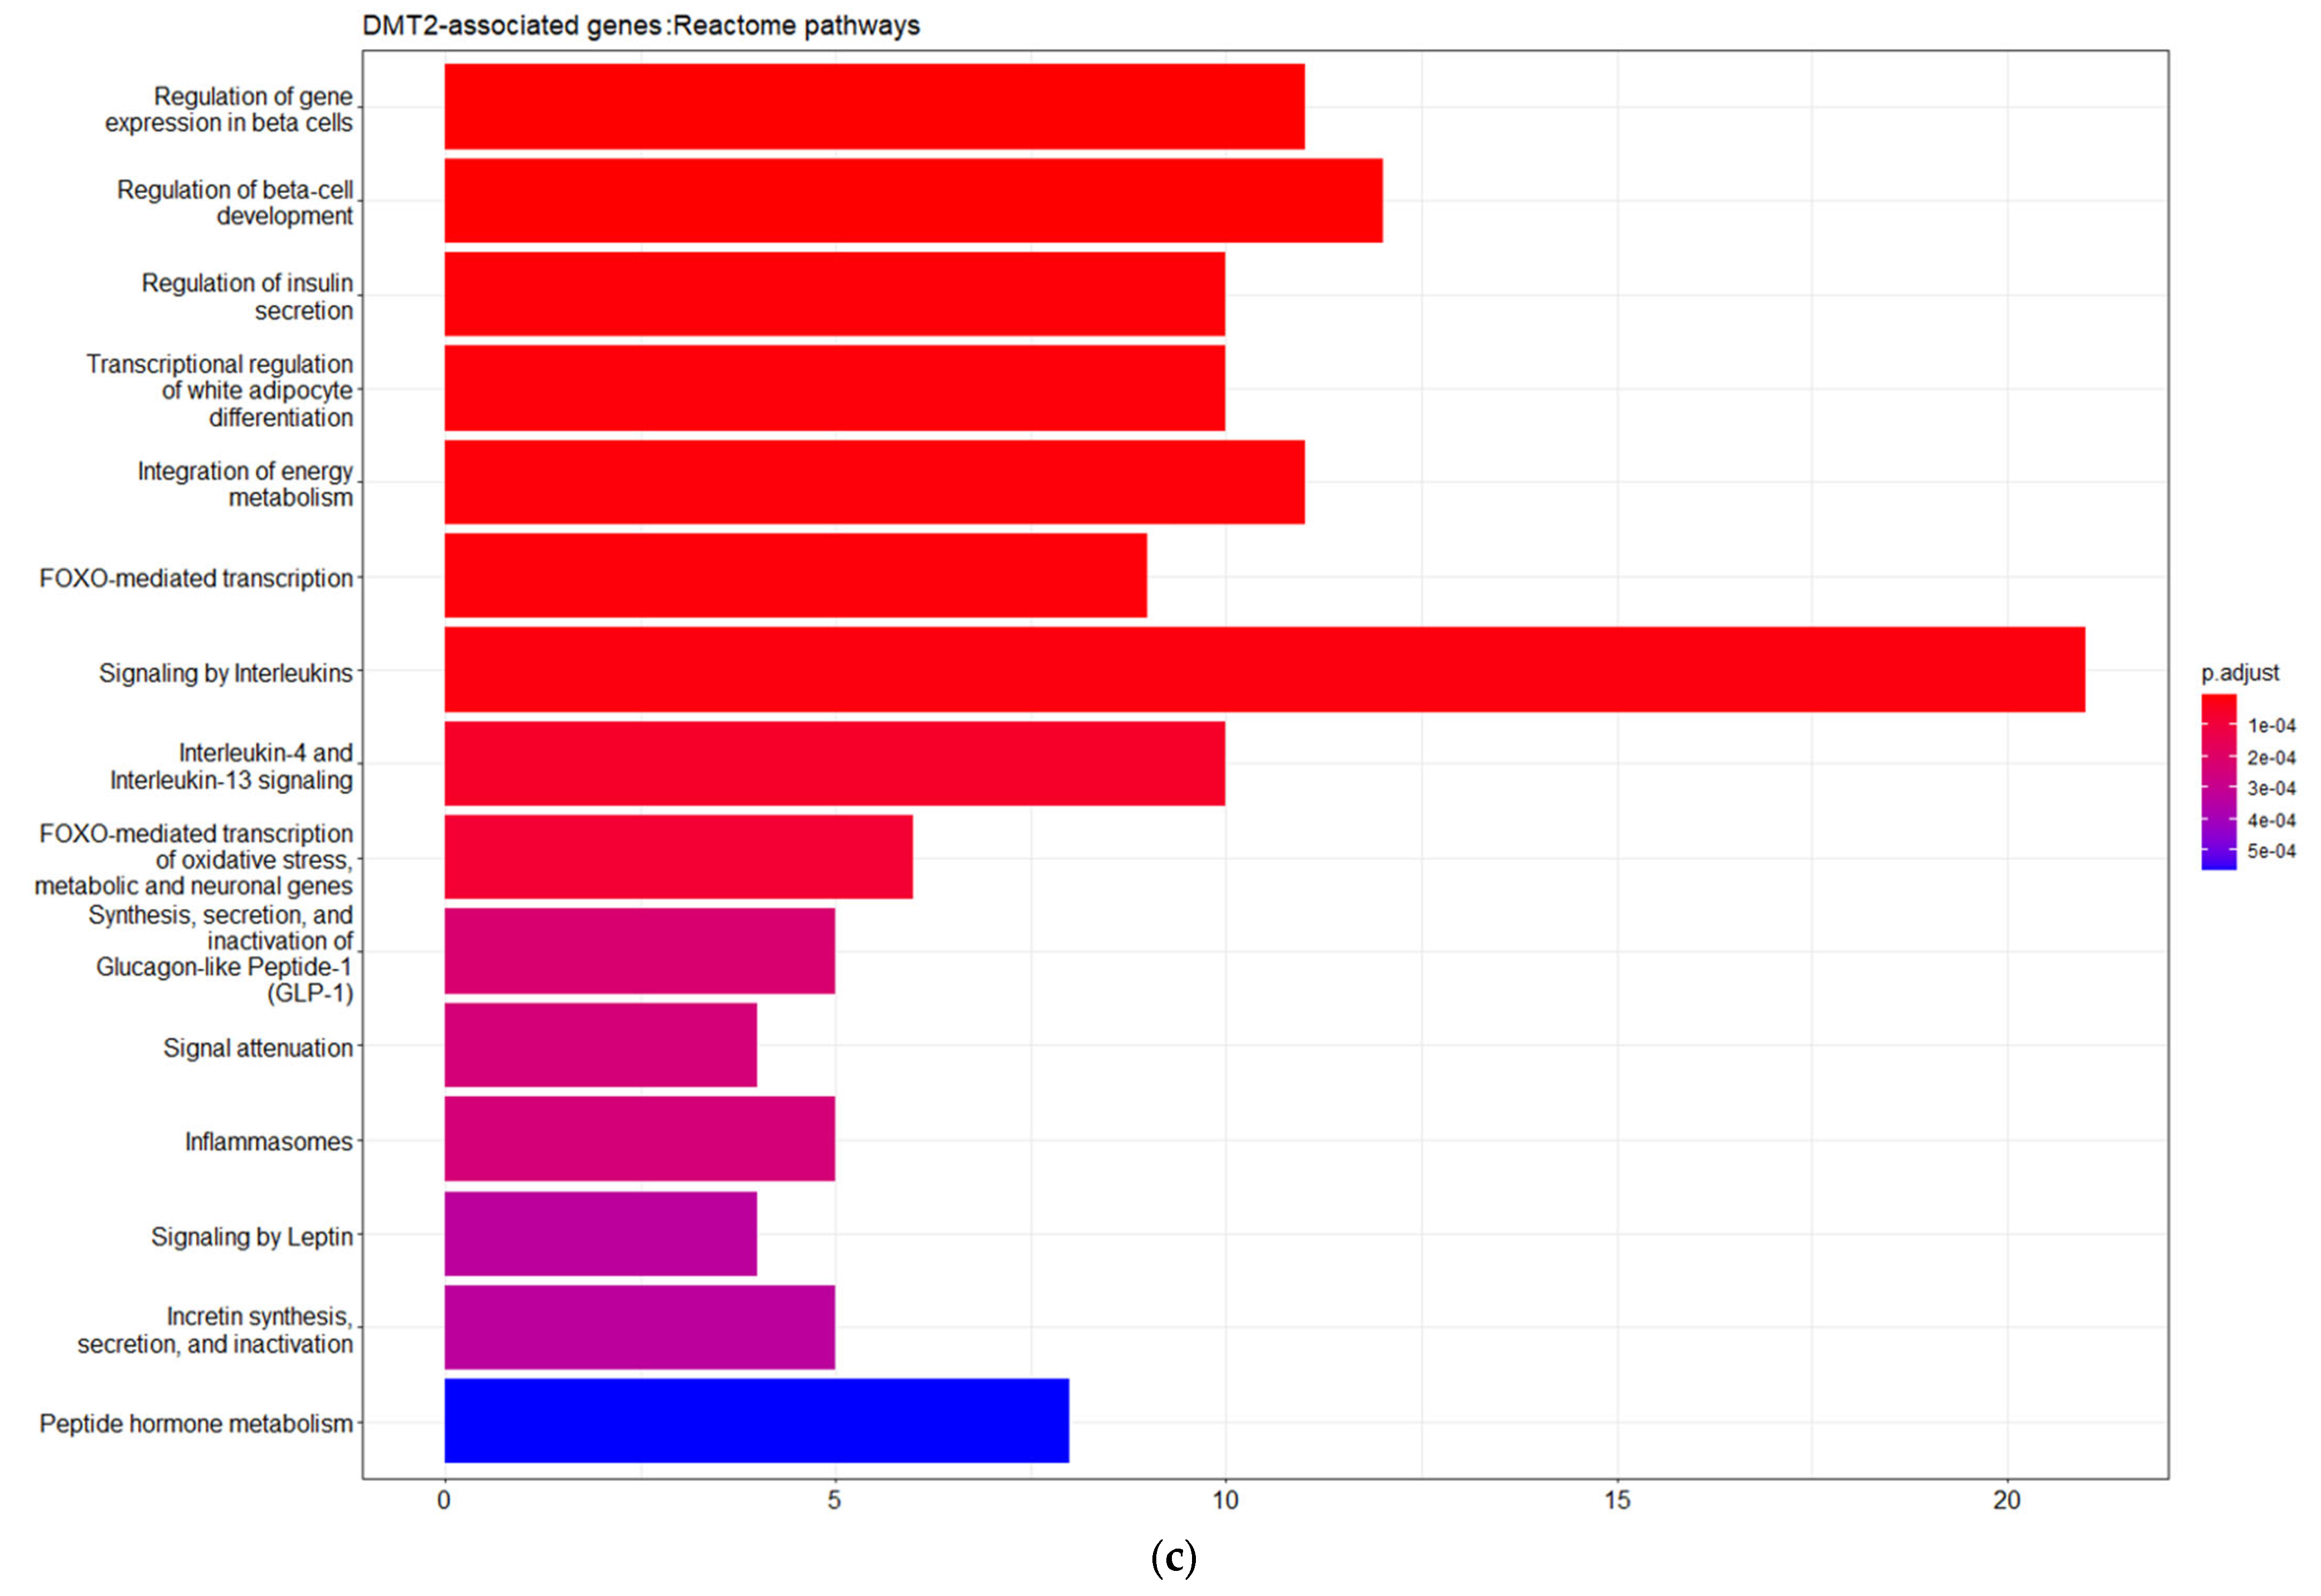
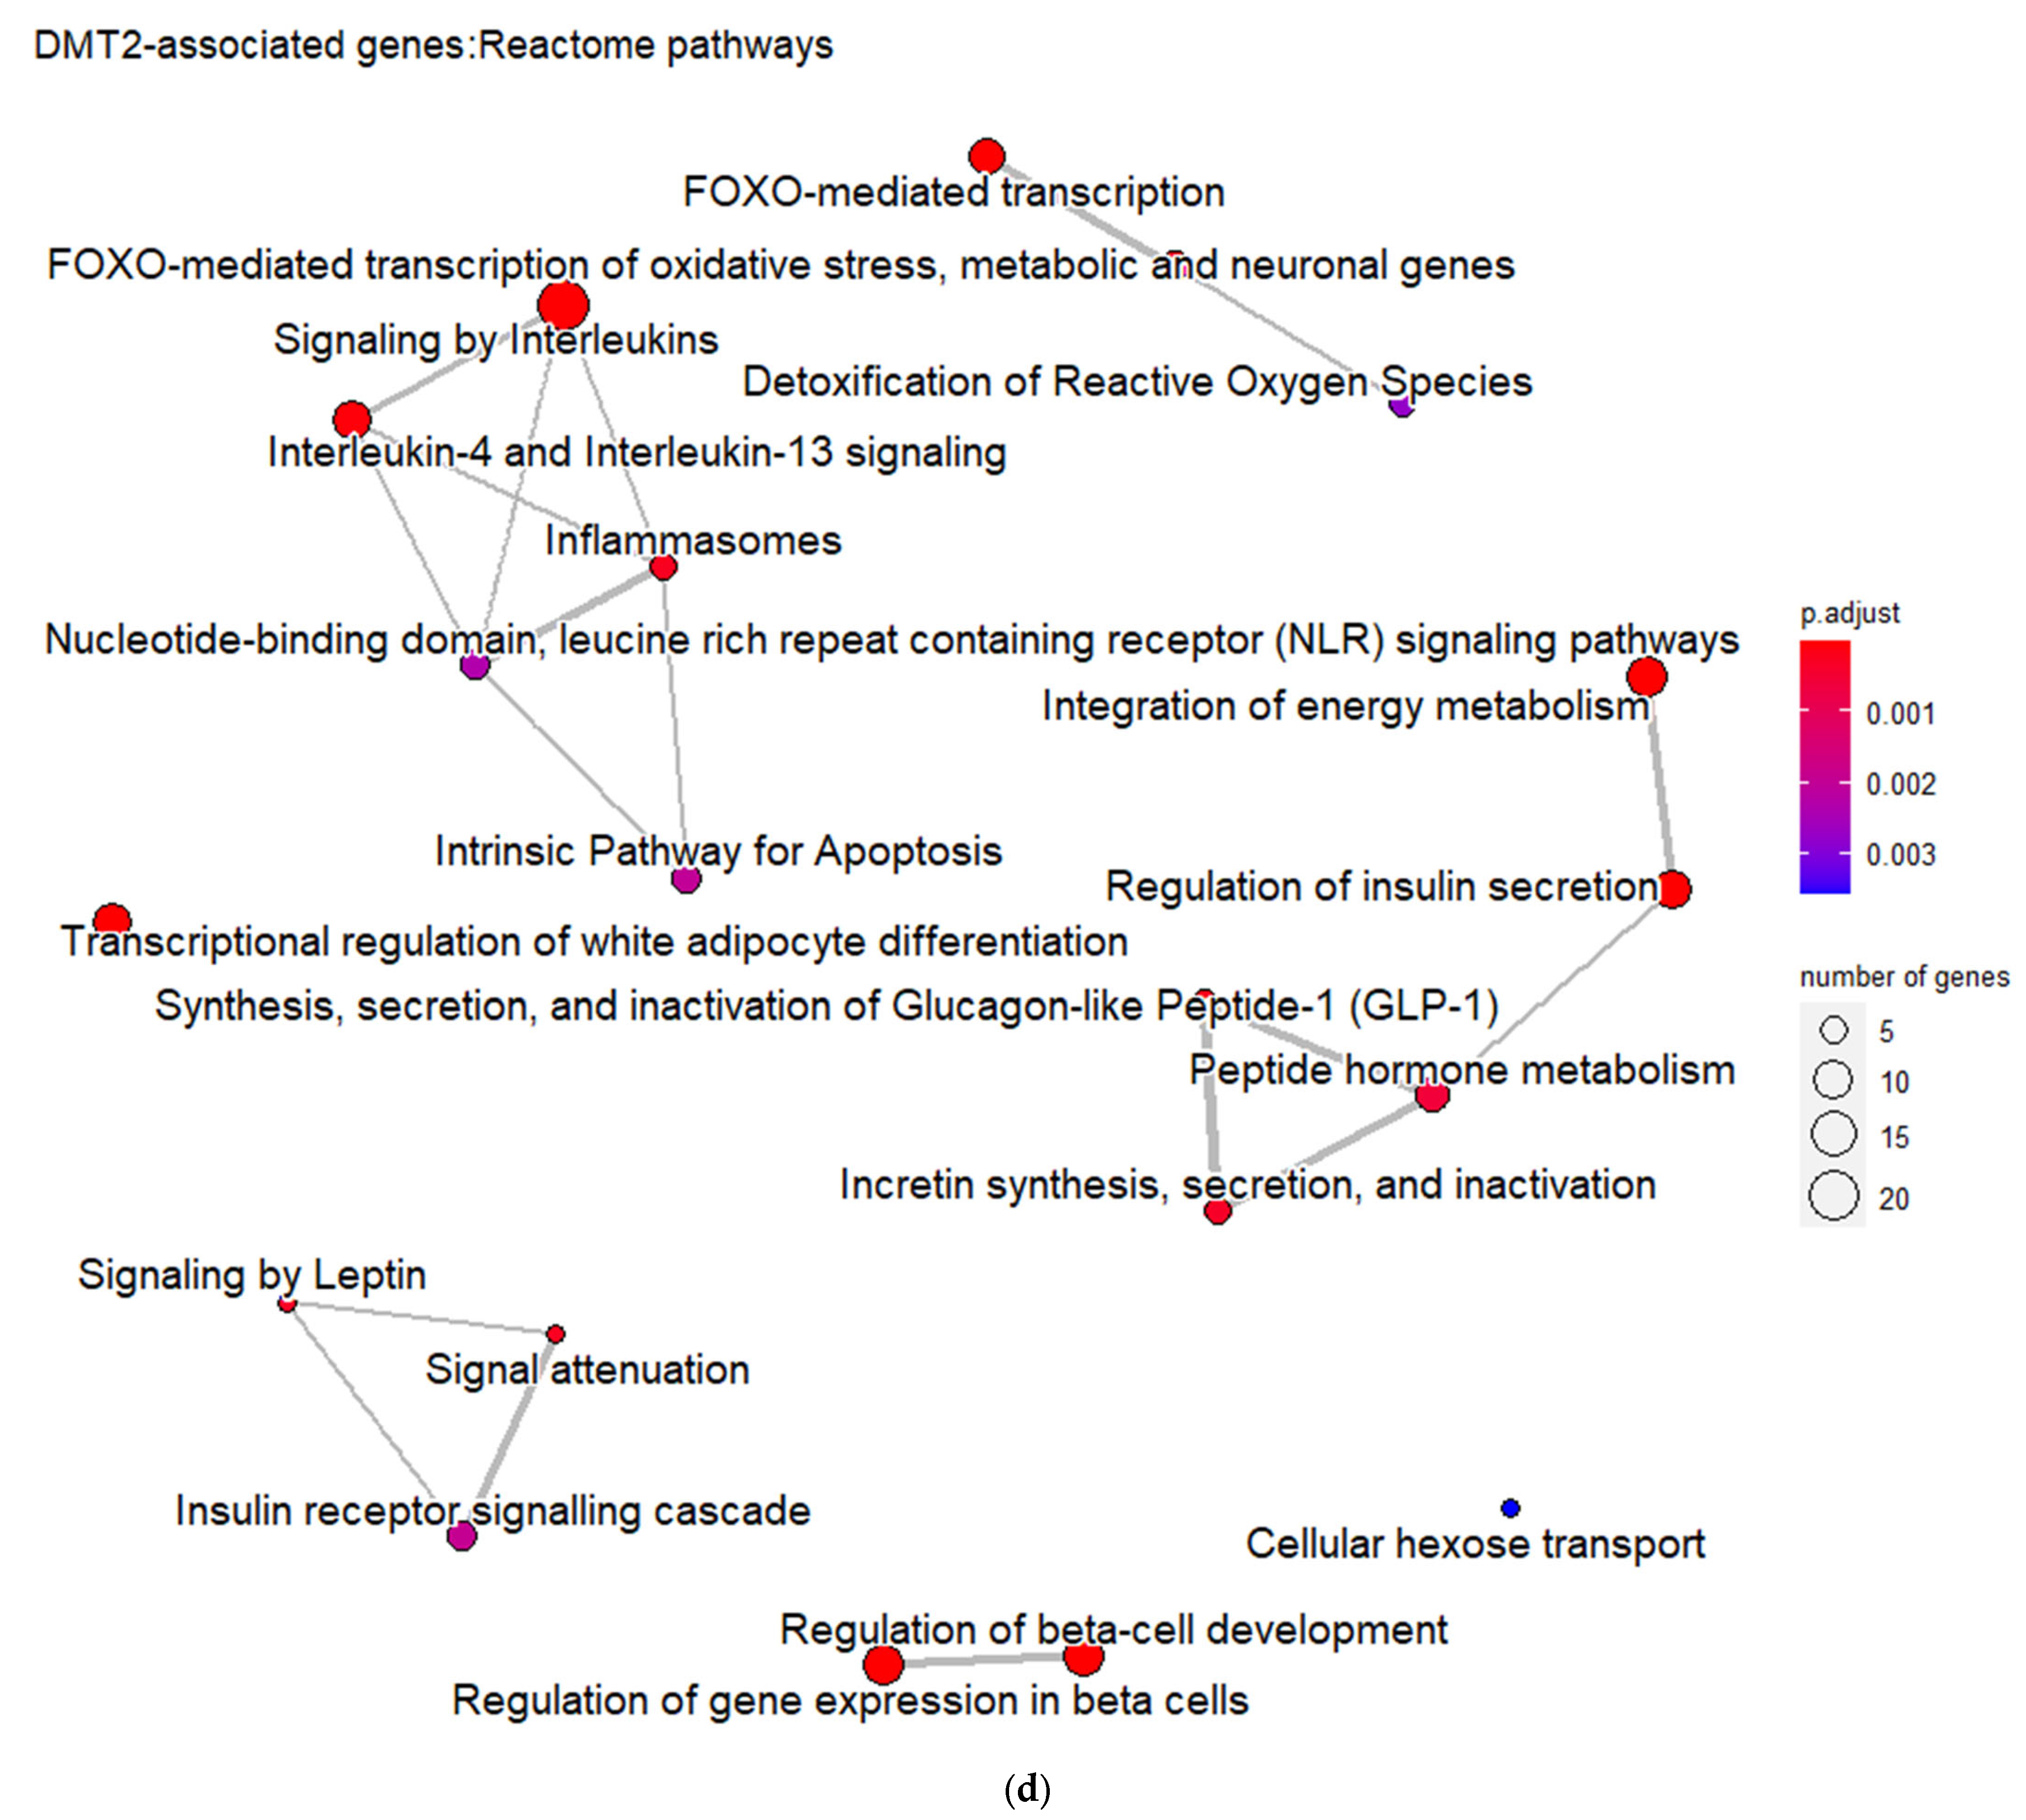
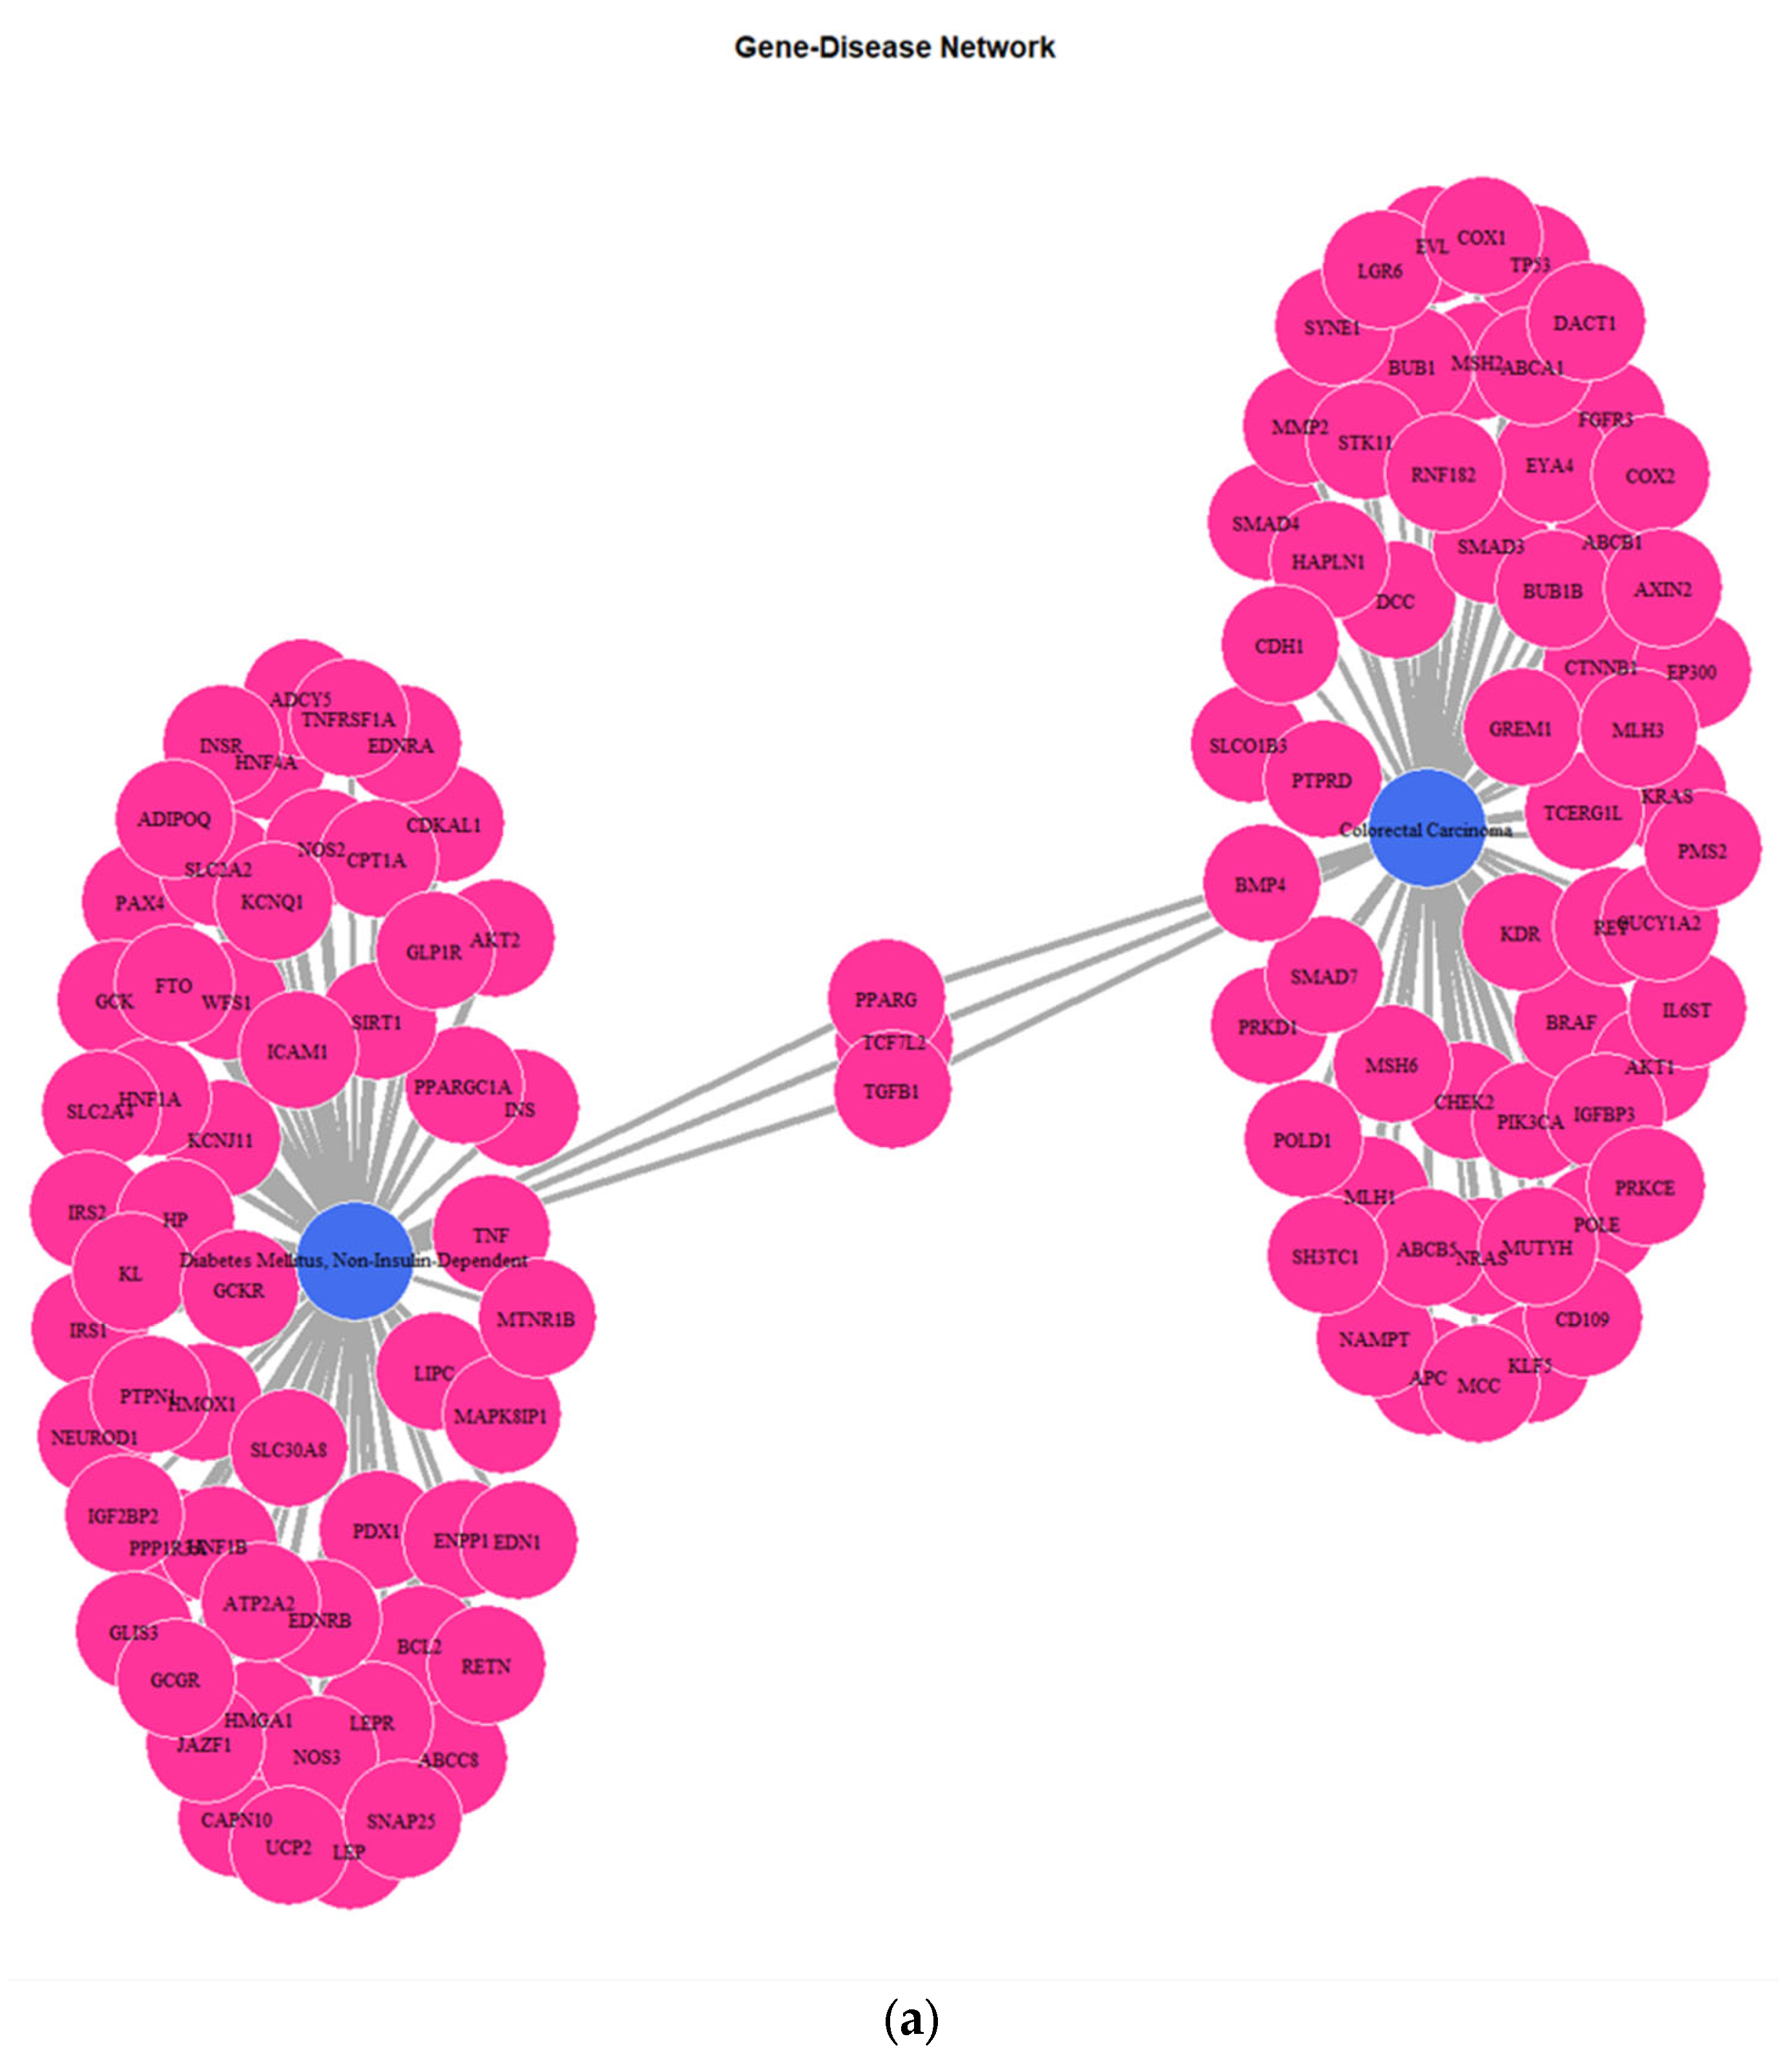
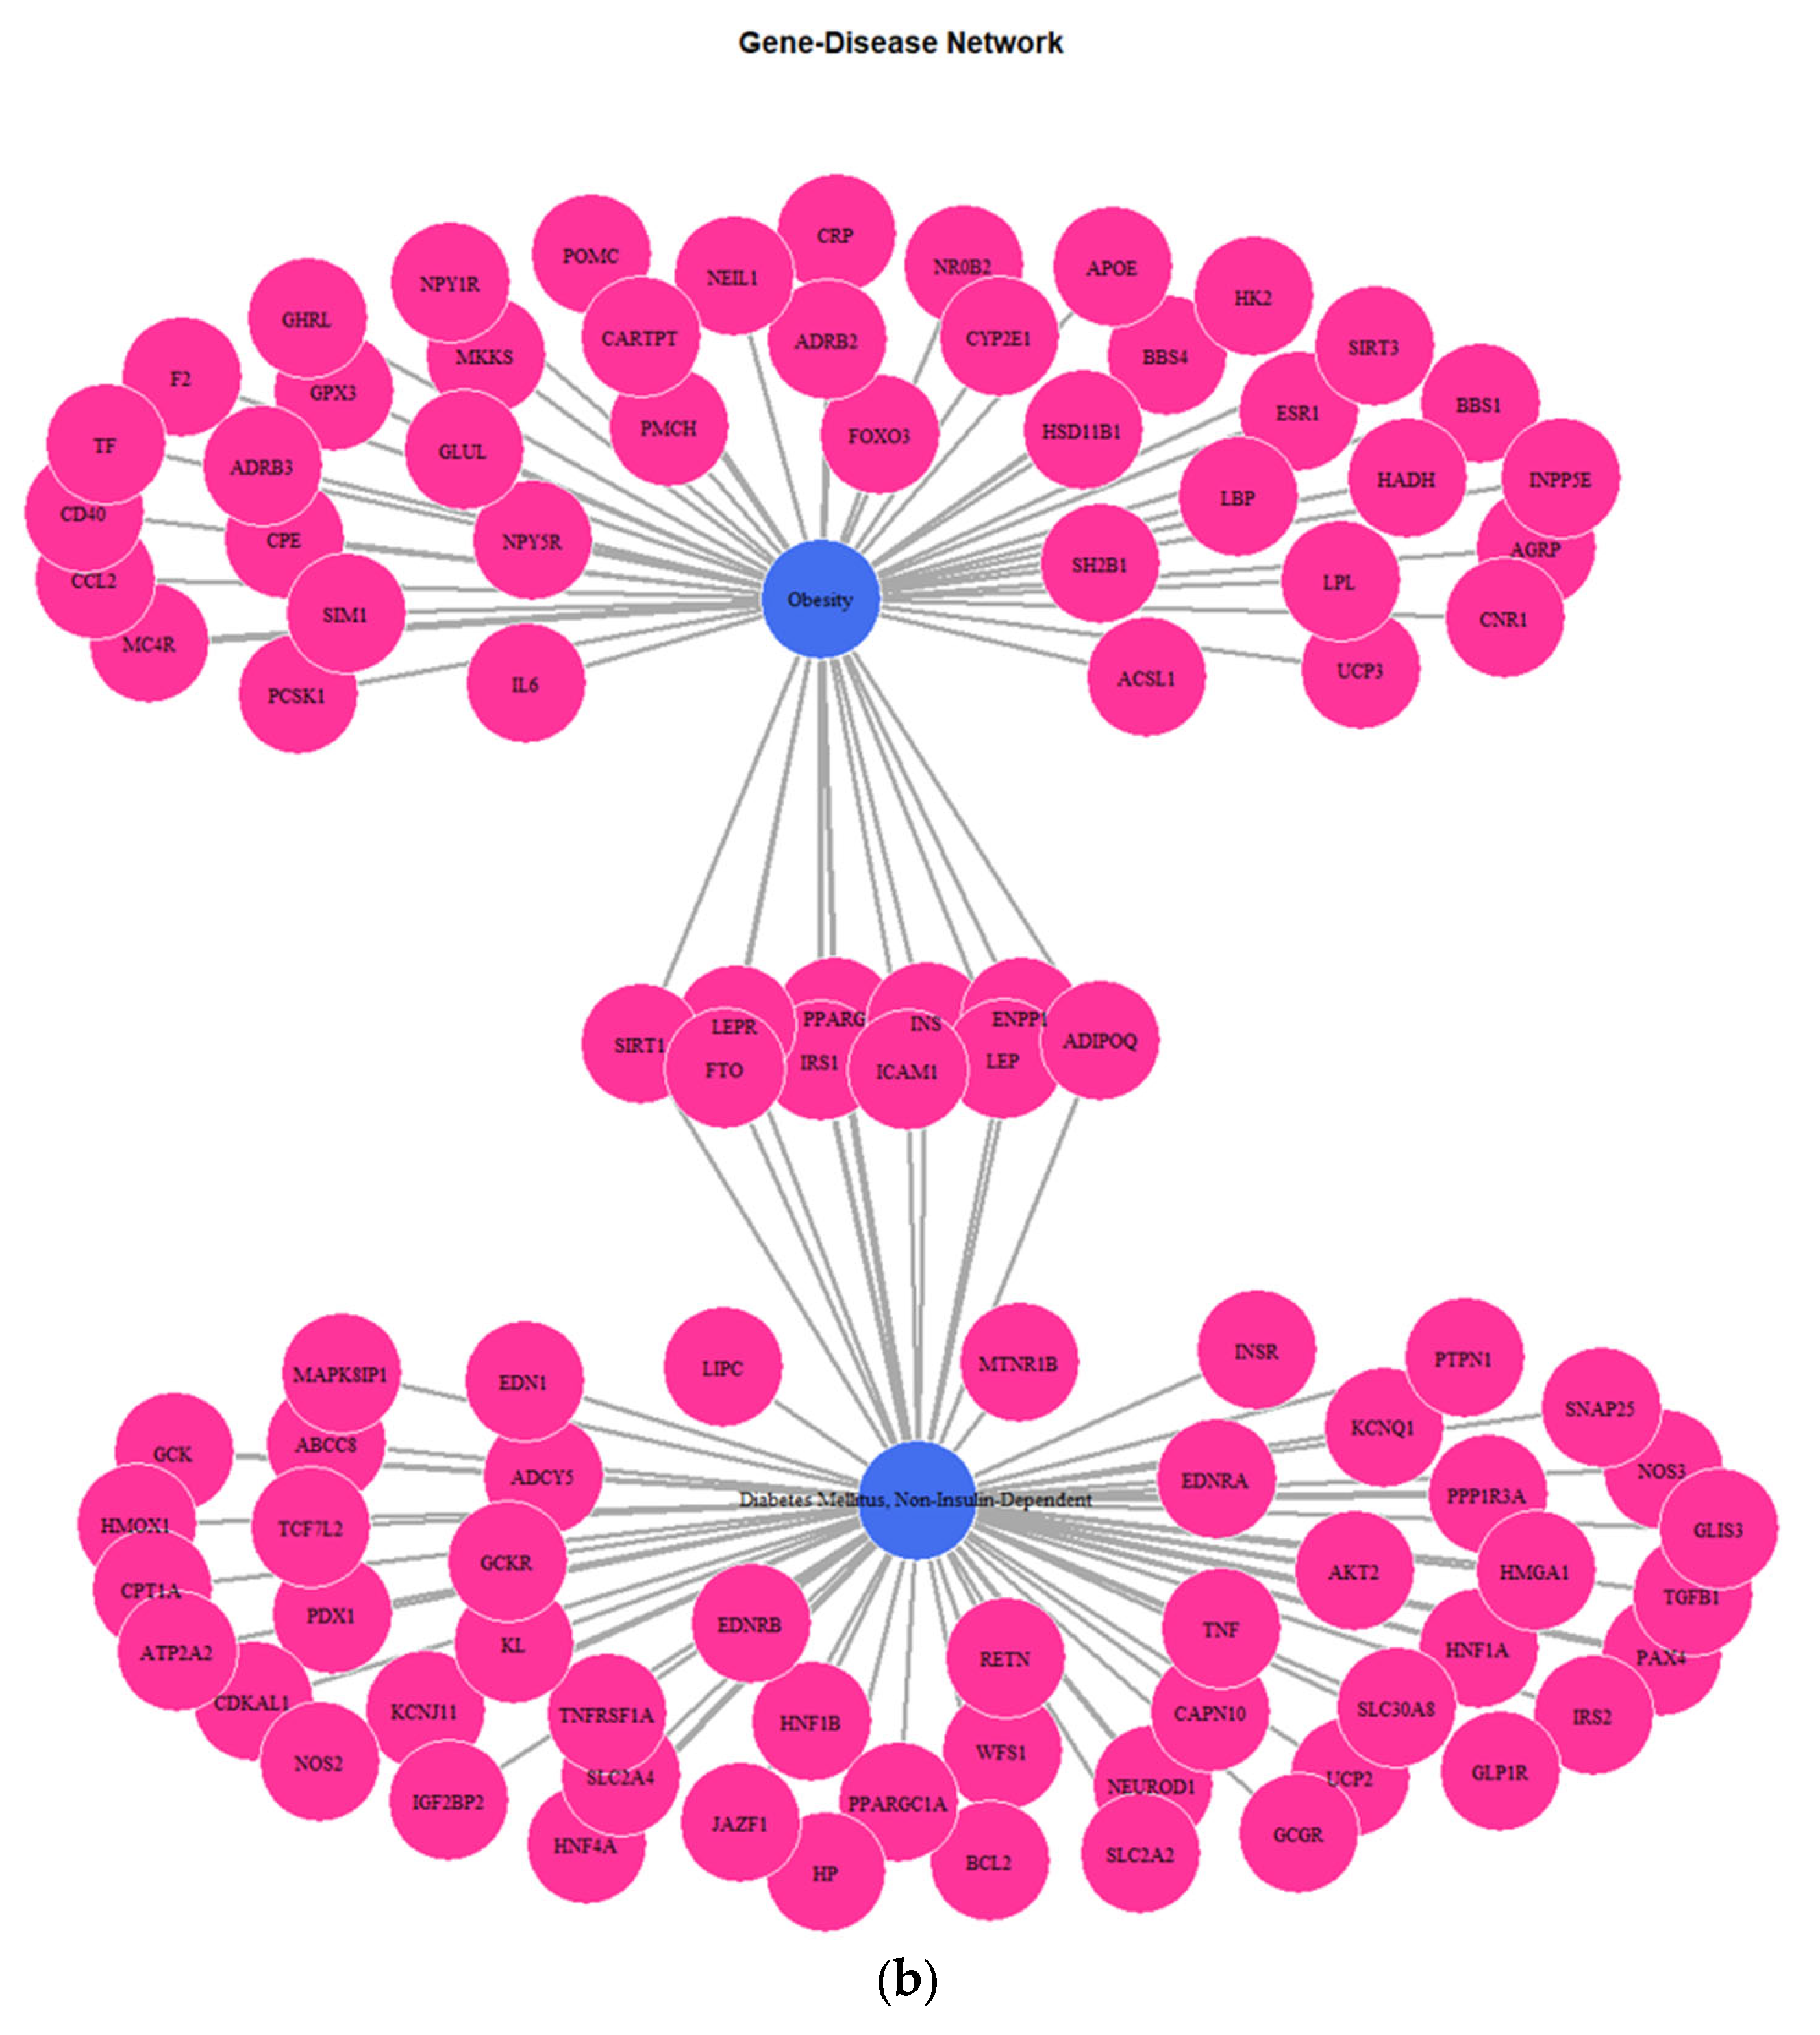
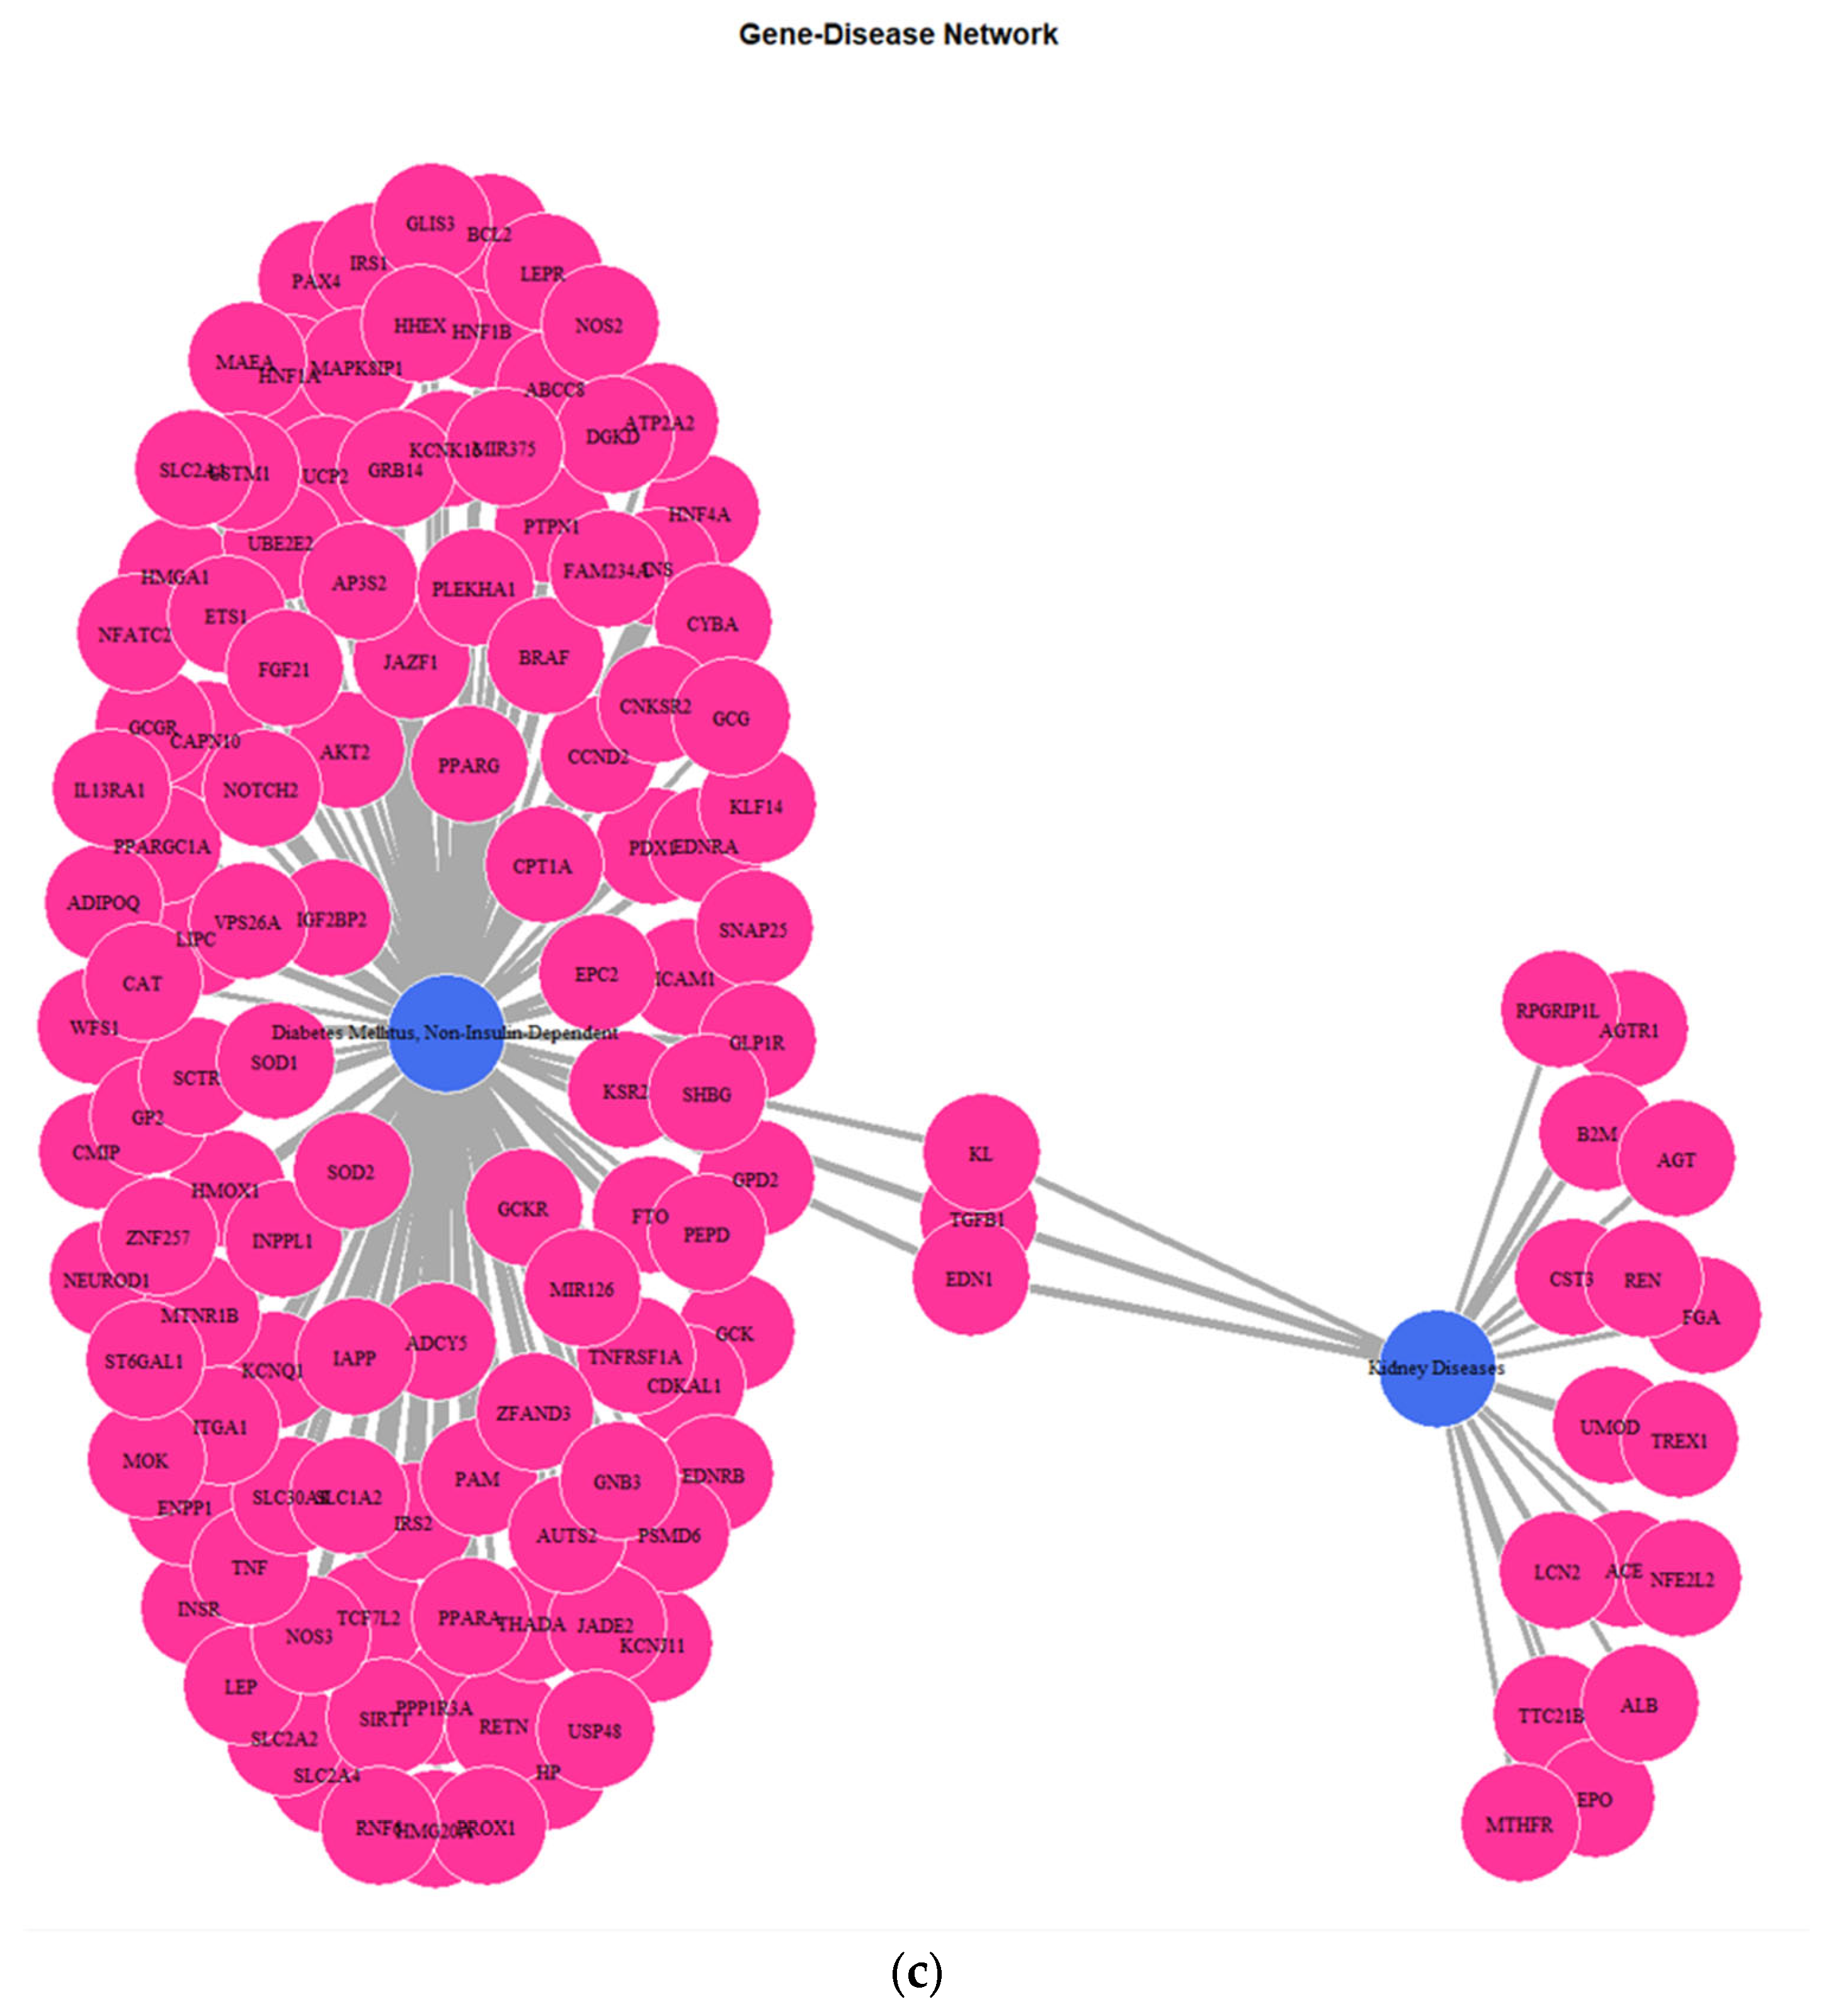
3.1. Genes Implicated in DMT2 Disease According to DisGeNET Database

Our search in the DisGeNET database, using expert-curated data, revealed that 221 genes are related with DMT2 pathophysiological mechanisms (Table S1 and Figure 1a). In addition, the identified variants of the genes implicated in DMT2 are depicted in a circular network (Figure 1b). The gene ontology (GO) enrichment analysis based on the biological process (BP) revealed that the DMT2-associated genes are implicated in cellular responses to peptide hormones, including insulin, as well as glucose homeostasis, transmembrane transport, and metabolic processes. The disease ontology (DOSE) enrichment analysis unveiled that the DMT2-related genes are implicated in diseases that usually co-exist in patients with DMT2, including glucose intolerance, obesity, kidney or pancreas diseases, fatty liver disease, and polycystic ovary syndrome.
Obesity is associated with an increased risk of developing insulin resistance and is considered as a significant inducer of DMT2 evolution. In individuals with obesity, the adipose tissue releases increased levels of non-esterified fatty acids (NEFAs), hormones, glycerol, and pro-inflammatory cytokines that are implicated in insulin resistance. Obesity-associated insulin resistance and abnormalities in pancreatic islet-β cell function result in abnormal blood glycose levels and DMT2 development [18]. In addition, insulin resistance in skeletal muscle is a dominant etiological factor of hyperlipidemia and excess fat accumulation in patients with DMT2 [19]. The prevalence of chronic kidney disease (CKD) is two-to-five times higher in people with DMT2 as compared with non-diabetic individuals, since hyperglycemia promotes pathological changes withing the kidney [20,21]. Patients with nonalcoholic fatty liver disease (NAFLD) have an increased risk of DMT2 development and vice versa; NAFLD and DMT2 have similar pathophysiological pathways and insulin resistance is the hallmark presented in both diseases [22]. The accumulation of toxic metabolites derived from triglycerides results in NAFLD-associated lipotoxicity. Such toxic metabolites accumulated in liver, pancreas, and muscles trigger inflammatory cascades and hepatic insulin resistance, which are pivotal inducers of DMT2 development [23]. Non-alcoholic fatty pancreas disease (NAFPD) is also associated with obesity, metabolic syndrome (MetS), atherosclerosis, and DMT2, verifying the existence of molecular pathways that are common between the diseases [24]. Impaired glycose homeostasis is also observed in patients with polycystic ovary syndrome (PCOS). This endocrine disorder usually coexists with prediabetes, which usually gradually develops into DMT2 over time. Insulin resistance and pancreatic β-cell dysfunction, which are the main pathophysiological factors for DMT2 development, are also concomitant in women with PCOS [25].
Furthermore, the DMT2-related genes are significantly enriched in pathways related to the regulation of gene expression in pancreatic β-cells, insulin secretion, metabolic hormones regulation, and interleukin signaling. These pathways form six different, larger pathway clusters, i.e., as depicted on Figure 2d, mainly referring to: (a) Oxidative stress; (b) Interleukin-signaling inflammasomes and adipocyte differentiation; (c) Energy and hormone metabolism; (d) Leptin and insulin signaling; (e) β-pancreatic cell development and gene regulation; and (f) Cellular hexose transport. The abnormal function of the genes implicated in these pathway clusters is the driving etiological factor towards DMT2 development. Oxidative stress and chronic inflammation participate in the development of DMT2. Inflammatory mediators, including the interleukins 1-beta and 6 and tumor necrosis factor-alpha, in combination with hyperglycemia, induce the generation of reactive oxygen species implicated in DMT2 pathogenesis [26]. Abnormalities in signaling pathways involved in energy and hormone metabolism, leptin and insulin signaling, and cellular glucose transport strongly determine the molecular signature associated with DMT2 development and progression [27].

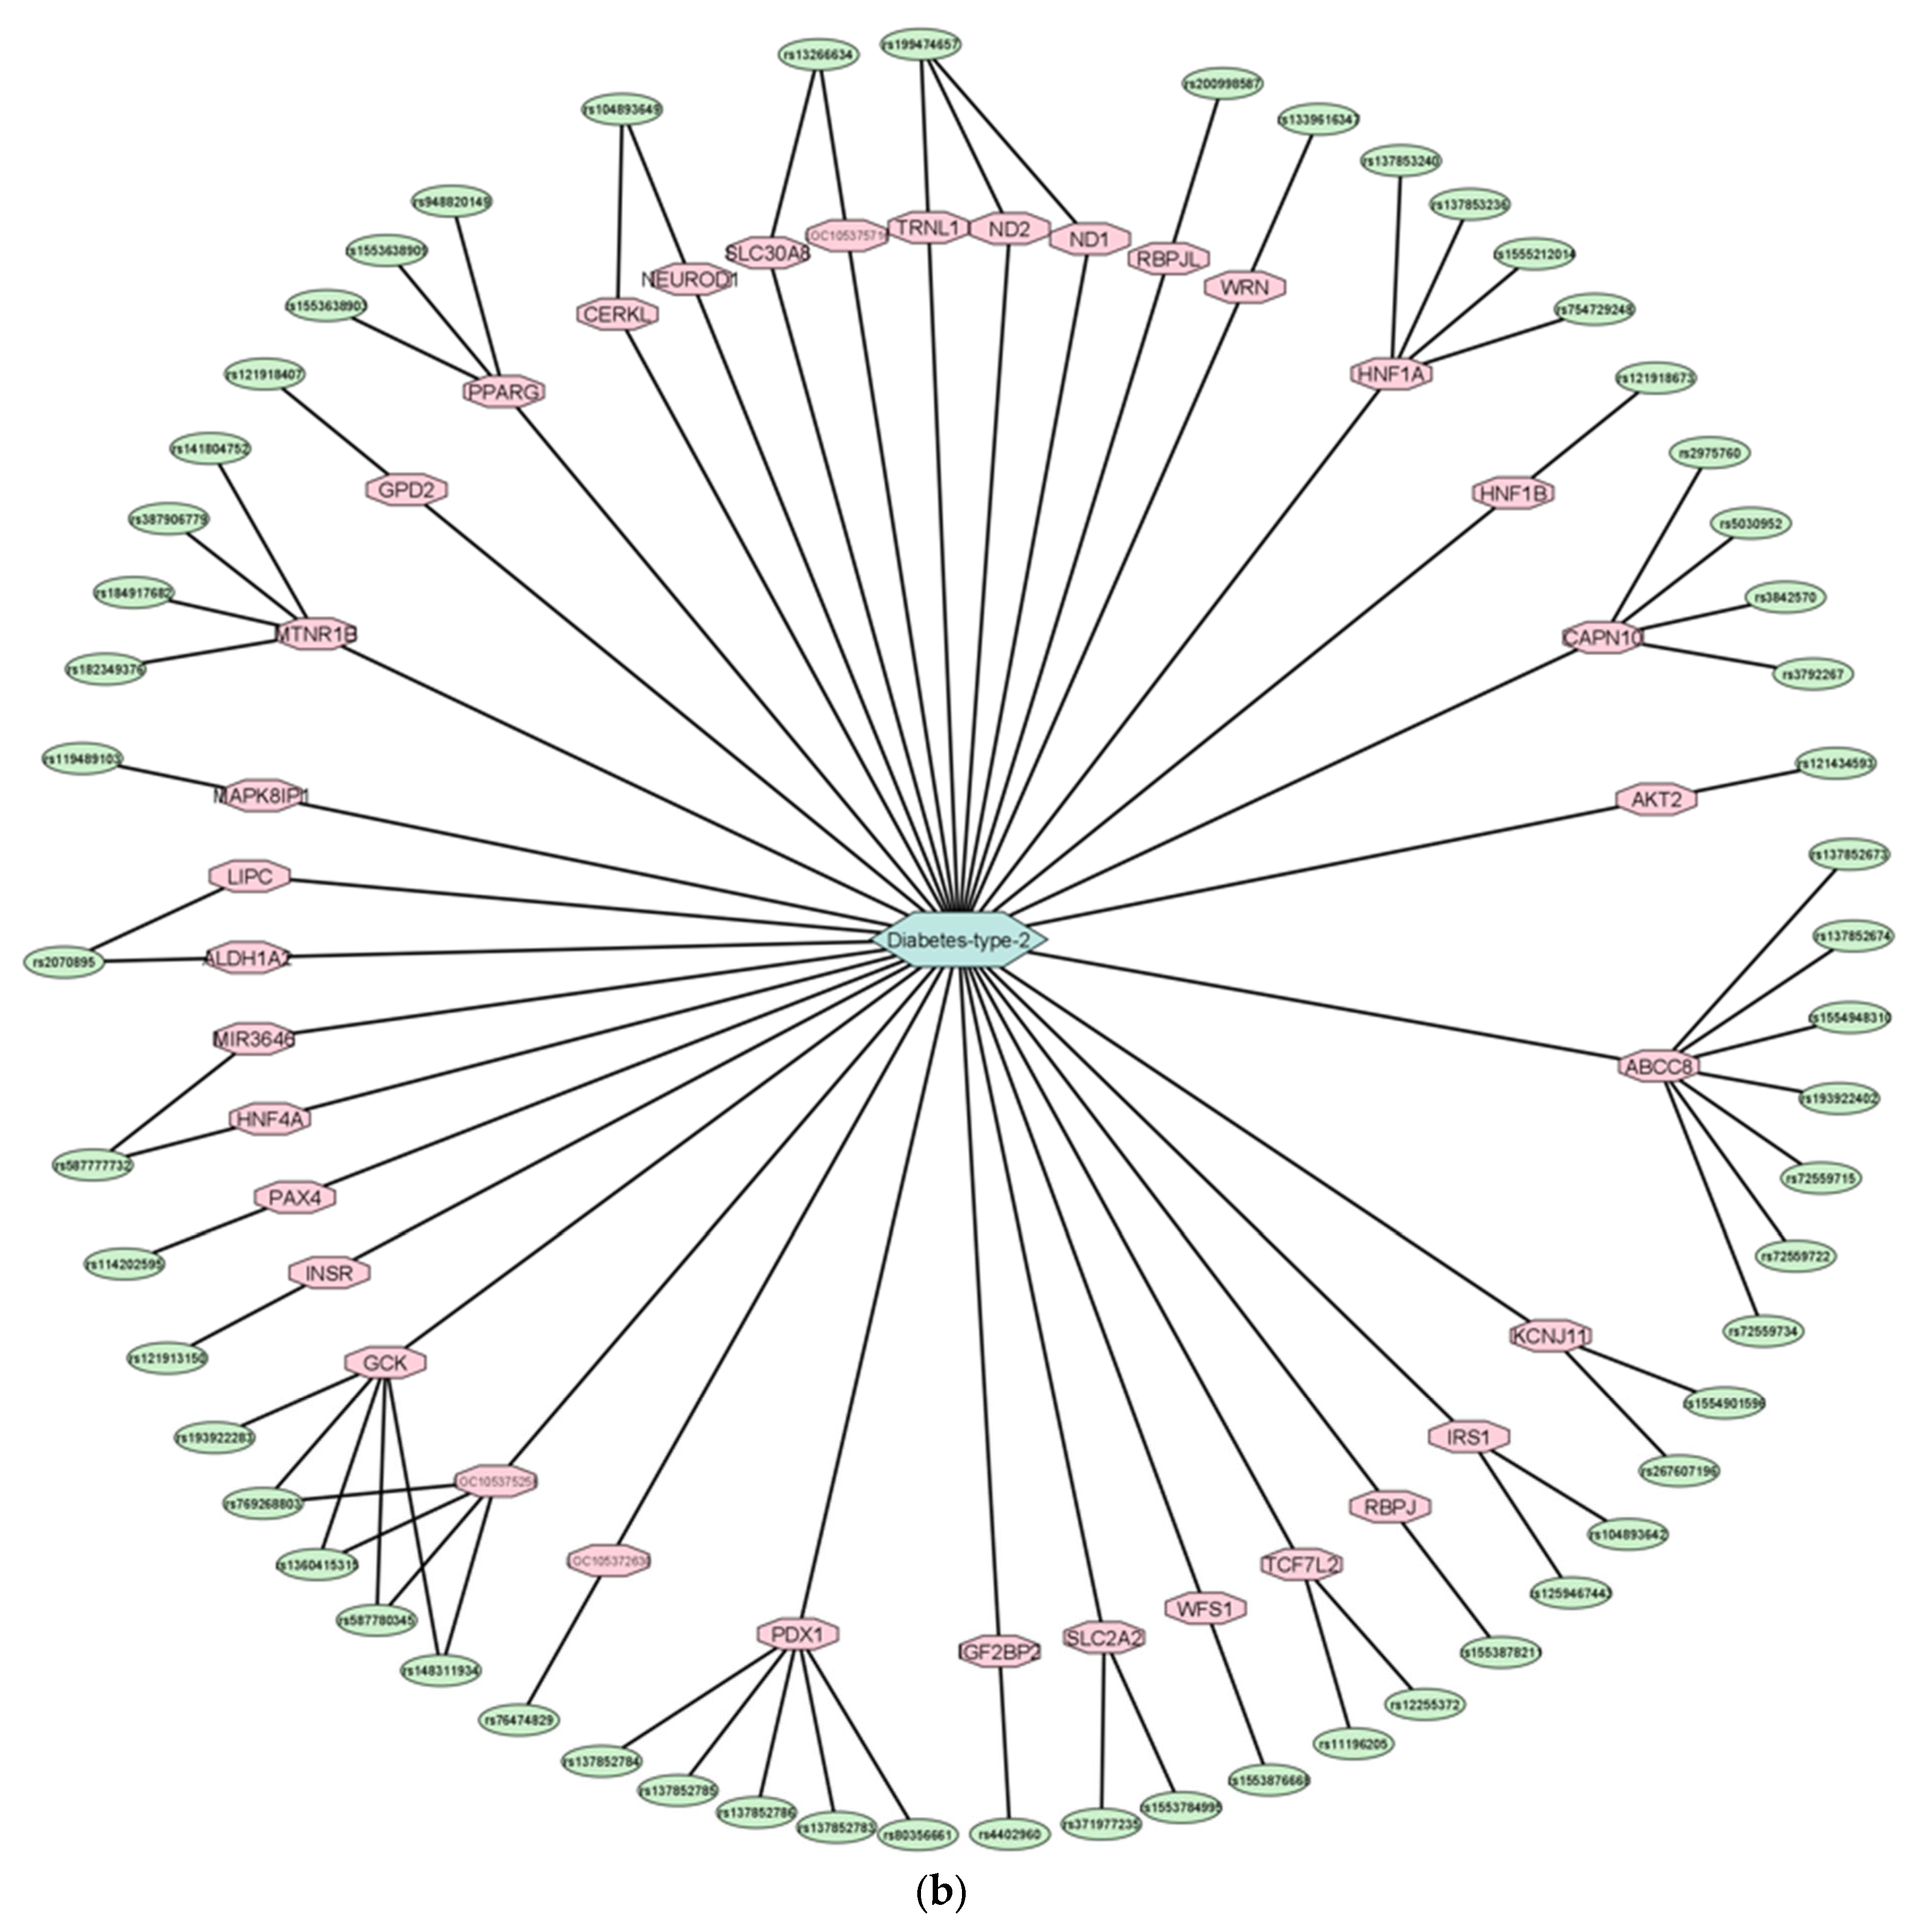
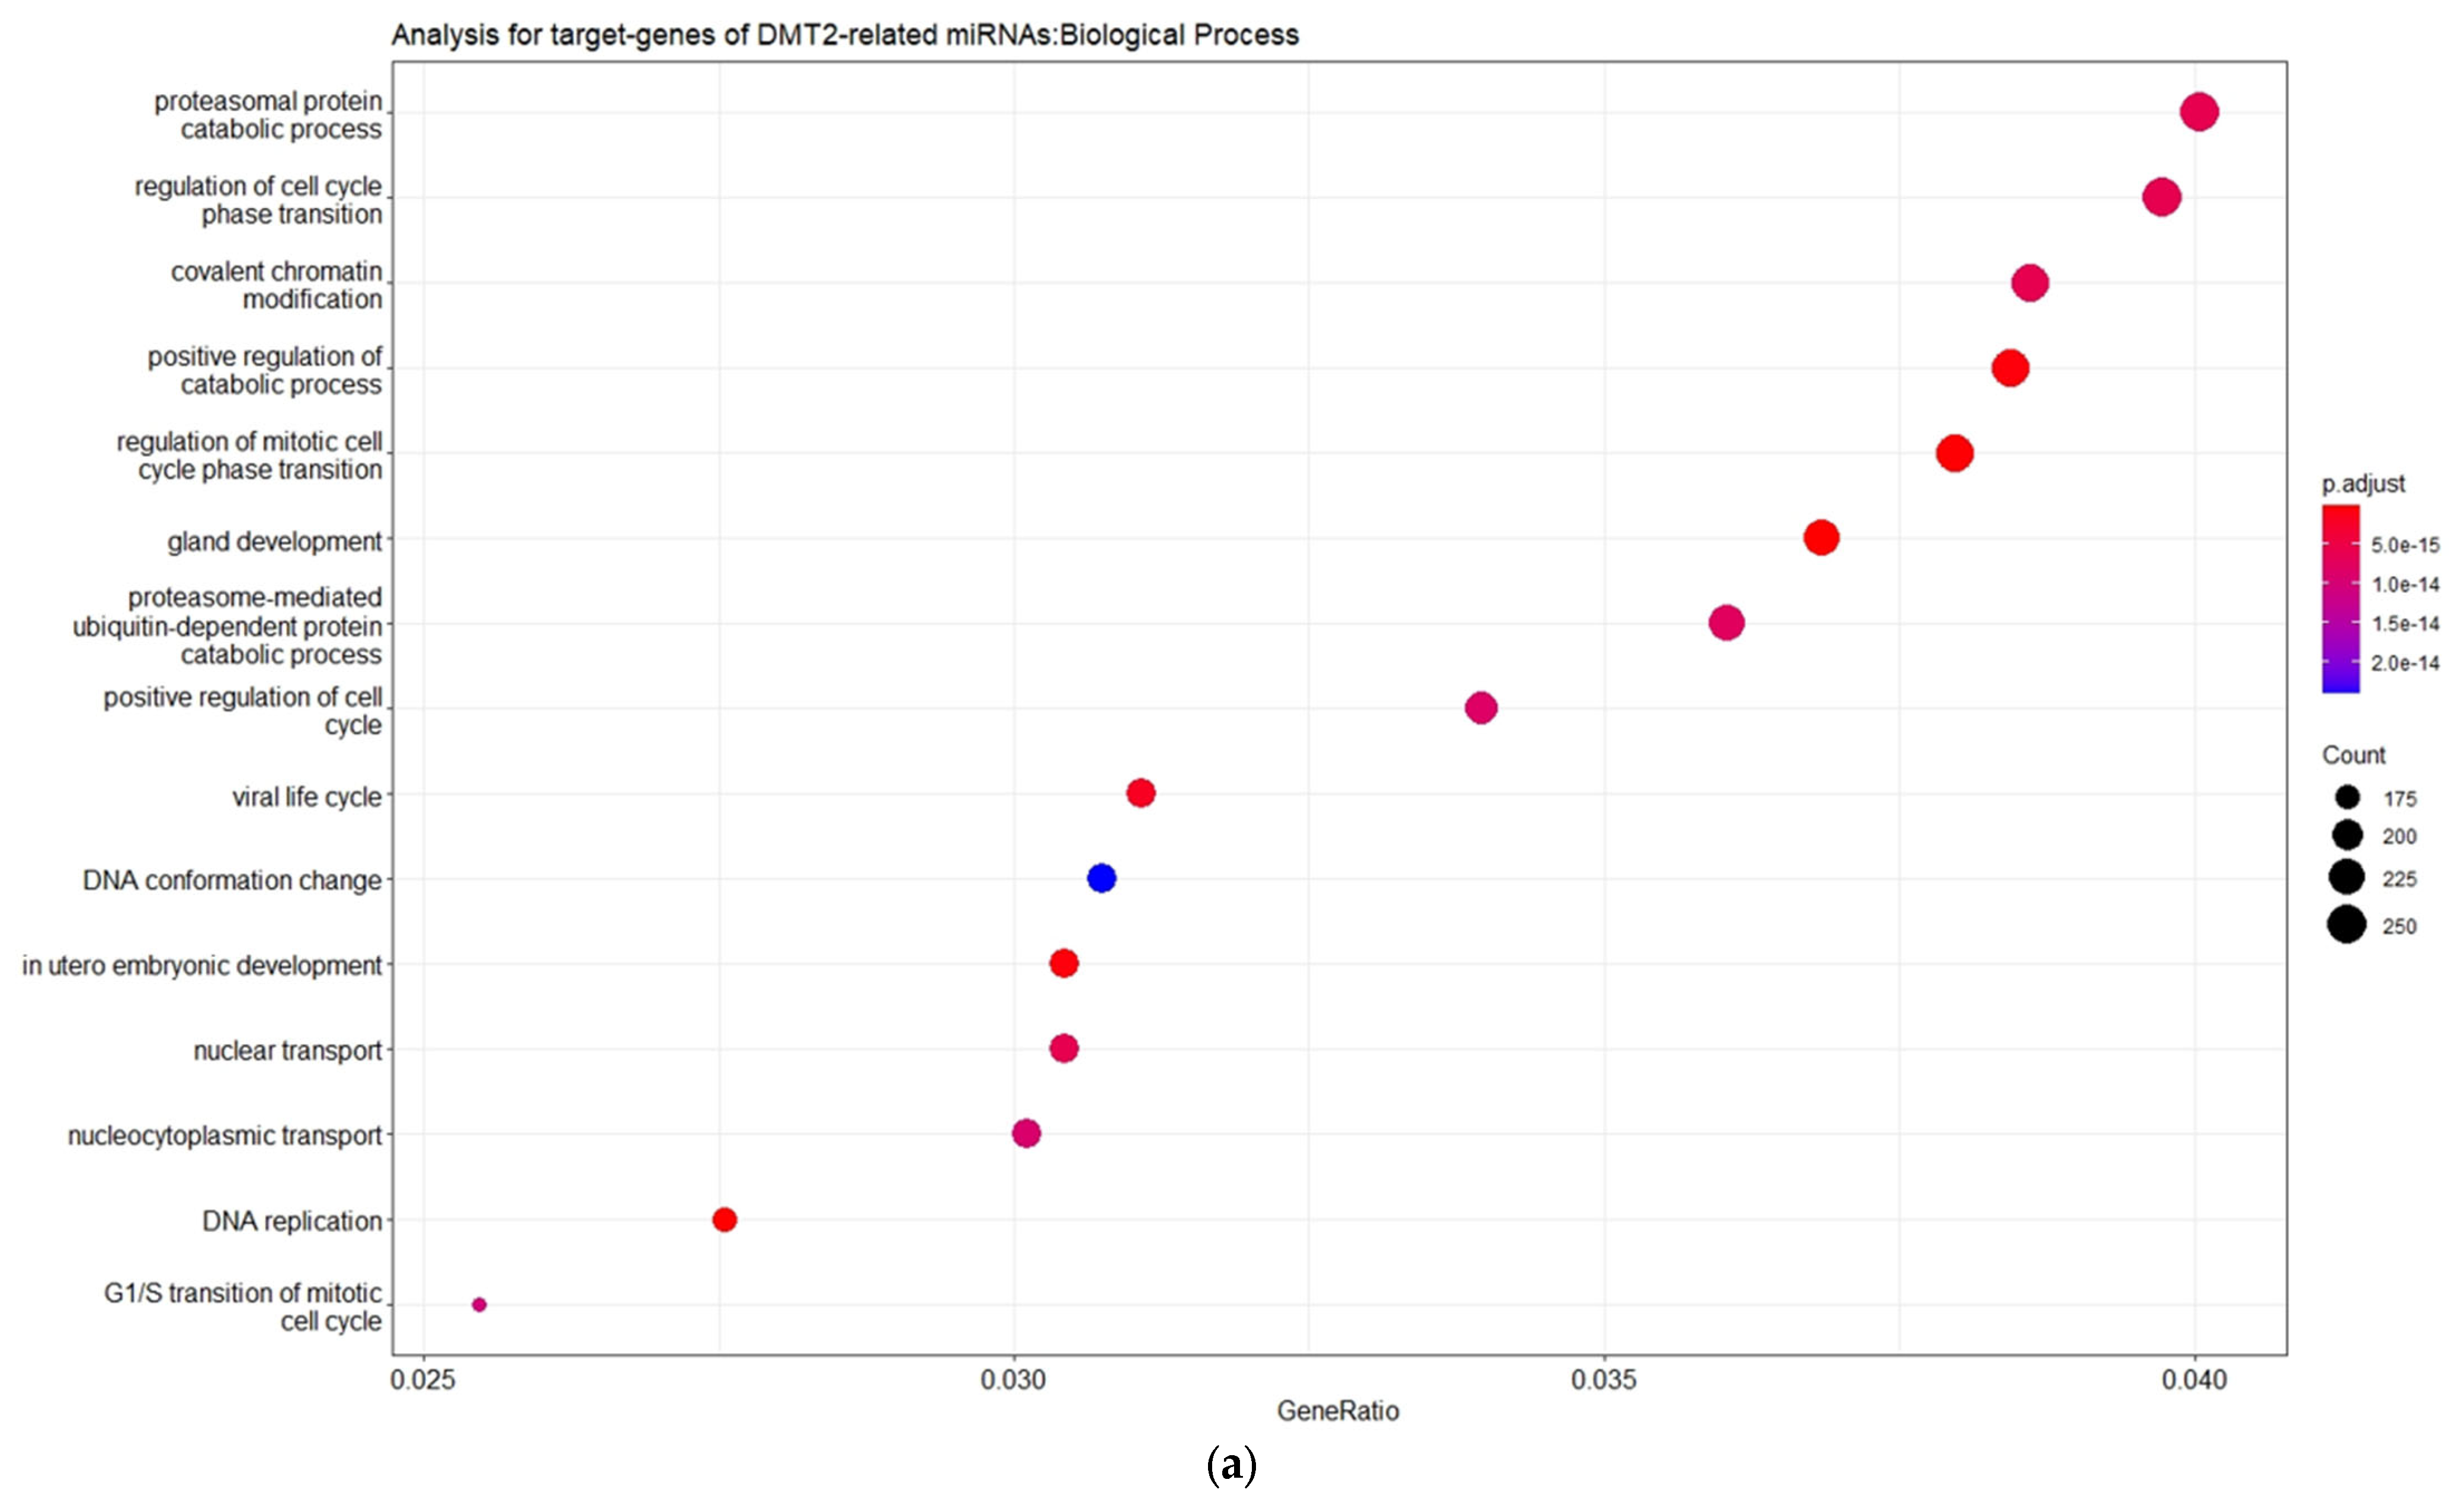
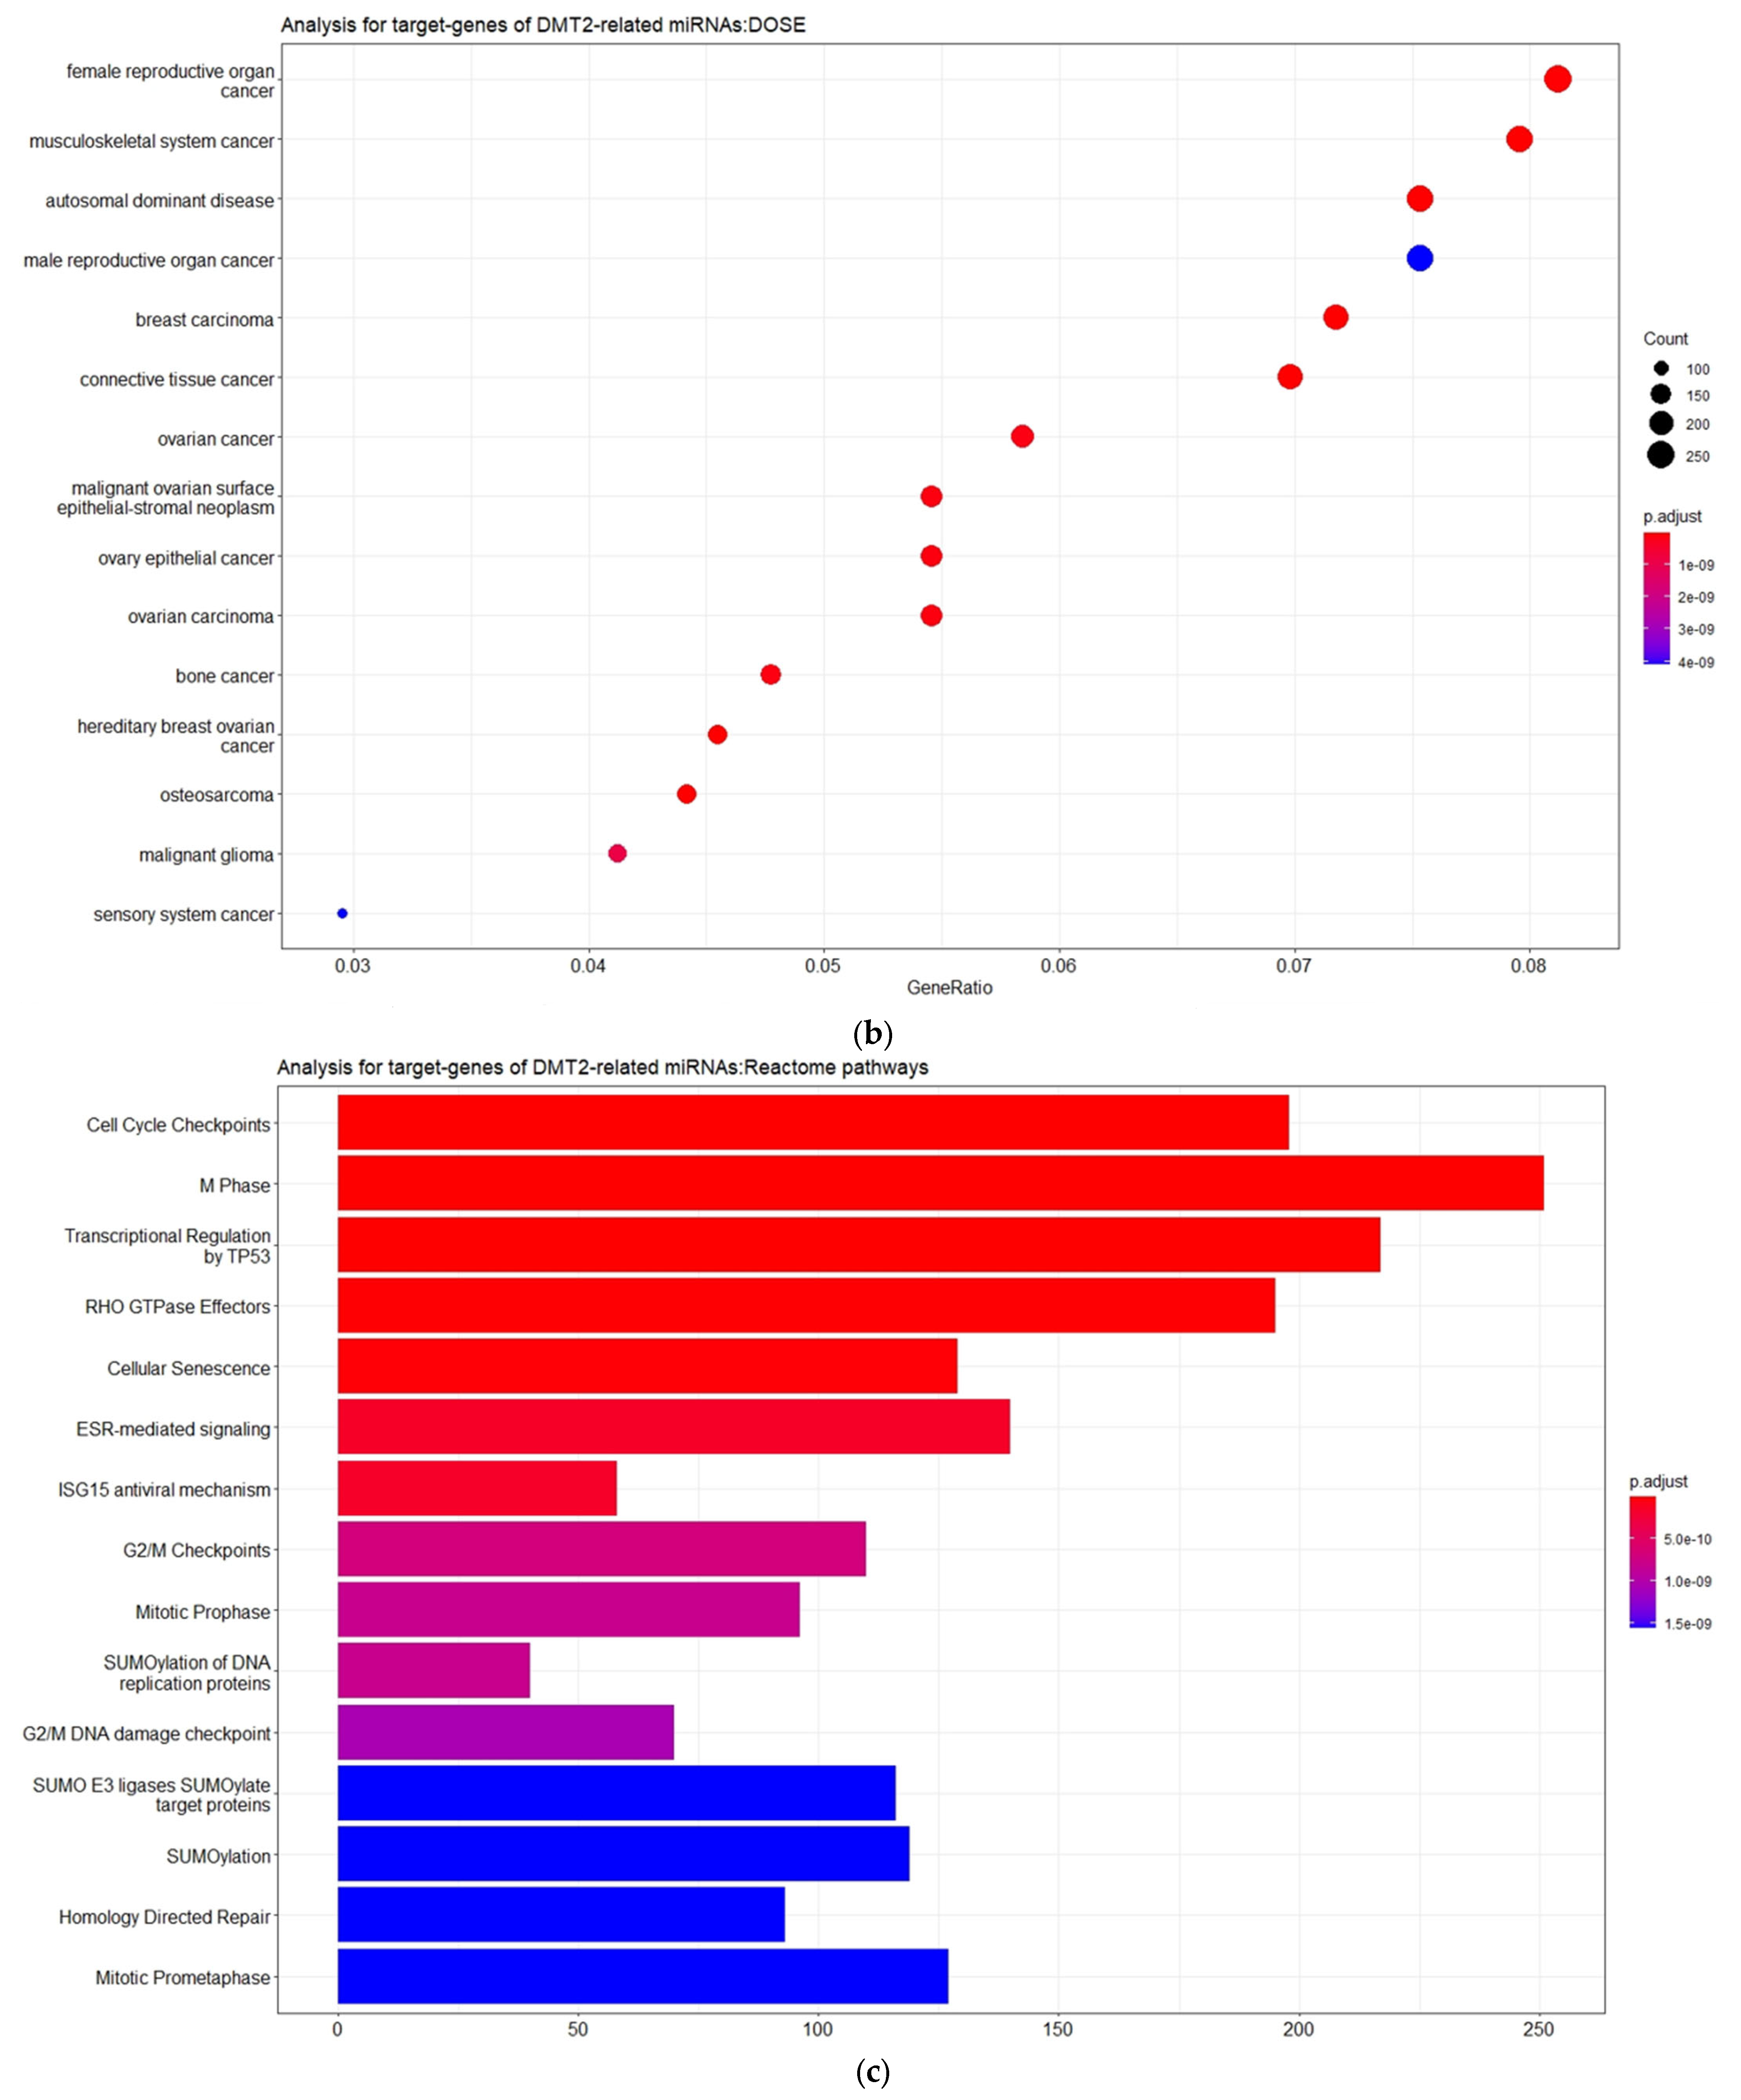
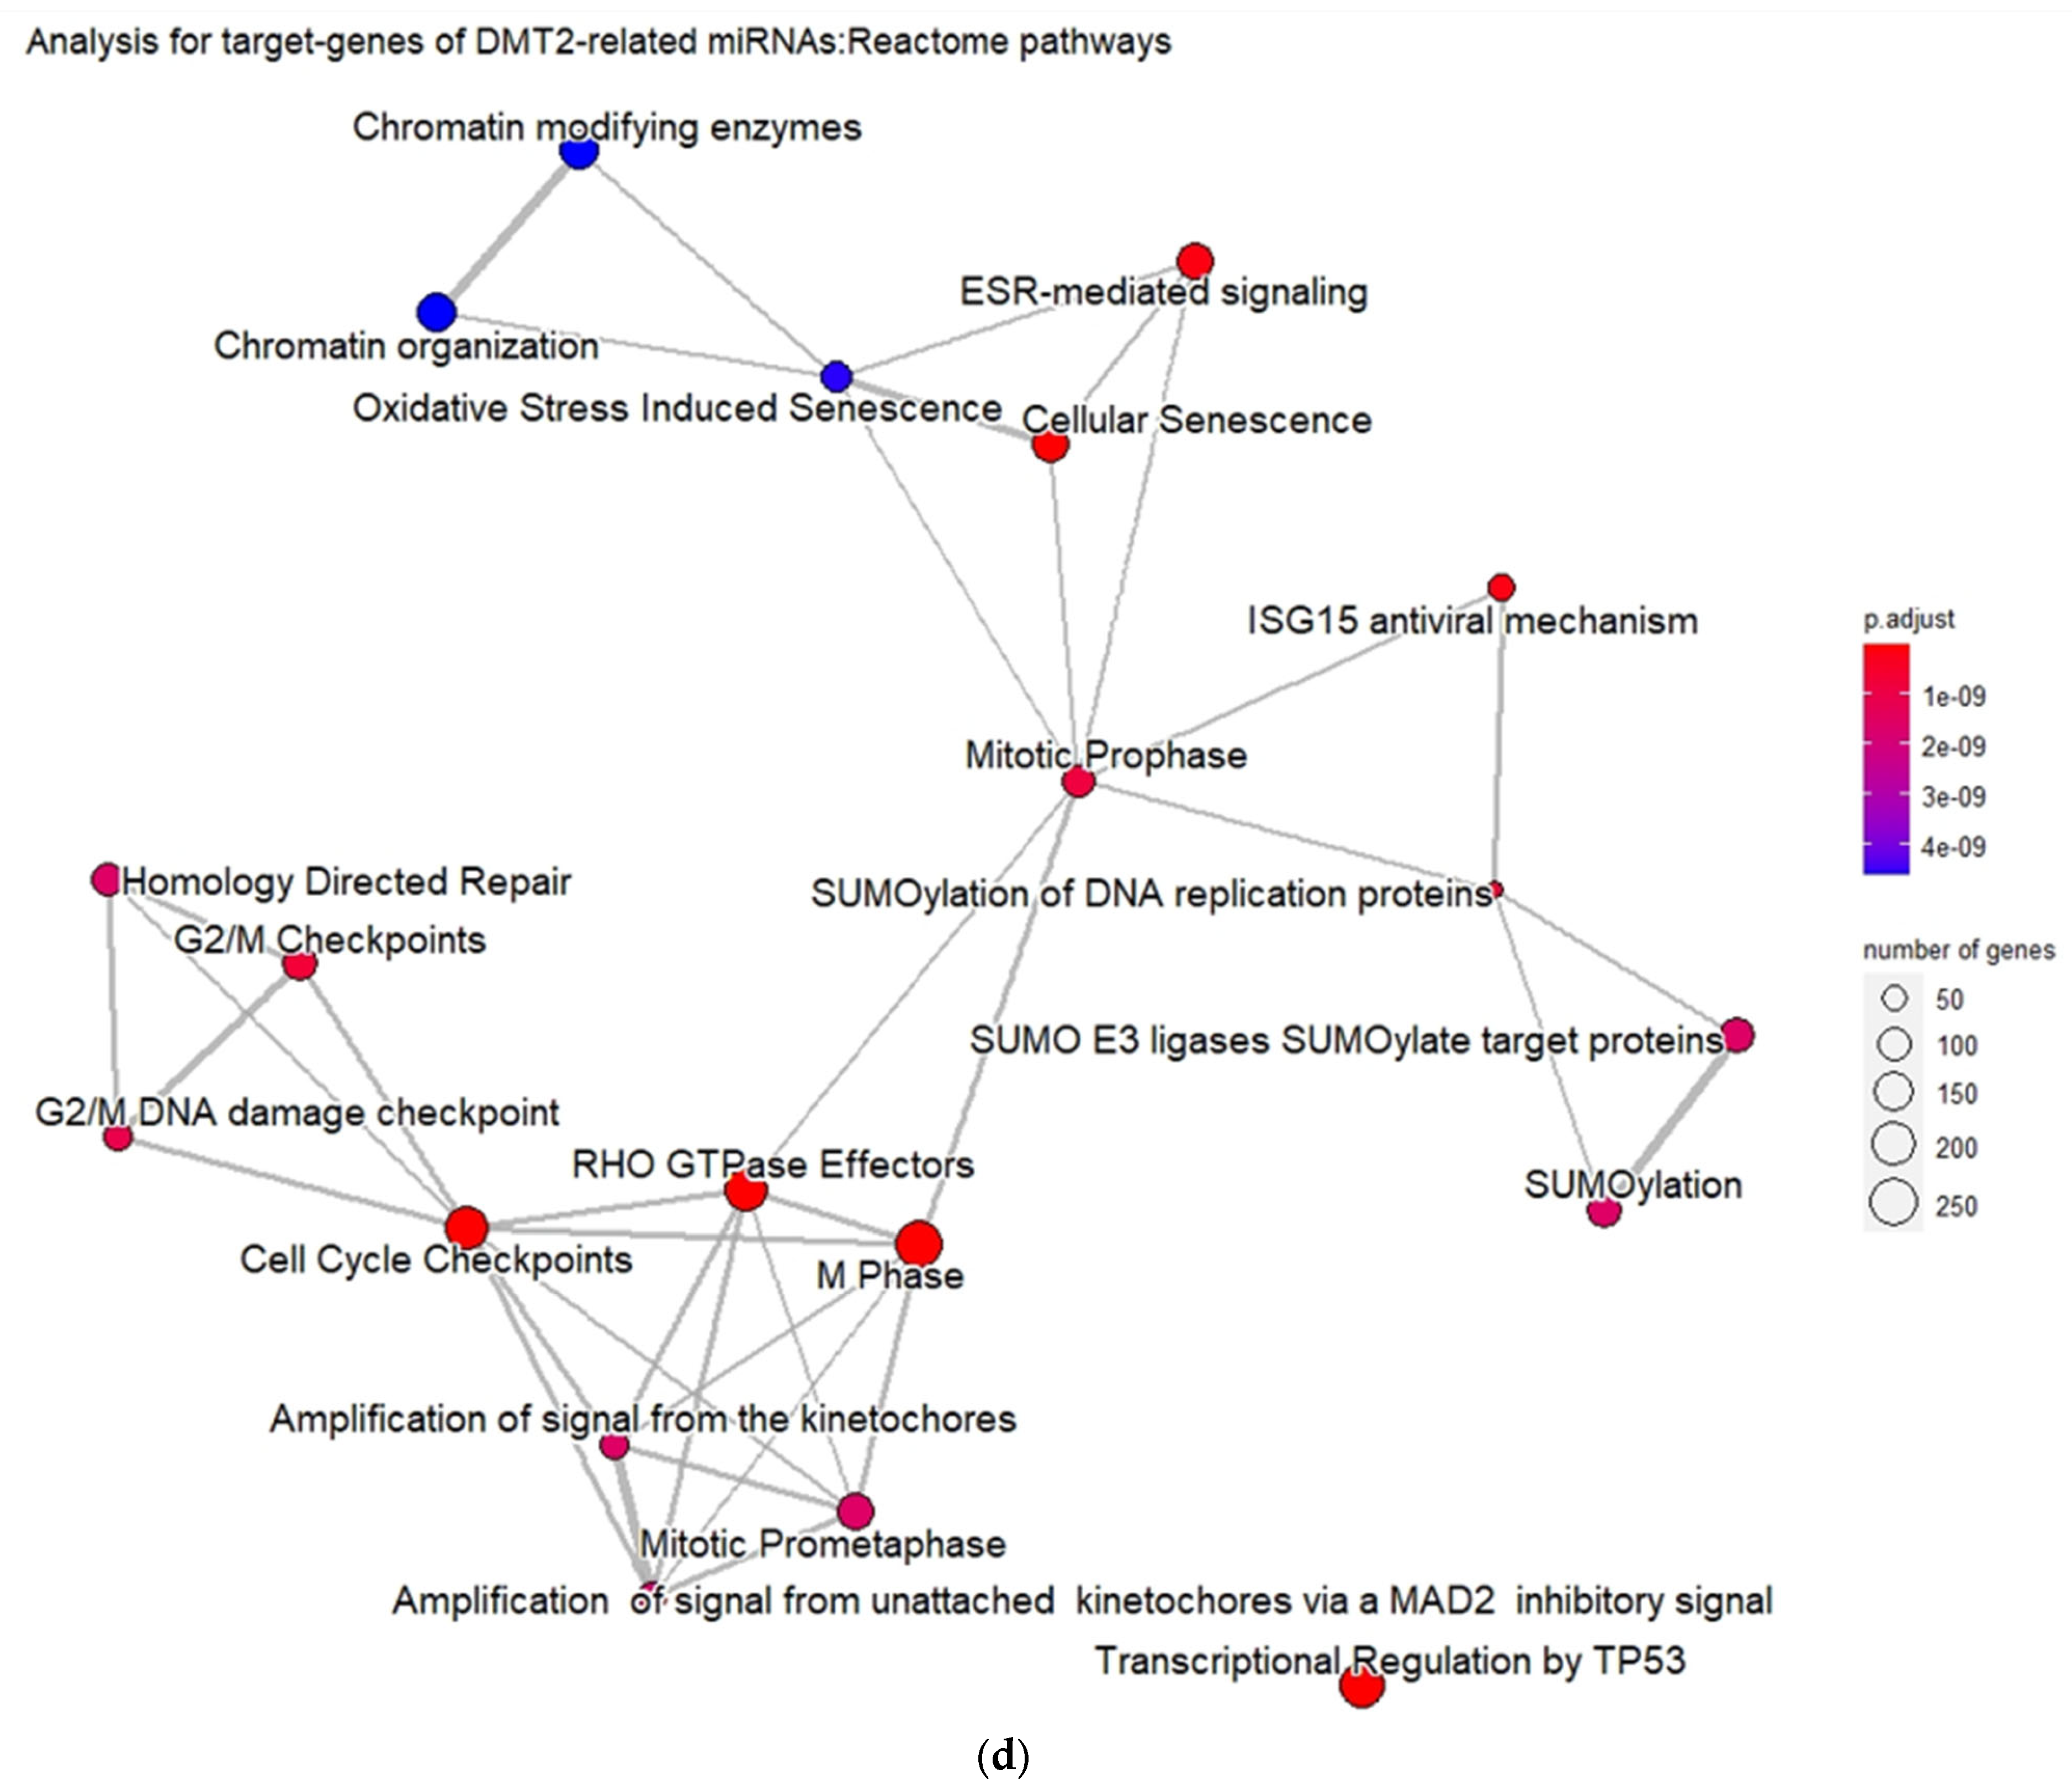
3.2. Experimentally Validated Target Genes of DMT2-Related miRNAs

The search of the HMDD database revealed 232 total miRNA entries that are related to DMT2. After excluding duplicates, we identified 128 unique miRNAs to be associated with DMT2. Amongst them, 16 miRNAs are already shown to be associated with their target genes, according to the multiMiR package. Subsequently, the miRNA-target gene interactions, which are not supported by experimental validation, were excluded. After applying this filtering, 15 miRNAs interacting with 6697 different target genes, according to available experimental validation data, were used for downstream analysis (see Table S2). The gene ontology enrichment analysis based on the biological process (BP) revealed that the miRNA-target genes are involved mainly in catabolic processes mediated by proteasome, and in processes related to cell cycle phase transition and nuclear transport (Figure 3).
Moreover, as also shown in Figure 3, the disease ontology (DOSE) enrichment analysis unveiled that the miRNA-target genes are implicated in different types of cancers, including tumors of the female reproductive system and the musculoskeletal system, breast cancer, and ovarian cancer. Although the association between DMT2 and cancer has been extensively reported and discussed over the last decades, the mechanisms underlying this relationship remain unclear [28]. However, some epidemiological studies have revealed that DMT2 shares risk factors and characteristics with gynecologic breast, ovarian, and endometrial cancer, suggesting that lifestyle- and health-associated problems (e.g., obesity) are key factors for both illnesses [29,30,31]. The hormonal changes of women with diabetes have been strongly associated with increased breast and ovarian cancer risk [32,33]. Indeed, the increased bioavailability of estrogen triggered the proliferation of ER-positive and/or estrogen-dependent breast tumor cells, while the activity of insulin and IGFs (insulin-like growth factors) has been also implicated in the positive proliferation and invasiveness of breast and ovarian cancer cells [34,35,36]. In addition, DMT2 can affect the musculoskeletal system, leading to connective tissue alterations via metabolic changes such as protein glycosylation, blood vessel destruction, and nerve destruction, as well as collagen accumulation in skin and periarticular structures. However, a direct association of DMT2 and cancer in the musculoskeletal system has not been reported yet [37].
Furthermore, the validated target genes (VTGs) of DMT2-related miRNAs are significantly enriched in pathways related with cell cycle regulation, transcription regulation by TP53 protein, and the SUMOylation processes that affect gene expression. Indeed, it was previously shown that deregulation of the post-translational modification process executed by the SUMOylation pathway affects insulin secretion in β-pancreatic cells [38]. In addition, accumulated evidence during the last years proposes an important role of p53-signaling pathways in metabolic abnormalities (e.g., oxidative phosphorylation, glycolysis, lipolysis, lipogenesis, β-oxidation, gluconeogenesis, and glycogen synthesis) that result in the imbalance of insulin action [39]. Moreover, insulin signaling has shown to regulate the FoxM1/PLK1/CENP-A pathway and, thus, promote the proliferation of β-pancreatic cells [40].

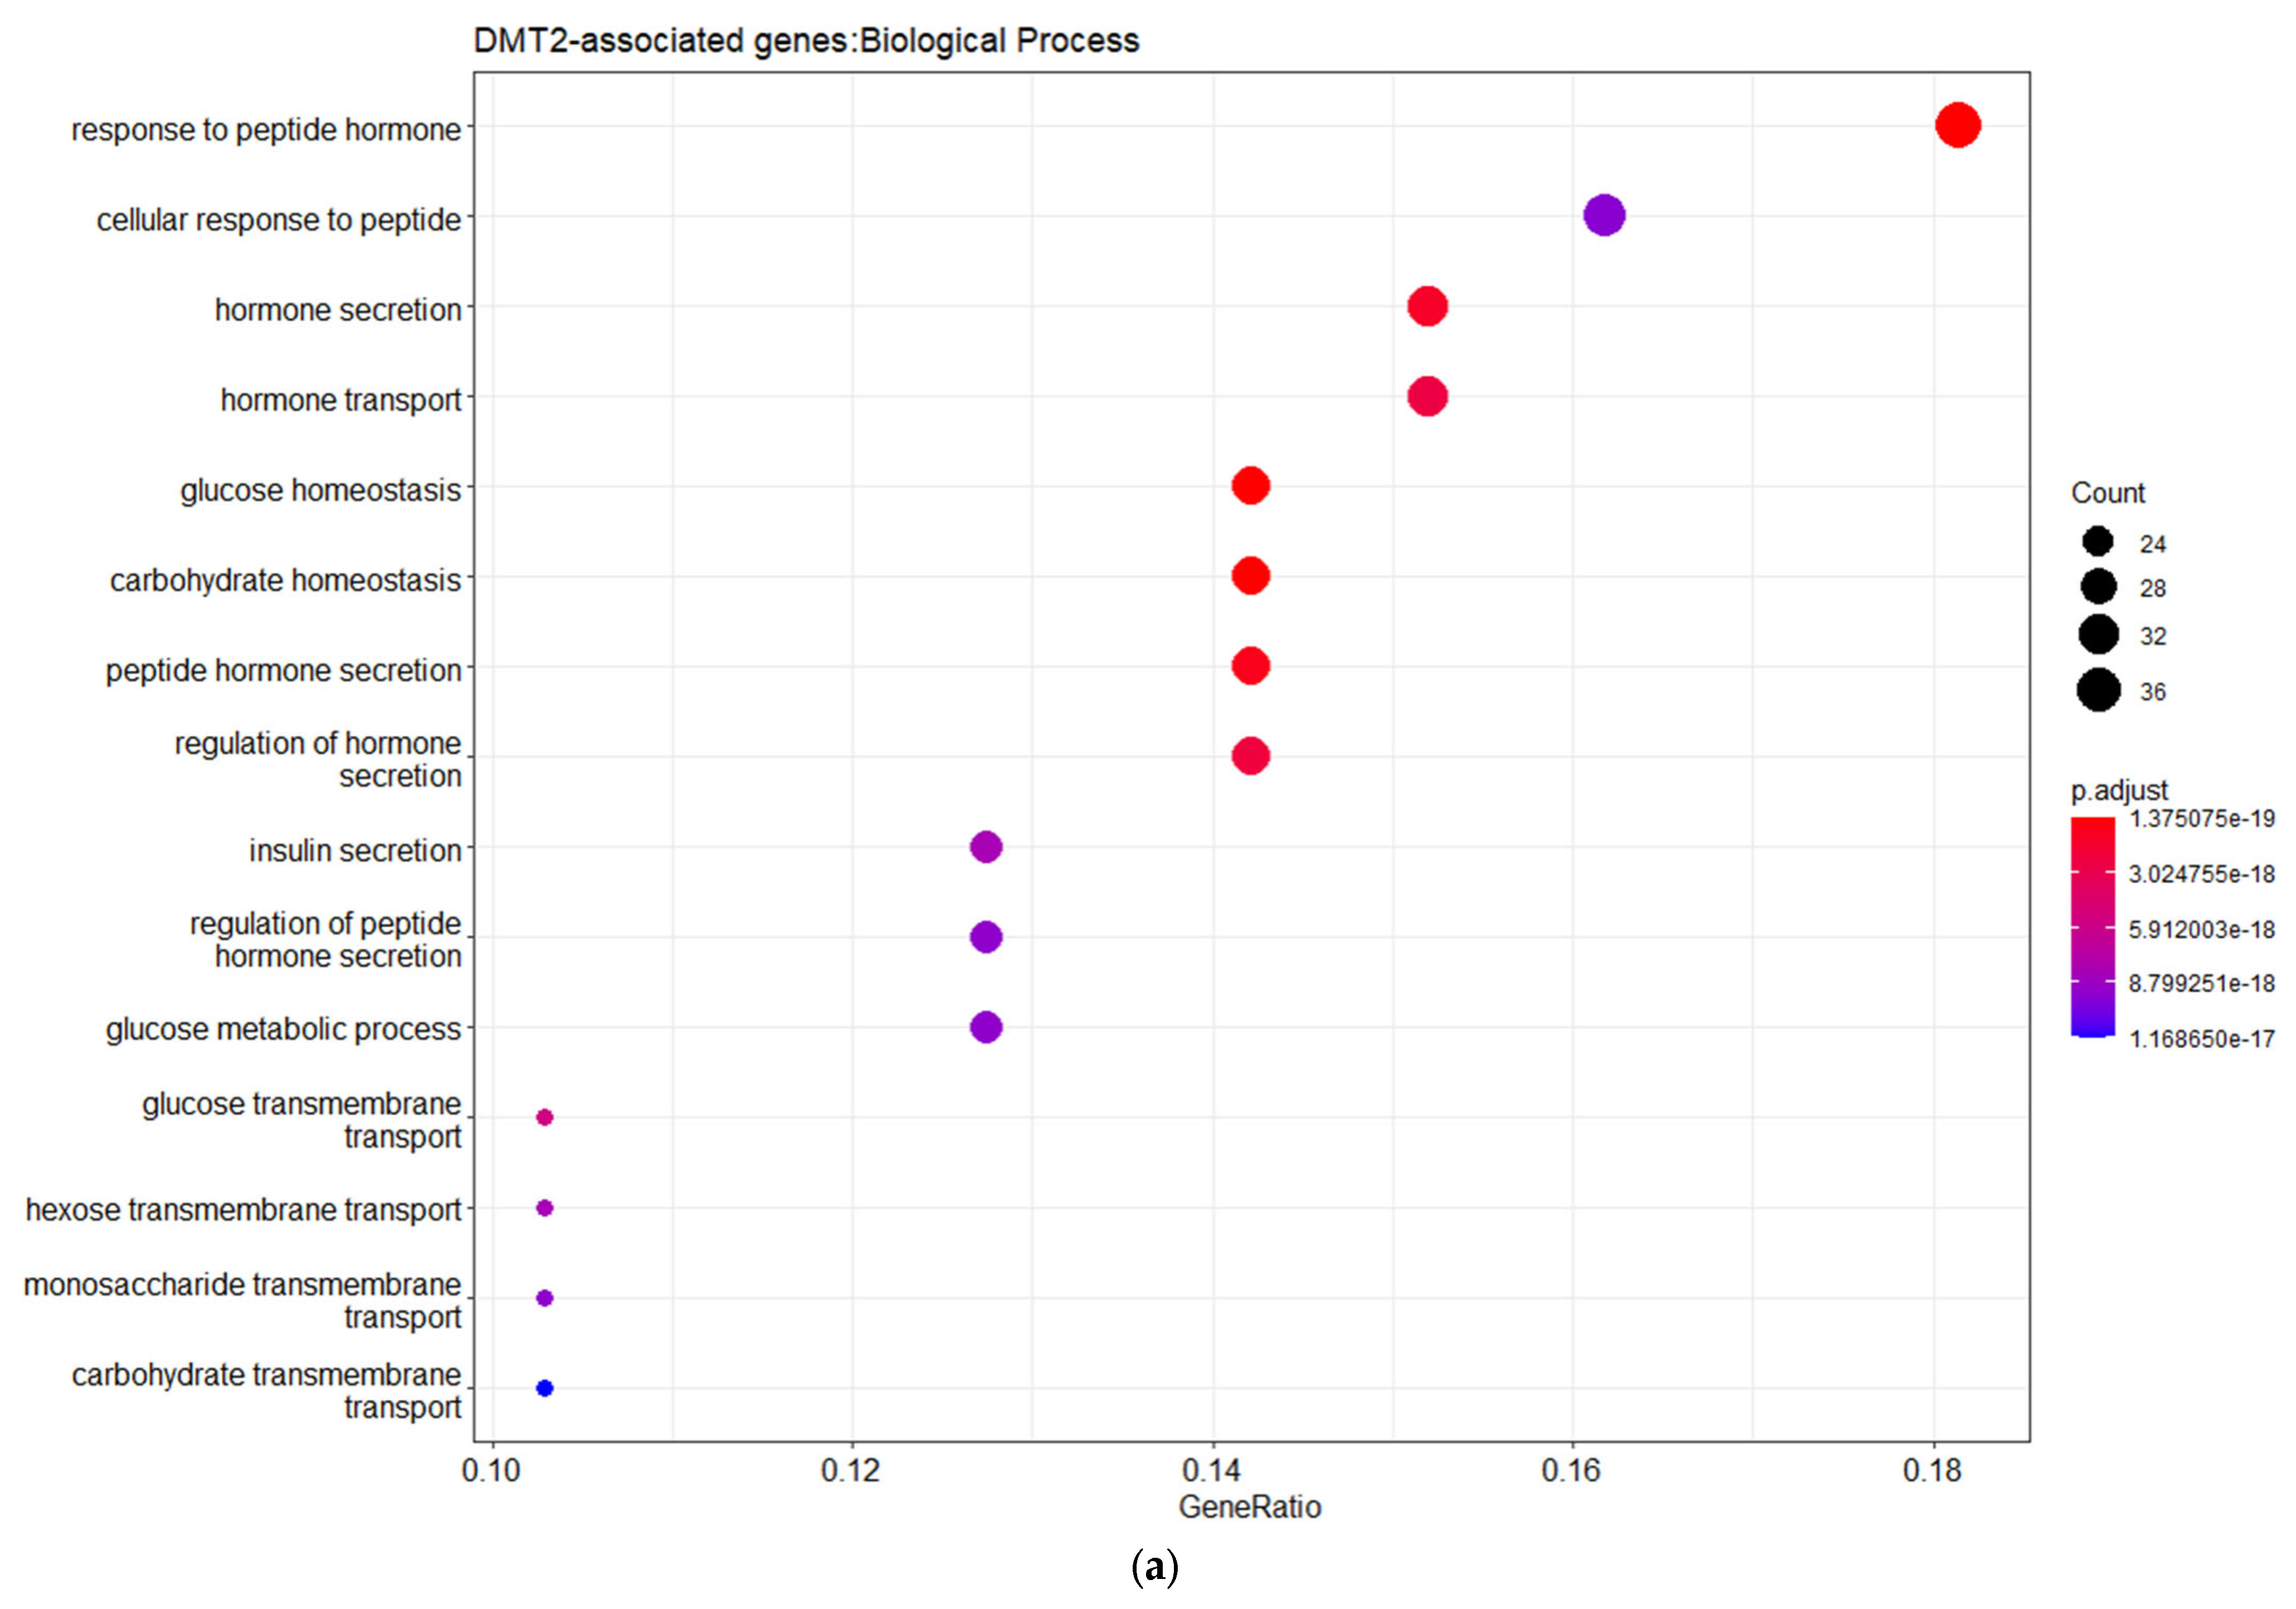
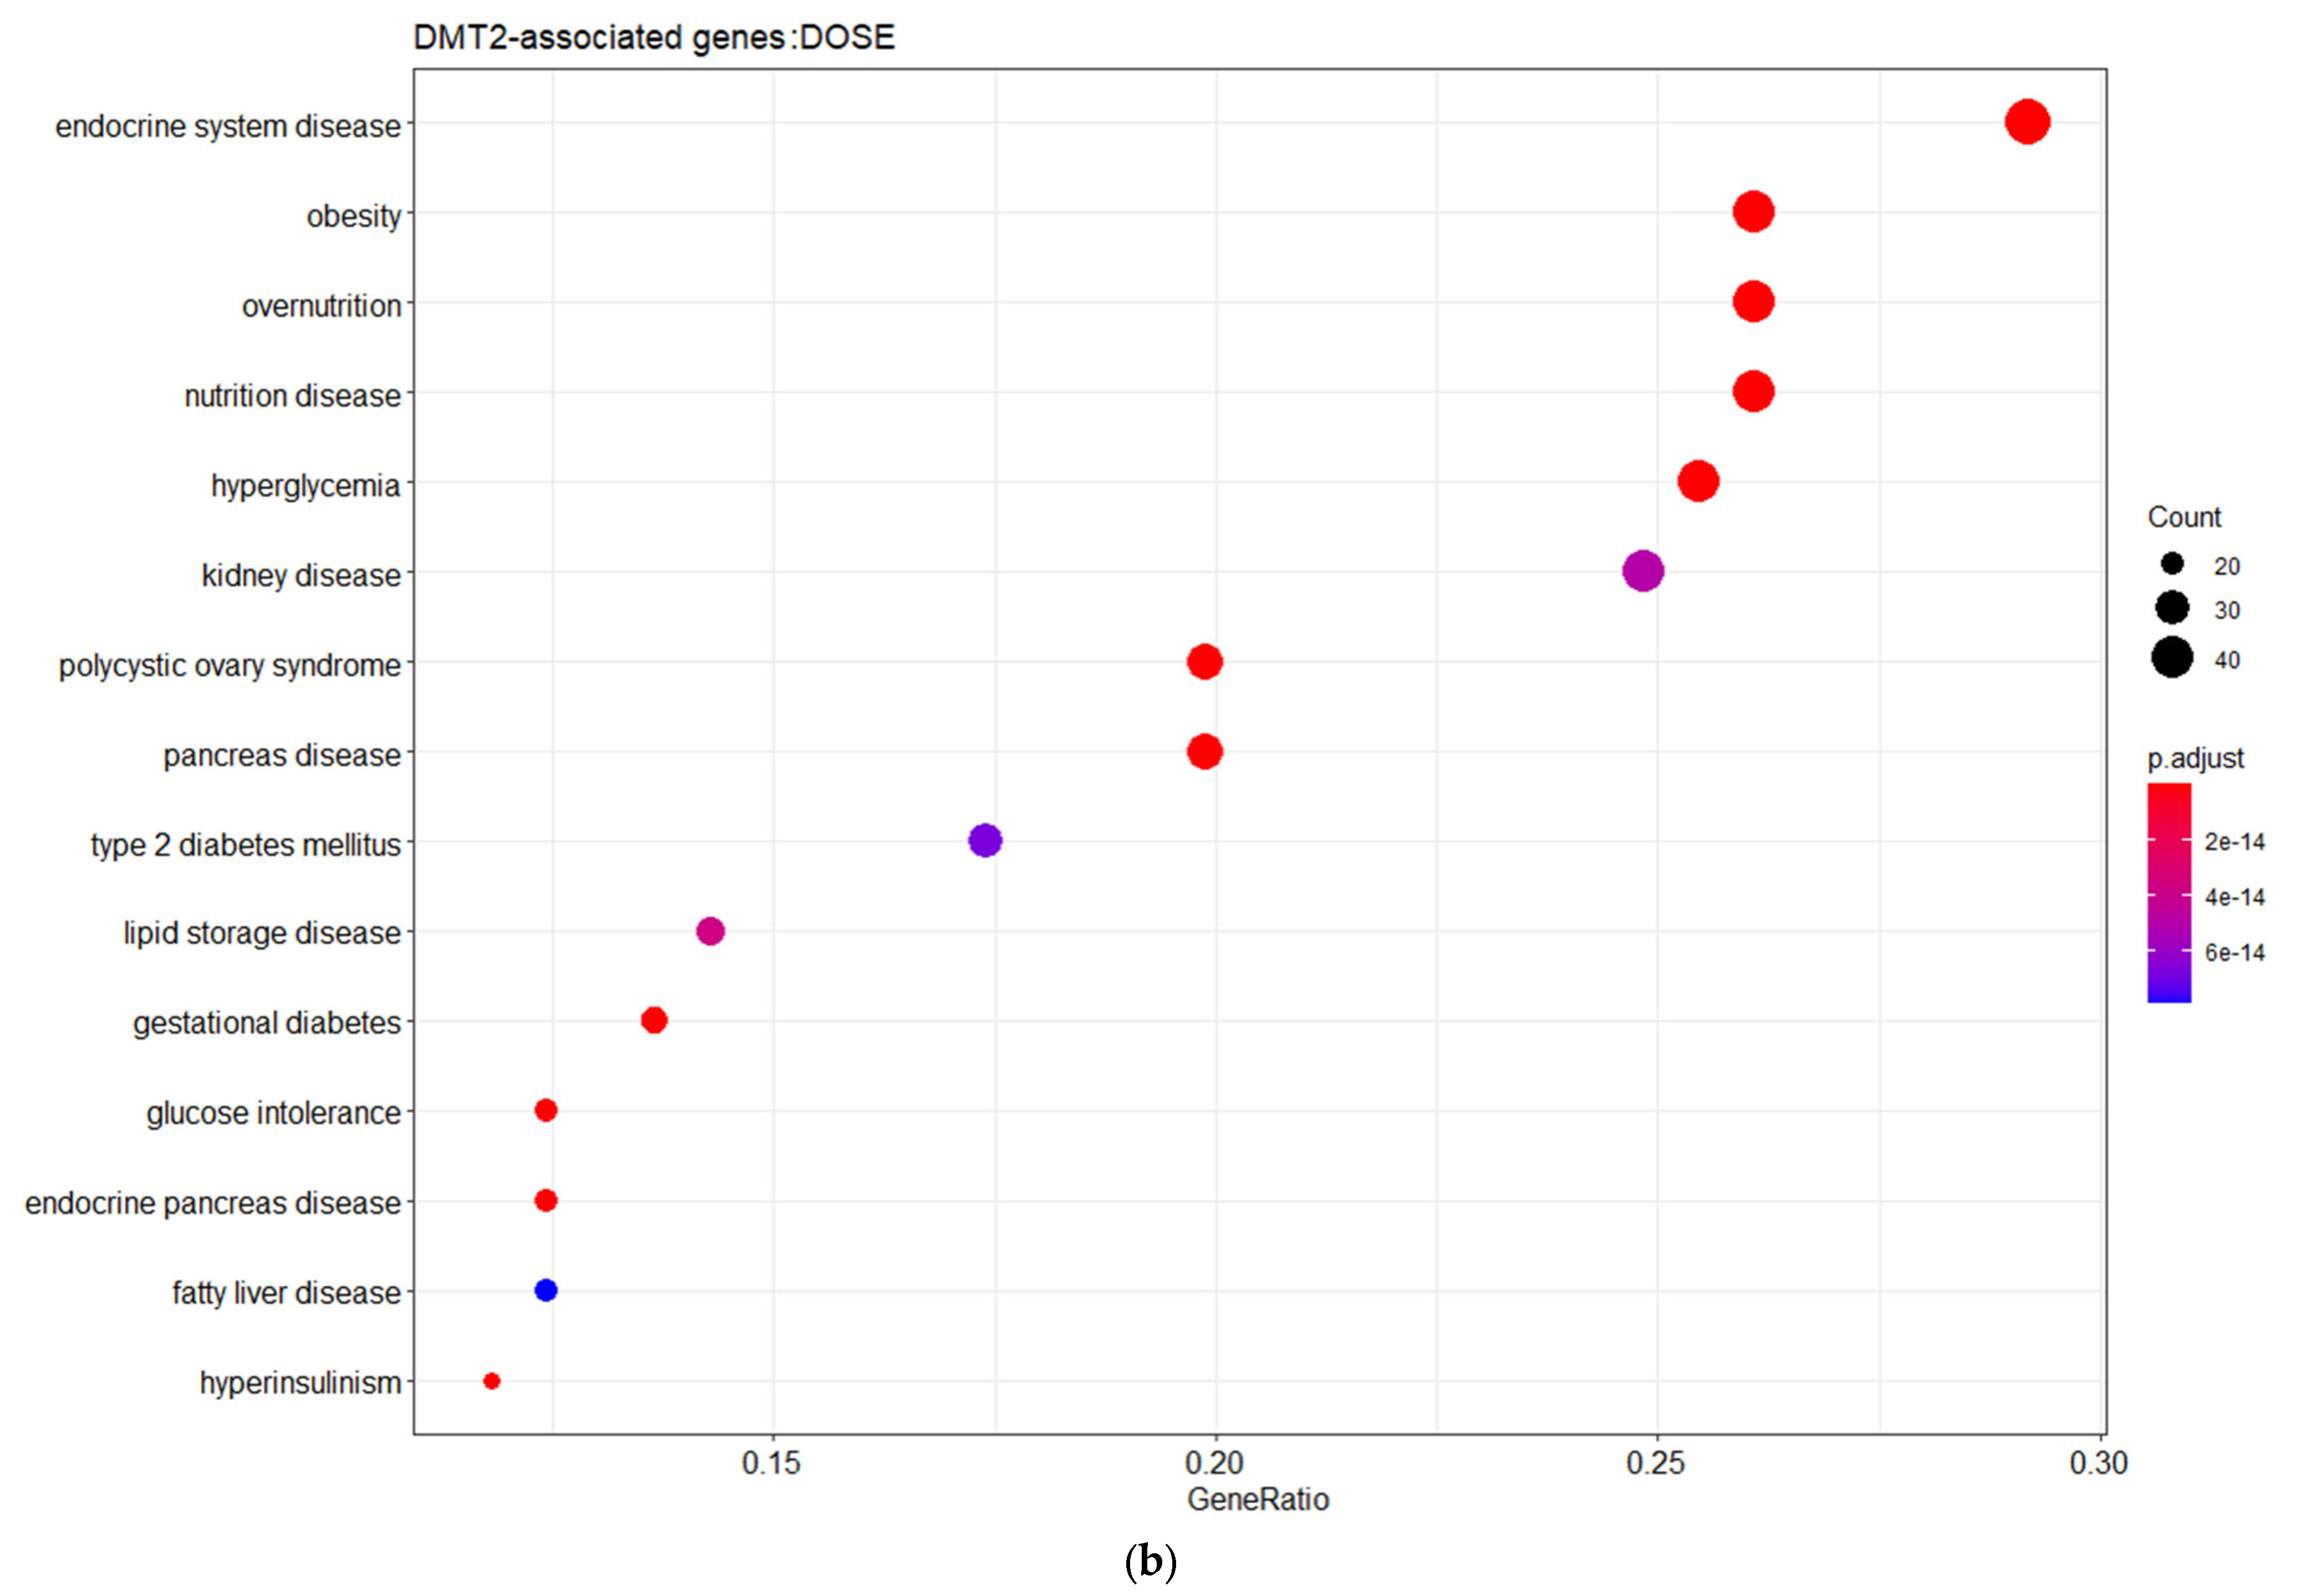
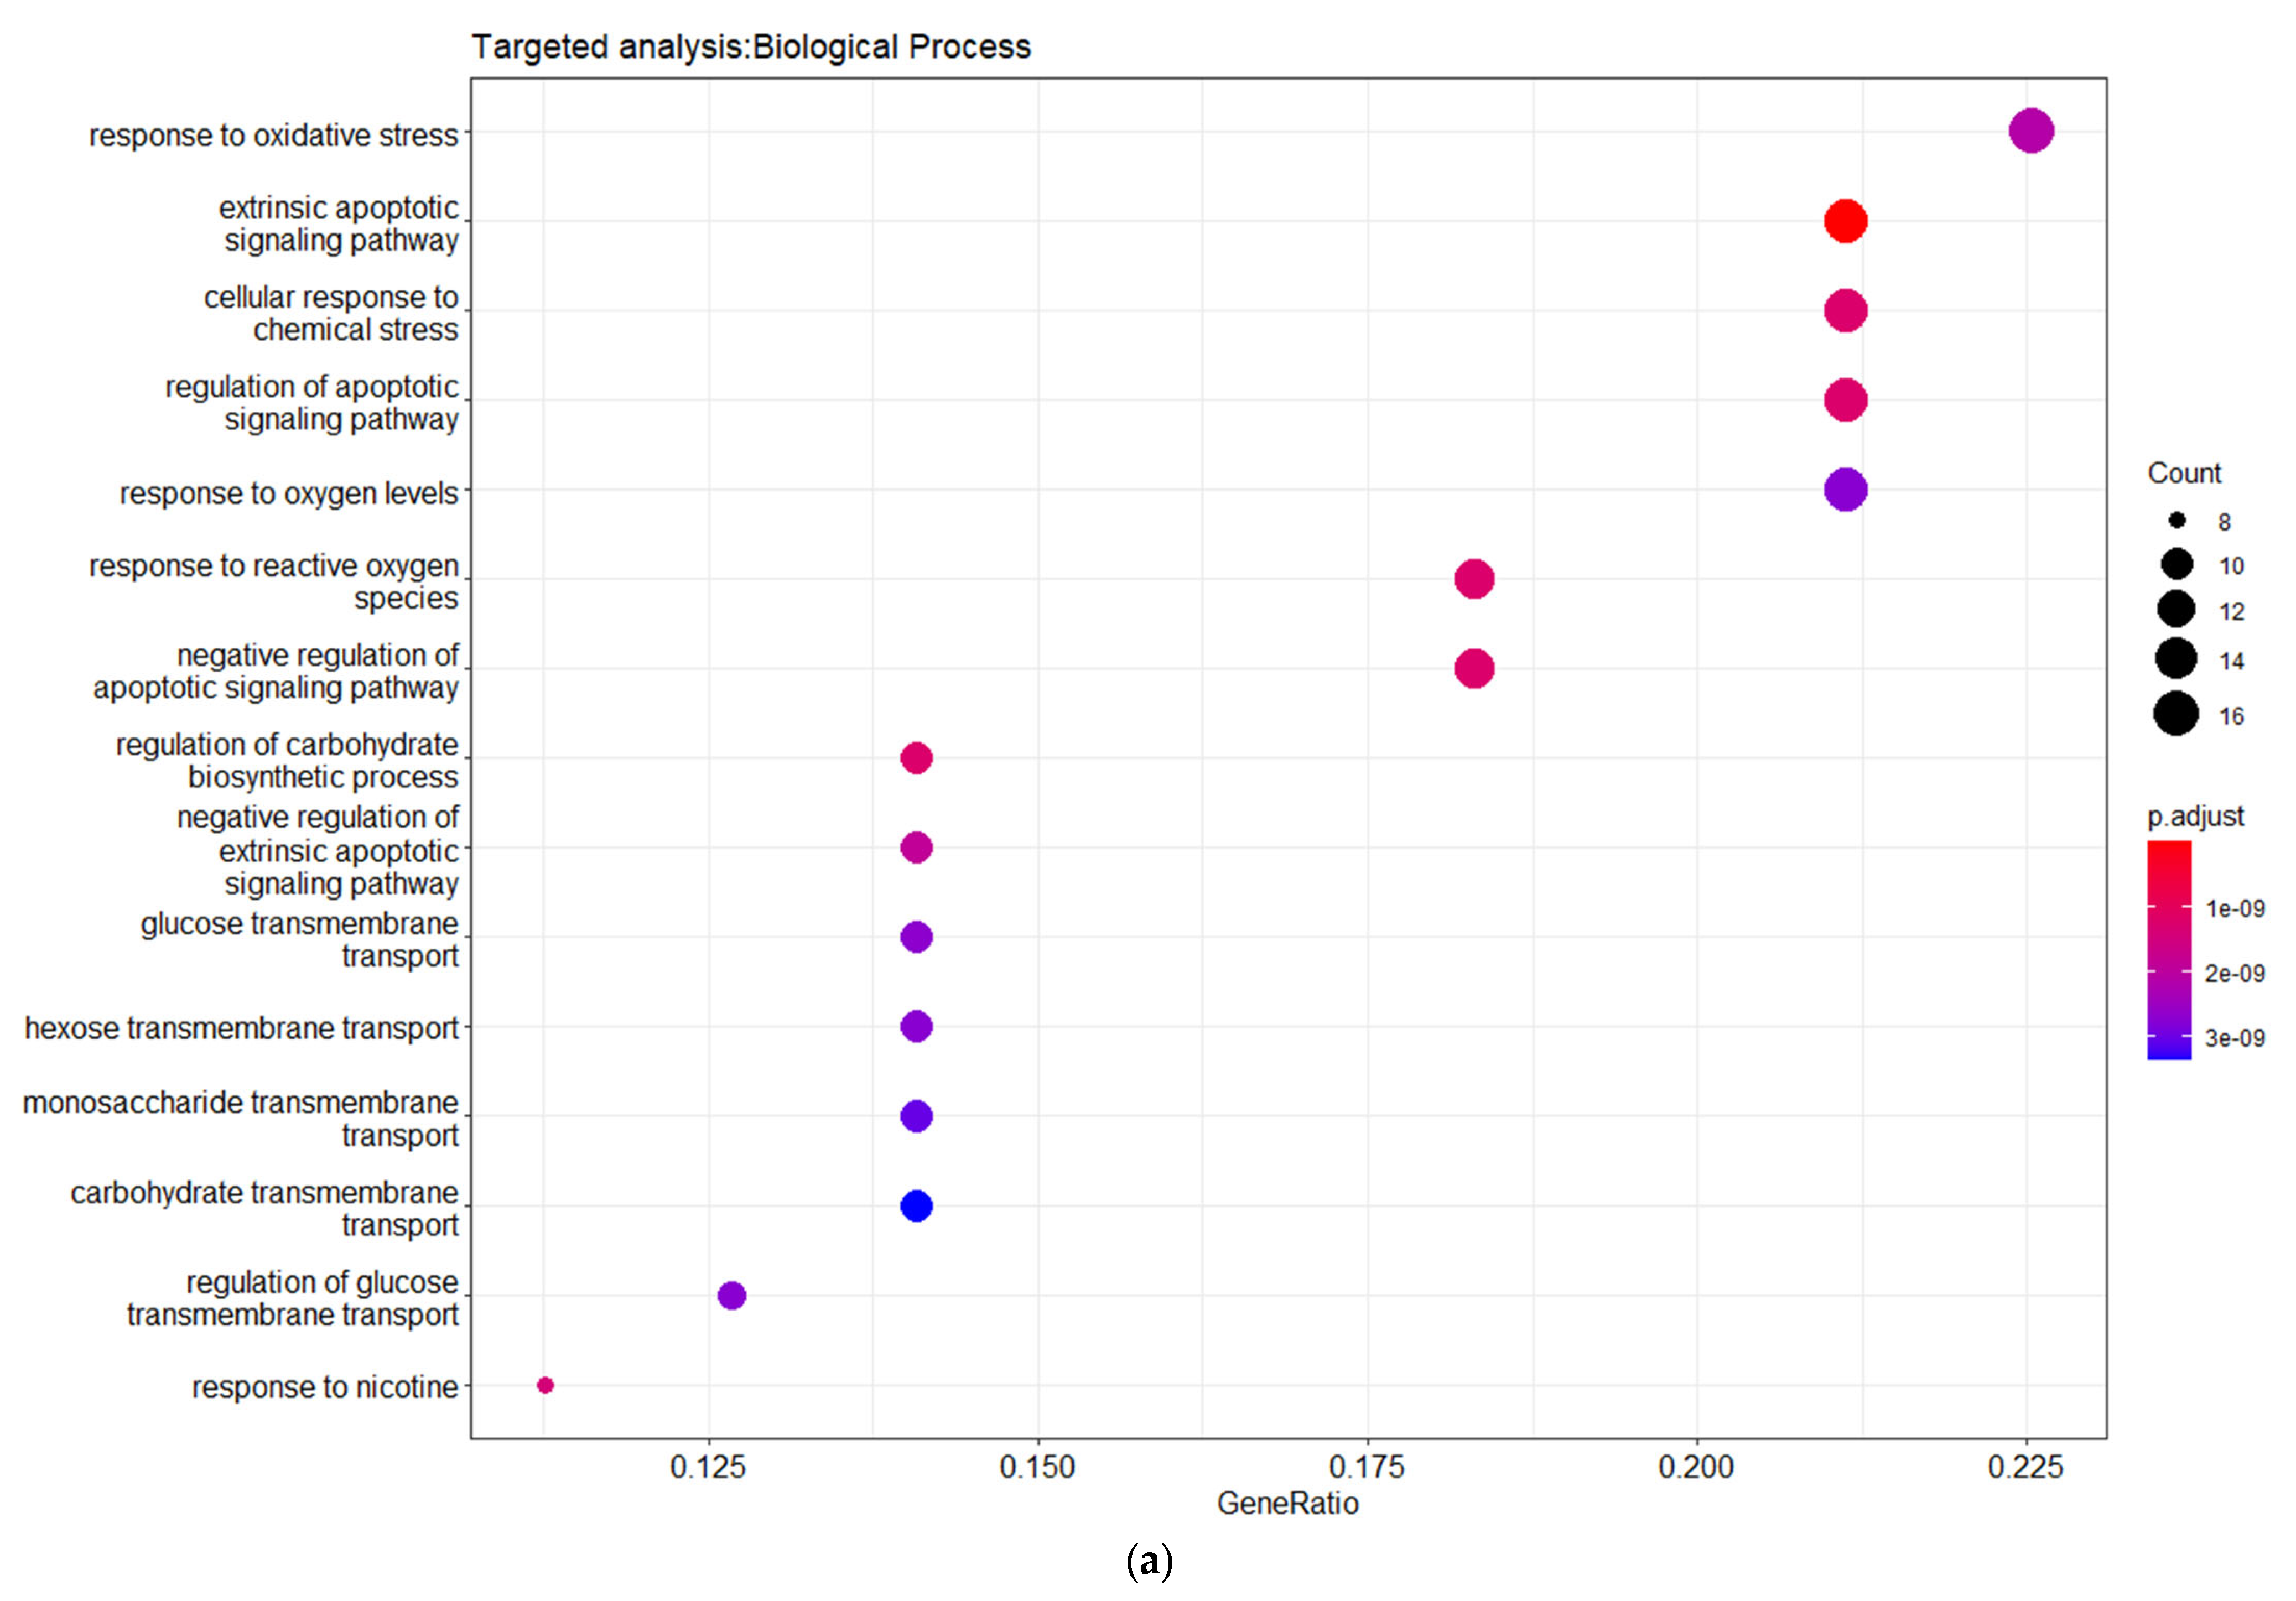
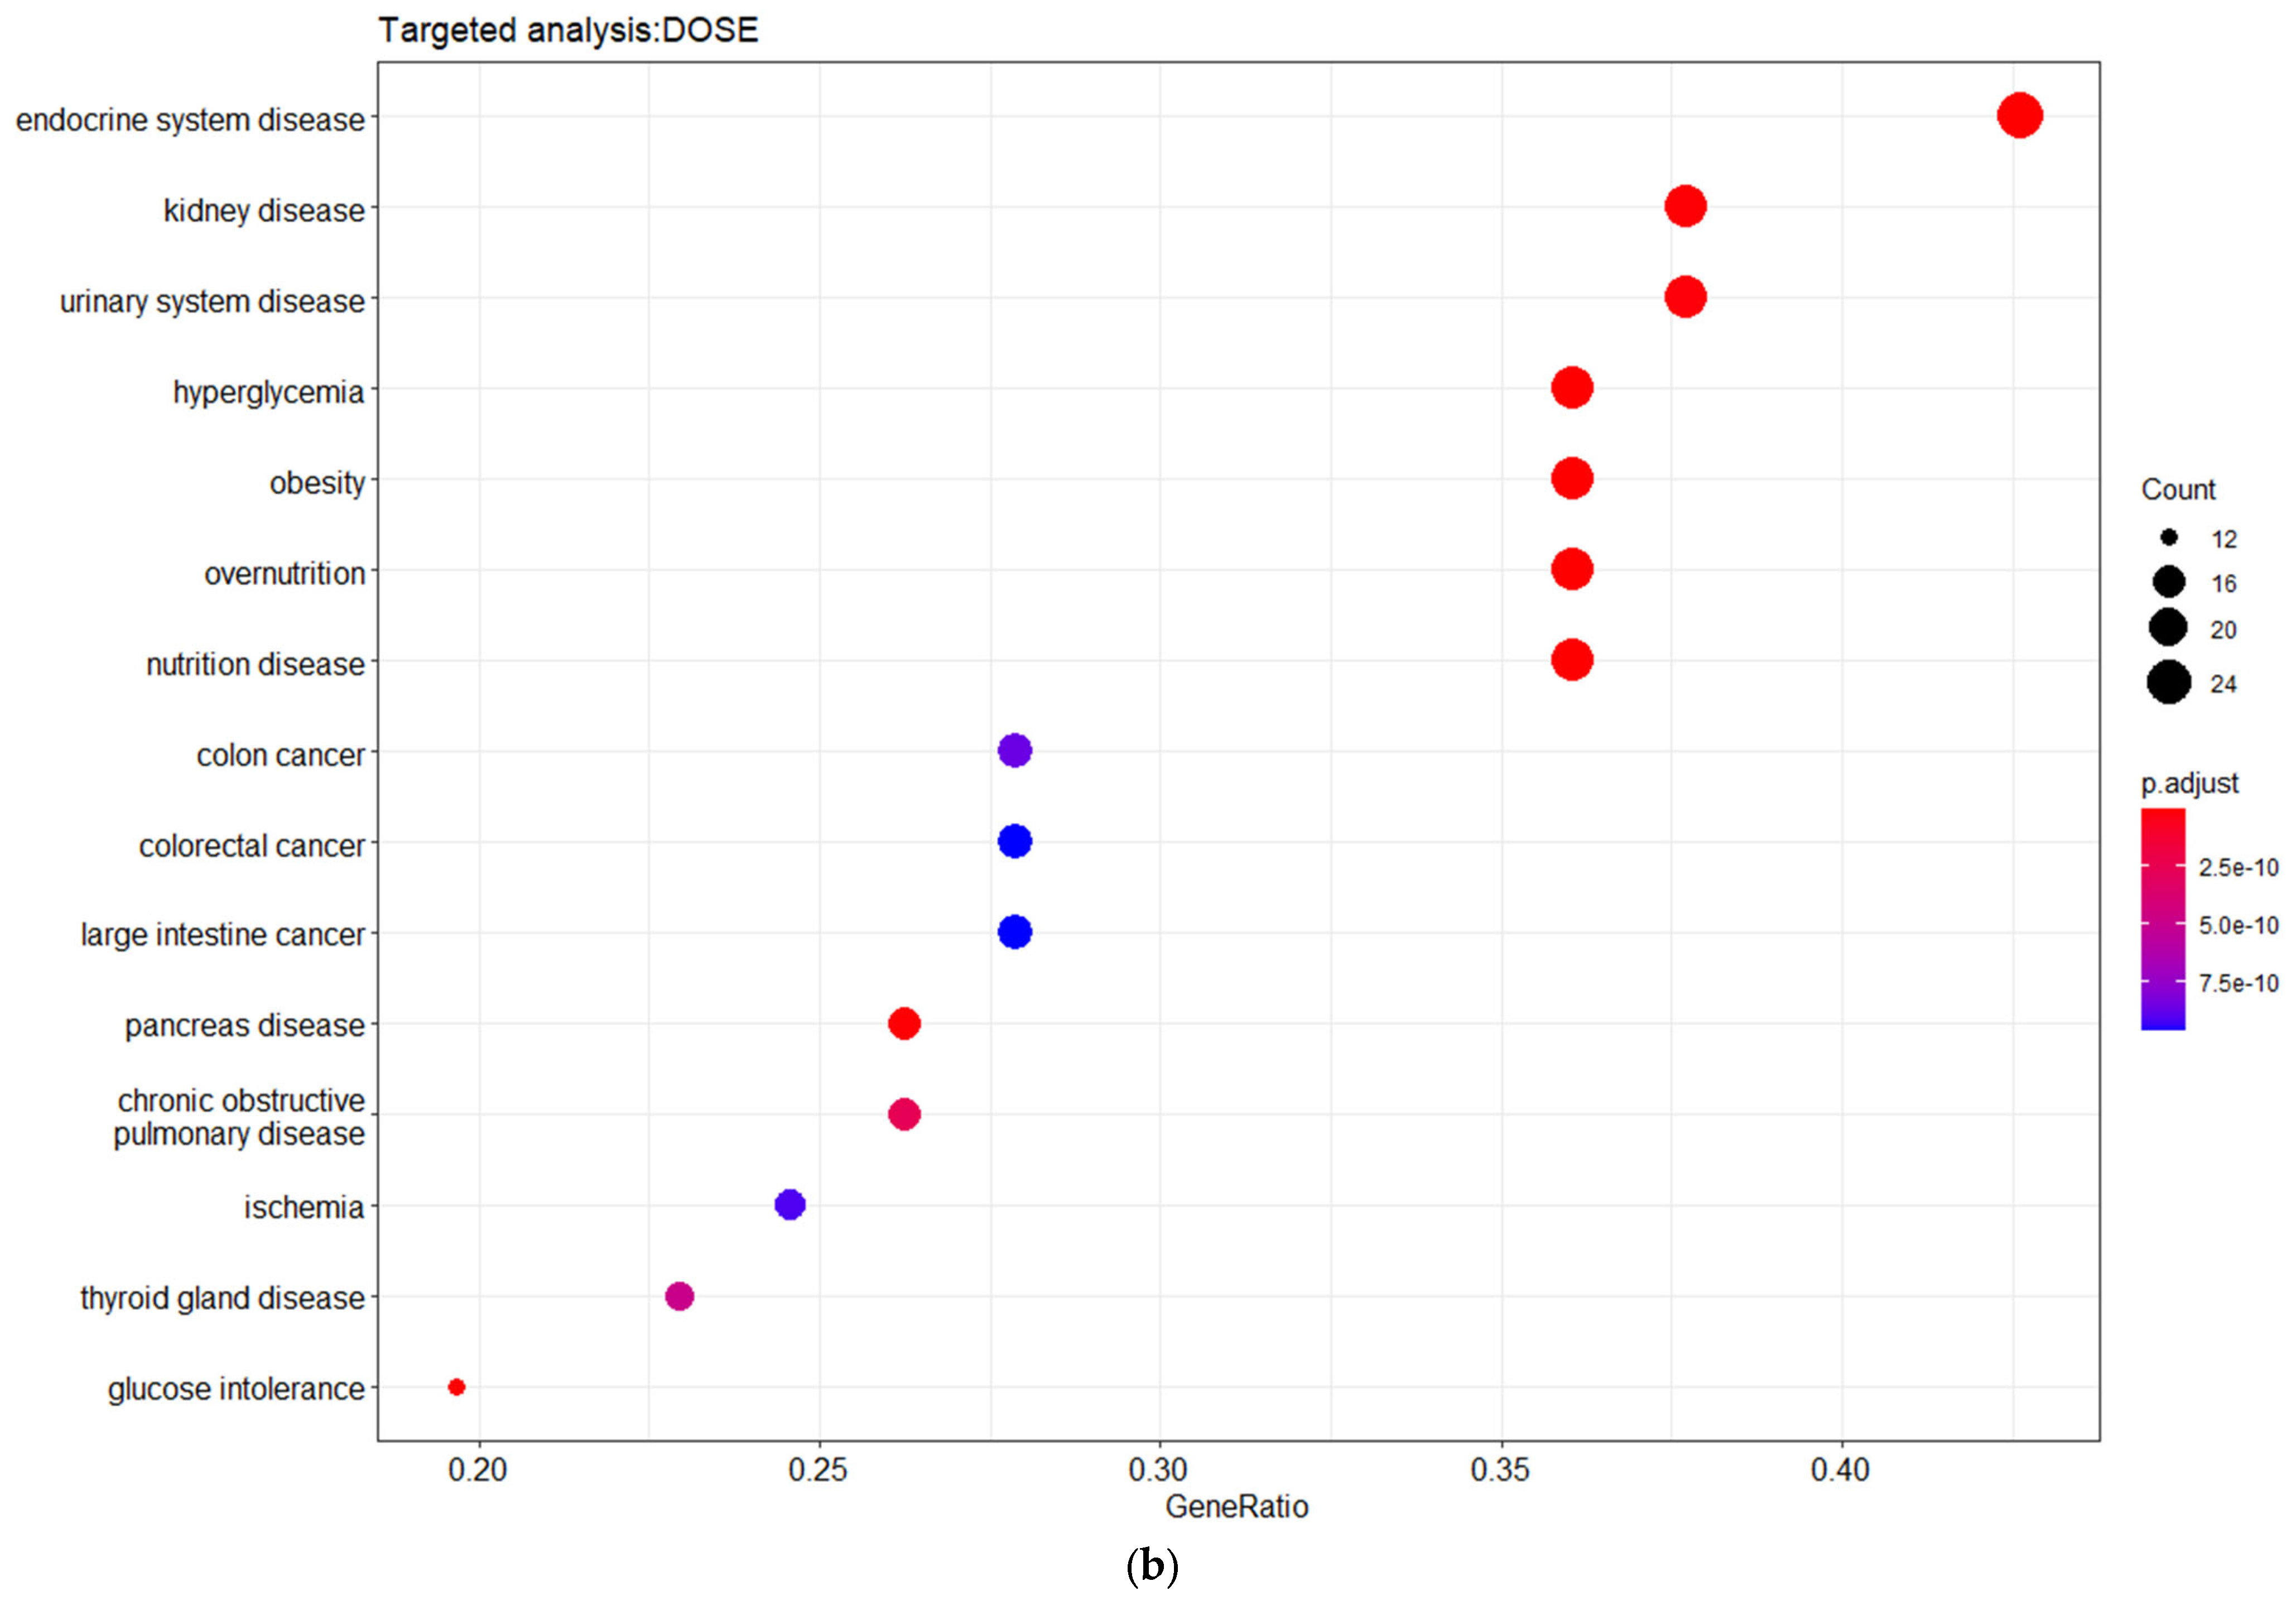
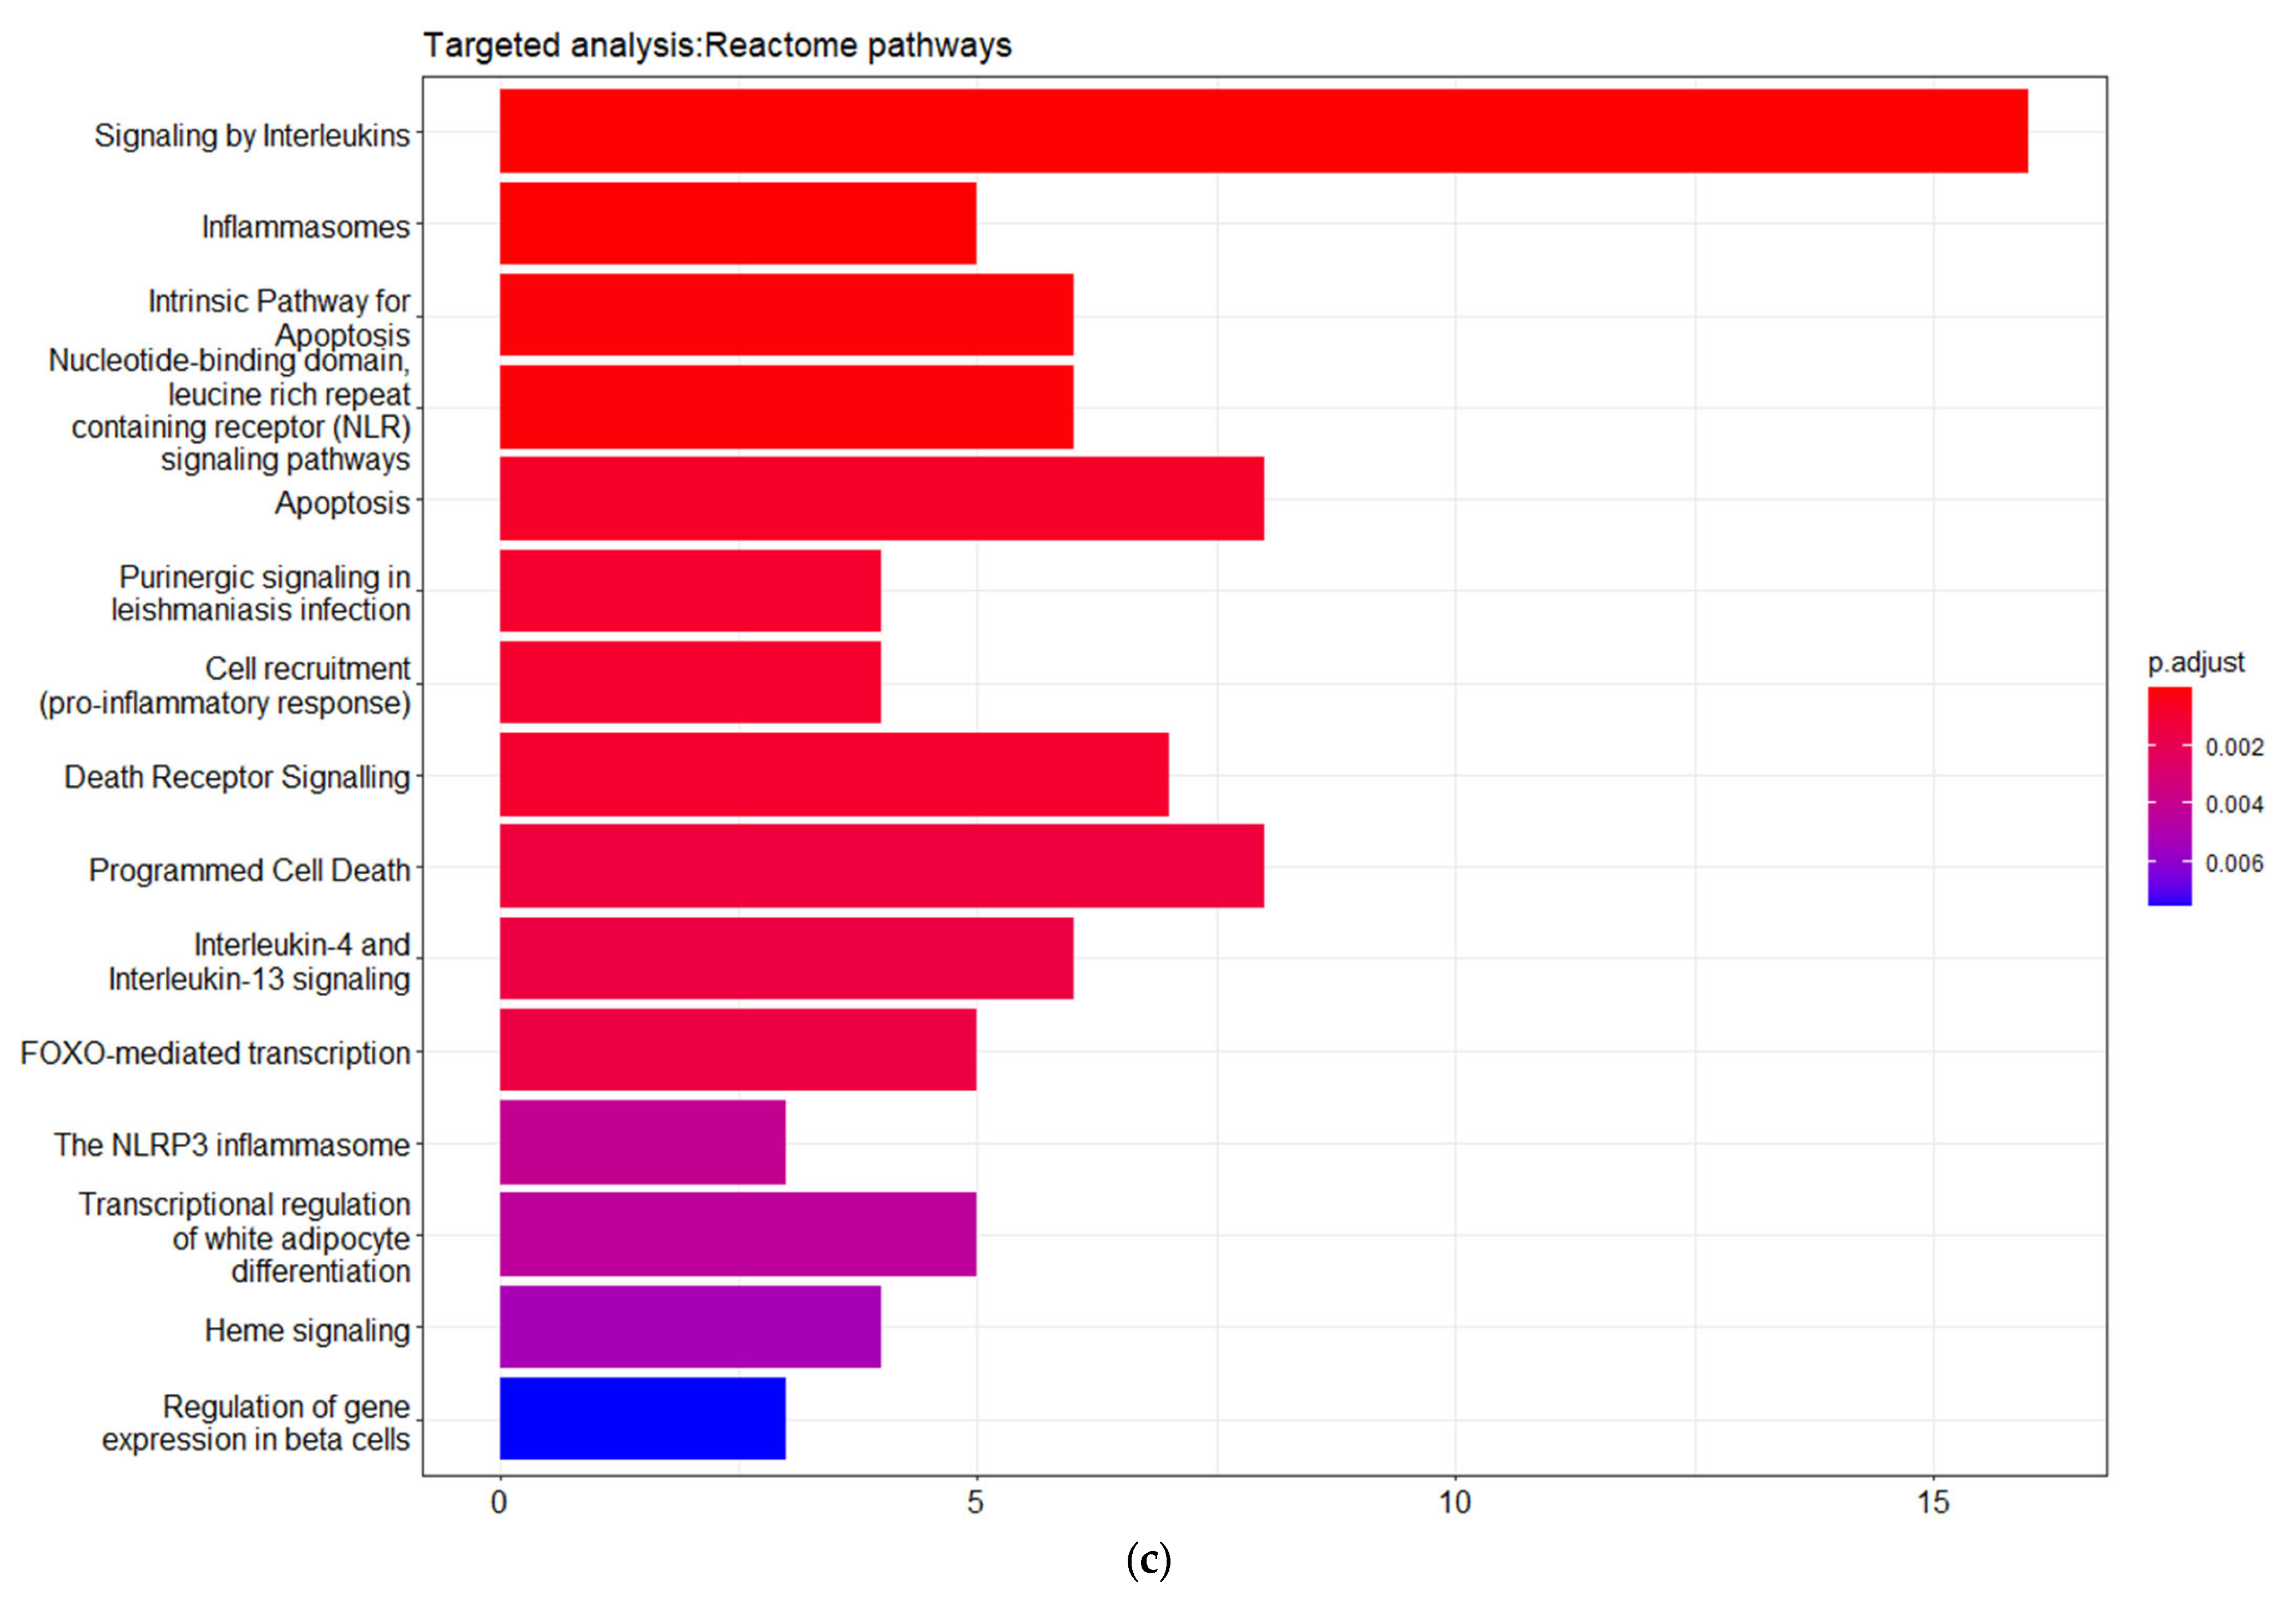
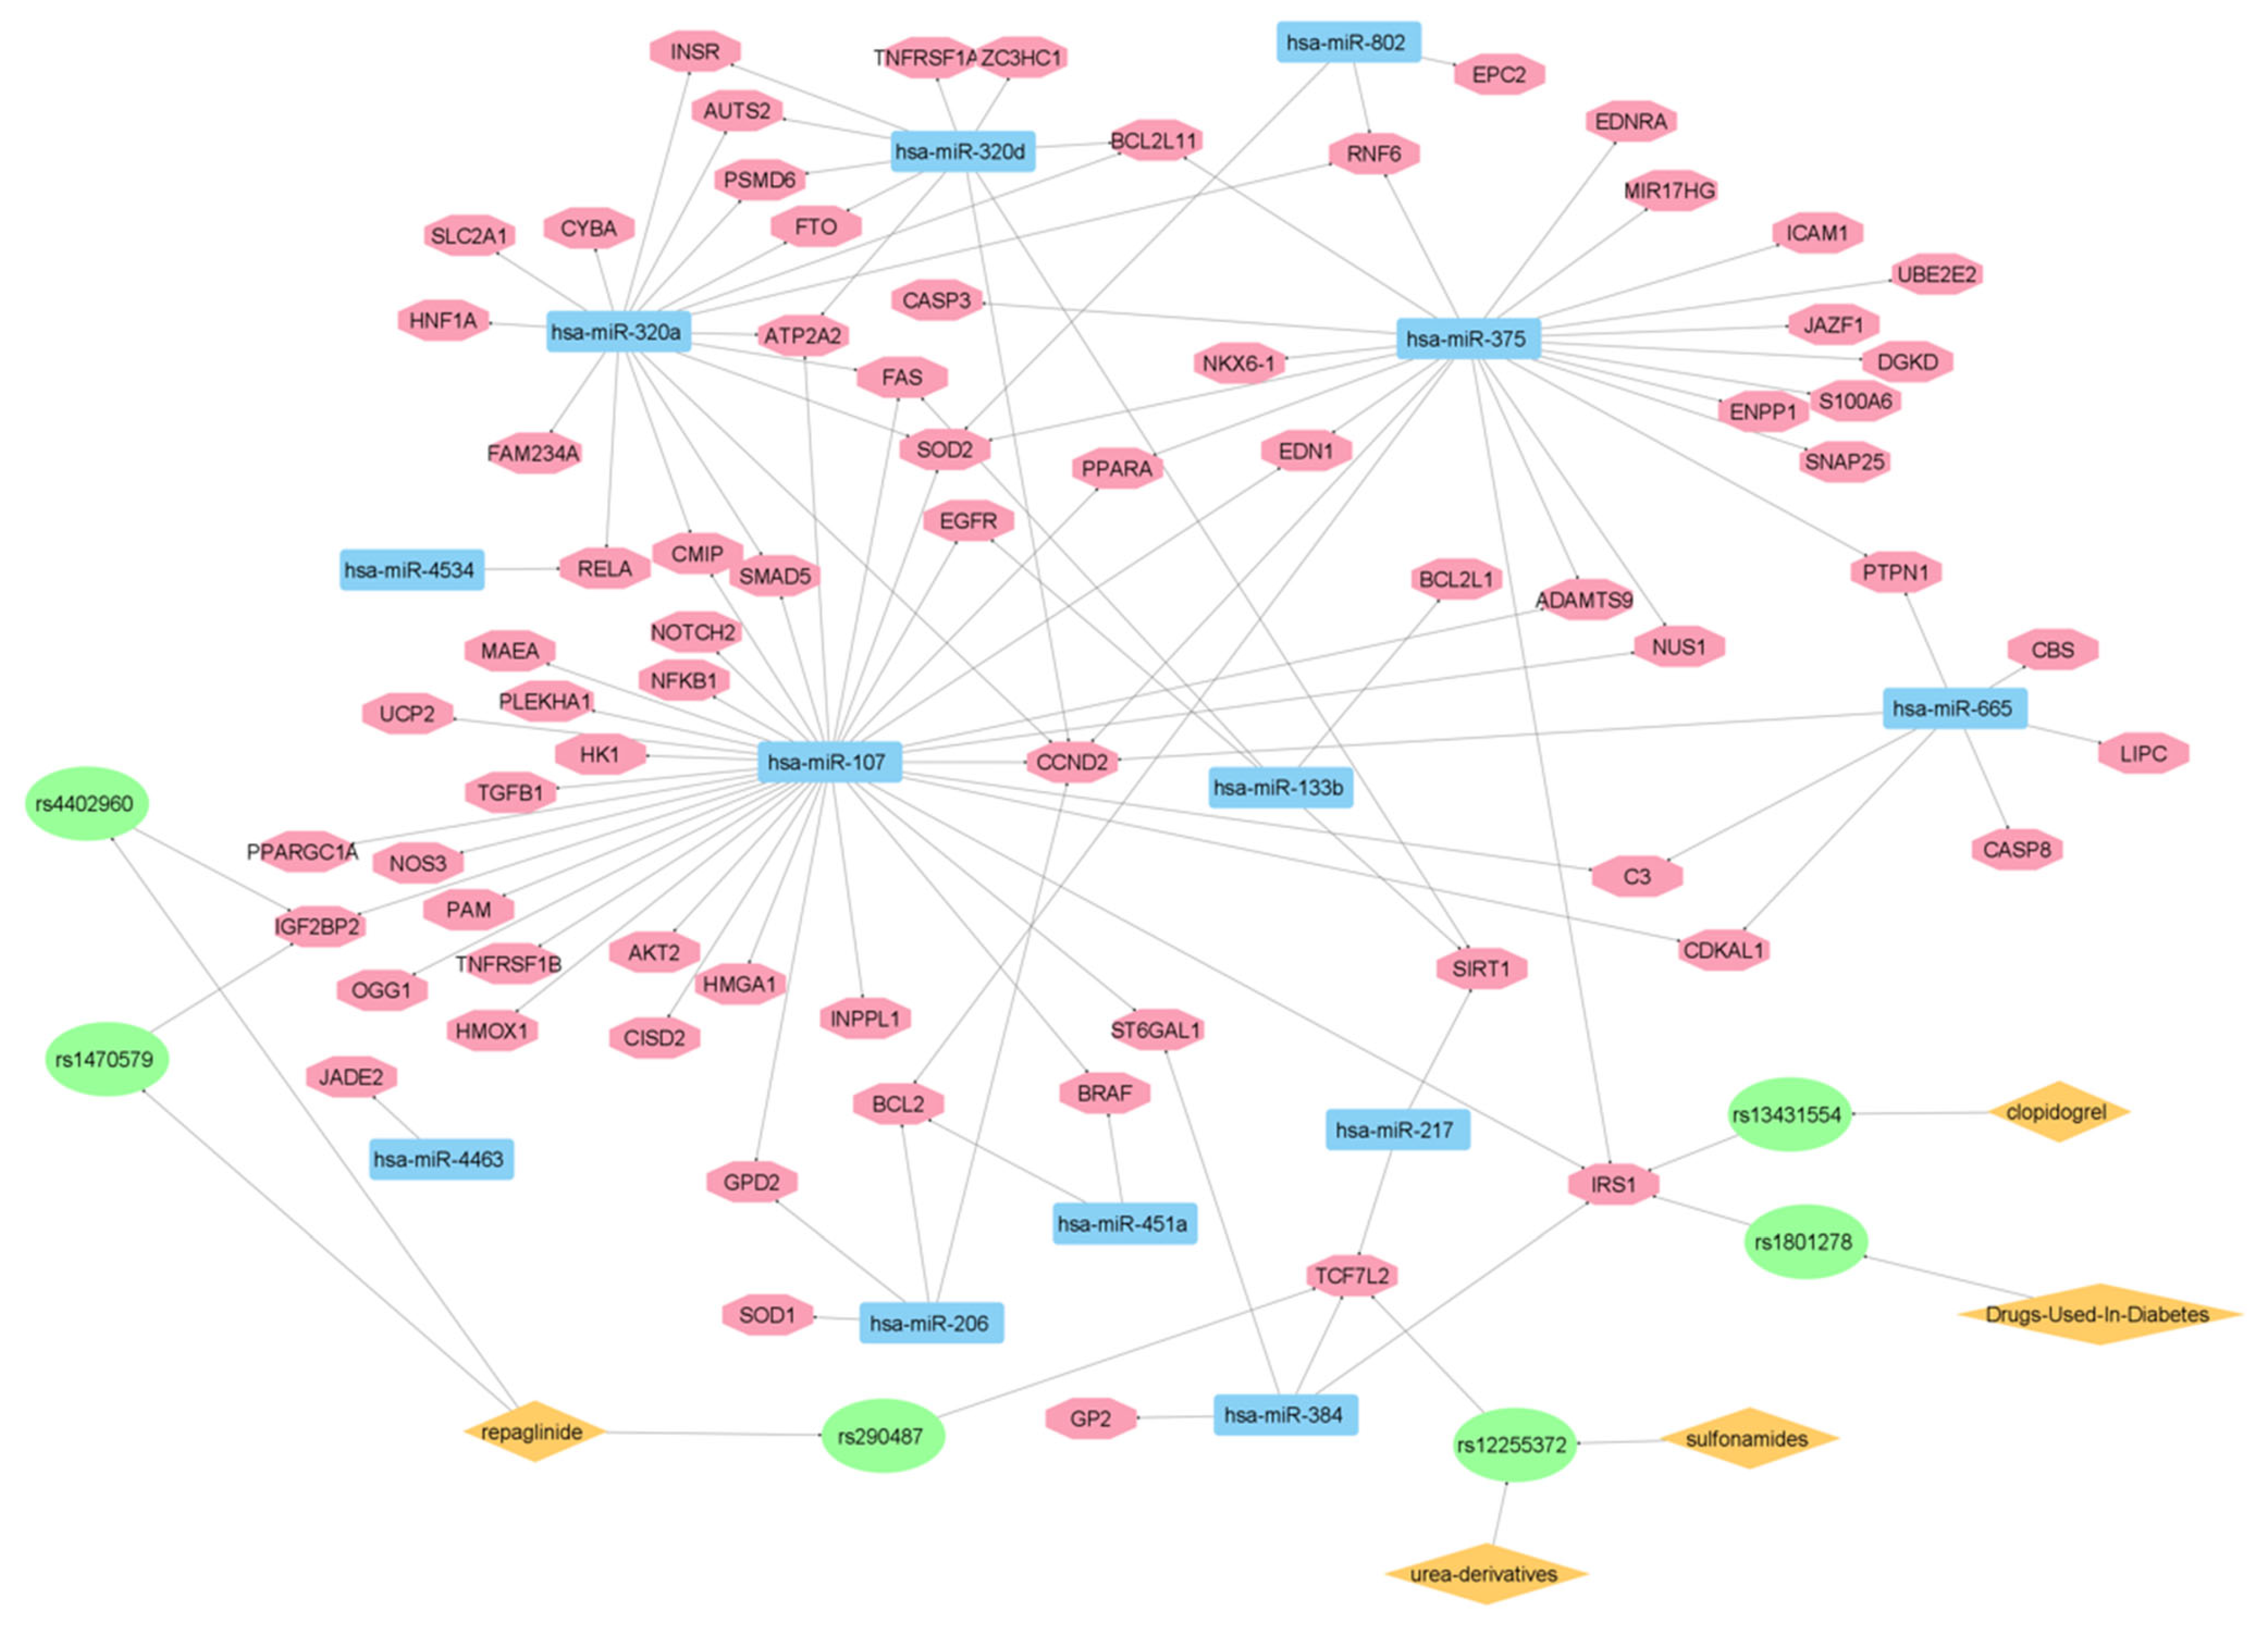
3.3. Targeted Analysis to Reveal Unique Shared Genes between the Experimentally Validated Target Genes of DMT2-Related miRNAs and the Genes Implicated in DMT2 Pathogenesis Relevant to Pharmacogenomics Analysis

The correlation of 221 genes that are related to DMT2 pathogenesis, according to the DisGeNET database and the experimentally validated target genes (VDTs) from our analysis of the DMT2-associated miRNAs, revealed 71 unique shared genes (see Table S3). These genes are related to DMT2 pathogenesis and interact with DMT2-associated miRNAs. The gene ontology enrichment analysis based on biological process (BP) revealed the shared genes involvement in processes related with oxidative stress, apoptosis regulation, and glucose transmembrane transport (Figure 4). The disease ontology (DOSE) enrichment analysis unveiled that the shared genes are implicated in several diseases, which can be clustered in three major disease groups, including urinary system disease, obesity-overnutrition, and colorectal cancer (Figure 4). The network (Figure 5) depicting the genes implicated in DMT2, kidney diseases, obesity, and colorectal cancer reveals several key genes shared among the disease groups. The shared key genes could be the connection link, in terms of pathophysiological mechanisms, which relates DMT2 with other diseases that coexist in patients with DMT2, including kidney diseases, obesity, and colorectal cancer. TGF-β1, a pleiotropic cytokine involved in several processes, including angiogenesis, extracellular matrix (ECM) formation, and immunoregulation, is considered a dominant factor involved in fibrotic processes of chronic kidney disease in patients with diabetes [41]. The EDN1 gene encodes a preprotein that is subjected to the proteolytic process generating an endothelial cell-derived peptide (endothelin 1). Hyperglycemia and hypertension associated with DMT2 contribute to increased renal Endothelin 1 production, progressively resulting in diabetic nephropathy [42,43]. Several genes are shared between DMT2 and obesity-overnutrition, including the ICAM1, PPARG, LEPR, SIRT1, FTO etc. For instance, genetic variations in the FTO gene are related with insulin resistance, inflammation, obesity, and DMT2. Groups of patients with a high risk of genetic variations in the FTO gene could be benefited by obesity prevention programs to prevent DMT2 development [44].
Furthermore, strong epidemiological evidence supports the existence of molecular connectors that increase the susceptibility for colorectal cancer (CRC) development of patients with DMT2. Diabetes is associated with dysregulated carbohydrate and lipid metabolic processes. The increased availability of nutrients, such as glucose and lipids, related with DMT2 disease favors the metabolic transformation of the cancer cells, overcoming growth inhibition checkpoints and apoptotic mechanisms [45]. Several signal transduction pathways, including the Wnt, PI3K/Akt, Ras-ΜAPK, and TGF-β, are triggered by the high lipid and glucose content in patients with DMT2 [46,47]. Notable previous studies have demonstrated the increased activation of cancer-related pathways in non-cancer mucosa of DMT2 patients, suggesting the field cancerization effect induced by diabetes [48]. TCF7L2, a gene shared between DMT2 and colorectal cancer, according to our analysis, is a transcription factor involved in the Wnt-signaling pathway [49]. This gene is related with DMT2 development and its complications, as well as with a susceptibility to CRC evolution [50]. Furthermore, previous studies have demonstrated a strong association between variants in the TCF7L2 gene and DMT2 and colorectal cancer development [51,52].
In addition, the matched genes are significantly enriched in pathways related with interleukins signaling, inflammasome and pro-inflammatory responses, apoptosis regulation, programmed cell death, and death receptor signaling. These pathways strongly interact with each other, forming larger pathway clusters as depicted on Figure 4d. Following these data, as shown in Figure 6, an additional network analysis was carried out to link the identified genes and miRNAs implicated in DMT2 pathogenesis with drug targets. Importantly, in this network, 13 microRNAs (miR-802, miR-320a, miR-320d, miR-375, miR-665, miR-107, miR-133b, miR-4534, miR-4463, miR-451a, miR-217, miR-206, and miR-384) are connected via six gene single nucleotide polymorphism (SNP) variants (rs290487, rs4402960, rs1470579, rs12255372, rs1801278, and rs13431554) with DMT2 drug therapeutics. These SNPs are variants of insulin-like growth factor 2 mRNA-binding protein 2 (IGF2BP2) gene (rs4402960 and rs1470579) of transcription factor 7-like 2 (TCF7L2) gene (rs290487 and rs12255372) and of insulin receptor substrate-1 (IRS-1) gene (rs1801278 and rs13431554) [53,54,55,56].
Such a network allows the creation of connection molecular maps between genes, SNPs, microRNAs, and drugs (e.g., repaglinide, urea-derivatives) relevant to pharmacogenomics and precision medicine decisions in DMT2 therapy. It is also interesting to note that one SNP (rs13431554) is associated with clopidogrel effects sharing the common target gene insulin receptor substrate 1 (IRS1) with the DMT2-associated SNP rs1801278. The latter correlation was shown to exist in coronary artery disease (CAD) patients with DMT2, where IRS1 polymorphisms and high platelet reactivity were associated with the clopidogrel therapy outcome [56].
Notably, IRS1 is also known as a signaling adapter protein, which is to be involved in various signaling cascades with a potential role in cancer progression [57,58]. Such connections allow us to better understand how specific gene functions contribute to the molecular pathophysiology of various illnesses. Recently, researchers proved that miR-107 expression is regulated by the p53 pathway, leading to insulin metabolism dysfunction [59]. Moreover, miR-133a plays a key role for proper skeletal and cardiac muscle function by regulating crucial signaling pathways, including the Wnt signaling [60]. It was also shown to regulate the EGFR/cMyc/P53 axis. Thus, it is implicated in various cellular processes, including migration, invasion, autophagy, proliferation, and apoptosis [61]. Since the function of miRNA-133a was previously associated with diabetic cardiomyopathy [62], it is reasonable for someone to consider molecular connections from its pleotropic biological effects with DMT2 pathophysiology.
Likewise, for microRNA-375, it was previously published that it exerts important gene functions that affect the complex regulatory network of pancreatic development [63]. Besides cell growth and proliferation, it has been proposed that its function in β-pancreatic cells is correlated with insulin secretion [64]. Complementary previous studies have also shown that miR-375 is involved in the regulation of the epithelial–mesenchymal transition (EMT) of tumor cells by affecting signaling pathways like Wnt, nuclear factor κB (NF-κB), and transforming growth factor β (TGF-β), which are considered crucial for cancer cell progression [65].
As far as the function of miR-320 in DMT2 is concerned, its involvement in the regulation of glucose and lipid metabolism was previously proposed. Specifically, the diabetes-induced cardiac dysfunction was shown to be mediated by miR-320 via the transcription regulation of genes involved in the fatty acid biosynthetic pathway [66]. Furthermore, miR-320a can directly cause dysfunction of pancreatic β-cells via its target gene [67], whereas it has been proposed to exert effects to myelodysplastic syndromes, too [68].
Overall, the proposed network analysis that unifies knowledge from genes, miRNAs, SNPs, and drugs sheds light onto molecular maps that contribute to: (a) Better understanding of DMT2 pathophysiology; (b) The creation of connections with signaling pathways linked to other illnesses; (c) The work related to drug repurposing approaches; (d) The exploitation and clinical implementation of pharmacogenomics knowledge; and (e) The formulation of precision medicine decisions in DMT2 therapy.

3.4. Assessment of Drug Interactions of Various Pharmacological Classes of Antidiabetic Drugs

3.4.1. Sulfonylureas and Glinides

Sulfonylureas (SUs) bind to their receptors (SURs) and stimulate the insulin release from pancreatic islet β-cells by deactivating the adenosine triphosphate (ATP)-sensitive potassium channel (KATP). When the KATP channel is closed, intracellular K+ begins to accumulate inside the cells. This leads to an influx of extracellular Ca+2, whereas the binding of Ca+2 to the insulin vesicles promotes their release into the circulation. Such results lead to the transportation of glucose molecules into the cell via the activation of the glucose transporter GLUT2 and, thus, the initiation of mitochondrial glycolysis. This insulin release is independent of the glucose levels in the blood, whereas the chronic administration of SUs can result in impaired insulin secretion due to downregulation of the expression level of SURs on the β-cell surface [69].
The most common clinically relevant drug interactions of SUs occur with metformin and thiazolidinediones (pioglitazone, rosiglitazone) (Table 1). The drug interactions are of special concern when new drugs are delivered to patients to control their DMT2 symptoms, or when the dosage of a medication has already been adjusted. Moreover, of special interest are patients with DMT2 who also have increased cardiovascular (CVD) risk and, thus, are treated with statins, which are predominantly metabolized by CYP3A4 (e.g., lovastatin, atorvastatin). When glibenclamide is co-administered with these statins, the Cmax and AUC of glibenclamide has been shown to increase up to 20% [70]. Patients with DMT2 who often take vitamin K antagonists, such as warfarin due to CVD comorbidities, have exhibited an increased risk for hypoglycemia, although little clinical information exists to support such evidence. To this end, a case report was published presenting a warfarin-maintained patient whose International Normalised Ratio (INR) was elevated upon co-administration of glibenclamide. The latter interaction has been considered to occur at the level of protein binding. However, the clinical evidence of such an effect is still limited [71].
Glibenclamide, glimepiride, and glipizide are the most frequently used SU agents. SUs are mainly metabolized by CYP2C9 and, to a lesser extent, by CYP3A4 [72]. When their pharmacokinetic profiles combine high plasma protein binding and hepatic metabolism by CYP enzymes, this property leads to a greater possibility of SUs to show an interaction with other drugs. Another level of interaction of SUs may stand in gastrointestinal absorption, which is largely dependent on gastric pH; even small changes can affect their bioavailability [73]. Inducers of CYP2C9, such as carbamazepine, phenobarbital, rifampicin, ritonavir, and St John’s wort, can cause increased elimination rates that result in decreased plasma levels of SUs. In contrast, inhibitors of CYP2C9, such as amiodarone, cimetidine, ranitidine, trimethoprim, fluconazole, ketoconazole, voriconazole, fluoxetine, leflunomide, and metronidazole prolong the pharmacodynamic effect of SUs. Therefore, when the daily dose of SUs has been on the adjustment phase, the clinical interactions with other drugs, and the emergence of adverse effects such as hypoglycemia, can more frequently occur [70,71]. In addition, many antibiotic drugs affect hepatic enzyme activity and can increase hypoglycemic risk of SUs. Therefore, these interactions are associated with higher morbidity and increased costs [74]. In a Finnish study, it was shown that the drugs trimethoprim, metronidazole, and ketoconazole contributed to interactions in patients with DMT2 with a rate of 75% [75].
The co-administration of clarithromycin and verapamil with SUs can cause increased plasma levels of glibenclamide due to the inhibition of the gastrointestinal drug transporter P-glycoprotein (P-gp) [70]. The organic anion transporting polypeptides OATP1B1-3 is implicated in the cellular permeability of many drugs, including SUs. Specifically, OATP1B3 facilitates the entry of glibenclamide [76]. However, further studies are needed to determine the exact impact of OATPs in the pharmacokinetic behavior of SUs and also validate any clinical relevance. For example, the co-delivery of chloramphenicol in DMT2 patients can increase the hypoglycemic effect of glibenclamide. The same result was shown when SUs were co-administered with NSAIDs. In addition, the concomitant use of DPP-4 inhibitors with SUs led to pharmacodynamic interaction [77]. Another significant interaction was shown with ethanol; alcohol intake is dangerous for DMT2 patients who treated with SUs. Ethanol increases the risk of patients to develop hypoglycemia upon SU administration. Alcohol intake should not exceed one-to-three drinks and should always be consumed with food [78]. Notably, many antacid medications that contain magnesium salts can increase the risk of hypoglycemia by increasing the absorption of SUs. Therefore, a sufficient time interval should mediate between the administration of SUs and antacid medications. On the other hand, the co-administration of cholestyramine may lead to a decreased absorption of SUs [79].
Table 1. Interactions of SUs and Glinides.
DrugsCO-Administered DrugsEffectReferences
GlibenclamideStatinsCmax and AUC of glibenclamide increased by up to 20%[70]
SUsInducers of CYP2C9 (carbamazepine, phenobarbital, rifampicin, ritonavir, St John’s wort)Increased elimination rate of SUs[70]
SUsInhibitors of CYP2C9 (amiodarone, cimetidine, ranitidine, trimethoprim, fluconazole, ketoconazole, voriconazole, fluoxetine, leflunomide, metronidazoleProlong SU effect[70]
GlibenclamideClarithromycinIncreased levels of glibenclamide[70]
GlibenclamideVerapamilIncreased levels of glibenclamide[70]
SUsEthanolIncreased risk of hypoglycemia[78]
SUsAntiacidsIncreased risk of hypoglycemia[79]
SUsCholestyramineDecreased absorption of SUs[79]
RepaglinideGemfibrozilIncreased plasma concentration of repaglinide[80]
RepaglinideCyclosporinIncreased plasma concentration of repaglinide[80]
RepaglinideInducers of CYP enzymes (carbamazepine, phenytoin, St John’s wort, rifampicin)Reduced plasma concentrations of repaglinide[81]
RepaglinideKetoconazole (inhibitor of CYP3A4)Increased AUC by 15% and the mean Cmax by 8% for repaglinide[82]
RepaglinideMacrolide antibiotics (clarithromycin)The effect of repaglinide is increased[83]
RepaglinideClopidogrelIncreased risk of hypoglycemia[84]
Although glinides (or meglitinides) have similar mechanisms of action with Sus, they are also prescribed for patients with renal sufficiency to reduce the postprandial hyperglycemia. The two analogs currently available for clinical use, repaglinide and nateglinide, bind to SUR1 on pancreatic β-cells and inhibit the ATP-sensitive potassium channel KATP. The most common adverse event associated with repaglinide monotherapy is hypoglycemia, whereas it has been reported that the combination of glinides and TZDs may lead to an increased risk of edema [85].
Glinides are associated with a lower risk of hypoglycemia than SUs due to their pharmacokinetic profile having shorter half-life values (t1/2) [86]. Moreover, the elimination of repaglinide is executed by the metabolic enzymes CYP2C8, CYP3A4, and uridine diphosphate glucuronosyltransferase 1A1 (UGT1A1). Thus, repaglinide should not be administered with gemfibrozil or cyclosporine, drugs that are known inhibitors of these enzymes. As the class of SUs, nateglinide is metabolized by CYP2C9 and CYP3A4, and it is also a substrate for the OATP1B1 transporter. Thus, it is reasonable to note that the drug interactions seen in clinical practice are similar in both cases. Rifampicin, as an inducer of CYP enzymes, can reduce plasma concentrations of repaglinide by increasing its metabolic elimination. Other inducers of CYP3A4, such as carbamazepine, phenytoin, and St John’s wort, could also decrease the pharmacodynamic effects of repaglinide, as proposed [81].
Moreover, a pharmacokinetic interaction at the level of metabolism was shown upon the co-administration of repaglinide and ketoconazole. Healthy subjects received repaglinide alone or repaglinide on Day 5 of ketoconazole treatment. Ketoconazole, a known inhibitor of CYP3A4, increased the mean AUC of repaglinide by 15% and the mean Cmax by 8%. However, the safety profile of repaglinide has not changed [82]. In another randomized crossover study, an interaction between repaglinide and gemfibrozil (CYP2C8 inhibitor), and between repaglinide and itraconazole (CYP3A4 inhibitor), was shown. The Cmax of repaglinide increased by 140% with gemfibrozil co-administration and by 47% with itraconazole co-administration. Importantly, the co-delivery of the two drugs with repaglinide led to a significant increase (175%) in the Cmax of repaglinide. [87]. The macrolide antibiotic clarithromycin inhibits CYP3A4 as well as the OATP1B1-mediated hepatic uptake of many drug substrates. Thus, the co-administration of repaglinide and clarithromycin can increase the plasma concentration and the glucose-lowering effects of repaglinide [83]. Clopidogrel is an antiplatelet drug and potent antagonist of the P2Y12 receptors. The use of clopidogrel in patients with repaglinide treatment is not recommended to avoid hypoglycemia, since one metabolite of clopidogrel is an inhibitor of CYP2C8. In such a case, ticagrelor is considered an alternative drug to be used as antiplatelet therapy in DMT2 patients [86,87,88].

3.4.2. Metformin

Metformin is recommended as a first-line therapy for the treatment of DMT2 patients. Metformin is excreted by renal elimination without undergoing hepatic metabolism. Therefore, all drugs that affect renal function may reduce the clearance of metformin and increase the emergence of adverse reactions [89]. As a biguanide agent, metformin decreases both basal and postprandial plasma glucose. In addition, metformin may have additional health benefits such as weight reduction, lowering plasma lipid levels and preventing cardiovascular complications. The action of metformin on mitochondria involves the inhibition of Complex I of the respiratory chain suppressing ATP production. Changes in the ratio of NAD+: NADH have also been observed following metformin administration. The inhibition of mitochondrial function leads to changes in AMP:ATP and ADP:ATP ratios, resulting in the activation of AMPK [90].
Although metformin does not often cause significant side effects, lactic acidosis is a rare but life-threatening adverse effect of metformin. In Table 2, the drug interactions associated with metformin are summarized. Thus, metformin is not administered with iodinated contrast agents due to the risk of renal failure. The mechanism of this interaction is not fully understood, but the transporters OCT, MATE1, MATE2K seem to have a crucial role [79]. Patients who received inhibitors of these transporters, such as trimethoprim, digoxin, amiloride, ranitidine, and vancomycin must be warned for potential interactions with metformin. Ranitidine, especially, is a potential inhibitor of MATE1 and, hence, the renal clearance of metformin is decreased. Thus, famotidine is a more suitable H2 antagonist in patients who are treated with metformin [91]. Cimetidine, as an inhibitor of MATE1, could also decrease the excretion of metformin, resulting in increased exposure [92]. A study has shown that individuals with the MATE1 808GT variant were more tolerant to this interaction with cimetidine [93]. Moreover, in vitro studies have revealed that cells with M420del were more sensitive to inhibition by amitriptyline than wild-type cells [94]. Furthermore, trimethoprim inhibits the elimination of metformin via the inhibition of OCTs and MATEs [95].
Anticholinergics also interact with metformin, leading to an increased bioavailability of metformin. Metformin affects the motility of the small bowel and, thus, it is responsible for the decreased absorption of vitamin B12 [97]. The risk of vitamin B12 deficiency is increased by the combination of proton pump inhibitors, or H2 receptor blockers [102]. Furthermore, PPIs may inhibit MATE and OCT2 transporters and increase plasma metformin exposure [96].
Verapamil decreases the glucose-lowering effect of metformin probably due to the inhibition of OCT1 [98]. This means that the intestinal and hepatic uptake of metformin is inhibited and, thus, the pharmacodynamic effect is limited [103]. A common variant of OCT1, M420del has been shown to be more sensitive to inhibition than the wild type allele. Cells with that variant were more sensitive to inhibition by verapamil. This implies a decrease in the intestinal and hepatic absorption of metformin. Dujic et al. presented results showing that individuals who carry reduced-function alleles and are treated with OCT1-inhibiting drugs had a four-fold higher risk of metformin intolerance [104].
Ranolazine is an approved drug for the therapy of chronic angina as it blocks the sodium channels of pancreatic α-cells and, thus, inhibits the release of glucagon. Ranolazine decreases the elimination of metformin through the inhibition of OCT2 transporter. Patients who are being advised to receive 1000mg of ranolazine should avoid high doses of metformin [99]. Another remarkable interaction is with β-adrenergic blockers. Atenolol inhibits the OCT2 transporter and reduces the renal blood flow, so the result of this mechanism is the reduced elimination of metformin upon co-administration. However, the delivery of metoprolol can decrease the plasma concentration of metformin by increasing its hepatic uptake. Moreover, metoprolol increases the renal uptake of metformin by reducing the expression of MATE1 [100].
Four anticancer drugs (imatinib, nilotinib, gefitinib, and erlotinib) have been shown to act as inhibitors of metformin’s transporters. The inhibition of OCT1, OCT3, MATE1, and MATE2-K could lead to alterations of absorption or the elimination of metformin. Other anticancer drugs, such as vandetanib, may increase the plasma concentration of metformin due to a decreased elimination since this drug is also a substrate of transporters. Berberine, a famous ingredient of herbal medicine, has been also shown to inhibit OCT1 and OCT2 transporters, implying a potential interaction with metformin.

3.4.3. Thiazolidinediones

Thiazolidinediones (TZDs) reduce insulin resistance, especially in adipose and liver tissue, while at the same time improving the response of pancreatic β-cells to glucose. TZDs regulate gene expression through binding to the peroxisome proliferator-activated receptor-gamma (PPAR-γ). PPAR-γ agonists improve insulin resistance by increasing adiponectin and GLUT4 expression, as well as reducing the effect of TNF-α on adipocytes. PPAR-γ acts synergistically with the retinoid receptor (Retinoid X Receptor, RXR), promoting the expression of genes implicated in insulin sensitivity. The most common side effects of TZDs are weight gain and fluid retention. Moreover, an increased incidence of edema is observed when TZDs are co-administered with insulin or other antidiabetic agents [105].
CYP enzymes are involved in the hepatic metabolism of TZDs. Pioglitazone is metabolized by CYP2C8 and CYP3A4. Thus, the drugs that inhibit CYP2C8 and CYP3A4 play a significant role in the pharmacokinetic pathway of pioglitazone. In Table 3, the drug interactions associated with pioglitazone are summarized. Rosiglitazone is also metabolized by CYP2C8 and CYP2C9. Drugs such as gemfibrozil and trimethoprim that inhibit CYP2C8-mediated metabolism can induce the emergence of adverse reactions of pioglitazone. Gemfibrozil inhibits CYP2C8 and increases the plasma concentration of pioglitazone. Thus, the level of blood glucose in patients taking gemfibrozil and pioglitazone should be monitored [106]. Another study showed that the co-administration of fenofibrate and rosiglitazone may cause myopathy and decreased quantities of high-density lipoprotein (HDL) [107].
The concomitant use of trimethoprim and pioglitazone can result in increased levels of pioglitazone. Notably, the co-administration of rosiglitazone and trimethoprim could cause adverse effects related with rosiglitazone. The co-administration of clopidogrel and pioglitazone may result in increased levels of pioglitazone due to fluid retention in the body. This interaction could also worsen the symptoms of heart failure. Ketoconazole inhibits CYP2C8 and CYP2C9 enzyme activity. Ketoconazole interacts with pioglitazone and rosiglitazone and increases the risk of adverse effects of rosiglitazone [108].
Inducers of CYP2C8 may have the opposite results. Rifampicin, as an inducer of CYP2C8, may result in the decreased efficacy of pioglitazone. Rifampicin can also induce CYP3A4 and CYP2C8, which are responsible for the metabolism of pioglitazone. Patients who are taking rifampicin and pioglitazone might exhibit decreased plasma levels of pioglitazone [109]. Rifampicin is also an inducer of CYP2C9. To this end, the co-administration of rifampicin and rosiglitazone could lead to a decreased plasma concentration of rosiglitazone [110].
Table 3. Drug interactions with pioglitazone.
DrugCo-Administered DrugEffectReferences
PioglitazoneGemfibrozilIncreased plasma concentration of pioglitazone[106]
PioglitazoneTrimethoprimIncreased plasma concentration of pioglitazone[73]
PioglitazoneClopidogrelIncreased levels of pioglitazone[84]
PioglitazoneKetoconazoleIncreased levels of pioglitazone[108]
PioglitazoneRifampicinDecreased efficacy of pioglitazone[109]

3.4.4. DPP-4 Inhibitors

Gliptins offer several advantages since they increase insulin secretion in a glucose-dependent manner. Unlike sulfonylurea, the administration of gliptins is not associated with weight gain and hypoglycemia. Many patients with DMT2 are also treated with DPP-4 inhibitors to reduce the incidence of cardiovascular events. Mechanistically, DPP-4 inhibitors increase incretin levels, such as the levels of GLP-1 and GIP. The DPP-4 inhibitors increase β-cell mass by stimulating β-cell differentiation and proliferation by reducing oxidative stress, inflammation, and apoptosis, both in vitro and in pre-clinical models of DMT2 [111,112]. In Table 4, the drug interactions of DDP-4 inhibitors with other drugs are summarized. Despite the advantages of DPP-4 inhibitors, the patient’s therapeutic response varies.
Sitagliptin, a DPP-4 inhibitor, is administered with metformin [113]. In a multiple-dose cross-over study, metformin did not alter the pharmacokinetic of sitagliptin. Sitagliptin is a substrate of P-gp; thus, the inhibitors of P-gp may lead to adverse effects of sitagliptin [114]. The co-administration of sitagliptin and cyclosporin leads to an increased absorption of sitagliptin through the inhibition of P-gp. However, the half-life changes of sitagliptin were not clinically significant [115]. The potential interactions between sitagliptin and other antihyperglycemic agents are also important. The concomitant use of sitagliptin and glibenclamide was evaluated in an open-label, randomized, two-period cross-over study, but no pharmacokinetic interactions were observed [116]. Drug interactions with HMG–CoA reductase inhibitors are also potent. Sitagliptin did not alter the pharmacokinetic profile of simvastatin, but several cases of rhabdomyolysis in patients with renal failure were observed [117]. The patients who are receiving sitagliptin along with statins, like atorvastatin and lovastatin, should be monitored for the symptoms of muscle toxicity.
Vildagliptin is another inhibitor DPP-4 that has been used in the treatment of DMT2. The CYP enzymes do not play a significant role in the metabolic pathways of vildagliptin. Different studies have been carried out to determine the potential interactions between vildagliptin and glibenclamide or pioglitazone. The result of these studies showed that the coadministration of vildagliptin with either glibenclamide or pioglitazone had no clinically significant effect on the pharmacokinetics of vildagliptin [118]. An open-label, multiple-dose, three-period cross-over study tried to determine the drug interactions between simvastatin and vildagliptin. The data indicated that the absorption of vildagliptin wasn’t affected upon the co-administration with simvastatin [119]. The co-administration of digoxin and vildagliptin for 7 days in healthy subjects had no effect exposure of digoxin [120]. The DPP-4 inhibitors also decrease the degradation of peptides, such as substance P. That means they could be involved in the pathogenesis of ACE inhibitor-associated angioedema. Vildagliptin use may be associated with a significantly increased risk of angioedema among patients receiving ACE inhibitors, although the absolute risk is small [121].
Linagliptin is another DPP-4 inhibitor that is used to manage hyperglycemia in patients with DMT2. It should not be used to treat Type I diabetes or in diabetic ketoacidosis. Graefe et al., investigated the effect of the linagliptin (5 mg) on the pharmacokinetics and pharmacodynamics of warfarin, a CYP2C9 substrate [122]. The coadministration of linagliptin did not alter the pharmacokinetics or pharmacodynamics of R- or S-warfarin. Therefore, no dosage adjustment is needed.
Saxagliptin, another DPP-IV inhibitor, is mainly metabolized by CYP3A4. Inhibitors of CYP3A4 and P-gp, such as ketoconazole and diltiazem, may increase the plasma concentration of saxagliptin. It has been observed that the plasma concentration of saxagliptin is increased by the concomitant use of ketoconazole and saxagliptin. Thus, when the usage of ketoconazole is necessary, it is recommended to use the lowest dose of saxagliptin (2.5 mg). Diltiazem, a drug usually prescribed in the management of hypertension, angina, and arrhythmias, is a potent inhibitor of CYP3A4 and P-gp. The coadministration of saxagliptin and diltiazem may increase the concentration of saxagliptin [123,124]. The plasma concentration of saxagliptin may be increased with the concomitant use of other inhibitors of CYP3A4, such as macrolide antibiotics and antiretroviral drugs. However, further studies are required to confirm these interactions [70].
Table 4. Drug interactions with DPP-4 Inhibitors.
DrugCo-Administered DrugEffectReferences
SitagliptinCyclosporinIncreased absorption of sitagliptin[115]
SitagliptinSimvastatinRisk of rhabdomyolysis[117]
VildagliptinACE InhibitorsIncreased risk of angioedema[121]
SaxagliptinKetoconazoleIncreased plasma concentration of saxagliptin[124]
SaxagliptinDiltiazemIncreased plasma concentration of saxagliptin[124]
SaxagliptinMacrolide antibioticsIncreased plasma concentration of saxagliptin[70]

3.4.5. GLP-1 Receptor Agonists (GLP-1RA)

In the guidelines provided by American Diabetes Association–European Association for the Study of Diabetes, GLP-1 receptor agonists are recommended as a second-line and third-line therapy for DMT2. GLP-1 receptor agonists reduce the risk of hypoglycemia, minimize weight gain, and promote weight loss [125,126]. Glucagon-like peptide-1 receptor agonists are incretin mimetics and contribute to the management of the blood glucose levels in the patients. Drugs, such as exenatide, liraglutide, lixisenatide, albiglutide, dulaglutide, and semaglutide, have been approved as GLP-1 agonists. The antidiabetic effect of GLP-1 agonists occurs through many mechanisms, including an increased glucose-dependent insulin secretion, suppressed glucagon levels, and reduced food intake [127]. GLP-1 receptor agonists, such as the endogenous GLP-1, bind and activate the GLP-1 receptor. GLP-1 is an incretin hormone that is released after the oral ingestion of carbohydrates or fats.
Patients with DMT2 have decreased levels of GLP-1. GLP-1 enhances insulin secretion in the presence of elevated glucose. Moreover, it suppresses glucagon secretion, retards gastric emptying, reduces food intake via the reduction of appetite, and promotes beta cell proliferation. GLP-1RA improves the glycemic control in patients with DMT2 and reduces body weight [128]. GLP-1RA has been shown to reduce systolic blood pressure and, to a lesser extent, diastolic blood pressure [129]. In their review article, Saraiva and Sposito presented data suggesting that GLP-1 receptor agonists do not worsen cardiovascular disease and may have potential cardiovascular benefits in patients with DMT2 [130].
Nausea and vomiting are common adverse reactions and occur in the onset of treatment with GLP-1RAs. Dose titration regimens are intended to reduce the gastrointestinal effects. Patients with gastroparesis or other GI issues are more likely to experience these adverse reactions [128]. The co-administration of insulin and GLP-1RA may increase the risk of hypoglycemia. Hence, it is recommended to reduce the dosage of insulin or insulin secretagogues. GLP-1RA could decrease the weight of patients with DMT2. Various studies reported a mean weight loss of −1 kg to −4.4 kg after 3-to-4 months of treatment [131]. Acute pancreatitis has occurred in patients who received GLP-1RA. In February 2014, the FDA and EMA stated that the current data do not support the increased risk of pancreatitis in patients receiving incretin mimetics. However, patients with a history of pancreatitis should be prescribed another antidiabetic therapy [132]. In Table 5, the drug interactions of GLP-1RA are summarized.
Drug–drug interactions may happen during the treatment of GLP-1RA. GLP-1RA may slow down the absorption of certain orally administered medications through delayed gastric emptying. The concurrent use of digoxin with dulaglutide, liraglutide, or semaglutide resulted in a little delay in the Tmax of digoxin, but no dose adjustment was needed [136,139]. Several studies have shown that no Warfarin dose modifications were required in patients taking dulaglutide, semaglutide, or liraglutide along with warfarin. However, a delay in the absorption of warfarin was observed in patients receiving dulaglutide, semaglutide, or liraglutide. Thus, the INR of patients receiving GLP-1 agonists and warfarin needs to be monitored [136,139].
Sulfonylureas are widely used in the treatment of DMT2. A higher risk of hypoglycemia was observed in patients taking liraglutide along with sulfonylurea. To avoid the risk of hypoglycemic episodes, the dose of sulfonylurea should be halved when sulfonylurea is co-administered with a GLP-1RA [137]. Previous studies demonstrated that the administration of exenatide modified the bioavailability of lovastatin. However, no dosage adjustment was required. The concomitant use of atorvastatin with liraglutide, dulaglutide, or semaglutide modified the Tmax of atorvastatin. However, this change was not clinically significant [138,139]. Angiotensin-converting enzyme (ACE) inhibitors are preferred as first-line antihypertensive agents to treat patients with hypertension and DMT2. However, the administration of liraglutide delayed the Tmax of lisinopril [138]. The lixisenatide also delayed the Tmax of ramipril, but this interaction was not clinically significant [140].

3.4.6. SGLT2 Inhibitors

SGLT2 inhibitors (SGLT2i) reduce renal tubular glucose reabsorption, producing a reduction in blood glucose without insulin release. Another benefit is the SGLT2i-mediated positive effects on blood pressure and weight. The SGLT2i mechanism of action depends on blood glucose levels while it is independent of the actions of insulin. Thus, there is minimal chance of hypoglycemia and no risk of beta cell overstimulation. Currently, six SGLT2 inhibitors, ipragliflozin, dapagliflozin, canagliflozin, empagliflozin, luceogliflozin, and tofogliflozin, were introduced for the treatment of DMT2 [141].
SGLT2 inhibitors can improve both fasting and postprandial hyperglycemia. A meta-analysis of 45 clinical trials showed that SGLT2 inhibitor monotherapy results in a 0.79% reduction of HbA1c plasma levels. Furthermore, the treatment with SGLT2i leads to a reduction in the body weight by 1.7 kg. The weight loss from SGLT2i therapy occurs due to an increased glucagon:insulin ratio that causes increased lipid mobilization. The EMPA-REG OUTCOME study evaluated the cardiovascular safety and efficacy of empagliflozin. Empagliflozin treatment reduced cardiovascular death, non-fatal myocardial infarction, and non-fatal stroke by 14%, and it reduced cardiovascular death by 38%. The DAPA–HF study revealed that dapagliflozin reduced the risk of heart failure or death from cardiovascular disease by 26% [142]. Higher levels of glucose in the urine due to the glucosuric action of SGLT2i may lead to urinary tract infection. Although most meta-analyses failed to correlate urinary tract infection with SGLT2 inhibitors, dapagliflozin appears to have the greatest effect. A significant increase in genital infections was observed in EMPA-REG OUTCOME. It has been suggested that therapy with SGLT2i may change the mineral metabolism and, thus, increase fracture risk. The risk of fractures was significantly higher with canagliflozin, while an insignificant difference was reported with empagliflozin and dapagliflozin [143].
The metabolism of dapagliflozin occurs predominantly in the liver and kidneys by uridine diphosphate-glucuronosyltransferase (UGT) 1A9 (UGT1A9). Dapagliflozin is not cleared by renal excretion, in contrast to its major metabolite, which is mainly eliminated via renal excretion. Pharmacokinetic studies in healthy volunteers showed that pioglitazone, metformin, glimepiride, or sitagliptin can be co-administered with dapagliflozin without a dose adjustment [144]. The addition of dapagliflozin in patients who couldn’t control DMT2 with glimepiride resulted in an important reduction of HbA1c levels [145]. The co-administration of dapagliflozin was evaluated in patients who were treated with simvastatin, warfarin, valsartan, or digoxin. In Table 6, the drug interactions of SGLT2i are summarized. Dapagliflozin increases the exposure of simvastatin, but it was not clinically significant. An increased exposure to warfarin was detected with a concomitant use of dapagliflozin, but changes to INR did not occur [144]. Drug interactions of dapagliflozin may have occurred due to alterations at the level of metabolism. Hence, inducers or inhibitors of UGT1A9 may lead to clinically relevant interactions of dapagliflozin. As a matter of fact, rifampicin, an inducer of UGT1A9, and mefenamic aid, a strong inhibitor of UGT1A9, may interact with dapagliflozin. Indeed, significant changes at dapagliflozin exposure were observed after the administration of rifampicin (decrease of AUC by 22%) or mefenamic acid (increase of AUC by 51%) [146].
Canagliflozin is metabolized through glucuronidation by UGT1A9 and UGT2B4 into two inactive metabolites. Drugs that induce or inhibit UGT enzymes could lead to several interactions with canagliflozin. Moreover, canagliflozin is metabolized by CYP3A4 to a lesser extent [152]. Metformin increases the exposure of canagliflozin (Cmax increase by 5%), but this change was not clinically significant. The co-administration of canagliflozin and digoxin increase the exposure to digoxin. Patients treated with this combination should be monitored due to the narrow therapeutic index of digoxin. In contrast, no obvious changes were observed after the administration of warfarin [148]. Inducers of UGT enzymes, such as rifampicin, could decrease the exposure to canagliflozin. Upon the co-administration of canagliflozin with an inducer of UGT enzymes, patients should be advised to increase the dose of canagliflozin to 300mg in order to succeed glycemic control. The administration of probenecid and cyclosporine increase the exposure to canagliflozin without significant clinical effects [153].
Pharmacokinetic and pharmacodynamic characteristics of empagliflozin were recently reviewed. The administration of glimepiride decreases the exposure to empagliflozin, while the administration of sitagliptin increases the exposure. However, these changes were not clinically relevant [151,154]. The absence of an interaction between empagliflozin and verapamil showed that there is no effect of P-gp inhibition on the metabolism of empagliflozin [155]. Furthermore, the oral co-administration of ethinylestradiol/levonorgestrel demonstrated no alteration in the exposure of empagliflozin in DMT2 patients [156].

4. Conclusions

Nowadays, through the exploitation of molecular knowledge, pharmacogenomics keeps the promise to advance disease prognosis, diagnosis, and therapy, as well as to provide personalized medicine decisions. As a matter of fact, pharmacogenomics aims to improve the clinical outcomes broadly for most, if not all, patients. However, by considering the case of DMT2, its heterogenous and multifactorial nature, along with the molecular complexity underlying the disease’s pathophysiology, must be emphasized, as well as the secondary complications being developed over the years. To this regard, and to improve data usage and clinical implementation, in the presented work, we executed network analysis by covering gene and microRNA biomarker information complemented with drug targets to depict the molecular connections of clinical relevance. Indeed, the comprehensive analysis conducted in this study verified that DMT2 emerges as a multifactional disease with a variety of pathways and molecular functions to be involved in its pathogenesis and progressiveness.
This great complexity of DMT2 disease is reflected by the number of miRNAs and target-genes with a potentially crucial role in the disease. Going further, the association of DMT2 with cancer and pathways related to cell cycle and inflammation, which have been already reported, are also presented in the current study, reinforcing the molecular complexity of the disease. However, the identification of some key molecules involved in many processes, and which play a crucial role in biological pathways, can enrich the existing knowledge as well as lay new foundations in the disease’s prevention and treatment. Such a way helps the improvement of translational research capabilities to extract pharmacogenomics-based information applicable to the individualized handling of patients and therapeutic interventions. Furthermore, by comprehensively assessing the drug interactions of therapeutics delivered to patients with DMT2, the clinical pharmacology knowledge could be simultaneously correlated with pharmacogenomics information, a desirable case to happen when decision and drug dosage selection must be undertaken in the clinical setting to fulfill pharmacotyping [157].
Overall, the data obtained facilitate the analysis of the molecular landscape of DMT2 by improving our understanding of the disease pathophysiology at the molecular level, unveiling molecular connection maps of practical clinical utility, and empowering the exploitation of pharmacogenomics-guided therapeutic decisions within the concept of precision medicine.

Supplementary Materials

The following supporting information can be downloaded at: https://www.mdpi.com/article/10.3390/futurepharmacol3010021/s1; Table S1: List of the 221 genes that are found to be related with DMT2 pathophysiological mechanisms in DisGeNET database using expert-curated data; Table S2: List of miRNAs that are associated with DMT; Table S3: List of the 71 unique shared genes identified to be related to DMT2 pathogenesis that are also interacting with the DMT2-associated miRNAs.

Author Contributions

Conceptualization and supervision, I.S.V.; methodology and bioinformatic analysis, A.S. and A.G.-D.; data analysis and writing-original draft preparation, A.S., A.G.-D., I.K., E.G. and I.S.V.; All authors contributed to preparing the original draft, writing and review of the manuscript. All authors have read and agreed to the published version of the manuscript.

Funding

This research received no external funding.

Institutional Review Board Statement

Not applicable.

Informed Consent Statement

Not applicable.

Data Availability Statement

Data is contained within the article and Supplementary Material.

Conflicts of Interest

The authors declare no conflict of interest.

References

  1. International Diabetes Federation. IDF Diabetes Atlas, 10th ed.; International Diabetes Federation: Brussels, Belgium, 2021; Available online: http://www.diabetesatlas.org/ (accessed on 10 February 2023).
  2. Kahn, S.E.; Cooper, M.E.; del Prato, S. Pathophysiology and treatment of type 2 diabetes: Perspectives on the past, present, and future. Lancet 2014, 383, 1068–1083. [Google Scholar] [CrossRef] [PubMed] [Green Version]
  3. Deshpande, A.D.; Harris-Hayes, M.; Schootman, M. Epidemiology of Diabetes and Diabetes-Related Complications. Phys Ther. 2008, 88, 1254–1264. [Google Scholar] [CrossRef] [PubMed] [Green Version]
  4. Robertson, R.P.; Zhou, H.; Zhang, T.; Harmon, J.S. Chronic oxidative stress as a mechanism for glucose toxicity of the beta cell in Type 2 diabetes. Cell Biochem. Biophys. 2007, 48, 139–146. [Google Scholar] [CrossRef] [PubMed]
  5. Pickup, J.C. Inflammation and Activated Innate Immunity in the Pathogenesis of Type 2 Diabetes. Diabetes Care 2004, 27, 813–823. [Google Scholar] [CrossRef] [Green Version]
  6. Gupta, A.; Jelinek, H.F.; Al-Aubaidy, H. Glucagon like peptide-1 and its receptor agonists: Their roles in management of Type 2 diabetes mellitus. Diabetes Metab. Syndr. Clin. Res. Rev. 2017, 11, 225–230. [Google Scholar] [CrossRef]
  7. Tiwari, P. Recent Trends in Therapeutic Approaches for Diabetes Management: A Comprehensive Update. J. Diabetes Res. 2015, 2015, 340838. [Google Scholar] [CrossRef] [Green Version]
  8. Hinton, W.; Feher, M.; Munro, N.; Walker, M.; Lusignan, S. Real-world prevalence of the inclusion criteria for the LEADER trial: Data from a national general practice network. Diabetes Obes. Metab. 2019, 21, 1661–1667. [Google Scholar] [CrossRef]
  9. McGovern, A.; Feher, M.; Munro, N.; de Lusignan, S. Sodium-Glucose Co-transporter 2 (SGLT2) Inhibitor: Comparing Trial Data and Real-World Use. Diabetes Ther. 2017, 8, 365–376. [Google Scholar] [CrossRef] [Green Version]
  10. Bell, J. Stratified medicines: Towards better treatment for disease. Lancet 2014, 383, S3–S5. [Google Scholar] [CrossRef]
  11. Dennis, J.M. Precision Medicine in Type 2 Diabetes: Using Individualized Prediction Models to Optimize Selection of Treatment. Diabetes 2020, 69, 2075–2085. [Google Scholar] [CrossRef]
  12. Shields, B.M.; Dennis, J.M.; Angwin, C.D.; Warren, F.; Henley, W.E.; Farmer, A.J.; Sattar, N.; Holman, R.R.; Jones, A.G.; Pearson, E.R.; et al. Patient stratification for determining optimal second-line and third-line therapy for type 2 diabetes: The TriMaster study. Nat. Med. 2022, 29, 376–383. [Google Scholar] [CrossRef]
  13. Xie, F.; Chan, J.C.; Ma, R.C. Precision medicine in diabetes prevention, classification and management. J. Diabetes Investig. 2018, 9, 998–1015. [Google Scholar] [CrossRef] [Green Version]
  14. Pearson, E.R. Diabetes: Is There a Future for Pharmacogenomics Guided Treatment? Clin. Pharmacol. Ther. 2019, 106, 329–337. [Google Scholar] [CrossRef] [Green Version]
  15. Khoshnejat, M.; Kavousi, K.; Banaei-Moghaddam, A.M.; Moosavi-Mohavedi, A.A. Unraveling the molecular heterogeneity in type 2 diabetes: A potential subtype discovery followed by metabolic modeling. BMC Med Genomics 2020, 13, 119. [Google Scholar] [CrossRef] [PubMed]
  16. Dawed, A.Y.; Mari, A.; Brown, A.; McDonald, T.J.; Li, L.; Wang, S.; Hong, M.-G.; Sharma, S.; Robertson, N.R.; Mahajan, A.; et al. Pharmacogenomics of GLP-1 receptor agonists: A genome-wide analysis of observational data and large randomised controlled trials. Lancet Diabetes Endocrinol. 2023, 11, 33–41. [Google Scholar] [CrossRef] [PubMed]
  17. Whirl-Carrillo, M.; Huddart, R.; Gong, L.; Sangkuhl, K.; Thorn, C.F.; Whaley, R.; Klein, T.E. An Evidence-Based Framework for Evaluating Pharmacogenomics Knowledge for Personalized Medicine. Clin. Pharmacol. Ther. 2021, 110, 563–572. [Google Scholar] [CrossRef] [PubMed]
  18. Kahn, S.E.; Hull, R.L.; Utzschneider, K.M. Mechanisms linking obesity to insulin resistance and type 2 diabetes. Nature 2006, 444, 840–846. [Google Scholar] [CrossRef]
  19. Malone, J.I.; Hansen, B.C. Does obesity cause type 2 diabetes mellitus (T2DM)? Or is it the opposite? Pediatr. Diabetes 2019, 20, 5–9. [Google Scholar] [CrossRef] [Green Version]
  20. Akhtar, M.; Taha, N.M.; Nauman, A.; Mujeeb, I.B.; Al-Nabet, A.D.M.H. Diabetic Kidney Disease: Past and Present. Adv. Anat. Pathol. 2020, 27, 87–97. [Google Scholar] [CrossRef]
  21. Koye, D.N.; Magliano, D.J.; Nelson, R.G.; Pavkov, M.E. The Global Epidemiology of Diabetes and Kidney Disease. Adv. Chronic Kidney Dis. 2018, 25, 121–132. [Google Scholar] [CrossRef]
  22. Tanase, D.M.; Gosav, E.M.; Costea, C.F.; Ciocoiu, M.; Lacatusu, C.M.; Maranduca, M.A.; Ouatu, A.; Floria, M. The Intricate Relationship between Type 2 Diabetes Mellitus (T2DM), Insulin Resistance (IR), and Nonalcoholic Fatty Liver Disease (NAFLD). J. Diabetes Res. 2020, 2020, 3920196. [Google Scholar] [CrossRef] [PubMed]
  23. Muzica, C.M.; Sfarti, C.; Trifan, A.; Zenovia, S.; Cuciureanu, T.; Nastasa, R.; Huiban, L.; Cojocariu, C.; Singeap, A.-M.; Girleanu, I.; et al. Nonalcoholic Fatty Liver Disease and Type 2 Diabetes Mellitus: A Bidirectional Relationship. Can. J. Gastroenterol. Hepatol. 2020, 2020, 6638306. [Google Scholar] [CrossRef]
  24. Filippatos, T.D.; Alexakis, K.; Mavrikaki, V.; Mikhailidis, D.P. Nonalcoholic Fatty Pancreas Disease: Role in Metabolic Syndrome, “Prediabetes”, Diabetes and Atherosclerosis. Dig. Dis. Sci. 2022, 67, 26–41. [Google Scholar] [CrossRef]
  25. Livadas, S.; Anagnostis, P.; Bosdou, J.K.; Bantouna, D.; Paparodis, R. Polycystic ovary syndrome and type 2 diabetes mellitus: A state-of-the-art review. World J. Diabetes 2022, 13, 5–26. [Google Scholar] [CrossRef]
  26. Oguntibeju, O.O. Type 2 diabetes mellitus, oxidative stress and inflammation: Examining the links. Int. J. Physiol. Pathophysiol. Pharmacol. 2019, 11, 45–63. [Google Scholar]
  27. Galicia-Garcia, U.; Benito-Vicente, A.; Jebari, S.; Larrea-Sebal, A.; Siddiqi, H.; Uribe, K.; Ostolaza, H.; Martín, C. Pathophysiology of Type 2 Diabetes Mellitus. Int. J. Mol. Sci. 2020, 21, 6275. [Google Scholar] [CrossRef]
  28. Czyżyk, A.; Szczepanik, Z. Diabetes mellitus and cancer. Eur. J. Intern. Med. 2000, 11, 245–252. [Google Scholar] [CrossRef] [PubMed] [Green Version]
  29. Larsson, S.C.; Mantzoros, C.S.; Wolk, A. Diabetes mellitus and risk of breast cancer: A meta-analysis. Int. J. Cancer 2007, 121, 856–862. [Google Scholar] [CrossRef] [PubMed]
  30. Chen, H.F.; Liu, M.D.; Chen, P.; Chen, L.H.; Chang, Y.H.; Wen, P.C.; Li, C.Y. Risks of Breast and Endometrial Cancer in Women with Diabetes: A Population-Based Cohort Study. PLoS ONE 2013, 8, e67420. [Google Scholar] [CrossRef] [Green Version]
  31. Wang, L.; Wang, L.; Zhang, J.; Wang, B.; Liu, H. Association between diabetes mellitus and subsequent ovarian cancer in women. Medicine 2017, 96, e6396. [Google Scholar] [CrossRef]
  32. Friedenreich, C.M. Review of anthropometric factors and breast cancer risk. Eur. J. Cancer Prev. 2001, 10, 15–32. [Google Scholar] [CrossRef] [PubMed]
  33. Risch, H.A. Hormonal Etiology of Epithelial Ovarian Cancer, with a Hypothesis Concerning the Role of Androgens and Progesterone. JNCI J. Natl. Cancer Inst. 1998, 90, 1774–1786. [Google Scholar] [CrossRef] [PubMed]
  34. Sciacca, L.; Costantino, A.; Pandini, G.; Mineo, R.; Frasca, F.; Scalia, P.; Sbraccia, P.; Goldfine, I.D.; Vigneri, R.; Belfiore, A. Insulin receptor activation by IGF-II in breast cancers: Evidence for a new autocrine/paracrine mechanism. Oncogene 1999, 18, 2471–2479. [Google Scholar] [CrossRef]
  35. Shen, M.-R.; Lin, A.-C.; Hsu, Y.-M.; Chang, T.-J.; Tang, M.-J.; Alper, S.L.; Ellory, J.C.; Chou, C.-Y. Insulin-like Growth Factor 1 Stimulates KCl Cotransport, Which Is Necessary for Invasion and Proliferation of Cervical Cancer and Ovarian Cancer Cells. J. Biol. Chem. 2004, 279, 40017–40025. [Google Scholar] [CrossRef] [PubMed] [Green Version]
  36. Vona-Davis, L.; Rose, D.P. Type 2 Diabetes and Obesity Metabolic Interactions: Common Factors for Breast Cancer Risk and Novel Approaches to Prevention and Therapy. Curr. Diabetes Rev. 2012, 8, 116–130. [Google Scholar] [CrossRef] [PubMed]
  37. Kim, R.P.; Edelman, S.V.; Kim, D.D. Musculoskeletal Complications of Diabetes Mellitus. Clin. Diabetes 2001, 19, 132–135. [Google Scholar] [CrossRef] [Green Version]
  38. Davey, J.S.; Carmichael, R.E.; Craig, T.J. Protein SUMOylation regulates insulin secretion at multiple stages. Sci. Rep. 2019, 9, 2895. [Google Scholar] [CrossRef] [Green Version]
  39. Strycharz, J.; Drzewoski, J.; Szemraj, J.; Sliwinska, A. Is p53 Involved in Tissue-Specific Insulin Resistance Formation? Oxid. Med. Cell. Longev. 2017, 2017, 9270549. [Google Scholar] [CrossRef] [Green Version]
  40. Shirakawa, J.; Fernandez, M.; Takatani, T.; el Ouaamari, A.; Jungtrakoon, P.; Okawa, E.R.; Zhang, W.; Yi, P.; Doria, A.; Kulkarni, R.N. Insulin Signaling Regulates the FoxM1/PLK1/CENP-A Pathway to Promote Adaptive Pancreatic β Cell Proliferation. Cell Metab. 2017, 25, 868–882.e5. [Google Scholar] [CrossRef] [Green Version]
  41. Zhao, L.; Zou, Y.; Liu, F. Transforming Growth Factor-Beta1 in Diabetic Kidney Disease. Front. Cell Dev. Biol. 2020, 8, 187. [Google Scholar] [CrossRef] [Green Version]
  42. Yamauchi, T.; Ohnaka, K.; Takayanagi, R.; Umeda, F.; Nawata, H. Enhanced secretion of endothelin-1 by elevated glucose levels from cultured bovine aortic endothelial cells. FEBS Lett. 1990, 267, 16–18. [Google Scholar] [CrossRef] [PubMed] [Green Version]
  43. Anguiano, L.; Riera, M.; Pascual, J.; Soler, M. Endothelin Blockade in Diabetic Kidney Disease. J. Clin. Med. 2015, 4, 1171–1192. [Google Scholar] [CrossRef] [Green Version]
  44. Bego, T.; Čaušević, A.; Dujić, T.; Malenica, M.; Asimi, Z.V.; Prnjavorac, B.; Marc, J.; Nekvindová, J.; Palička, V.; Semiz, S. Association of FTO gene variant (rs8050136) with type 2 diabetes and markers of obesity, glycaemic control and inflammation. J. Med. Biochem. 2019, 38, 153–163. [Google Scholar] [CrossRef] [Green Version]
  45. Gutiérrez-Salmerón, M.; Lucena, S.R.; Chocarro-Calvo, A.; García-Martínez, J.M.; Martín Orozco, R.M.; García-Jiménez, C. Metabolic and hormonal remodeling of colorectal cancer cell signalling by diabetes. Endocr. Relat. Cancer 2021, 28, R191–R206. [Google Scholar] [CrossRef] [PubMed]
  46. Santinon, G.; Pocaterra, A.; Dupont, S. Control of YAP/TAZ Activity by Metabolic and Nutrient-Sensing Pathways. Trends Cell Biol. 2016, 26, 289–299. [Google Scholar] [CrossRef] [PubMed]
  47. Chocarro-Calvo, A.; García-Martínez, J.M.; Ardila-González, S.; De la Vieja, A.; García-Jiménez, C. Glucose-Induced β-Catenin Acetylation Enhances Wnt Signaling in Cancer. Mol. Cell 2013, 49, 474–486. [Google Scholar] [CrossRef] [Green Version]
  48. González, N.; Prieto, I.; del Puerto-Nevado, L.; Portal-Nuñez, S.; Ardura, J.A.; Corton, M.; Fernández-Fernández, B.; Aguilera, O.; Gomez-Guerrero, C.; Mas, S.; et al. 2017 update on the relationship between diabetes and colorectal cancer: Epidemiology, potential molecular mechanisms and therapeutic implications. Oncotarget 2017, 8, 18456–18485. [Google Scholar] [CrossRef] [Green Version]
  49. Mitroi, A.F.; Leopa, N.; Dumitru, E.; Brînzan, C.; Tocia, C.; Dumitru, A.; Popescu, R.C. Association of TCF7L2, CASC8 and GREM1 Polymorphisms in Patients with Colorectal Cancer and Type II Diabetes Mellitus. Genes 2022, 13, 1297. [Google Scholar] [CrossRef]
  50. Peng, S.; Zhu, Y.; Lü, B.; Xu, F.; Li, X.; Lai, M. TCF7L2 gene polymorphisms and type 2 diabetes risk: A comprehensive and updated meta-analysis involving 121 174 subjects. Mutagenesis 2013, 28, 25–37. [Google Scholar] [CrossRef] [Green Version]
  51. Sainz, J.; Rudolph, A.; Hoffmeister, M.; Frank, B.; Brenner, H.; Chang-Claude, J.; Hemminki, K.; Försti, A. Effect of Type 2 Diabetes Predisposing Genetic Variants on Colorectal Cancer Risk. J. Clin. Endocrinol. Metab. 2012, 97, E845–E851. [Google Scholar] [CrossRef] [Green Version]
  52. Cheng, I.; Caberto, C.P.; Lum-Jones, A.; Seifried, A.; Wilkens, L.R.; Schumacher, F.; Monroe, K.R.; Lim, U.; Tiirikainen, M.; Kolonel, L.N.; et al. Type 2 diabetes risk variants and colorectal cancer risk: The Multiethnic Cohort and PAGE studies. Gut 2011, 60, 1703–1711. [Google Scholar] [CrossRef] [PubMed]
  53. Huang, Q.; Yin, J.; Dai, X.; Pei, Q.; Dong, M.; Zhou, Z.; Huang, X.; Yu, M.; Zhou, H.; Liu, Z. IGF2BP2 variations influence repaglinide response and risk of type 2 diabetes in Chinese population. Acta Pharmacol. Sin. 2010, 31, 709–717. [Google Scholar] [CrossRef] [PubMed]
  54. Shokouhi, S.; Delpisheh, A.; Haghani, K.; Mahdizadeh, M.; Bakhtiyari, S. Association of rs7903146, rs12255372, and rs290487 Polymorphisms in TCF7L2 Gene with Type 2 Diabetes in an Iranian Kurdish Ethnic Group. Clin. Lab. 2014, 60, 1269–1276. [Google Scholar] [CrossRef] [PubMed] [Green Version]
  55. Albegali, A.A.; Shahzad, M.; Mahmood, S.; Ullah, M.I. Genetic association of insulin receptor substrate-1 (IRS-1, rs1801278) gene with insulin resistant of type 2 diabetes mellitus in a Pakistani population. Mol. Biol. Rep. 2019, 46, 6065–6070. [Google Scholar] [CrossRef] [PubMed]
  56. Zhang, D.; Zhang, X.; Liu, D.; Liu, T.; Cai, W.; Yan, C.; Han, Y. Association between insulin receptor substrate-1 polymorphisms and high platelet reactivity with clopidogrel therapy in coronary artery disease patients with type 2 diabetes mellitus. Cardiovasc. Diabetol. 2016, 15, 50. [Google Scholar] [CrossRef] [Green Version]
  57. Esposito, D.L.; Aru, F.; Lattanzio, R.; Morgano, A.; Abbondanza, M.; Malekzadeh, R.; Bishehsari, F.; Valanzano, R.; Russo, A.; Piantelli, M.; et al. The Insulin Receptor Substrate 1 (Irs1) in Intestinal Epithelial Differentiation and in Colorectal Cancer. PLoS ONE 2012, 7, e36190. [Google Scholar] [CrossRef] [Green Version]
  58. Dearth, R.K.; Cui, X.; Kim, H.J.; Hadsell, D.L.; Lee, A.V. Oncogenic Transformation by the Signaling Adaptor Proteins Insulin Receptor Substrate (IRS)-1 and IRS-2. Cell Cycle 2007, 6, 705–713. [Google Scholar] [CrossRef] [PubMed]
  59. Yang, L.; Zhang, B.; Wang, X.; Liu, Z.; Li, J.; Zhang, S.; Gu, X.; Jia, M.; Guo, H.; Feng, N.; et al. P53/PANK1/miR-107 signalling pathway spans the gap between metabolic reprogramming and insulin resistance induced by high-fat diet. J. Cell. Mol. Med. 2020, 24, 3611–3624. [Google Scholar] [CrossRef] [Green Version]
  60. De Gonzalo-Calvo, D.; van der Meer, R.W.; Rijzewijk, L.J.; Smit, J.W.A.; Revuelta-Lopez, E.; Nasarre, L.; Escola-Gil, J.C.; Lamb, H.J.; Llorente-Cortes, V. Serum microRNA-1 and microRNA-133a levels reflect myocardial steatosis in uncomplicated type 2 diabetes. Sci. Rep. 2017, 7, 47. [Google Scholar] [CrossRef] [PubMed]
  61. Di Mauro, V.; Crasto, S.; Colombo, F.S.; di Pasquale, E.; Catalucci, D. Wnt signalling mediates miR-133a nuclear re-localization for the transcriptional control of Dnmt3b in cardiac cells. Sci. Rep. 2019, 9, 9320. [Google Scholar] [CrossRef] [Green Version]
  62. Hua, Y.T.; Xu, W.X.; Li, H.; Xia, M. Emerging roles of MiR-133a in human cancers. J. Cancer 2021, 12, 198–206. [Google Scholar] [CrossRef] [PubMed]
  63. Li, X. miR-375, a microRNA related to diabetes. Gene 2014, 533, 1–4. [Google Scholar] [CrossRef] [PubMed]
  64. Sedgeman, L.R.; Beysen, C.; Solano, M.A.R.; Michell, D.L.; Sheng, Q.; Zhao, S.; Turner, S.; Linton, M.F.; Vickers, K.C. Beta cell secretion of miR-375 to HDL is inversely associated with insulin secretion. Sci. Rep. 2019, 9, 3803. [Google Scholar] [CrossRef] [PubMed] [Green Version]
  65. Wei, J.; Lu, Y.; Wang, R.; Xu, X.; Liu, Q.; He, S.; Pan, H.; Liu, X.; Yuan, B.; Ding, Y.; et al. MicroRNA-375: Potential cancer suppressor and therapeutic drug. Biosci. Rep. 2021, 41, BSR20211494. [Google Scholar] [CrossRef] [PubMed]
  66. Du, H.; Zhao, Y.; Yin, Z.; Wang, D.W.; Chen, C. The role of miR-320 in glucose and lipid metabolism disorder-associated diseases. Int. J. Biol. Sci. 2021, 17, 402–416. [Google Scholar] [CrossRef] [PubMed]
  67. Du, H.; Yin, Z.; Zhao, Y.; Li, H.; Dai, B.; Fan, J.; He, M.; Nie, X.; Wang, C.-Y.; Wang, D.W.; et al. miR-320a induces pancreatic β cells dysfunction in diabetes by inhibiting MafF. Mol. Ther. Nucleic Acids 2021, 26, 444–457. [Google Scholar] [CrossRef]
  68. Wan, C.; Wen, J.; Liang, X.; Xie, Q.; Wu, W.; Wu, M.; Liu, Z. Identification of miR-320 family members as potential diagnostic and prognostic biomarkers in myelodysplastic syndromes. Sci. Rep. 2021, 11, 183. [Google Scholar] [CrossRef]
  69. Al-Saleh, Y.; Sabico, S.; Al-Furqani, A.; Jayyousi, A.; Alromaihi, D.; Ba-Essa, E.; Alawadi, F.; Alkaabi, J.; Hassanein, M.; Al-Sifri, S.; et al. Sulfonylureas in the Current Practice of Type 2 Diabetes Management: Are They All the Same? Consensus from the Gulf Cooperation Council (GCC) Countries Advisory Board on Sulfonylureas. Diabetes Ther. 2021, 12, 2115–2132. [Google Scholar] [CrossRef]
  70. May, M.; Schindler, C. Clinically and pharmacologically relevant interactions of antidiabetic drugs. Ther. Adv. Endocrinol. Metab. 2016, 7, 69–83. [Google Scholar] [CrossRef] [Green Version]
  71. Holstein, A.; Beil, W.; Kovacs, P. CYP2C metabolism of oral antidiabetic drugs—Impact on pharmacokinetics, drug interactions and pharmacogenetic aspects. Expert Opin. Drug Metab. Toxicol. 2012, 8, 1549–1563. [Google Scholar] [CrossRef]
  72. Holstein, A.; Beil, W. Oral antidiabetic drug metabolism: Pharmacogenomics and drug interactions. Expert Opin. Drug Metab. Toxicol. 2009, 5, 225–241. [Google Scholar] [CrossRef] [PubMed]
  73. Tornio, A.; Niemi, M.; Neuvonen, P.J.; Backman, J.T. Drug interactions with oral antidiabetic agents: Pharmacokinetic mechanisms and clinical implications. Trends Pharmacol. Sci. 2012, 33, 312–322. [Google Scholar] [CrossRef] [PubMed]
  74. Parekh, T.M.; Raji, M.; Lin, Y.L.; Tan, A.; Kuo, Y.F.; Goodwin, J.S. Hypoglycemia After Antimicrobial Drug Prescription for Older Patients Using Sulfonylureas. JAMA Intern. Med. 2014, 174, 1605–1612. [Google Scholar] [CrossRef] [Green Version]
  75. Tirkkonen, T.; Heikkilä, P.; Huupponen, R.; Laine, K. Potential CYP2C9-mediated drug-drug interactions in hospitalized type 2 diabetes mellitus patients treated with the sulphonylureas glibenclamide, glimepiride or glipizide. J. Intern. Med. 2010, 268, 359–366. [Google Scholar] [CrossRef]
  76. Zu Schwabedissen, H.E.M.; Boettcher, K.; Steiner, T.; Schwarz, U.I.; Keiser, M.; Kroemer, H.K.; Siegmund, W. OATP1B3 is expressed in pancreatic β-islet cells and enhances the insulinotropic effect of the sulfonylurea derivative glibenclamide. Diabetes 2014, 63, 775–784. [Google Scholar] [CrossRef] [PubMed] [Green Version]
  77. Scheen, A.J. Dipeptidylpeptidase-4 inhibitors (gliptins): Focus on drug-drug interactions. Clin. Pharmacokinet. 2010, 49, 573–588. [Google Scholar] [CrossRef] [PubMed]
  78. Lao, B.; Czyzyk, A.; Szutowski, M.; Szczepanik, Z. Alcohol tolerance in patients with non-insulin-dependent (type 2) diabetes treated with sulphonylurea derivatives. Arzneimittelforschung 1994, 44, 727–734. [Google Scholar]
  79. Amin, M.; Suksomboon, N. Pharmacotherapy of Type 2 Diabetes Mellitus: An Update on Drug–Drug Interactions. Drug Saf. 2014, 37, 903–919. [Google Scholar] [CrossRef]
  80. Pakkir Maideen, N.M.; Manavalan, G.; Balasubramanian, K. Drug interactions of meglitinide antidiabetics involving CYP enzymes and OATP1B1 transporter. Ther. Adv. Endocrinol. Metab. 2018, 9, 259–268. [Google Scholar] [CrossRef] [Green Version]
  81. Niemi, M.; Backman, J.T.; Neuvonen, M.; Neuvonen, P.J.; Kivistö, K.T. Rifampin decreases the plasma concentrations and effects of repaglinide. Clin. Pharmacol. Ther. 2000, 68, 495–500. [Google Scholar] [CrossRef]
  82. Hatorp, V.; Hansen, K.T.; Thomsen, M.S. Influence of Drugs Interacting with CYP3A4 on the Pharmacokinetics, Pharmacodynamics, and Safety of the Prandial Glucose Regulator Repaglinide. J. Clin. Pharmacol. 2003, 43, 649–660. [Google Scholar] [CrossRef]
  83. Niemi, M.; Neuvonen, P.J.; Kivistö, K.T. The cytochrome P4503A4 inhibitor clarithromycin increases the plasma concentrations and effects of repaglinide. Clin. Pharmacol. Ther. 2001, 70, 58–65. [Google Scholar] [CrossRef]
  84. Kim, S.-J.; Yoshikado, T.; Ieiri, I.; Maeda, K.; Kimura, M.; Irie, S.; Kusuhara, H.; Sugiyama, Y. Clarification of the Mechanism of Clopidogrel-Mediated Drug–Drug Interaction in a Clinical Cassette Small-dose Study and Its Prediction Based on In Vitro Information. Drug Metab. Dispos. 2016, 44, 1622–1632. [Google Scholar] [CrossRef] [PubMed] [Green Version]
  85. Milner, Z.; Akhondi, H. Repaglinide. In xPharm: The Comprehensive Pharmacology Reference; StatPearls: Orlando, FL, USA, 2021; pp. 1–3. [Google Scholar]
  86. Rang, H.; Dale, M. Rang and Dale’s Pharmacology, 7th ed.; Elsevier Churchill Livingstone: Edinburgh, UK, 2012. [Google Scholar]
  87. Niemi, M.; Backman, J.T.; Neuvonen, M.; Neuvonen, P.J. Effects of gemfibrozil, itraconazole, and their combination on the pharmacokinetics and pharmacodynamics of repaglinide: Potentially hazardous interaction between gemfibrozil and repaglinide. Diabetologia 2003, 46, 347–351. [Google Scholar] [CrossRef] [PubMed]
  88. Wang, Z.; Chen, M.; Zhu, L.; Yu, L.; Zeng, S.; Xiang, M.; Zhou, Q. Pharmacokinetic drug interactions with clopidogrel: Updated review and risk management in combination therapy. Ther. Clin. Risk Manag. 2015, 11, 449–467. [Google Scholar] [PubMed] [Green Version]
  89. Scheen, A.J. Clinical Pharmacokinetics of Metformin. Clin. Pharmacokinet. 1996, 30, 359–371. [Google Scholar] [CrossRef] [PubMed]
  90. Rena, G.; Hardie, D.G.; Pearson, E.R. The mechanisms of action of metformin. Diabetologia 2017, 60, 1577–1585. [Google Scholar] [CrossRef] [PubMed] [Green Version]
  91. Hibma, J.E.; Zur, A.A.; Castro, R.A.; Wittwer, M.B.; Keizer, R.J.; Yee, S.W.; Goswami, S.; Stocker, S.L.; Zhang, X.; Huang, Y.; et al. The Effect of Famotidine, a MATE1-Selective Inhibitor, on the Pharmacokinetics and Pharmacodynamics of Metformin. Clin. Pharmacokinet. 2016, 55, 711–721. [Google Scholar] [CrossRef] [Green Version]
  92. Seo, J.H.; Lee, D.Y.; Hong, C.W.; Lee, I.H.; Ahn, K.S.; Kang, G.W. Severe lactic acidosis and acute pancreatitis associated with cimetidine in a patient with type 2 diabetes mellitus taking metformin. Intern. Med. 2013, 52, 2245–2248. [Google Scholar] [CrossRef] [Green Version]
  93. Wang, Z.J.; Yin, O.Q.P.; Tomlinson, B.; Chow, M.S.S. OCT2 polymorphisms and in-vivo renal functional consequence: Studies with metformin and cimetidine. Pharmacogenet. Genom. 2008, 18, 637–645. [Google Scholar] [CrossRef]
  94. Ahlin, G.; Chen, L.; Lazorova, L.; Chen, Y.; Ianculescu, A.G.; Davis, R.L.; Giacomini, K.M.; Artursson, P. Genotype-dependent effects of inhibitors of the organic cation transporter, OCT1: Predictions of metformin interactions. Pharm. J. 2010, 11, 400–411. [Google Scholar] [CrossRef]
  95. Grün, B.; Kiessling, M.K.; Burhenne, J.; Riedel, K.-D.; Weiss, J.; Rauch, G.; Haefeli, W.E.; Czock, D. Trimethoprim–metformin interaction and its genetic modulation by OCT2 and MATE1 transporters. Br. J. Clin. Pharmacol. 2013, 76, 787–796. [Google Scholar] [CrossRef] [Green Version]
  96. Kim, A.; Chung, I.; Yoon, S.H.; Yu, K.-S.; Lim, K.S.; Cho, J.-Y.; Lee, H.; Jang, I.-J.; Chung, J.Y. Effects of proton pump inhibitors on metformin pharmacokinetics and pharmacodynamics. Drug Metab. Dispos. 2014, 42, 1174–1179. [Google Scholar] [CrossRef] [Green Version]
  97. Herrmann, W.; Obeid, R. Ursachen und frühzeitige diagnostik von vitamin-B12-mangel. Dtsch. Arztebl. 2008, 105, 680–685. [Google Scholar]
  98. Sheleme, T. Clinical Pharmacokinetics of Metformin. In Metformin—Pharmacology and Drug Interactions; IntechOpen: London, UK, 2021. [Google Scholar]
  99. Zack, J.; Berg, J.; Juan, A.; Pannacciulli, N.; Allard, M.; Gottwald, M.; Zhang, H.; Shao, Y.; Ben-Yehuda, O.; Jochelson, P. Pharmacokinetic drug-drug interaction study of ranolazine and metformin in subjects with type 2 diabetes mellitus. Clin. Pharmacol. Drug Dev. 2015, 4, 121–129. [Google Scholar] [CrossRef] [PubMed]
  100. Ma, Y.-R.; Shi, A.-X.; Qin, H.-Y.; Zhang, T.; Wu, Y.-F.; Zhang, G.-Q.; Wu, X.-A. Metoprolol decreases the plasma exposure of metformin via the induction of liver, kidney and muscle uptake in rats. Biopharm. Drug Dispos. 2016, 37, 511–521. [Google Scholar] [CrossRef] [PubMed]
  101. Maideen, N.M.P.; Jumale, A.; Balasubramaniam, R. Drug Interactions of Metformin Involving Drug Transporter Proteins. Adv. Pharm. Bull. 2017, 7, 501–505. [Google Scholar] [CrossRef] [PubMed] [Green Version]
  102. Long, A.N.; Atwell, C.L.; Yoo, W.; Solomon, S.S. Vitamin B12 Deficiency Associated with Concomitant Metformin and Proton Pump Inhibitor Use. Diabetes Care 2012, 35, e84. [Google Scholar] [CrossRef] [Green Version]
  103. Stage, T.B.; Brøsen, K.; Christensen, M.M.H. A Comprehensive Review of Drug–Drug Interactions with Metformin. Clin. Pharmacokinet. 2015, 54, 811–824. [Google Scholar] [CrossRef]
  104. Dujic, T.; Zhou, K.; Donnelly, L.A.; Tavendale, R.; Palmer, C.N.A.; Pearson, E.R. Association of Organic Cation Transporter 1 With Intolerance to Metformin in Type 2 Diabetes: A GoDARTS Study. Diabetes 2015, 64, 1786–1793. [Google Scholar] [CrossRef] [Green Version]
  105. Davidson, M.A.; Mattison, D.R.; Azoulay, L.; Krewski, D. Thiazolidinedione drugs in the treatment of type 2 diabetes mellitus: Past, present and future. Crit. Rev. Toxicol. 2017, 48, 52–108. [Google Scholar] [CrossRef]
  106. Jaakkola, T.; Backman, J.T.; Neuvonen, M.; Neuvonen, P.J. Effects of Gemfibrozil, Itraconazole, and Their Combination on the Pharmacokinetics of Pioglitazone. Clin. Pharmacol. Ther. 2005, 77, 404–414. [Google Scholar] [CrossRef]
  107. Ledl, M.; Hohenecker, J.; Francesconi, C.; Roots, I.; Bauer, M.F.; Roden, M. Acute myopathy in a type 2 diabetic patient on combination therapy with metformin, fenofibrate and rosiglitazone. Diabetologia 2005, 48, 1996–1998. [Google Scholar] [CrossRef] [Green Version]
  108. Park, J.Y.; Kim, K.A.; Shin, J.G.; Lee, K.Y. Effect of ketoconazole on the pharmacokinetics of rosiglitazone in healthy subjects. Br. J. Clin. Pharmacol. 2004, 58, 397–402. [Google Scholar] [CrossRef] [Green Version]
  109. Jaakkola, T.; Backman, J.T.; Neuvonen, M.; Laitila, J.; Neuvonen, P.J. Effect of rifampicin on the pharmacokinetics of pioglitazone. Br. J. Clin. Pharmacol. 2006, 61, 70–78. [Google Scholar] [CrossRef] [PubMed]
  110. Park, J.Y.; Kim, K.A.; Kang, M.H.; Kim, S.L.; Shin, J.G. Effect of Rifampin on the Pharmacokinetics of Rosiglitazone in Healthy Subjects. Clin. Pharmacol. Ther. 2004, 75, 157–162. [Google Scholar] [CrossRef]
  111. Omar, B.A.; Vikman, J.; Winzell, M.S.; Voss, U.; Ekblad, E.; Foley, J.E.; Ahrén, B. Enhanced beta cell function and anti-inflammatory effect after chronic treatment with the dipeptidyl peptidase-4 inhibitor vildagliptin in an advanced-aged diet-induced obesity mouse model. Diabetologia 2013, 56, 1752–1760. [Google Scholar] [CrossRef] [PubMed]
  112. Drucker, D.J.; Nauck, M.A. The incretin system: Glucagon-like peptide-1 receptor agonists and dipeptidyl peptidase-4 inhibitors in type 2 diabetes. Lancet 2006, 368, 1696–1705. [Google Scholar] [CrossRef]
  113. American Diabetes Association. Standards of Medical Care in Diabetes—2010. Diabetes Care 2010, 33 (Suppl. S1), S11–S61. [Google Scholar] [CrossRef] [PubMed] [Green Version]
  114. Zerilli, T.; Pyon, E.Y. Sitagliptin phosphate: A DPP-4 inhibitor for the treatment of type 2 diabetes mellitus. Clin. Ther. 2007, 29, 2614–2634. [Google Scholar] [CrossRef] [PubMed]
  115. Krishna, R.; Bergman, A.; Larson, P.; Cote, J.; Lasseter, K.; Dilzer, S.; Wang, A.; Zeng, W.; Chen, L.; Wagner, J.; et al. Effect of a single cyclosporine dose on the single-dose pharmacokinetics of sitagliptin (MK-0431), a dipeptidyl peptidase-4 inhibitor, in healthy male subjects. J. Clin. Pharmacol. 2007, 47, 165–174. [Google Scholar] [CrossRef]
  116. Mistry, G.C.; Bergman, A.J.; Zheng, W.; Hreniuk, D.; Zinny, M.A.; Gottesdiener, K.M.; Wagner, J.A.; Herman, G.A.; Ruddy, M. Sitagliptin, an dipeptidyl peptidase-4 inhibitor, does not alter the pharmacokinetics of the sulphonylurea, glyburide, in healthy subjects. Br. J. Clin. Pharmacol. 2008, 66, 36–42. [Google Scholar] [CrossRef] [Green Version]
  117. Kao, D.P.; Kohrt, H.E.; Kugler, J. Renal failure and rhabdomyolysis associated with sitagliptin and simvastatin use. Diabet. Med. 2008, 25, 1229–1230. [Google Scholar] [CrossRef] [PubMed]
  118. Serra, D.; He, Y.L.; Bullock, J.; Riviere, G.J.; Balez, S.; Schwartz, S.; Wang, Y.; Ligueros-Saylan, M.; Jarugula, V.; Dole, W.P. Evaluation of pharmacokinetic and pharmacodynamic interaction between the dipeptidyl peptidase IV inhibitor vildagliptin, glyburide and pioglitazone in patients with Type 2 diabetes. Int. J. Clin. Pharmacol. Ther. 2008, 46, 349–364. [Google Scholar] [CrossRef]
  119. Ayalasomayajula, S.; Dole, K.; He, Y.-L.; Ligueros-Saylan, M.; Wang, Y.; Campestrini, J.; Humbert, H.; Sunkara, G. Evaluation of the potential for steady-state pharmacokinetic interaction between vildagliptin and simvastatin in healthy subjects. Curr. Med. Res. Opin. 2007, 23, 2913–2920. [Google Scholar] [CrossRef]
  120. He, Y.-L.; Sabo, R.; Sunkara, G.; Bizot, M.-N.; Riviere, G.-J.; Leon, S.; Ligueros-Saylan, M.; Dole, W.P.; Howard, D. Evaluation of Pharmacokinetic Interactions Between Vildagliptin and Digoxin in Healthy Volunteers. J. Clin. Pharmacol. 2007, 47, 998–1004. [Google Scholar] [CrossRef] [PubMed]
  121. Brown, N.J.; Byiers, S.; Carr, D.; Maldonado, M.; Warner, B.A. Dipeptidyl peptidase-IV inhibitor use associated with increased risk of ACE inhibitor-associated angioedema. Hypertension 2009, 54, 516–523. [Google Scholar] [CrossRef] [Green Version]
  122. Graefe-Mody, E.; Brand, T.; Ring, A.; Withopf, B.; Stangier, J.; Iovino, M.; Woerle, H.-J. Effect of linagliptin on the pharmacokinetics and pharmacodynamics of warfarin in healthy volunteers. Int. J. Clin. Pharmacol. Ther. 2011, 49, 300–310. [Google Scholar] [CrossRef]
  123. Teng, R.; Butler, K. Effect of the CYP3A inhibitors, diltiazem and ketoconazole, on ticagrelor pharmacokinetics in healthy volunteers. J. Drug Assess. 2013, 2, 30–39. [Google Scholar] [CrossRef] [Green Version]
  124. Patel, C.G.; Li, L.; Girgis, S.; Kornhauser, D.M.; Frevert, E.U.; Boulton, D.W. Two-way pharmacokinetic interaction studies between saxagliptin and cytochrome P450 substrates or inhibitors: Simvastatin, diltiazem extended-release, and ketoconazole. Clin. Pharmacol. 2011, 3, 13–25. [Google Scholar] [CrossRef] [PubMed] [Green Version]
  125. Drucker, D.J. Mechanisms of Action and Therapeutic Application of Glucagon-like Peptide-1. Cell Metab 2018, 27, 740–756. [Google Scholar] [CrossRef] [Green Version]
  126. Davies, M.J.; Aroda, V.R.; Collins, B.S.; Gabbay, R.A.; Green, J.; Maruthur, N.M.; Rosas, S.E.; Del Prato, S.; Mathieu, C.; Mingrone, G.; et al. Management of Hyperglycemia in Type 2 Diabetes, 2022. A Consensus Report by the American Diabetes Association (ADA) and the European Association for the Study of Diabetes (EASD). Diabetes Care 2022, 45, 2753–2786. [Google Scholar] [CrossRef] [PubMed]
  127. Kalra, S.; Baruah, M.P.; Sahay, R.K.; Unnikrishnan, A.G.; Uppal, S.; Adetunji, O. Glucagon-like peptide-1 receptor agonists in the treatment of type 2 diabetes: Past, present, and future. Indian J. Endocrinol. Metab. 2016, 20, 254–267. [Google Scholar] [PubMed]
  128. Garber, A.J. Long-Acting Glucagon-Like Peptide 1 Receptor Agonists: A review of their efficacy and tolerability. Diabetes Care 2011, 34 (Suppl. S2), S279–S284. [Google Scholar] [CrossRef] [PubMed] [Green Version]
  129. Hinnen, D. Glucagon-Like Peptide 1 Receptor Agonists for Type 2 Diabetes. Diabetes Spectr. 2017, 30, 202–210. [Google Scholar] [CrossRef] [Green Version]
  130. Saraiva, F.K.; Sposito, A.C. Cardiovascular effects of glucagon-like peptide 1 (GLP-1) receptor agonists. Cardiovasc. Diabetol. 2014, 13, 142. [Google Scholar] [CrossRef] [Green Version]
  131. Htike, Z.Z.; Zaccardi, F.; Papamargaritis, D.; Webb, D.R.; Khunti, K.; Davies, M.J. Efficacy and safety of glucagon-like peptide-1 receptor agonists in type 2 diabetes: A systematic review and mixed-treatment comparison analysis. Diabetes Obes. Metab. 2017, 19, 524–536. [Google Scholar] [CrossRef] [Green Version]
  132. Singh, S.; Chang, H.Y.; Richards, T.M.; Weiner, J.P.; Clark, J.M.; Segal, J.B. Glucagonlike peptide 1-based therapies and risk of hospitalization for acute pancreatitis in type 2 diabetes mellitus: A population-based matched case-control study. JAMA Intern. Med. 2013, 173, 534–539. [Google Scholar] [CrossRef] [Green Version]
  133. Blase, E.; Taylor, K.; Gao, H.Y.; Wintle, M.; Fineman, M. Pharmacokinetics of an oral drug (acetaminophen) administered at various times in relation to subcutaneous injection of exenatide (exendin-4) in healthy subjects. J. Clin. Pharmacol. 2005, 45, 570–577. [Google Scholar] [CrossRef]
  134. Hurren, K.M.; Pinelli, N.R. Drug-drug interactions with glucagon-like peptide-1 receptor agonists. Ann. Pharmacother. 2012, 46, 710–717. [Google Scholar] [CrossRef]
  135. Kapitza, C.; Zdravkovic, M.; Hindsberger, C.; Flint, A. The effect of the once-daily human glucagon-like peptide 1 analog liraglutide on the pharmacokinetics of acetaminophen. Adv. Ther. 2011, 28, 650–660. [Google Scholar] [CrossRef] [PubMed]
  136. Hausner, H.; Karsbøl, J.D.; Holst, A.G.; Jacobsen, J.B.; Wagner, F.-D.; Golor, G.; Anderson, T.W. Effect of Semaglutide on the Pharmacokinetics of Metformin, Warfarin, Atorvastatin and Digoxin in Healthy Subjects. Clin. Pharmacokinet. 2017, 56, 1391–1401. [Google Scholar] [CrossRef] [PubMed] [Green Version]
  137. Filippatos, T.D.; Panagiotopoulou, T.V.; Elisaf, M.S. Adverse Effects of GLP-1 Receptor Agonists. Rev. Diabet. Stud. 2014, 11, 202–230. [Google Scholar] [CrossRef] [Green Version]
  138. Malm-Erjefält, M.; Ekblom, M.; Vouis, J.; Zdravkovic, M.; Lennernäs, H. Effect on the Gastrointestinal Absorption of Drugs from Different Classes in the Biopharmaceutics Classification System, When Treating with Liraglutide. Mol. Pharm. 2015, 12, 4166–4173. [Google Scholar] [CrossRef] [PubMed]
  139. De la Peña, A.; Cui, X.; Geiser, J.; Loghin, C. No Dose Adjustment is Recommended for Digoxin, Warfarin, Atorvastatin or a Combination Oral Contraceptive When Coadministered with Dulaglutide. Clin. Pharmacokinet. 2017, 56, 1415–1427. [Google Scholar] [CrossRef]
  140. Petersen, A.B.; Knop, F.K.; Christensen, M. Lixisenatide for the treatment of type 2 diabetes. Drugs Today 2013, 49, 537–553. [Google Scholar] [CrossRef]
  141. Hsia, D.S.; Grove, O.; Cefalu, W.T. An Update on SGLT2 Inhibitors for the Treatment of Diabetes Mellitus. Curr. Opin. Endocrinol. Diabetes Obes. 2017, 24, 73–79. [Google Scholar]
  142. Joshi, S.S.; Singh, T.; Newby, D.E.; Singh, J.; Shruti, D.; Joshi, S. Sodium-glucose co-transporter 2 inhibitor therapy: Mechanisms of action in heart failure. Heart 2021, 107, 1032–1038. [Google Scholar] [CrossRef]
  143. Tentolouris, A.; Vlachakis, P.; Tzeravini, E.; Eleftheriadou, I.; Tentolouris, N. SGLT2 Inhibitors: A Review of Their Antidiabetic and Cardioprotective Effects. Int. J. Environ. Res. Public Health 2019, 16, 2965. [Google Scholar] [CrossRef] [Green Version]
  144. Kasichayanula, S.; Liu, X.; Shyu, W.C.; Zhang, W.; Pfister, M.; Griffen, S.C.; Li, T.; LaCreta, F.P.; Boulton, D.W. Lack of pharmacokinetic interaction between dapagliflozin, a novel sodium-glucose transporter 2 inhibitor, and metformin, pioglitazone, glimepiride or sitagliptin in healthy subjects. Diabetes Obes. Metab. 2011, 13, 47–54. [Google Scholar] [CrossRef]
  145. Strojek, K.; Yoon, K.H.; Hruba, V.; Elze, M.; Langkilde, A.M.; Parikh, S. Effect of dapagliflozin in patients with type 2 diabetes who have inadequate glycaemic control with glimepiride: A randomized, 24-week, double-blind, placebo-controlled trial. Diabetes Obes. Metab. 2011, 13, 928–938. [Google Scholar] [CrossRef] [PubMed]
  146. Kasichayanula, S.; Liu, X.; Griffen, S.C.; Lacreta, F.P.; Boulton, D.W. Effects of rifampin and mefenamic acid on the pharmacokinetics and pharmacodynamics of dapagliflozin. Diabetes Obes. Metab. 2013, 15, 280–283. [Google Scholar] [CrossRef]
  147. Kasichayanula, S.; Chang, M.; Liu, X.; Shyu, W.-C.; Griffen, S.C.; LaCreta, F.P.; Boulton, D.W. Lack of pharmacokinetic interactions between dapagliflozin and simvastatin, valsartan, warfarin, or digoxin. Adv. Ther. 2012, 29, 163–177. [Google Scholar] [CrossRef] [PubMed] [Green Version]
  148. Devineni, D.; Manitpisitkul, P.; Vaccaro, N.; Bernard, A.; Skee, D.; Mamidi, R.N.; Tian, H.; Weiner, S.; Stieltjes, H.; Sha, S.; et al. Effect of canagliflozin, a sodium glucose co-transporter 2 inhibitor, on the pharmacokinetics of oral contraceptives, warfarin, and digoxin in healthy participants. Int. J. Clin. Pharmacol. Ther. 2015, 53, 41–53. [Google Scholar] [CrossRef] [PubMed]
  149. Devineni, D.; Vaccaro, N.; Murphy, J.; Curtin, C.; Mamidi, R.N.; Weiner, S.; Wang, S.-S.; Ariyawansa, J.; Stieltjes, H.; Wajs, E.; et al. Effects of rifampin, cyclosporine A, and probenecid on the pharmacokinetic profile of canagliflozin, a sodium glucose co-transporter 2 inhibitor, in healthy participants. Int. J. Clin. Pharmacol. Ther. 2015, 53, 115–128. [Google Scholar] [CrossRef] [PubMed] [Green Version]
  150. Scheen, A.J. Drug-drug interactions with sodium-glucose cotransporters type 2 (SGLT2) inhibitors, new oral glucose-lowering agents for the management of type 2 diabetes mellitus. Clin. Pharmacokinet. 2014, 53, 295–304. [Google Scholar] [CrossRef] [Green Version]
  151. Brand, T.; MacHa, S.; Mattheus, M.; Pinnetti, S.; Woerle, H.J. Pharmacokinetics of empagliflozin, a sodium glucose cotransporter-2 (SGLT-2) inhibitor, coadministered with sitagliptin in healthy volunteers. Adv. Ther. 2012, 29, 889–899. [Google Scholar] [CrossRef]
  152. Elkinson, S.; Scott, L.J. Canagliflozin: First global approval. Drugs 2013, 73, 979–988. [Google Scholar] [CrossRef]
  153. Devineni, D.; Curtin, C.R.; Polidori, D.; Gutierrez, M.J.; Murphy, J.; Rusch, S.; Rothenberg, P.L. Pharmacokinetics and pharmacodynamics of canagliflozin, a sodium glucose co-transporter 2 inhibitor, in subjects with type 2 diabetes mellitus. J. Clin. Pharmacol. 2013, 53, 601–610. [Google Scholar] [CrossRef] [PubMed]
  154. Macha, S.; Mattheus, M.; Pinnetti, S.; Seman, L.; JWoerle, H. Pharmacokinetics of Empagliflozin, a Sodium Glucose Cotransporter 2 Inhibitor, and Glimepiride Following Co-administration in Healthy Volunteers: A Randomised, Open-label, Crossover Study. J. Diabetes Res. Clin. Metab. 2012, 1, 14. [Google Scholar] [CrossRef] [Green Version]
  155. Macha, S.; Sennewald, R.; Rose, P.; Schoene, K.; Pinnetti, S.; Woerle, H.J.; Broedl, U.C. Lack of clinically relevant drug-drug interaction between empagliflozin, a sodium glucose cotransporter 2 inhibitor, and verapamil, ramipril, or digoxin in healthy volunteers. Clin. Ther. 2013, 35, 226–235. [Google Scholar] [CrossRef] [PubMed]
  156. Macha, S.; Mattheus, M.; Pinnetti, S.; Woerle, H.J.; Broedl, U.C. Effect of Empagliflozin on the Steady-State Pharmacokinetics of Ethinylestradiol and Levonorgestrel in Healthy Female Volunteers. Clin. Drug Investig. 2013, 33, 351–357. [Google Scholar] [CrossRef] [PubMed]
  157. Vizirianakis, I.S. Clinical Translation of Genotyping and Haplotyping Data. Clin. Pharmacokinet. 2007, 46, 807–824. [Google Scholar] [CrossRef] [PubMed]
Scheme 1. Schematic illustration of bioinformatics pipeline applied to analyze the molecular data in this work. Created by BioRender.com (accessed on 12 December 2022).
Futurepharmacol 03 00021 sch001
Figure 1. (a) Genes associated with DMT2 (Non-Insulin-Dependent) as retrieved from expert curated data integrated into DisGeNET database. The network was constructed using the disgenet2r package in R. (b) Network visualization of the variants associated with the DMT2-related genes. The variants were retrieved from expert-curated data integrated into DisGeNET database. Pink nodes illustrate the DMT2-related genes. Green nodes depict the variants corresponding to the DMT2-related genes. The network was constructed using Cytoscape.
Futurepharmacol 03 00021 g001aFuturepharmacol 03 00021 g001b
Figure 2. Gene ontology (GO), disease ontology (DOSE), and pathway enrichment analysis and visualization of the genes associated to DMT2 pathogenesis as retrieved from DisGeNET database. (a) Top 15 significantly enriched gene ontology (GO) biological process (BP) terms associated with the genes implicated in DMT2. The gene ratio and statistical significance (p-value < 0.01, following Benjamini and Hochberg’s adjustment method) are also depicted. (b) Top 15 significantly enriched disease ontology (DOSE) terms associated with the genes implicated in DMT2. The gene ratio and statistical significance (p-value < 0.01, following Benjamini and Hochberg’s adjustment method) are also depicted. (c) The REACTOME pathway enrichment analysis on the genes involved in DMT2. Top 15 statistically significant pathways are listed, and their colors correspond to the adjusted p-values. (d) Network construction to visualize the relationship between REACTOME pathways associated with the genes involved in DMT2. Node size corresponds to the number of genes associated with the particular pathway, and node color corresponds to the adjusted p-values. The enrichment analysis was performed using clusterProfiler and ReactomePA packages in R.
Futurepharmacol 03 00021 g002aFuturepharmacol 03 00021 g002bFuturepharmacol 03 00021 g002cFuturepharmacol 03 00021 g002d
Figure 3. Gene ontology (GO), disease ontology (DOSE), pathway enrichment analysis, and visualization of the experimentally validated target genes of DMT2-related miRNAs. (a) Top 15 significantly enriched gene ontology (GO) biological process (BP) terms associated with the experimentally validated target genes of the DMT2-related miRNAs. The gene ratio and statistical significance (p-value < 0.01, following Benjamini and Hochberg’s adjustment method) are also depicted. (b) Top 15 significantly enriched disease ontology (DOSE) terms associated with the experimentally validated target genes of the DMT2-related miRNAs. The gene ratio and statistical significance (p-value < 0.01, following Benjamini and Hochberg’s adjustment method) are also depicted. (c) The REACTOME pathway enrichment analysis on the experimentally validated target genes of the DMT2-related miRNAs. Top 15 statistically significant pathways are listed, and their colors correspond to the adjusted p-values. (d) Network construction to visualize relationship between REACTOME pathways associated with the experimentally validated target genes of the DMT2-related miRNAs. Node size corresponds to the number of genes associated with the particular pathway, and node color corresponds to the adjusted p-values. The enrichment analysis was performed using clusterProfiler and ReactomePA packages in R.
Futurepharmacol 03 00021 g003aFuturepharmacol 03 00021 g003bFuturepharmacol 03 00021 g003c
Figure 4. Gene ontology (GO), disease ontology (DO), and pathway-enrichment analysis and visualization of the matched genes retrieved from the targeted analysis. The matched genes are implicated in DMT2 pathogenesis, according to DisGeNET database. Moreover, these genes are the experimentally validated targets of the DMT2-related miRNAs, which were retrieved from the HMDD database. (a) The top 15 significantly enriched gene ontology (GO) biological process (BP) terms associated with the matched genes of the targeted analysis. The gene ratio and statistical significance (p-value < 0.01, following Benjamini and Hochberg’s adjustment method) are also depicted. (b) Top 15 significantly enriched disease ontology (DO) terms associated with the matched genes of the targeted analysis. The gene ratio and statistical significance (p-value < 0.01, following Benjamini and Hochberg’s adjustment method) are also depicted. (c) The REACTOME pathway enrichment analysis on the matched genes. The top 15 statistically significant pathways are listed, and their colors correspond to the adjusted p-values. (d) Network construction to visualize the relationship between REACTOME pathways, corresponding to the matched genes that are associated with DMT2 pathogenesis and DMT2-related miRNAs. Node size corresponds to the number of genes associated with the particular pathway, and node color corresponds to the adjusted p-values. The enrichment analysis was performed using clusterProfiler and ReactomePA packages in R.
Futurepharmacol 03 00021 g004aFuturepharmacol 03 00021 g004bFuturepharmacol 03 00021 g004cFuturepharmacol 03 00021 g004d
Figure 5. Network visualization of the matched genes retrieved from the targeted analysis and their association with diseases. In the selected three examples shown above that were taken from the disease ontology (DO) enrichment analysis, the pink nodes located between the DMT2 group and colorectal cancer (a), obesity (b), and kidney disease (c) groups represent genes implicated in the pathogenesis of the referred diseases, including DMT2.
Futurepharmacol 03 00021 g005aFuturepharmacol 03 00021 g005bFuturepharmacol 03 00021 g005c
Figure 6. Network of the matched genes retrieved from the targeted analysis. The matched genes (red nodes) are implicated in DMT2 pathogenesis, according to DisGeNET database. Moreover, these genes are the experimentally validated targets of the DMT2-related miRNAs (blue rectangular objects), which were retrieved from the HMDD database. The variants associated with the shared genes are depicted as green nodes. The drugs associated with the variants of the shared genes, according to PharmGKB database, are depicted as diamonds in orange. The network was created using Cytoscape.
Futurepharmacol 03 00021 g006
Table 2. Drug interactions with metformin.
DrugCo-Administered DrugEffectReferences
MetforminIodinated contrast agentsRisk of lactic acidosis[79]
MetforminRanitidineDecreased renal clearance of metformin[91]
MetforminCimetidineIncreased exposure of metformin[92]
MetforminPPIsIncreased exposure of metformin[96]
MetforminVitamin B12Decreased absorption of B12[97]
MetforminTrimethoprimDecreased elimination of metformin[95]
MetforminVerapamilDecreased effect of metformin[98]
MetforminRanolazineDecreased elimination[99]
MetforminMetoprololDecreased plasma concentration of metformin[100]
MetforminVandetanibIncreased plasma concentration[101]
MetforminAnticancer drugsReduced elimination of metformin[101]
Table 5. Drug interactions with GLP-1RA.
DrugCo-Administered DrugEffectReferences
ExenatideAcetaminophenDelayed absorption of acetaminophen[133]
LovastatinDecreased AUC and Cmax of lovastatin[134]
LiraglutideAcetaminophenDelayed absorption of acetaminophen[135]
DigoxinDelayed Tmax of digoxin[136]
SulfonylureasIncreased risk of hypoglycemia[137]
AtorvastatinDelayed Tmax of atorvastatin[138]
LisinoprilDelayed Tmax of lisinopril[138]
SemaglutideDigoxinDelayed Tmax of digoxin[136]
WarfarinDelayed absorption of warfarin[136]
AtorvastatinProlonged absorption and lowered Cmax of atorvastatin[136]
DulaglutideDigoxinDelayed Tmax of digoxin[139]
WarfarinDelayed absorption of warfarin[139]
AtorvastatinReduced AUC of atorvastatin[139]
LixisenatideRamiprilDelayed Tmax of ramipril[140]
Table 6. Drug interactions with SGLT2i.
DrugCo-Administered DrugEffectReferences
DapagliflozinSimvastatinIncreased AUC of simvastatin[147]
RifampicinDecreased AUC of dapagliflozin[146]
Mefenamic AcidIncreased AUC of dapagliflozin[146]
CanagliflozinDigoxinIncreased exposure of digoxin[148]
RifampicinDecreased Cmax of canagliflozin[149]
Probenecid AcidIncreased Cmax of canagliflozin[149]
CyclosporineIncreased AUC of canagliflozin[149]
EmpagliflozinGlimepirideDecreased exposure of empagliflozin[150]
SitagliptinIncreased exposure of empagliflozin[151]
Disclaimer/Publisher’s Note: The statements, opinions and data contained in all publications are solely those of the individual author(s) and contributor(s) and not of MDPI and/or the editor(s). MDPI and/or the editor(s) disclaim responsibility for any injury to people or property resulting from any ideas, methods, instructions or products referred to in the content.

