
Fitting Parameters of a Modified Hill’s Equation and Their Influence on the Shape of the Model Hemoglobin Oxygenation Curve
 , and
, and 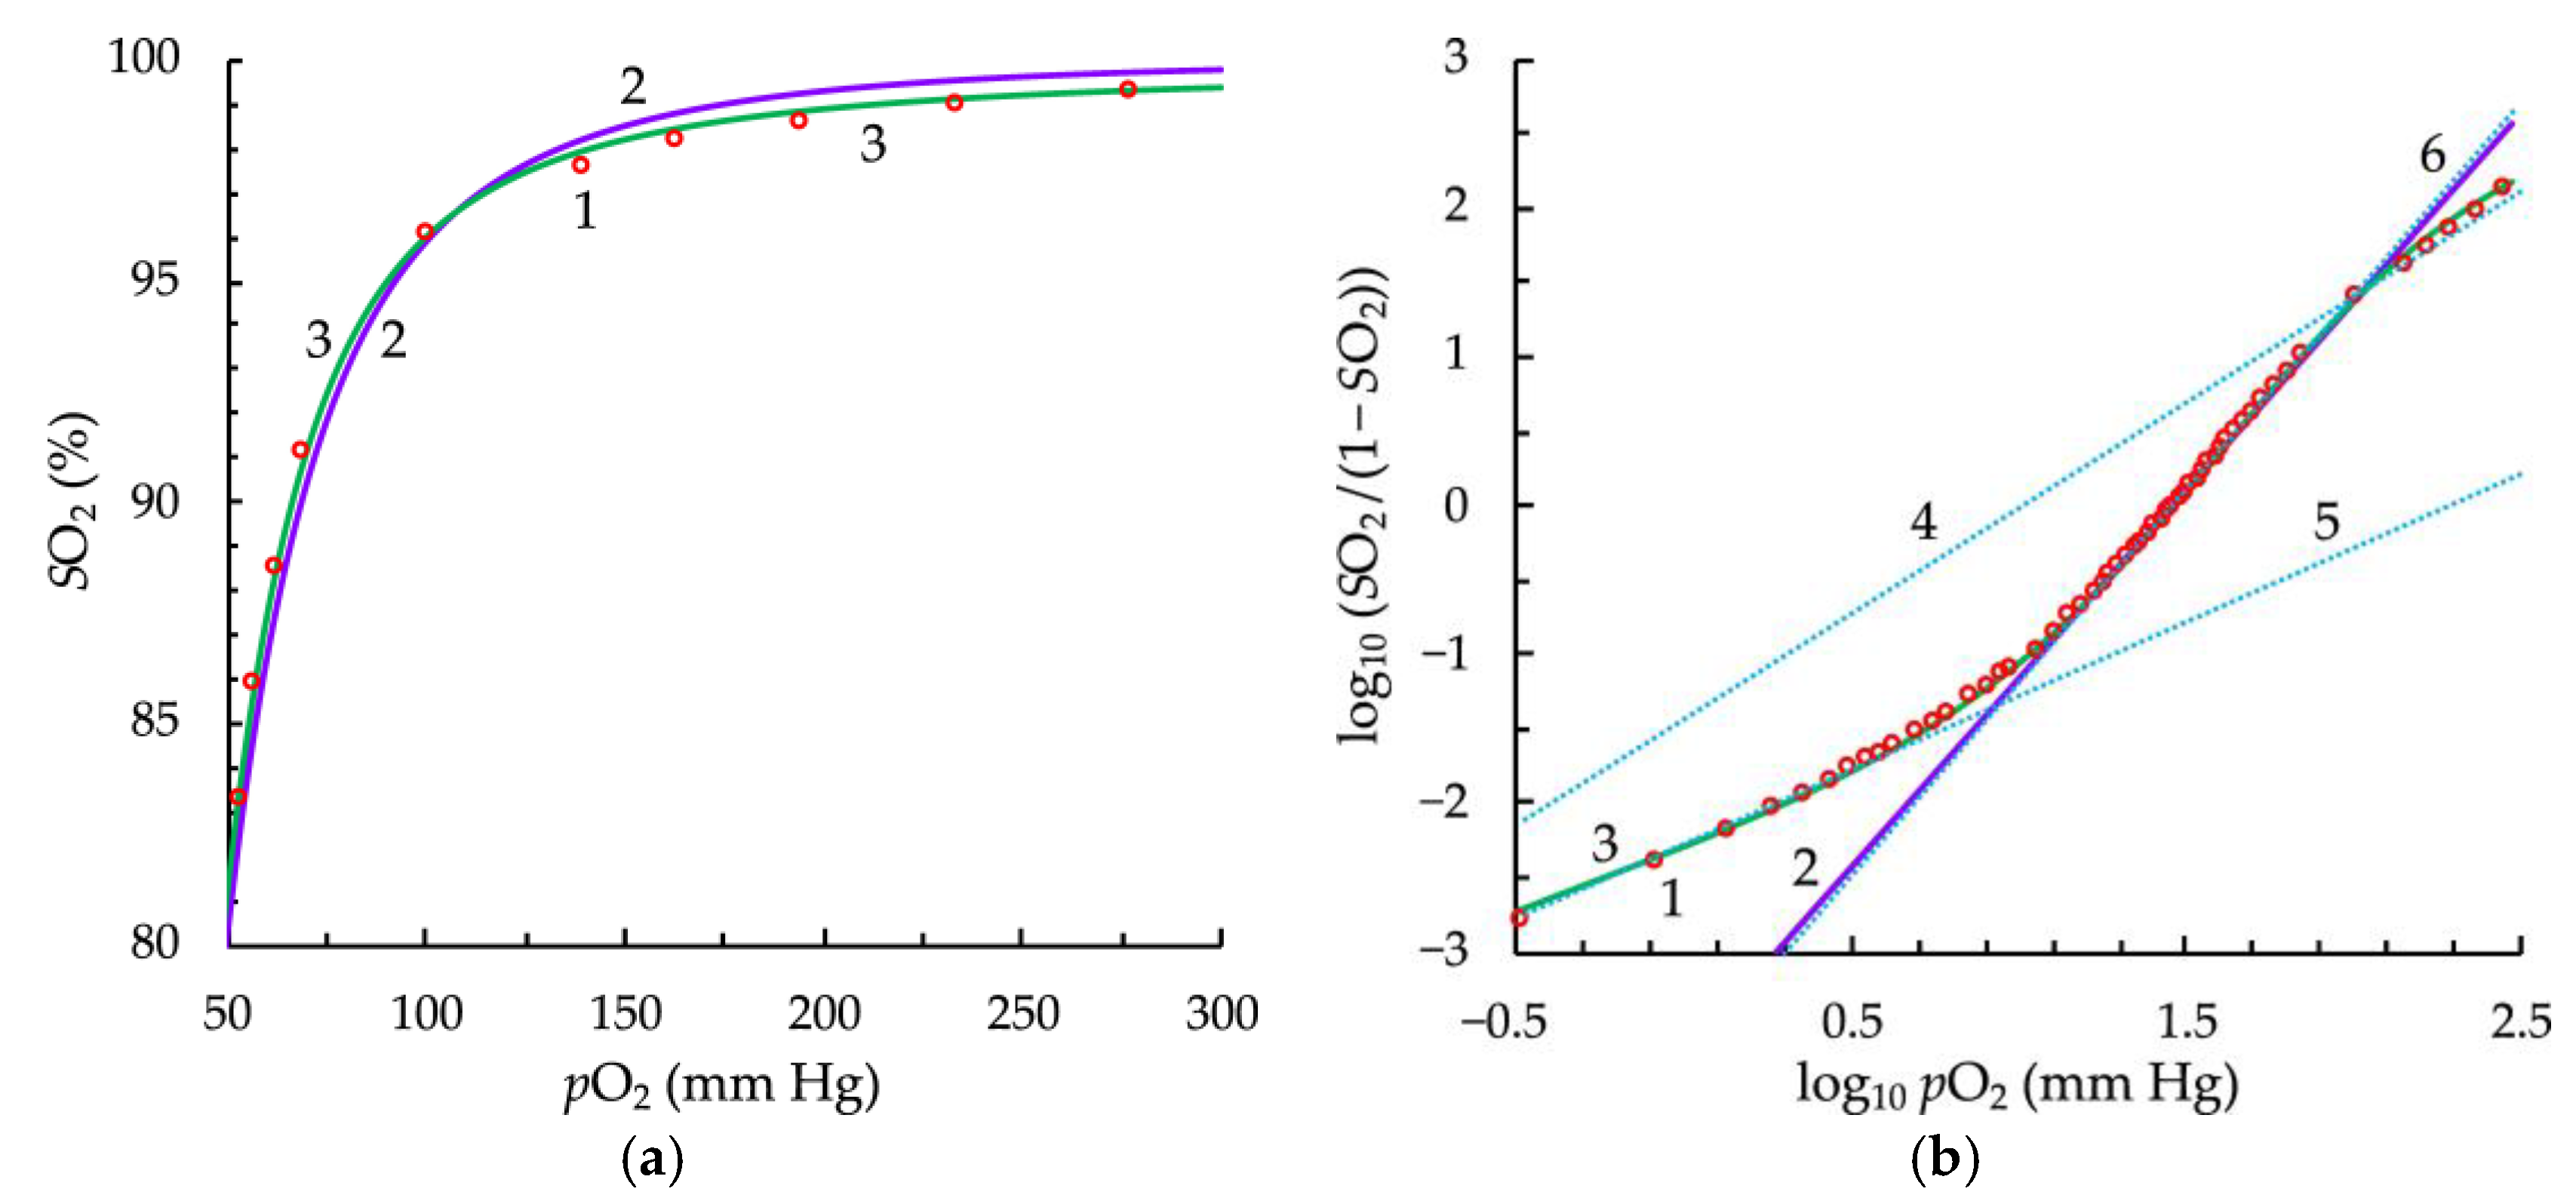
Abstract
:1. Introduction
2. Materials and Methods
3. Results
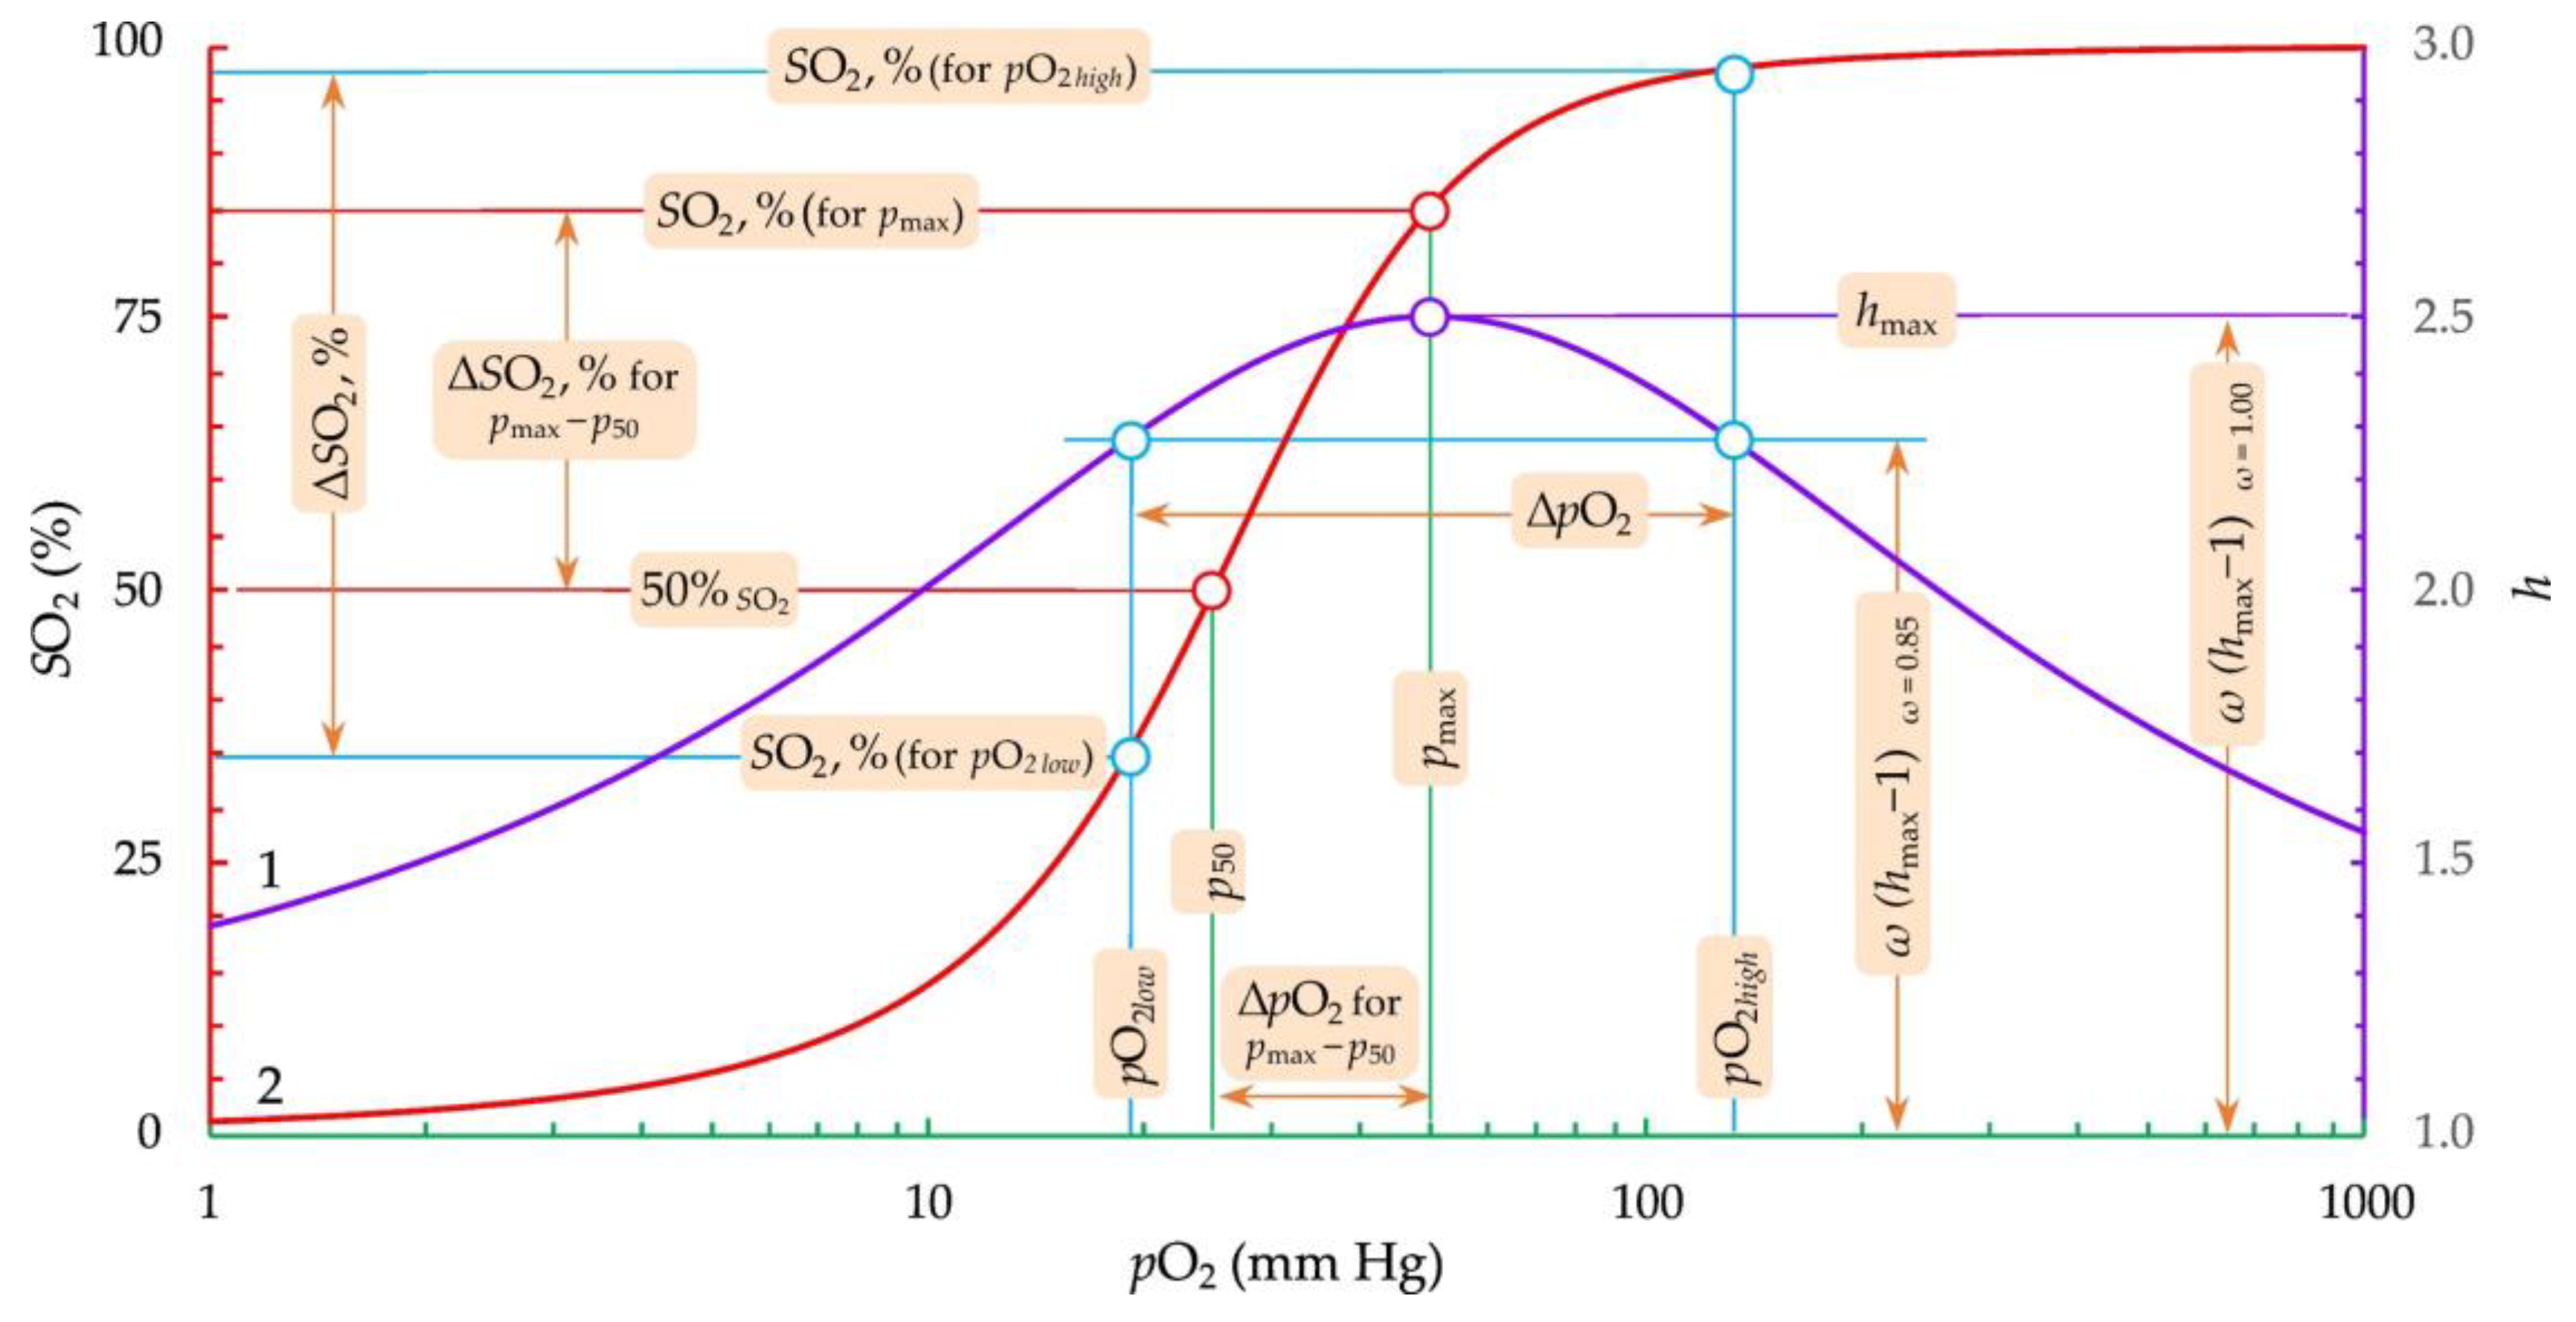
3.1. Fitting and Derived Parameters from the Modified Hill’s Equation
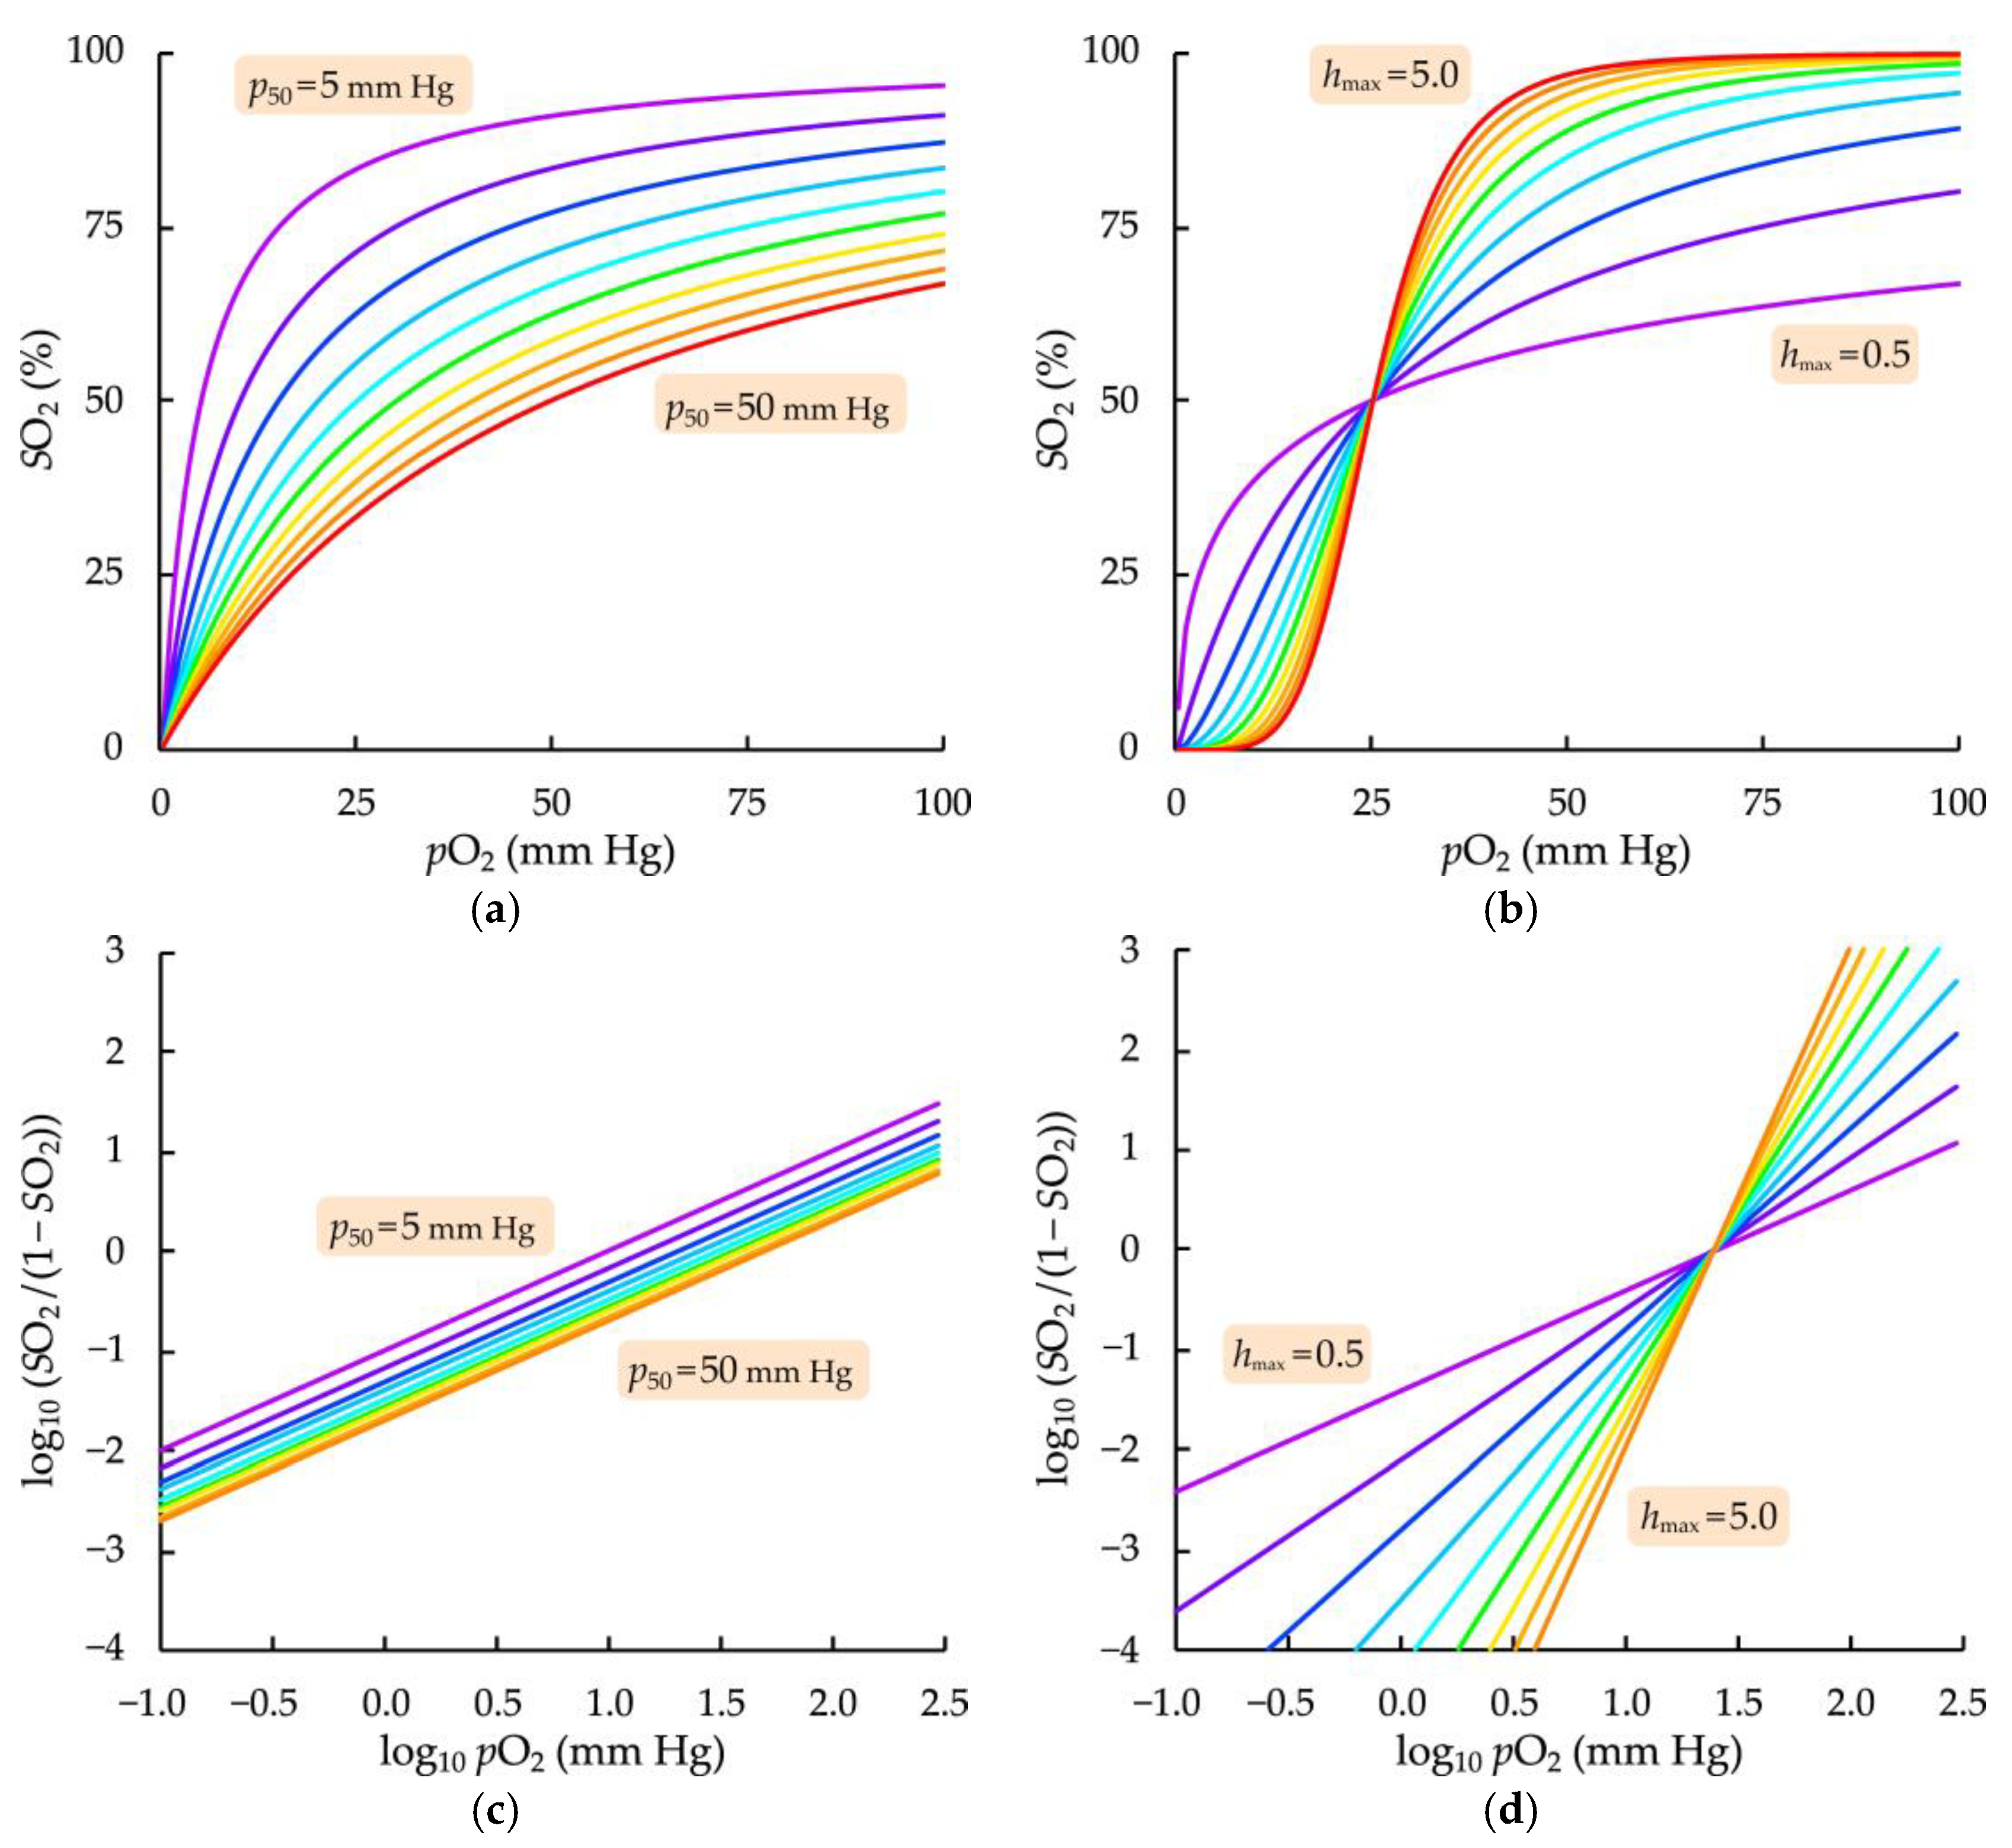
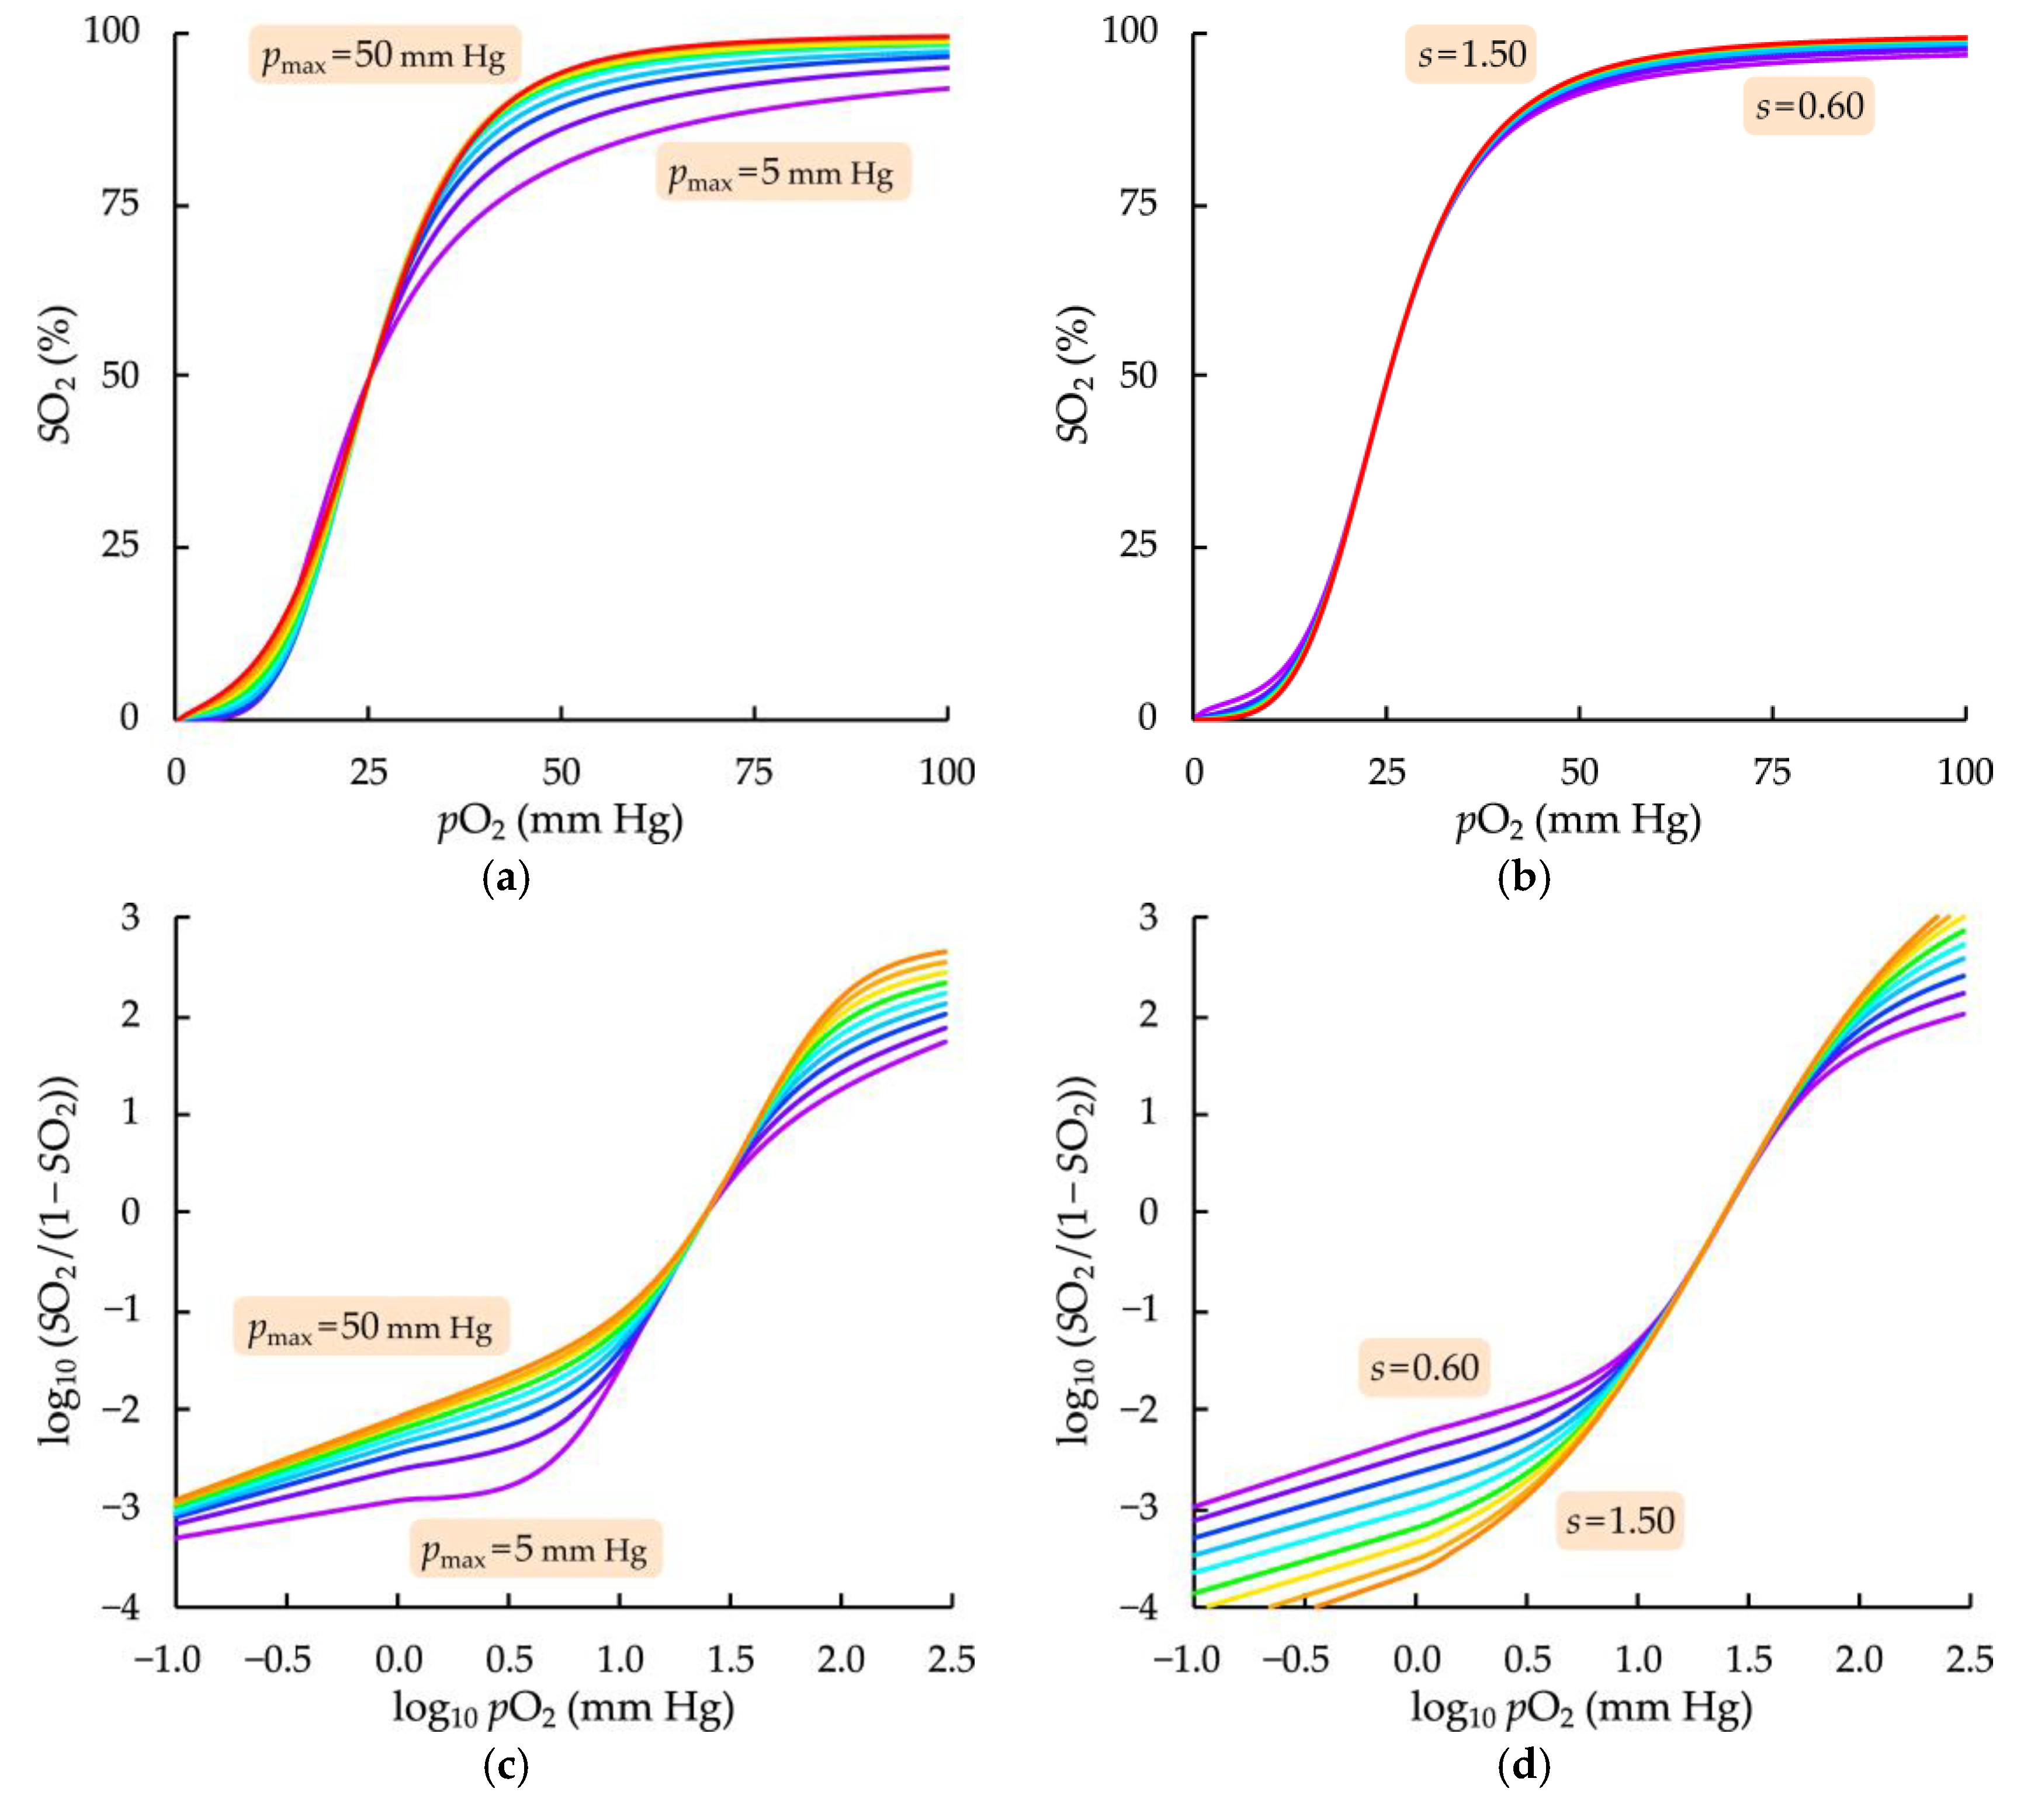
3.2. Influence of Fitting Parameters of the Modified Hill Equation on the Model Oxygenation Curve Course
4. Discussion
Supplementary Materials
Author Contributions
Funding
Institutional Review Board Statement
Informed Consent Statement
Data Availability Statement
Acknowledgments
Conflicts of Interest
References
- Fournier, G.P.; Moore, K.R.; Rangel, L.T.; Payette, J.G.; Momper, L.; Bosak, T. The Archean origin of oxygenic photosynthesis and extant cyanobacterial lineages. Proc. R. Soc. B Biol. Sci. 2021, 288, 20210675. [Google Scholar] [CrossRef] [PubMed]
- Gilbert, D.L. Oxygen and Living Processes: An Interdisciplinary Approach; Springer Science & Business Media: Berlin/Heidelberg, Germany, 2012. [Google Scholar]
- Leys, S.P.; Kahn, A.S. Oxygen and the Energetic Requirements of the First Multicellular Animals. Integr. Comp. Biol. 2018, 58, 666–676. [Google Scholar] [CrossRef] [PubMed] [Green Version]
- Bennett, A.F. The evolution of activity capacity. J. Exp. Biol. 1991, 160, 1–23. [Google Scholar] [CrossRef] [PubMed]
- Stamati, K.; Mudera, V.; Cheema, U. Evolution of oxygen utilization in multicellular organisms and implications for cell signalling in tissue engineering. J. Tissue Eng. 2011, 2, 2041731411432365. [Google Scholar] [CrossRef] [PubMed]
- Dzal, Y.A.; Jenkin, S.E.M.; Lague, S.L.; Reichert, M.N.; York, J.M.; Pamenter, M.E. Oxygen in demand: How oxygen has shaped vertebrate physiology. Comp. Biochem. Physiol. Part A Mol. Integr. Physiol. 2015, 186, 4–26. [Google Scholar] [CrossRef] [PubMed]
- Collins, J.-A.; Rudenski, A.; Gibson, J.; Howard, L.; O’Driscoll, R. Relating oxygen partial pressure, saturation and content: The haemoglobin–oxygen dissociation curve. Breathe 2015, 11, 194–201. [Google Scholar] [CrossRef] [Green Version]
- Danish, M.A. Preoxygenation and Anesthesia: A Detailed Review. Cureus 2021, 13, e13240. [Google Scholar]
- Nechipurenko, Y.D.; Semyonov, D.A.; Lavrinenko, I.A.; Lagutkin, D.A.; Generalov, E.A.; Zaitceva, A.Y.; Matveeva, O.V.; Yegorov, Y.E. The Role of Acidosis in the Pathogenesis of Severe Forms of COVID-19. Biology 2021, 10, 852. [Google Scholar] [CrossRef]
- Antonini, E. History and theory of the oxyhemoglobin dissociation curve. Crit. Care Med. 1979, 7, 360–367. [Google Scholar] [CrossRef]
- Sladen, R.N. The oxyhemoglobin dissociation curve. Int. Anesth. Clin. 1981, 19, 39–70. [Google Scholar] [CrossRef] [Green Version]
- Nitzan, M.; Romem, A.; Koppel, R. Pulse oximetry: Fundamentals and technology update. Med. Devices 2014, 7, 231–239. [Google Scholar] [CrossRef] [PubMed]
- Pretto, J.J.; Roebuck, T.; Beckert, L.; Hamilton, G. Clinical use of pulse oximetry: Official guidelines from the Thoracic Society of Australia and New Zealand. Respirology 2014, 19, 38–46. [Google Scholar] [CrossRef] [PubMed]
- Cui, Q.; Karplus, M. Allostery and cooperativity revisited. Protein Sci 2008, 17, 1295–1307. [Google Scholar] [CrossRef] [PubMed] [Green Version]
- Bellelli, A. Hemoglobin and cooperativity: Experiments and theories. Curr. Protein Pept. Sci. 2010, 11, 2–36. [Google Scholar] [CrossRef] [PubMed]
- Koshland, D.E., Jr.; Hamadani, K. Proteomics and Models for Enzyme Cooperativity. J. Biol. Chem. 2002, 277, 46841–46844. [Google Scholar] [CrossRef] [Green Version]
- Whitty, A. Cooperativity and biological complexity. Nat. Chem. Biol. 2008, 4, 435–439. [Google Scholar] [CrossRef]
- Storz, J.F. Hemoglobin: Insights into Protein Structure, Function, and Evolution; Oxford University Press: Oxford, UK, 2018. [Google Scholar]
- Perutz, M.F. Hemoglobin structure and respiratory transport. Sci. Am. 1978, 239, 92–125. [Google Scholar] [CrossRef]
- Cornish-Bowden, A. Understanding allosteric and cooperative interactions in enzymes. FEBS J. 2014, 281, 621–632. [Google Scholar] [CrossRef]
- Perutz, M.F.; Rossmann, M.G.; Cullis, A.F.; Muirhead, H.; Will, G.; North, A. Structure of hæmoglobin: A three-dimensional Fourier synthesis at 5.5-Å. resolution, obtained by X-ray analysis. Nature 1960, 185, 416–422. [Google Scholar] [CrossRef]
- Brunori, M. Hemoglobin is an honorary enzyme. Trends Biochem. Sci. 1999, 24, 158–161. [Google Scholar] [CrossRef]
- Perutz, M.F. Stereochemistry of cooperative effects in haemoglobin: Haem–haem interaction and the problem of allostery. Nature 1970, 228, 726–734. [Google Scholar] [CrossRef] [PubMed]
- Perutz, M.F. Mechanisms of cooperativity and allosteric regulation in proteins. Q. Rev. Biophys. 1989, 22, 139–237. [Google Scholar] [CrossRef] [PubMed]
- Lin, X.; Li, X.; Lin, X. A Review on Applications of Computational Methods in Drug Screening and Design. Molecules 2020, 25, 1375. [Google Scholar] [CrossRef] [PubMed] [Green Version]
- Thabault, L.; Liberelle, M.; Frederick, R. Targeting protein self-association in drug design. Drug Discov. Today 2021, 26, 1148–1163. [Google Scholar] [CrossRef]
- Perrella, M.; Di Cera, E. CO Ligation Intermediates and the Mechanism of Hemoglobin Cooperativity. J. Biol. Chem. 1999, 274, 2605–2608. [Google Scholar] [CrossRef] [Green Version]
- Eaton, W.A.; Henry, E.R.; Hofrichter, J.; Bettati, S.; Viappiani, C.; Mozzarelli, A. Evolution of allosteric models for hemoglobin. IUBMB Life 2007, 59, 586–599. [Google Scholar] [CrossRef] [PubMed]
- Eaton, W.A. A retrospective on statistical mechanical models for hemoglobin allostery. J. Chem. Phys. 2022, 157, 184104. [Google Scholar] [CrossRef]
- Berthollet, C.-L. Essai de Statique Chimique; Didot: Paris, France, 1803; Volume 2. [Google Scholar]
- Guldberg, C.M.; Waage, P. Studies concerning affinity. CM Forh. Vidensk.-Selsk. Christ. 1864, 35, 1864. [Google Scholar]
- van’t Hoff, J.H. Die grenzebene, ein beitrag zur kenntniss der esterbildung. Ber. Dtsch. Chem. Ges. 1877, 10, 669–678. [Google Scholar] [CrossRef]
- Hüfner, G. Über die Bedeutung der in der vorigen Abhandlung vorgethangenen Lehre für die Spectroskopie und Photometrie des Blutes. Arch. Physiol. 1890, 31, 28–30. [Google Scholar]
- Hill, A.V. The possible effects of the aggregation of the molecules of hæmoglobin on its dissociation curves. J. Physiol. 1910, 40, iv–vii. [Google Scholar]
- Weiss, J.N. The Hill equation revisited: Uses and misuses. FASEB J. 1997, 11, 835–841. [Google Scholar] [CrossRef] [PubMed]
- Goutelle, S.; Maurin, M.; Rougier, F.; Barbaut, X.; Bourguignon, L.; Ducher, M.; Maire, P. The Hill equation: A review of its capabilities in pharmacological modelling. Fundam. Clin. Pharmacol. 2008, 22, 633–648. [Google Scholar] [CrossRef] [PubMed]
- Svedberg, T.; Fåhraeus, R. A new method for the determination of the molecular weight of the proteins. J. Am. Chem. Soc. 1926, 48, 430–438. [Google Scholar] [CrossRef]
- Adair, G.S.; Bock, A.; Field Jr, H. The hemoglobin system: VI. The oxygen dissociation curve of hemoglobin. J. Biol. Chem. 1925, 63, 529–545. [Google Scholar] [CrossRef]
- Lavrinenko, I.A.; Vashanov, G.A.; Sulin, V.Y.; Nechipurenko, Y.D. An Analysis of Models of Cooperative Oxygen Binding by Hemoglobin. Biophysics 2021, 66, 905–912. [Google Scholar] [CrossRef]
- Newsholme, E.A.; Start, C. Regulation in Metabolism; Wiley: Hoboken, NJ, USA; London, UK, 1973. [Google Scholar]
- Bernard, S.R. Mathematical studies of the interaction of respiratory gases with whole blood I. O2 absorption. Bull. Math. Biophys. 1960, 22, 391–415. [Google Scholar] [CrossRef]
- Lefurgy, S.T.; Leyh, T.S. Analytical expressions for the homotropic binding of ligand to protein dimers and trimers. Anal. Biochem. 2012, 421, 433–438. [Google Scholar] [CrossRef] [Green Version]
- Pauling, L. The oxygen equilibrium of hemoglobin and its structural interpretation. Proc. Natl. Acad. Sci. USA 1935, 21, 186. [Google Scholar] [CrossRef] [Green Version]
- Klotz, I.M. The application of the law of mass action to binding by proteins; interactions with calcium. Arch. Biochem. 1946, 9, 109–117. [Google Scholar]
- Koshland Jr, D.E.; Némethy, G.; Filmer, D. Comparison of experimental binding data and theoretical models in proteins containing subunits. Biochemistry 1966, 5, 365–385. [Google Scholar] [CrossRef] [PubMed]
- Gruber, R.; Mondal, T.; Horovitz, A. GroEL Allostery Illuminated by a Relationship between the Hill Coefficient and the MWC Model. Biophys. J. 2019, 117, 1915–1921. [Google Scholar] [CrossRef] [PubMed]
- Monod, J.; Wyman, J.; Changeux, J.-P. On the nature of allosteric transitions: A plausible model. J. Mol. Biol. 1965, 12, 88–118. [Google Scholar] [CrossRef] [PubMed]
- Brunori, M.; Coletta, M.; Di Cera, E. A cooperative model for ligand binding to biological macromolecules as applied to oxygen carriers. Biophys. Chem. 1986, 23, 215–222. [Google Scholar] [CrossRef] [PubMed]
- Szabo, A.; Karplus, M. A mathematical model for structure-function relations in hemoglobin. J. Mol. Biol. 1972, 72, 163–197. [Google Scholar] [CrossRef] [PubMed]
- Lee, A.W.; Karplus, M. Structure-specific model of hemoglobin cooperativity. Proc. Natl. Acad. Sci. USA 1983, 80, 7055–7059. [Google Scholar] [CrossRef] [PubMed] [Green Version]
- Henry, E.R.; Bettati, S.; Hofrichter, J.; Eaton, W.A. A tertiary two-state allosteric model for hemoglobin. Biophys. Chem. 2002, 98, 149–164. [Google Scholar] [CrossRef]
- Viappiani, C.; Bettati, S.; Bruno, S.; Ronda, L.; Abbruzzetti, S.; Mozzarelli, A.; Eaton, W.A. New insights into allosteric mechanisms from trapping unstable protein conformations in silica gels. Proc. Natl. Acad. Sci. USA 2004, 101, 14414–14419. [Google Scholar] [CrossRef] [Green Version]
- Lavrinenko, I.A.; Vashanov, G.A.; Hernández Cáceres, J.L.; Buchelnikov, A.S.; Nechipurenko, Y.D. A New Model of Hemoglobin Oxygenation. Entropy 2022, 24, 1214. [Google Scholar] [CrossRef]
- Winslow, R.M.; Swenberg, M.L.; Berger, R.L.; Shrager, R.I.; Luzzana, M.; Samaja, M.; Rossi-Bernardi, L. Oxygen equilibrium curve of normal human blood and its evaluation by Adair’s equation. J. Biol. Chem. 1977, 252, 2331–2337. [Google Scholar] [CrossRef]
- Facó, J.L.D. A Generalized Reduced Gradient Algorithm for Solving Large-Scale Discrete-Time Nonlinear Optimal Control Problems. IFAC Proc. Vol. 1989, 22, 45–50. [Google Scholar] [CrossRef]
- Dekking, M.; Kraaikamp, C.; Lopuhaä, H.P.; Meester, L.E. A Modern Introduction to Probability and Statistics: Understanding Why and How; Springer: London, UK, 2005; 486p. [Google Scholar]
- Michaelis, L.; Menten, M. Die kinetik der invertinwirkung. Biochem. Z. 1913, 49, 333–369. [Google Scholar]
- Lavrinenko, I.A.; Vashanov, G.A.; Nechipurenko, Y.D. New Mathematical Model to Describe Hemoglobin Oxygenation. Biophysics 2022, 67, 347–352. [Google Scholar] [CrossRef]
- Lavrinenko, I.A.; Vashanov, G.A.; Buchelnikov, A.S.; Nechipurenko, Y.D. Cooperative Oxygen Binding with Hemoglobin as a General Model in Molecular Biophysics. Biophysics 2022, 67, 327–337. [Google Scholar] [CrossRef]
- Lavrinenko, I.A.; Vashanov, G.A.; Nechipurenko, Y.D. New Interpretation of the Hill Coefficient. Biophysics 2022, 67, 171–174. [Google Scholar] [CrossRef]
- Hofmeyr, J.-H.S.; Cornish-Bowden, H. The reversible Hill equation: How to incorporate cooperative enzymes into metabolic models. Bioinformatics 1997, 13, 377–385. [Google Scholar] [CrossRef] [Green Version]
- McDonald, A.G.; Tipton, K.F. Parameter Reliability and Understanding Enzyme Function. Molecules 2022, 27, 263. [Google Scholar] [CrossRef]
- Gesztelyi, R.; Zsuga, J.; Kemeny-Beke, A.; Varga, B.; Juhasz, B.; Tosaki, A. The Hill equation and the origin of quantitative pharmacology. Arch. Hist. Exact Sci. 2012, 66, 427–438. [Google Scholar] [CrossRef]
- Gadagkar, S.R.; Call, G.B. Computational tools for fitting the Hill equation to dose–response curves. J. Pharmacol. Toxicol. Methods 2015, 71, 68–76. [Google Scholar] [CrossRef] [Green Version]
- Takaichi, H.; Kawano, T. Expanded and practical use of logistic equations in eco-toxicity evaluation: Cases of lethal metal toxicity curves in green paramecia with minimal-sized experiments. J. Adv. Comput. Intell. Intell. Inform. 2016, 20, 681–690. [Google Scholar] [CrossRef]
- Shockley, K.R. Estimating Potency in High-Throughput Screening Experiments by Maximizing the Rate of Change in Weighted Shannon Entropy. Sci. Rep. 2016, 6, 27897. [Google Scholar] [CrossRef] [PubMed] [Green Version]
- Prinz, H. Hill coefficients, dose–response curves and allosteric mechanisms. J. Chem. Biol. 2010, 3, 37–44. [Google Scholar] [CrossRef] [Green Version]
- Bhaskaran, S.; Umesh, P.; Nair, A.S. Hill Equation in Modeling Transcriptional Regulation. In Systems and Synthetic Biology; Singh, V., Dhar, P.K., Eds.; Springer: Dordrecht, The Netherlands, 2015; pp. 77–92. [Google Scholar]
- Shi, X. A Hill type equation can predict target gene expression driven by p53 pulsing. FEBS Open Bio 2021, 11, 1799–1808. [Google Scholar] [CrossRef] [PubMed]
- Sachs, J.R. Kinetic evaluation of the Na-K pump reaction mechanism. J. Physiol. 1977, 273, 489–514. [Google Scholar] [CrossRef] [PubMed]
- Lolkema, J.S.; Slotboom, D.-J. The Hill analysis and co-ion–driven transporter kinetics. J. Gen. Physiol. 2015, 145, 565–574. [Google Scholar] [CrossRef] [Green Version]
- Habeck, M.; Tokhtaeva, E.; Nadav, Y.; Ben Zeev, E.; Ferris, S.P.; Kaufman, R.J.; Bab-Dinitz, E.; Kaplan, J.H.; Dada, L.A.; Farfel, Z.; et al. Selective Assembly of Na,K-ATPase α2β2 Heterodimers in the Heart: Distinct functional properties and isoform-selective inhibitors. J. Biol. Chem. 2016, 291, 23159–23174. [Google Scholar] [CrossRef] [Green Version]
- Ackers, G.K.; Holt, J.M. Asymmetric cooperativity in a symmetric tetramer: Human hemoglobin. J. Biol. Chem. 2006, 281, 11441–11443. [Google Scholar] [CrossRef] [Green Version]
- de Keijzer, I.N.; Massari, D.; Sahinovic, M.; Flick, M.; Vos, J.J.; Scheeren, T.W.L. What is new in microcirculation and tissue oxygenation monitoring? J. Clin. Monit. Comput. 2022, 36, 291–299. [Google Scholar] [CrossRef]
- Edelstein, S.J. Cooperative Interactions of Hemoglobin. Annu. Rev. Biochem. 1975, 44, 209–232. [Google Scholar] [CrossRef]
- Eaton, W.A.; Henry, E.R.; Hofrichter, J.; Mozzarelli, A. Is cooperative oxygen binding by hemoglobin really understood? Nat. Struct. Biol. 1999, 6, 351–358. [Google Scholar] [CrossRef]


Disclaimer/Publisher’s Note: The statements, opinions and data contained in all publications are solely those of the individual author(s) and contributor(s) and not of MDPI and/or the editor(s). MDPI and/or the editor(s) disclaim responsibility for any injury to people or property resulting from any ideas, methods, instructions or products referred to in the content. |
© 2023 by the authors. Licensee MDPI, Basel, Switzerland. This article is an open access article distributed under the terms and conditions of the Creative Commons Attribution (CC BY) license (https://creativecommons.org/licenses/by/4.0/).
Share and Cite
Lavrinenko, I.A.; Vashanov, G.A.; Hernández Cáceres, J.L.; Nechipurenko, Y.D. Fitting Parameters of a Modified Hill’s Equation and Their Influence on the Shape of the Model Hemoglobin Oxygenation Curve. Oxygen 2023, 3, 90-101. https://doi.org/10.3390/oxygen3010007
Lavrinenko IA, Vashanov GA, Hernández Cáceres JL, Nechipurenko YD. Fitting Parameters of a Modified Hill’s Equation and Their Influence on the Shape of the Model Hemoglobin Oxygenation Curve. Oxygen. 2023; 3(1):90-101. https://doi.org/10.3390/oxygen3010007
Chicago/Turabian StyleLavrinenko, Igor A., Gennady A. Vashanov, José L. Hernández Cáceres, and Yury D. Nechipurenko. 2023. "Fitting Parameters of a Modified Hill’s Equation and Their Influence on the Shape of the Model Hemoglobin Oxygenation Curve" Oxygen 3, no. 1: 90-101. https://doi.org/10.3390/oxygen3010007