
Effect of Water-Soluble Chlorine-Containing Buckminsterfullerene Derivative on the Metabolism of Reactive Oxygen Species in Human Embryonic Lung Fibroblasts
 , , ,
, , ,
Abstract
:
1. Introduction
2. Materials and Methods
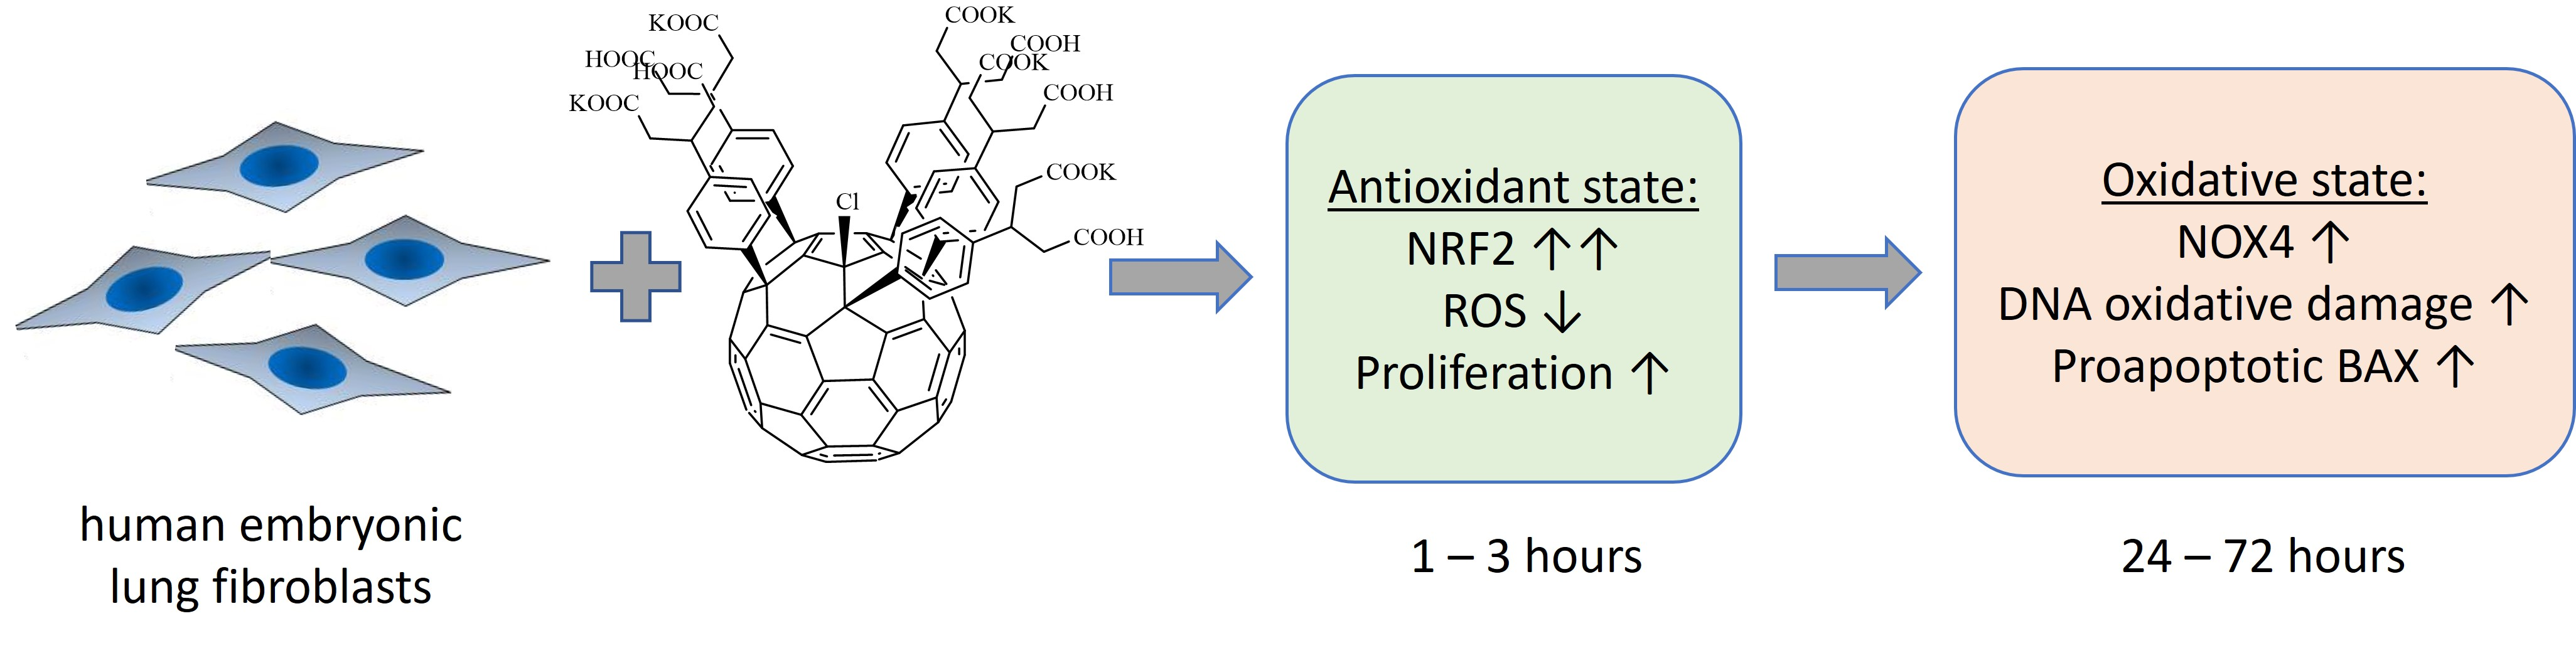
2.1. Fullerene Derivative
2.2. Cell Culture
2.3. MTT Test
2.4. Antibodies
2.5. Flow Cytometry
2.6. Fluorescence Microscopy
2.7. Spectrophotometry and Spectrofluorimetry
2.8. Immunocytochemistry
2.9. Intracellular ROS Assay
2.10. mRNA Quantification
2.11. Gene Accession Numbers
2.12. Statistics
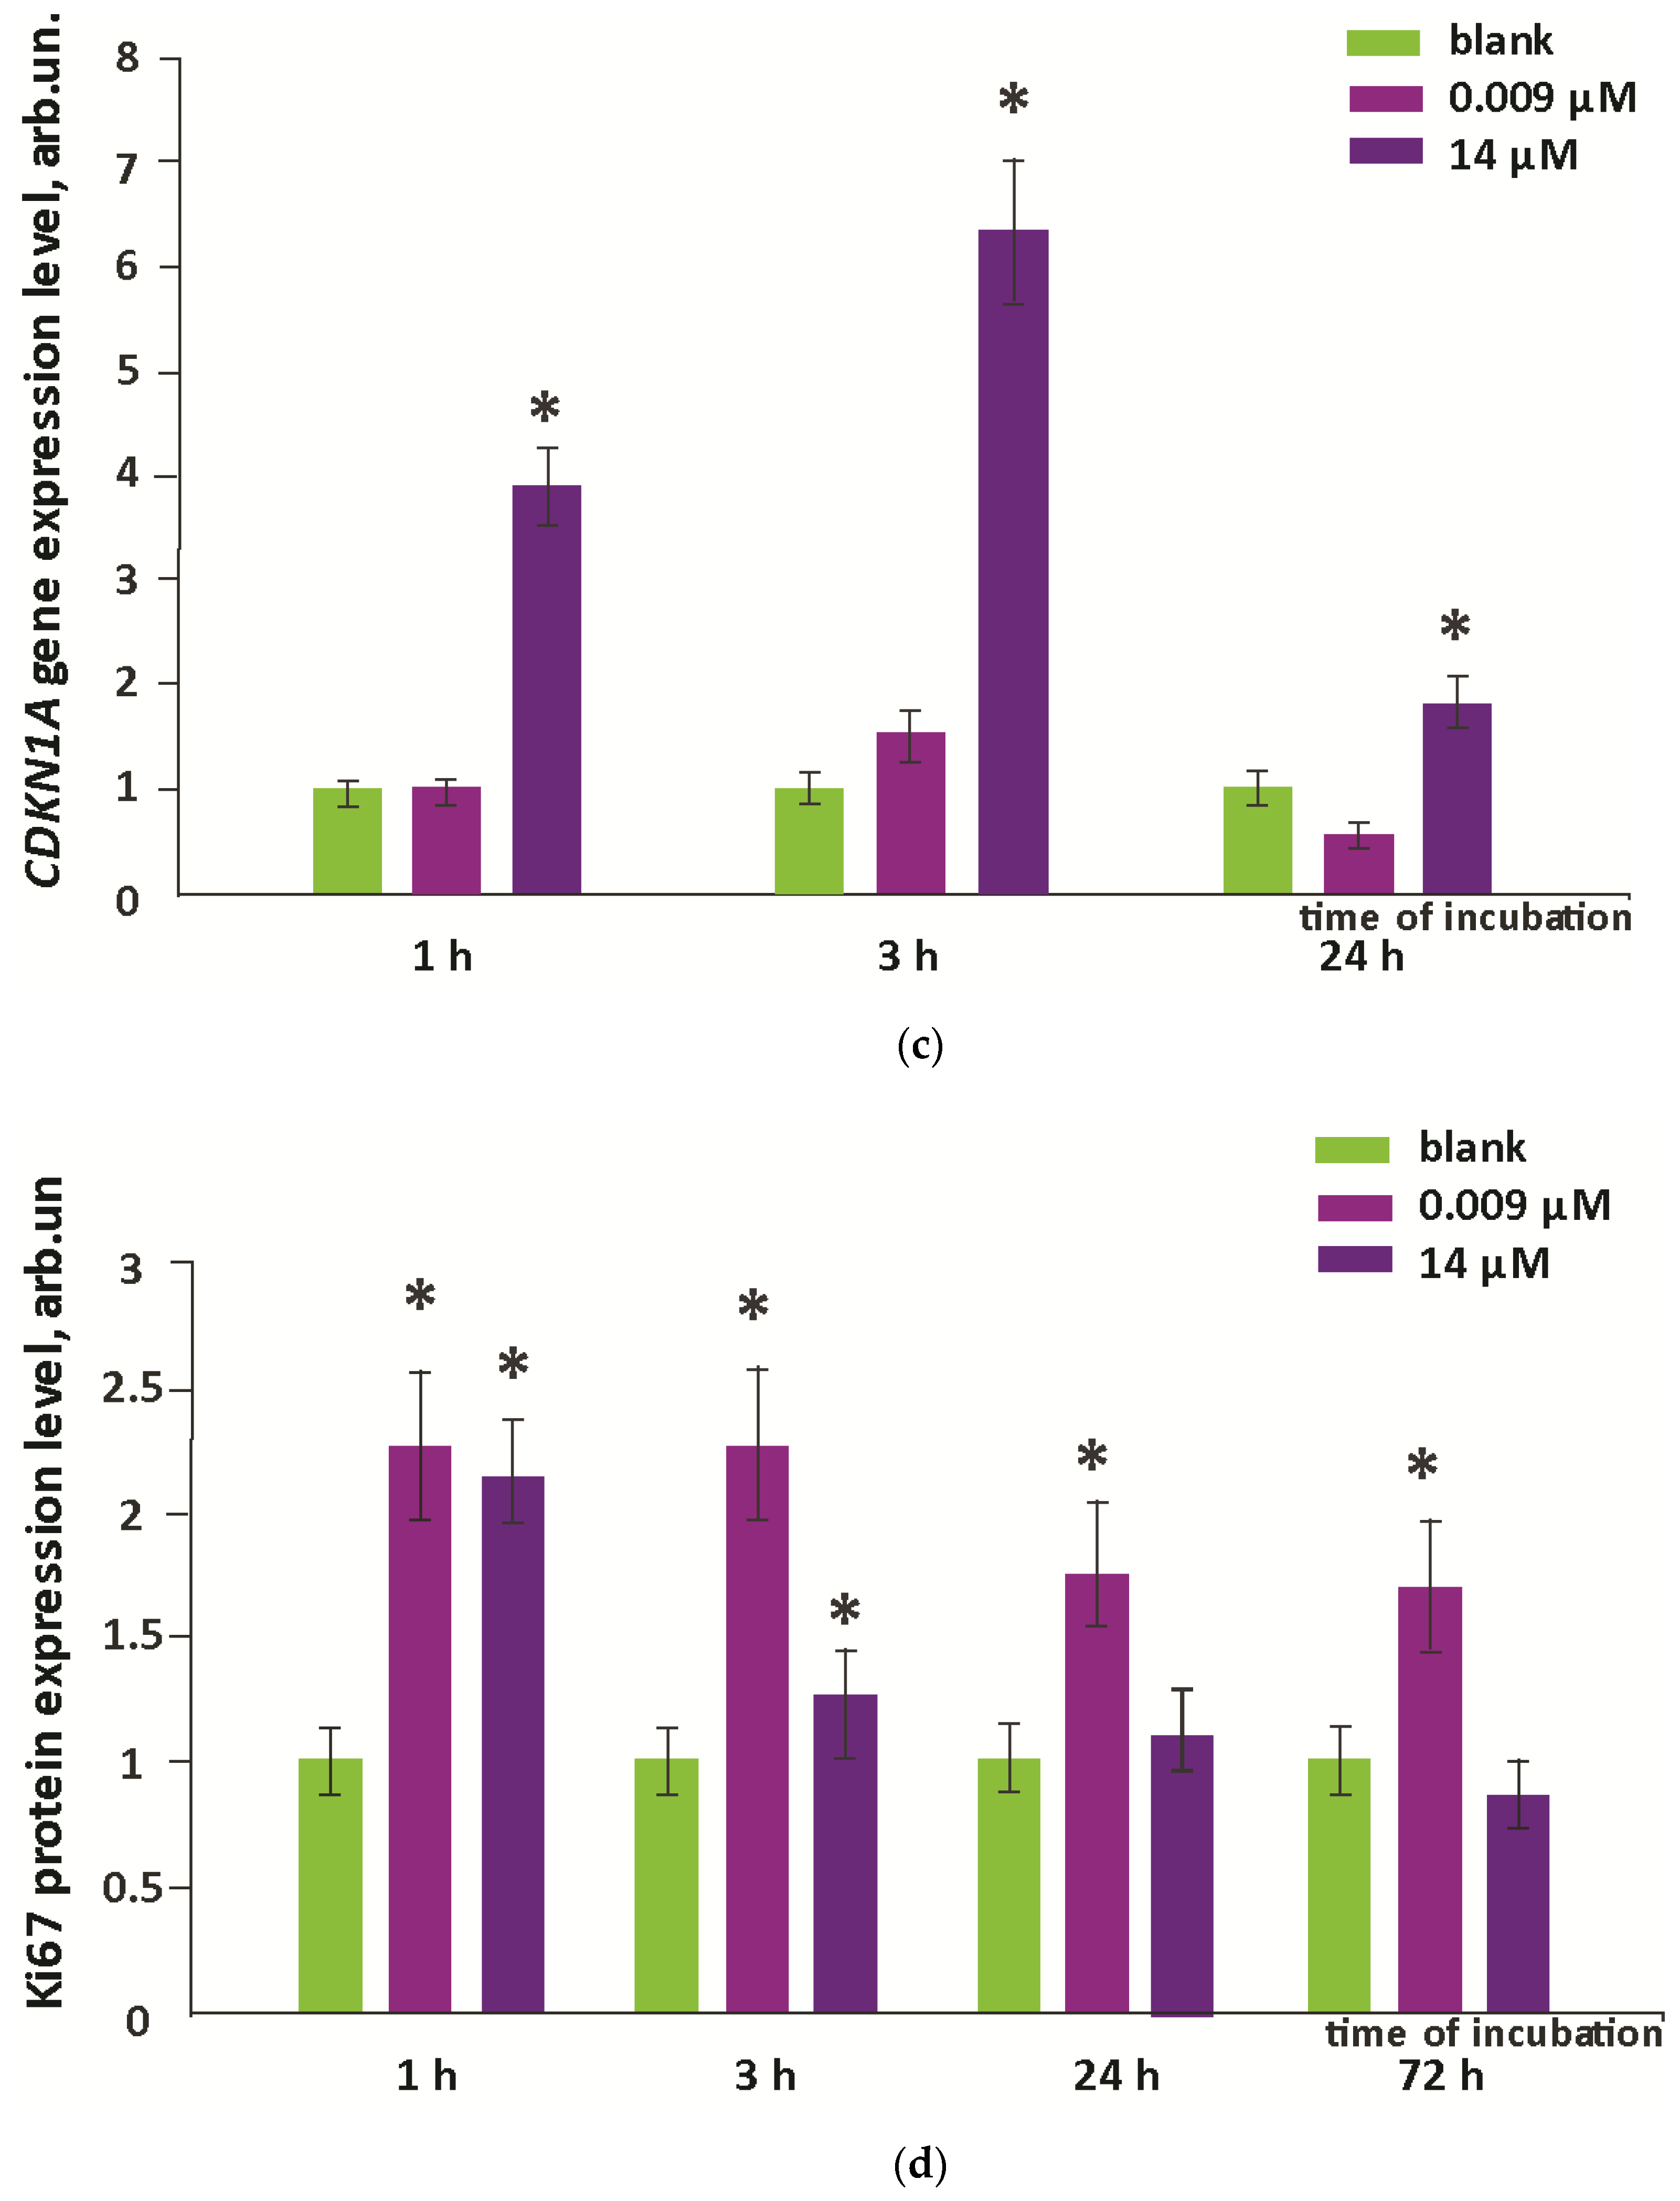
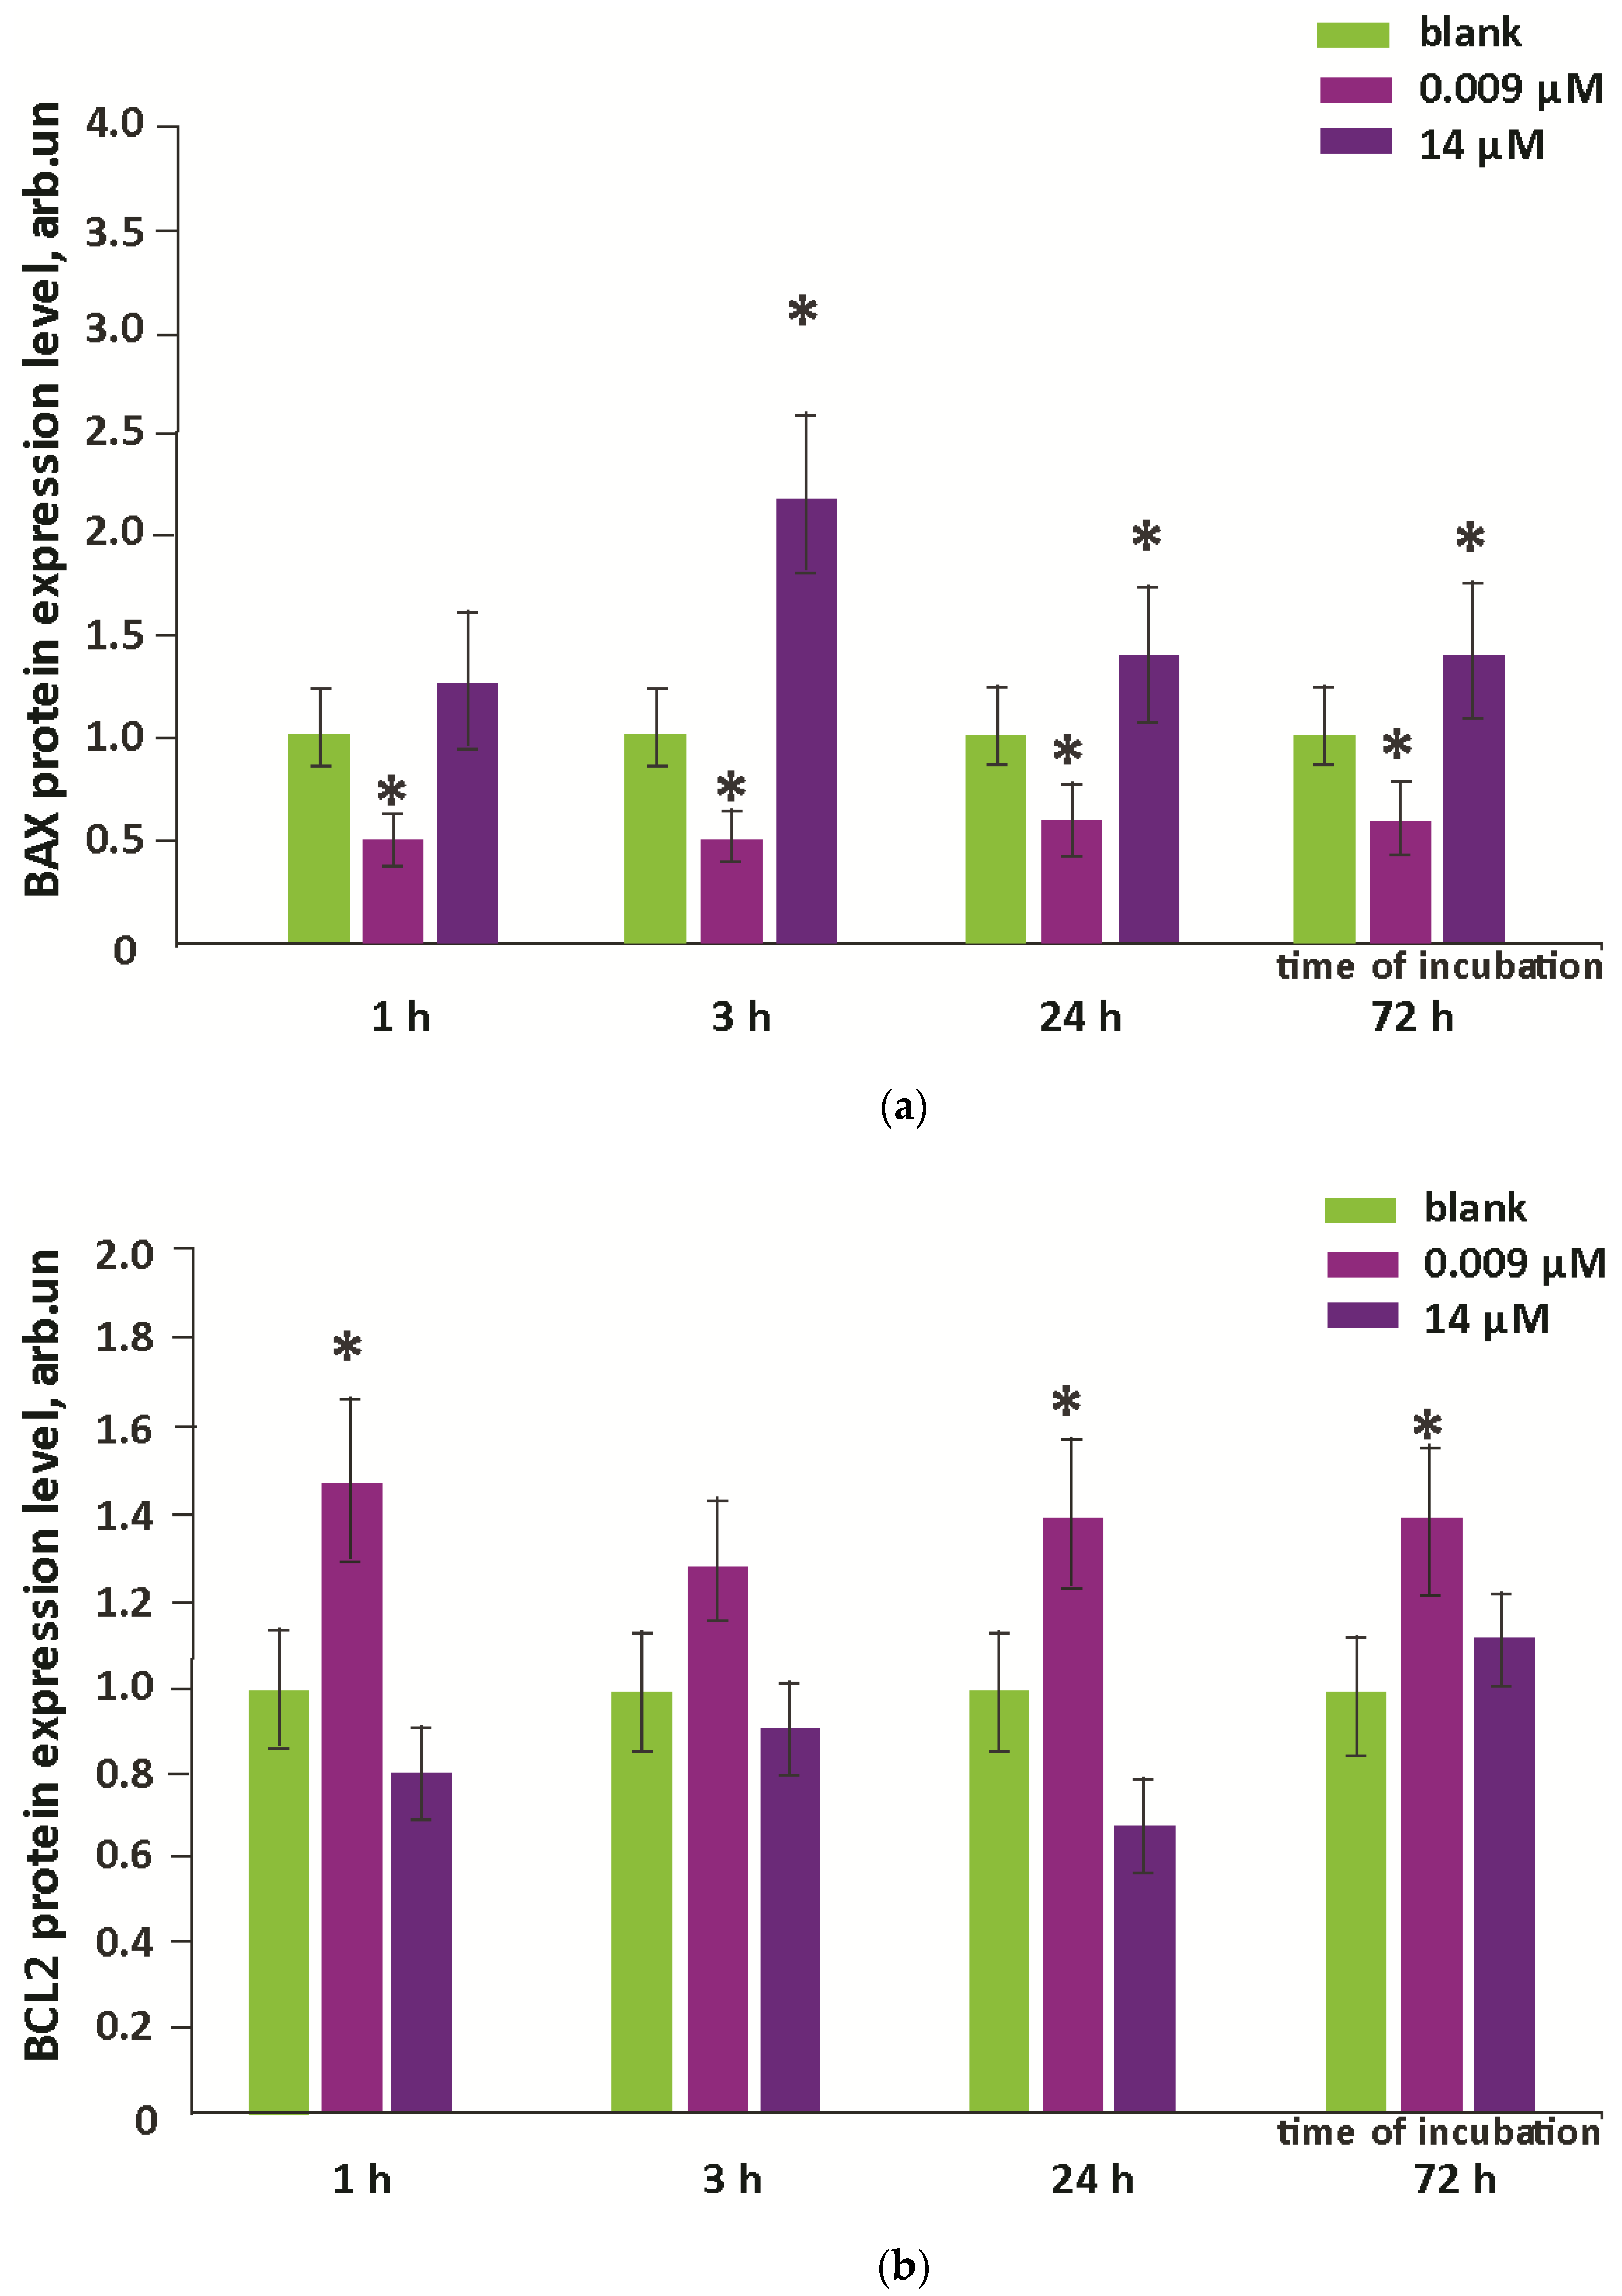
3. Results
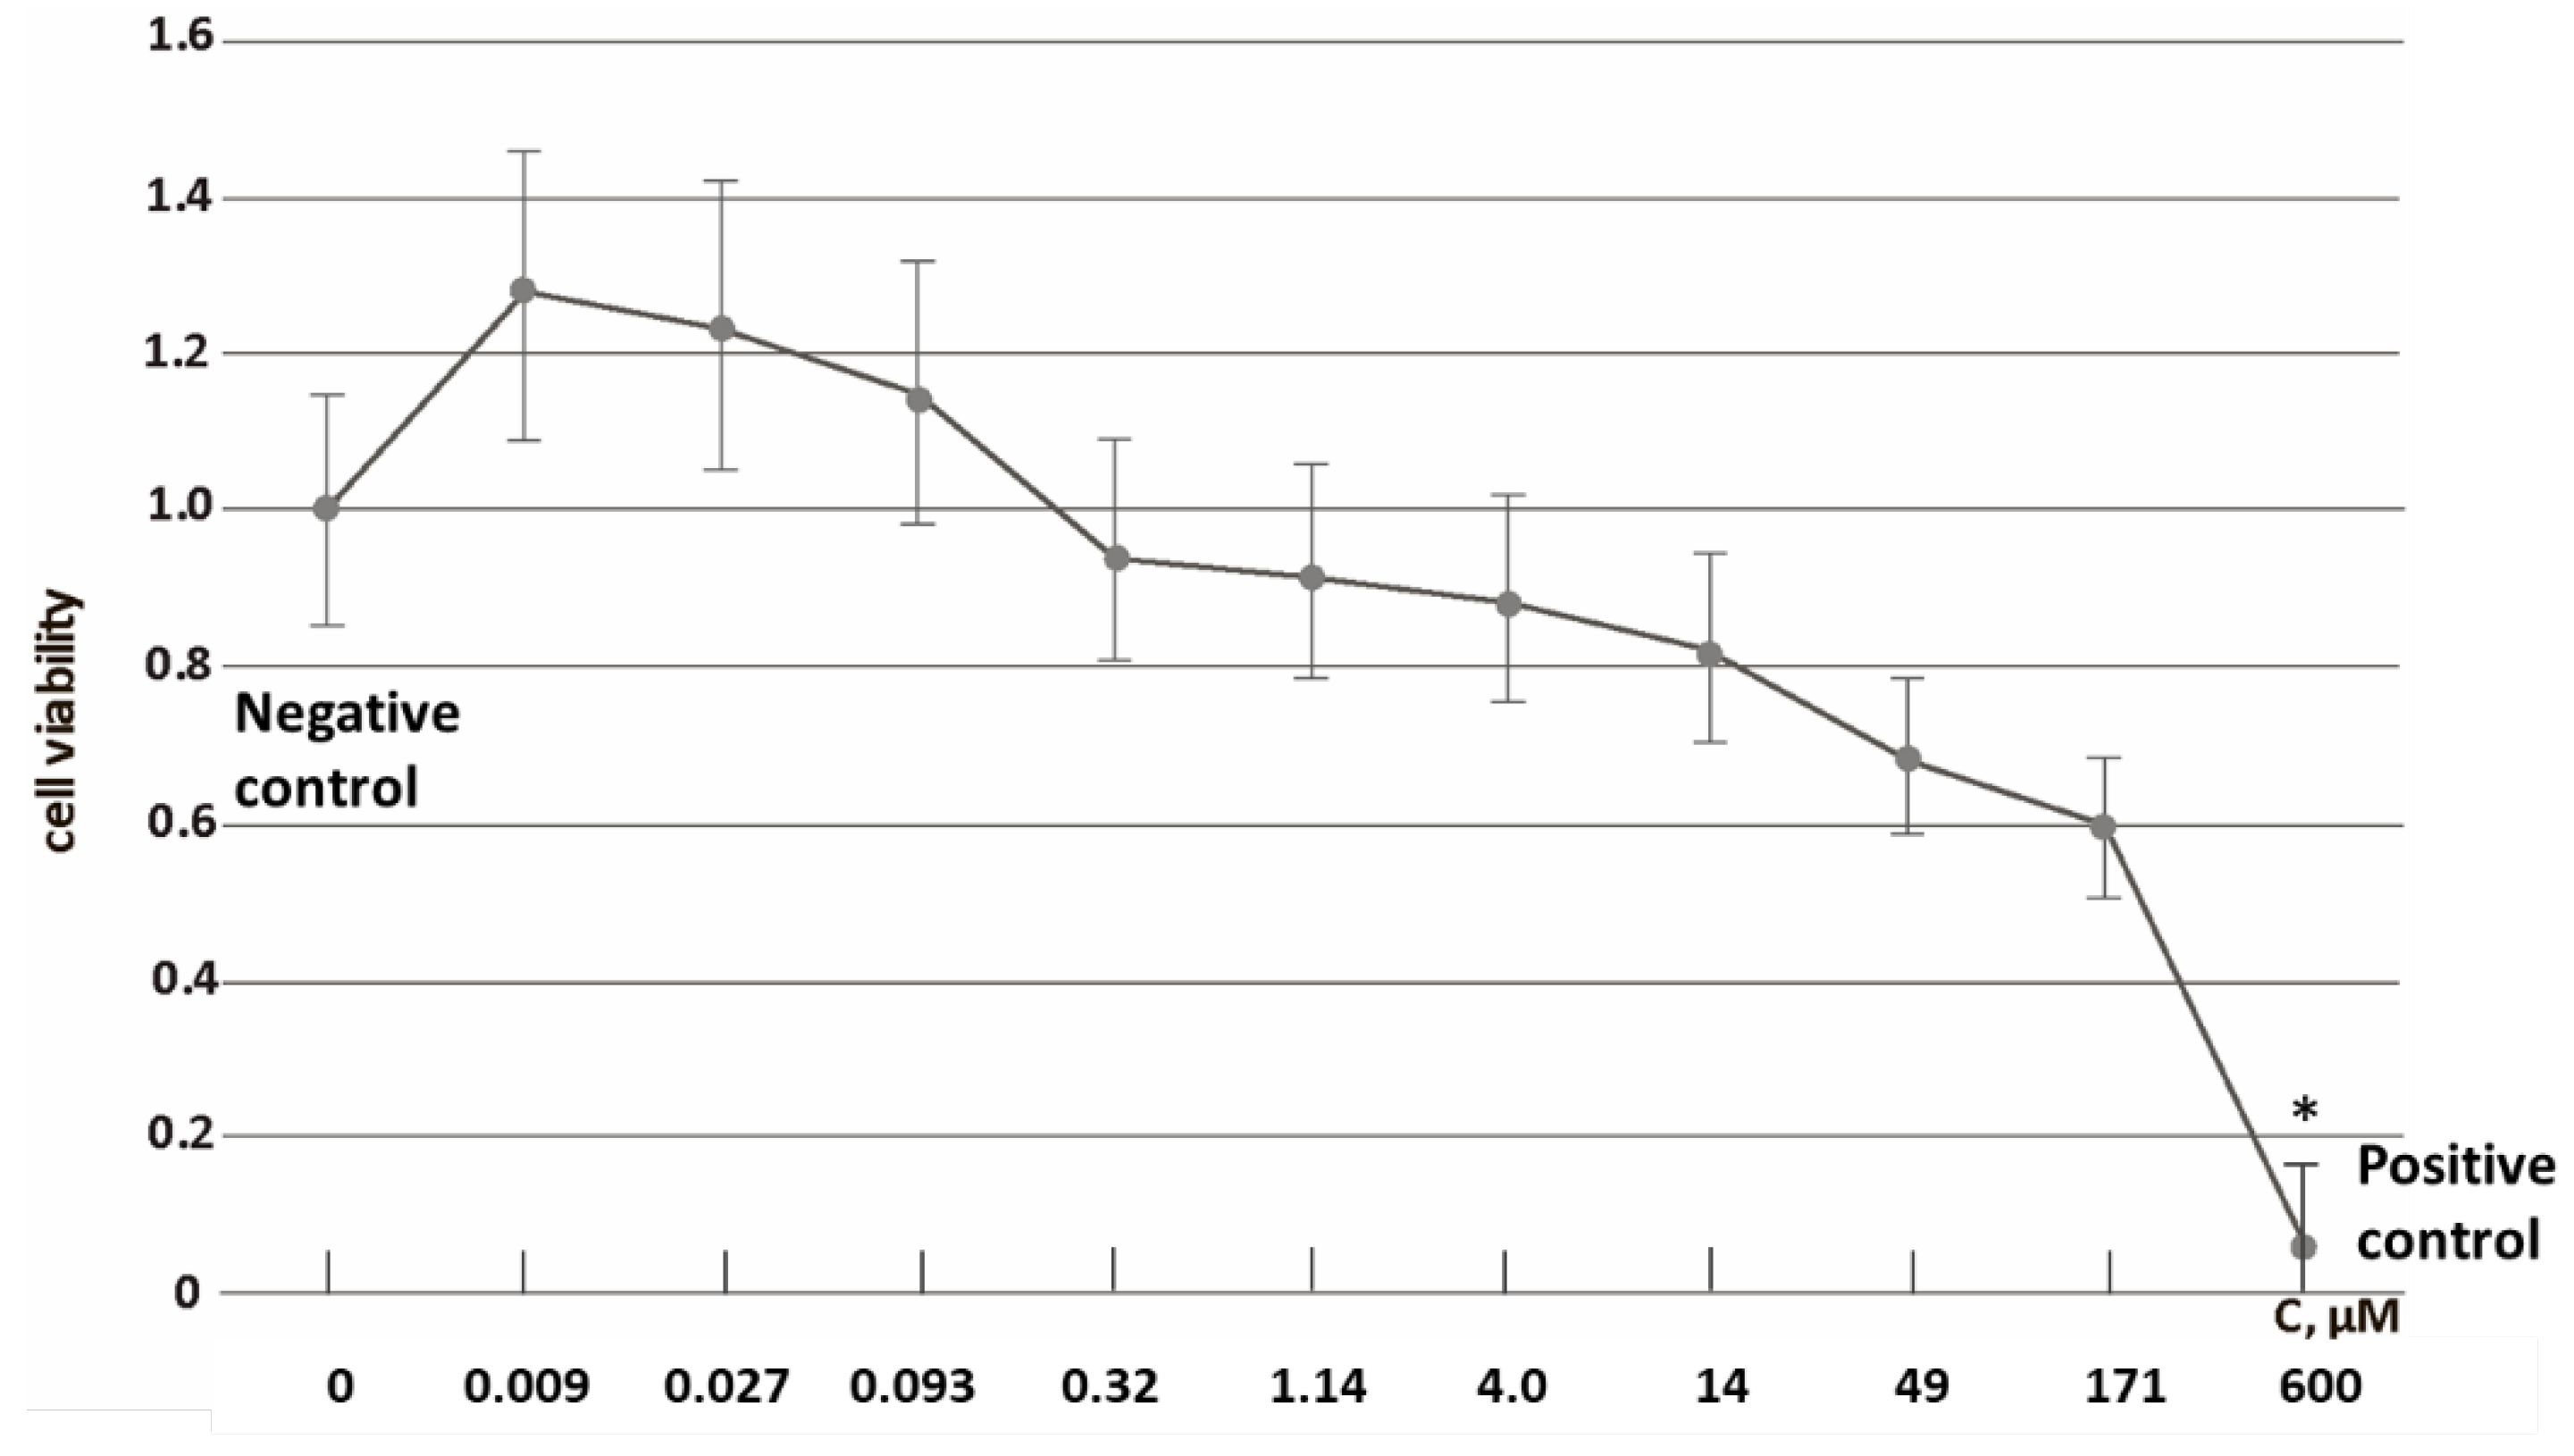
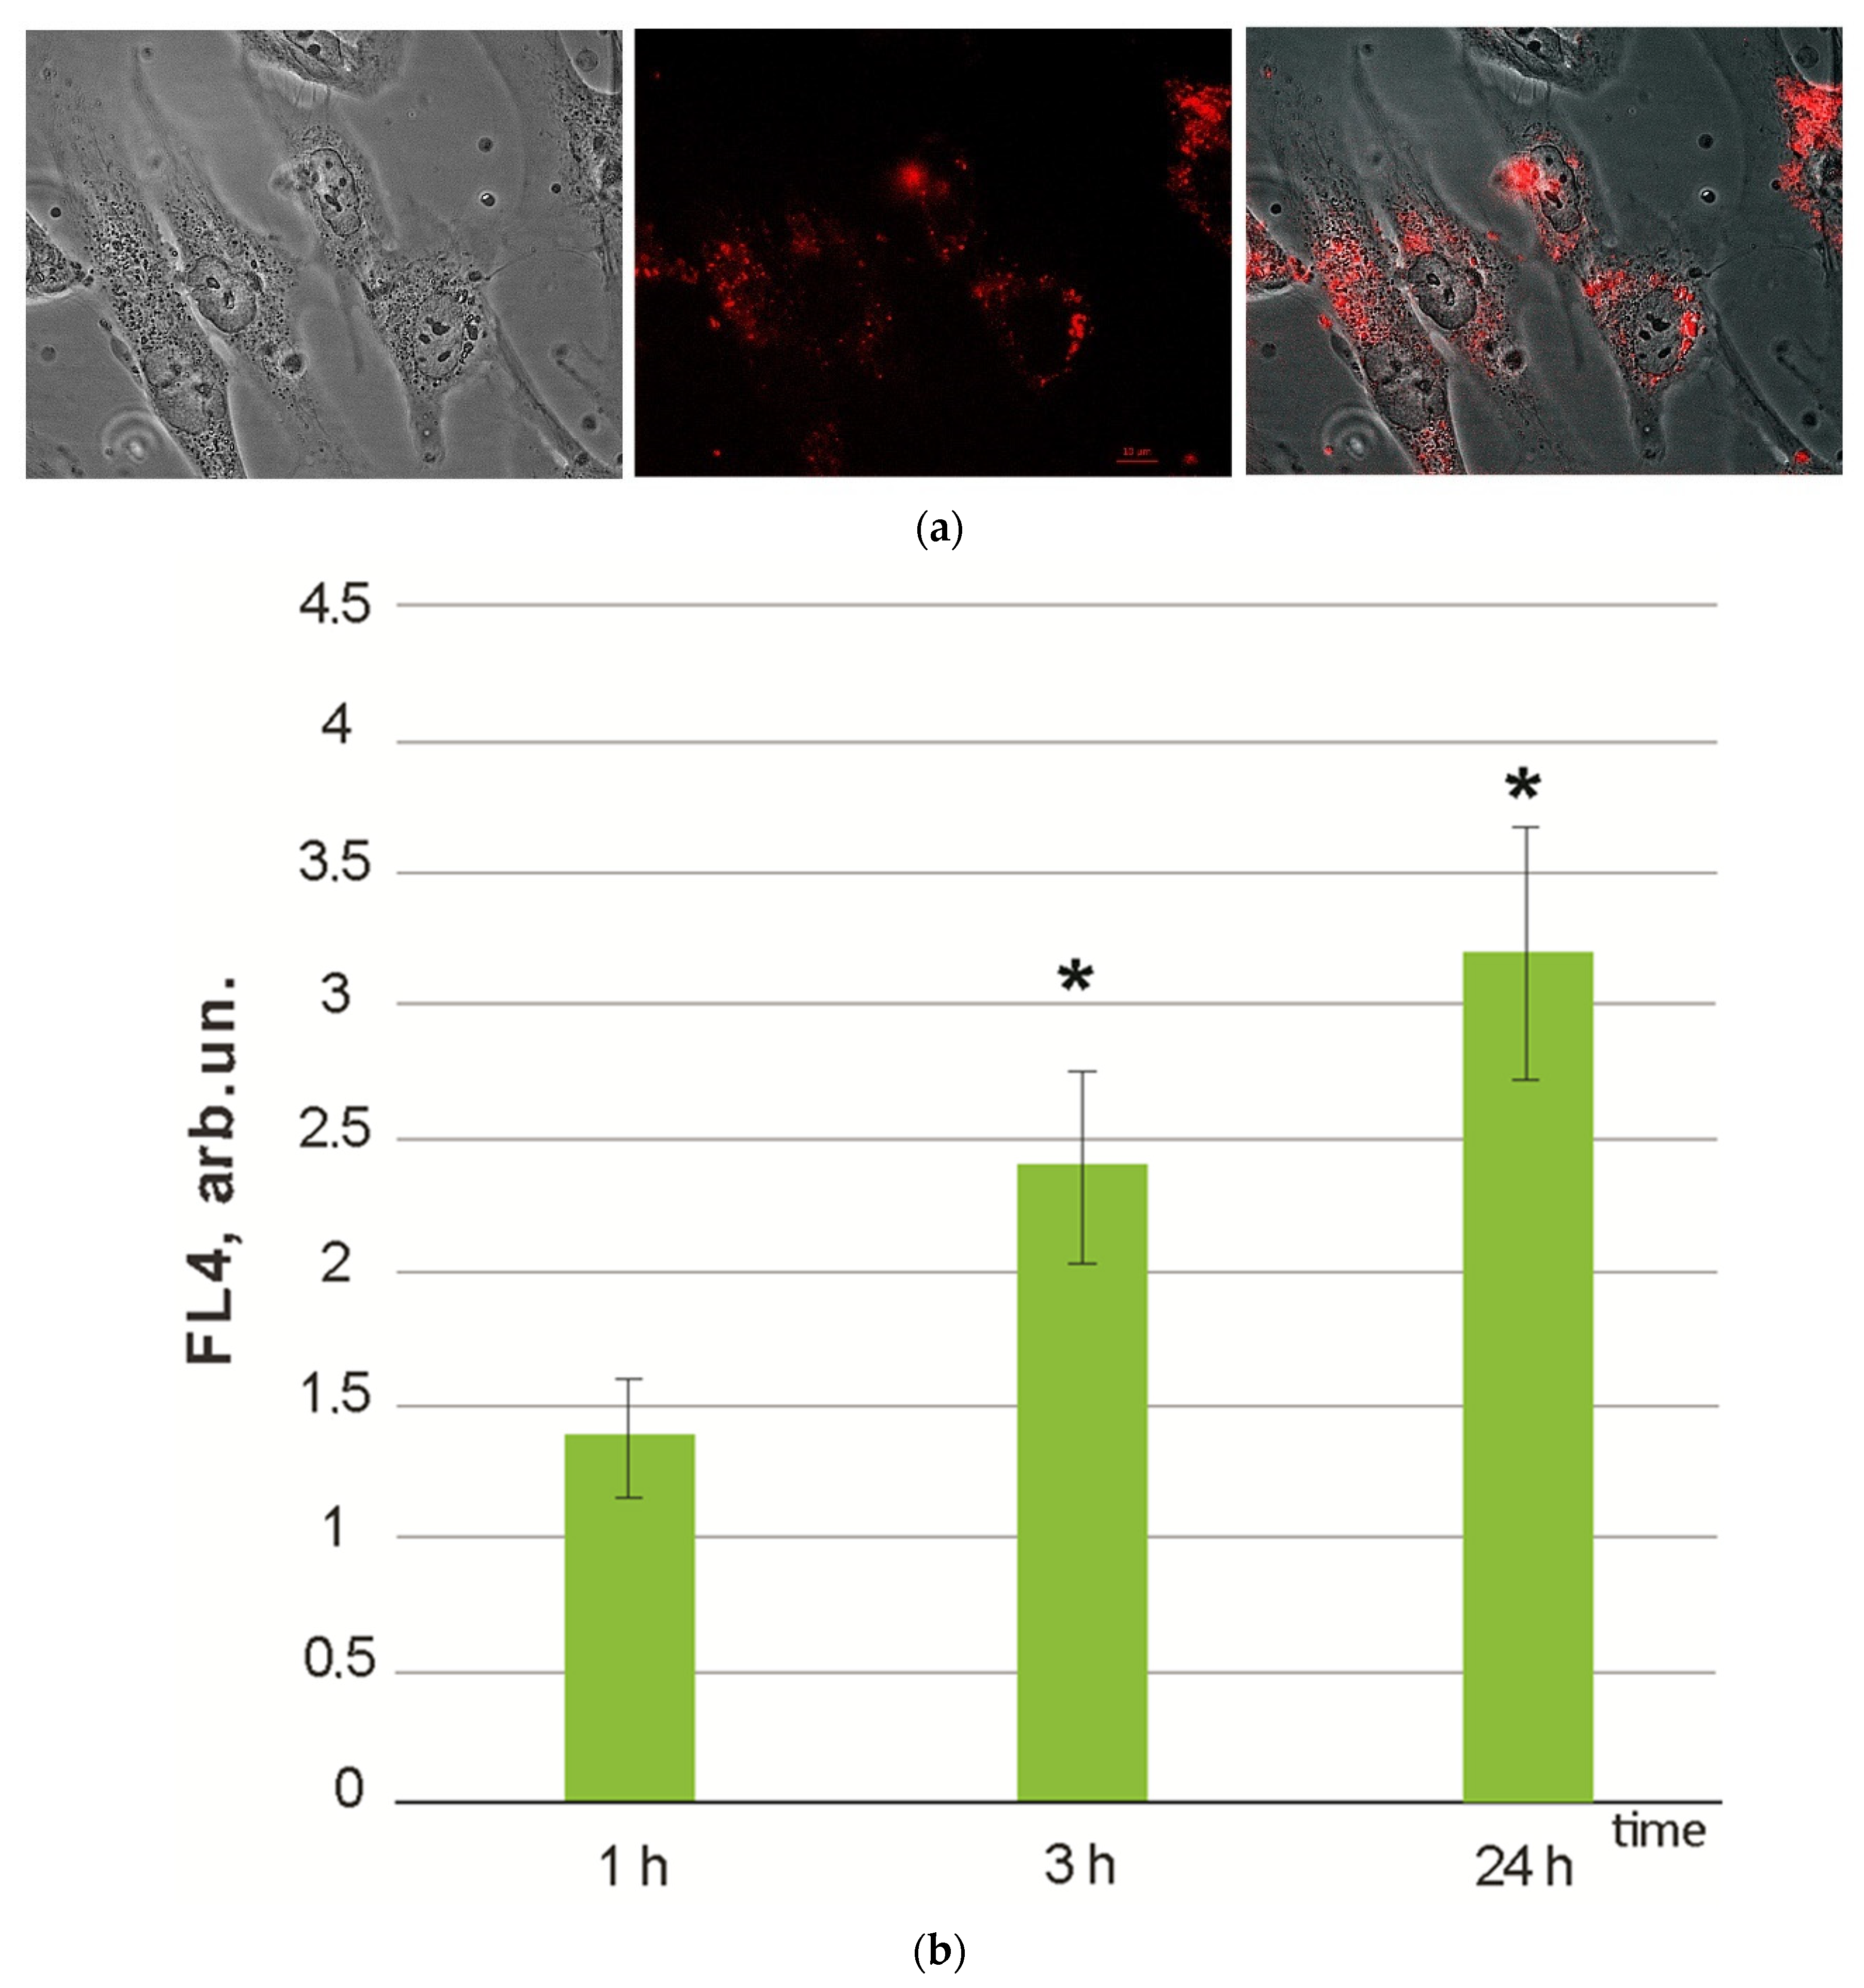
3.1. Cytotoxicity and Cell Penetration
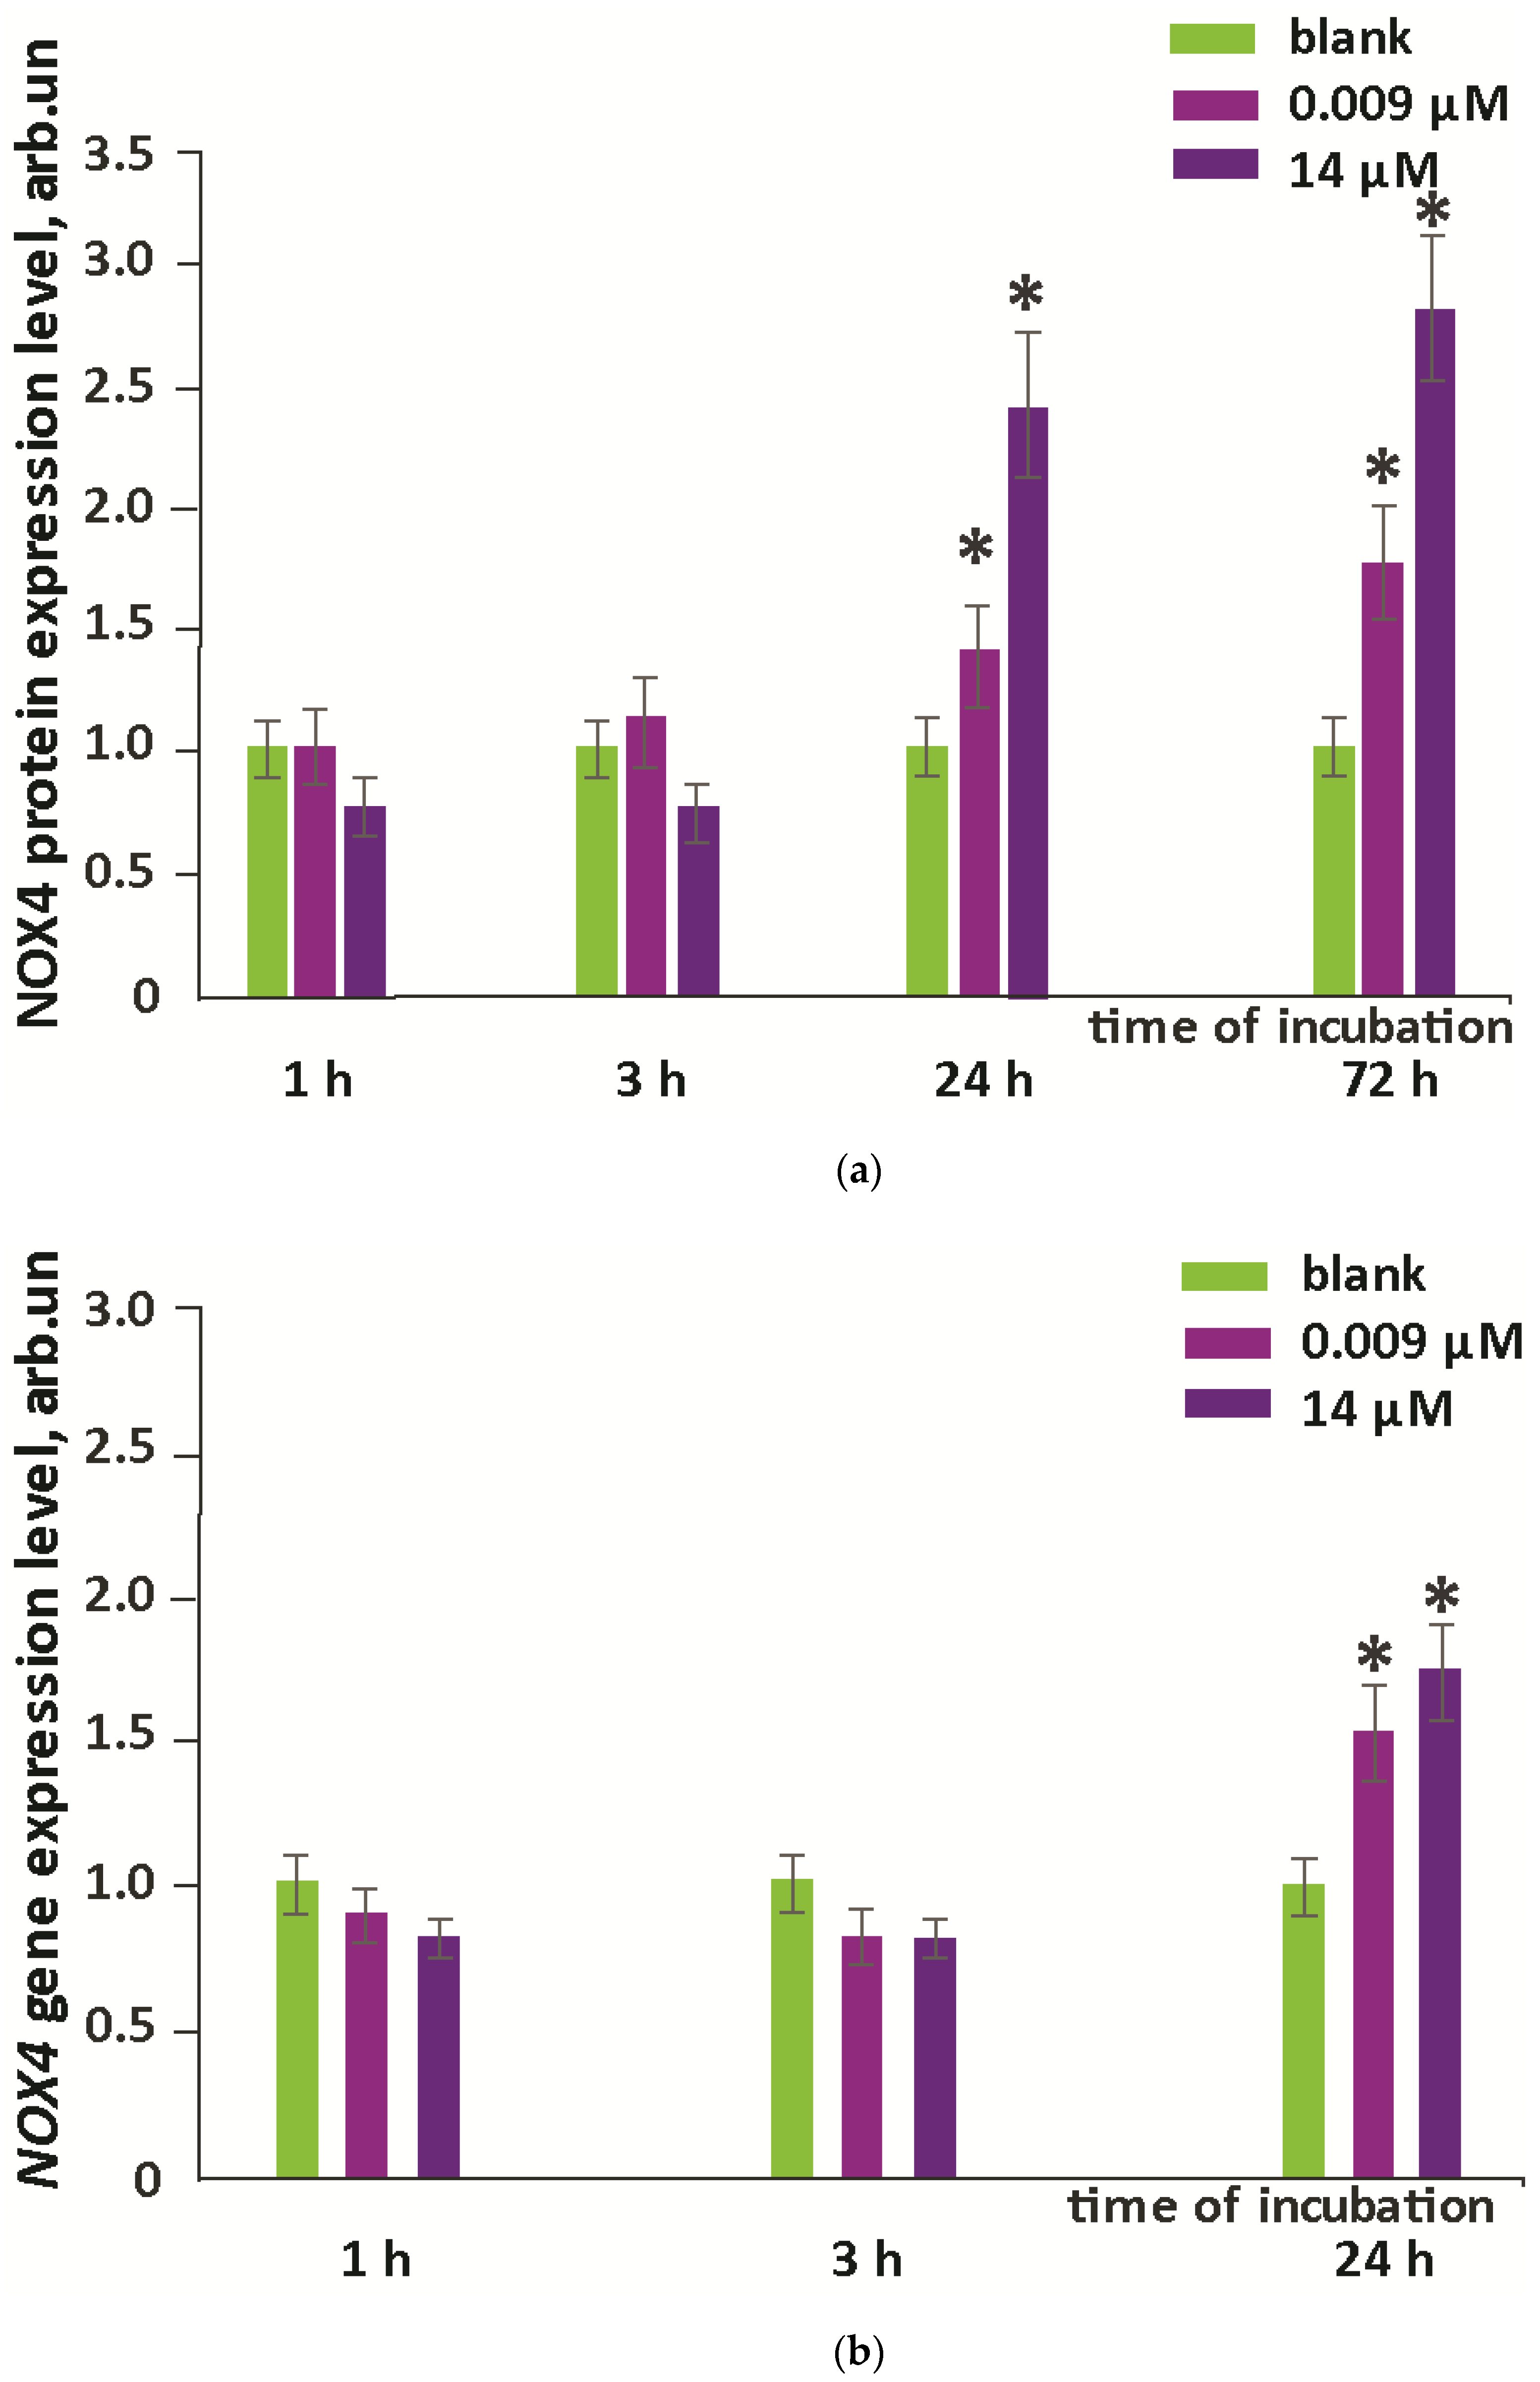
3.2. Intracellular ROS and NOX4 Gene Expression
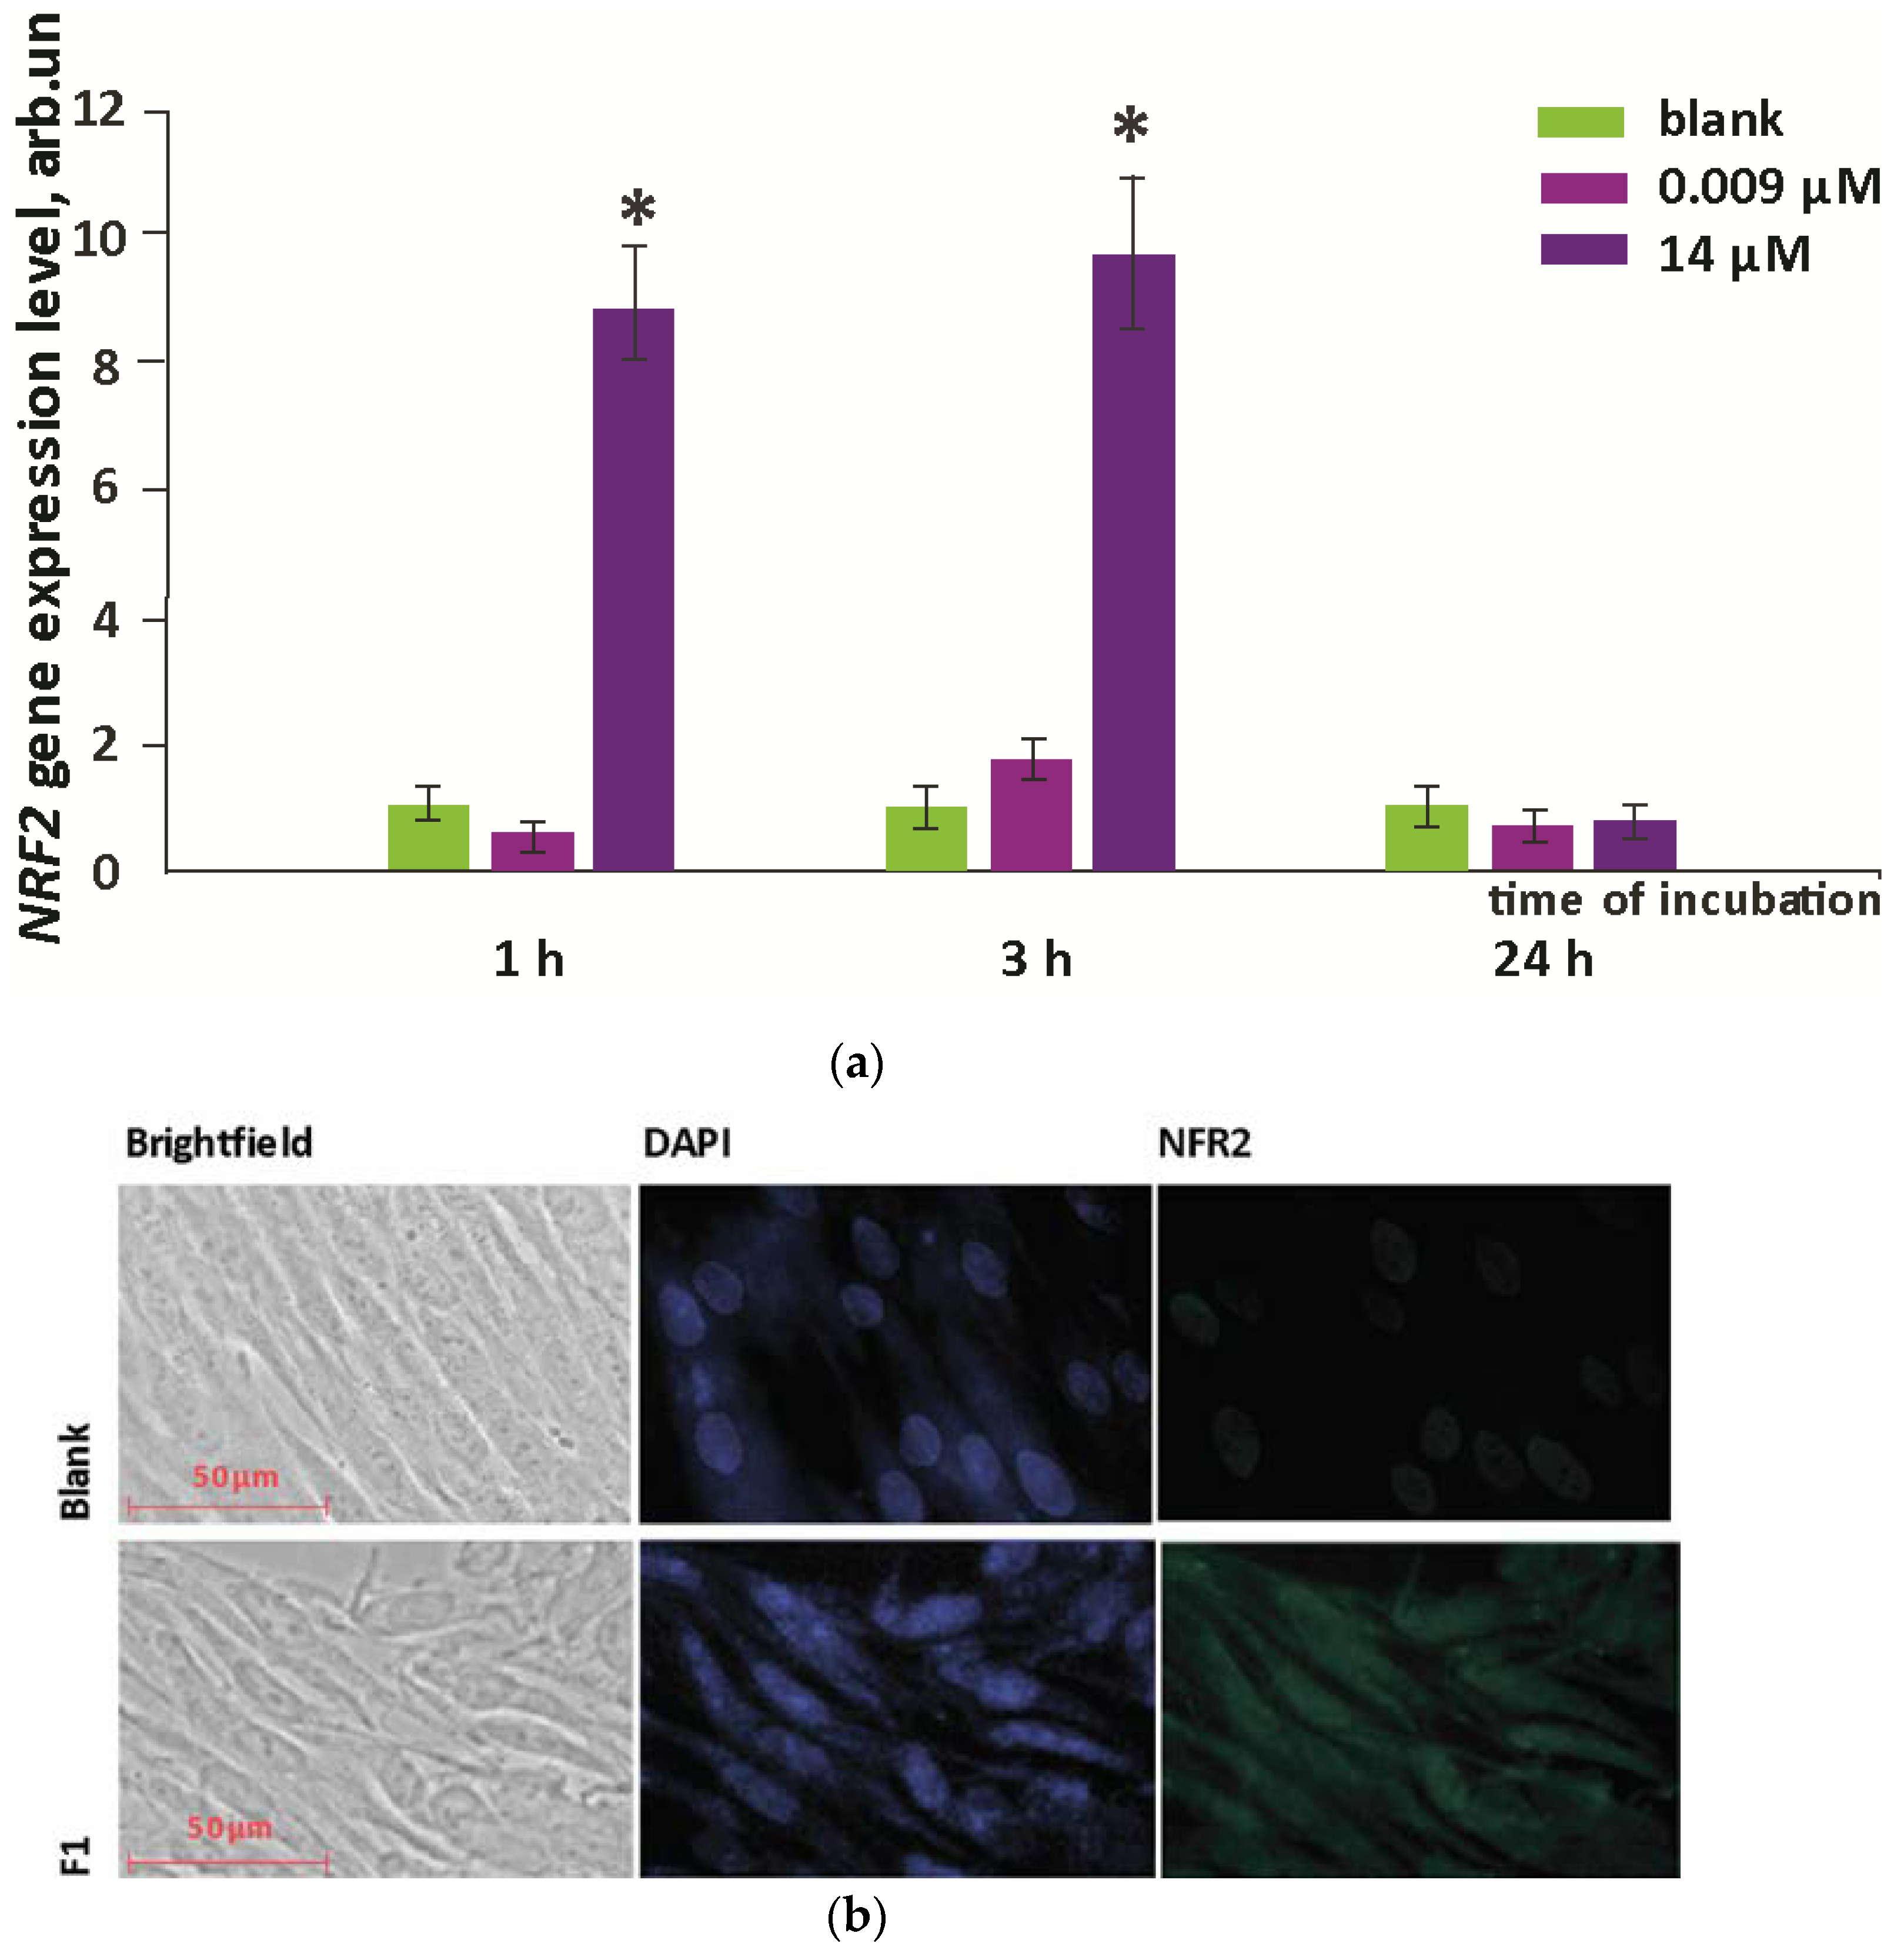
3.3. NRF2 Expression
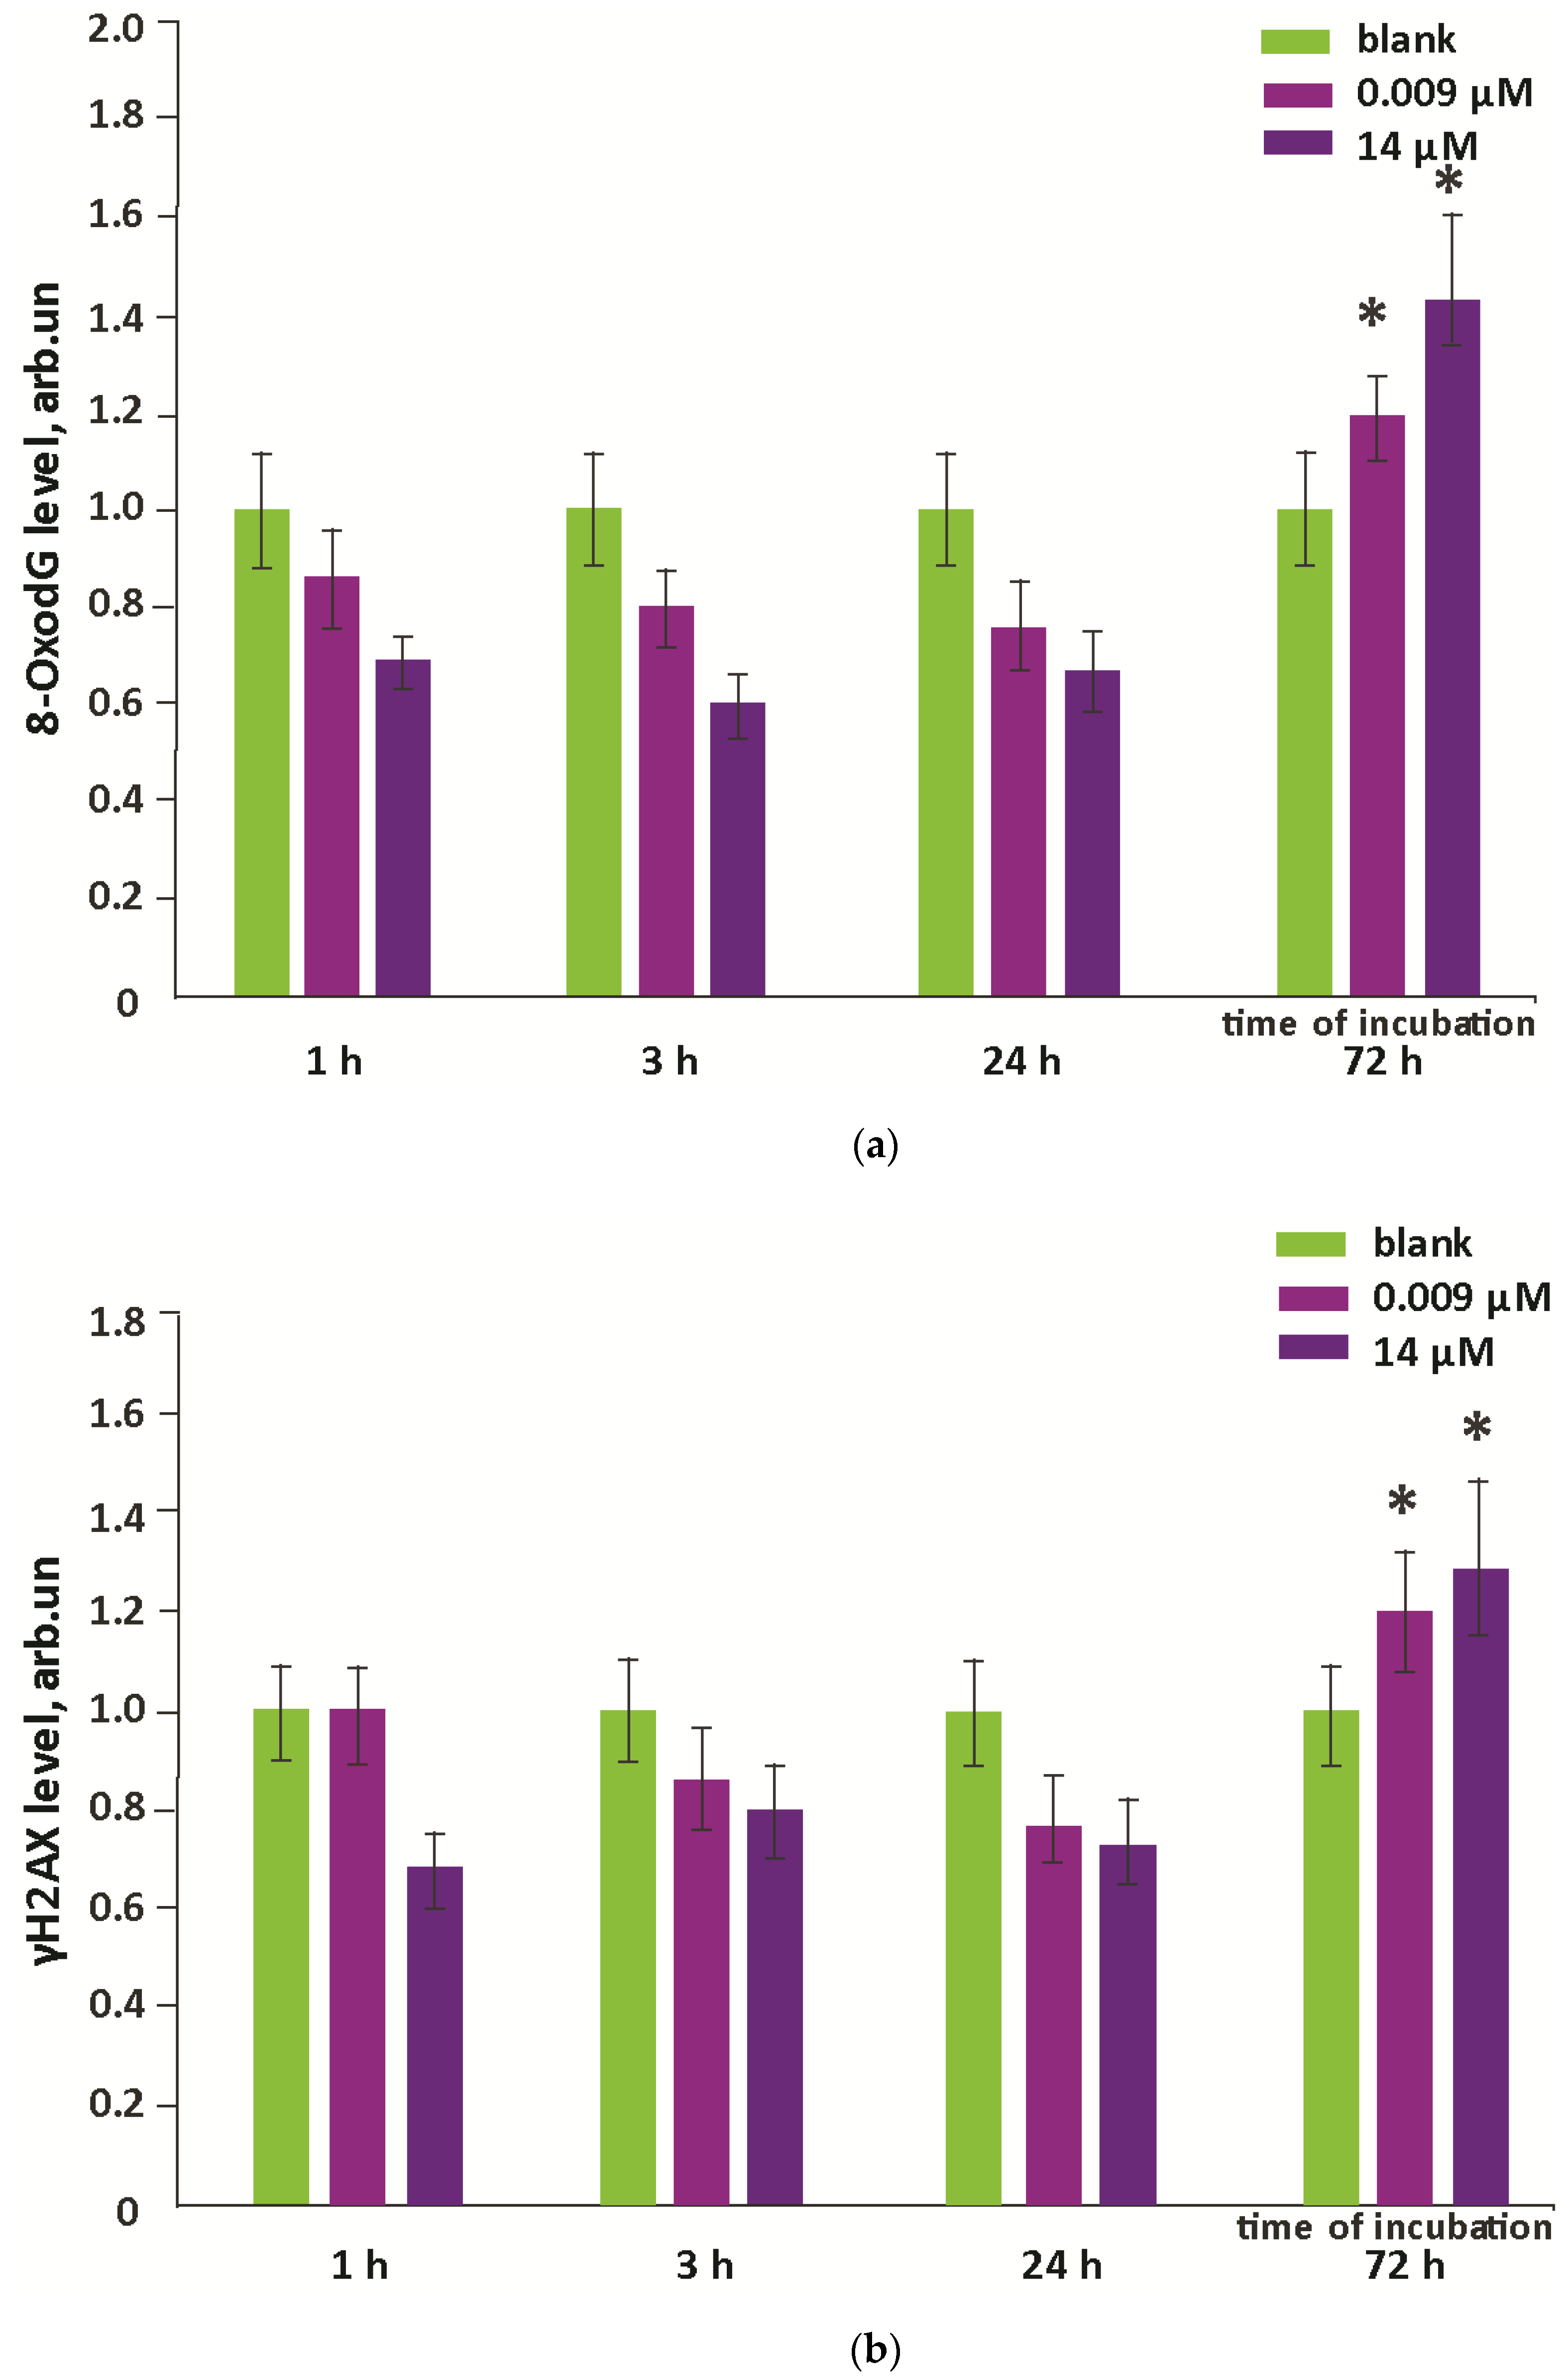
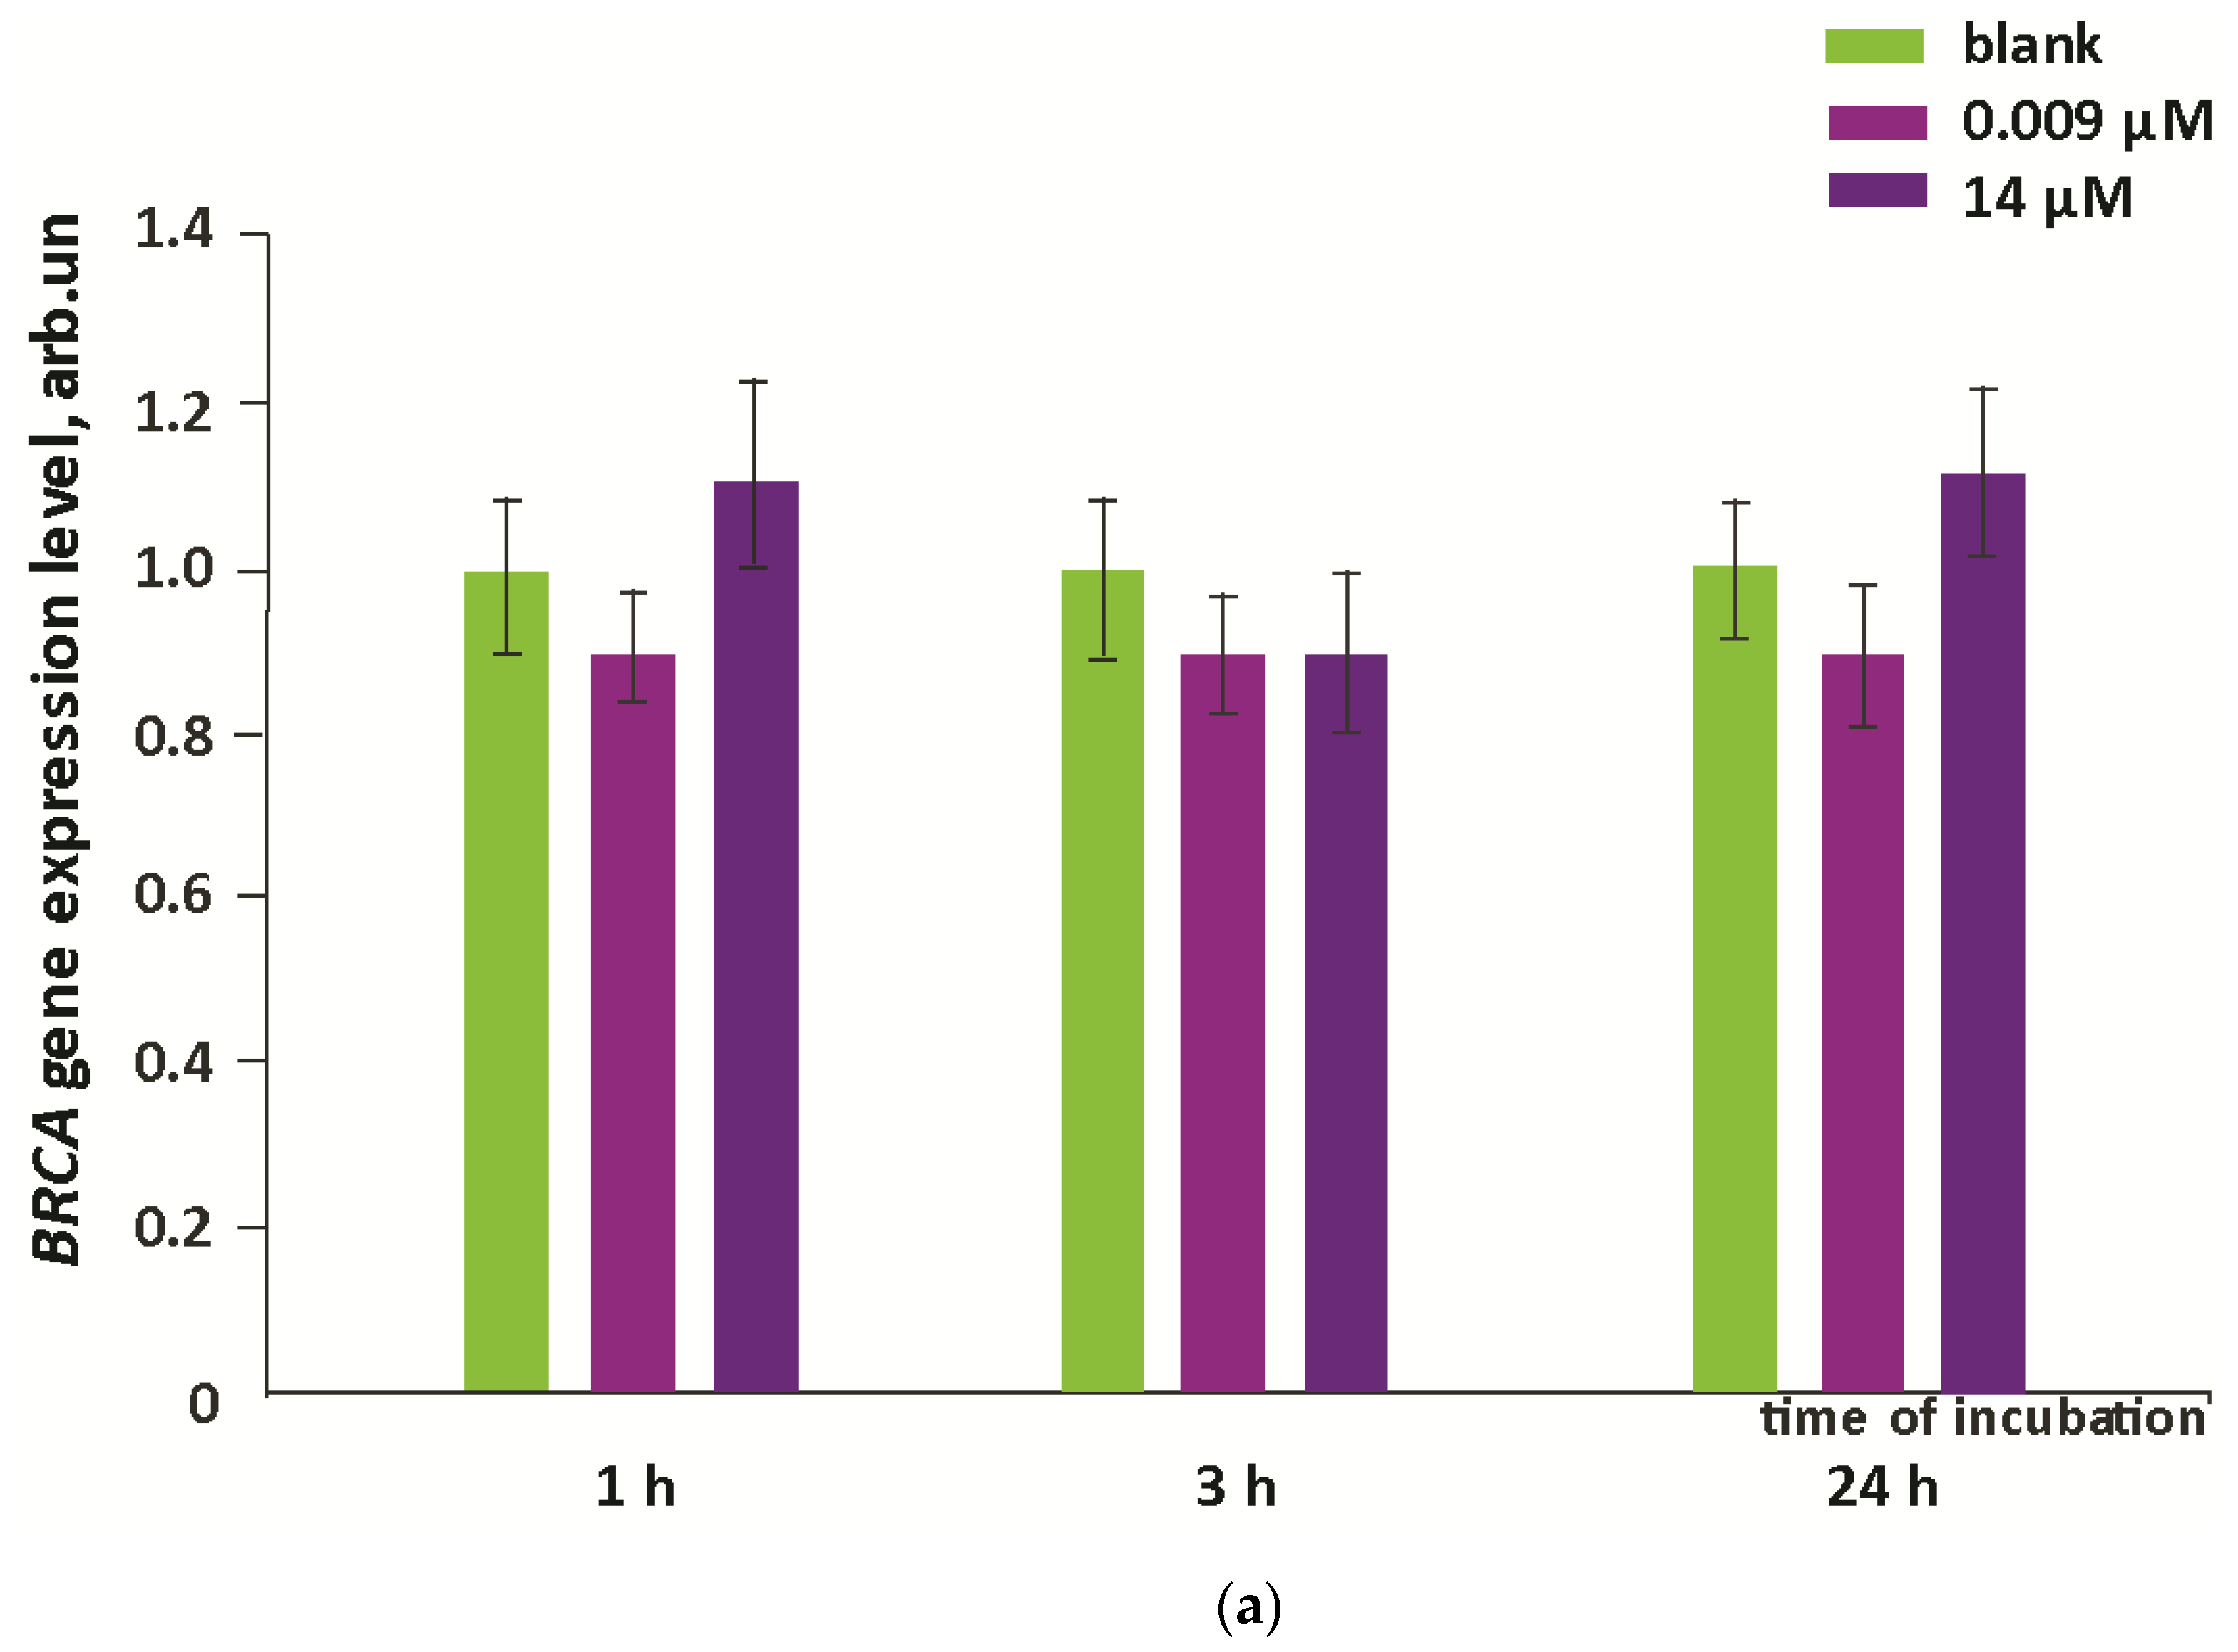
3.4. Oxidative Damage to DNA and Activation of Repair Genes
3.5. Proliferation and Apoptosis
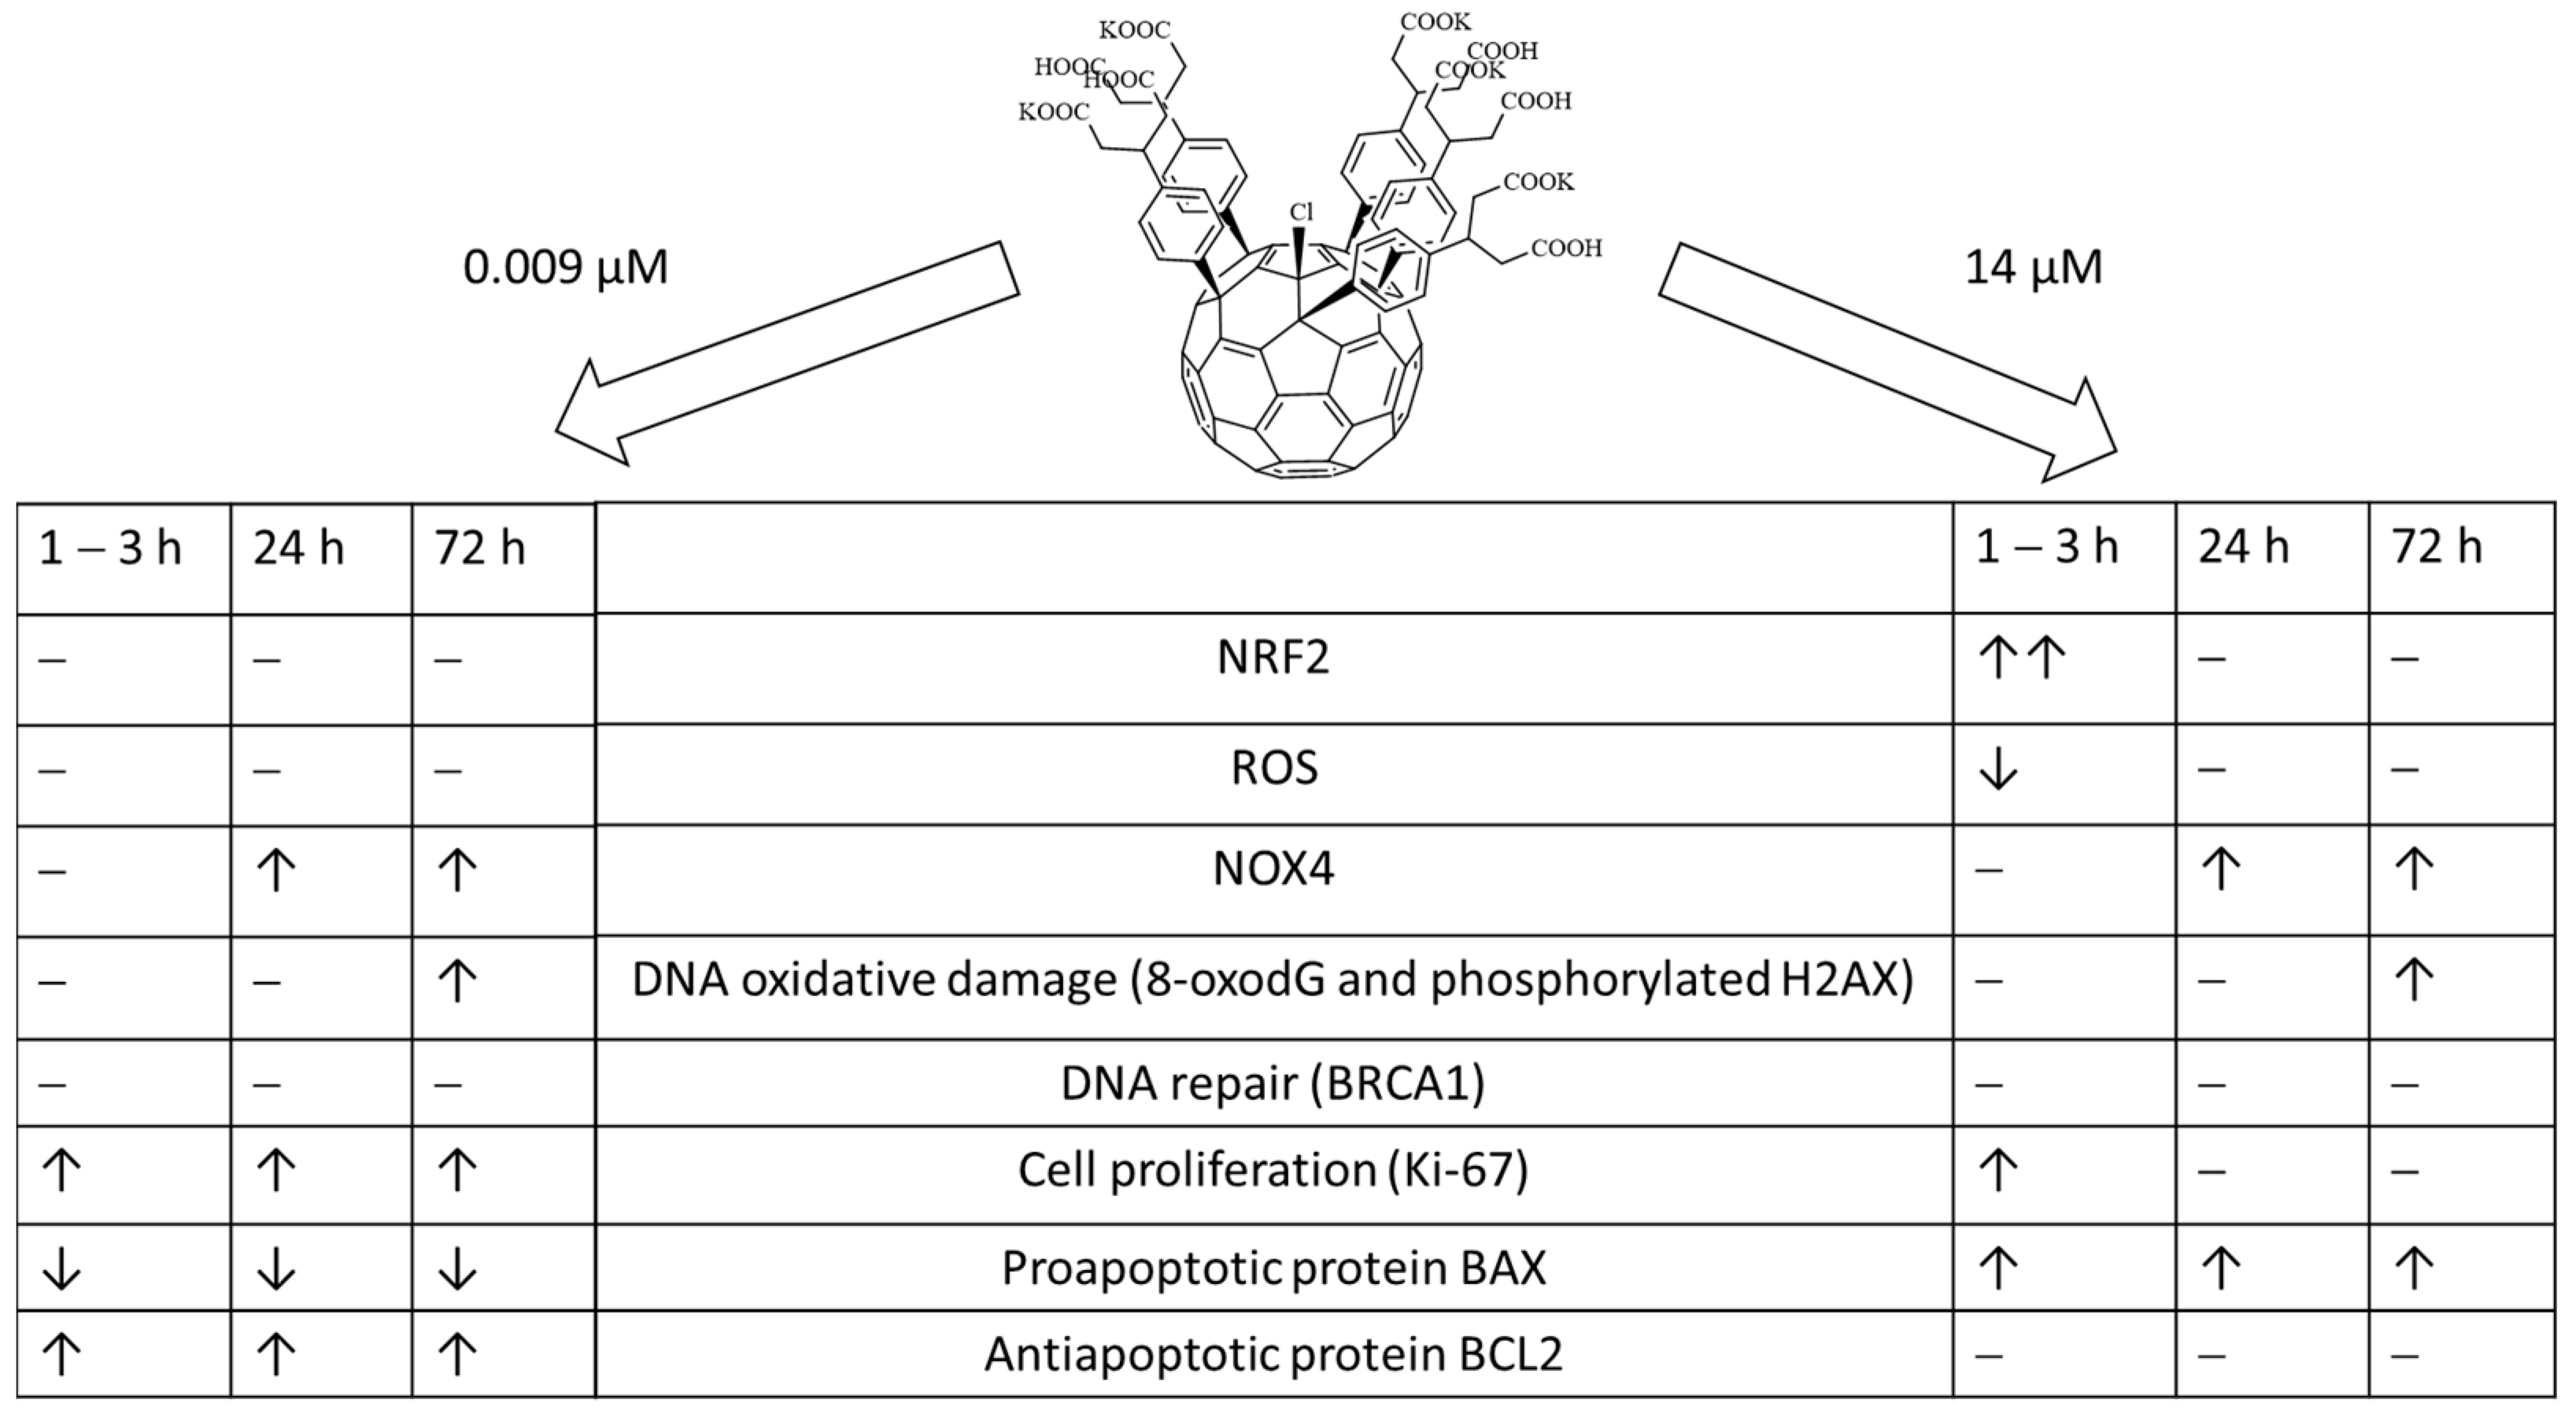
4. Discussion
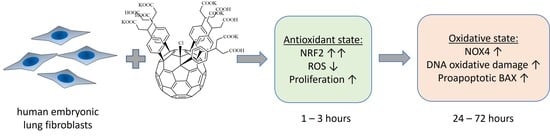
- Within 1–24 h of incubation, F1 penetrated through the cell membrane and accumulates in the cytoplasm.
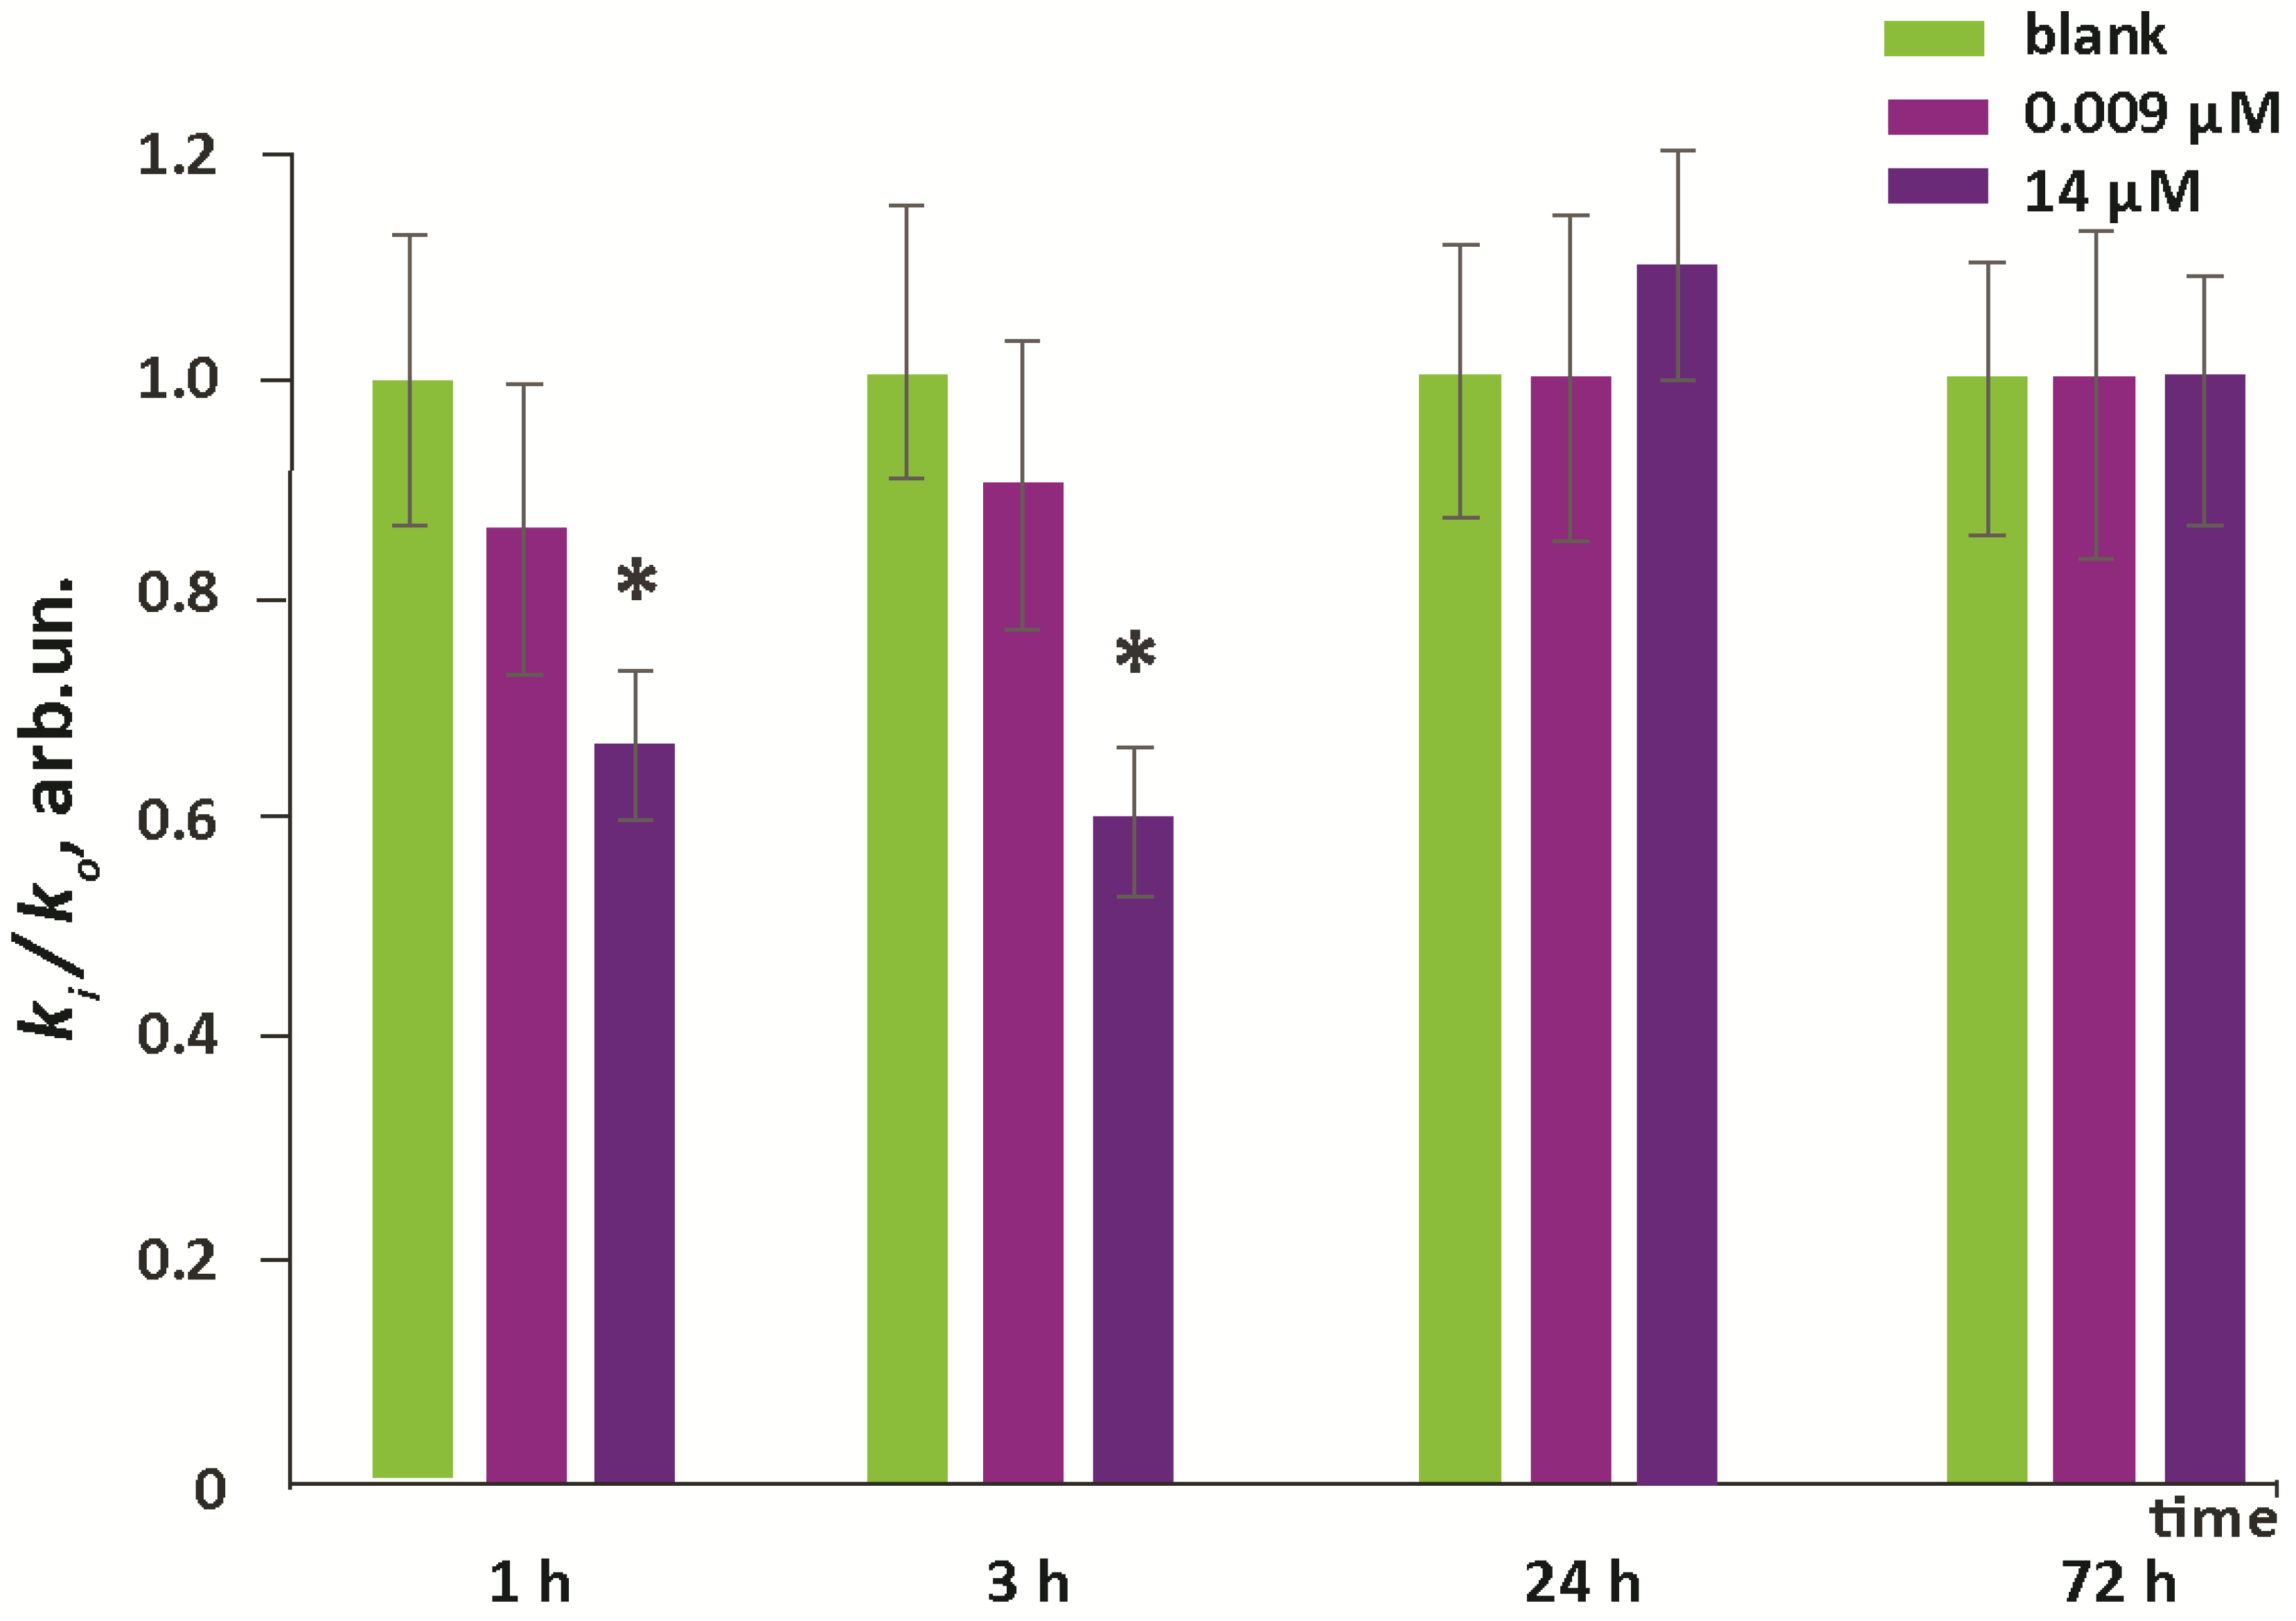
- During the first three hours after incubation, the level of intracellular ROS dropped by about 40% (for the higher concentration). Then, within a day, it was restored to the initial level, and then it did not change.
- During the first hour for the higher concentration of F1, the expression of the NRF2 gene, which was responsible for the anti-inflammatory and antioxidant response of the cell, increased by an order of magnitude; this increase was not a compensatory response to oxidative stress; thus, the studied compound is probably an activator of the NRF2 pathway.
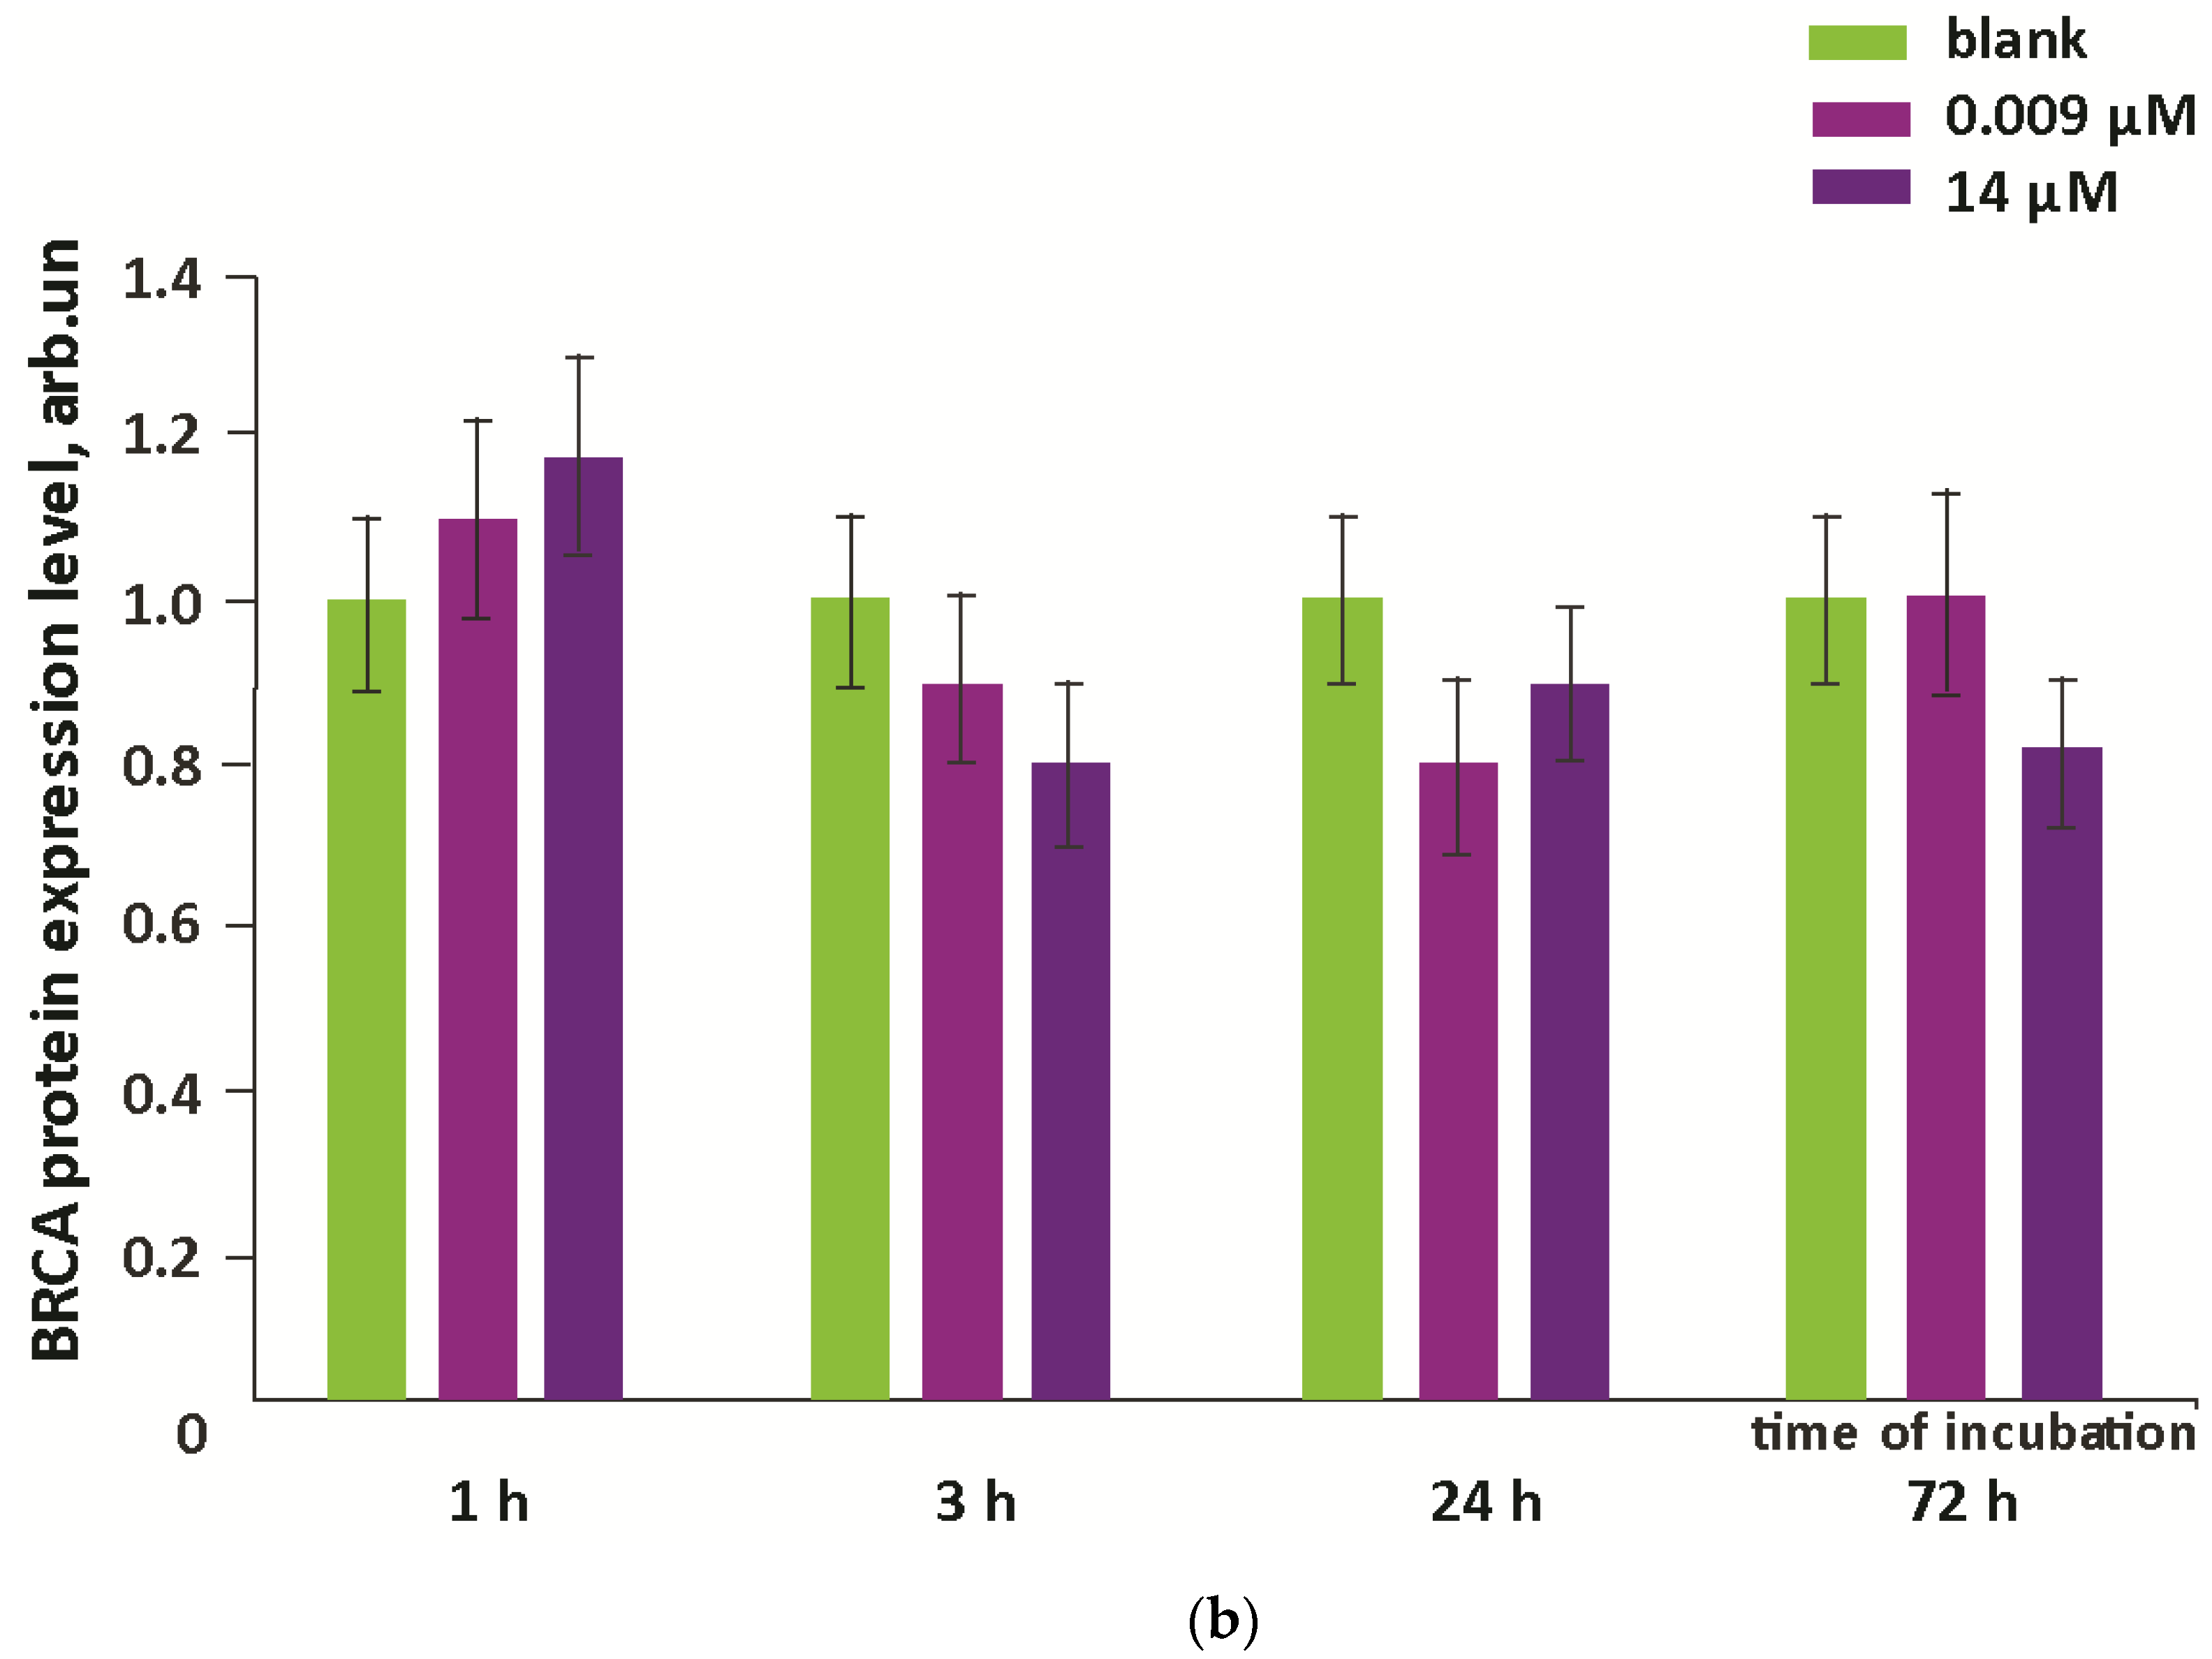
- In contrast, NOX4 expression increased by about 2.5-fold after one day of incubation (for both concentrations studied) and remained at about the same level after three days.
- Oxidative damage of DNA occurred on the third day after incubation, while the activity of repair genes did not change.
5. Conclusions
Supplementary Materials
Author Contributions
Funding
Institutional Review Board Statement
Informed Consent Statement
Data Availability Statement
Conflicts of Interest
References
- Gaur, M.; Misra, C.; Yadav, A.B.; Swaroop, S.; Maolmhuaidh, F.O.; Bechelany, M.; Barhoum, A. Biomedical Applications of Carbon Nanomaterials: Fullerenes, Quantum Dots, Nanotubes, Nanofibers, and Graphene. Materials 2021, 14, 5978. [Google Scholar] [CrossRef] [PubMed]
- Chistyakov, V.A.; Smirnova, Y.O.; Prazdnova, E.V.; Soldatov, A.V. Possible mechanisms of fullerene C(6)(0) antioxidant action. BioMed Res. Int. 2013, 2013, 821498. [Google Scholar] [CrossRef] [PubMed] [Green Version]
- Markovic, Z.; Trajkovic, V. Biomedical potential of the reactive oxygen species generation and quenching by fullerenes (C60). Biomaterials 2008, 29, 3561–3573. [Google Scholar] [CrossRef] [PubMed]
- Kraevaya, O.A.; Novikov, A.V.; Shestakov, A.F.; Ershova, E.S.; Savinova, E.A.; Kameneva, L.V.; Veiko, N.N.; Schols, D.; Balzarini, J.; Kostyuk, S.V.; et al. Water-soluble fullerene-based nanostructures with promising antiviral and myogenic activity. Chem. Commun. 2020, 56, 10203–10206. [Google Scholar] [CrossRef]
- Li, T.; Dorn, H.C. Biomedical Applications of Metal-Encapsulated Fullerene Nanoparticles. Small 2017, 13, 1603152. [Google Scholar] [CrossRef]
- Huang, J.; Zhou, C.; He, J.; Hu, Z.; Guan, W.C.; Liu, S.H. Protective effect of reduced glutathione C60 derivative against hydrogen peroxide-induced apoptosis in HEK 293T cells. J. Huazhong Univ. Sci. Technol. Med. Sci. 2016, 36, 356–363. [Google Scholar] [CrossRef]
- Sergeeva, V.; Kraevaya, O.; Ershova, E.; Kameneva, L.; Malinovskaya, E.; Dolgikh, O.; Konkova, M.; Voronov, I.; Zhilenkov, A.; Veiko, N.; et al. Antioxidant Properties of Fullerene Derivatives Depend on Their Chemical Structure: A Study of Two Fullerene Derivatives on HELFs. Oxid. Med. Cell. Longev. 2019, 2019, 4398695. [Google Scholar] [CrossRef]
- Troshina, O.A.; Troshin, P.A.; Peregudov, A.S.; Kozlovskiy, V.I.; Balzarini, J.; Lyubovskaya, R.N. Chlorofullerene C60Cl6: A precursor for straightforward preparation of highly water-soluble polycarboxylic fullerene derivatives active against HIV. Org. Biomol. Chem. 2007, 5, 2783–2791. [Google Scholar] [CrossRef]
- Kornev, A.B.; Khakina, E.A.; Troyanov, S.I.; Kushch, A.A.; Peregudov, A.; Vasilchenko, A.; Deryabin, D.G.; Martynenko, V.M.; Troshin, P.A. Facile preparation of amine and amino acid adducts of [60]fullerene using chlorofullerene C60Cl6 as a precursor. Chem. Commun. 2012, 48, 5461–5463. [Google Scholar] [CrossRef]
- Khakina, E.A.; Kraevaya, O.A.; Popova, M.L.; Peregudov, A.S.; Troyanov, S.I.; Chernyak, A.V.; Martynenko, V.M.; Kulikov, A.V.; Schols, D.; Troshin, P.A. Synthesis of different types of alkoxy fullerene derivatives from chlorofullerene C60Cl6. Org. Biomol. Chem. 2017, 15, 773–777. [Google Scholar] [CrossRef]
- Yoshioka, W.; Tohyama, C. Mechanisms of Developmental Toxicity of Dioxins and Related Compounds. Int. J. Mol. Sci. 2019, 20, 617. [Google Scholar] [CrossRef] [PubMed] [Green Version]
- Katagiri, T.; Takeuchi, T.; Mine, T.; Noguchi, T.; Nishizawa, T.; Yamamoto, S.; Okudaira, M.; Matsushima, T. Chronic inhalation toxicity and carcinogenicity studies of 3-chloro-2-methylpropene in BDF1 mice. Ind. Health 2000, 38, 309–318. [Google Scholar] [CrossRef] [PubMed] [Green Version]
- Valentovic, M.A.; Ball, J.G.; Hong, S.K.; Rogers, B.A.; Meadows, M.K.; Harmon, R.C.; Rankin, G.O. In Vitro toxicity of 2- and 4-chloroaniline: Comparisons with 4-amino-3-chlorophenol, 2-amino-5-chlorophenol and aminophenols. Toxicol. In Vitro 1996, 10, 713–720. [Google Scholar] [CrossRef] [PubMed]
- Schweigert, N.; Hunziker, R.W.; Escher, B.I.; Eggen, R.I. Acute toxicity of (chloro-)catechols and (chloro-)catechol-copper combinations in Escherichia coli corresponds to their membrane toxicity in vitro. Environ. Toxicol. Chem. 2001, 20, 239–247. [Google Scholar] [CrossRef]
- Zhang, T.; Li, X.; Min, X.; Fang, T.; Zhang, Z.; Yang, L.; Liu, P. Acute toxicity of chlorobenzenes in tetrahymena: Estimated by microcalorimetry and mechanism. Environ. Toxicol. Pharmacol. 2012, 33, 377–385. [Google Scholar] [CrossRef] [PubMed]
- Yin, J.; Wu, B.; Zhang, X.X.; Xian, Q. Comparative toxicity of chloro- and bromo-nitromethanes in mice based on a metabolomic method. Chemosphere 2017, 185, 20–28. [Google Scholar] [CrossRef]
- Wang, J.; Zhang, H.; Zheng, X.; Liu, R.; Zong, W. In vitro toxicity and molecular interacting mechanisms of chloroacetic acid to catalase. Ecotoxicol. Environ. Saf. 2020, 189, 109981. [Google Scholar] [CrossRef] [PubMed]
- Sies, H. Oxidative stress: Oxidants and antioxidants. Exp. Physiol. 1997, 82, 291–295. [Google Scholar] [CrossRef]
- Lambeth, J.D.; Neish, A.S. Nox enzymes and new thinking on reactive oxygen: A double-edged sword revisited. Annu. Rev. Pathol. 2014, 9, 119–145. [Google Scholar] [CrossRef]
- Sies, H. Total antioxidant capacity: Appraisal of a concept. J. Nutr. 2007, 137, 1493–1495. [Google Scholar] [CrossRef] [Green Version]
- Martin, K.R.; Barrett, J.C. Reactive oxygen species as double-edged swords in cellular processes: Low-dose cell signaling versus high-dose toxicity. Hum. Exp. Toxicol. 2002, 21, 71–75. [Google Scholar] [CrossRef] [PubMed]
- Pan, J.S.; Hong, M.Z.; Ren, J.L. Reactive oxygen species: A double-edged sword in oncogenesis. World J. Gastroenterol. 2009, 15, 1702–1707. [Google Scholar] [CrossRef] [PubMed]
- Ferrer, M.D.; Sureda, A.; Mestre, A.; Tur, J.A.; Pons, A. The double edge of reactive oxygen species as damaging and signaling molecules in HL60 cell culture. Cell. Physiol. Biochem. 2010, 25, 241–252. [Google Scholar] [CrossRef]
- Mijatovic, S.; Savic-Radojevic, A.; Pljesa-Ercegovac, M.; Simic, T.; Nicoletti, F.; Maksimovic-Ivanic, D. The Double-Faced Role of Nitric Oxide and Reactive Oxygen Species in Solid Tumors. Antioxidants 2020, 9, 374. [Google Scholar] [CrossRef] [PubMed]
- Kraevaya, O.A.; Peregudov, A.S.; Troyanov, S.I.; Godovikov, I.; Fedorova, N.E.; Klimova, R.R.; Sergeeva, V.A.; Kameneva, L.V.; Ershova, E.S.; Martynenko, V.M.; et al. Diversion of the Arbuzov reaction: Alkylation of C-Cl instead of phosphonic ester formation on the fullerene cage. Org. Biomol. Chem. 2019, 17, 7155–7160. [Google Scholar] [CrossRef]
- Ershova, E.S.; Sergeeva, V.A.; Chausheva, A.I.; Zheglo, D.G.; Nikitina, V.A.; Smirnova, T.D.; Kameneva, L.V.; Porokhovnik, L.N.; Kutsev, S.I.; Troshin, P.A.; et al. Toxic and DNA damaging effects of a functionalized fullerene in human embryonic lung fibroblasts. Mutat. Res. Genet. Toxicol. Environ. Mutagen. 2016, 805, 46–57. [Google Scholar] [CrossRef] [PubMed]
- Ershova, E.S.; Sergeeva, V.A.; Tabakov, V.J.; Kameneva, L.A.; Porokhovnik, L.N.; Voronov, I.I.; Khakina, E.A.; Troshin, P.A.; Kutsev, S.I.; Veiko, N.N.; et al. Functionalized Fullerene Increases NF-kappaB Activity and Blocks Genotoxic Effect of Oxidative Stress in Serum-Starving Human Embryo Lung Diploid Fibroblasts. Oxid. Med. Cell. Longev. 2016, 2016, 9895245. [Google Scholar] [CrossRef] [Green Version]
- Itoh, K.; Wakabayashi, N.; Katoh, Y.; Ishii, T.; Igarashi, K.; Engel, J.D.; Yamamoto, M. Keap1 represses nuclear activation of antioxidant responsive elements by Nrf2 through binding to the amino-terminal Neh2 domain. Genes Dev. 1999, 13, 76–86. [Google Scholar] [CrossRef] [Green Version]
- Yamamoto, T.; Suzuki, T.; Kobayashi, A.; Wakabayashi, J.; Maher, J.; Motohashi, H.; Yamamoto, M. Physiological significance of reactive cysteine residues of Keap1 in determining Nrf2 activity. Mol. Cell. Biol. 2008, 28, 2758–2770. [Google Scholar] [CrossRef] [Green Version]
- Poljsak, B.; Milisav, I. The neglected significance of “antioxidative stress”. Oxid. Med. Cell. Longev. 2012, 2012, 480895. [Google Scholar] [CrossRef]
- Gandhi, V.V.; Phadnis, P.P.; Kunwar, A. 2,2′-Dipyridyl diselenide (Py2Se2) induces G1 arrest and apoptosis in human lung carcinoma (A549) cells through ROS scavenging and reductive stress. Metallomics 2020, 12, 1253–1266. [Google Scholar] [CrossRef] [PubMed]
- Ma, T.J.; Lan, D.H.; He, S.Z.; Ye, Z.; Li, P.; Zhai, W.; Chen, W.Q.; Huang, Y.; Fu, Y.; Sun, A.; et al. Nrf2 protects human lens epithelial cells against H2O2-induced oxidative and ER stress: The ATF4 may be involved. Exp. Eye Res. 2018, 169, 28–37. [Google Scholar] [CrossRef] [PubMed]
- Pervaiz, S.; Clement, M.V. Hydrogen peroxide-induced apoptosis: Oxidative or reductive stress? Methods Enzymol. 2002, 352, 150–159. [Google Scholar] [CrossRef] [PubMed]
- Brewer, A.C.; Mustafi, S.B.; Murray, T.V.; Rajasekaran, N.S.; Benjamin, I.J. Reductive stress linked to small HSPs, G6PD, and Nrf2 pathways in heart disease. Antioxid. Redox Signal. 2013, 18, 1114–1127. [Google Scholar] [CrossRef] [PubMed] [Green Version]
- Pendyala, S.; Moitra, J.; Kalari, S.; Kleeberger, S.R.; Zhao, Y.; Reddy, S.P.; Garcia, J.G.; Natarajan, V. Nrf2 regulates hyperoxia-induced Nox4 expression in human lung endothelium: Identification of functional antioxidant response elements on the Nox4 promoter. Free Radic. Biol. Med. 2011, 50, 1749–1759. [Google Scholar] [CrossRef] [Green Version]
- Troshin, P.A.; Popkov, O.; Lyubovskaya, R.N. Some New Aspects of Chlorination of Fullerenes. Fuller. Nanotub. Carbon Nanostruct. 2003, 11, 165–185. [Google Scholar] [CrossRef]


Disclaimer/Publisher’s Note: The statements, opinions and data contained in all publications are solely those of the individual author(s) and contributor(s) and not of MDPI and/or the editor(s). MDPI and/or the editor(s) disclaim responsibility for any injury to people or property resulting from any ideas, methods, instructions or products referred to in the content. |
© 2022 by the authors. Licensee MDPI, Basel, Switzerland. This article is an open access article distributed under the terms and conditions of the Creative Commons Attribution (CC BY) license (https://creativecommons.org/licenses/by/4.0/).
Share and Cite
Savinova, E.A.; Salimova, T.A.; Proskurnina, E.V.; Rodionov, I.V.; Kraevaya, O.A.; Troshin, P.A.; Kameneva, L.V.; Malinovskaya, E.M.; Dolgikh, O.A.; Veiko, N.N.; et al. Effect of Water-Soluble Chlorine-Containing Buckminsterfullerene Derivative on the Metabolism of Reactive Oxygen Species in Human Embryonic Lung Fibroblasts. Oxygen 2023, 3, 1-19. https://doi.org/10.3390/oxygen3010001
Savinova EA, Salimova TA, Proskurnina EV, Rodionov IV, Kraevaya OA, Troshin PA, Kameneva LV, Malinovskaya EM, Dolgikh OA, Veiko NN, et al. Effect of Water-Soluble Chlorine-Containing Buckminsterfullerene Derivative on the Metabolism of Reactive Oxygen Species in Human Embryonic Lung Fibroblasts. Oxygen. 2023; 3(1):1-19. https://doi.org/10.3390/oxygen3010001
Chicago/Turabian StyleSavinova, Ekaterina A., Tatiana A. Salimova, Elena V. Proskurnina, Ivan V. Rodionov, Olga A. Kraevaya, Pavel A. Troshin, Larisa V. Kameneva, Elena M. Malinovskaya, Olga A. Dolgikh, Natalia N. Veiko, and et al. 2023. "Effect of Water-Soluble Chlorine-Containing Buckminsterfullerene Derivative on the Metabolism of Reactive Oxygen Species in Human Embryonic Lung Fibroblasts" Oxygen 3, no. 1: 1-19. https://doi.org/10.3390/oxygen3010001