
Temporal and Spatial Evolution of Seasonal Sea Ice of Arctic Bay, Nunavut
1
Department of Physical and Environmental Sciences, University of Toronto Scarborough, 1265 Military Trail, Scarborough, ON M1C 1A4, Canada
2
Department of Computer and Mathematical Sciences, University of Toronto Scarborough, 1265 Military Trail, Scarborough, ON M1C 1A4, Canada
*
Author to whom correspondence should be addressed.
Coasts 2023, 3(2), 113-124; https://doi.org/10.3390/coasts3020007
Submission received: 22 October 2022
/
Revised: 21 December 2022
/
Accepted: 2 March 2023
/
Published: 3 April 2023
Abstract
:The temporal and spatial variation in seasonal sea ice in Arctic Bay, Nunavut, are examined using time series and spatial clustering analyses. For the period of 1971 to 2018, a time series of sea ice break-up, and freeze-up, dates and ice-free season length at nine grid points are generated from sea ice charts derived from satellites and other data. These data are analysed temporally and spatially. The temporal analyses indicate an unambiguous response to a warming climate with statistically significant earlier break-up dates, later freeze-up dates, and longer ice-free seasons with clear statistically significant linkages to local air temperature. The rate of change in freeze-up dates and ice-free season length was particularly strong in the early 2000s and less in the 2010s. Spatial clustering analysis indicated a roughly linear pathway of south to north behaviour, following the contours of the bay with the exception of modified behaviour for landfast sea ice near the hamlet of Arctic Bay. The temporal analysis confirms and expands upon an earlier time series analysis of local seasonal sea ice. The spatial analysis indicates that while the ice-free season is increasing, it does not provide clear evidence that there has been a regime change in the seasonal characteristics of how sea ice forms and melts each year.
1. Introduction
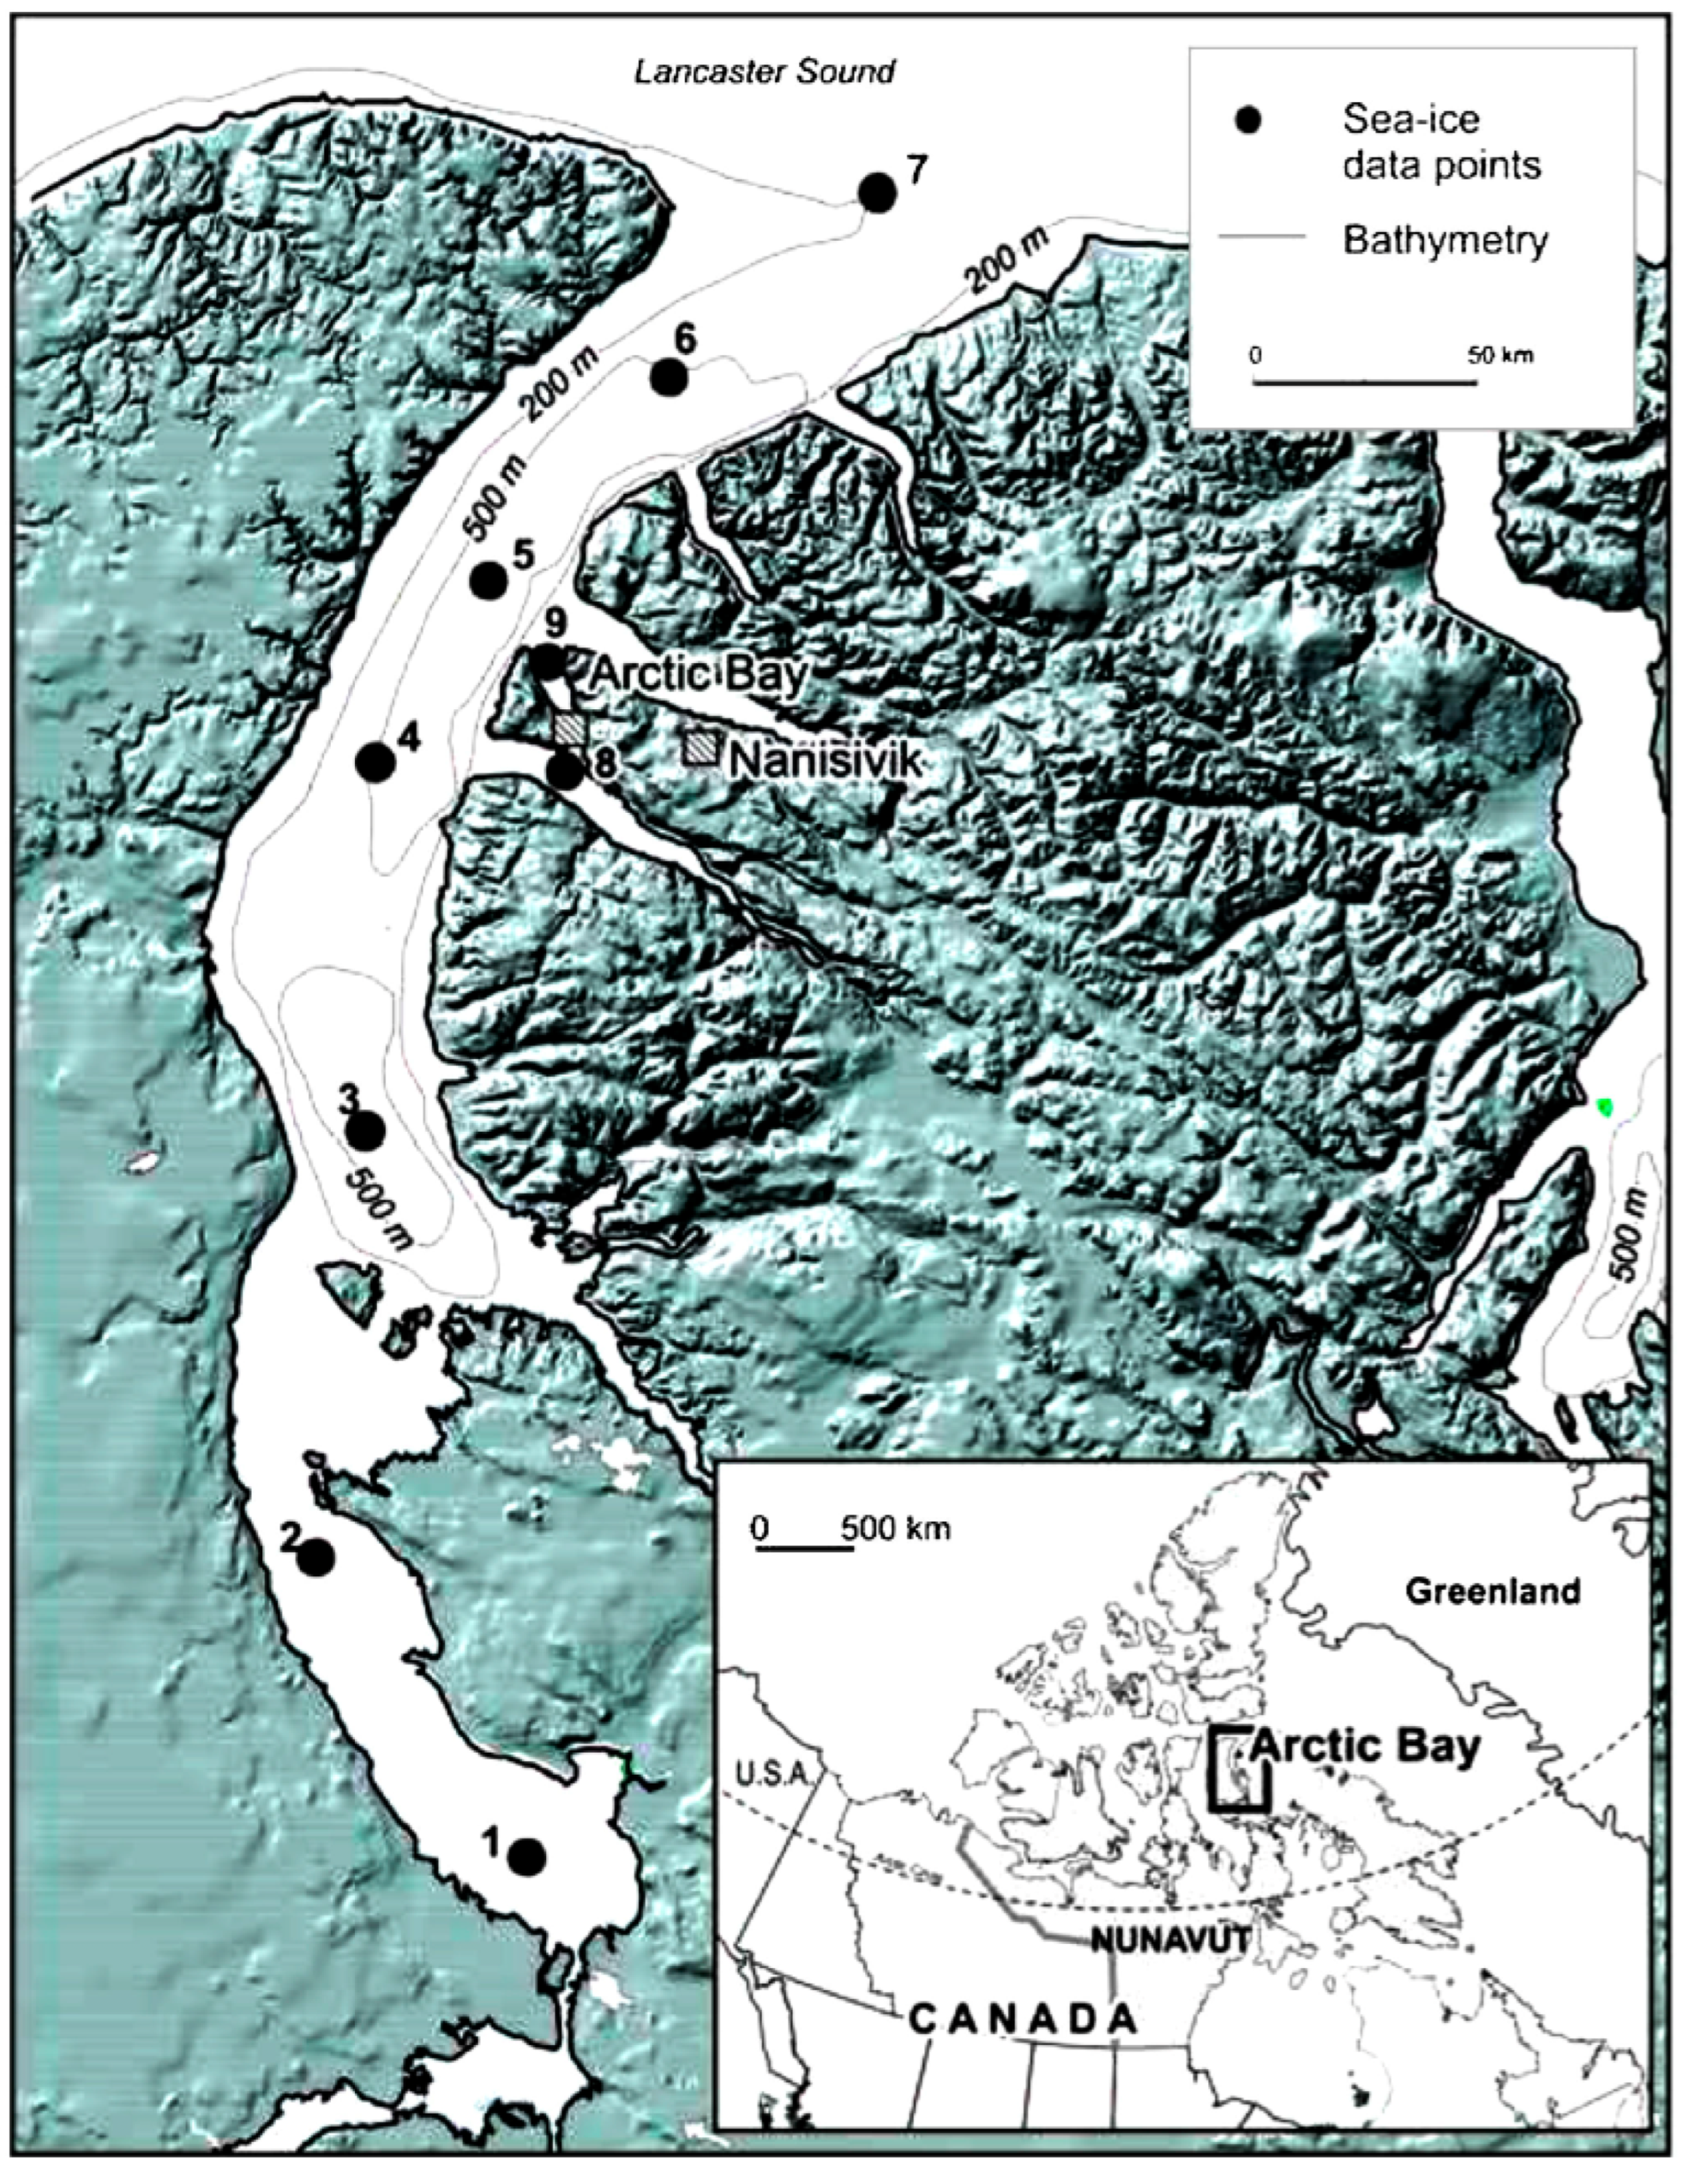
Arctic Bay (Ikpiarjuk), Nunavut (73.04° N, 85.15° W) is a coastal Inuit hamlet located on the northwest corner of Baffin Island in Nunavut, Canada (Figure 1) with a population of approximately 1000 people, which is surrounded by sea ice for most of the year [1]. The community is situated in a north/south oriented inlet off Lancaster Sound that spans 450 km in length and 20–50 km in width, with the community 150 km south of the mouth of the inlet.
Arctic Bay experiences a tundra climate (Koppen: ET), which is characterized by long, very cold winters, and short cool summers. The climate is considered arid with less than 250 mm of precipitation per year. The climate observations for the area have been sporadic, thus a continuous temperature record is not available. A more coherent record occurs at Nanisivik airport, 13 km from Arctic Bay. The ocean water surrounding Arctic Bay completely freezes every fall and remains frozen until the summer (October to July). This region is ice-free every summer (August to September), and consequently water access by ship is only possible from mid-summer to early autumn. The ice variation in this region is primarily controlled by air temperature variations; however, intense tidal currents and strong winds also influence the movement and distribution of this seasonal sea ice. These three factors determine when the sea ice will melt and when it will freeze again, and ultimately control the duration of the ice thickness and the ice cover surrounding Arctic Bay.
The Arctic Bay community has experienced substantial climate change as documented [1,2,3]. From 2004 to 2014, the community experienced an increase in the ice-free season of eighteen days, a 25% increase [1]. This is the result of both earlier break-ups and later freeze-ups. The current work builds on these earlier results by extending the climatological analysis to 2018 and including more sophisticated time series analysis as well as introducing a spatial cluster analysis. The Arctic more broadly has experienced substantial and unprecedented warming and sea ice loss as found consistently in air temperature, sea surface temperature, and sea ice data [4,5,6,7,8,9,10,11,12,13,14].
Research Objectives
This work builds on the preliminary sea ice analysis developed previously for [1]. The same grid (Figure 1) is used with an expanded data set (1971–2018). The following research questions are addressed.
- How statistically significant are the temporal changes in the break-up, freeze-up, and ice-free periods for the nine grid points representing Arctic Bay for three time periods, 1971–2018, 1971–1994, 1995–2018, and the relationship to concurrent temperature change?
- Using a spatial cluster analysis, how coherent is the nature of break-up, freeze-up, and ice-free periods spatially using the three time periods?
- From these two analyses, is there evidence to suggest a regime change in how sea ice dynamics operate in Arctic Bay?
2. Materials and Methods
2.1. Data
2.1.1. Temperature Data
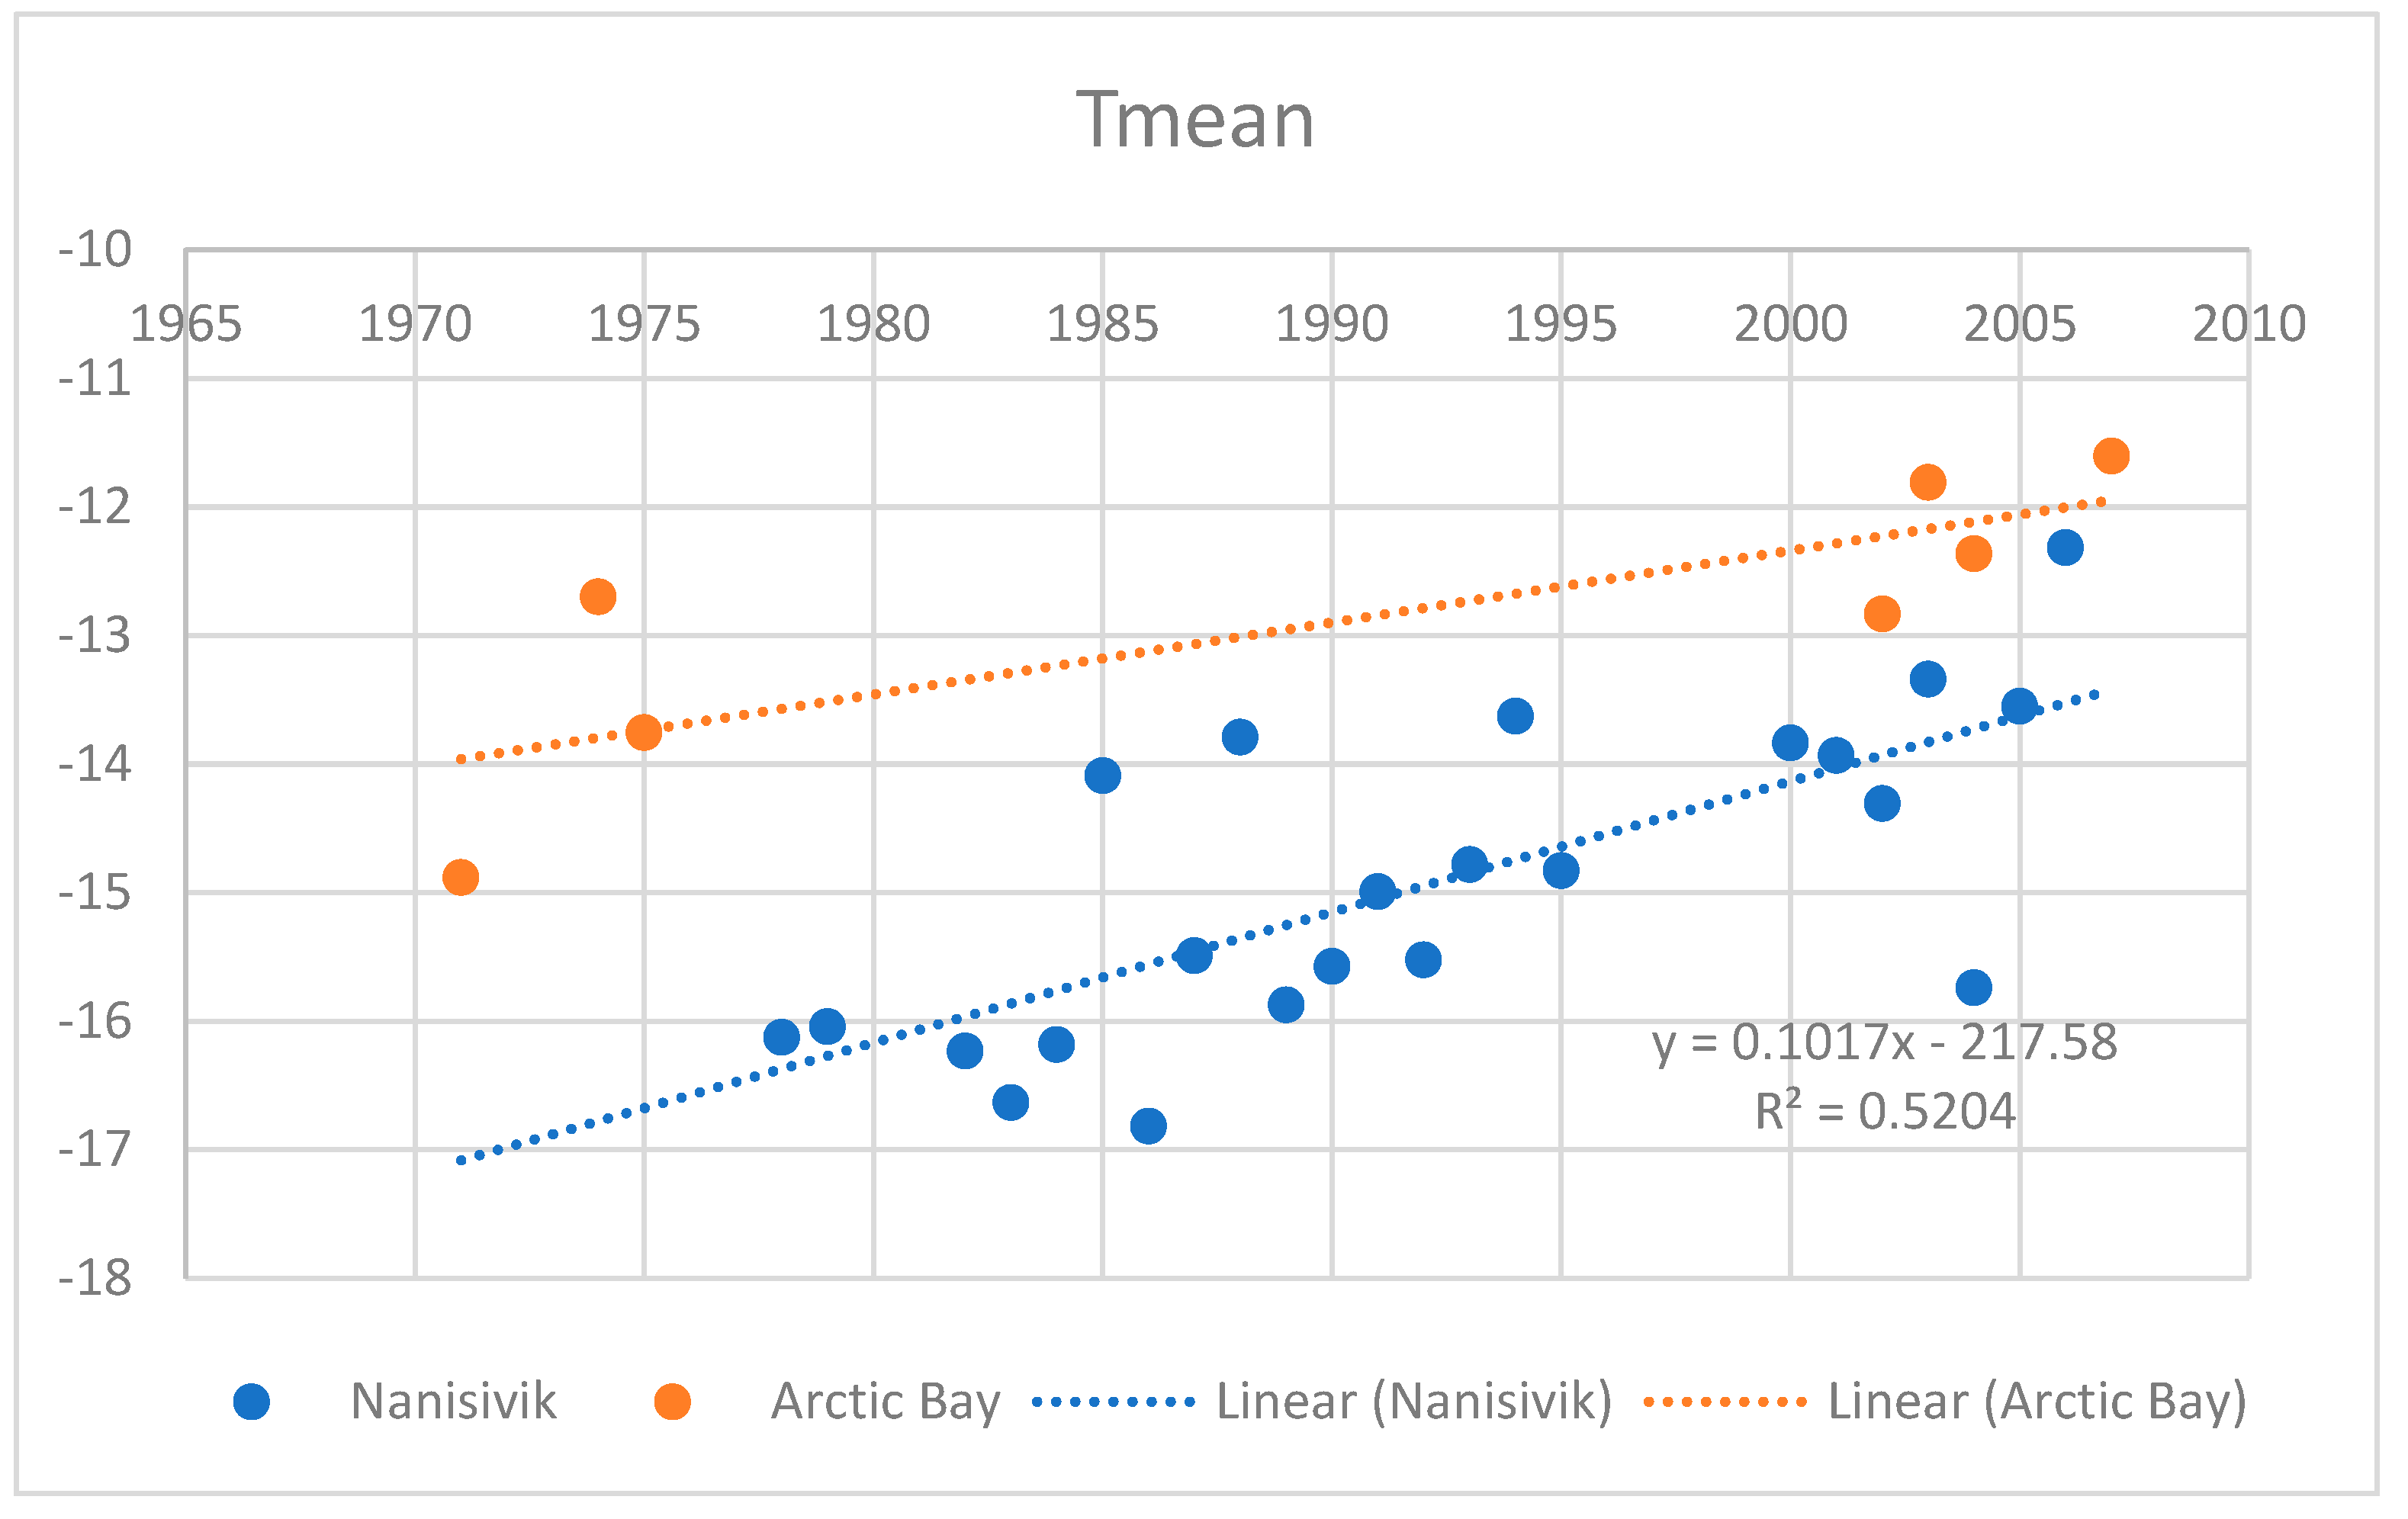
Temperature data (monthly mean temperature) were obtained from the Environment and Climate Change Canada archive (https://climate.weather.gc.ca/historical_data/search_historic_data_e.html accessed on 1 August 2023). There is a paucity of data from Arctic Bay for temperature. Seven years with complete annual records were identified: 1971, 1974, 1975, 2002, 2003, 2004, and 2007. Nanisivik, a community 13 km east of Arctic Bay has a more complete record and annual data were obtained for 1978, 1979, 1988–1995, and 2000–2006. While the absolute values differ, being colder by approximately 2 °C as illustrated in Figure 2, Nanisivik serves as a proxy with more complete data for the rate of change calculation of the annual mean temperature. The rate of change is determined by linear regression.
2.1.2. Sea Ice Data
Following [1], a grid of nine points was used to represent Arctic Bay. In order to determine the break-up and freeze-up dates from 1971 to 2018 for each of the sampling locations for Arctic Bay (Figure 1), the same methodology, as described below, utilized by others [15,16,17,18] was employed. Points 8 and 9 are located in waters to the south and north of the Arctic Bay community, respectively.
The Canadian Ice Service (CIS) issues sea ice concentration data for the Arctic region since 1971 on a weekly basis, except during the winter months of January to May when it is issued bi-weekly. The sea ice concentration data are expressed in tenths (from 0 to 10/10), which refers to the surface area that is covered with ice. The CIS images, which contain the sea ice concentration data, are developed by utilizing all the available information such as satellite images, ship and aircraft observations, observations from shore, and climatic information. This information is available online at http://www.ec.gc.ca/glaces-ice/default.asp and was accessed 1 July 2019. The sea ice concentrations for those images were obtained for every sampling point that is superimposed over the study area (Figure 2) and the dates of the ice break-up, ice freeze-up, and the derived ice-free season were catalogued for each year (from 1971 to 2018) with an accuracy of +/−1 week. The ice break-up date was defined as the first date when the ice concentration was 5/10 or less during the spring and summer months, while the ice freeze-up date was determined to be the earliest date when the ice concentration reached 5/10 or more between October and December. These specific thresholds used to determine the break-up and freeze-up dates are in accordance with that used by both the Canadian Sea Ice Service and the World Meteorological Organization (WMO). The break-up and freeze-up dates were expressed numerically as the ordinal day of the year, where January 1st was the 1st day, and December 31st was the 365th day, unless there was a leap year in which case December 31st would be the 366th day of the year. There is one set of break-up dates, freezing dates, and ice-free season length for each grid point. In 1972, the ice did not break-up using the 5/10 threshold, and so this year is omitted from the three time series.
2.2. Time Series Analysis
The Kendall correlation is a non-parametric measure of correlation that assesses monotonicity of trends without assuming a normal distribution of data. This correlation with time is called a Mann–Kendall correlation, and it can be used to test (statistically) whether a trend is unchanging against an alternative hypothesis that the trend is increasing or decreasing [15,19,20]. Thus, the Mann–Kendall test is a commonly used nonparametric test to assess the statistical significance of a time trend [15]. The test is based on the assumption of independence among the observations. However, observations in time series can be autocorrelated and this can influence the detection of a significant trend. Thus, it is crucial to check the autocorrelation in a given series and to adjust the test if necessary [15,16].
In order to account for the possibility of autocorrelation within each of the three data sets (for the three metrics), the adjustment was performed using the adjustment method of [15] using the fume package in R. The fume package’s mkTrend function carries out the adjusted and unadjusted Mann–Kendall tests, but only the adjusted value in each case is presented in this work. The Mann–Kendall correlations (tests for trend significance) were performed for each of the three metrics for each of the three separate time periods (1971–2018, 1971–1994, and 1995–2018). A p value threshold of less than 0.05 is considered significant [16].
The Theil–Sen method is a non-parametric slope estimator of the rate of change in the variables considered (three metrics) in terms of days per year that are not affected by outliers [15,16,21]. The slope represents the rate of change in the variables considered (break-up date, freeze-up date, and ice-free period) in days per year [15,16]. The Theil–Sen method was used for the three metrics for each of the three time periods, namely the full time period, 1971–2018, as well as the two distinct time periods, 1971–1994, and 1995–2018, by utilizing the statistical program R.
To visualize the potential non-linearities in the time series, Lowess curves [16,22] were generated for each grid point for all three metrics. A Lowess curve is a locally weighted regression and thus it is not constrained to be linear. These curves indicate the shape of a time trend, even if that trend is not linear and as such, this method provides more nuance than a regression curve because the latter is constrained to be linear even though the actual trend may not be [15,16].
Using both temperature and sea ice time series, a correlation analysis is performed using linear regression to assess the direct impact of local air temperature on the local sea annual cycle.
2.3. Spatial Analysis
Cluster analysis [23] is used to divide observations into groups or clusters based on the values of several observed variables. Hierarchical cluster analysis begins with one cluster containing all the observations that are repeatedly subdivided [23], or the opposite such as Ward’s method, which we use in this study. Ward’s method begins with each point as a separate cluster. The process followed is described below:
- Start with each point in a cluster by itself (sum of squares = 0);
- Merge two clusters in order to produce the smallest increase in the sum of squares (merging cost);
- Keep merging until k clusters are reached. The merging cost is the increase in sum of squares when you merge two clusters.
Ward’s method can handle missing data, specifically the dissimilarity between any pair of locations is calculated using any years for which that pair of locations has non-missing data. The benefit of this approach is that years in which there are missing values are not deleted entirely and therefore more of the data are actually employed for the analysis. Ward’s method was run for each of the three metrics for the Arctic Bay grid points for each of the 3 separate time periods, (1971–2018; 1971–1994; and 1995–2018) by utilizing the statistical program R. Four clusters were chosen for the Arctic Bay data set. There is, however, some degree of arbitrariness in choosing a specific number of clusters.
3. Results
3.1. Temperature Analysis
Figure 2 shows the time series of the annual averaged mean temperature (Tmean) of day from 1978 to 2006 for Nanisivik, NU, located 13 km east of Arctic Bay as well as the annual Tmean data for Arctic Bay for 1971, 1974, 1975, 2002, 2003, and 2004. The Tmean increased approximately 3 °C during this time period for Nanisivik, NU. The Arctic Bay temperatures were slightly warmer than Nanisivik but also showed an increasing trend, although the paucity of data makes the determination of the magnitude of the trend less certain. For Nanisivik, the linear regression slope is a warming of approximately 0.1 °C per year. As is clear in subsequent sections, this warming is consistent with the changes in seasonal sea ice behaviour. These results are consistent with the broader spatial warming in the Arctic of 4.5 °C for the period of 1982 to 2021 [4,11,12,13].
3.2. Sea Ice Time Series Analysis
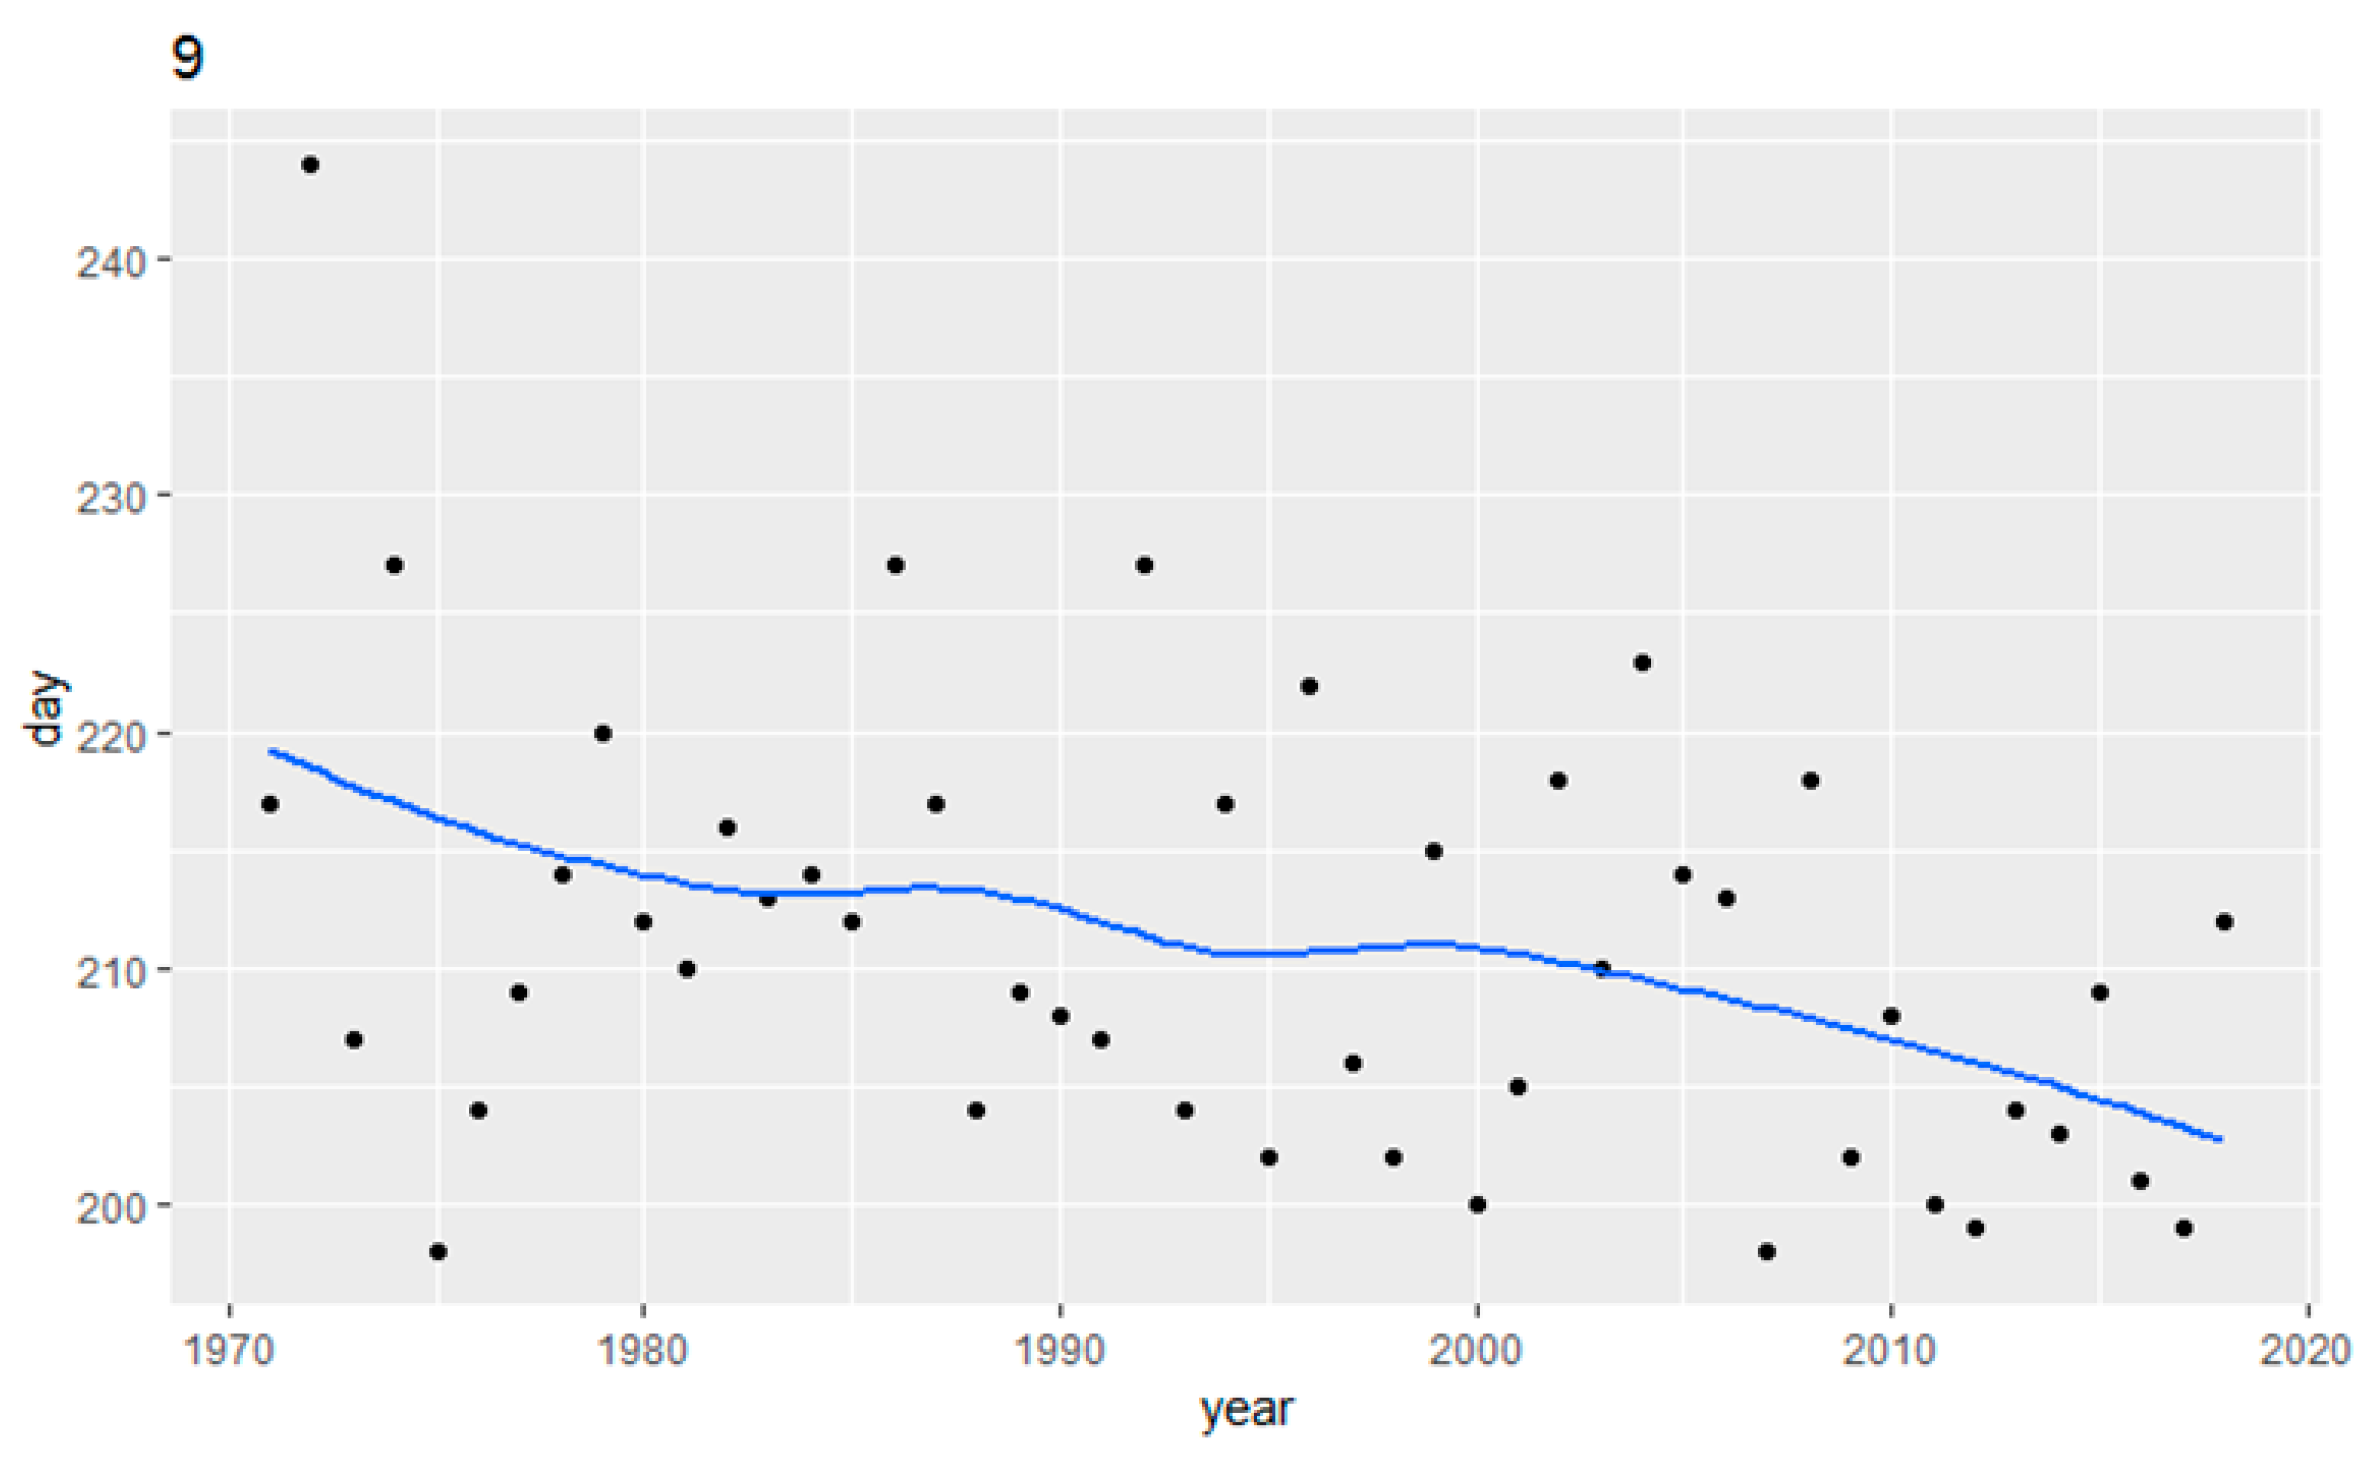
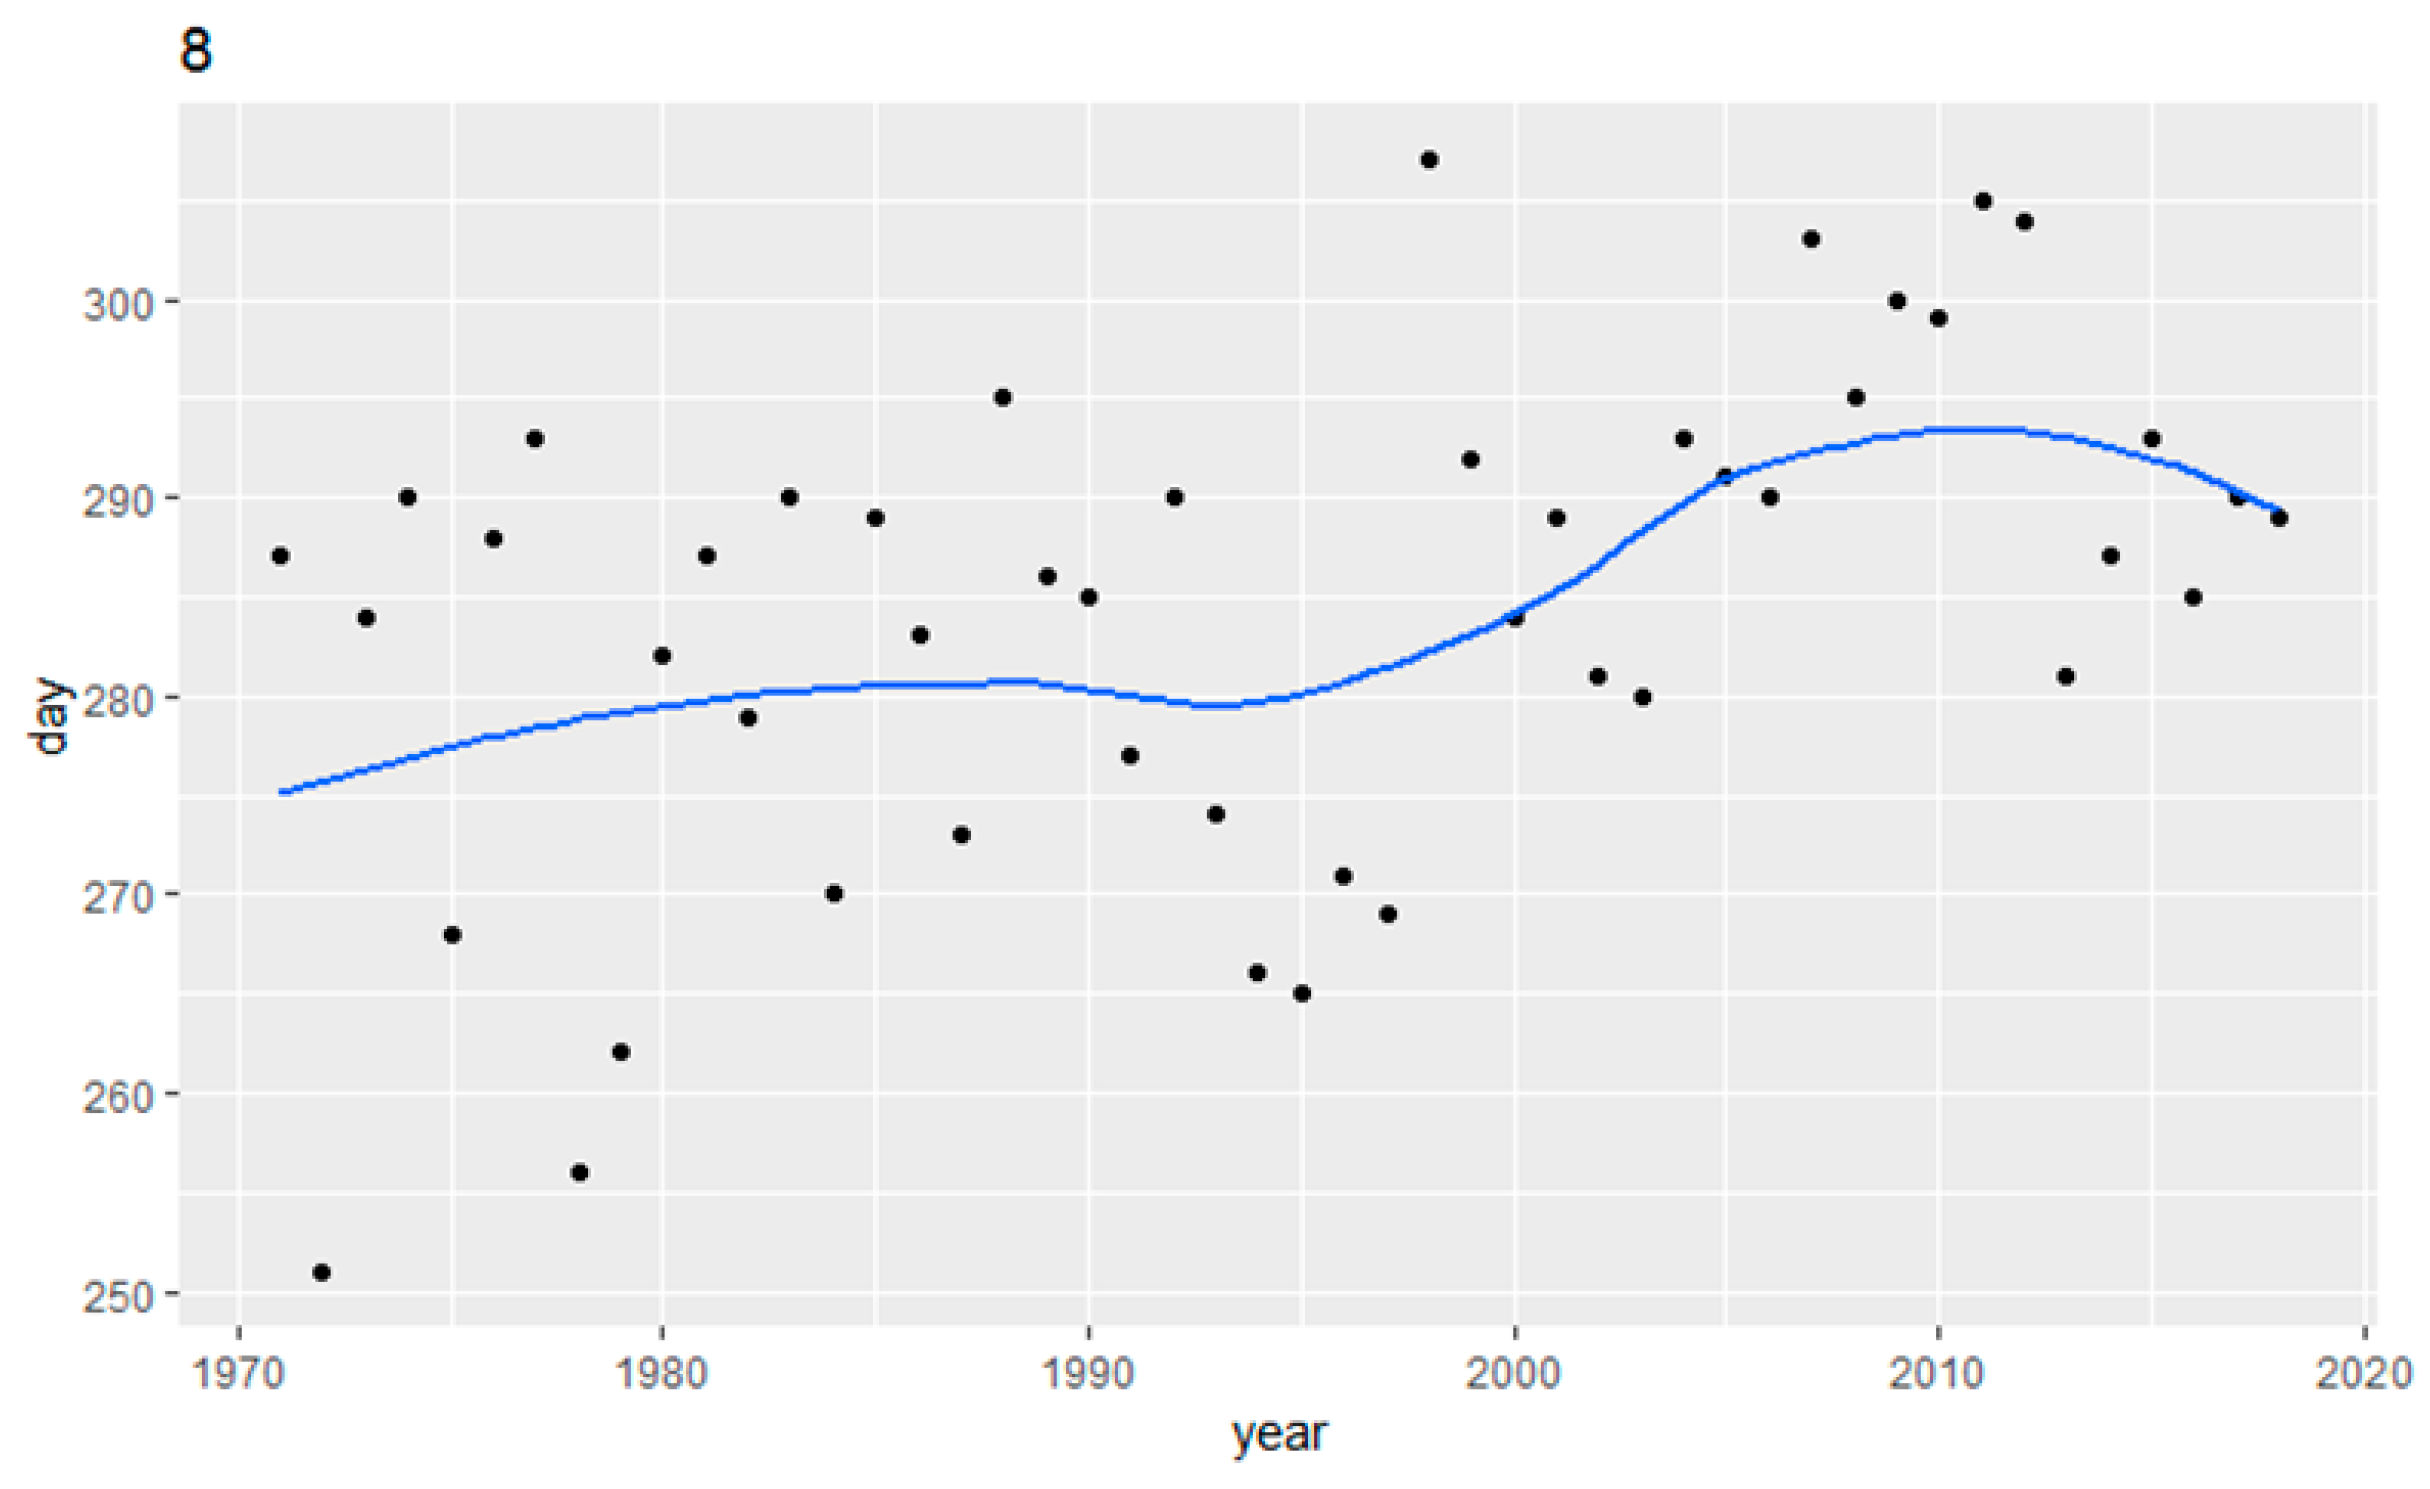
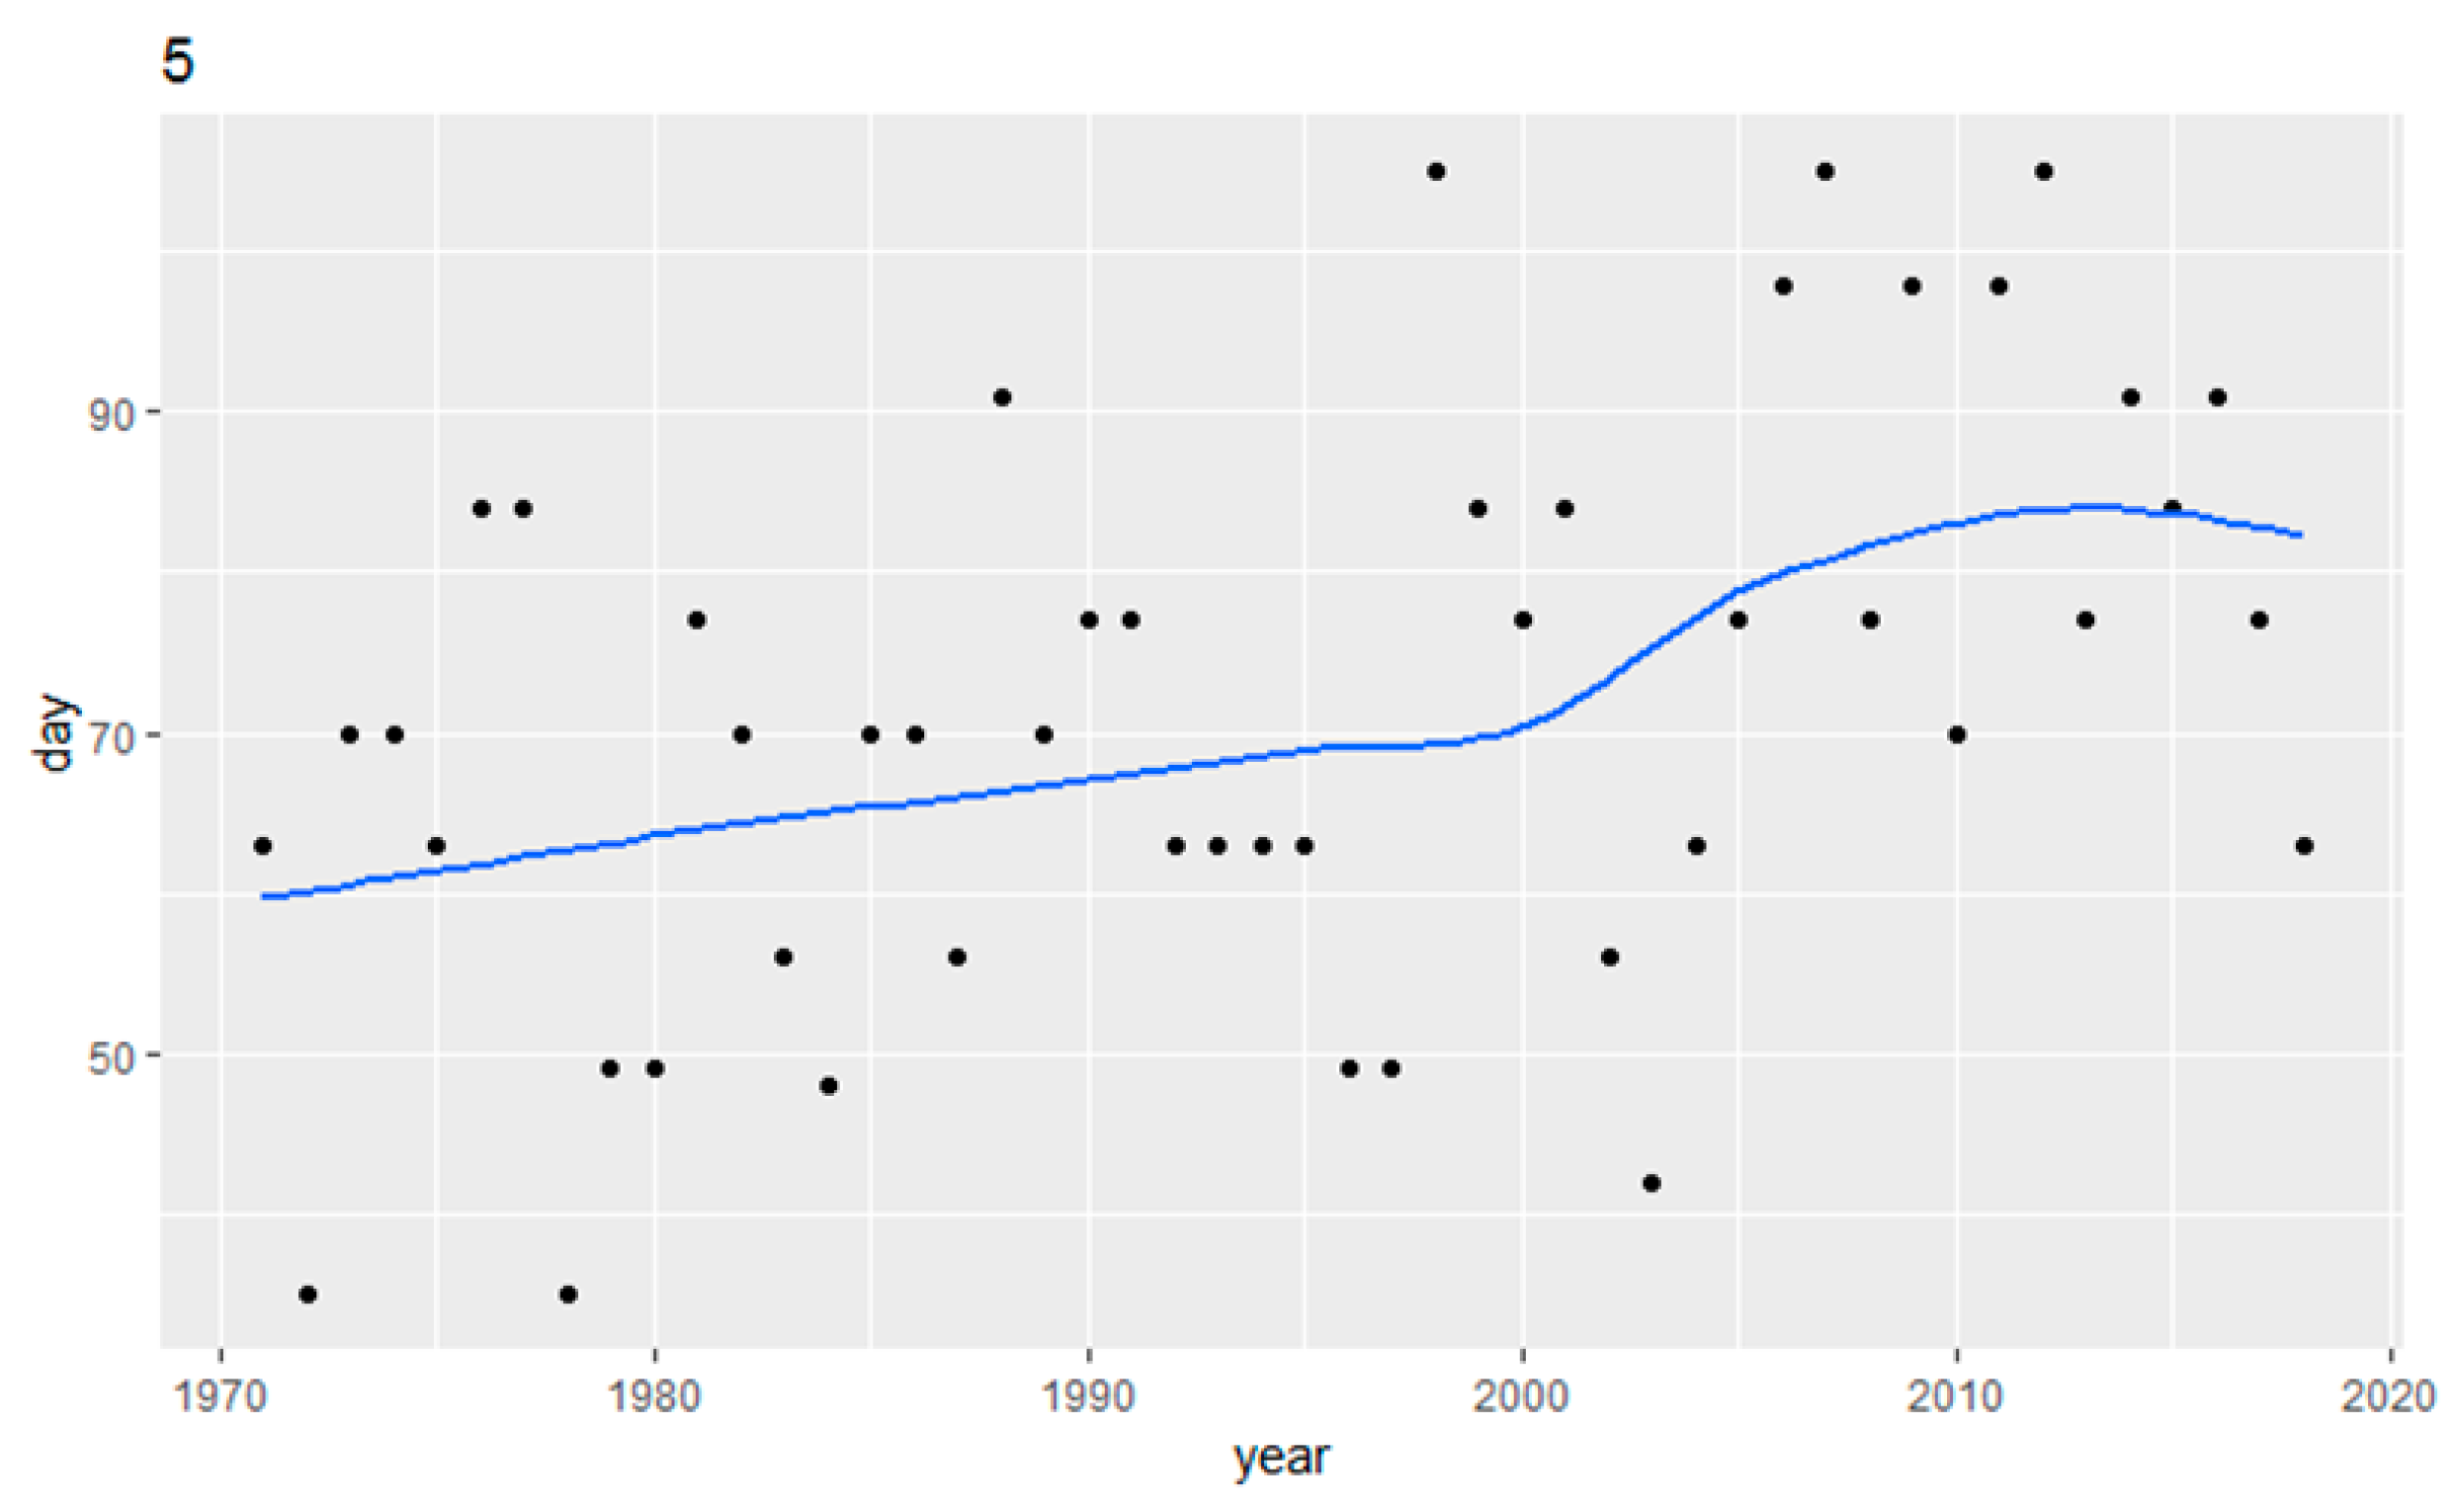
We begin by examining the representative Lowess curves for ice break-up, freeze-up, and ice-free season for points 9, 8, and 5, respectively, all points located near the hamlet of Arctic Bay (Figure 3, Figure 4 and Figure 5). Figure 3 displays a relatively linear trend toward earlier break-up of seasonal sea ice. There is considerable interannual variability as has been found in other parts of the Eastern Arctic [15,16]. For ice freeze-up (Figure 4) there is more nuance, with a substantial trend to later freeze-up dates from the mid-1990s to 2010 and levelling after 2010. This mid-1990s to 2010 accelerating of later freeze-up dates was also seen in Hudson Bay during the same period [16]. Since the ice-free period (Figure 5) is derived from the break-up and freeze-up dates, the same early 2000s increase and post-2010 levelling is evident.
The Mann–Kendall correlation and Theil–Sen slope estimator are used to quantify the results presented in the Lowess curves for each of the nine grid points. These results are presented in Table 1 for time of ice break-up for three time periods, 1971–2018, 1971–1994, and 1995–2018. The latter two are included to determine if there has been a significant change in behaviour throughout the 48-year period.
For the 1971–2018 time period, all nine points were statistically significant using the Mann–Kendall test with p values less than 0.05 for all grid points. The rate of change ranges from −0.19 to −0.43 days per year which indicates 9 to 21 days earlier in break-up over the study period. Those points nearest the hamlet of Arctic Bay experienced an 11-day change over the study period. The largest magnitude, point 7, occurred at the mouth of the inlet. The subdivided periods, 1971–1994 and 1995–2018, are not statistically significant and do not provide any additional insights into the nature of the sea ice break-up. These trends are similar to those reported in [1] for the same grid points but for a time series that ended in 2014.
Autocorrelation was found at only one grid point for break-up (7, the most northerly point, as seen in Figure 1) for the 1971–2018 period. This suggests that for the break-up in Arctic Bay there is no significant “climate memory” as introduced for Hudson Strait by [24] and explored in more detail by [25].
The Mann–Kendall correlation and Theil–Sen slope estimator for freeze-up are presented in Table 2 for the three time periods. For the 1971–2018 time period, all nine points were statistically significant using the Mann–Kendall test with p values less than 0.05 for all grid points. The rate of change ranges from 0.20 to 0.36 days per year which indicates 10 to 17 days later in freeze-up over the study period. Those points nearest the hamlet of Arctic Bay experienced a 16-day change over the study period, at the high end among the grid points. Similar to the break-up analysis, the subdivided periods, 1971–1994 and 1995–2018, for freeze-up are not statistically significant (p < 0.05); however, the Theil–Sen slopes for the two time periods indicate a more substantial increase in the second, more recent period, consistent with the Lowess curves (Figure 4), post-mid-1990s. Once again, these trends are consistent with those reported in [1] for the same grid points but for a shorter time series.
Autocorrelation was found at only one grid point for break-up (1, the most southerly point, as seen in Figure 1) for the 1971–2018 period. This suggests that for the break-up in Arctic Bay there is no significant “climate memory” as noted also for the break-up.
The Mann–Kendall correlation and Theil–Sen slope estimator for the ice-free period are presented in Table 3 for the three time periods. For the 1971–2018 time period all but one of the nine points were statistically significant using the Mann–Kendall test with p values less than 0.05 for all grid points. The lone outlier was point 7 at the mouth of Arctic Bay, which may have been impacted by multi-year ice leading to greater variability. The rate of change ranges from 0.438 to 0.739 days per year which indicates a 21 to 35 days longer ice-free period over the study period. As expected, this is largely additive to the earlier break-up and later freeze-up of seasonal sea ice reported above. Essentially, as with the break-up, the subdivided periods 1971–1994 and 1995–2018, are not statistically significant (p < 0.05), except for point 9 for the 1995 to 2018 time period; however, similar to freeze-up, the Theil–Sen slopes for the two time periods indicate a more substantial increase in the second, more recent period, consistent with the Lowess curves (Figure 5). The single outlier, point 9, for the later time period is located directly to the north of the Arctic Bay community at the common mouth of two smaller bays, and experiences a low degree of variability due to the limited influence of larger scale regional sea ice dynamics and due to the absence or near absence of multi-year ice. This in turn leads to a statistically significant trend, particularly during the later period, that is the signal is discernible within the inherent variability. As with the other two metrics, these trends are consistent with those reported in [1] for the same grid points but for a shorter time series. Such changes have been explored for Arctic Bay from a community resilience lens by [2,3].
Autocorrelation was found at three grid points for the ice-free period (5,7,8; Figure 1) for 1971–2018. The two sub-periods, 1971–1994 and 1995–2018, did not have any commonality of points across the three time periods. This lack of spatial and temporal coherency suggests that for the ice-free period in Arctic Bay there is no significant “climate memory”, as noted also for the both the break-up and freeze-up.
A correlation analysis was performed for the three metrics for the years of coincident data (as determined by the availability of Nanisivik temperature data). For both ice-free season length and freeze-up dates at all points, there were statistically significant correlations with annual and summer Nanisivik air temperature. This strong signal was less clear for break-up dates, which is likely dependent more on antecedent temperatures from the previous year as found in [24] for Hudson Strait, suggesting some short-term thermal inertia. The coefficient of determination (R2) varied from 20 to 44% for the ice-free season with similar values for the freeze-up date analysis (26 to 36%), indicating the importance of ambient temperature, but also indicating other factors at play such as antecedent temperatures and the advection of sea ice, especially during the break-up, as is most notable in the central points (4, 5, 8, and 9) where the inlet encounters tributaries, leading to more sea ice dynamics.
3.3. Spatial Analysis
The spatial clustering of the nine Arctic Bay grid points was explored using the Ward’s method. In addition, the bifurcation into two shorter time series also did not result in any differences in the clustering of the grid points, and so these are not presented. This in itself is significant, a point we return to later in the Section 4.
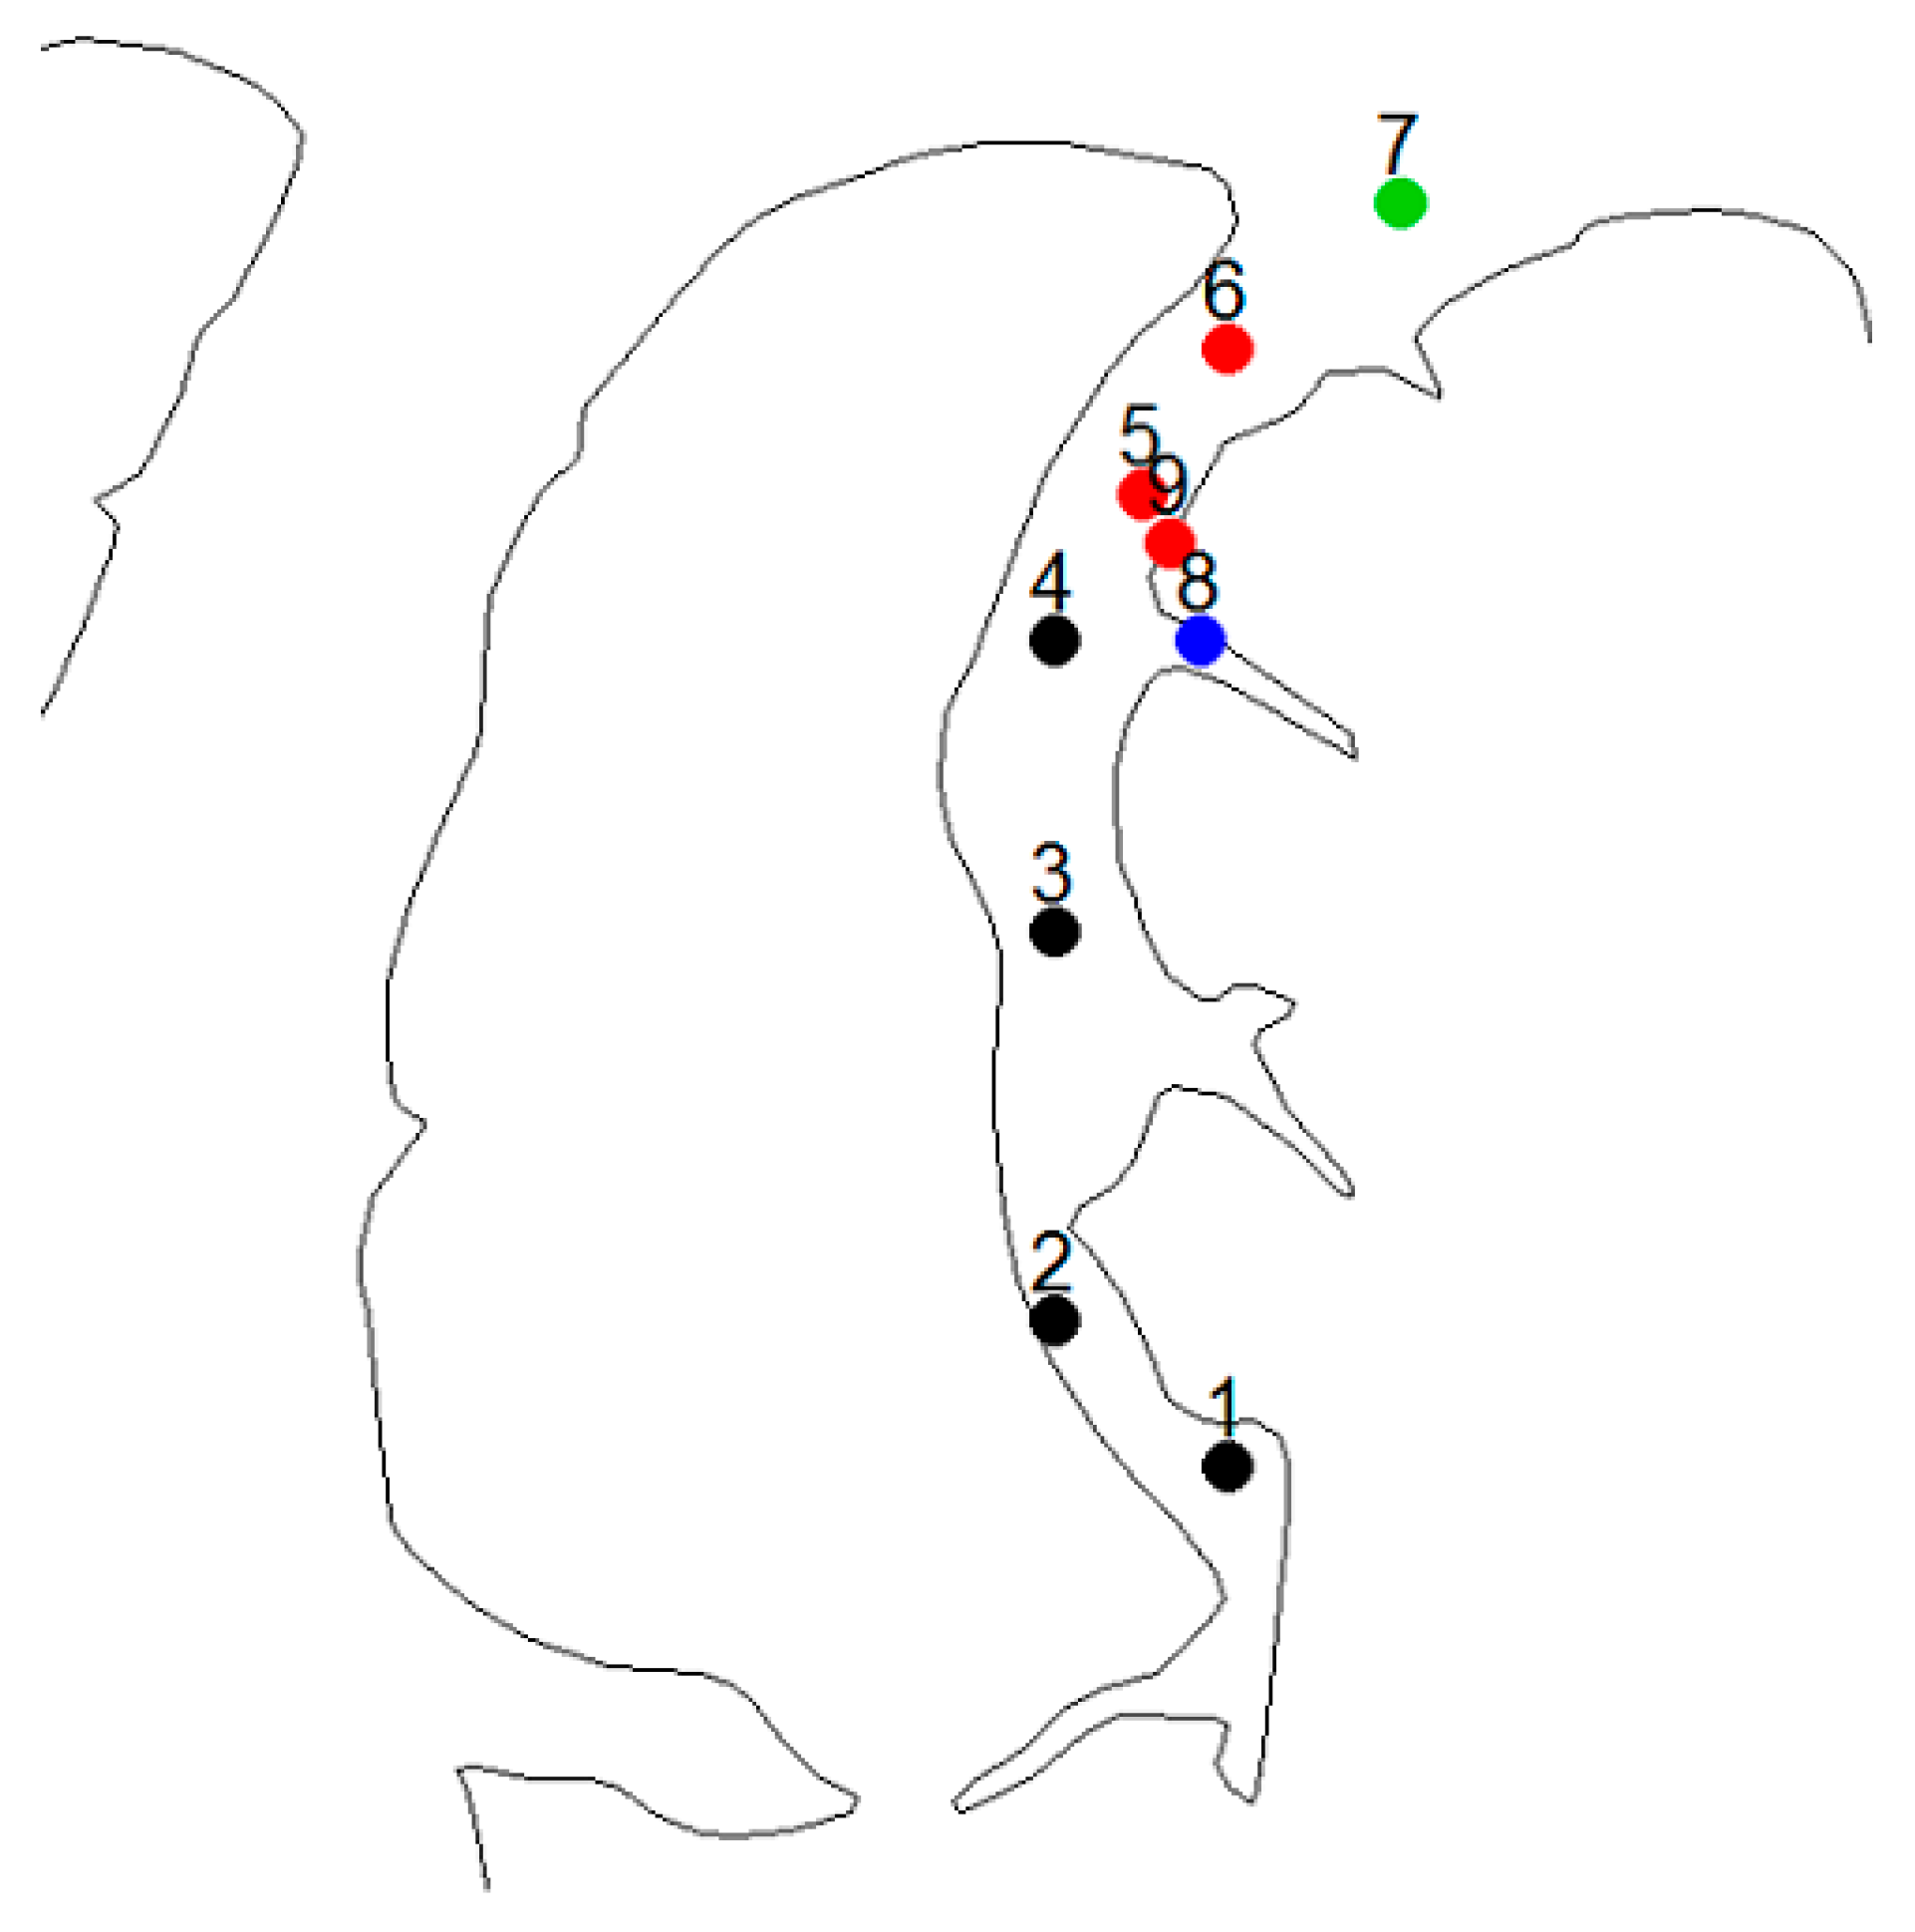
For break-up, the four clusters of grid points are presented in Figure 6. Points 1 to 4 follow a linear pattern from the southernmost part of the bay to the hamlet of Arctic Bay. These points have the latest break-up of all nine points. Three additional contiguous points, 5, 6, and 9, extend from the hamlet north to the mouth of the Bay. The final two clusters have a single membership. Point 8 occurs to the south of the hamlet in a small bay connected to the larger bay. Point 7 is at the mouth of Arctic Bay, and as noted earlier it is likely influenced by larger regional dynamics of sea ice, including multi-year ice and movement of sea ice by ocean currents and winds.
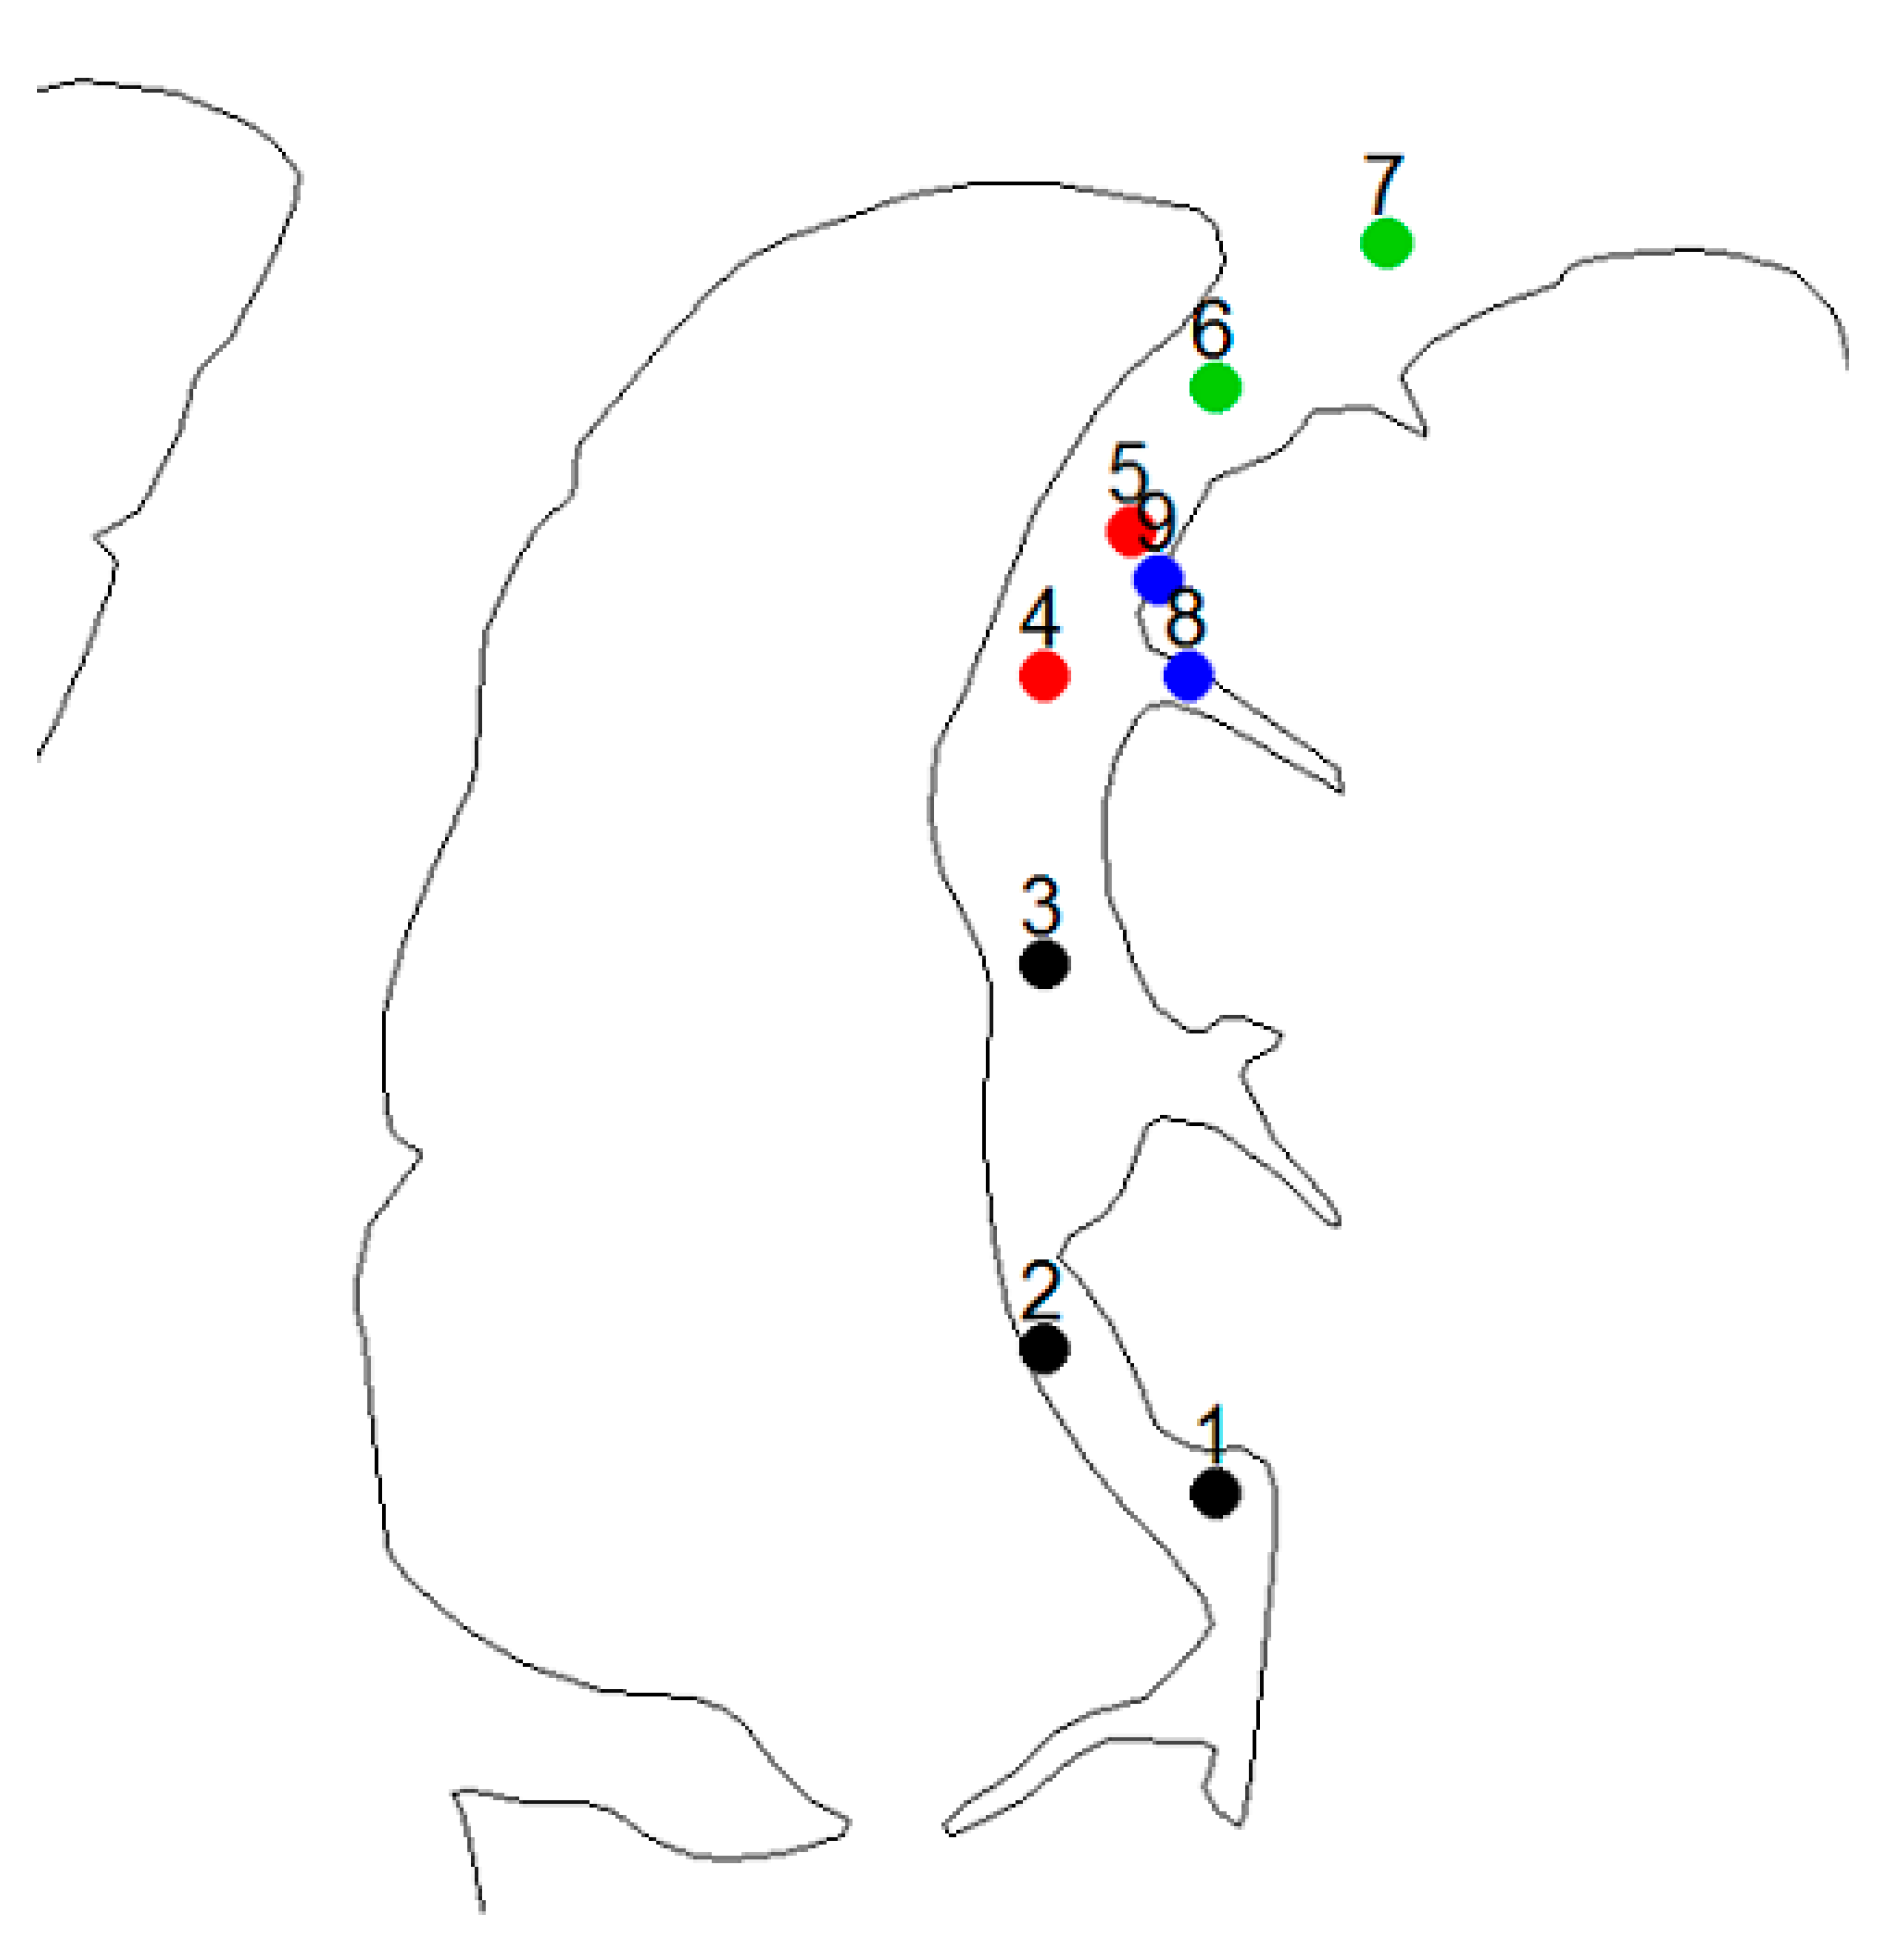
We now turn to a similar cluster analysis for freeze-up in Arctic Bay. These are presented in Figure 7. A slightly different picture emerges. The southerly three points where freeze-up occurs first forms one cluster. Points 4 and 5, in the centre of the bay near the hamlet of Arctic Bay, form a second cluster. Adjacent to this is the third cluster, points 8 and 9, the two closest to the shore just to the north and south of the hamlet. Finally, the two more northerly points, 6 and 7, form the last cluster. The clustering, not unlike break-up, is largely linear from south to north for the first, second, and fourth cluster. The only nuance is the cluster of the near-shore points (8, 9), suggesting a modification of the freeze-up process based on proximity to the shore.
Finally, we examine the clustering for the ice-free period in Figure 8. For this metric, there is a large cluster of five of the nine grid points in the centre of the bay (points 3–6, and 9). Smaller clusters exist, as with the two southerly points (1, 2), plus one point clusters for points 7 and 8, as was seen for the break-up data.
The overall the spatial analysis produced, for the most part, clusters of contiguous points that followed the south/north orientation of the bay. Deviations from this occurred for the two grid points near the hamlet of Arctic Bay that were closer to shore than others. Landfast sea ice does behave differently in other parts of the Eastern Arctic [15,16].
4. Discussion and Conclusions
This work is a temporal expansion by four years (to 2018) of the climatological aspects of the earlier work by [1], and by the inclusion of a spatial clustering analysis. Three questions were addressed, and this section is structured to address each.
4.1. How Statistically Significant Are the Temporal Changes in the Break-Up, Freeze-Up, and Ice-Free Periods for the Nine Grid Points Representing Arctic Bay for Three Time Periods, 1971–2018, 1971–1994, 1995–2018, and the Relationship to Concurrent Temperature Change?
The time series analysis was consistent with the earlier work indicating that all three metrics (break-up, freeze-up, and ice-free period) have changed significantly in timing over the 48-year time period. The only nuance to this steady progression to earlier break-ups, later freeze-ups, and longer ice-free periods was an indication of slowing down of these changes for freeze-up, post-2010, a result reflected in the ice-free period. This may be related to changes in large scale circulation, and this should be explored further, especially the differential impact on freeze-up and not break-up. The most likely candidate is the North Atlantic Oscillation which was in a more negative phase in the early 2000s when freeze-up dates changed to later dates (Figure 4) and became more positive in the 2010s. The correlation analysis between sea ice metrics and ambient temperature found statistically significant results for ice-free season length and freeze-up dates, accounting for up to 44% of the sea ice variability. Break-up dates are less strongly linked to concurrent temperatures, and likely are influenced by antecedent temperatures from the previous year as found in other work [24]. These results are consistent with documented regional Arctic warming [4,5,7,8,9,11,12,13].
4.2. Using a Spatial Cluster Analysis, How Coherent Is the Nature of Break-Up, Freeze-Up, and Ice-Free Periods Spatially Using the Three Time Periods?
The spatial clustering analysis indicated the expected south/north trajectory with the most southerly points forming one cluster and then progressing to the northerly mouth of the bay. The only nuance is the separate clustering for points immediately adjacent to the hamlet of Arctic Bay, which is likely reflective of the nature of landfast ice and the confluence of tributaries to the north and south of the community of Arctic Bay (points 8 and 9). There is no evidence to support such a change in Arctic Bay. Autocorrelation of the nine time series was minimal and does not suggest that “climate memory” was a dominant factor in determining the subsequent year’s sea ice conditions, as has been found elsewhere [24,25], with the possible exception of the break-up dates as noted above.
4.3. From These Two Analyses, Is There Evidence to Suggest a Regime Change in How Sea Ice Dynamics Operate in Arctic Bay?
The fact that breaking up the data into two equal time series did not yield any clustering differences is significant and suggests that the changes in sea ice is not a change in the way the ice behaves other than timing, as observed elsewhere [26].
To the local inhabitants of Arctic Bay and the neighbouring community of Nanisivik, climate change has been realized locally with significant changes to access to traditional foods and a longer navigation season [1,2,3]. This analysis should provide an update on climate change conditions for use in adaptation planning.
Author Contributions
Conceptualization, S.K. and W.A.G.; methodology, S.K. and K.B.; software, S.K. and K.B.;. formal analysis, S.K.; resources, W.A.G.; data curation, S.K.; writing—original draft preparation, S.K.; writing—review and editing, W.A.G.; visualization, S.K. and K.B.; supervision, W.A.G.; project administration, W.A.G.; funding acquisition, W.A.G. All authors have read and agreed to the published version of the manuscript.
Funding
This research was funded by NSERC RGPIN-2018-06801.
Informed Consent Statement
Not applicable.
Data Availability Statement
Temperature data was accessed from the national archive (Environment and Climate Change Canada), https://climate.weather.gc.ca/historical_data/search_historic_data_e.html; Sea ice data were obtained from the Canadian Ice Service, http://www.ec.gc.ca/glaces-ice/default.asp.
Conflicts of Interest
The authors declare no conflict of interest.
References
- Archer, L.; Ford, J.; Pearce, T.; Kowal, S.; Gough, W.A.; Allurut, M. Longitudinal assessment of climate vulnerability: A case study from the Canadian Arctic. Sustain. Sci. 2017, 12, 15–29. [Google Scholar] [CrossRef]
- Ford, J.D.; Smit, B.; Wandel, J. Vulnerability to climate change in the Arctic: A case study from Arctic Bay, Canada. Glob. Environ. Chang. Human Policy Dimens. 2006, 16, 145–160. [Google Scholar] [CrossRef]
- Ford, J.D.; Bell, T.; St-Hilaire-Gravel, D. Vulnerability of community infrastructure to climate change in nunavut: A case study from Arctic Bay. In Community Adaptation and Vulnerability in Arctic Regions; Springer: Dordrecht, The Netherlands, 2010; pp. 107–130. [Google Scholar]
- Nielsen-Englyst, P.; Hoyer, J.L.; Kolbe, W.M.; Dybkjaer, G.; Lavergne, T.; Tonboe, R.T.; Skarpalezos, S.; Karagali, I. A combined sea and sea surface temperature climate dataset of the Arctic, 1982–2021. Remote Sens. Environ. 2023, 284, 113331. [Google Scholar] [CrossRef]
- Comiso, J.C. Warming trends in the Arctic from clear sky satellite observations. J. Clim. 2003, 16, 3498–3510. [Google Scholar] [CrossRef]
- Dybkjaer, G.; Tonboe, R.; Hoyer, J.L. Arctic sea surface temperatures from Metop AVHRR compared to in situ land and ocean data. Ocean. Sci. 2012, 8, 959–970. [Google Scholar] [CrossRef] [Green Version]
- Comiso, J.C.; Hall, D.K. Climate trends in the Arctic as observed from space. Wiley Interdiscip. Rev. Clim. Chang. 2014, 5, 389–409. [Google Scholar] [CrossRef] [PubMed]
- Cao, Y.; Liang, S. Recent advances in driving mechanisms of the Arctic amplification: A review. Chin. Sci. Bull. 2018, 63, 2757–2774. [Google Scholar] [CrossRef] [Green Version]
- Ma, J.; Tao, S.; Du, L.; Shi, H. Decadal Variation of Sea Ice Melting-Frozen Season in the Pacific Sector of the Arctic. Clim. Chang. Res. Lett. 2019, 8, 302–311. [Google Scholar] [CrossRef]
- Banzon, V.; Smith, T.M.; Steele, M.; Huang, B.; Zhang, H.-M. Improved estimation of proxy sea surface temperature in the Arctic. J. Atmos. Ocean. Technol. 2020, 37, 341–349. [Google Scholar] [CrossRef]
- Carvalho, K.S.; Wang, S. Sea surface temperature variability in the Arctic Ocean and its marginal seas in a changing climate. Patterns Mech. 2020, 193, 103265. [Google Scholar] [CrossRef]
- Collow, A.B.M.; Cullather, R.I.; Bosilovich, M.G. Recent artic ocean sea surface temperatures in atmospheric re-analysis and numerical simulations. J. Clim. 2020, 33, 4347–4367. [Google Scholar] [CrossRef] [Green Version]
- Zheng, L.; Cheng, X.; Chen, Z.; Liang, Q. Delay in Arctic Sea Ice Freeze-Up Linked to Early Summer Sea Ice Loss: Evidence from Satellite Observations. Remote Sens. 2021, 13, 2162. [Google Scholar] [CrossRef]
- Docquier, D.; Koenigk, T. A review of interactions between ocean heat transport and Arctic sea ice. Environ. Res. Lett. 2021, 16, 123002. [Google Scholar] [CrossRef]
- Gagnon, A.S.; Gough, W.A. Trends in the Dates of Ice Freeze-up and Breakup over Hudson Bay, Canada. Arctic 2005, 58, 370–382. [Google Scholar] [CrossRef] [Green Version]
- Kowal, S.; Gough, W.A.; Butler, K. Temporal Evolution of Hudson Bay Sea Ice (1971–2011). Theor. Appl. Climatol. 2017, 127, 753–760. [Google Scholar] [CrossRef]
- Etkin, D.A. Break-up in Hudson Strait: Its sensitivity to air temperatures and implications for climate warming. Climatol. Bull. 1991, 25, 21–34. [Google Scholar]
- Stirling, I.; Derocher, A.E. Possible impacts of climatic warming on polar bears. Arctic 1993, 46, 240–245. [Google Scholar] [CrossRef]
- Neave, H.R.; Worthington, P.L. Distribution-Free Tests; Unwin Hyman Limited: London, UK, 1988. [Google Scholar]
- Hamed, K.H.; Rao, A.R. A modified Mann–Kendall trend test for autocorrelated data. J. Hydrol. 1998, 204, 182–196. [Google Scholar] [CrossRef]
- Sen, P.K. Estimates of the Regression Coefficient Based on Kendall’s Tau. J. Am. Stat. Assoc. 1968, 63, 1379–1389. [Google Scholar] [CrossRef]
- Cleveland, W.S. LOWESS: A program for smoothing scatterplots by robust locally weighted regression. Am. Stat. 1981, 35, 54. [Google Scholar] [CrossRef]
- Johnson, R.A.; Wichern, D.W. Applied Multivariate Statistical Analysis, 5th ed.; Prentice-Hall: Upper Saddle River, NJ, USA, 2002. [Google Scholar]
- Gough, W.A.; Houser, C. Climate memory and long range forecasting of sea ice conditions in Hudson Strait. Polar Geogr. 2005, 29, 17–26. [Google Scholar] [CrossRef]
- Andrews, J.; Babb, D.G.; Barber, D.G. Climate change and sea ice: Shipping in Hudson Bay, Hudson Strait, and Foxe Basin (1980–2016). Elem. Sci. Anthr. 2018, 6, 19. [Google Scholar] [CrossRef] [Green Version]
- Ho, E.; Tsuji, L.J.S.; Gough, W.A. Trends in river-ice break-up data for the Western James Bay region of Canada. Polar Geogr. 2005, 29, 291–299. [Google Scholar] [CrossRef]
Figure 1.
Arctic Bay, NU (73.04° N, 85.15° W), in the Eastern Canadian Arctic from [1]. Points 1 to 9 are the locations of the grid used in this analysis. The community of Arctic Bay is located between points 8 and 9.
Figure 1.
Arctic Bay, NU (73.04° N, 85.15° W), in the Eastern Canadian Arctic from [1]. Points 1 to 9 are the locations of the grid used in this analysis. The community of Arctic Bay is located between points 8 and 9.

Figure 2.
Temperature record (°C) at Nanisivik, NU from 1978 to 2006 and for selected years at Arctic Bay, NU.
Figure 2.
Temperature record (°C) at Nanisivik, NU from 1978 to 2006 and for selected years at Arctic Bay, NU.

Figure 3.
Lowess curve for location 9 (Arctic Bay) for the break-up dates.

Figure 4.
Lowess curve for location 8 (Arctic Bay) for the freeze-up dates.

Figure 5.
Lowess curve for location 5 (Arctic Bay) for the ice-free period.

Figure 6.
Spatial representation of the cluster analysis using Ward’s method for break-up dates for the period of 1971–2018 for Arctic Bay.
Figure 6.
Spatial representation of the cluster analysis using Ward’s method for break-up dates for the period of 1971–2018 for Arctic Bay.

Figure 7.
Spatial representation of the cluster analysis using Ward’s method for freeze-up dates for the period of 1971–2018 for Arctic Bay.
Figure 7.
Spatial representation of the cluster analysis using Ward’s method for freeze-up dates for the period of 1971–2018 for Arctic Bay.

Figure 8.
Spatial representation of the cluster analysis using Ward’s method for ice-free dates for the period of 1971–2018 for Arctic Bay.
Figure 8.
Spatial representation of the cluster analysis using Ward’s method for ice-free dates for the period of 1971–2018 for Arctic Bay.


Table 1.
Break-up in Arctic Bay. Mann–Kendall test and Theil–Sen Slope, (*** p < 0.01, ** p < 0.05, * p < 0.1, NS p > 0.01). See Figure 3 for locations.
Table 1.
Break-up in Arctic Bay. Mann–Kendall test and Theil–Sen Slope, (*** p < 0.01, ** p < 0.05, * p < 0.1, NS p > 0.01). See Figure 3 for locations.
| Points | Mann–Kendall | Theil–Sen (Days per Year) | Mann–Kendall | Theil–Sen (Days per Year) | Mann–Kendall | Theil–Sen (Days per Year) |
|---|---|---|---|---|---|---|
| 1971–2018 | 1971–2018 | 1971–1994 | 1971–1994 | 1995–2018 | 1995–2018 | |
| 1 | *** | −0.29 | NS | −0.13 | NS | −0.14 |
| 2 | *** | −0.33 | NS | −0.17 | NS | −0.27 |
| 3 | ** | −0.24 | NS | −0.17 | NS | −0.12 |
| 4 | *** | −0.27 | NS | −0.29 | NS | −0.36 |
| 5 | *** | −0.23 | NS | −0.08 | NS | −0.38 |
| 6 | ** | −0.23 | NS | 0.00 | NS | −0.13 |
| 7 | *** | −0.43 | NS | −0.61 | NS | −0.17 |
| 8 | ** | −0.19 | NS | −0.12 | NS | −0.11 |
| 9 | *** | −0.25 | NS | −0.15 | NS | −0.28 |
Table 2.
Freeze-up, Arctic Bay. Mann–Kendall test and Theil–Sen Slope, (*** p < 0.01, ** p < 0.05, * p < 0.1, NS p > 0.01). See Figure 3 for locations.
Table 2.
Freeze-up, Arctic Bay. Mann–Kendall test and Theil–Sen Slope, (*** p < 0.01, ** p < 0.05, * p < 0.1, NS p > 0.01). See Figure 3 for locations.
| Points | Statistical Significance | Theil–Sen (Days per Year) | Statistical Significance | Theil–Sen (Days per Year) | Statistical Significance | Theil–Sen (Days per Year) |
|---|---|---|---|---|---|---|
| 1971–2018 | 1971–2018 | 1971–1994 | 1971–1994 | 1995–2018 | 1995–2018 | |
| 1 | ** | 0.20 | NS | 0.00 | NS | 0.21 |
| 2 | ** | 0.27 | NS | 0.00 | NS | 0.50 |
| 3 | ** | 0.29 | NS | 0.14 | NS | 0.34 |
| 4 | ** | 0.28 | * | 0.27 | NS | 0.50 |
| 5 | *** | 0.33 | NS | 0.23 | NS | 0.50 |
| 6 | ** | 0.31 | NS | −0.28 | NS | 0.54 |
| 7 | ** | 0.34 | NS | −0.09 | NS | 0.59 |
| 8 | *** | 0.36 | NS | 0.03 | NS | 0.73 |
| 9 | *** | 0.33 | NS | −0.08 | NS | 0.67 |
Table 3.
Ice-free period, Arctic Bay. Mann–Kendall test and Theil–Sen Slope, (*** p < 0.01, ** p < 0.05, * p < 0.1, NS p > 0.01). See Figure 3 for locations.
Table 3.
Ice-free period, Arctic Bay. Mann–Kendall test and Theil–Sen Slope, (*** p < 0.01, ** p < 0.05, * p < 0.1, NS p > 0.01). See Figure 3 for locations.
| Points | Mann–Kendall | Theil–Sen (Days per Year) | Mann–Kendall | Theil–Sen (Days per Year) | Mann–Kendall | Theil–Sen (Days per Year) |
|---|---|---|---|---|---|---|
| 1971–2018 | 1971–2018 | 1971–1994 | 1971–1994 | 1995–2018 | 1995–2018 | |
| 1 | *** | 0.50 | NS | 0.00 | NS | 0.00 |
| 2 | *** | 0.58 | NS | 0.00 | NS | 0.76 |
| 3 | *** | 0.50 | NS | 0.00 | NS | 0.00 |
| 4 | *** | 0.50 | NS | 0.47 | NS | 0.44 |
| 5 | *** | 0.56 | NS | 0.00 | NS | 1.00 |
| 6 | *** | 0.61 | NS | 0.00 | NS | 0.68 |
| 7 | * | 0.79 | NS | 0.38 | NS | 0.32 |
| 8 | ** | 0.44 | NS | 0.00 | NS | 0.64 |
| 9 | *** | 0.58 | NS | 0.00 | ** | 1.00 |
Disclaimer/Publisher’s Note: The statements, opinions and data contained in all publications are solely those of the individual author(s) and contributor(s) and not of MDPI and/or the editor(s). MDPI and/or the editor(s) disclaim responsibility for any injury to people or property resulting from any ideas, methods, instructions or products referred to in the content. |
© 2023 by the authors. Licensee MDPI, Basel, Switzerland. This article is an open access article distributed under the terms and conditions of the Creative Commons Attribution (CC BY) license (https://creativecommons.org/licenses/by/4.0/).
Share and Cite
MDPI and ACS Style
Kowal, S.; Gough, W.A.; Butler, K. Temporal and Spatial Evolution of Seasonal Sea Ice of Arctic Bay, Nunavut. Coasts 2023, 3, 113-124. https://doi.org/10.3390/coasts3020007
AMA Style
Kowal S, Gough WA, Butler K. Temporal and Spatial Evolution of Seasonal Sea Ice of Arctic Bay, Nunavut. Coasts. 2023; 3(2):113-124. https://doi.org/10.3390/coasts3020007
Chicago/Turabian StyleKowal, Slawomir, William A. Gough, and Kenneth Butler. 2023. "Temporal and Spatial Evolution of Seasonal Sea Ice of Arctic Bay, Nunavut" Coasts 3, no. 2: 113-124. https://doi.org/10.3390/coasts3020007