
Spatial and Temporal Variations in Shoreline Changes of the Niger Delta during 1986–2019


1
School of Geography and Environmental Science, University of Southampton, Southampton SO17 1BJ, UK
2
Department of Geography, Obafemi Awolowo University, Ile-Ife 220005, Nigeria
*
Author to whom correspondence should be addressed.
Coasts 2022, 2(3), 203-220; https://doi.org/10.3390/coasts2030010
Submission received: 14 April 2022
/
Revised: 6 July 2022
/
Accepted: 6 July 2022
/
Published: 13 July 2022
Abstract
:The purpose of this study was to analyse the shoreline movement of the Niger delta, specifically focusing on the spatial pattern of the delta’s shoreline behaviour during 1986–2019. We employed satellite data of medium spatial resolution (20–30 m) to delimit the delta shorelines representing specific time in order to determine the rates of the delta shoreline migration. Our results show that the delta shoreline has changed nearly in equal proportion between erosion (50.3%) and accretion (49.7%), at mean (maximum) rates of 3.9 m/yr. (26 m/yr.) of erosion, and 4.0 m/yr. (27 m/yr.) of accretion. Further analysis indicates that the highest shoreline migration is seaward (>200 m) though the ratio of the shoreline distance in recession (54%) exceeds that which is in accretion. Our analysis did not reveal any entrenched spatial pattern of shoreline behaviour but rather highlights a random occurrence of hotspots in both shoreline erosion and accretion over space and time. We have also showed that by applying the statistical mean-removed shoreline approach, the overall trend of a delta shoreline movement can be vividly discriminated. In conclusion, since the Niger delta shoreline dynamics is most intense at the delta river mouths, we suggest this is likely due to the interaction between waves and river discharge in these locations.
1. Introduction
Delta coastline changes respond to the intricate interplay among a host of oceanographic and hydrological variables, including fluvial discharge, wave climate, tides, longshore and cross shore currents, and coastline bathymetry and geometry [1]. In reality, fluvial sediment supply is the most critical factor of delta coastline dynamics, which tends to inform a delta’s resilience to climatic and environmental changes through the maintenance of its elevation relative to the sea level [2,3,4]. Indeed, the position of a delta’s shoreline is often considered a good indicator of the dynamic interaction between the fluxes of fluvial (water and sediment) discharges and oceanographic (waves, tides, and currents) processes [5,6,7]. Thus, a shift in the shoreline position basinward (i.e., progradation) may be indicative of a state of excess sediment supply, while a landward shift (i.e., recession) may be indicative of a state of relative sediment starvation [4,8,9].
Recent studies have pointed to a steady decline in fluvial sediment supply from major global river basins in response to the increasing anthropogenic drainage basin activities [10,11,12,13,14]. Moreover, current climatic and environmental changes are projected to be most impactful within the low-lying coastal zones globally [15]. The coupling of fluvial sediment declines with climatic change intensification appears to have effectively set many deltas on a destructive path marked by pervasive shoreline recession and land submergence [4,16,17,18]. In view of the increasing vulnerability of river deltas, accurate time series analysis of delta shoreline movement is of critical importance [4,17]. An improved understanding of delta shoreline behaviour guarantees relevant information pertaining to the magnitude and pattern of erosion/accretion within a delta coastal region [4,17,18]. Additionally, coastline information also aids specific decision-making processes, such as the determination of an ideal construction setback for coastline structures, the assessment of the effectiveness of shoreline protective measures, and the establishment of hazard zones [19,20,21].
During the recent decades, scientific inquiry into the nature and magnitude of delta morphological changes has been intensified. In the Nile delta, shoreline change analysis was undertaken to investigate the response of the coastline morphology to wave forces prior to and after the construction of coastline protection structures along key delta promontories (Rosetta and Damietta) [22]. Jimenez et al. [23] explored the impact of coastline reshaping processes, especially waves, along the Ebro delta in relation to the declining fluvial sediment input. Similarly, the impact of river regulation on delta shoreline dynamics was the focus of Bergillos’ et al. [24] analysis of the shoreline movement of the Guadalfeo delta in the Mediterranean coast of Spain. In a bid to untangle the relative influences of natural and anthropogenic processes, the shoreline dynamics of the Volta delta in West Africa was critically appraised in a recent review [25]. Further, recent high resolution satellite data of the Mekong delta were employed in an analysis of the shoreline recession resulting from increasing anthropogenic pressure within the delta and the source river basin [18], while the role of mangrove vegetation in the delta’s shoreline stability was later investigated by Besset et al. [26]. Remote sensing data of 54 representative global river deltas were recently analysed in an attempt to resolve the rate of land conversion into open water (and vice versa) in response to the changing sediment budget of the delta systems [4]. The specific examples outlined in the preceding show the growing interest in delta coastline dynamics in the overall desire to contextualise the coupled effect of the increasing anthropogenic pressure and climatic/environmental changes.
Within the Niger delta region and the source Niger River basin, anthropogenic pressures relating to oil and gas extraction and dam construction have been on the rise over the past half-century since the delta became the key economic hotspot of the West African country of Nigeria. Previously, the coupled relationship between the delta shoreline dynamics and trends of fluvial discharge from the Niger River basin was examined [27,28] while the influence of the changing wave climate on the delta’s coastline behaviour has also been investigated [29,30]. Attempts have also been made to examine the spatio-temporal variation of the delta coastline dynamics during recent decades using readily accessible satellite data [31,32]. Further, the Niger delta coastline dynamics has been examined as a subset of key recent global-scale analysis [4,33]. Most previous work affirmed that the delta is not currently in a dominant state of shoreline recession. Instead, both shoreline erosion and accretion have occurred randomly in recent decades. The random delta coastline change established in the previous studies may be indicative of a delta under the influence of natural process dynamics rather than one that had transitioned into an anthropogenically disturbed state [13,16]. For instance, in previous attempts to correlate the Niger delta coastline dynamics with river basin fluvial discharges (e.g., [27,28]), it was contended that observed fluctuations in the fluvial discharge from the Niger River during the previous decades were mainly influenced by the corresponding periodic hydroclimatic variabilities rather than by increasing anthropogenic pressures. Current delta coastline behaviour, it would appear, has yet to respond to any sediment-starvation scenario as previously suggested [34,35]. However, the trends of the incident wave climate along the delta coastline show significant correlations with the coastline changes [29,30], indicating that the coupling of wave and fluvial processes along the delta coastline is fundamental to current shoreline dynamics. Moreover, the Niger delta is believed to be spatially varied regarding the relative influences of key fluvial and marine processes; in particular, the highlighted reduced fluvial input into the eastern half of the delta [35,36,37]. In this regard, Niger delta coastline dynamics may be expected to manifest some obvious spatial pattern. Although previous analyses of the Niger delta coastline dynamics established some hotspots of extreme shoreline changes between 1986–2012, they did not reveal any identifiable spatial pattern (e.g., [32]). We therefore identify the spatial pattern of the decadal shoreline movement of the Niger delta as an area in need of further investigation.
Accordingly, the main objective of this study is to examine the spatial pattern of recent Niger delta shoreline dynamics. We focus specifically on the spatial pattern of shoreline dynamics due to the outlined spatial variation in the relative influences of fluvial, wave and tidal processes along the delta coast [36,37,38]. Hence, the study analyses medium resolution satellite data of the Niger delta spanning the period 1986–2019 (the initial date corresponds with the time when quality satellite data became available). We characterise the rates of shoreline dynamics through a division of the entire study period into multiple temporally distinct epochs, while the delta’s spatial extent is similarly delineated into multiple alongshore coastline cells. Statistical procedures are employed to characterise the pervasive pattern of shoreline dynamics within the successive alongshore cells.
2. Geographical Setting
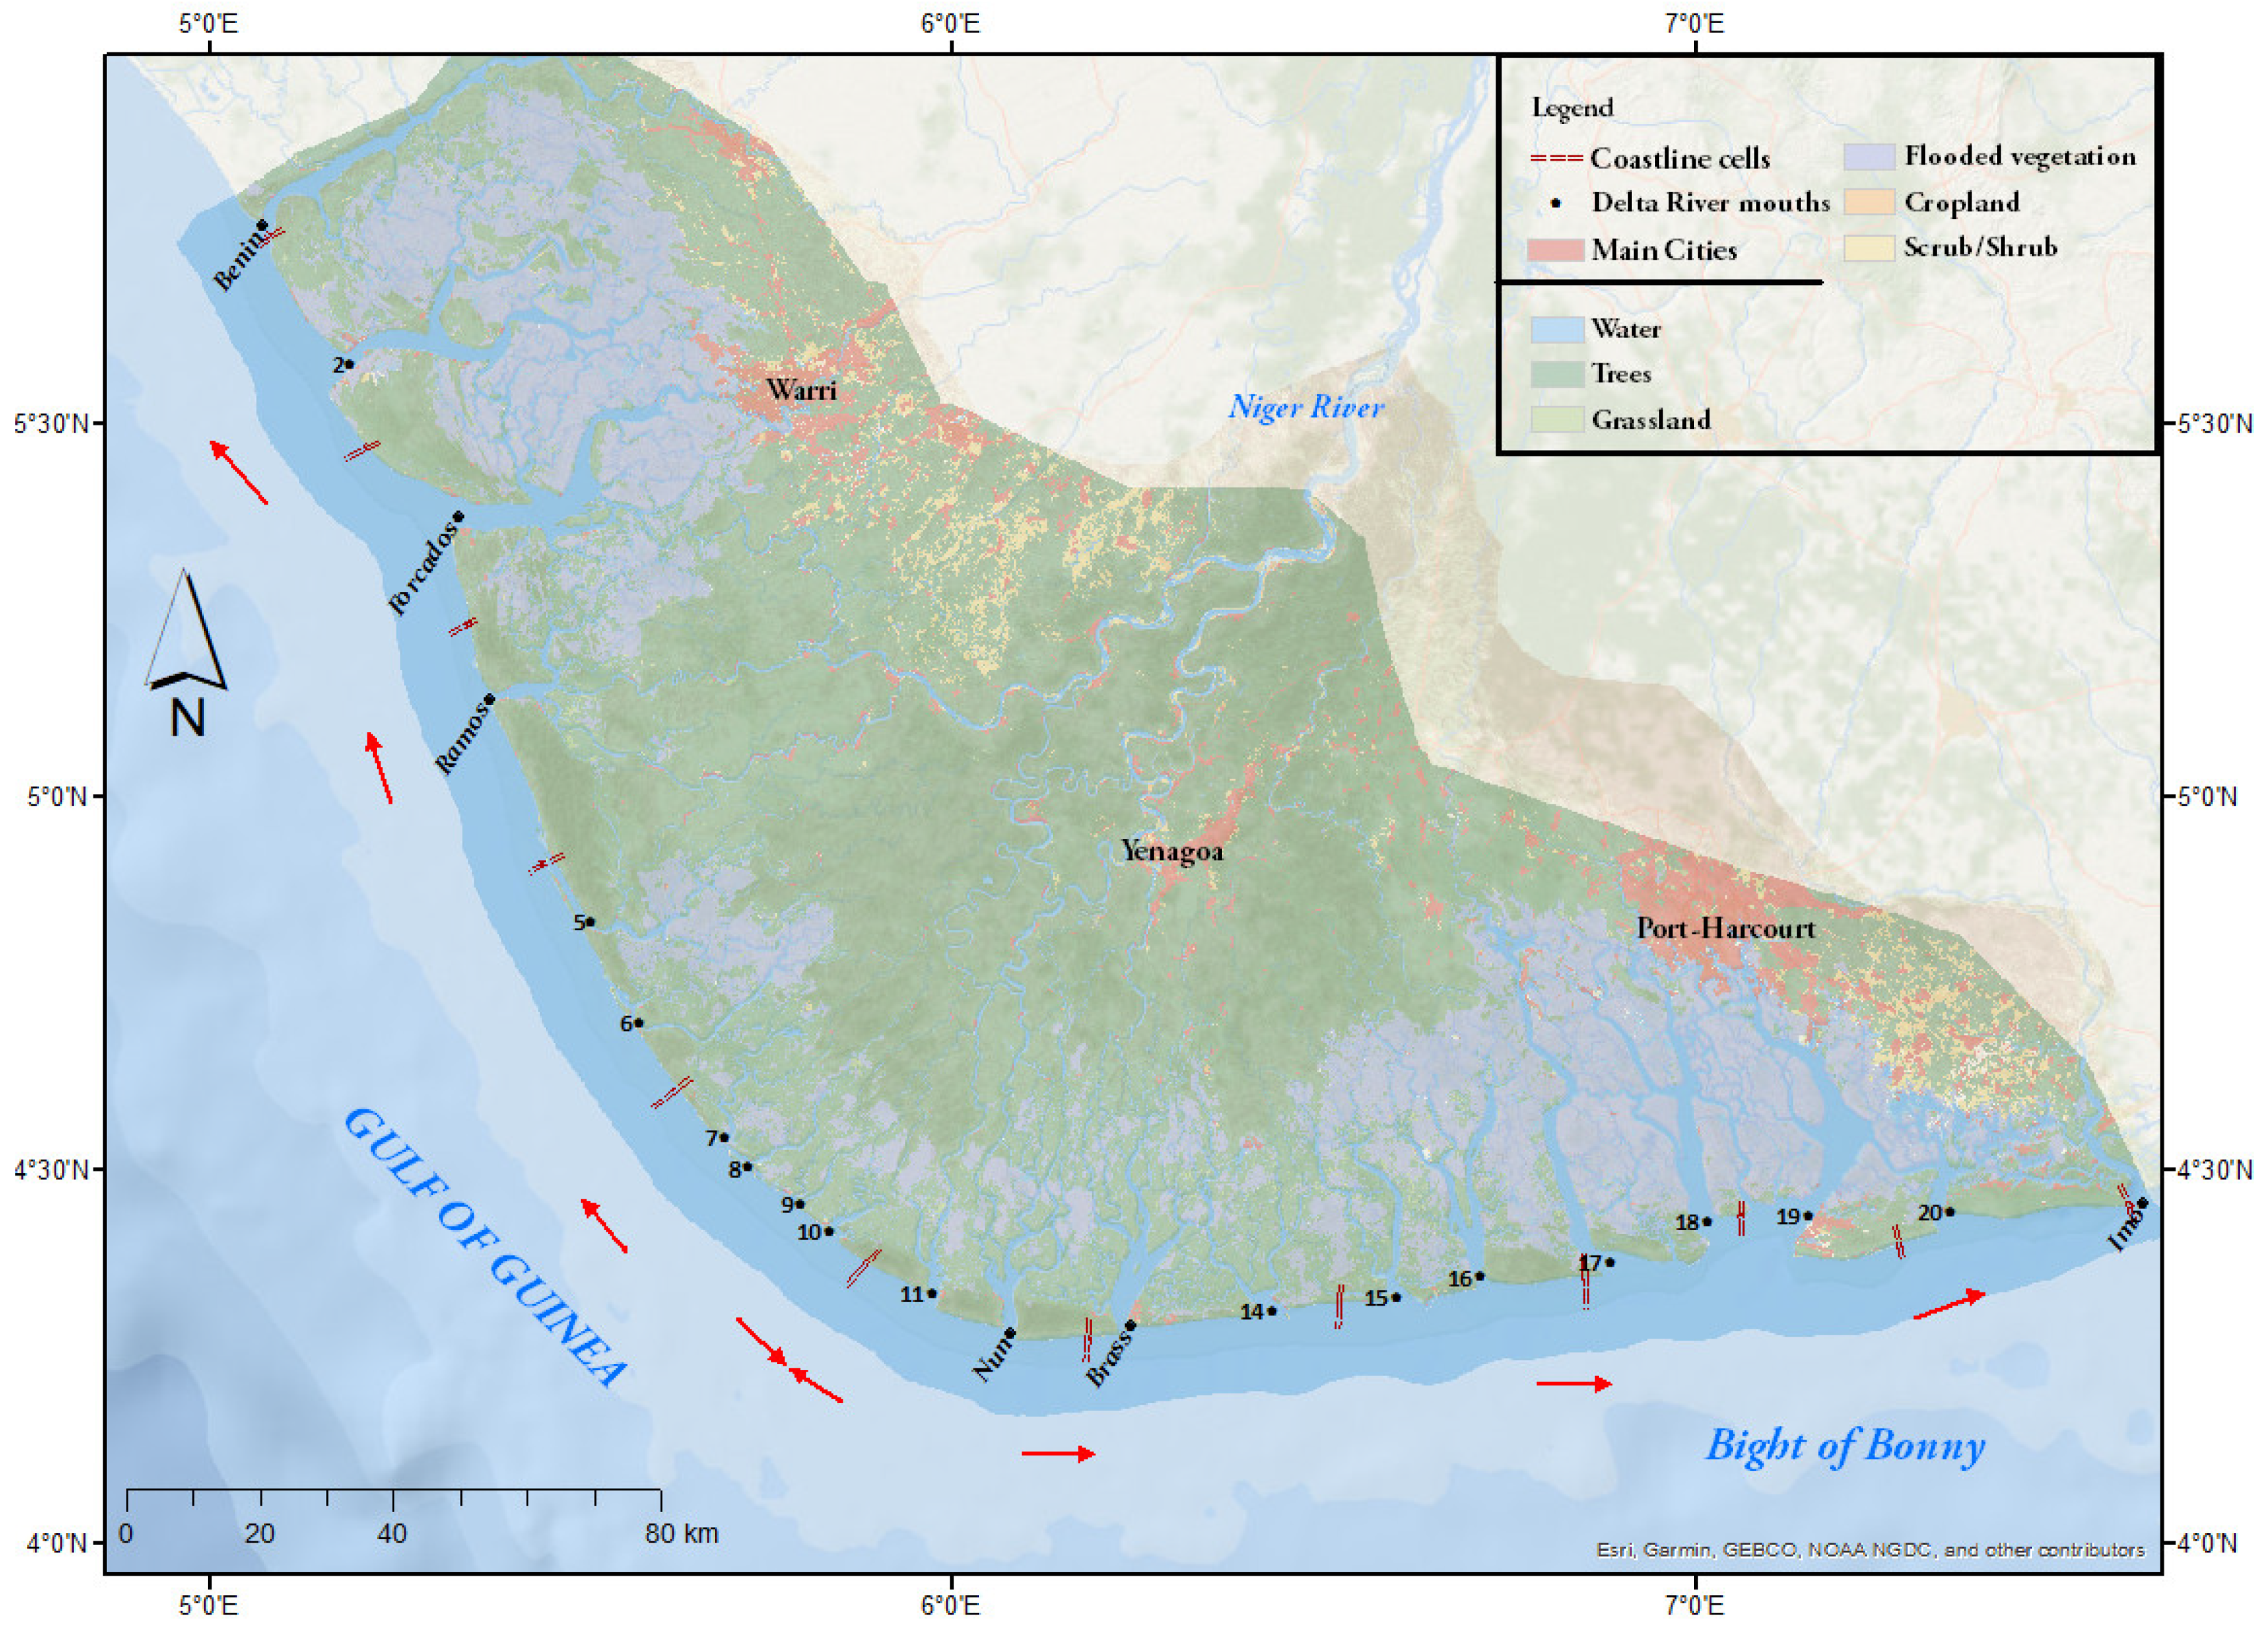
The Niger delta is a sedimentary basin which occupies the Gulf of Guinea continental margin in equatorial West Africa, between latitudes 3–6° N and longitudes 5–8° E (Figure 1). The region covers an estimated area of ~20,000 km2, albeit with considerable variability in various published sources (e.g., [1,2,38]), and is presently home to ~12 million people at a density of ~300 persons per square kilometres [39].
The Niger delta coast is a cyclone and storm-free environment, mainly influenced by south-westerly winds and swell waves that originate in the storm centres within the Atlantic Ocean [28,40]. The delta region on average (1998–2007 period) receives ~2300 mm/year of rain with an actual evapotranspiration of ~600 mm/year [41].
Going by the schematic illustration of the coastal energy spectrum [42], the Niger delta may be classified principally as a wave-dominated coastline (i.e., 1 < Hsig ≤ 2 m; tidal range: <2 m), though the increasing influence of tides towards the eastern margin has been acknowledged [37,43] and cross shore currents are also thought to have some impact on the delta’s sediment transport [5,43]. Average semi-diurnal tidal amplitudes trend from 1 m at the western end, increasing to 1.6 m in the central section and attaining a high of 2.5 m in the eastern margin [37,44]. Tidal flows result in a net loss of sediments to the ocean because the gradient on the ocean-facing side is steeper, thereby resulting in more energetic ebb–tidal flows relative to the flood flows [43,45]. Waves into the delta coast are described as high intensity and are of two distinct origins. Locally generated seas with an average height of 1.25 m and a maximum period of 3–4 s originate from the south-west direction. Conversely, south-southwesterly storms bring swell waves with average height of ~1.5 m and period of 12–13 s to the Niger delta coast [44,45]. The Niger delta is arcuate in shape with a smooth coastline, a reflection of waves having enough energy to move sediment and smooth the coastline [7,46,47].
The Niger River discharges into the Gulf of Guinea via ~20 delta distributary channels. Some of the most prominent distributaries are the Nun (seen as the direct continuation of the main stem Niger River into the Ocean), Forcados (regarded as the second of the two main distributaries), Brass, Ramos, Sangana, and Sombreiro [36,37]. Peak fluvial discharges occur during the wet season months of September and October, while between December and May, the flow discharge is usually at a minimum [36]. The distributary channels cut the delta coastline morphology into a series of contiguous beach–ridge barrier complexes whose dimensions typically range between 15–20 km long and 3–5 km in width [40,47]. The delta has previously been characterised into western delta, arcuate (main) delta, and eastern delta based on its morphology and sedimentary characteristics [29,37], although a two-sector division either side of the centrally located longshore current divergence point [43,46,47] seems to be more appropriate.
3. Materials and Methods
3.1. Data Sources
Orthorectified multispectral satellite data from Landsat for the years 1986, 1999, 2003, 2008, and 2011, as well as Sentinel 2 images for 2015 and 2019, were downloaded via the USGS Earth Explorer repository. An initial reconnaissance survey of available satellite data for the study site revealed a total absence/incompleteness of satellite images during the period 1988–1998, explaining the irregular interval between the dates of the satellite data used in this study. The satellite images from Landsat were acquired at Level T1 processing and were from Landsat 5 TM (Thematic Mapper) (1986, 1999) and Landsat 7 ETM+ (2003, 2006, 2011). At level T1, Landsat data have been radiometrically corrected and geographically calibrated prior to their release for public use. The Sentinel 2 images were acquired as Level 1C TOA (Top of Atmosphere) reflectance data, which indicated images that had undergone both radiometric and geometric corrections, including orthorectification, and hence are released as accurate geolocated products. Moreover, we obtained the FRB (Full Resolution Browse) tiles, already prepared in GEOTIFF (Georeferenced Tagged Image File) format in simulated natural colour composites of bands 4 (10 m), 8A (20 m) and 11 (20 m), thus giving the data an overall resolution of 20 m. All satellite data were obtained at a maximum scene cloud cover of ≤20%, though the majority have cloud coverage of <10%.
3.2. Image Preparation
All satellite data were pre-processed using ERDAS Imagine image processing software to combine all visible, near-infrared (NIR) and shortwave infrared (SWIR) bands (layer-stacking), and to coalesce the contiguous scenes that make up the Niger delta region into a single image (mosaicking). The rest of the analyses (including georeferencing, feature creation, and shoreline digitizing) were carried out within the ArcGIS environment.
A variety of band combinations, e.g., bands 4 and 5 (near-infrared) and band 7 (mid-infrared), as well as bands 3 (visible), band 4 (near-infrared), and band 7 (mid-infrared), were employed in a colour composite to provide clear distinction between waterbody, vegetation/land, and thus enhance manual image digitizing on the Landsat data. This was done to make the vegetation line clearly discernible and thus enable manual digitizing of the vegetation line as the shoreline proxy, following the approach adopted in previous studies of the Niger delta [4,29]. One of the advantages of using the vegetation line as a shoreline proxy is that it is somewhat a less variable indicator of shoreline change. The response of the vegetation line to erosion or accretion is about months to years as against, for example, the wet/dry line which tends to be characterised by much higher frequency change [21]. Irrespective of the preceding, the effect of natural seasonal variations (i.e., discharge and wave energy are greater during the wet season (May–October) and tidal range has higher momentum during the dry season months (December–April)) in the study area was acknowledged [36,37]. Thus, we limited our satellite images selection to the dry season period of the year (December–February) as a way of minimizing any shoreline distortions that may arise due to seasonal variability [8,32].
3.3. Shoreline Position Uncertainty
We estimate shoreline positional uncertainty by incorporating the square root of the squared georeferencing error, image digitizing error, and error due to image pixel resolution into a mathematical notation. Thus, total error Ep (m) is the cumulative of corresponding errors relating to image resolution Er (m), the root mean georeferencing error Eg (m) of the data, and the error due to digitizing Ed (m) the shoreline (e.g., [4,48]):
The root mean squared georeferencing error (m) was computed by geo-rectifying the mosaicked images through a first order polynomial transformation of 18 ground control points (GCPs) extracted from the Google Earth. The GCPs represent fixed visible objects in the landscape of the area, such as road intersections. The error estimates corresponding to the difference between the final positions of the control points relative to their specific real-life locations cumulatively give the root mean squared error (RMSE) for the georeferencing. In addition to the georeferencing error, other variables in the error estimation were incorporated appropriately (Table 1).
A separate Ep was estimated for each time step of satellite data, and the summation were annualized to provide yearly error estimates using:
where represents the start year shoreline error, is the end year shoreline error, and is the time difference between the two dates. The annualized error indicates the lowest value below which shoreline change cannot be considered detectable in the analysis. In the present study, the shoreline position uncertainty due to tidal fluctuations was not considered, in common with previous studies [32,50]. This is justifiable because the Niger delta tidal range is low (average ~1.43 m) [37], indicating minimal tidal influence [32], while the selected satellite data were also carefully chosen to correspond to the dry season period to make any associated tidal error both negligible and constant. Overall, the annualized uncertainty estimated for the 34-year period (1986–2019) was ±2.7 m, which is augmented to ±3 m (see Table 1).
3.4. Shoreline Change Analysis
The Digital Shoreline Analysis System (DSAS) was employed to compute the shoreline change rates along the Niger delta between 1986 to 2019. DSAS provides a measure of the net shoreline movement (NSM), shoreline change envelope (SCE), end point rate (EPR), and linear regression rate (LRR) between two or more shorelines [51,52,53]. The measurement was referenced to a baseline created in correspondence with the orientation of the shorelines and are along perpendicular transects designed to intersect each of the shorelines. Transects were cast at 400 m alongshore spacing, thus producing ~1100 transects for the Niger delta coastline (>400 km long). The analysis period was considered in 6 distinct epochs involving the following shoreline dates: 1986–1999 (Epoch 1); 1999–2003 (Epoch 2); 2003–2008 (Epoch 3); 2008–2011 (Epoch 4); 2011–2015 (Epoch 5); and 2015–2019 (Epoch 6). The LRR was not computed for the individual epochs as the number of shorelines (i.e., 2) is less than the number required (i.e., ≥3) [53], and as a result we make the EPR our reference statistic.
4. Results
4.1. Shoreline Movement along the Niger Delta during 1986–2019
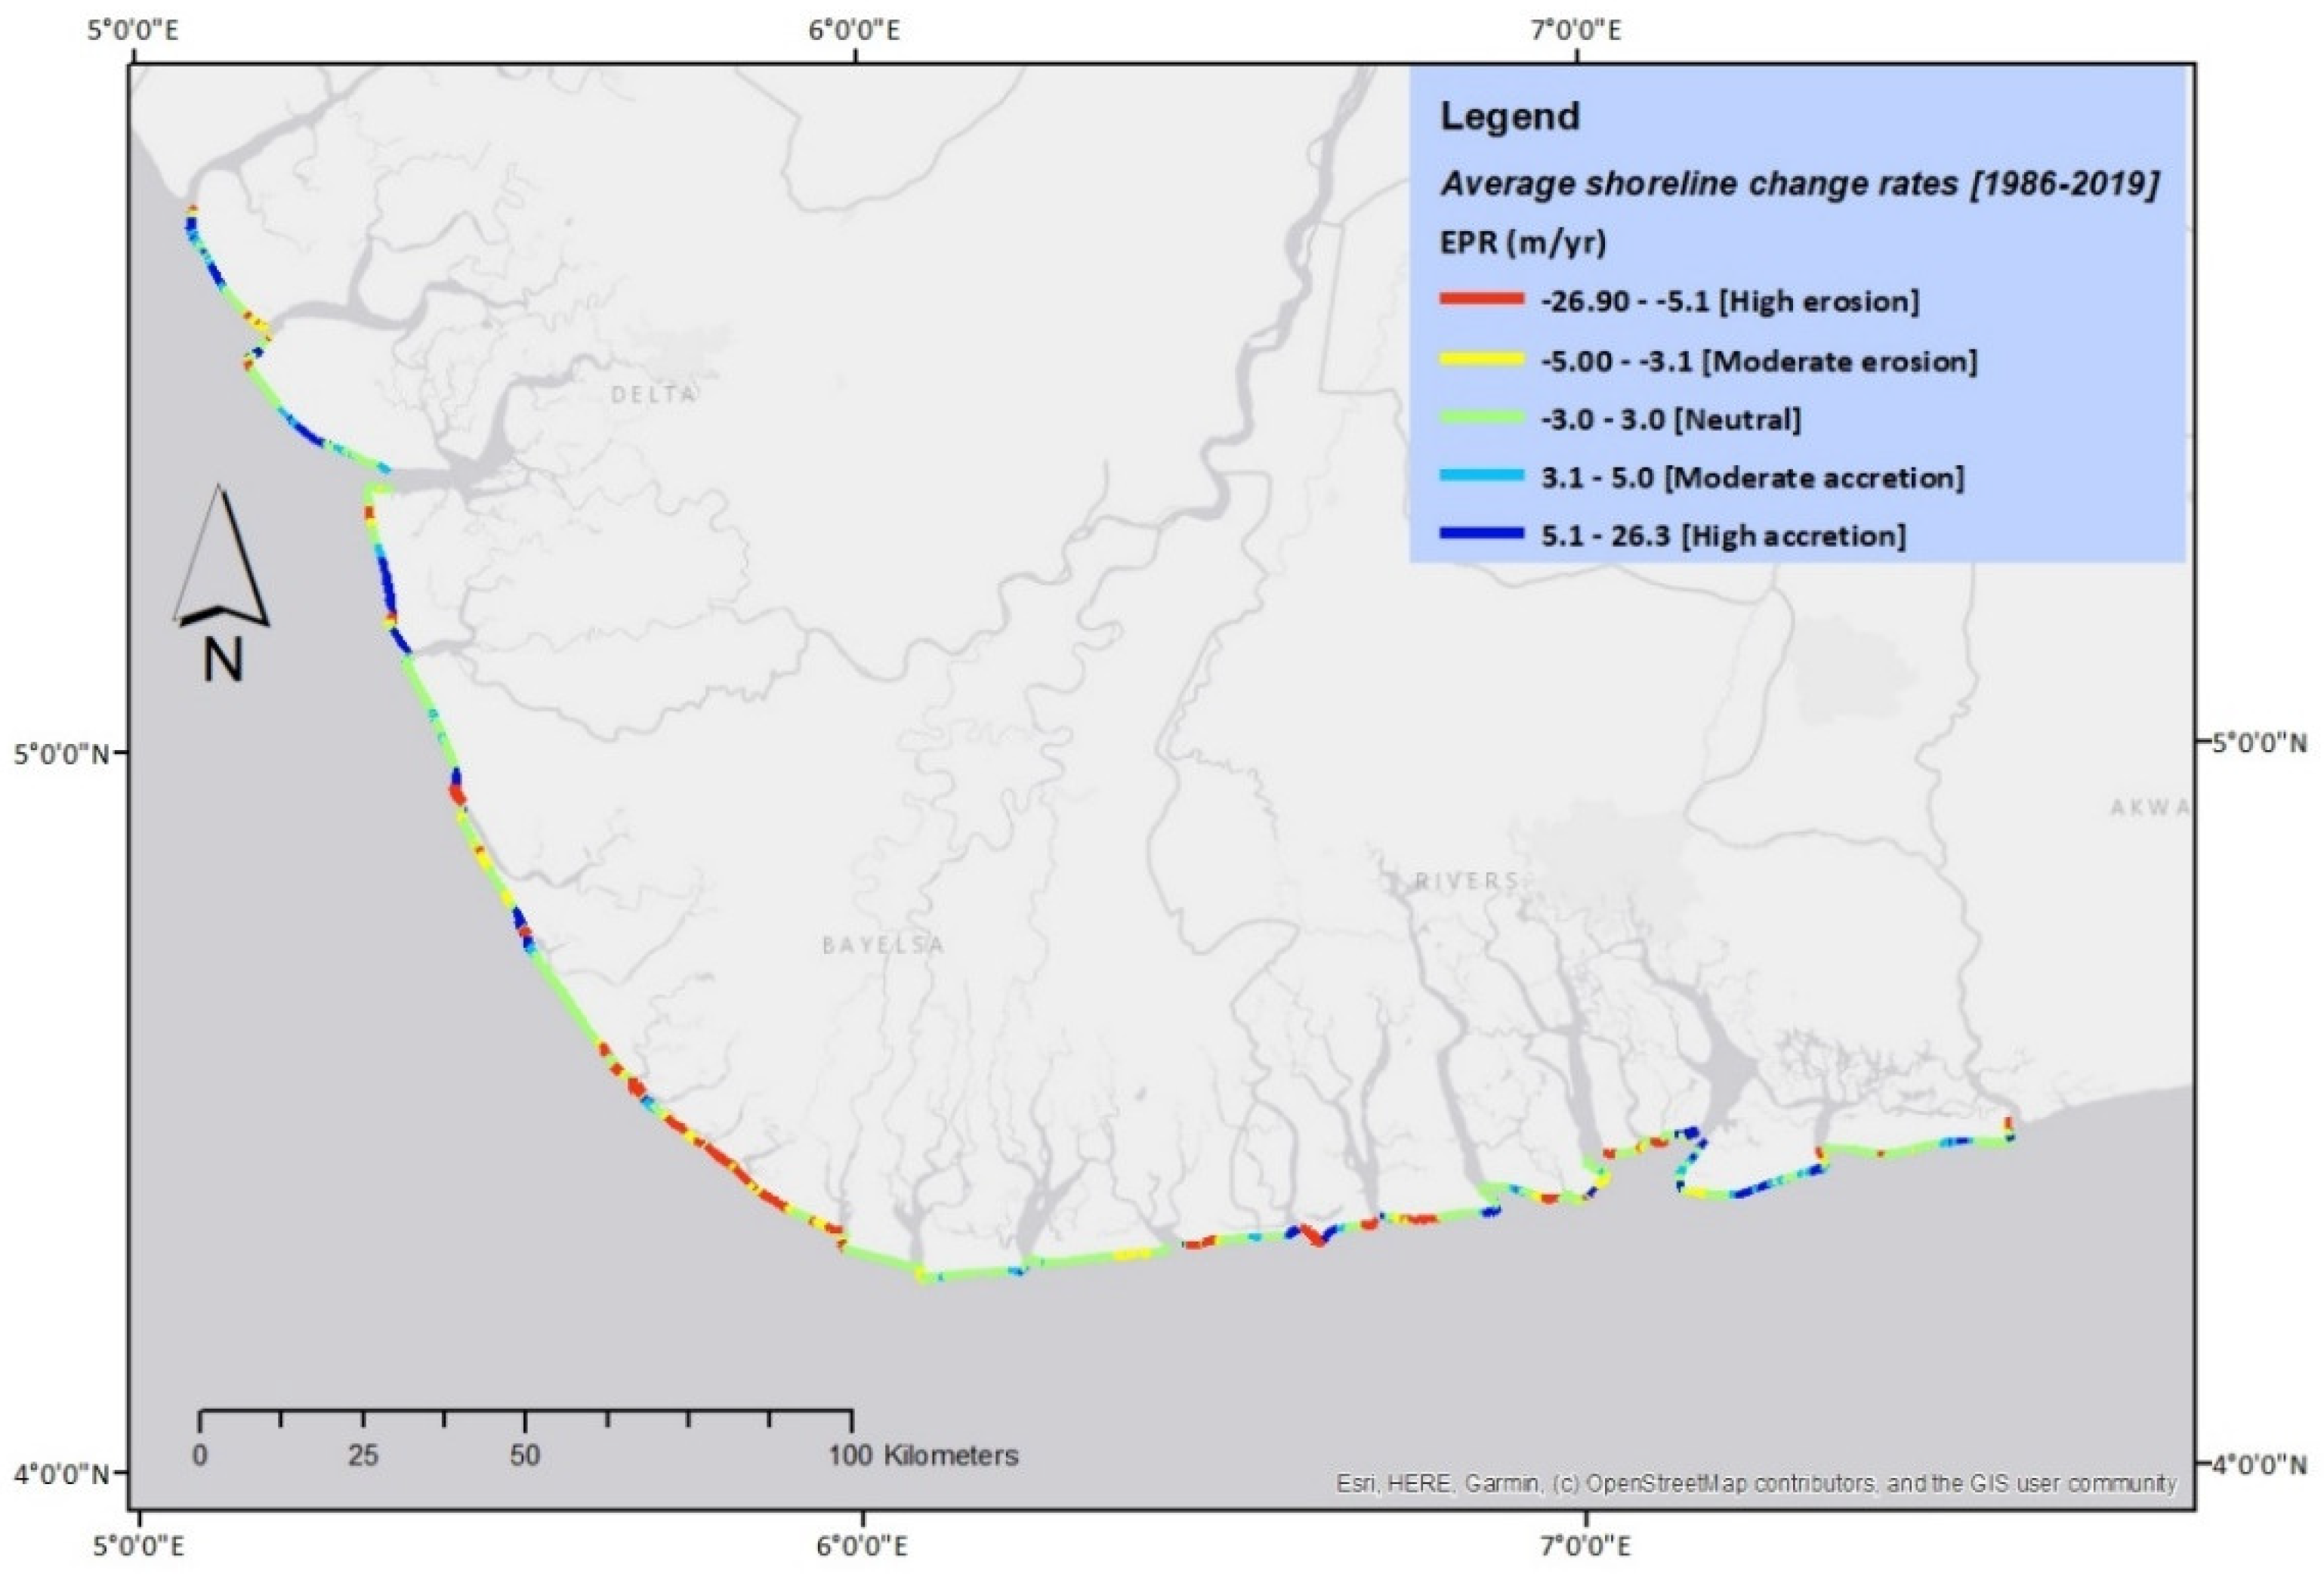
The analysis of the movement of the Niger delta shoreline over the 34-year period (1986–2019) of study revealed that the delta is characterised by distinct zones of erosion and accretion. Within the eroding parts of the delta, a maximum of 0.89 ± 0.10 km of shoreline recession was observed during the period, resulting in an annual maximum shoreline recession of 26 ± 3 m/year. Within the accreting zones, however, a maximum of 0.91 ± 0.10 km of shoreline progradation was recorded for the entire period, corresponding to an annual maximum shoreline accretion of 27 ± 3 m/year (Table 2). On the average, all the erosional transects (521 of 1035 transects with valid results were net erosional), had a mean of −3.9 ± 3 m/year while for the accretional transects (514, or 49.7% of the total transects) the mean accretion amounts to 4.0 ± 3 m/year. Overall, there is relative equality in both the landward (negative) and shoreward (positive) movements and a lack of an entrenched spatial pattern with zones of recession and accretion spatially intertwined (Figure 2). Nevertheless, our analysis revealed a zone of shoreline recession (i.e., an erosion hotspot), situated just west of the delta apex.
4.2. Interannual and Decadal Shoreline Changes
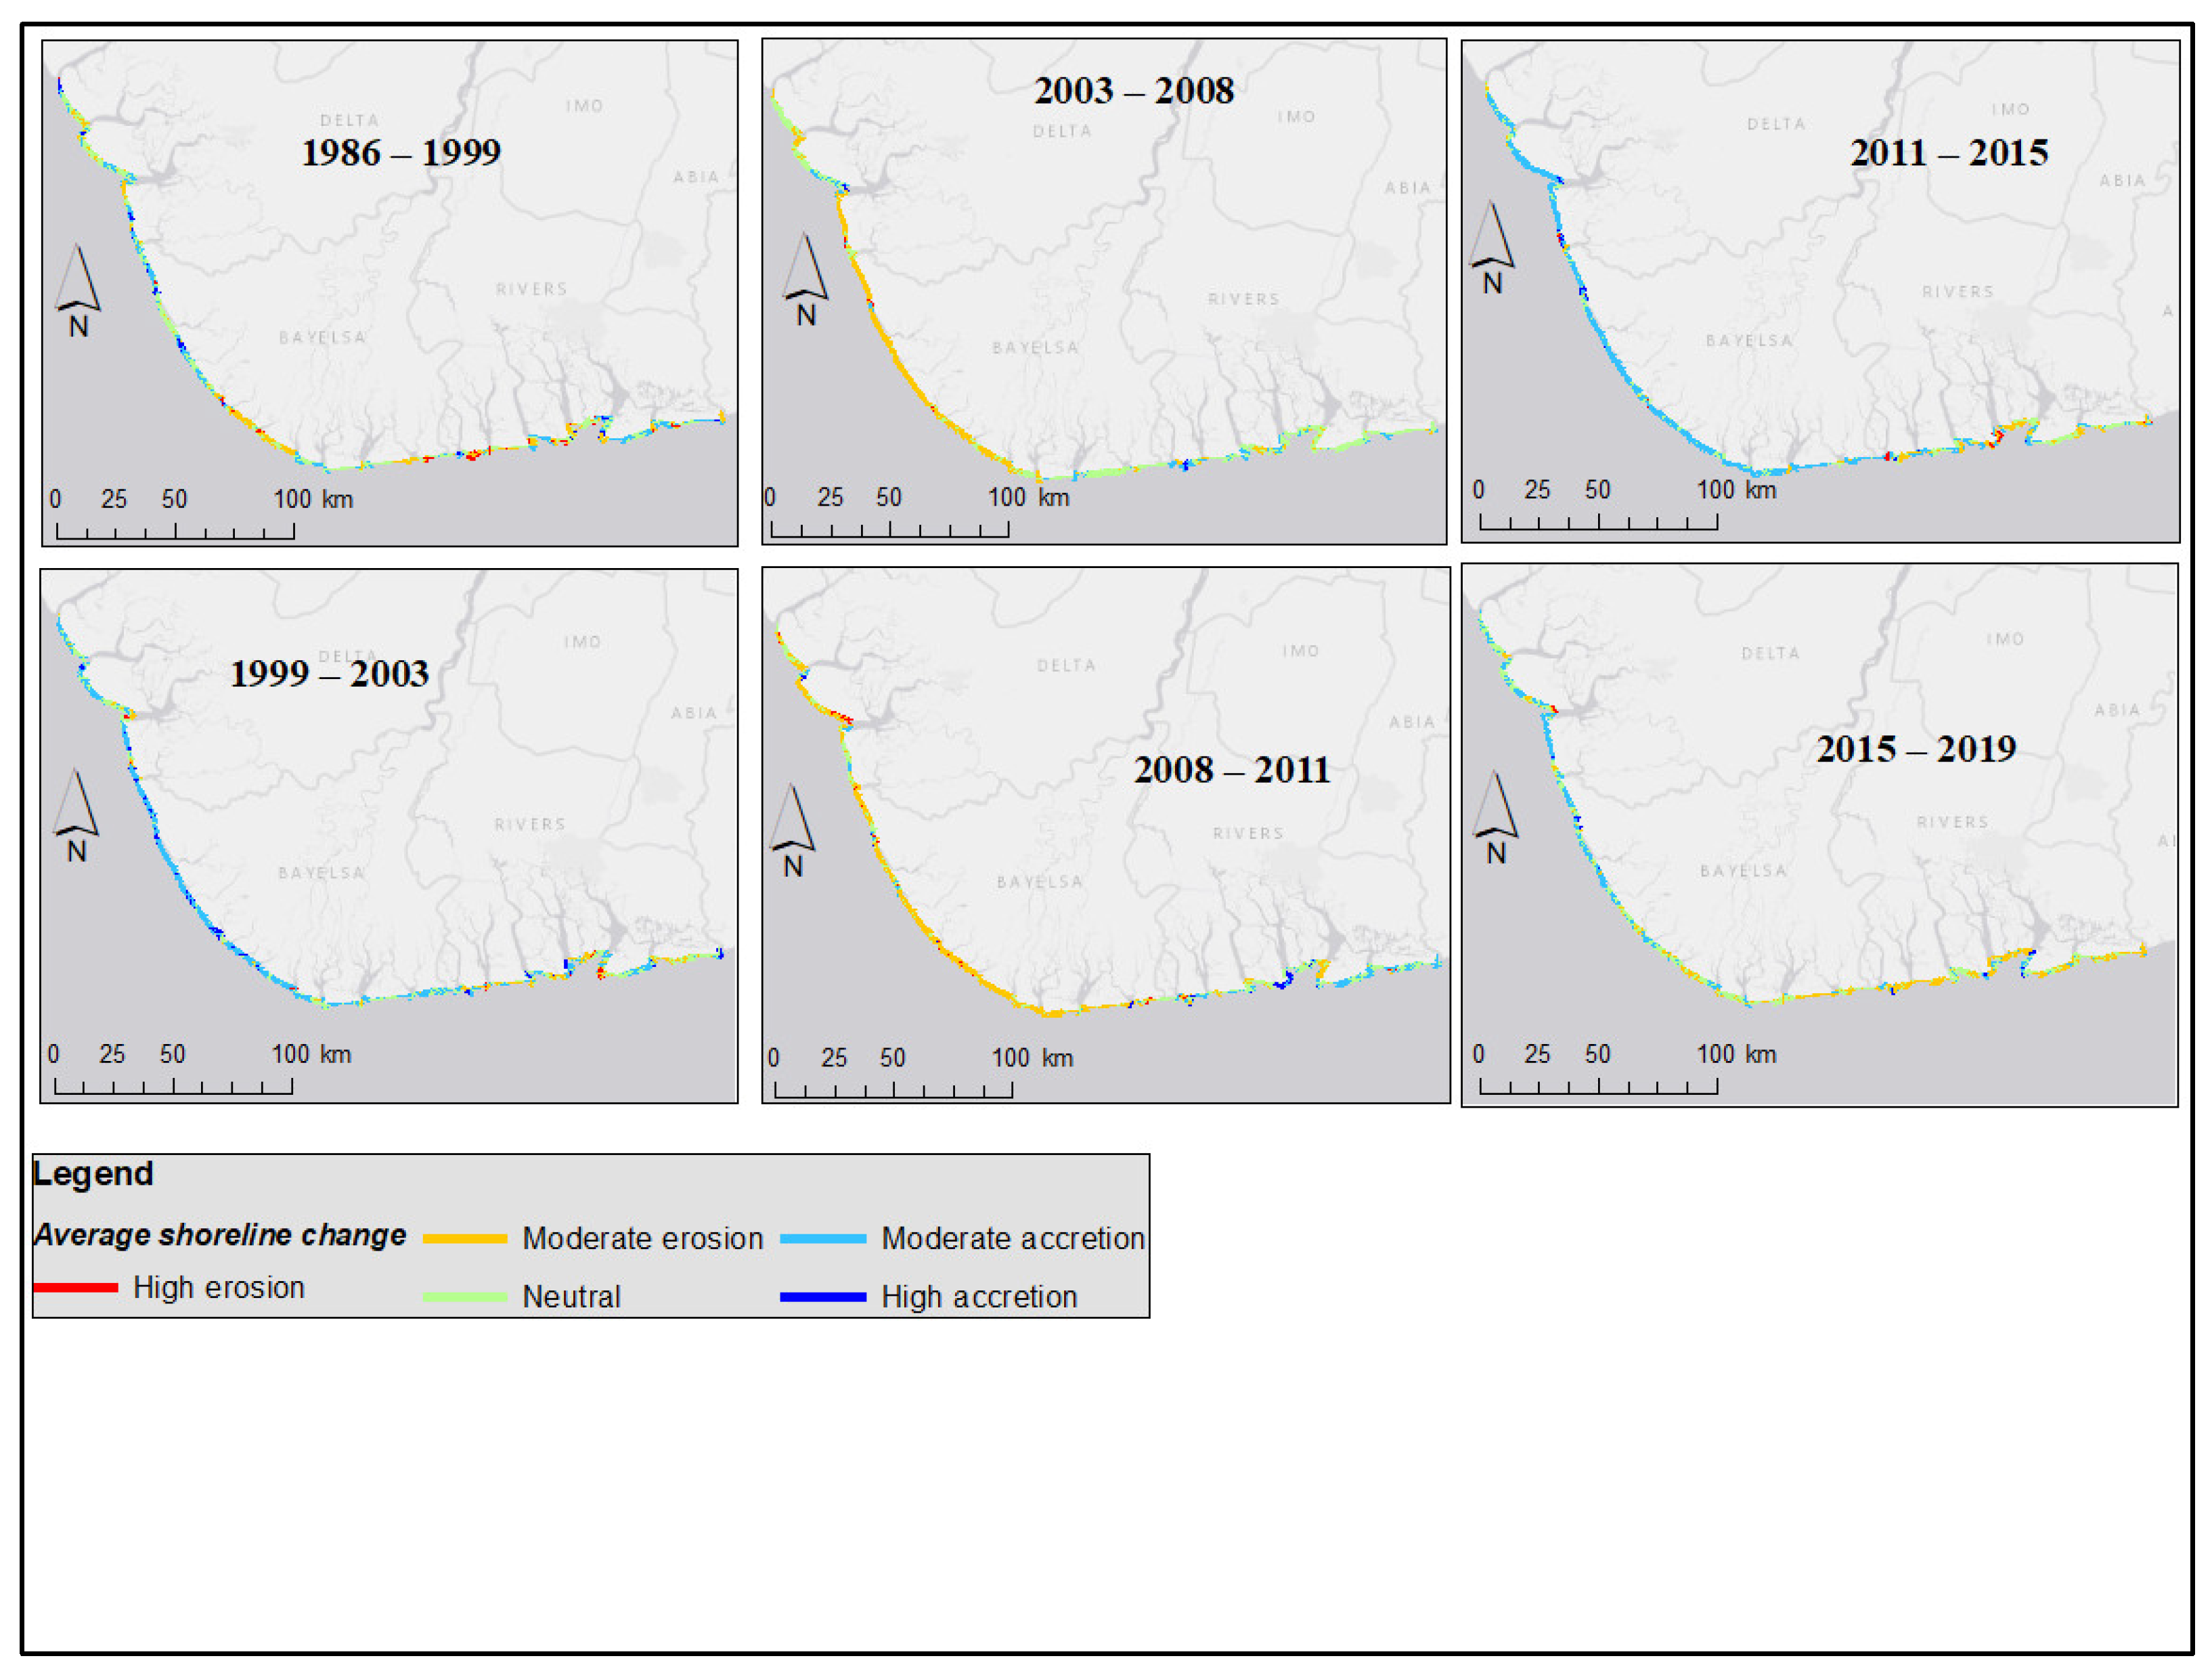
The shoreline dynamics during each of the epochs (Table 2) showed a complicated outlook, whereby erosional and accretive phases switch over time. The analysis indicated that accretion was slightly dominant during epoch 1 (1986–1999) at 54.2% of the transects while erosion was recorded at 45.8% of transects. Epoch 2 (1999–2003) is shown to be dominated by accretion, which is occurs at 73.7% of the transects, with only 26.3% of the transects erosional; a trend that was reversed during Epoch 3 (2003–2008), as demonstrated by 67.6% and 32.4% of eroding and accretive transects, respectively. The dominant phase of shoreline erosion is sustained during Epoch 4 (2008–2011) with 72.5% of the transects exhibiting erosion as against 27.5% of accretive transects. During Epoch 5 (2011–2015) the trend is reversed again as shoreline progradation was dominant along 75.2% of the transects, while shoreline recession was observed at 24.8% of the transects. Epoch 6 (2015–2019) however saw a slight reversal to an erosive phase, with 54.3% and 45.7% of erosional and accretional transects, respectively.
Further, a similar degree of complexity is also exhibited by the shoreline spatial pattern of erosion/accretion (Figure 3). The first epoch (1986–1999) appeared to model the result obtained for the entire study period (Figure 2) by having a random pattern of erosion and accretion on either side of an erosion hotspot section. Epochs 3 (2003–2008) and 4 (2008–2011), however, portrayed the western half of the delta to be more erosional than the eastern half. This outlook is reversed during Epoch 6 (2015–2019) as the western half was dominated by accretion while the eastern half was more erosional. Finally, Epochs 2 (1999–2003) and 5 (2011–2015) are analogous in the way shoreline accretion dominate all except some patches within the eastern side of the delta.
4.3. Delimitation of Alongshore Cells to Elucidate the Spatiotemporal Shoreline Dynamics
To gain a better appreciation of the spatial pattern of the delta shoreline dynamics, the alongshore transects were aggregated to form distinct coastline cells. Each coastline cell is made up of 100 alongshore transects and there are 11 distinct cells in all (Figure 1). Given that the division of the coastline into cells was based on a simple enumeration of the alongshore transects, individual cells may not form distinctive coastline morphological units. Rather, the exercise affords an opportunity to further investigate the inherent spatial pattern of the delta shoreline dynamics, as has been attempted elsewhere (e.g., [54,55]). We next highlight (Table 3) the key characteristics of the distinct coastline cells under three key headings: distributary outlets present, human land use, and physical characteristics.
Anthropogenic activities along delta coastlines tend to promote accelerated land subsidence, alter the fluvial and coastline hydrodynamics, and compromise the coastlines’ natural defence mechanisms (e.g., [18,59]). Specifically, human activities, such as extensive vegetation degradation, coastline engineering (e.g., sand replenishment, groynes, and revetments), location of oil and gas handling facilities, and the dredging of channel mouth sand bars to aid oil-related navigation, have been documented along the Niger delta coast (e.g., [45,57,60]).
Regarding the physical process dynamics, the vital role of the river mouths as the locus of delta coastline processes has been well acknowledged (e.g., [32,47,61]). Thus, the number of distributaries within each coastline cell and the volume of fluvial discharges through them are reckoned to be critical to the coastline dynamics. Additionally, coastline geometry could impact the angle of wave approach to the delta coastline, thereby inducing gradients in longshore sediment transport in distinct parts of a delta coastline (e.g., [62]). In the following section, we employed a simple mathematical approach to evaluate the dominant and most pervasive trend of shoreline movements within the distinct coastline cells.
4.4. The Concept of Temporal Mean-Removed Shoreline
We employed the temporal mean-removed shoreline as a mathematical approach to characterise the most entrenched pattern of shoreline change within the distinct coastline cells. The mean-removed shoreline was determined by computing the cumulative average shoreline change during the successive epoch periods at individual alongshore transects. The concept was originally employed by Hapke et al. [9] as an approach to reveal the persistent trends in shoreline dynamics over time. The authors computed a time series of historical shorelines whose overall mean was subtracted from each observed shoreline position, such that positive values within an epoch are indicative of seaward shoreline advance, while negative values indicate landward shoreline movement [9]. This method was adapted in the present study to, among others, highlight the overall mean position of the shoreline at individual alongshore transects, ascertain the pervasive trend of shoreline change, and highlight the magnitude of the shoreline movement during period of study. We derived the mean-removed shoreline (m − s) using the notation:
where si represents the average shoreline change rates (EPR: m/yr.) at each alongshore transect during the successive epoch period.
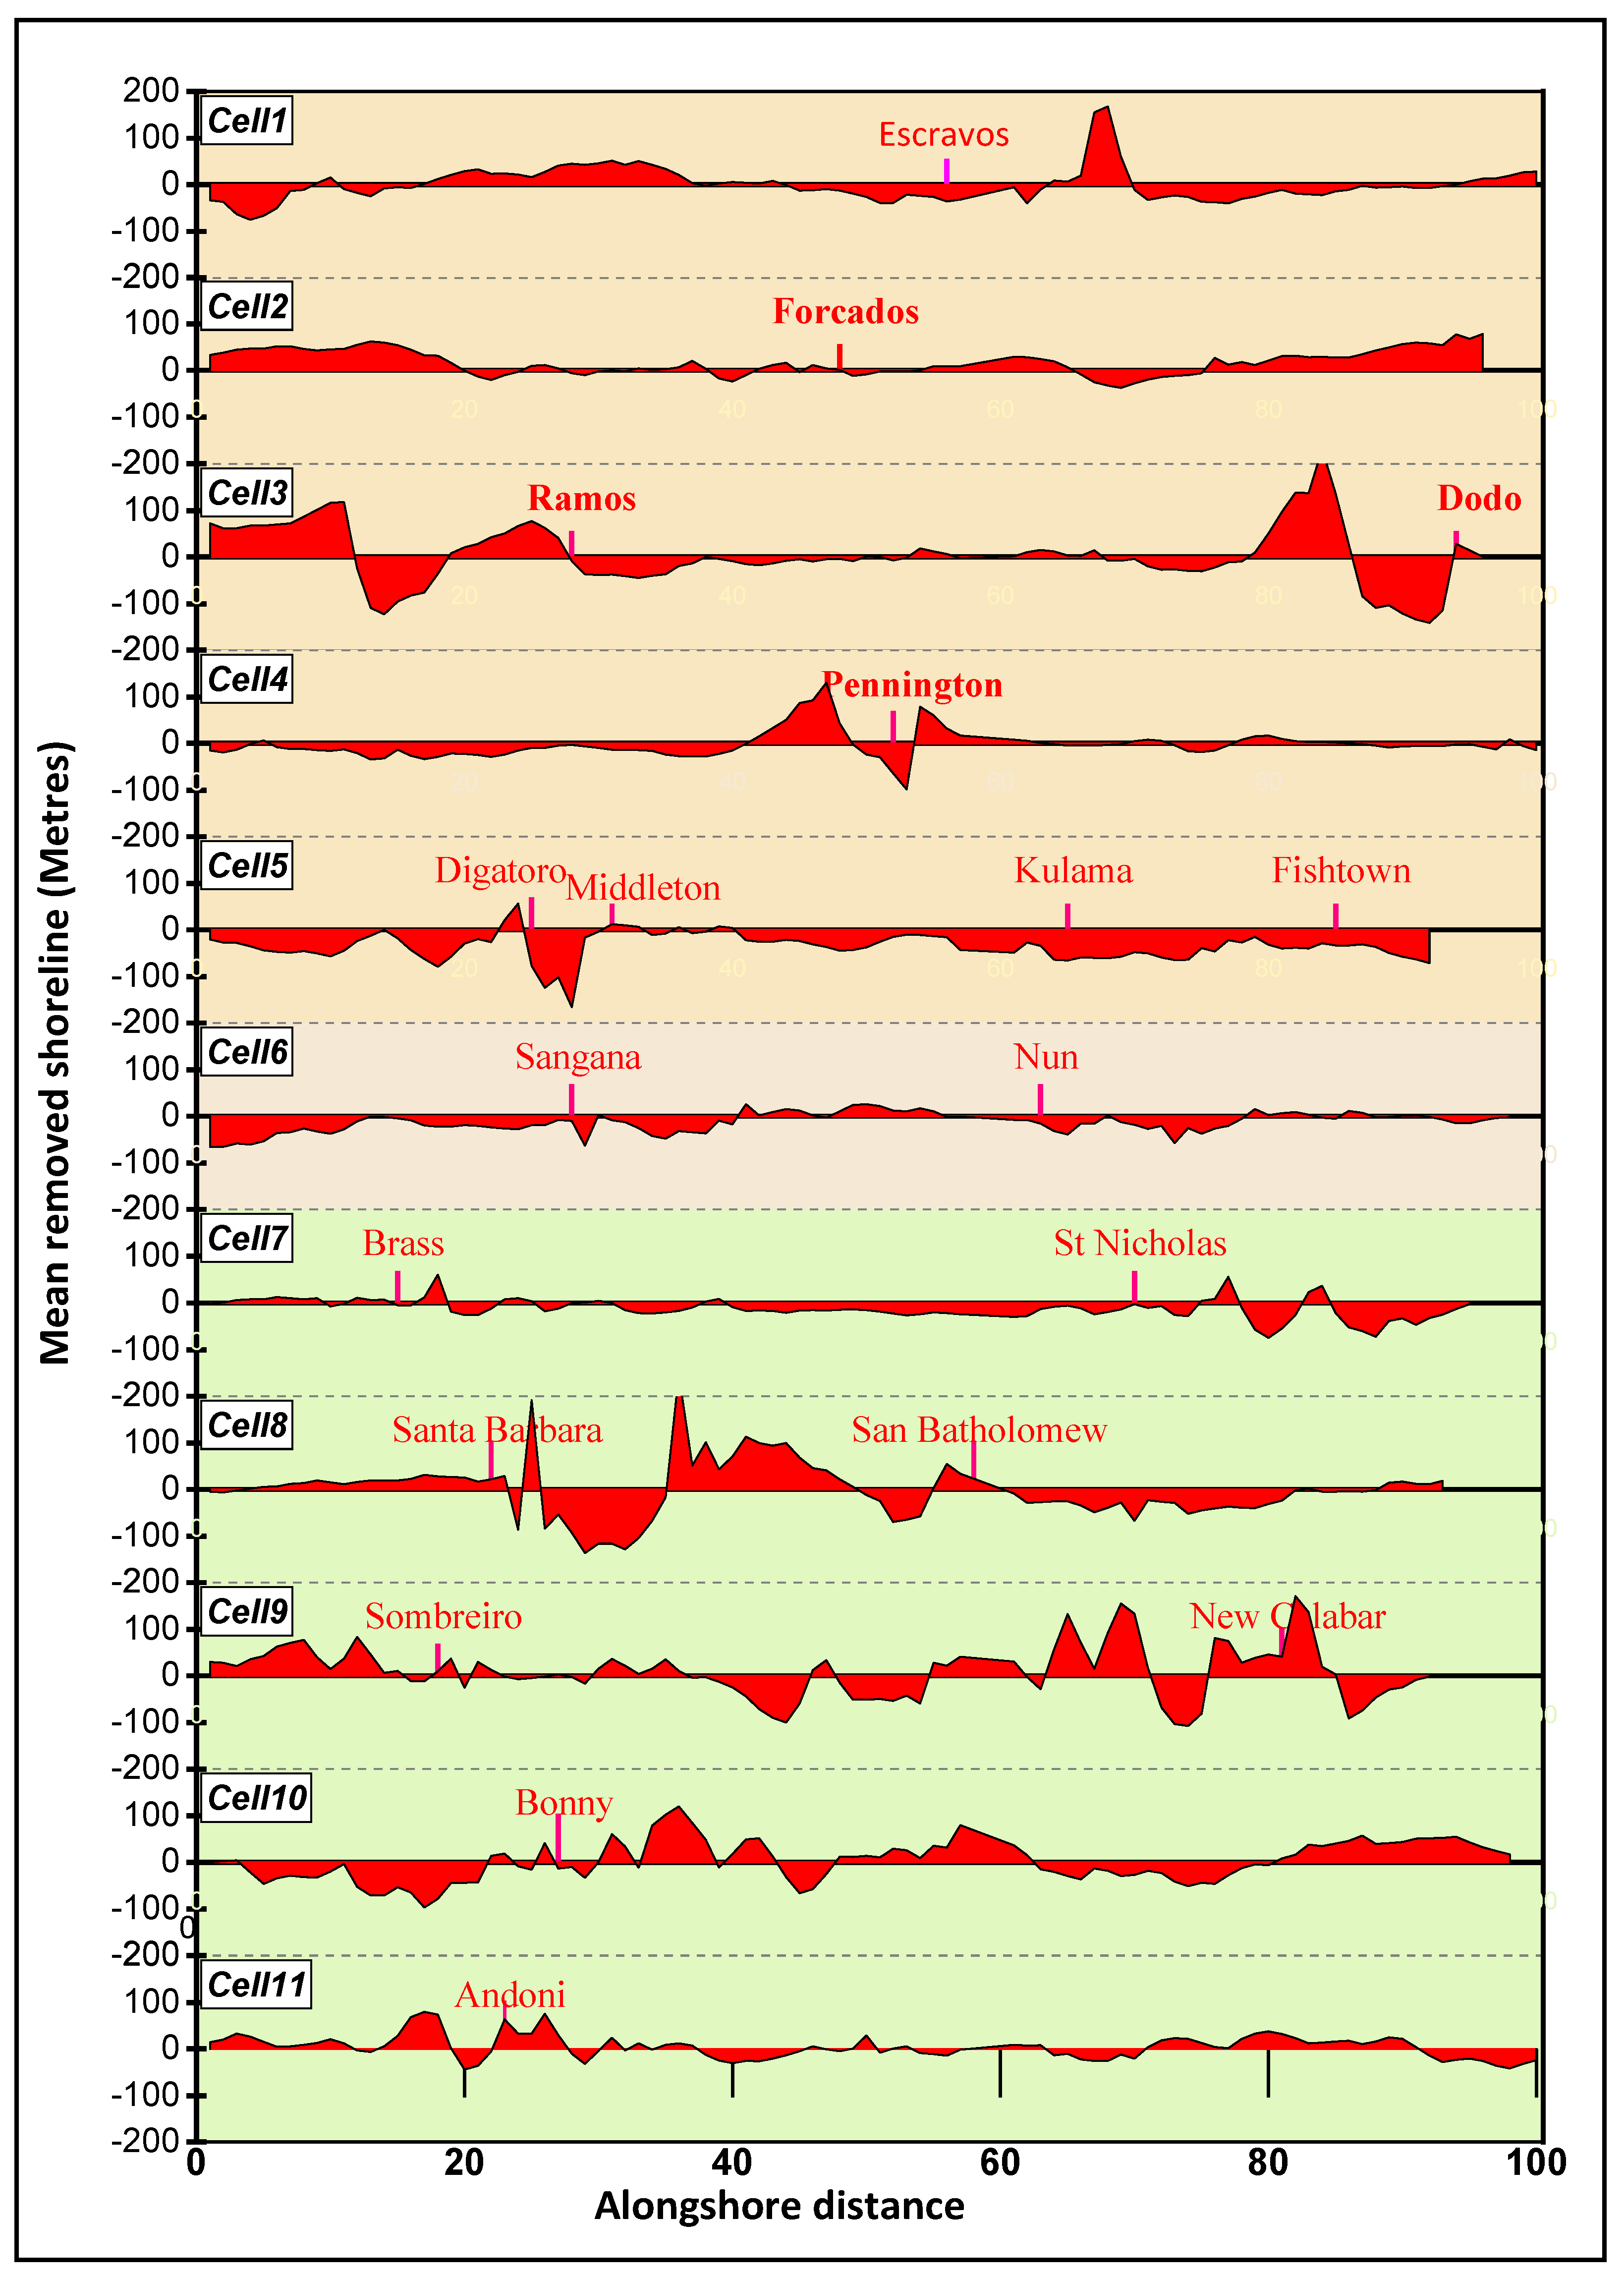
The delta shoreline change, as revealed in this analysis (Figure 4), established the spatially inhomogeneous nature of the shoreline movement along the Niger delta. Specifically, it can be observed that cells 5, 6, and 7 are dominantly erosional, though cell 5 experienced higher net erosional movement than cells 6 and 7, whose rates are modest. Cells 8, 9, and 3 are considered as locations of active shoreline migration, as they are characterised by relatively high net shoreline movement (both recession and accretion). Furthermore, coastline cells proximal to the longshore current divergence point (i.e., cells 6 and 7) are characterised by relatively low overall changes, whereas the coastline cells located distal from the divergence point in the delta flank areas, e.g., cells 8–9 (east) and cell 3 (west), are characteristically highly erosive or accretive.
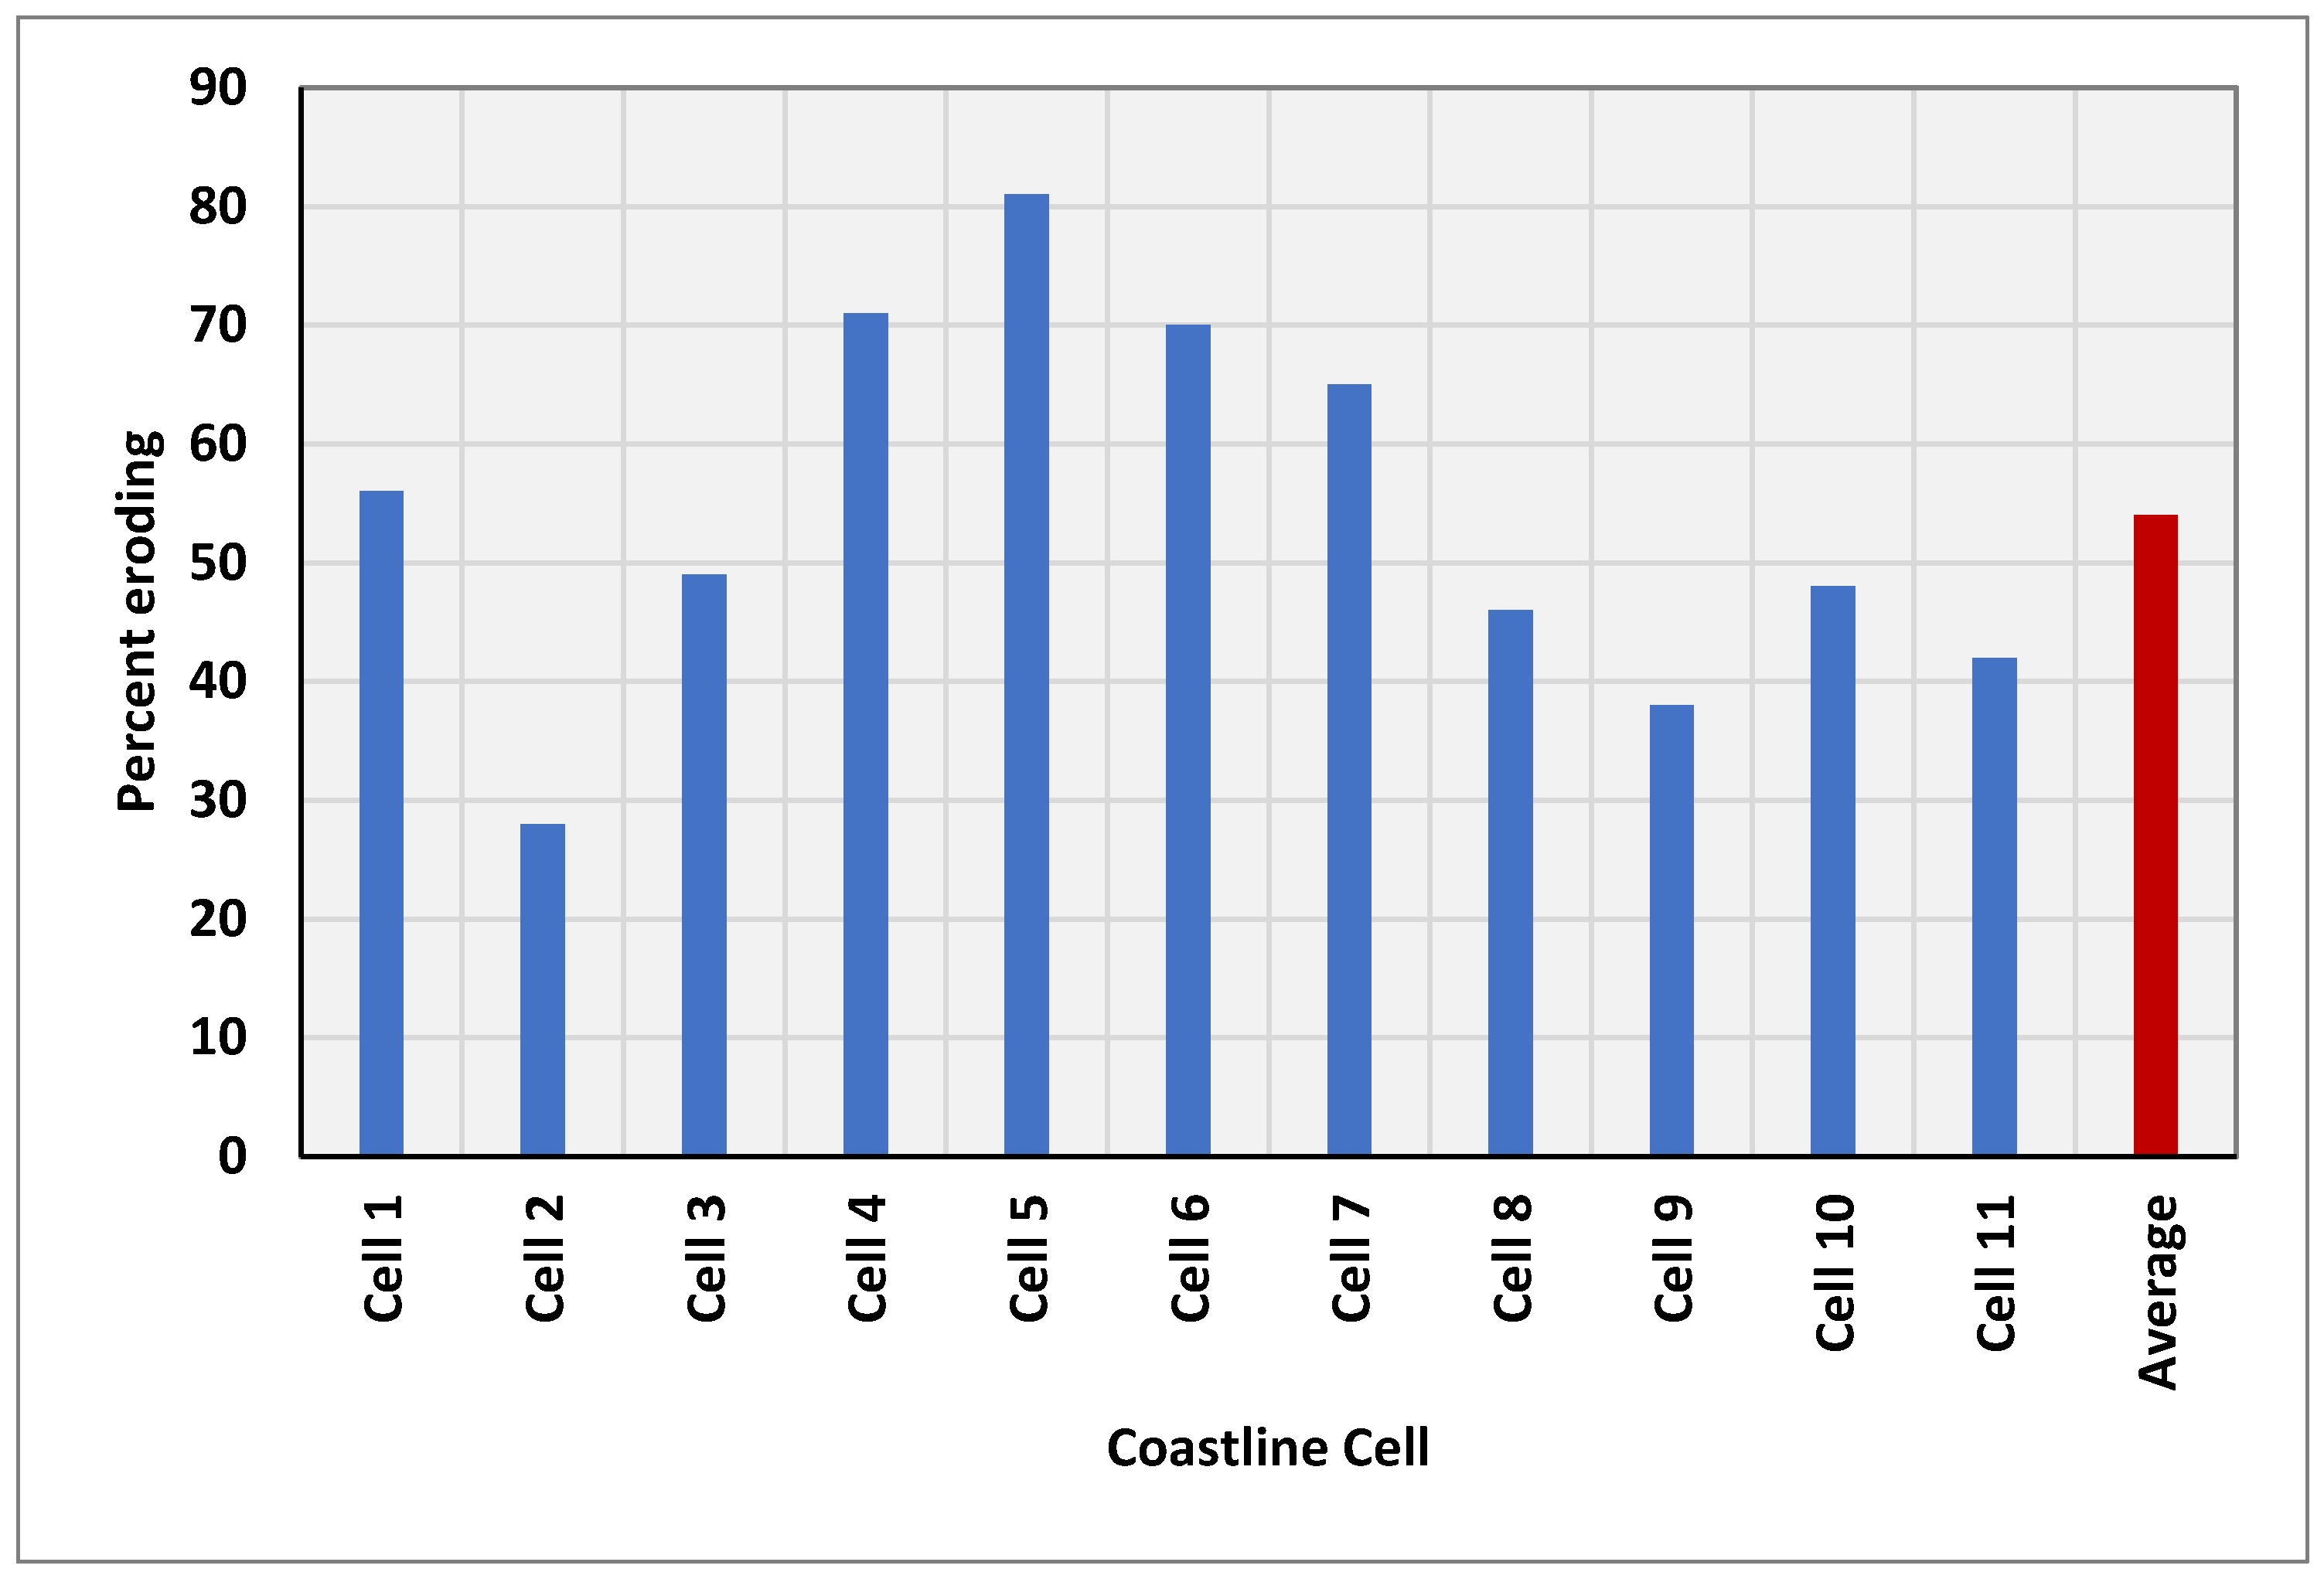
Overall, the analysis affirms the joint occurrence of both shoreline erosion and accretion along the Niger delta. In absolute terms, net shoreline progradation attains the highest rates (>200 m) during the period (Figure 4). However, in proportional terms, eroding shoreline transects, 54%, is greater than the accretive transects (Figure 5). Moreover, the central part of the delta has a higher ratio of eroding transects compared to the two flanks of the delta.
5. Discussion
The multidecadal shoreline trend of the Niger delta revealed a random shoreline movement slightly dominated by shoreline recession. Annual average in both erosion and accretion appear modest (both < 5 m) as are their corresponding maximum shoreline change rates (both < 30 m). The rates of shoreline movement reported in this study is slightly less than the reported rates from previous studies. For instance, Kuenzer et al. [32] reported maximum erosion (accretion) rates of −64.8 m/yr (59.8 m/yr) localised around the river mouths, which were deliberately excluded from the rates calculation in the present study to ensure a more realistic outcome. Similarly, historical annual rates of coastline erosion from isolated field measurements along the Niger delta included 18–24 m at Escravos, 16–22 m at Forcados, and 16–19 m at Brass [45]. Furthermore, shoreline migration along the delta during the past three decades did not initially suggest any obvious spatial pattern as would have been expected along a typical delta subject to varying influence of the underlying hydrodynamics and oceanographic processes. It was previously claimed that the section east of the main central delta river mouths has been dominated by shoreline retreat over time due to the reduction in fluvial discharge occasioned by the lack of connectivity with the main stem Niger River [35,36,37]. More recent reports however suggested that the western section has been dominated by shoreline recession [45,48]. Our analysis, while not showing any marked pattern of change, nevertheless revealed the presence of a dominant zone of erosion just west of the central delta river mouths (Figure 2).
The location of the erosion hotspot (Figure 2) seems to coincide with the point where the shoreline orientation changes from a west-east trend to a northwest-southeast trend. Wright and Coleman [6] claimed that coastline convexity tends to maximize wave erosive power, a factor likely to be critical in the entrenched shoreline recession within the coastline cell 5 (Figure 4). This suggestion is supported by the unusually high significant wave height (Hs > 2 m) previously reported between Sangana and Fishtown Rivers (i.e., between cells 5 and 6 [30,37]. Cells 5 and 6 also have a region of alongshore drift reversal, in which the regular northwest trending longshore drift occasionally changes into a southeast trend ([37], Figure 1). Such longshore drift reversal could potentially result in a net loss of sediment to the offshore environment, as has been inferred from a similar alongshore drift collision in the margin of the western Niger delta [63]. We also noted cell 5 as the coastline cell with the greatest number of delta distributaries (Table 3; Figure 6), which tend to intensify coastline processes [32].
The dominant temporal pattern of shoreline movement during the successive epoch periods oscillates between an initial period of greater shoreline accretion (1986–2003) to greater shoreline erosion (2003–2011), back to greater shoreline accretion (2011–2015), and finally to greater shoreline erosion (2015–2019). Kuenzer et al. [32] similarly report dominant accretion along the Niger delta between 1986/87–2002/03 but greater erosion between 2002/03–2013. Moreover, shoreline erosion during the period leading to 2011 was partly induced by Niger River dredging, while the shoreline accretion of the 2011–2015 may have been significantly propelled by the ‘great’ 2012 floods within the Niger River basin, according to Dada et al. [28].
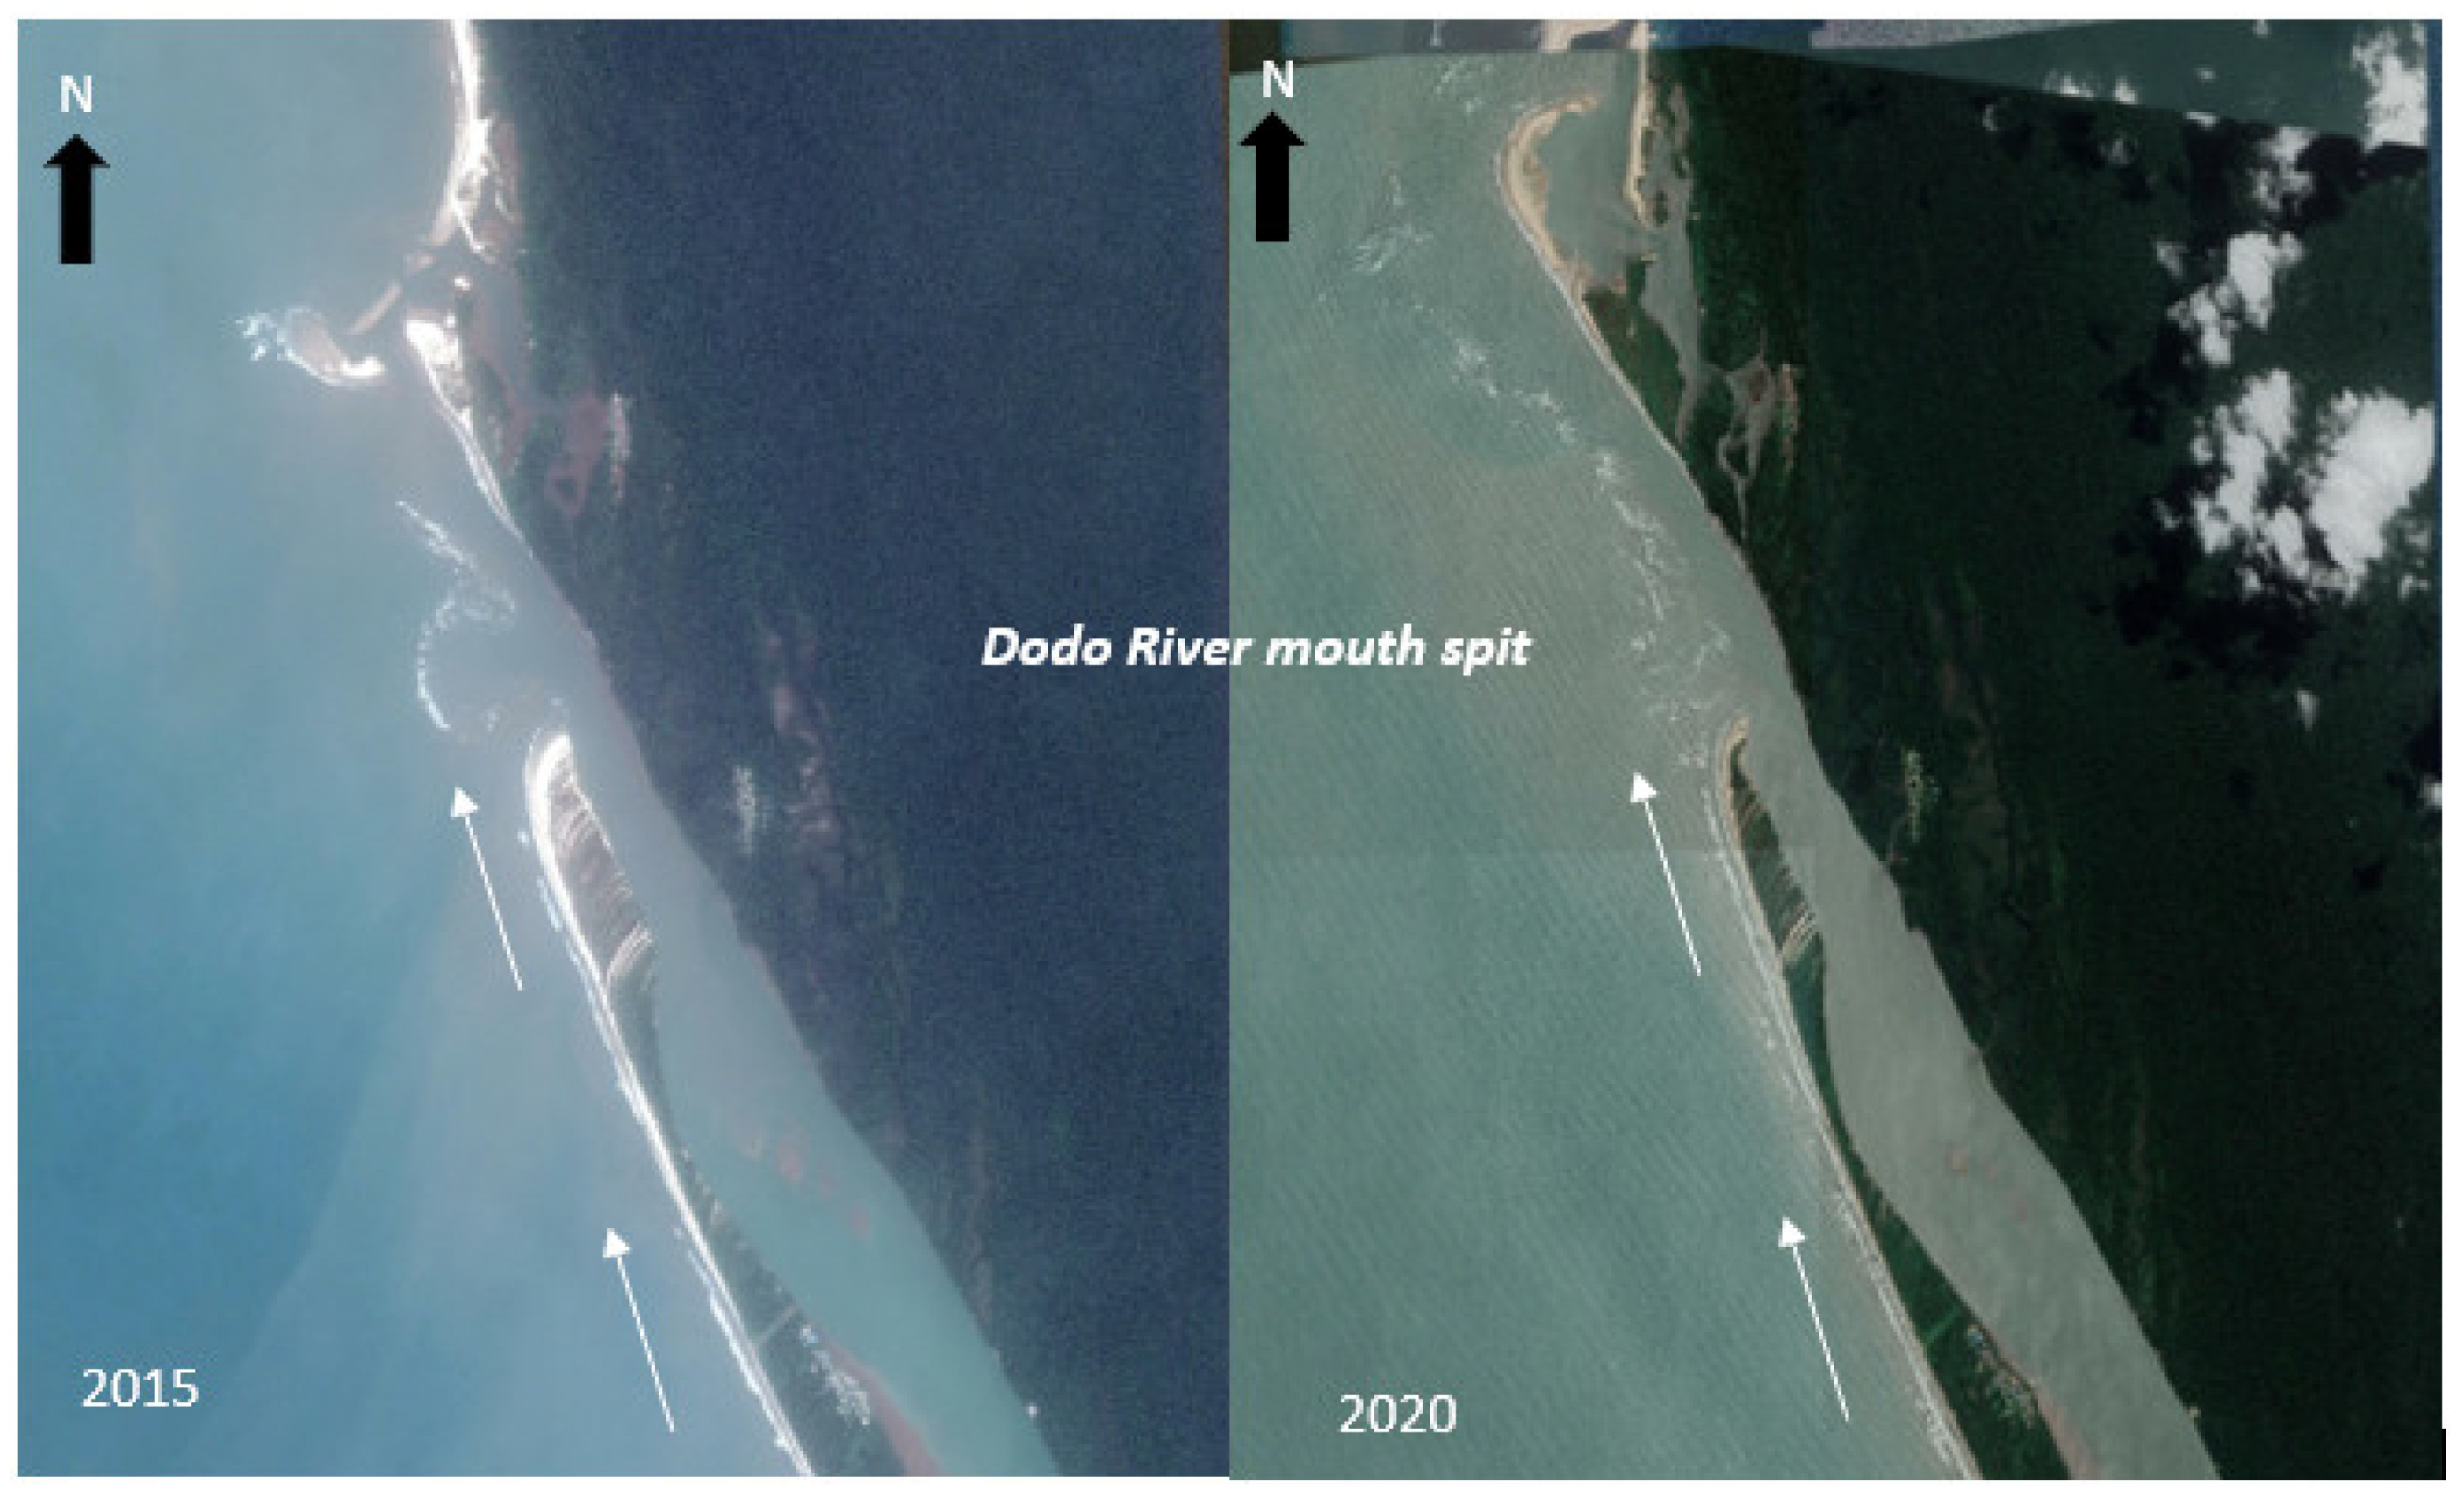
Further investigation has identified some spatial patterns of the shoreline change along the Niger delta, and we can infer that the observed patterns relate to the delta river mouths, wave energy intensity, and coastline geometry. The delta coastline behaviour showed that erosion has been slightly more prevalent across the whole delta coastline (Figure 5); the central section is dominated by erosion (Figure 4 and Figure 5); and net coastline movements within the distal parts of the delta are higher than within the proximal central delta locations. These findings may be related to the location of a longshore drift divergence point within the central delta where longshore sediment is being propagated eastwards and north-westwards towards the eastern and western delta margin, respectively. Shoreline change pattern may therefore be the result of additional sediment input into the delta coastline sediment budget at successive river outlets within the two distinct (western and eastern) alongshore drift cells [43,46,47]. We also observed an interesting coastline behaviour in cell 3 (Figure 4), whereby successive zones of shoreline accretion are immediately succeeded by zones of shoreline recession in a wave-like oscillation. A closer scrutiny of the shoreline behaviour suggests that the location of the erosive and accretive hotspots coincide with the locations of river mouths. For instance, the tip of the barrier spit at Dodo River (estimated from Google Earth to be ~14 km long) appears as being presently reworked by waves erosion, while the eroded materials seem to be accreting immediately downdrift of the river channel outlet, resulting in shoreline progradation and a new spit development there (Figure 7).
Ibe and Anita [45] have identified waves, tides, and fluvial agents as the key control of the Niger delta coastline dynamics. However, spatial process variation has long been established in the Niger delta literature, including the increasing tidal amplitude from west to east (e.g., [37,44]); more energetic waves in the western-to-central section relative to the eastern side (e.g., [37,45]); and greater fluvial discharges in the central part at the expense of the flank areas (e.g., [35,56]). Hence, an attempt was recently made to cast the Niger delta shoreline into discrete process environments [38] of fluvial (central) and tides/waves (western and eastern flanks). However, on a careful observation of the geometry of the delta river mouths, it does not appear that the delta has any section that is overly fluvially-dominated. In reality, the distinguishing feature seems to be the increased tidal input into incident wave energy in the flank areas (where the river mouths appear more funnel-shaped) relative to the central region, which demonstrate an overarching influence of wave action against fluvial input. Our analysis has shown that the flanks of the delta have a rather complex shoreline change pattern, while shoreline movement in the central delta area seems to be more uniform and conservative. It is thus curious to note that the coastline cells which are considered fluvially-dominated are shown to be more erosional than the less-fluvially dominated cells (Figure 5). Logically, such pattern of coastline behaviour seems more likely to result from the synergy between wave action and coastline geometry.
Finally, our analysis did not show a clear nexus between anthropogenic impact and delta shoreline dynamics since the coastline cells perceived to be under greater human occupation (Table 3) are not seen to be characterised by a distinctive and sustained shoreline change pattern (Figure 4). This may indicate that the Niger delta is presently minimally anthropogenically impacted. Although vegetation degradation [32,60], channel dredging [45], and sand mining [64] have been reported within the Niger delta lately, our study suggests that current influence of the human agency on the delta’s morphodynamics process remains moderate.
6. Conclusions
In this study, we have identified the most vulnerable section of the Niger delta to coastline recession to be related to the influence of coastline geometry on wave energy and the intense shoreline erosive process this engenders. By identifying the section of the delta coastline which provides added impetus to erosive wave processes, an opportunity is provided for coastline managers to focus on this segment in any planned delta coastline management scheme.
Our analysis of the net shoreline movement across the epochal periods has also provided further elucidation on the overall pattern of the delta’s coastline behaviour. Thus, the inherent shoreline change pattern within the alongshore cells are better characterised, while shoreline areas most liable to erosion are also clearly discriminated.
However, variability in the time intervals between the epoch periods, occasioned by satellite data availability, hardly justifies the integration of the epochal shoreline change data as presented in this study. Moreover, the use of vegetation line as a shoreline proxy, while often seen as an ideal indicator of interannual shoreline erosion, tends to show considerable time lag in detecting corresponding shoreline accretion [20]. In spite of the preceding, our study has yielded reasonable and useful findings on the inter-annual and decadal shoreline change pattern of the Niger delta.
Finally, our study aligns in principle with the common conceptual framework that the position of the shoreline within any coastline cell per time is a function of the difference between the volume of sediment moved into and out of that cell (e.g., [5,65]). Thus, we have seen that net shoreline movement rates tend to increase away from the centre of the delta towards the flanks, a scenario that suggests that gradients in alongshore sediment transport, occasioned by the introduction of fresh sediment input at intervening distributary outlets, are a critical factor.
This may be interpreted further to suggest that any impact resulting from anthropic sediment reduction from the Niger River basin will most likely begin at the central delta segment because: (i) alongshore sediment propagates away from this point, and (ii) a constant influx of riverine sediment is required to maintain a stable coastline within the section. This segment may thus be an area to focus more attention on in anticipation that the current anthropogenic impact on the Niger River may begin to manifest at the delta coastline in the near future.
Author Contributions
M.A. and S.D. designed the project. S.D. proposed the methodology. M.A. carried out the analysis of satellite images and coastline changes. S.D. supervised M.A. Both authors jointly wrote and/or reviewed the article. All authors have read and agreed to the published version of the manuscript.
Funding
This research received no external funding.
Acknowledgments
M.A. acknowledges the Petroleum Technology Development Fund (PTDF) of the Government of Nigeria for providing the funding for his PhD programme.
Conflicts of Interest
The authors declare no conflict of interest.
References
- Syvitski, J.P.M.; Saito, Y. Morphodynamics of deltas under the influence of humans. Glob. Planet. Chang. 2007, 57, 261–282. [Google Scholar] [CrossRef]
- Ericson, J.P.; Vörösmarty, C.J.; Dingman, S.L.; Ward, L.G.; Meybeck, M. Effective sea-level rise and deltas: Causes of Chang. and human dimension implications. Glob. Planet. Chang. 2006, 50, 63–82. [Google Scholar] [CrossRef]
- Tessler, Z.D.; Vörösmarty, C.J.; Grossberg, M.; Gladkova, I.; Aizenman, H.; Syvitski, J.P.M.; Foufoula-Georgiou, E. Profiling risk and sustainability in coastal deltas of the world. Science 2015, 349, 638–643. [Google Scholar] [CrossRef] [PubMed] [Green Version]
- Besset, M.; Anthony, E.J.; Bouchette, F. Multi-decadal variations in delta shorelines and their relationship to river sediment supply: An assessment and review. Earth-Sci. Rev. 2019, 193, 199–219. [Google Scholar] [CrossRef] [Green Version]
- Komar, P.D. Computer Models of Delta Growth due to Sediment Input from Rivers and Longshore Transport. GSA Bull. 1973, 84, 2217–2226. [Google Scholar] [CrossRef]
- Wright, L.D.; Coleman, J.M. Variations in morphology of major river deltas as functions of ocean wave and river discharge regimes. AAPG Bull. 1973, 57, 370–398. [Google Scholar]
- Galloway, W.D. Process framework for describing the morphologic and stratigraphic evolution of deltaic depositional systems. In Deltas, Models for Exploration; Houston Geological Society: Houston, TX, USA, 1975; pp. 86–98. [Google Scholar]
- Ruggiero, P.; Buijsman, M.; Kaminsky, G.M.; Gelfenbaum, G. Modeling the effects of wave climate and sediment supply variability on large-scale shoreline change. Mar. Geol. 2010, 273, 127–140. [Google Scholar] [CrossRef]
- Hapke, C.J.; Plant, N.G.; Henderson, R.E.; Schwab, W.C.; Nelson, T.R. Decoupling processes and scales of shoreline morphodynamics. Mar. Geol. 2016, 381, 42–53. [Google Scholar] [CrossRef] [Green Version]
- Vörösmarty, C.J.; Meybeck, M.; Fekete, B.; Sharma, K.; Green, P.; Syvitski, J.P.M. Anthropogenic sediment retention: Major global impact from registered river impoundments. Glob. Planet. Chang. 2003, 39, 169–190. [Google Scholar] [CrossRef]
- Walling, D.E.; Fang, D. Recent trends in the suspended sediment loads of the world’s rivers. Glob. Planet. Chang. 2003, 39, 111–126. [Google Scholar] [CrossRef]
- Syvitski, J.P.M.; Vörösmarty, C.J.; Kettner, A.J.; Green, P. Impact of Humans on the Flux of Terrestrial Sediment to the Global Coastal Ocean. Science 2005, 308, 376–380. [Google Scholar] [CrossRef] [PubMed]
- Syvitski, J.P.M.; Kettner, A.J.; Overeem, I.; Hutton, E.W.H.; Hannon, M.T.; Brakenridge, G.R.; Day, J.; Vörösmarty, C.; Saito, Y.; Giosan, L.; et al. Sinking Deltas Due to Human Activities. Nat. Geosci. 2009, 2, 681–686. [Google Scholar] [CrossRef]
- Dunn, F.E.; Darby, S.E.; Nicholls, R.J.; Cohen, S.; Zarfl, C.; Fekete, B.M. Projections of declining fluvial sediment delivery to major deltas worldwide in response to climate change and anthropogenic stress. Environ. Res. Lett. 2019, 14, 084034. [Google Scholar] [CrossRef]
- Nicholls, R.J.; Wong, P.P.; Burkett, V.R.; Codignotto, J.O.; Hay, J.E.; McLean, R.F.; Ragoonaden SWoodroffe, C.D. Coastal systems, and low-lying areas. In Climate Change 2007: Impacts, Adaptation and Vulnerability; Contribution of Working Group II to the Fourth Assessment Report of the Intergovernmental Panel on Climate Change; Parry, M.L., Canziani, O.F., Palutikof, J.P., van der Linden, P.J., Hanson, C.E., Eds.; Cambridge University Press: Cambridge, UK, 2007; pp. 315–356. [Google Scholar]
- Renaud, F.G.; Syvitski, J.P.M.; Sebesvari, Z.; Werners, S.E.; Kremer, H.; Kuenzer, C.; Ramesh, R.; Jeuken, A.D.; Friedrich, J. Tipping from the Holocene to the Anthropocene: How threatened are major world deltas? Curr. Opin. Environ. Sustain. 2013, 5, 644–654. [Google Scholar] [CrossRef] [Green Version]
- Kuenzer, C.; Heimhuber, V.; Huth, J.; Dech, S. Remote Sensing for the Quantification of Land Surface Dynamics in Large River Delta Regions—A Review. Remote Sens. 2019, 11, 1985. [Google Scholar] [CrossRef] [Green Version]
- Anthony, E.J.; Brunier, G.; Besset, M.; Goichot, M.; Dussouillez, P.; Nguyen, V.L. Linking rapid erosion of the Mekong River delta to human activities. Sci. Rep. 2015, 5, 14745. [Google Scholar] [CrossRef] [Green Version]
- Moore, L.J. Shoreline mapping techniques. J. Coast. Res. 2000, 16, 111–124. [Google Scholar]
- Boak, E.H.; Turner, I.L. Shoreline Definition and Detection: A Review. J. Coast. Res. 2005, 214, 688–703. [Google Scholar] [CrossRef] [Green Version]
- Gens, R. Remote sensing of coastlines: Detection, extraction and monitoring. Int. J. Remote Sens. 2010, 31, 1819–1836. [Google Scholar] [CrossRef]
- Frihy, O.E.; Debes, E.A.; El Sayed, W.R. Processes reshaping the Nile delta promontories of Egypt: Pre- and post-protection. Geomorphology 2003, 53, 263–279. [Google Scholar] [CrossRef]
- Jiménez, J.A.; Sánchez-Arcilla, A. Medium-term coastal response at the Ebro delta, Spain. Mar. Geol. 1993, 114, 105–118. [Google Scholar] [CrossRef]
- Bergillos, R.J.; López-Ruiz, A.; Ortega-Sánchez, M.; Masselink, G.; Losada, M.A. Implications of delta retreat on wave propagation and longshore sediment transport—Guadalfeo case study (southern Spain). Mar. Geol. 2016, 382, 1–16. [Google Scholar] [CrossRef]
- Anthony, E.; Almar, R.; Aagaard, T. Recent shoreline changes in the Volta River delta, West Africa: The roles of natural processes and human impacts. Afr. J. Aquat. Sci. 2016, 41, 81–87. [Google Scholar] [CrossRef]
- Besset, M.; Gratiot, N.; Anthony, E.J.; Bouchette, F.; Goichot, M.; Marchesiello, P. Mangroves and shoreline erosion in the Mekong River delta, Viet Nam. Estuar. Coast. Shelf Sci. 2019, 226, 106263. [Google Scholar] [CrossRef]
- Dada, O.A.; Qiao, L.; Ding, D.; Li, G.; Ma, Y.; Wang, L. Evolutionary trends of the Niger Delta shoreline during the last 100years: Responses to rainfall and river discharge. Mar. Geol. 2015, 367, 202–211. [Google Scholar] [CrossRef]
- Dada, O.A.; Li, G.; Qiao, L.; Asiwaju-Bello, Y.A.; Anifowose, A.Y.B. Recent Niger Delta shoreline response to Niger River hydrology: Conflict between forces of Nature and Humans. J. Afr. Earth Sci. 2018, 139, 222–231. [Google Scholar] [CrossRef]
- Dada, O.A.; Li, G.; Qiao, L.; Ma, Y.; Ding, D.; Xu, J.; Li, P.; Yang, J. Response of waves and coastline evolution to climate var-iability off the Niger Delta coast during the past 110 years. J. Mar. Syst. 2016, 160, 64–80. [Google Scholar] [CrossRef]
- Dada, O.A.; Adesina, R.; Agbaje, A. Seasonal wave climate on the Niger Delta Shoreline: Temporal variability and Implication. J. Earth Atmos. Res. 2018, 1, 98–110. [Google Scholar]
- Adegoke, O.; Fageja, J.; James, M.; Agbaje, G.G.; Ologunorisa, E.T. An Assessment of Recent Changes in the Niger Delta Coastline Using Satellite Imagery. J. Sustain. Dev. 2010, 3, 277–296. [Google Scholar] [CrossRef]
- Kuenzer, C.; van Beijma, S.; Gessner, U.; Dech, S. Land surface dynamics and environmental challenges of the Niger Delta, Africa: Remote sensing-based analyses spanning three decades (1986–2013). Appl. Geog. 2014, 53, 354–368. [Google Scholar] [CrossRef]
- Luijendijk, A.; Hagenaars, G.; Ranasinghe, R.; Baart, F.; Donchyts, G.; Aarninkhof, S. The State of the World’s Beaches. Sci. Rep. 2018, 8, 6641. [Google Scholar] [CrossRef]
- Abam, T.K.S. Impact of dams on the hydrology of the Niger Delta. Bull. Eng. Geol. Environ. 1999, 57, 239–251. [Google Scholar] [CrossRef]
- Abam, T.K.S. Modification of Niger Delta Physical Ecology: The Role of Dams and Reservoirs; IAHS-AISH: Wallingford, UK, 2001; Volume 266, pp. 19–30. [Google Scholar]
- Allen, J.R.L. Late Quaternary Niger Delta, and Adjacent Areas: Sedimentary Environments and Lithofacies. AAPG Bull. 1965, 49, 547–600. [Google Scholar] [CrossRef]
- Sexton, W.J.; Murday, M. The morphology and sediment character of the coastline of Nigeria—The Niger Delta. J. Coast. Res. 1994, 10, 959–977. [Google Scholar]
- George, C.F.; Macdonald, D.I.M.; Spagnolo, M. Deltaic sedimentary environments in the Niger Delta, Nigeria. J. Afr. Earth Sci. 2019, 160, 103592. [Google Scholar] [CrossRef]
- Edmonds, D.A.; Caldwell, R.L.; Brondizio, E.S.; Siani, S.M.O. Coastal flooding will disproportionately impact people on river deltas. Nat. Commun. 2020, 11, 4741. [Google Scholar] [CrossRef]
- Ibe, A.C. The Niger Delta and Sea-Level Rise; Springer: Dordrecht, The Netherlands, 1996; Volume 2, pp. 249–267. [Google Scholar] [CrossRef]
- Syvitski, J.P.M.; Cohen, S.; Kettner, A.J.; Brakenridge, G.R. How important and different are tropical rivers?—An overview. Geomorphology 2014, 227, 5–17. [Google Scholar] [CrossRef]
- Anthony, E.J.; Orford, J.D. Between Wave- and Tide-Dominated Coasts: The Middle Ground Revisited. J. Coast. Res. 2002, 36, 8–15. [Google Scholar] [CrossRef] [Green Version]
- Awosika, L.; Folorunsho, R.; Imovbore, V. Morphodynamics and features of littoral cell circulation observed from sequential aerial photographs and Davies drifter along a section of the strand coast East of the Niger Delta, Nigeria. J. Oceanogr. Mar. Sci. 2013, 4, 12–18. [Google Scholar] [CrossRef]
- Oomkens, E. Lithofacies relations in the Late Quaternary Niger Delta complex. Sedimentology 1974, 21, 195–222. [Google Scholar] [CrossRef]
- Ibe, A.C.; Antia, E.E. Preliminary Assessment of the Impact of Erosion along the Nigerian Shoreline; Technical Paper 13; Nigerian Institute for Oceanography and Marine Research: Lagos, Nigeria, 1983; p. 17. [Google Scholar]
- Coleman, J.M.; Huh, O.K. Major Deltas of the World: A Perspective from Space; Report Coastal Studies Institute, and Department of Oceanography and Coastal Sciences, Louisiana State University: Baton Rouge, LA, USA, 2004; Available online: http://www.geol.lsu.edu/WDD/PUBLICATIONS/C&Hnasa04/C&Hfinal04.htm (accessed on 25 August 2021).
- Anthony, E.J. Wave influence in the construction, shaping and destruction of river deltas: A review. Mar. Geol. 2015, 361, 53–78. [Google Scholar] [CrossRef]
- Hackney, C.; Darby, S.E.; Leyland, J. Modelling the response of soft cliffs to climate change: A statistical, process-response model using accumulated excess energy. Geomorphology 2013, 187, 108–121. [Google Scholar] [CrossRef]
- Hapke, C.J.; Reid, D. National Assessment of Shoreline Change, Part 4: Historical Coastal Cliff Retreat along the California Coast; Open-File Rep. 2007-1133; USGS: Reston, VA, USA, 2017; p. 56. [Google Scholar] [CrossRef] [Green Version]
- Dada, O.A.; Li, G.; Qiao, L.; Ding, D.; Ma, Y.; Xu, J. Seasonal shoreline behaviours along the arcuate Niger Delta coast: Complex interaction between fluvial and marine processes. Cont. Shelf Res. 2016, 122, 51–67. [Google Scholar] [CrossRef]
- Anders, F.J.; Byrnes, M.R. Accuracy of Shoreline Change Rates as Determined from Maps and Aerial Photographs. Shore Beach 1991, 59, 309–318. [Google Scholar]
- Thieler, E.R.; Danforth, W.W. Historical shoreline mapping (II): Application of the Digital Shoreline Mapping and Analysis Systems (DSMS/DSAS) to shoreline change mapping in Puerto Rico. J. Coast. Res. 1994, 10, 600–620. [Google Scholar]
- Himmelstoss, E.A.; Henderson, R.E.; Kratzmann, M.G.; Farris, A.S. Digital Shoreline Analysis System (DSAS) Version 5.0 User Guide. Open-File Rep. 2018, 1179, 126. [Google Scholar]
- Maiti, S.; Bhattacharya, A.K. Shoreline change analysis and its application to prediction: A remote sensing and statistics-based approach. Mar. Geol. 2009, 257, 11–23. [Google Scholar] [CrossRef]
- Deepika, B.; Avinash, K.; Jayappa, K.S. Shoreline change rate estimation and its forecast: Remote sensing, geographical information system and statistics-based approach. Int. J. Environ. Sci. Technol. 2013, 11, 395–416. [Google Scholar] [CrossRef] [Green Version]
- Tejedor, A.; Longjas, A.; Zaliapin, I.; Foufoula-Georgiou, E. Delta channel networks: A graph-theoretic approach for studying connectivity and steady state transport on deltaic surfaces. Water Resour. Res. 2015, 51, 3998–4018. [Google Scholar] [CrossRef]
- Oyegun, C.U. Land degradation and the coastal environment of Nigeria. CATENA 1993, 20, 215–225. [Google Scholar] [CrossRef]
- Folorunsho, R.; Awosika, L. Morphological Characteristics of the Bonny and Cross River (Calabar) Estuaries in Nigeria: Implications for Navigation and Environmental Hazards; Springer: Cham, Switzerland, 2014; pp. 87–96. [Google Scholar]
- Brown, S.; Nicholls, R.J. Subsidence, and human influences in mega deltas: The case of the Ganges-Brahmaputra-Meghna. Sci. Total Environ. 2015, 527–528, 362–374. [Google Scholar] [CrossRef] [PubMed] [Green Version]
- Numbere, A.O. Impact of Invasive Nypa Palm (Nypa Fruticans) on Mangroves in Coastal Areas of the Niger Delta Region, Nigeria. In Impacts of Invasive Species on Coastal Environments; Springer: Cham, Switzerland, 2018; Volume 29, pp. 425–454. [Google Scholar] [CrossRef]
- Wright, L.D. Sediment transport and deposition at river mouths: A synthesis. Geol. Soc. Am. Bull. 1977, 6, 857–868. [Google Scholar] [CrossRef]
- Ashton, A.D.; Murray, A.B. High-angle wave instability and emergent shoreline shapes: Modeling of sand waves, flying spits, and capes. J. Geophys. Res. Earth Surf. 2006, 111, F04011. [Google Scholar] [CrossRef] [Green Version]
- Burke, K. Longshore Drift, Submarine Canyons, and Submarine Fans in Development of Niger Delta. AAPG Bull. 1972, 56, 1975–1983. [Google Scholar] [CrossRef]
- Abam, T.K.S.; Oba, T. Recent case studies of sand mining, utilisation, and environmental impacts in the Niger delta. J. Environ. Geol. 2018, 2, 64–67. [Google Scholar]
- Boateng, I.; Bray, M.; Hooke, J. Estimating the fluvial sediment input to the coastal sediment budget: A case study of Ghana. Geomorphology 2012, 138, 100–110. [Google Scholar] [CrossRef]
Figure 1.
The geographical setting of the study. Arrows indicate the directions of the longshore currents along the delta coastline. The main delta rivers are shown in print while the minor rivers are numbered. The extent of the alongshore coastline cells are also demarcated.
Figure 1.
The geographical setting of the study. Arrows indicate the directions of the longshore currents along the delta coastline. The main delta rivers are shown in print while the minor rivers are numbered. The extent of the alongshore coastline cells are also demarcated.

Figure 2.
Average rates of shoreline movement along the Niger delta during 1986–2019. Note the erosion hotspot situated to the west of the apex of the delta as well as how the flanks exhibit both areas of shoreline erosion and accretion.
Figure 2.
Average rates of shoreline movement along the Niger delta during 1986–2019. Note the erosion hotspot situated to the west of the apex of the delta as well as how the flanks exhibit both areas of shoreline erosion and accretion.

Figure 3.
Temporal variations in shoreline change rates of the Niger delta.

Figure 4.
Temporal mean-removed shoreline within the successive coastline cells along the Niger delta and the locations of delta distributaries. Tonal contrasts indicate—from north to south—the western, apex, and eastern delta coastline cells. Note that in the western half, the longshore currents trend from cell 6 towards cell 1, while the trend is from cell 6 towards cell 11 in the eastern Niger half (see Figure 1).

Figure 5.
The percentage of eroding transects across the coastline cells of the Niger delta computed from the mean-removed shorelines. The centrally located coastline cells (cells 4–7) contain a higher number of eroding transects than the coastline cells on the opposing delta flanks.
Figure 5.
The percentage of eroding transects across the coastline cells of the Niger delta computed from the mean-removed shorelines. The centrally located coastline cells (cells 4–7) contain a higher number of eroding transects than the coastline cells on the opposing delta flanks.

Figure 6.
Cell 5 which has four river mouths marked by characteristic river mouth accretion and barrier spits. The cell is the site of the observed erosion hotspot along the Niger delta. [2016 Landsat images courtesy Google Earth].
Figure 6.
Cell 5 which has four river mouths marked by characteristic river mouth accretion and barrier spits. The cell is the site of the observed erosion hotspot along the Niger delta. [2016 Landsat images courtesy Google Earth].

Figure 7.
Coastline dynamics around the Dodo River mouth spit as observed in the satellite images of 2015 (left) and 2020 (right). Longshore drift trend is indicated by the white arrows. [Landsat images courtesy Google Earth].
Figure 7.
Coastline dynamics around the Dodo River mouth spit as observed in the satellite images of 2015 (left) and 2020 (right). Longshore drift trend is indicated by the white arrows. [Landsat images courtesy Google Earth].


Table 1.
Estimated positional uncertainties for the satellite data of the five shoreline epochs [48,49].
| Measurement Uncertainties | Shoreline Dates | ||||||
|---|---|---|---|---|---|---|---|
| 1986 | 1999 | 2003 | 2008 | 2011 | 2015 | 2019 | |
| Image resolution Er (m) | 30 | 30 | 30 | 30 | 30 | 20 | 20 |
| Georeferencing error Eg (m) | 28.1 | 15.7 | 18.6 | 14.9 | 22.6 | 12.8 | 12.6 |
| Digitizing Ed (m) | 1.0 | 1.0 | 1.0 | 1.0 | 1.0 | 1.0 | 1.0 |
| Total positional uncertainty Ep (m) | 41.1 | 33.9 | 35.1 | 33.5 | 37.6 | 23.8 | 23.7 |
| Annualized uncertainty rate Ea (m) | ~3.0 | ||||||
Table 2.
Average shoreline movement (EPR) statistics over the entire 34-year study period (All), and for each of the six epoch periods (Epoch 1–Epoch 6). Period describes the interval between the start and end dates; Uncy (m/yr.) represents the positional error or uncertainty; Mean (m/yr.), Max (m/yr.), and Percent eroding represent the mean, maximum erosion or accretion, and percentage of erosional transects.
| Epoch | Period | Uncy (m/yr.) | Erosion | Accretion | Percent Eroding | Remark | ||
|---|---|---|---|---|---|---|---|---|
| Mean (m/yr.) | Max (m/yr.) | Mean (m/yr.) | Max (m/yr.) | % | ||||
| All | 1986–2019 | 2.7 | −3.9 | −26.3 | 4.0 | 26.8 | 50.3 | Even change |
| Epoch 1 | 1986–1999 | 4.1 | −6.2 | −72.0 | 7.2 | 60.6 | 45.8 | Slightly accretive |
| Epoch 2 | 1999–2003 | 12.2 | −9.2 | −62.4 | 15.2 | 215.9 | 26.3 | Dominantly accretive |
| Epoch 3 | 2003–2008 | 9.7 | −22.4 | −130.1 | 12.1 | 148.7 | 67.6 | Dominantly erosional |
| Epoch 4 | 2008–2011 | 16.8 | −27.6 | −104.7 | 28.3 | 223.1 | 72.5 | Dominantly erosional |
| Epoch 5 | 2011–2015 | 11.1 | −22.9 | −142.4 | 22.1 | 205.1 | 24.8 | Dominantly accretive |
| Epoch 6 | 2015–2019 | 8.4 | −12.4 | −60.0 | 15.3 | 157.2 | 54.3 | Slightly erosional |
Table 3.
An annotative description of the distinct delta coastline cells. Numbers in parentheses indicate the position of the river mouths in (Figure 1). Key: √ (YES); X (NO); GE: Google Earth.
Table 3.
An annotative description of the distinct delta coastline cells. Numbers in parentheses indicate the position of the river mouths in (Figure 1). Key: √ (YES); X (NO); GE: Google Earth.
| Cell | Distributaries | Human Land Use | Physical Characteristics | References | |||
|---|---|---|---|---|---|---|---|
| Name(s) | main | minor | settlement | Oil & gas | |||
| 1 | Escravos (2) | √ | √ | √ |
| [35,56] GE | |
| 2 | Forcados | √ | √ | √ |
| [34,35,45,57] | |
| 3 | Ramos | √ | X | X |
| ||
| 4 | Dodo (5), Pennington (6) | √ √ | X | X |
| [44,47], GE | |
| 5 | Digatoro (7), Middleton (8), Kulama (9), Fishtown (10) | √ √ √ √ | X | X |
| [37] | |
| 6 | Sangana (11), Nun | √ √ | √ | X |
| [28,37,47,56,58] | |
| 7 | Brass, St. Nicholas (14) | √ | X | √ X | √ X |
| [45,56] GE |
| 8 | Santa Barbara (15), San Bartholomew (16) | √ √ | X X | X X |
| [56] | |
| 9 | Sombreiro (17), New Calabar (18) | √ √ | X X | X X |
| [56] | |
| 10 | Bonny (19) | √ | √ | √ |
| [58] | |
| 11 | Andoni (20) | √ | X | X |
| GE | |
Publisher’s Note: MDPI stays neutral with regard to jurisdictional claims in published maps and institutional affiliations. |
© 2022 by the authors. Licensee MDPI, Basel, Switzerland. This article is an open access article distributed under the terms and conditions of the Creative Commons Attribution (CC BY) license (https://creativecommons.org/licenses/by/4.0/).
Share and Cite
MDPI and ACS Style
Afolabi, M.; Darby, S. Spatial and Temporal Variations in Shoreline Changes of the Niger Delta during 1986–2019. Coasts 2022, 2, 203-220. https://doi.org/10.3390/coasts2030010
AMA Style
Afolabi M, Darby S. Spatial and Temporal Variations in Shoreline Changes of the Niger Delta during 1986–2019. Coasts. 2022; 2(3):203-220. https://doi.org/10.3390/coasts2030010
Chicago/Turabian StyleAfolabi, Matthew, and Stephen Darby. 2022. "Spatial and Temporal Variations in Shoreline Changes of the Niger Delta during 1986–2019" Coasts 2, no. 3: 203-220. https://doi.org/10.3390/coasts2030010