Article

Predicting Animal Welfare Labels from Pork Fat Using Raman Spectroscopy and Chemometrics

1
Ocean Insight, Geograaf 24, 6921 EW Duiven, The Netherlands
2
M4i Institute, Faculty Health, Medicine & Life Sciences, Maastricht University, Universiteitssingel 50, 6229 ER Maastricht, The Netherlands
3
Department of Analytical Chemistry & Chemometrics, Institute for Molecules and Materials, Radboud University, Heyendaalseweg 135, 6525 AJ Nijmegen, The Netherlands
4
Coher Sense UG, im Technikzentrum Lübeck, Maria-Goeppert-Str. 1, 23562 Lübeck, Germany
5
Life Science Trace Detection Laboratory, Department of Analytical Chemistry & Chemometrics, Radboud University, Heyendaalseweg 135, 6525 AJ Nijmegen, The Netherlands
6
Ocean Insight, 3500 Quadrangle Blvd., Orlando, FL 32817, USA
7
Department of Chemistry and ILOC, Niederrhein University of Applied Sciences, Frankenring 20, 47798 Krefeld, Germany
*
Author to whom correspondence should be addressed.
AppliedChem 2023, 3(2), 279-289; https://doi.org/10.3390/appliedchem3020017
Submission received: 31 March 2023 / Revised: 5 May 2023 / Accepted: 8 May 2023 / Published: 17 May 2023
(This article belongs to the Special Issue Spectroscopy in Food Science and Engineering)

Abstract

:
The awareness of the origin of meat that people consume is rapidly increasing today and with that increases the demand for fast and accurate methods for its distinction. In this work, we present for the first time the application of Raman spectroscopy using a portable spectrometer for the classification of pork. Breeding conditions were distinguished from spectral differences of adipose tissues. The pork samples were obtained from Dutch vendors, from supermarkets with quality marks of 1 and 3 stars, and from a local butcher shop. In total, 60 fat samples were examined using a fiber-optic-coupled Raman spectrometer. Recorded spectra were preprocessed before being subjected to multivariate statistical analysis. An initial data exploration using Principal Component Analysis (PCA) revealed a separation of adipose tissue samples between the lower supermarket quality grade and the samples from the local butcher. Moreover, predictive modeling using Partial Least Squares Discriminant Analysis (PLS-DA) resulted in 96.67% classification accuracy for all three sources, demonstrating the suitability of the presented method for intraspecies meat classification and the potential on-site use.

1. Introduction

The consumption of meat has rapidly increased in the last decades, with a reported rise of up to 500% between 1961 and 2016 [1,2]. The pigmeat consumption was the highest on a global average till 2015 and remains in the second position until today [3]. The nutritional values, such as the high content of protein, amino acids, fatty acids and being a source of vitamin B12, zinc, iron, and phosphorus [4], make meat a very popular product on our plates, standing for approximately 30% of the total calory intake in the European Union (EU) [5]. Although the trend of meat consumption is expected to continue growing, nowadays consumers are also becoming more interested in and aware of the meat value chain including animal well-being and food safety [6]. Several studies have reported animal welfare as a predominant reason why people choose to buy organically produced meat. Animals raised on organic farms are defined as free-range, with access to the pasture for grazing and foraging [7]. Moreover, their larger living spaces reduce stress and diseases. Besides animal well-being, other reasons for favoring organic meat are environmental impact and human health. The consumers who are aware of the negative impact of meat production on the environment are more likely to purchase products from organic sources, as these are perceived as more sustainable than conventional ones. Organic meat is considered healthier and of better taste due to the reduced use of antibiotics and a lower amount of concentrated feed in comparison to meat from conventional farming [8,9]. Health and taste aspects have been correlated to the nutritional value of animal products. The fatty acid composition of animal food is reported to influence the fatty acid content of meat, eggs, and milk [10]. The comparison of the chemical composition of organically and conventionally produced meat showed significant variations in the fatty acids profiles. Especially large differences were detected for total polyunsaturated fatty acids (PUFAs) and n-3 PUFA, known as good fats, which were more abundant in organic meat [11].
The importance of higher nutrition values as well as caring for animal well-being has led to a substantial growth of the organic food business in the last years, undergoing a fivefold expansion from 1999 [7]. Yet, the increasing demand for organic meat is associated with the risk of adulteration, as such products are usually more expensive due to higher production costs [12]. To prevent fraudulence and protect the consumers as well as the organic farmers, methods are required to delineate organic and nonorganic meat. Commonly, meat is analyzed with respect to fatty acid ethyl esters using gas chromatography coupled with flame-ionization detection (GC-FID) [13,14,15,16] or with mass spectrometry (GC-MS) [17,18]. Liquid chromatography–mass spectrometry (LC-MS) has been used for nonvolatile compound screening [16,18], proton transfer reaction mass spectrometry for volatile compounds analysis (PTR-MS) [16], inductively coupled plasma mass spectrometry (ICP-MS) for trace elements detection [19], and rapid evaporative ionization mass spectrometry (REIMS) for direct metabolite analysis [20].
While these techniques are widely used in chemical analysis, they require laborious sample preparation or utilization of nonportable instrumentation, resulting in nonfieldable applicability. Techniques to overcome these problems are based on optical spectroscopy allowing for rapid analysis, noninvasiveness, and portability. In food analysis, Raman spectroscopy plays a particular role since water molecules do not cause interference and samples can be analyzed through the packaging [21,22,23,24].
In this work, we present for the first time the use of Raman spectroscopy for the classification of pork meat from different origins using a portable spectrometer. Samples from three sources were analyzed using a mobile Raman system together with a chemometric analysis. PCA and PLS-DA were used to explore and subsequently exploit the potential of the Raman system in combination with carefully selected spectral data processing methods to discriminate pork meat welfare labels. The approach was applied to distinguish adipose tissues of pork, chicken, and lamb and extended to intraspecies discrimination of pork meat.

2. Materials and Methods

2.1. Sample Preparation

Pork samples (bacon steaks) were collected from the Dutch supermarket chain (Albert Heijn) with different quality labels, 1 star and 3 stars (Beter Leven), and from a local butcher. Chicken thighs were purchased from the same supermarket with quality label 1 and lamb chopsticks were labeled as AH Excellent brand, which corresponds to the 3-star quality label. Fat pieces (10 mm × 10 mm) were cut out of meat slices and placed on a metal stage for Raman experiments. In total, 121 adipose tissue samples were investigated for interspecies discrimination: 40 from lamb, 21 from chicken, and 60 from pork. The latter consisted of 18 fat pieces from the 1-star quality meat, 18 from the 3-star quality meat, and 24 from meat obtained from a local butcher for intraspecies discrimination. Meat samples were purchased on different days to eliminate intrabatch variations: for lamb samples—4 packages, for chicken samples—3 packages, and for pork samples—6 packages per welfare label. All samples were analyzed within 2 h after the purchase to avoid spoilage.

2.2. Raman Analysis

Raman analyses were performed using a QePro-Raman+ spectrometer (Ocean Insight, Orlando, FL, USA), equipped with a thermoelectric (TE)-cooled CCD detector at −15 °C and a 50 µm interchangeable slit. Fat samples were placed on an adjustable metal stage with the Raman probe (InPhotonics, Inc., Norwood, MA, USA) positioned above the sample. A 785 nm wavelength laser with a power of 350 mW was used as an excitation source (Innovative Photonic Solutions, Plainsboro, NJ, USA). Samples were visually inspected after the measurements to ensure no changes occurred due to the laser power. The spectral acquisition was controlled using OceanView v2.0.9 software (Ocean Insight, Orlando, FL, USA), in the range of 0–3038 cm−1 (1039 data points) using an integration time of 30 s.

2.3. Spectral Processing and Statistical Analysis

2.3.1. Data Preprocessing

All data were analyzed using MATLAB R2021a and in-house built scripts. Only spectral data from 800 cm−1 to 3038 cm−1 (832 data points) were processed. The trimmed spectroscopic data were pretreated prior to data modeling to compensate for additive and multiplicative baseline artifacts, as well as instrumental noise [25]. Such artifacts often arise from differences between the measurements (e.g., analysis) rather than from actual chemical differences between the samples. Slight differences between calibration settings between two measurement runs may for instance cause additive and multiplicative baseline artifacts. Not only do these artifacts limit the extraction of chemically relevant information, but when correlated to the class labels they can cause a prediction model to actively (and falsely) model the analysis differences rather than the chemical differences. As independent testing provides no protection against this, it was decided to reduce the effects of additive and multiplicative baseline artifacts with, respectively and subsequently, Asymmetric Least Squares (AsLS) smoothing [26] and a Standard Normal Variate (SNV) transformation [27]. Instrumental noise was eliminated using a Gaussian-weighted moving average filter with a window width of 5 spectral data points [28].

2.3.2. Explorative Data Modeling

Principal Component Analysis (PCA) was used to perform an explorative analysis of the measured data [29]. As PCA allows for the projection of the major sources of variance in the data to a minimal and orthogonal space, it can visualize how strong the meat class differences are manifested in the Raman data in terms of component scores plots, without actively maximizing those differences. Further investigation of the component loadings can help in understanding the major variations of the data from a chemical viewpoint and helps in checking the data for artifacts and outliers. The spectral variables were centered to zero mean prior to modeling [30].

2.3.3. Predictive Data Modeling

To further exploit the spectral data with supervised predictive modeling, Partial Least Squares Discriminant Analysis (PLS-DA) was used on the preprocessed spectral data to construct models for the classification of the meat quality according to the welfare label for pork fat samples. The meat types and welfare labels were used as dependent variables, while the intensities/signals measured over the different Raman shifts were used as dependent variables for the multivariate regression [31]. As for the PCA models, the spectral variables were mean-centered prior to modeling.

2.3.4. Model Optimization and Validation

The PLS-DA models were optimized and validated by applying double 5-fold Venetian Blinds cross-validation [32]. The outer cross-validation loop holds out 20% of data for independent testing of the model, while the remaining 80% of data is used for training the model. This is repeated 5 times in a way that every sample is independently tested once, to help estimate the modeling accuracy while respecting the distribution of the classes. This outer validation loop ensures that the estimated discrimination accuracy is not subject to model overfitting. The inner cross-validation loop is a nested loop applied (per outer validation fold) to 80% of training data, to optimize the number of latent variables used by PLS-DA towards minimum Root Mean Squared Error (RMSE). In this nested loop, 80% of training data is iteratively used to calibrate the model and 20% of the model to select (and thereby) optimize the number of latent variables.

3. Results

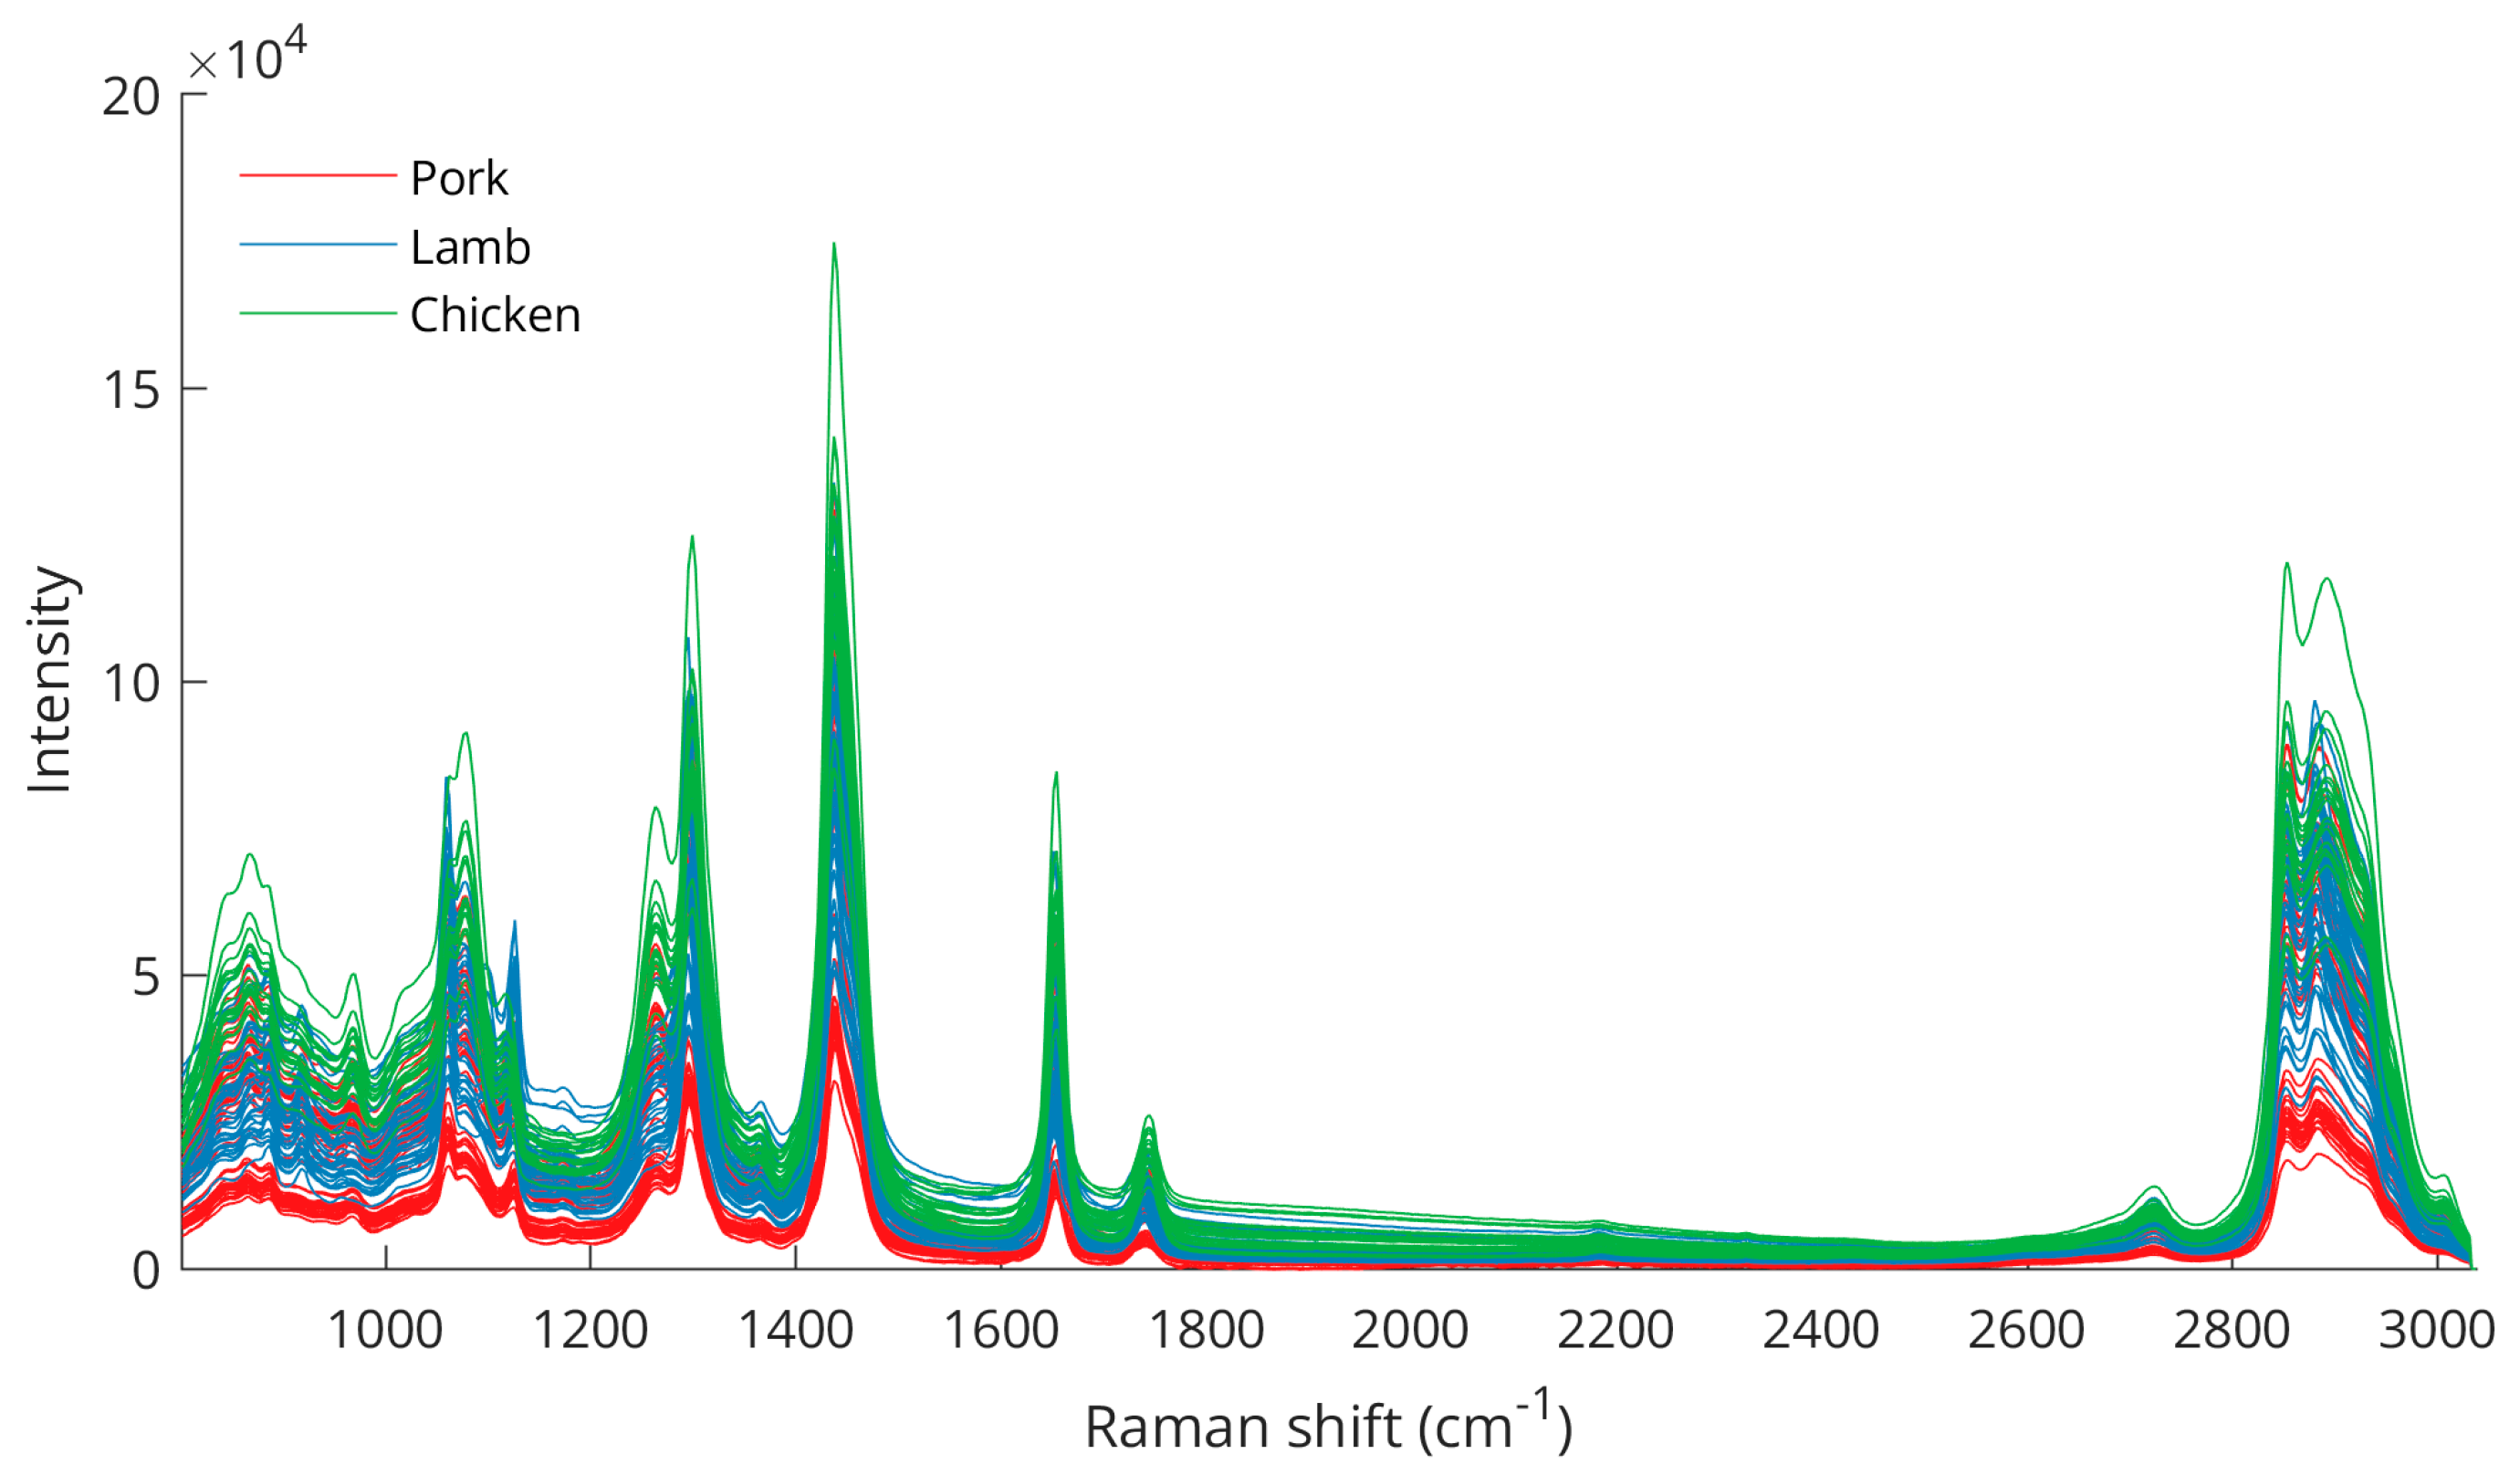
3.1. Raman Spectra of Fat Samples

Fat samples from pork, lamb, and chicken were cut, prepared, and analyzed with a portable Raman spectroscopy system. Spectra acquired from 0 to 3038 cm−1 were trimmed to 800–3038 cm−1. Figure 1 shows the unprocessed Raman spectra from all fat samples.
After spectral data preprocessing, the differences between the three species are better visualized (Figure 2), especially for the peaks between 800 and 1000 cm−1 (C–C, CH3 rocking vibrations, C–O), 1062 cm−1 (out-of-phase aliphatic C–C stretching all-trans), 1082 cm−1 (aliphatic C–C stretching in gauche), 1125 cm−1 (in-phase aliphatic C–C stretching all-trans), 1269 cm−1 (=CH in-plane cis olefinic hydrogen bending), 1295 cm−1 (CH2 methylene twisting deformations), 1653 cm−1 (cis C=C olefinic stretching), 2854 cm−1 (methylene symmetric stretching), and 2886 cm−1 (methyl symmetric stretching). The wavenumbers of the bands including some variations corresponded well with previously described Raman analyses of animal adipose tissues [33,34,35]. Moreover, the intensity differences in these bands were also apparent from intraspecies measurements (Figure S1), emphasizing the importance of these peaks for meat discrimination analysis.

3.2. Data Analysis

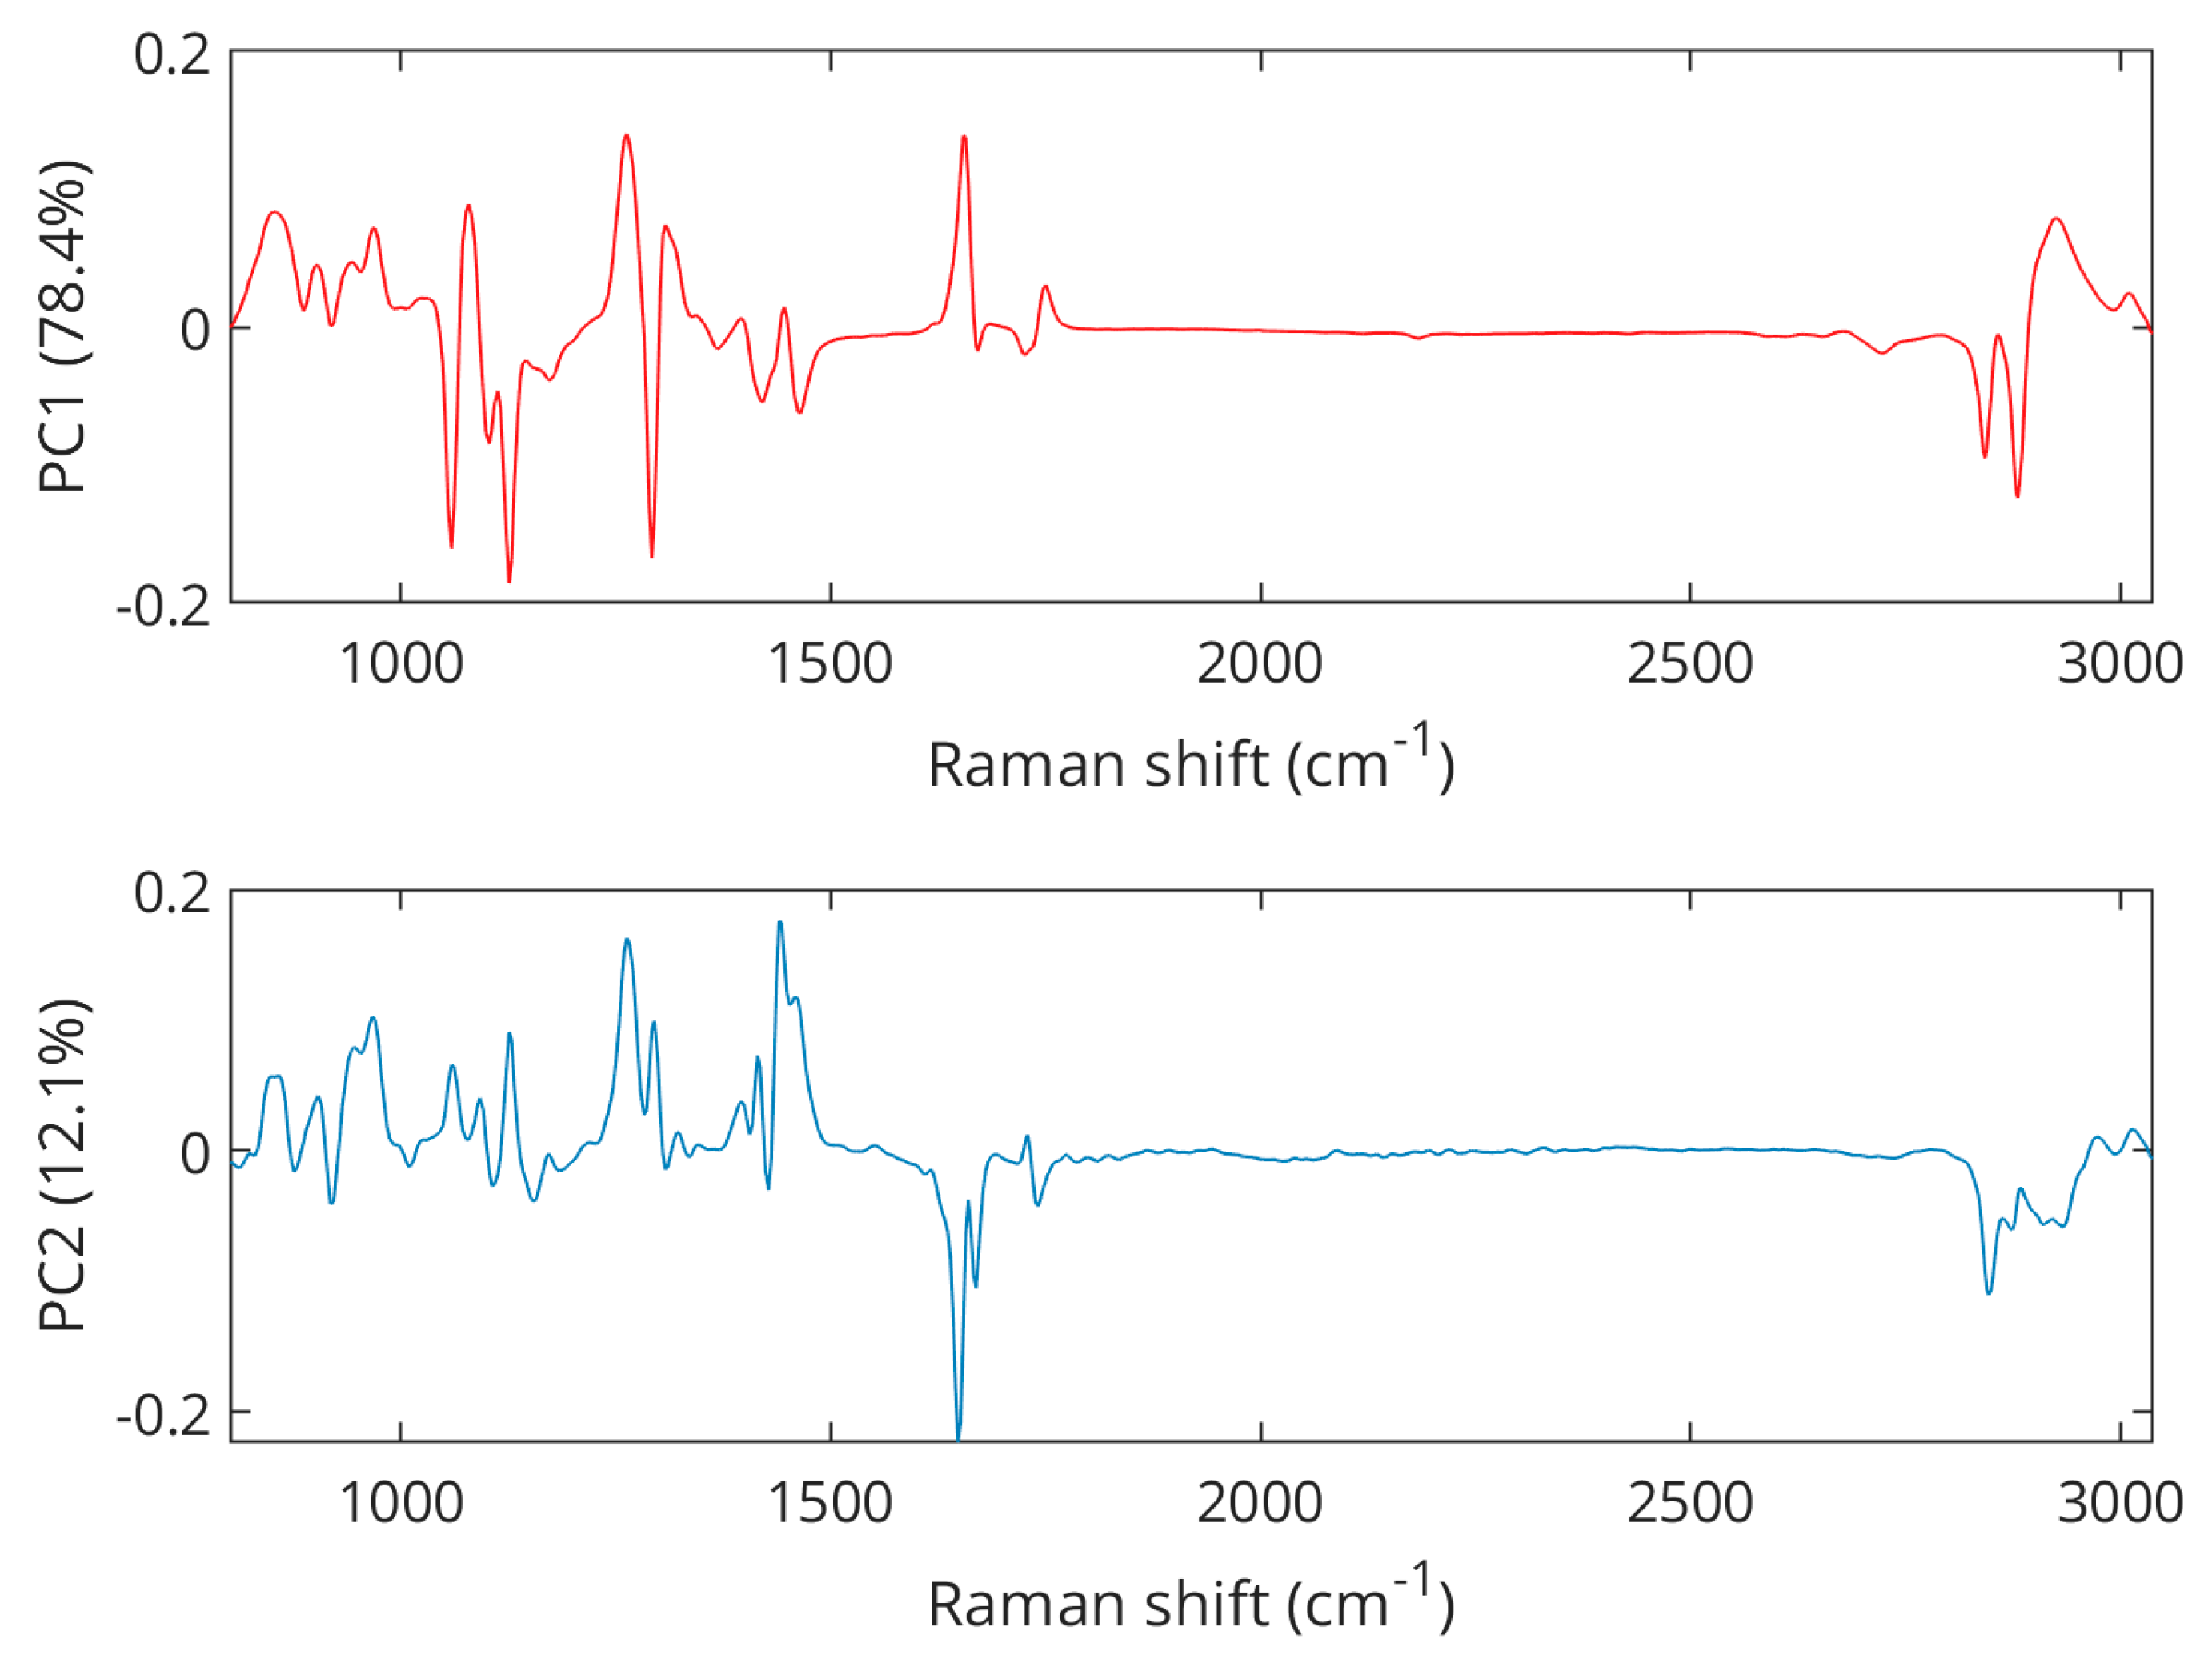
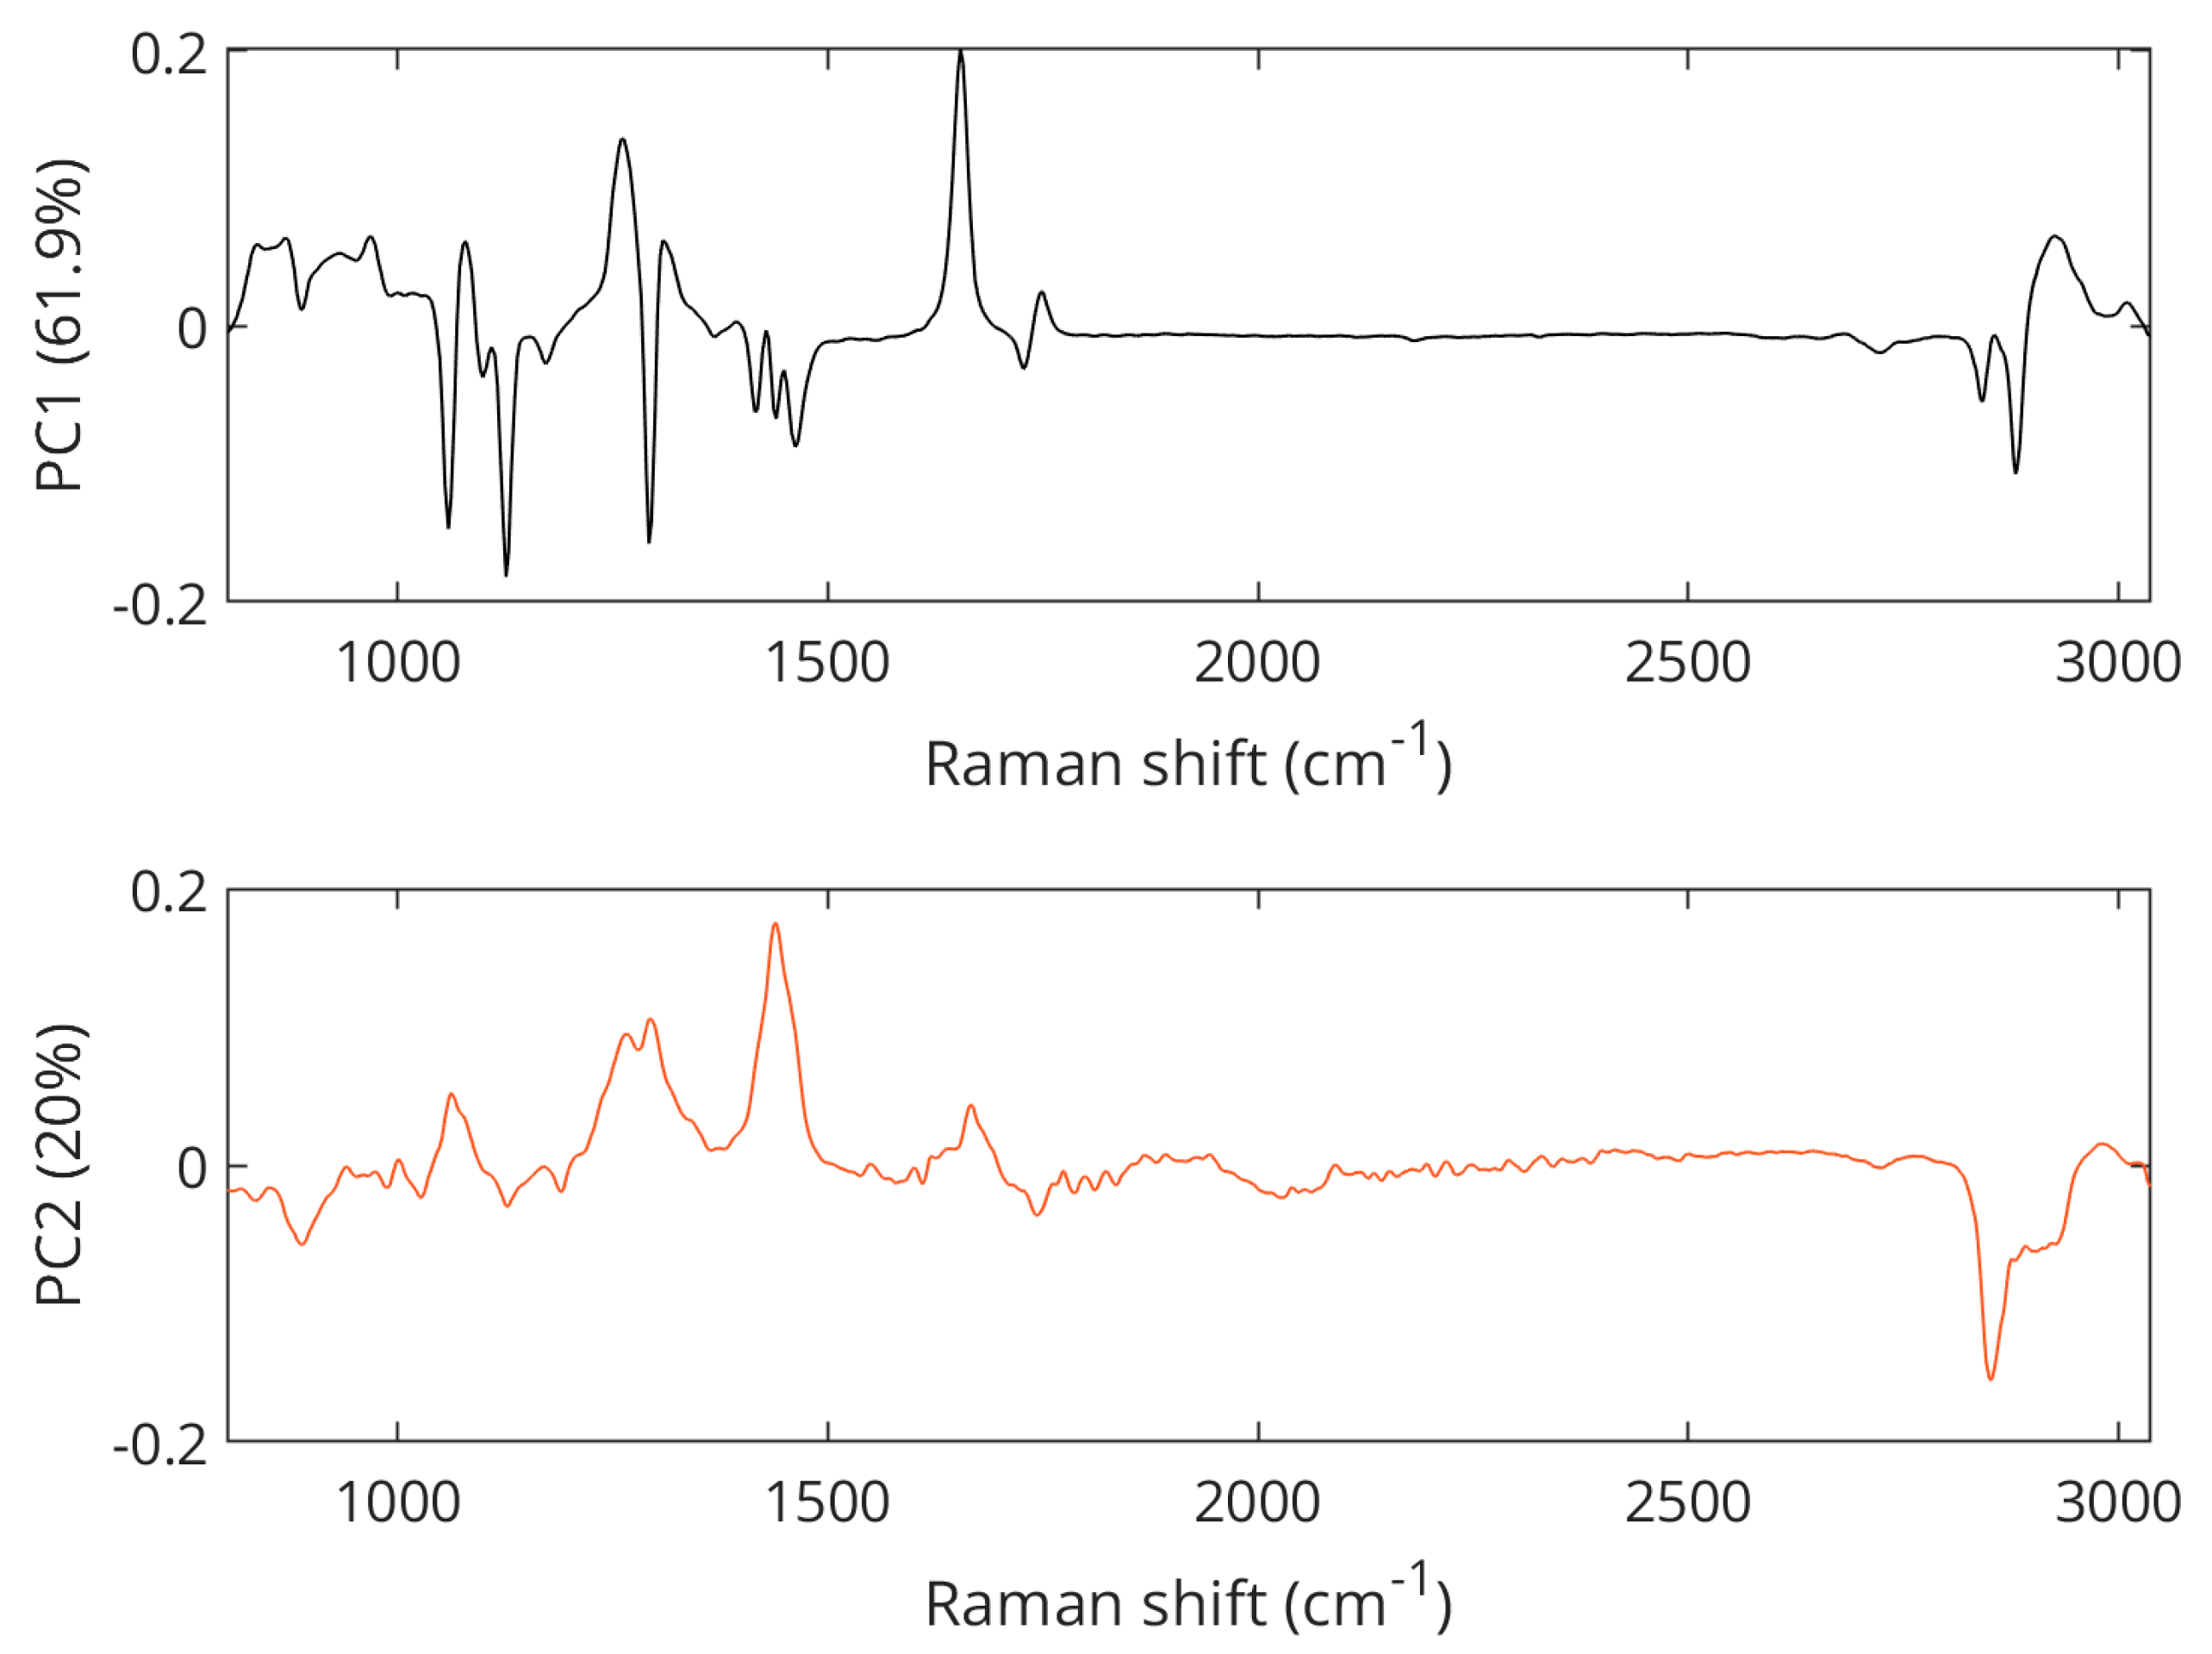
3.2.1. Principal Component Analysis (PCA)

An exploration of the preprocessed spectral data using PCA reveals a clear separation between samples from pork, lamb, and chicken (Figure 3), with the first principal component (PC1) explaining 78.4% of the variance and the second principal component (PC2) describing another 12.1% of the variations. Further principal components were investigated but did not reveal better class separation than is already observed for the scores of the PC1 and PC2. Pork samples were clustered in the positive PC2 space while lamb and chicken were represented in the negative PC2 space. The separation between lamb and chicken was achieved in the PC1 dimension as lamb samples grouped in the negative space, while chicken samples appeared on the positive PC1 axis. PCA loading plots (Figure 4) showed Raman features responsible for the discrimination in the negative and positive spaces for both dimensions, PC1 and PC2. The peaks with the largest variance in the negative PC2 space were found at 1650 cm−1 (C=C olefinic stretching) and 2854 cm−1 (methylene symmetric stretching), while in the positive direction, bands at 1269 cm−1 (=CH in-plane cis olefinic hydrogen bending) and 1436 cm−1 (CH2 methylene scissor deformations) were important. In PC1 positive space, the observed separation is correlated to Raman bands at 1269 and 1650 cm−1, whereas in the negative region, bands at 1062 cm−1 (out-of-phase aliphatic C–C stretch all-trans), 1125 cm−1 (in-phase aliphatic C–C stretch all-trans), and 1295 cm−1 (CH2 methylene twisting deformations) seem decisive.
Figure 5 shows the scores for the first two principal components of a PCA model calculated on the spectral data of only the pork samples. This figure reveals that some separation between supermarket pork samples with 1-star quality mark and samples from a local farm could be recognized. Data from the 3-star quality label also referred to as biological meat did not separate well but were widely spread and occurred at high PC1 and PC2 values but also within the two clusters. Hence, only a few samples at high PC values were well separated. The large total distribution may be due to similarities in breeding conditions. For instance, living conditions and standard diets are rather similar for pigs of the supermarket quality labels 1 to 3 [36]. Yet, animals for biological grade meat also have access to the pasture where they can graze and forage like pigs bred on a local farm. These results show that distinguishing meats within one species based on Raman measurements is more challenging than distinguishing meats of different species, and that the usage of a supervised classifier such as PLS-DA should indeed be explored. Note that further principal components were investigated but did not reveal better class separation than is already observed for the scores of the PC1 and PC2.
The separation between samples with 1-star grade and samples from local farm meat was mainly visible in the PC2 space of the PCA score plot shown in Figure 5, with the separation of 1-star meat samples in the positive space and local farm meat samples in the negative space. The Raman spectral features that cause the separation of lower-grade pork samples corresponded to the vibrations at 1062 cm−1 (out-of-phase aliphatic C–C stretching all-trans), 1269 cm−1 (=CH in-plane cis olefinic hydrogen bending), 1295 cm−1 (CH2 methylene twisting deformations), 1436 cm−1 (CH2 methylene scissor deformations), and 1653 cm−1 (cis C=C olefinic stretching). In contrast, bands important for the separation of the local farm meat as seen in the negative PC2 space were located at 886 cm−1 (CH3 rocking vibration), 1125 cm−1 (in-phase aliphatic C–C stretching all-trans), 1743 cm−1 (C=O carbonyl stretching), and 2854 cm−1 (methylene symmetric stretching), cf. Figure 6. A compilation of Raman spectra of pork samples with annotated major characteristic bands is given in Figure S2.

3.2.2. Predictive Modeling for Pork Origins

PLS-DA models were calibrated, optimized, and validated on the preprocessed Raman data to further exploit the discriminating properties of pork for the three qualities by adipose tissue analysis. Table 1 presents the classification confusion matrix for the PLS-DA model. Note that these results are found after the double cross-validation applied to protect against overfitting and thus correspond to independent resting. The number of latent variables selected—which is executed for each of the five outer validation folds—ranged between 14 and 29 for the PLS-DA models.
The PLS-DA model shows excellent validated performance with 96.67% classification accuracy. Only two samples from 3-star grade pork out of 18 were predicted as 1-star quality. A PLS-DA model built for the three meat species achieved a classification accuracy of 97.52% (Table S1). In this case, three samples from 3-star grade pork were classified as 1 star. In contrast to PCA, the PLS-DA scores plot (Figure 7) showed that the 1-star label samples and the local farm samples formed well-defined clusters, whereas the 3-star pork samples were scattered more widely over the latent space. Thus, the 1-star label and local farm samples exhibited the largest differences and were therefore easier to discriminate from each other. The 3-star pork samples showed more intersample variance, which reduced their discriminant distance from the two other groups. This was also supported by the fact that the two samples misclassified by the PLS-DA model were 3-star pork.
The regression coefficients presented in Figure S3 revealed the Raman features responsible for the distinction of the three pork classes. In the 1-star grade PLS-DA model, the following Raman peaks contributed predominantly: 847 and 868 cm−1 (C–O–O skeletal), 1038 cm−1 (C–H bending) [37], 1269 cm−1 (in-plane cis olefinic hydrogen bending (=CH)), and 2854 cm−1 (methylene symmetric stretching). In the 3-star grade model, the major contribution stemmed from the bands at 847 cm−1, 1062 cm−1 (out-of-phase aliphatic C–C stretching all-trans), and 1269 cm−1 (=CH in-plane cis olefinic hydrogen bending). The discriminatory power in the local farm meat PLS-DA model was associated with the vibrations at 1029 cm−1 (CH bending), 1082 cm−1 (aliphatic C–C stretching in gauche), 1125 cm−1 (in-phase aliphatic C–C stretching all-trans), and 1436 cm−1(CH2 methylene scissor deformations).

4. Discussion

In the presented study, Raman spectroscopy was used to explore and exploit the differences in adipose tissue profiles for inter- and intraspecies classification of meat samples. Previous studies assigned the peaks responsible for the separation of meat from different animals to saturated fatty acids, i.e., 1060, 1080, 1127, and 1440 cm−1, and unsaturated fatty acids, i.e., 1267 and 1650 cm−1 [33,38]. These findings support our observations that the bands at 1062, 1125, 1269, 1295, 1436, 1650, and 2854 cm−1 were responsible for the interspecies discrimination. Moreover, the bands at 1267 and 1650 cm−1 stemming from unsaturated fatty acids played a crucial role in the intraspecies classification of pork meat. The observation and analysis of unsaturated fatty acids are especially important since it has been previously reported that the concentration of monounsaturated fatty acids (MUFAs) and polyunsaturated fatty acids (PUFAs) from pork fat differed significantly between pork samples from conventional and organic farming [16,39,40]. In particular, linoleic acid was given a significant role in intraspecies classification. This is in excellent agreement with our results as the band observed at 1650 cm−1 could be traced back to conjugated linoleic acid [38].

5. Conclusions

In this work, we advanced the field of meat science by demonstrating that Raman spectroscopy combined with chemometrics can be used for meat classification from different sources based on spectral differences stemming from adipose tissues. The Raman spectrometer used here provided a fast, nondestructive, and fieldable method requiring only 30 s of acquisition time and minimal sample preparation. Meat analysis resulted in a clear distinction between lamb, chicken, and pork meat. A classification model based on fat tissues could further successfully discriminate between pork of the lower supermarket grade (1 star) according to the Dutch classification scheme and local farm quality with an accuracy of 96.62%. These results indicate the potential of the presented method for predicting animal welfare labels on-site. Yet, further studies need to be carried out for an in-depth understanding of the chemical variations between meat and its adipose tissues due to different breeding conditions.

Supplementary Materials

The following supporting information can be downloaded at https://www.mdpi.com/article/10.3390/appliedchem3020017/s1, Figure S1: The Raman spectra of all meat species after spectral data pre-processing. Figure S2: The Raman spectra of all pork samples after spectral data pre-processing with wavenumbers on the main characteristic bands. Figure S3: Regression coefficient for three pork classes. Table S1: PLSDA classification confusion matrix for five meat classes.

Author Contributions

Conceptualization, K.M.S. and O.L.; methodology, K.M.S.; software, T.O. and J.M.; validation, O.L., M.J. and M.H.; formal analysis, T.O. and O.L.; investigation, K.M.S.; resources, K.M.S. and D.G.; data curation, T.O.; writing—original draft preparation, K.M.S.; writing—review and editing, O.L., D.G., Y.M., M.J. and M.H.; visualization, K.M.S. and J.M.; supervision, M.J. and M.H.; project administration, Y.M.; funding acquisition, Y.M. All authors have read and agreed to the published version of the manuscript.

Funding

This research received no external funding.

Institutional Review Board Statement

Not applicable.

Informed Consent Statement

Not applicable.

Data Availability Statement

Data are contained within the article and Supplementary Materials.

Conflicts of Interest

The authors declare no conflict of interest.

References

  1. González, N.; Marquès, M.; Nadal, M.; Domingo, J.L. Meat consumption: Which are the current global risks? A review of recent (2010–2020) evidences. Food Res. Int. 2020, 137, 109341. [Google Scholar] [CrossRef]
  2. Henchion, M.; McCarthy, M.; Resconi, V.C.; Troy, D. Meat consumption: Trends and quality matters. Meat Sci. 2014, 98, 561–568. [Google Scholar] [CrossRef] [PubMed]
  3. Meat and Dairy Production—Our World in Data. Available online: https://ourworldindata.org/meat-production (accessed on 13 March 2023).
  4. Bohrer, B.M. Review: Nutrient density and nutritional value of meat products and non-meat foods high in protein. Trends Food Sci. Technol. 2017, 65, 103–112. [Google Scholar] [CrossRef]
  5. Bonnet, C.; Bouamra-Mechemache, Z.; Réquillart, V.; Treich, N. Viewpoint: Regulating meat consumption to improve health, the environment and animal welfare. Food Policy 2020, 97, 101847. [Google Scholar] [CrossRef]
  6. Demarche, X.; Wiśniewska-Danek, K.; Otto, J.; Wojciechowski, J.; Friel, C.; Voinea, D.; Roșca, L. Animal Welfare in the EU: Closing the Gap between Ambitious Goals and Practical Implementation. Available online: https://www.eca.europa.eu/Lists/ECADocuments/SR18_31/SR_ANIMAL_WELFARE_EN.pdf (accessed on 14 March 2023).
  7. Akaichi, F.; Glenk, K.; Revoredo-Giha, C. Could animal welfare claims and nutritional information boost the demand for organic meat? Evidence from non-hypothetical experimental auctions. J. Clean. Prod. 2019, 207, 961–970. [Google Scholar] [CrossRef]
  8. Siegrist, M.; Hartmann, C. Impact of sustainability perception on consumption of organic meat and meat substitutes. Appetite 2019, 132, 196–202. [Google Scholar] [CrossRef]
  9. Mie, A.; Andersen, H.R.; Gunnarsson, S.; Kahl, J.; Kesse-Guyot, E.; Rembiałkowska, E.; Quaglio, G.; Grandjean, P. Human health implications of organic food and organic agriculture: A comprehensive review. Environ. Health 2017, 16, 111. [Google Scholar] [CrossRef]
  10. Popa, M.E.; Mitelut, A.C.; Popa, E.E.; Stan, A.; Popa, V.I. Organic foods contribution to nutritional quality and value. Trends Food Sci. Technol. 2019, 84, 15–18. [Google Scholar] [CrossRef]
  11. Średnicka-Tober, D.; Barański, M.; Seal, C.; Sanderson, R.; Benbrook, C.; Steinshamn, H.; Gromadzka-Ostrowska, J.; Rembiałkowska, E.; Skwarło-Sońta, K.; Eyre, M.; et al. Composition differences between organic and conventional meat: A systematic literature review and meta-analysis. Br. J. Nutr. 2016, 115, 994–1011. [Google Scholar] [CrossRef]
  12. Staudigel, M.; Trubnikov, A. High price premiums as barriers to organic meat demand? A hedonic analysis considering species, cut and retail outlet. Aust. J. Agric. Resour. Econ. 2022, 66, 309–334. [Google Scholar] [CrossRef]
  13. Bjorklund, E.; Heins, B.; DiCostanzo, A.; Chester-Jones, H. Fatty acid profiles, meat quality, and sensory attributes of organic versus conventional dairy beef steers. J. Dairy Sci. 2014, 97, 1828–1834. [Google Scholar] [CrossRef] [PubMed]
  14. Högberg, A.; Pickova, J.; Andersson, K.; Lundström, K. Fatty acid composition and tocopherol content of muscle in pigs fed organic and conventional feed with different n6/n3 ratios, respectively. Food Chem. 2003, 80, 177–186. [Google Scholar] [CrossRef]
  15. Kamihiro, S.; Stergiadis, S.; Leifert, C.; Eyre, M.D.; Butler, G. Meat quality and health implications of organic and conventional beef production. Meat Sci. 2015, 100, 306–318. [Google Scholar] [CrossRef] [PubMed]
  16. Oliveira, G.B.; Alewijn, M.; Boerrigter-Eenling, R.; Van Ruth, S.M. Compositional Signatures of Conventional, Free Range, and Organic Pork Meat Using Fingerprint Techniques. Foods 2015, 4, 359–375. [Google Scholar] [CrossRef]
  17. Gibbs, R.A.; Rymer, C.; Givens, D. Fatty acid composition of cooked chicken meat and chicken meat products as influenced by price range at retail. Food Chem. 2013, 138, 1749–1756. [Google Scholar] [CrossRef]
  18. Man, K.-Y.; Chan, C.-O.; Tang, H.-H.; Dong, N.-P.; Capozzi, F.; Wong, K.-H.; Kwok, K.W.H.; Chan, H.M.; Mok, D.K.-W. Mass spectrometry-based untargeted metabolomics approach for differentiation of beef of different geographic origins. Food Chem. 2021, 338, 127847. [Google Scholar] [CrossRef] [PubMed]
  19. Parinet, J.; Royer, E.; Saint-Hilaire, M.; Chafey, C.; Noël, L.; Minvielle, B.; Dervilly-Pinel, G.; Engel, E.; Guérin, T. Classification of trace elements in tissues from organic and conventional French pig production. Meat Sci. 2018, 141, 28–35. [Google Scholar] [CrossRef]
  20. Gatmaitan, A.N.; Lin, J.Q.; Zhang, J.; Eberlin, L.S. Rapid Analysis and Authentication of Meat Using the MasSpec Pen Technology. J. Agric. Food Chem. 2021, 69, 3527–3536. [Google Scholar] [CrossRef]
  21. Legner, R.; Voigt, M.; Servatius, C.; Klein, J.; Hambitzer, A.; Jaeger, M. A Four-Level Maturity Index for Hot Peppers (Capsicum annum) Using Non-Invasive Automated Mobile Raman Spectroscopy for On-Site Testing. Appl. Sci. 2021, 11, 1614. [Google Scholar] [CrossRef]
  22. Sourdaine, M.; Guenther, D.; Dowgiallo, A.-M.; Harvey, C.; Mattley, Y.; Guckian, A.; Lischtschenko, O. Protecting the food supply chain: Utilizing SERS and portable Raman spectroscopy. Tech. Mess. 2015, 82, 625–632. [Google Scholar] [CrossRef]
  23. Dib, O.H.; Assaf, A.; Pean, A.; Durand, M.-J.; Jouanneau, S.; Ramanathan, R.; Thouand, G. Raman Spectroscopy Application in Food Waste Analysis: A Step towards a Portable Food Quality-Warning System. Sustainability 2023, 15, 188. [Google Scholar] [CrossRef]
  24. McVey, C.; Elliott, C.T.; Cannavan, A.; Kelly, S.D.; Petchkongkaew, A.; Haughey, S.A. Portable spectroscopy for high throughput food authenticity screening: Advancements in technology and integration into digital traceability systems. Trends Food Sci. Technol. 2021, 118, 777–790. [Google Scholar] [CrossRef]
  25. Engel, J.; Gerretzen, J.; Szymańska, E.; Jansen, J.J.; Downey, G.; Blanchet, L.; Buydens, L.M. Breaking with trends in pre-processing? TrAC Trends Anal. Chem. 2013, 50, 96–106. [Google Scholar] [CrossRef]
  26. Eilers, P.H.C. A perfect smoother. Anal. Chem. 2003, 75, 3631–3636. [Google Scholar] [CrossRef] [PubMed]
  27. Lwin, T.; Martens, H.; Naes, T. Multivariate Calibration. Biometrics 1991, 47, 1203. [Google Scholar] [CrossRef]
  28. Feissel, M.; Lewandowski, W. A comparative analysis of Vondrak and Gaussian smoothing techniques. J. Geodesy 1984, 58, 464–474. [Google Scholar] [CrossRef]
  29. Bro, R.; Smilde, A.K. Principal component analysis. Anal. Methods 2014, 6, 2812–2831. [Google Scholar] [CrossRef]
  30. Bro, R.; Smilde, A.K. Centering and scaling in component analysis. J. Chemom. 2003, 17, 16–33. [Google Scholar] [CrossRef]
  31. Ruiz-Perez, D.; Guan, H.; Madhivanan, P.; Mathee, K.; Narasimhan, G. So you think you can PLS-DA? BMC Bioinform. 2020, 21, 2. [Google Scholar] [CrossRef] [PubMed]
  32. Westad, F.; Marini, F. Validation of chemometric models—A tutorial. Anal. Chim. Acta 2015, 893, 14–24. [Google Scholar] [CrossRef]
  33. Beattie, J.R.; Bell, S.E.J.; Borggaard, C.; Fearon, A.M.; Moss, B.W. Classification of Adipose Tissue Species using Raman Spectroscopy. Lipids 2007, 42, 679–685. [Google Scholar] [CrossRef]
  34. Olsen, E.F.; Rukke, E.-O.; Flåtten, A.; Isaksson, T. Quantitative determination of saturated-, monounsaturated- and polyunsaturated fatty acids in pork adipose tissue with non-destructive Raman spectroscopy. Meat Sci. 2007, 76, 628–634. [Google Scholar] [CrossRef] [PubMed]
  35. Beattie, J.R.; Bell, S.E.; Borgaard, C.; Fearon, A.; Moss, B.W. Prediction of adipose tissue composition using raman spectroscopy Average properties and individual fatty acids. Lipids 2006, 41, 287–294. [Google Scholar] [CrossRef] [PubMed]
  36. Available online: https://beterleven.dierenbescherming.nl/over-de-dieren/alle-dieren/varkens/ (accessed on 14 March 2023).
  37. Czamara, K.; Majzner, K.; Pacia, M.Z.; Kochan, K.; Kaczor, A.; Baranska, M. Raman spectroscopy of lipids: A review. J. Raman Spectrosc. 2015, 46, 4–20. [Google Scholar] [CrossRef]
  38. Saleem, M.; Amin, A.; Irfan, M. Raman spectroscopy based characterization of cow, goat and buffalo fats. J. Food Sci. Technol. 2021, 58, 234–243. [Google Scholar] [CrossRef] [PubMed]
  39. Hansen, L.; Claudi-Magnussen, C.; Jensen, S.; Andersen, H. Effect of organic pig production systems on performance and meat quality. Meat Sci. 2006, 74, 605–615. [Google Scholar] [CrossRef]
  40. Berhe, D.T.; Eskildsen, C.E.; Lametsch, R.; Hviid, M.S.; Van Den Berg, F.; Engelsen, S.B. Prediction of total fatty acid parameters and individual fatty acids in pork backfat using Raman spectroscopy and chemometrics: Understanding the cage of covariance between highly correlated fat parameters. Meat Sci. 2016, 111, 18–26. [Google Scholar] [CrossRef]
Figure 1. Raw Raman spectra from analysis of pork, lamb, and chicken fat samples.
Appliedchem 03 00017 g001
Figure 2. Raman spectra after spectral data preprocessing for pork, lamb, and chicken samples.
Appliedchem 03 00017 g002
Figure 3. PCA scores plot revealing separation between pork, lamb, and chicken samples.
Appliedchem 03 00017 g003
Figure 4. PCA loadings plots showing Raman features associated with the separation of pork, chicken, and lamb.
Appliedchem 03 00017 g004
Figure 5. PCA scores plot of pork samples with quality labels 1 star (black dots), 3 stars (red triangles), and local farm (blue squares).
Appliedchem 03 00017 g005
Figure 6. PCA loading plots showing Raman features associated with the separation of pork samples.
Appliedchem 03 00017 g006
Figure 7. PLS-DA scores plot of pork samples of 1 star, 3 stars, and local farm meat quality.
Appliedchem 03 00017 g007
Table 1. Double cross-validated PLSDA classification confusion matrix for pork samples.
Validated Classification Accuracy = 96.67%Predicted Class
1 Star3 StarsLocal Farm
True class1 Star1800
3 Stars2160
Local farm0024
Disclaimer/Publisher’s Note: The statements, opinions and data contained in all publications are solely those of the individual author(s) and contributor(s) and not of MDPI and/or the editor(s). MDPI and/or the editor(s) disclaim responsibility for any injury to people or property resulting from any ideas, methods, instructions or products referred to in the content.

