Article

Cytotoxic Activity and Phytochemical Screening of Eco-Friendly Extracted Flavonoids from Pueraria montana var. lobata (Willd.) Sanjappa & Pradeep and Trifolium pratense L. Flowers Using HPLC-DAD-MS/HRMS

by
Saied A. Aboushanab
1,2,*,
Vadim A. Shevyrin
1,2,
Vsevolod V. Melekhin
2,3,4,
Elena I. Andreeva
2,
Oleg G. Makeev
3,4 and
Elena G. Kovaleva
1,2
1
Institute of Chemical Engineering, Ural Federal University Named after the First President of Russia B. N. Yeltsin, Mira 19, 620002 Yekaterinburg, Russia
2
Educational and Innovative Center of Chemical and Pharmaceutical Technologies Chemical Technology Institute, Ural Federal University Named after the First President of Russia B. N. Yeltsin, Mira 19, 620002 Yekaterinburg, Russia
3
Department of Biology, Ural State Medical University, Repina 3, 620014 Yekaterinburg, Russia
4
Department of Gene and Cell Therapy, Institute for Medical Cell Technologies, Karla Marksa 22a, 620026 Yekaterinburg, Russia
*
Author to whom correspondence should be addressed.
AppliedChem 2023, 3(1), 119-140; https://doi.org/10.3390/appliedchem3010009
Submission received: 17 January 2023 / Revised: 13 February 2023 / Accepted: 17 February 2023 / Published: 20 February 2023
(This article belongs to the Special Issue Bioactive Compounds from Food)

Abstract

:
Increasing prospective phytochemical investigations and biological activities on Pueraria lobata and Trifolium pratense flowers exhibited their nutritional (food industry) pharmaceutical (anticancer, anti-inflammatory, anti-microbial, etc.) potentials. Previous studies paid great attention to the screening of isoflavones profile from phytochemicals. This study, in contrast, aimed at identifying the flavonoids from Pueraria lobata flowers or kudzu flower (KF) and Trifolium pratense flowers or red clover (RC) flowers and determining their cytotoxic activities on normal; (HEK-293) and cancer cell lines; human glioblastoma (A-172), osteosarcoma (HOS), embryonic rhabdomyosarcoma (Rd), lung carcinoma (A-549) and liver carcinoma (HepG2). The phytochemical screening using a high-performance liquid chromatography-diode array detector coupled with quadrupole time-of-flight mass spectrometry (HPLC-DAD-Q-TOF/MS) showed that 15 flavonoids, including isoflavones, flavones, flavonols, and flavanones, were identified in KF and 8 flavonoids, including isoflavones and flavonols, were found in RC. Nevertheless, the majority of flavonoid chemical constituents in KF or RC were found to be isoflavones (66.6%) and (62.5%), respectively. HPLC-DAD analysis following eco-friendly extraction of phytochemicals showed that KF contains mainly daidzein and genistein, while RC contains primarily formononetin and biochanin A. Cytotoxic activities evaluated according to IC50 values exhibited the most pronounced dose-dependent antiproliferative effect of KF and RC extracts were against HOS and Rd cancer cell lines, respectively. Accordingly, the morphological observation carried out using acridine orange/ethidium bromide and Giemsa stains revealed apoptotic activities and cell death in HOS and Rd cell lines when subjected to KF or RC extracts. Cytotoxic activities and apoptotic changes were pronounced among all cancer cell lines except for the control cells (HEK-293). Additionally, various polyphenols and flavonoids were identified and quantified in KF and RC extracts and exhibited potent radical scavenging activities. Overall, this study suggests that KF and RC could be valuable edible sources of flavonoids. The comprehensive flavonoid profiles for KF and RC may explain their remarkable biological activities and contribution to inducing antioxidant and cytotoxic activities against cancer cell lines.

Graphical Abstract

1. Introduction

Cancer is considered one of the major etiologies that may lead to an increment in death worldwide Sushma, et al. [1]. In 2020, there have been recorded over 19 million cancer cases and 10 million deaths [2]. In the United States, over 1.95 million new cancer cases and over 609 thousand cancer deaths are expected to occur in 2023 [3]. Cancer is characterized by unlimited cell growth, cell metastasis, and excessive cell proliferation [4]. Among the main critical common cancers are human glioblastoma, osteosarcoma, embryonic rhabdomyosarcoma, lung carcinoma, and liver carcinoma (GOELL cancers). These cancer types are associated with severe consequences and may lead to death if left untreated or with no medical or surgical interference [5]. The current multidisciplinary approach used for cancer diagnosis and treatment ends up using surgery, chemotherapy, or radiotherapy. However, these therapeutic interventions may attack healthy cells and generate undesirable side effects [6,7]. Therefore, there are constant attempts to find better sustainable diagnostic and therapeutic strategies that substitute traditional interventions and improve the treatment of these cancers. Recently, phytoestrogens from natural sources have gained interest accounting for their minor side effects, in particular, flavonoids and isoflavones derived from medicinal botanicals [8,9].
Although there are over 3000 plants (70% of natural origin) listed, kudzu and red clover, botanical plants, are well-known for being environment stress-resistant and their ability to induce pharmaceutical and medicinal potentials due to their polyphenols and flavonoids [10]. The phytochemical and pharmacological examination of these plants is of great interest owing to their pharmaceutical potential [11]. The availability of flavonoids and isoflavones as promising bioactive compounds with anticancer, anti-inflammatory, antioxidant, and microbiome modulation activities attracted the scientific community to further investigate their ability to treat cancers [12,13]. These bioactive compounds, particularly isoflavones, also exhibit estrogen-like properties since they show great similarity to 17β-estradiol. Hence, isoflavones became recently commercially available as a dietary supplement in Western countries to alleviate menopause symptoms [14]. Despite the available data in the literature, the antiproliferative and antitumor effects of plant flavonoids are still few.
Development of novel therapeutic anticancer drugs derived from medicinal plants is possible via phytochemical screening of their bioactive compounds. Flavonoids with their groups (isoflavone, flavonol, flavone, flavanone, etc.) are the main bioactive compounds that could be recovered from kudzu flowers (KF) or red clover (RC) [15,16]. Several extraction conditions have been previously employed to recover isoflavones from these plant sources. Recently, eco-friendly extraction technologies were recommended to be utilized to recover flavonoids since they have less toxicity and are safer for biological organisms. The analysis and identification of flavonoids were previously reported using nuclear magnetic resonance (NMR) spectroscopy [17], High-performance liquid chromatography–mass spectrometry (HPLC-MS) [18], and ultra-performance liquid chromatography–mass spectrometry (UPLC-MS) [19]. Notably, previous studies attempted to analyze the flavonoids present in KF and RC using the aforementioned analytical techniques. Despite the successful screening detection of peaks, some analytical systems could be less sensitive, and time-consuming and may produce less satisfactory or low-resolution peaks and, hence, result in false positive results [20,21]. Therefore, in the present study, a high-performance liquid chromatography diode-array detector high-resolution mass spectrometry (HPLC-HRMS and MS/MS) system coupled with quadrupole time-of-flight mass spectrometry (Q-TOF/MS) was adopted to identify the flavonoid peaks in KF and RC fractionated extracts. Moreover, HPLC-DAD was separately adopted to compare the concentrations of isoflavones (daidzein, genistein, puerarin, formononetin, and biochanin A) that correspond to their reference standards. Thus, a comprehensive flavonoid profile was obtained and the expected unknown compounds in the extracts were also determined.
Cytotoxicity of kudzu flower and red clover against GOELL cancers has been so far limitedly reported in the literature. Moreover, the previous studies focused on studying the cytotoxicity of these extracts on ovarian cancer cell lines [22], adenocarcinoma [23], etc. Another study investigated the effect of hydro-alcoholic red clover extract on glioblastoma cell lines (U87MG), but without comparing it with other cancer cell lines [24]. Unlike our previous published paper on kudzu roots and soy molasses on pediatric tumor cell lines [25], this study focuses on analyzing the isoflavones constituents in KF and RC and determining their ability to cause cytotoxicity to human cancer cells in vitro. To our knowledge, we assume that this study, for the first time, investigates the cytotoxic effect of KF and RC ecofriendly obtained extracts on various human cancer cell lines (GOELL).
To this view, this study aims to screen the chemical constituent of the major isoflavones in KF and RC extracts using an integrated establishment of LC–MS library and HPLC-DAD-Q-TOF/MS analysis, which is ideal for analyzing flavonoids including isoflavones, flavones, flavonols, and flavanones. Moreover, the antioxidant activity and total bioactive compounds, including polyphenols and flavonoids were compared. Additionally, we further investigated the cytotoxicity of these extracts on five different cancer cells (GOELL cell lines) compared to the control cells (HEK-293) by determining their IC50 values.

2. Materials and Methods

2.1. Chemicals, Reagents, and Equipment

Daidzein (≥98%), genistein (≥98%), puerarin (≥98%), formononetin (≥98%), and biochanin A (≥98%) as analytical standards were purchased from Sigma-Aldrich (St. Louis, MO, USA). Methanol (99.9%, HPLC grade), formic acid (98.0–100%, Puriss, meets analytical specifications of DAC and FCC), acetic acid and acetonitrile; (99.8%, HPLC grade), (99.9%, HPLC grade); respectively, were purchased from Sigma-Aldrich. Choline chloride (99%; pharmaceutical grade) was purchased from Acros Organics, Geel, Belgium. Citric acid (99%, food-grade) was purchased from Sigma-Aldrich. DPPH (2, 2-diphenyl-1-picrylhydrazyl, gallic acid, and quercetin, were purchased from Sigma-Aldrich. Ethanol and ethyl acetate were supplied by Himreaktiv-snab company, Ufa, Russia. All other provided reagents and chemicals in the present experiment were analytical grade. An ultrasonic cleaner and laboratory centrifuge Elma PE-6926 were utilized for the extraction process. A spectrophotometer Shimadzu-UV 1800 (Chiyoda-ku, Tokyo, Japan) was established for evaluating polyphenols, flavonoids, and antioxidant capacity. A hot dry oven (UN55, Memmert, Schwabach, Germany) was utilized for plant and sample dryness.

2.2. Plant Materials

Kudzu flowers (Pueraria lobata (Willd.) Ohwi) were purchased from Zhong Guan Cun, Beijing, China. Similarly, red clover flowers (Trifolium Pratense L.) were purchased from Parapharm company (Russian Federation). The flowers were oven dried to constant weight at a temperature below 40 °C and further pulverized using an electric blender. The homogeneous powder was sieved by passing through a sieve with 100-mesh and the resulting fine powder was stored at room temperature until subsequent use for the extraction process.

2.3. Preparation of Natural Deep Eutectic Solvents (NADESs)

NADES solvent was prepared as previously described by [25,26] with some modifications. Briefly, NADES was prepared by mixing choline chloride and citric acid (1:2, mol/mol) and 20% deionized water to form a viscous non-homogenous mixture. The mixture was left in a water bath at 80 °C until obtaining a transparent solution. Afterward, NADES was kept at −4 °C until further utilized.

2.4. NADES-Based Ultrasound-Assisted Extraction of KR and SM

An extraction technique assisted with ultrasound was established for the recovery of isoflavones from KF and RC, as described by Duru et al. with few modifications [18]. A certain quantity (approximately 1 g) of plant powder was placed in a beaker and 20 mL of NADES was immediately added. The mixtures were extracted by ultrasound at a frequency of 37 kHz, 180 W powder, and a temperature of 80 °C for 2 h. The bioactive compounds were gradually extracted and released in the suspension. The mixture was allowed to undergo centrifugation for 10 min at 10,000 rpm and the supernatant was separated. Then, supernatants were fractionated three times by ethyl acetate and the resulting upper layers were combined and concentrated. A certain quantity of the fractionated extract was diluted with 1 mL methanol (HPLC grade) and sent for analysis using HPLC-DAD after plotting the calibration curve. The same experimental procedure was carried out in triplicates. Extraction yields (Ey) were calculated as follows:
E y = C b × V s m w
where Cb refers to the concentration of bioactive compounds in plant extracts using HPLC-DAD, Vs refers to the volume of methanol used for dilution, and mw refers to the weight of the test sample.

2.5. Quantitative Determination of Isoflavones Using HPLC-DAD Method

HPLC-Agilent 1260 Infinity II system was established for quantifying five different isoflavones in KF and RC extracts. The system comprises a diode array ultraviolet (UV) detector (Model G7117C) coupled with DAD analysis software, a quaternary pump (Model G7111B), a vacuum degasser module, and an autosampler (Model G7129A) with an integrated column compartment. Isoflavone separation was performed using a reversed stationary phase column A Poroshell 120 EC-C18 (3.0 mm × 100 mm, 2.7 μm, Agilent Technologies, p/n 695975-302 (Santa Clara, CA, USA) with an additional 5 mm guard column. The mobile phase contains solvent A; acetic acid dissolved in water (0.1%, v/v), and solvent B; acetic acid dissolved in methanol (0.1%, v/v). Linear gradient elution of solvent B (5% up to 100%) within 20 min and established for 1.5 min and 0.7 mL/min flow rate. The column temperature was adjusted at 30 °C, and the volume of injection was 5 μL. The peaks of chromatograms for isoflavones were recognized based on the retention times and UV spectra that correspond to the reference standards of daidzein, genistein, puerarin, formononetin, and biochanin A. The calibration curve was plotted with a standard concentration of (0.04–1.6 μg/mL) and linear dependence (R2 ≥ 0.999). A quantitative analysis of the five peaks of isoflavone content in the extracts was performed. The isoflavone yields in KF or RC were expressed in percentage (%).

2.6. Analysis of Isoflavones Using HPLC-ESI-HRMS Method

HPLC-HRMS and MS/MS were used for the determination and identification of the bioactive compounds in KF and KR extracts. Agilent 1290 Infinity II HPLC system used for the identification process was connected with a quadrupole time-of-flight (Q-TOF) accurate mass detector (Agilent 6545 Q-TOF LC-MS, Agilent Technologies, USA). Poroshell 120 EC-C18 (2.1 mm × 100 mm, 2.7 μm, Agilent Technologies, p/n 695775-902) reversed stationary phase column with an additional 5 mm guard column was used for chromatographic separation. The temperature of the column was 50 °C. The mobile phase comprised solvent A; acetic acid dissolved in water (0.1%, v/v), and solvent B, acetic acid dissolved in methanol (0.1%, v/v). Linear gradient elution of solvent B was applied from 5% up to 100 % over 20 min and kept for 1.5 min at a flow rate of 0.4 mLmin−1. The injection volume was 1 μL. The Q-TOF instrument was operated in positive and negative ion modes with electrospray ionization (+, − ESI) source operating the following conditions: drying gas temperature; 350 °C (nitrogen, 10 L/min), capillary voltage; 3500 V, fragmented voltage; 90 V, and nebulizer pressure; 40 psi. In MS/MS mode, the quadrupole was adjusted to isolate precursor ions with a bandwidth of Δ m/z = 1.3. The collision-induced dissociation (CID) spectra of the precursor ions were recorded with collision energy (CE) in the range of 20–60 eV. The collision cell was filled with nitrogen (99.999%). Ions were scanned in the mass range of 100–1000 Da in the MS mode and 40–700 Da in the MS/MS mode. The TOF detector was operated in EDR (2 GHz) mode, and the acquisition was 1.5 spectra/s. The mass spectrometer was adjusted, and the accuracy of mass measurement was automatically corrected based on the instruction manual of the device and recommended standard solutions (Agilent, part. numbers G1969-85000 and G1969-85001).

2.7. Assessment of Antioxidant Activity

The antioxidant capacity was tested by DPPH radical scavenging assay [27]. DPPH solution (3.6 mL, 0.1 mM) was dissolved in methanol and added to 0.4 mL of different concentrations of KF and RC extracts (4–512 μg/mL) or a reference compound, ascorbic acid (4–512 μg/mL). The mixtures were incubated in dark for 90 min, the inhibition percentage was determined at 514 nm the absorbance using a spectrophotometer, Shimadzu-UV 1800. The principle for determining the free radical scavenging activity was based on the decreased optical density (OD) after the reaction. DPPH dissolved in methanol was used as a control and methanol was used as a blank. IC50 for the extracts and the reference compound was determined using GraphPad Prism and the values were shown as mean ± standard deviation (S.D.). The reduction percentage was evaluated using the following formula:
DPPH   Inhibition   ( % ) = OD   ( control )   OD   ( sample ) OD   ( control ) × 100

2.8. Determination of Total Polyphenols

This assay quantifies total polyphenols of KF and RC as previously described by [28] minor modifications. Briefly, an aliquot of diluted extract (0.25 mL) or standard gallic acid (GA) (0–500 μg/mL) solutions was mixed with 0.5 mL of Folin–Ciocalteu solution and 5.5 mL of H2O. After 5 min of incubating the mixture, 1 mL of Na2CO3 (20%, w/v) was immediately added. The mixture was left to react, and absorbance was measured at 765 nm against distilled water (blank) using a spectrophotometer. The total polyphenols were calculated, and the results were recorded as mg of GA equivalents per gram of the extract through the calibration curve of GA.

2.9. Determination of Total Flavonoids

The total flavonoid content (TF) was studied with NaNO2–Al(NO3)3–NaOH colorimetric assay [29] with minor modifications. An aliquot of 0.5 mL of KF or RC extract was mixed with 2 mL of ethanol (30%, v/v) and 0.15 mL of NaNO2 (5%, w/v). After 5 min of reaction, the mixture solution was allowed to react with 0.15 mL of Al(NO3)3 (10%, w/v) at room temperature for 6 min. Then, NaOH (2 mL, 1 M) was added, and the mixture was adjusted up to 5 mL with 0.2 mL of ethanol (30%, v/v). The resulting mixture was incubated for 10 min at room temperature, and the absorbance was determined at 510 nm. The blank sample was prepared by substituting Al(NO3)3 and NaOH solutions with 2.15 mL ethanol (30%, v/v). Quercetin was utilized as a standard and TF was recorded as mg of equivalent quercetin per gram of the extract (mg QEe/g).

2.10. Assessment of In Vitro Biological Activity

2.10.1. Culturing of Cell Lines

Human glioblastoma cells (A-172, ATCC CRL-1620), human osteosarcoma (HOS, ATCC CRL-1543), human embryonic rhabdomyosarcoma (Rd, ATCC CRL-136), human lung carcinoma (A-549, ATCC CCL 185), human liver carcinoma (HepG2, ATCC HB-8065) and human embryonic kidneys (HEK-293, ATCC CRL-1573) were supplied by the Collection of Vertebrate Cell Cultures, Institute of Cytology, Russian Academy of Sciences (St. Petersburg, Russia). HEK-293 was used as a free cancer cell line (control). Cells were cultured under standard conditions at 37 °C, 5% CO2 atmosphere, and 98% humidity and supplemented with DMEM/F-12 based medium (Gibco™, Thermo Fisher Scientific, Waltham, MA, USA) and 10% fetal bovine serum (FBS). Subculturing with a solution of trypsin 0.25% was carried out when the culture reached ≥90% confluence. Cisplatin was used as a positive control.

2.10.2. Cell Viability Assessment

KF and RC extract at varying concentrations (4, 8, 16, 32, 64, 128, 256, and 512 μg/mL) dissolved in DMSO (≤1%) were grown in DMEM/F-12 culture medium with fetal bovine serum (10%). Tumor cells were seeded in 96-well plates at a density of 4 × 10³ cells per well. After pre-cultivating plant extracts overnight in a given concentration range, the cells were inoculated into the wells of the tablet. Then, the cells were further incubated for 72 h and 20 μL of MTT (3-(4,5-Dimethyl-2-thiazolyl)-2,5-diphenyl-2H-tetrazolium bromide) was inoculated into the cultures at a concentration (5 mg/mL). Two hours later, the medium and MTT were removed and replaced with 200 μL of absolute DMSO and isopropanol, at a ratio of 1:1. Optical density (OD) was determined on a microplate spectrophotometer at a wavelength of 570 nm.
Viability   % = OD   ( sample ) OD   ( blank ) OD   ( intact   cell ) OD   ( blank ) × 100

2.10.3. Observation of Morphological Changes

  • Dual AO/EB Fluorescent Staining
The plasma membrane of living, apoptotic and necrotic cells have varying degrees of permeability to some fluorescent dyes. The study of the ratio of viable and dead cells was carried out by staining with a mixture of fluorescent dyes acridine orange (AO) and ethidium bromide (EB). Cells of the HOS and Rd lines were planted in Petri dishes the day before the application of the test substance and were incubated under conditions of 5% CO2, t = 37 °C, and 95% humidity for 24 h. Then suspensions of the studied compounds were introduced in a culture medium at a concentration of 64 μg/mL, while one of the Petri dishes was used as a control with intact cells. The cells were incubated for 72 h, then removed, and deposited by centrifugation at 200× g for 5 min. Cell precipitate was resuspended in 25 μL of phosphate buffer. The study of the ratio of viable and dead cells was carried out by staining with a mixture of fluorescent dyes vital acridine orange (AO) and ethidium bromide (EB), at concentrations of 5 μg/mL and 15 μg/mL, respectively. 10 μL of stained cell suspension was immediately, thereafter, placed on a pre-prepared slide, covered with a coverslip, and immediately analyzed under a fluorescence microscope (OPTIKA, Ponteranica, Italy) at 100× magnification.
  • Giemsa staining
A cytological method of staining for studying the morphological changes in cells when exposed to extracts was carried out. Cells of the HOS and Rd cell lines were cultured in Petri dishes with a diameter of 35 mm the day before application of the test substance and incubated under conditions of 5% CO2, t = 37 °C, and 95% humidity for 24 h. Then, the suspensions of the test compounds were introduced in a culture medium at a concentration of 64 μg/mL, while one of the Petri dishes was used as a control with intact cells. The cells were incubated under conditions of 5% CO2 content, t = 37 °C, and 95% humidity for 72 h. The cells were then fixed with a 10% solution of formaldehyde and slides were prepared and stained with Giemsa staining mixture. The cells were then observed for morphological changes using a light microscope (OPTIKA, Italy) at 100× magnification.

2.11. Statistical Analysis

All extractions were carried out three times, and all measurements were evaluated in triplicates. Values are expressed as mean ± standard deviation. All the results were analyzed at a 95% significance level (p < 0.05) using GraphPad Prism 9.4.1 software (San Diego, CA, USA. Correlation analysis between values was performed using Pearson’s correlation at a significance level (p ≤ 0.01). Analysis of in vitro biological activities was carried out by RStudio program (11 July 2022 © 2009–2022 RStudio, PBC) using the R package (version 4.2.1). The data in the diagrams are represented as sample averages ± confidence interval, 95% (CI95). Cytotoxicity index (IC50) is calculated with the creation of dose-response curves using the “drc” package to obtain the equation for the resulting sigmoidal curve of the model [30].

3. Results and Discussion

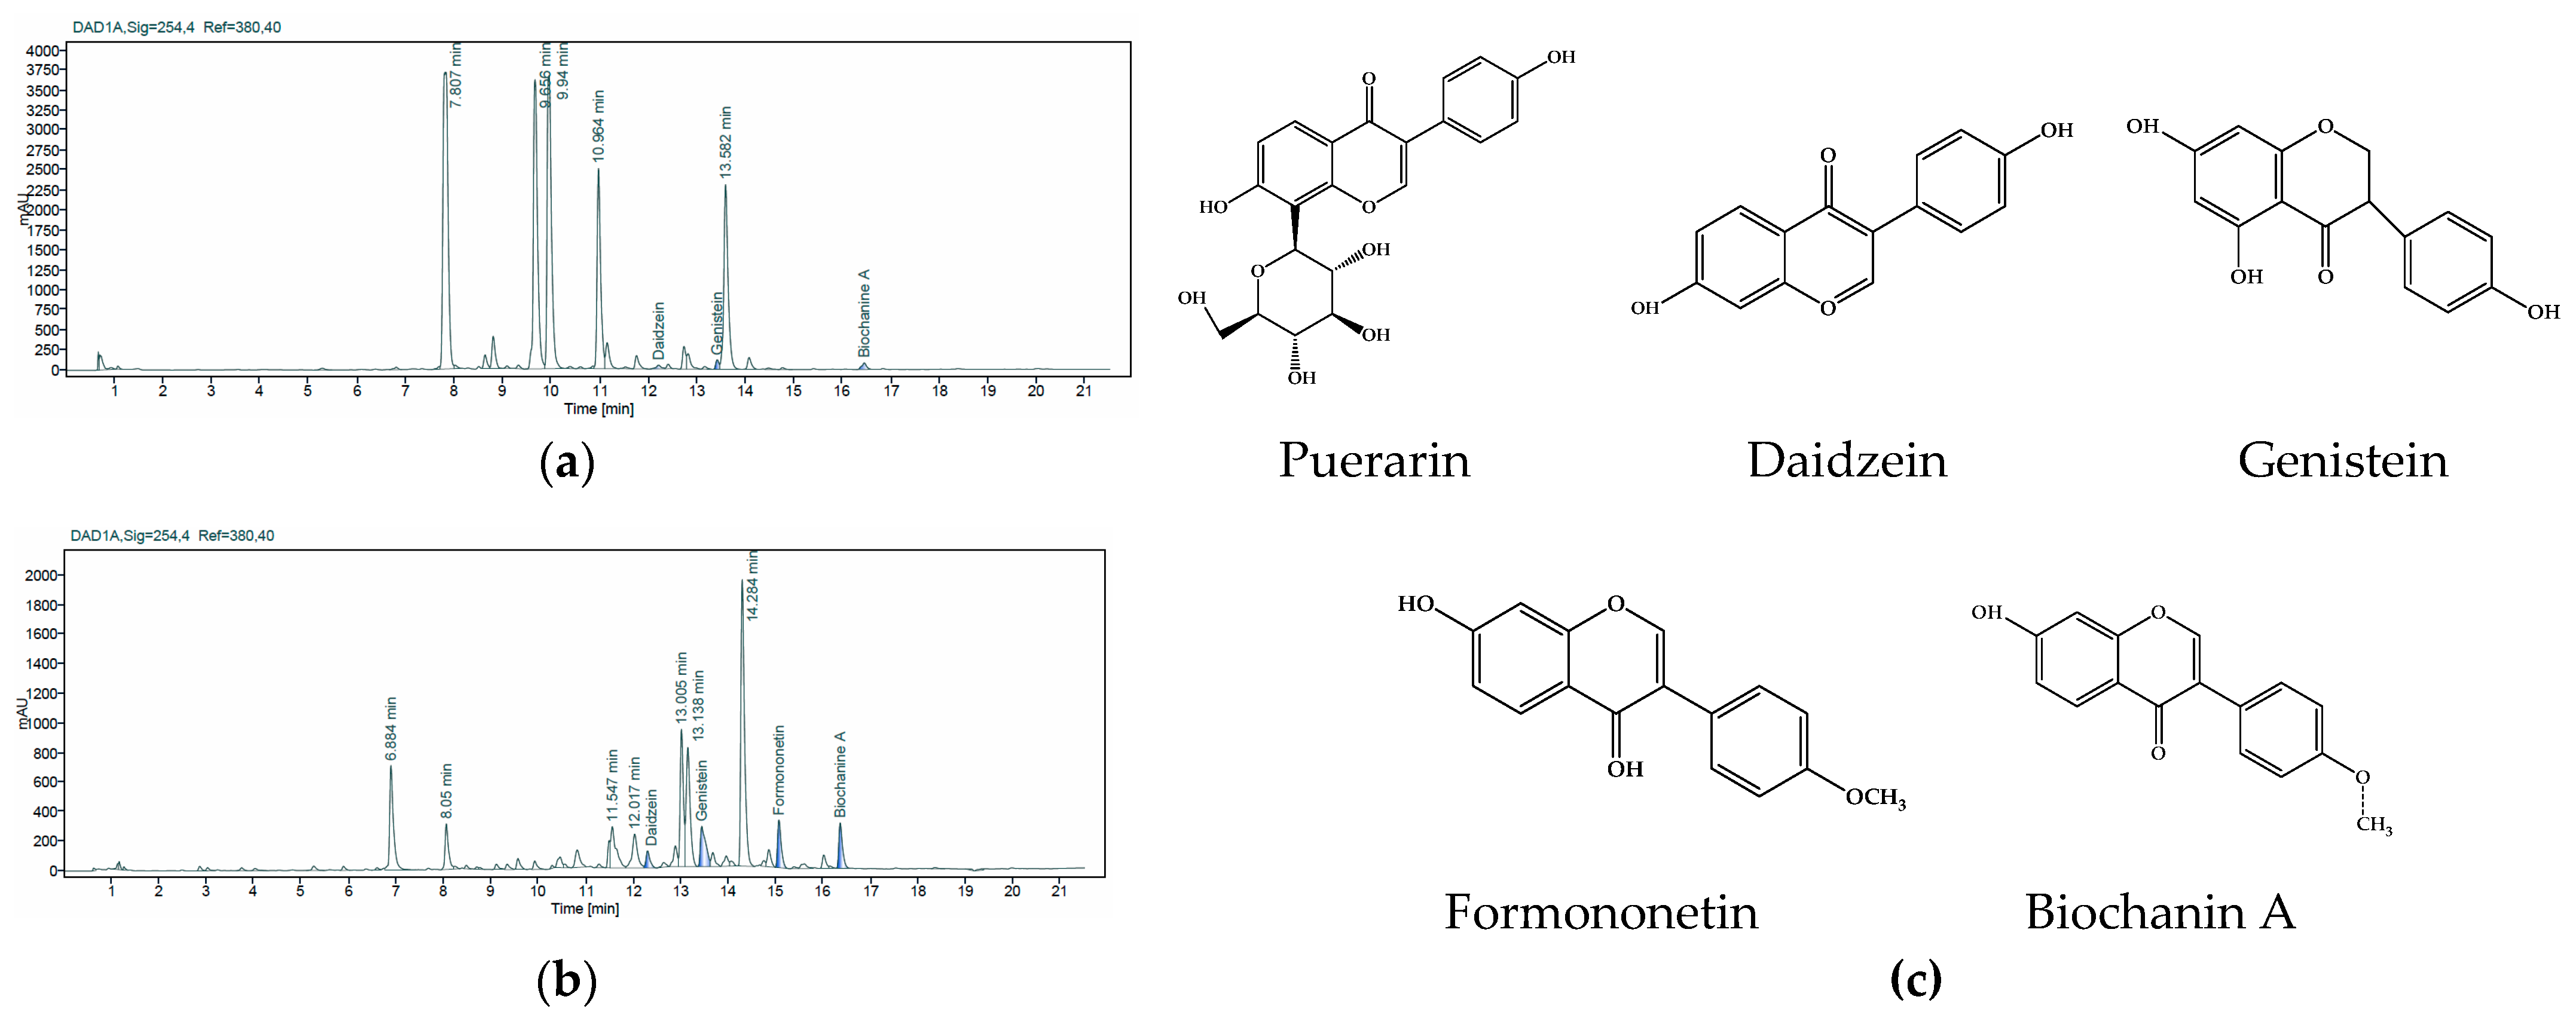
3.1. Identification and Quantification Isoflavones Present in KF and RC Using HPLC-DAD

An eco-friendly extraction technique was selected to recover the isoflavones from both kudzu and red clover flowers. Figure 1 elucidates the individual chromatograms and chemical structure of the identified isoflavones in the flowers using HPLC-DAD analytical method. Previous literature stated that the use of green solvents is more efficient than traditional solvents for extracting bioactive compounds from plants [31]. Thus, conventional techniques have been gradually substituted by deep eutectic solvents, ultrasound, microwave-assisted extraction, supercritical fluid extraction, etc., accounting for their extraction efficiency, shorter time, less waste and energy, and minor side effects [32]. In the present study, choline chloride-bases-NADES exhibited efficient extraction yield of isoflavones without the utilization of other organic solvents such as methanol, ethanol, hexane, etc. [33]. According to HPLC-DAD analysis, three compounds (daidzein, genistein, biochanin A) were identified in the extract of KF, while four individual isoflavones were identified in RC extracts. All compounds were identified and quantified by comparing their retention time and UV with commercially standard compounds. Puerarin was surprisingly not detected in both extracts, whereas formononetin was detected only in the RC extract. This was the reason why RC has slightly higher concentrations of total isoflavones (0.74 ± 0.007%) than KF (0.59 ± 0.091%) as shown in Table 1. Daidzein (0.31 ± 0.007%) and formononetin (0.29 ± 0.007%) exhibited the highest concentrations among the other isoflavones in KF and RC, respectively. These results are in agreement with the previous literature where daidzein and puerarin were found to be predominant in KF and formononetin and biochanin A were predominant in RC flowers [34,35]. Nevertheless, the absence of puerarin in the extracts may have resulted from the minor modifications in the extraction conditions or the smaller size of samples. Therefore, it is still warranted to optimize the eco-friendly extraction conditions of isoflavones using a design of the experiment (DOE) such as response surface methodology (RSM). It is noteworthy that our values for the accuracy and precision of the HPLC-DAD method were acceptable for the analytical measurements of the major isoflavones identifies (data not shown) [18]. Despite the quantification of isoflavones based on their retention times and peak areas using HPLC-DAD, the chromatograms showed evidence of the presence of some other unidentified bioactive compounds in the extracts. Herein lie the benefits of HPLC-HRMS analytical characterization since the mass spectra could represent the identity of each other unknown peaks.

3.2. Identification and Quantification of Bioactive Compounds Using HPLC-HRMS and MS/MS Analysis

The combination of HPLC with high-resolution tandem mass spectrometry (HRMS) was used for the detection and preliminary identification of more flavonoids in the prepared extracts than was possible with the available standard samples (daidzein, genistein, puerarin, formononetin, and biochanin A). HPLC-HRMS is often used in the chemical research of herbal drugs due to its rapid separation capability with higher peak resolution and low limit of detection. Fragment ions in MS/MS spectra can provide useful information for the structural identification of herbal components [36,37,38,39]. In our analysis, we used the approach implemented in the previous report [25]. Identification of individual flavonoids in extracts was based on accurate mass measurement values, including MS/MS experiments, comparison of obtained MS/MS (CID) spectra with data from spectral databases [40,41,42,43] and literary sources [44,45,46,47,48,49,50], as well as on the detailed interpretation of the spectra. For MS/MS experiments and subsequent identification using the instrument software, major compounds with fairly intense chromatogram signals (peak response greater than 5 × 10³ counts) and their calculated gross formula corresponding to the elemental composition of CxHyOz with an error of no more than 5 ppm were selected.

3.2.1. Identification and Quantification of Bioactive Compounds in KF

Fifteen major compounds were detected in kudzu flower extracts by HPLC-HRMS, for which retention times, gross formulas, and tentative identification results are summarized in Table 2. The chromatographic peak area of genistein was conventionally taken as 100% in Table 2 to approximate the content of the detected flavonoids. The isoflavones genistein, biochanin A, and daidzein (compounds 1i–3i, Table 2) were identified using standard samples based on CID spectra and retention times.
The presence of the glycoside form of genistein (compound 4i) in the extract was established using CID spectra, as previously described [25]. The glycoside form of genistein is also present in the extract. The CID spectrum (Figure S1) of the compound 4i ([M–H] = 431.0984) obtained at low collision energy (20 eV) demonstrated an intense signal of the Yo ion (m/z 269.0455), corresponding to the loss of glycan residues C6H10O5 (162 Da). These findings confirmed the attachment of hexose to aglycone in the hydroxyl group [49]. The [Yo–H]−● ion (m/z 268.0377) formed as a result of the homolytic C–O bond cleavage showed a high-intensity signal in the spectrum, which allowed us to hypothesize the structure of 7-O-glycoside [48,51]. In addition, the spectrum showed signals of ions formed as a result of bond breaking in the glycosidic part of the molecule: 0.2X (m/z 311.0561, [M–H–C4H8O4]) and 0.1X + 2H (m/z 283.0612, ([M–H–C5H8O5]) [51]. When the collision energy increased, the relative abundance of the radical anion signal [Yo–H]−● increased, and simultaneously, [Yo–2H] ion (m/z 267.0299) signals appeared in the spectrum (Figure S2). Fragment ions with m/z values such as 240.0428, 239.0350, 224.0479, 223.0401, and 211.0401 formed as a result of the sequential elimination of CO and CO2 from the corresponding aglycon ions Yo and [Yo–H]−● were also observed in the spectrum. The spectrum demonstrated diagnostic ions for genistein s[0.3B–H]−● (m/z 132.0217) and 0.3B- (m/z 133.0295), formed as a result of the RDA reaction [51]. A library search also showed a high similarity of the spectrum with that of genistin [40,43].
The genistein isomer with a longer retention time (compound 1f, Table 2) was tentatively identified as apigenin using spectral bases [40,42,43] and literature data [44,52,53,54]. The key difference between the CID spectra of isomer 1f and genistein in the negative ion mode is the nature of retro-Diels–Alder (RDA) fragmentation. The 1f spectra (Figures S13 and S14) contain typical peaks of flavones (Figures S13 and S14) of ions [1.3A] (m/z 151.0037), [0.2A] (m/z 149.0244) and [1.3B] (m/z 117.0346), whose signal dominates in the spectra when the collision energy increases, which is characteristic of apigenin [44].
Another flavone, luteolin (2f), was similarly identified, and its spectra are available in the databases [40,42,43] and are discussed in detail in the literature [44,48]. Similarly, to apigenin, the spectra of compound 2f show characteristic neutral losses CO2, C3O2, CO, and C2H2O, and RDA fragmentation lead to the formation of ions [1.3A] (m/z 151.0037), [1.3A–CO2] (m/z 107.0139) and [1.3B] (m/z 133.0295), whose abundance was maximal at high values of collision energy.
With the help of spectral bases [40,41,42,43] an isomer of luteolin, kaempferol (1fl), was also identified; RDA ion signals were observed in the CID spectra (Figures S17 and S18) as well as signal ions [M–H–CO] (m/z 257.0455), [M–H–CO2] (m/z 241.0506), [M–H–2CO] (m/z 229.0506) and [M–H–CO–CO2] (m/z 213.0557), whose formation was associated with sequential neutral losses from the C ring of the flavonol molecule, which are characteristic of flavonols [44,48]. When the collision energy rose to 40 eV, each of these four ions lose two protons, which lead to the appearance of the corresponding intense signals in the spectrum, and the ion [C6H5O] (m/z 93.0346), formed as a result of breaking the bond between the C and B rings of the molecule, has the maximal signal in the spectrum [53].
Another isomer with the gross formula C15H10O6 (5i), is probably a derivative of genistein containing an additional hydroxyl group in the A ring. This assumption is supported by the presence of ion signals [0.3B] (m/z 133.0295), [1.3B] (m/z 117.0346), [1.3A–CO2] (m/z 123.0088) and [0.3A] (m/z 151.0037) in spectra (Figures S3 and S4) obtained in the negative ion mode [53]. In the spectra recorded in the positive ion mode, there are signals of ions corresponding to the double loss of the CO (m/z 259.0601 and m/z 231.0652) and RDA fragmentation product signals [1.3A]+ (m/z 169.0131), [1.3A–4]+ (m/z 165.0182) и [1.3B]+ (m/z 119.0491), which confirms the proposed structure of isoflavone [15]. Compound 5i is also present in the form of a glycoside (6i), which is confirmed by the presence in spectra (Figures S5 and S6) of the Yo (m/z 285.0405) ion, corresponding to the loss of glycan residue C6H10O5 (162 Da) [48,49].
Dihydrokaempferol (2fl) was tentatively identified based on the spectral database [40,42] and the presence in spectrum (Figure S19) of RDA ion signals [1.3A] (m/z 151.0037) and [1.4A] (m/z 125.0244) [45]. The presence of the flavanone naringenin (1fn) in the extract was established using spectral bases [40,42,43]. It can also be identified by complementary RDA ion signals (Figure S20) [1.3A] (m/z 151.0037) and [1.3B] (m/z 119.0502) [48,53].
The KF extract contained three compounds with the gross formula C16H12O6. Among them, the isoflavone tectorigenin (7i), identified using spectral bases, had the largest chromatographic peak area [42,43]. In the spectrum of 7i (Figure S7), is observed the methyl radical release, characteristic of methoxylated isoflavones, with the formation of a radical anion [M–H–CH3]−●, which further fragmented with the subsequent loss of H, CO, and CO2 [46,50]. Along with this, intense RDA ion signals [0.3B] (m/z 133.0295) and [0.3B–H]−● (m/z 132.0217) are present. The other two compounds (8i and 9i) appear to be isomers of tectorigenin by the position of the methoxy group in the A ring since they have similar fragmentation directions (Figures S8 and S9).
Along with this, tectoridine (10i), which is a 7-O-glycoside form of tectorigenin, was detected. The spectra (Figures S10–S12) contain signals of ions Yo (m/z 299.0561), corresponding to the loss of glycan residues C6H10O5 (162 Da), [Yo–CH3]−● (m/z 284.0326), [Yo–H–CH3] (m/z 283.0248) and [Yo–H–CH3–CO] (m/z 255.0299) and are in good agreement with the data in the literature [47,49] and NIST spectral database [40].
There is some previous literature that discussed the analytical screening of phenolic compounds present in KF. The phenolic compounds in KF were shown to be mainly recovered using conventional solvents (ethanol, methanol, etc.) and analyzed by different analytical methods (HPLC-MS [55], HPLC-HSCCC [56], UPLC-QTOF/MS [19], NMR [57], PLC-FT-ICR MS [50], etc.). Anyway, the results from this literature showed great variance in the number and types of bioactive compounds identified according to the source of plant, method of analysis, and extraction conditions. However, none of the previous reports investigated the eco-friendly extracted flavonoids using HPLC-HRMS/MS. We assume that our methodology efficiently recovered flavonoids compared to the conventional methods of extraction [58]. Notably, the identification of isoflavones, flavones, flavonols, and flavanones is in agreement with the previous literature [59]. Nevertheless, unlike previously published, [19] saponins were not identified in our KF extract. This could be due to the small sample size used for extraction or could be misidentified while filtering the unrecognized spectral peaks. Therefore, future studies are still warranted to isolate the fractioned mixture compounds recovered from kudzu flowers using these methodologies.

3.2.2. Identification and Quantification of Bioactive Compounds in RC

Eight major compounds were detected in the RC extract by HPLC-HRMS for which the retention times, gross formulas, and tentative identification results are summarized in Table 3. The chromatographic peak area of formononetin was conventionally taken as 100% in Table 3, to approximate the content of the detected flavonoids. The isoflavones formononetin, genistein, biochanin A, daidzein, and puerarin (compounds 1ir–5ir, Table 3) were also identified using standard samples based on CID spectra and retention times.
The flavones kaempferol and dihydrokaempferol were identified using CID spectra similar to those described above. Quercetin (3fl) was previously identified using spectral bases [40,42]. CID spectra (Figures S21 and S22) contain signals of ions [M–H–CO] (m/z 273.0405), [M–H–CO2] (m/z 257.0455), [M–H–2CO] (m/z 245.0455) and [M–H–CO–CO2] (m/z 229.0506), as well as quercetin-specific RDA ion signals [1.2A] (m/z 178.9986), [1.2B] (m/z 121.0295), [1.2A–CO] (m/z 151.0037) and [1.2A–CO–CO2] (m/z 107.0139) [44,48].
Similar to KF, RC has been extensively studied in literature and its chemical profile was analyzed using different screening methodologies such as RPLC [60], LC-MS and HPLC-UV [60], and recently by qHNMR, and UHPLC-UV [61]. Unlike KF, only isoflavones and flavonoids were identified in RC fractionated extract. Importantly, there have been over 30 compounds qualitatively fragmented by HPLC-HRMS (data not shown), but some of them were not recognized by the library. Therefore, our data is highly comparable with the previously published literature where lignans, coumarins, and clovamides were identified. Although only eight compounds were identified in RC by HPLC-HRMS, our data, to some extent, agrees with previously reported screenings where isoflavones (daidzein, genistein) and flavonoids (kaempferol, quercetin) were recognized [62]. Similar to KF, the variations of analytical methodology, extraction conditions, and seasons when the plant was harvested may result in a highly comparable analytical screening of the available bioactive compounds. Nevertheless, the analysis of flavonoids recovered using our green extraction technology have not been previously reported. The isolation of individual compounds from red clover extracts and setting a standardized protocol for screening their bioactive constituent could assist in the full screening of the chemical profile of red clover compounds and is highly recommended to be put on the research agenda.

3.3. Antioxidant Activity and Total Bioactive Compounds

In the present study, the antioxidant activity, total polyphenols, and total flavonoids of KF and RC were determined. The assessment of the scavenging activity of each sample was performed using DPPH assay. As shown in Table 4, Kudzu flower fractionated extract was found to have significantly higher radical scavenging activity with an IC50 of 28.17 µg/mL than RC extract with an IC50 of 42.86 µg/mL. Nevertheless, both extracts exhibited moderate DPPH scavenging activity with an IC50 approximately 10 times higher than the IC50 of the reference compound, ascorbic acid (Table 4). The higher values for antioxidant capacity of both samples represent the accumulation of bioactive compounds in the extracts and, hence, possess potential cytotoxicity that is discussed further. Previous literature also has reported similar findings. For instance, numerous studies have recently revealed that fractions of KF exhibited strong DPPH scavenging activities [63]. Similarly, RC clover extract obtained using conventional extraction technology was shown to reveal radical scavenging capacity and reduce DPPH radicals [64,65]. Free radicals may cause tissue damage and delay the recovery of inflamed cells. Thus, the antioxidant activities of KF and RC extracts and their bioactive compounds would be beneficial for reducing the risk of diseases such as cancer.
Additionally, both KF and RC comprise a variety of phenolics and flavonoids [62,66]. Phenolic compounds and, among them, flavonoids are known for their efficient radical scavenging capacity resulting from the hydroxyl groups (OH) at different positions and the ortho-dihydroxy structure in their B ring [67]. A plethora of investigations has shown that phenolic compounds contribute significantly to antioxidant activities [68]. Despite the low number of values, it seems the higher antioxidant activity of KF extract could be attributed to the TP and TF (p ≤ 0.01) according to Pearson’s correlation analysis. The values here could be having some limitations since a low number of values was used for the comparison and a single experimental methodology for antioxidant activity was employed. Nonetheless, the replicates of our samples and further investigations of the cytotoxicity of extracts may improve and support these outcomes.

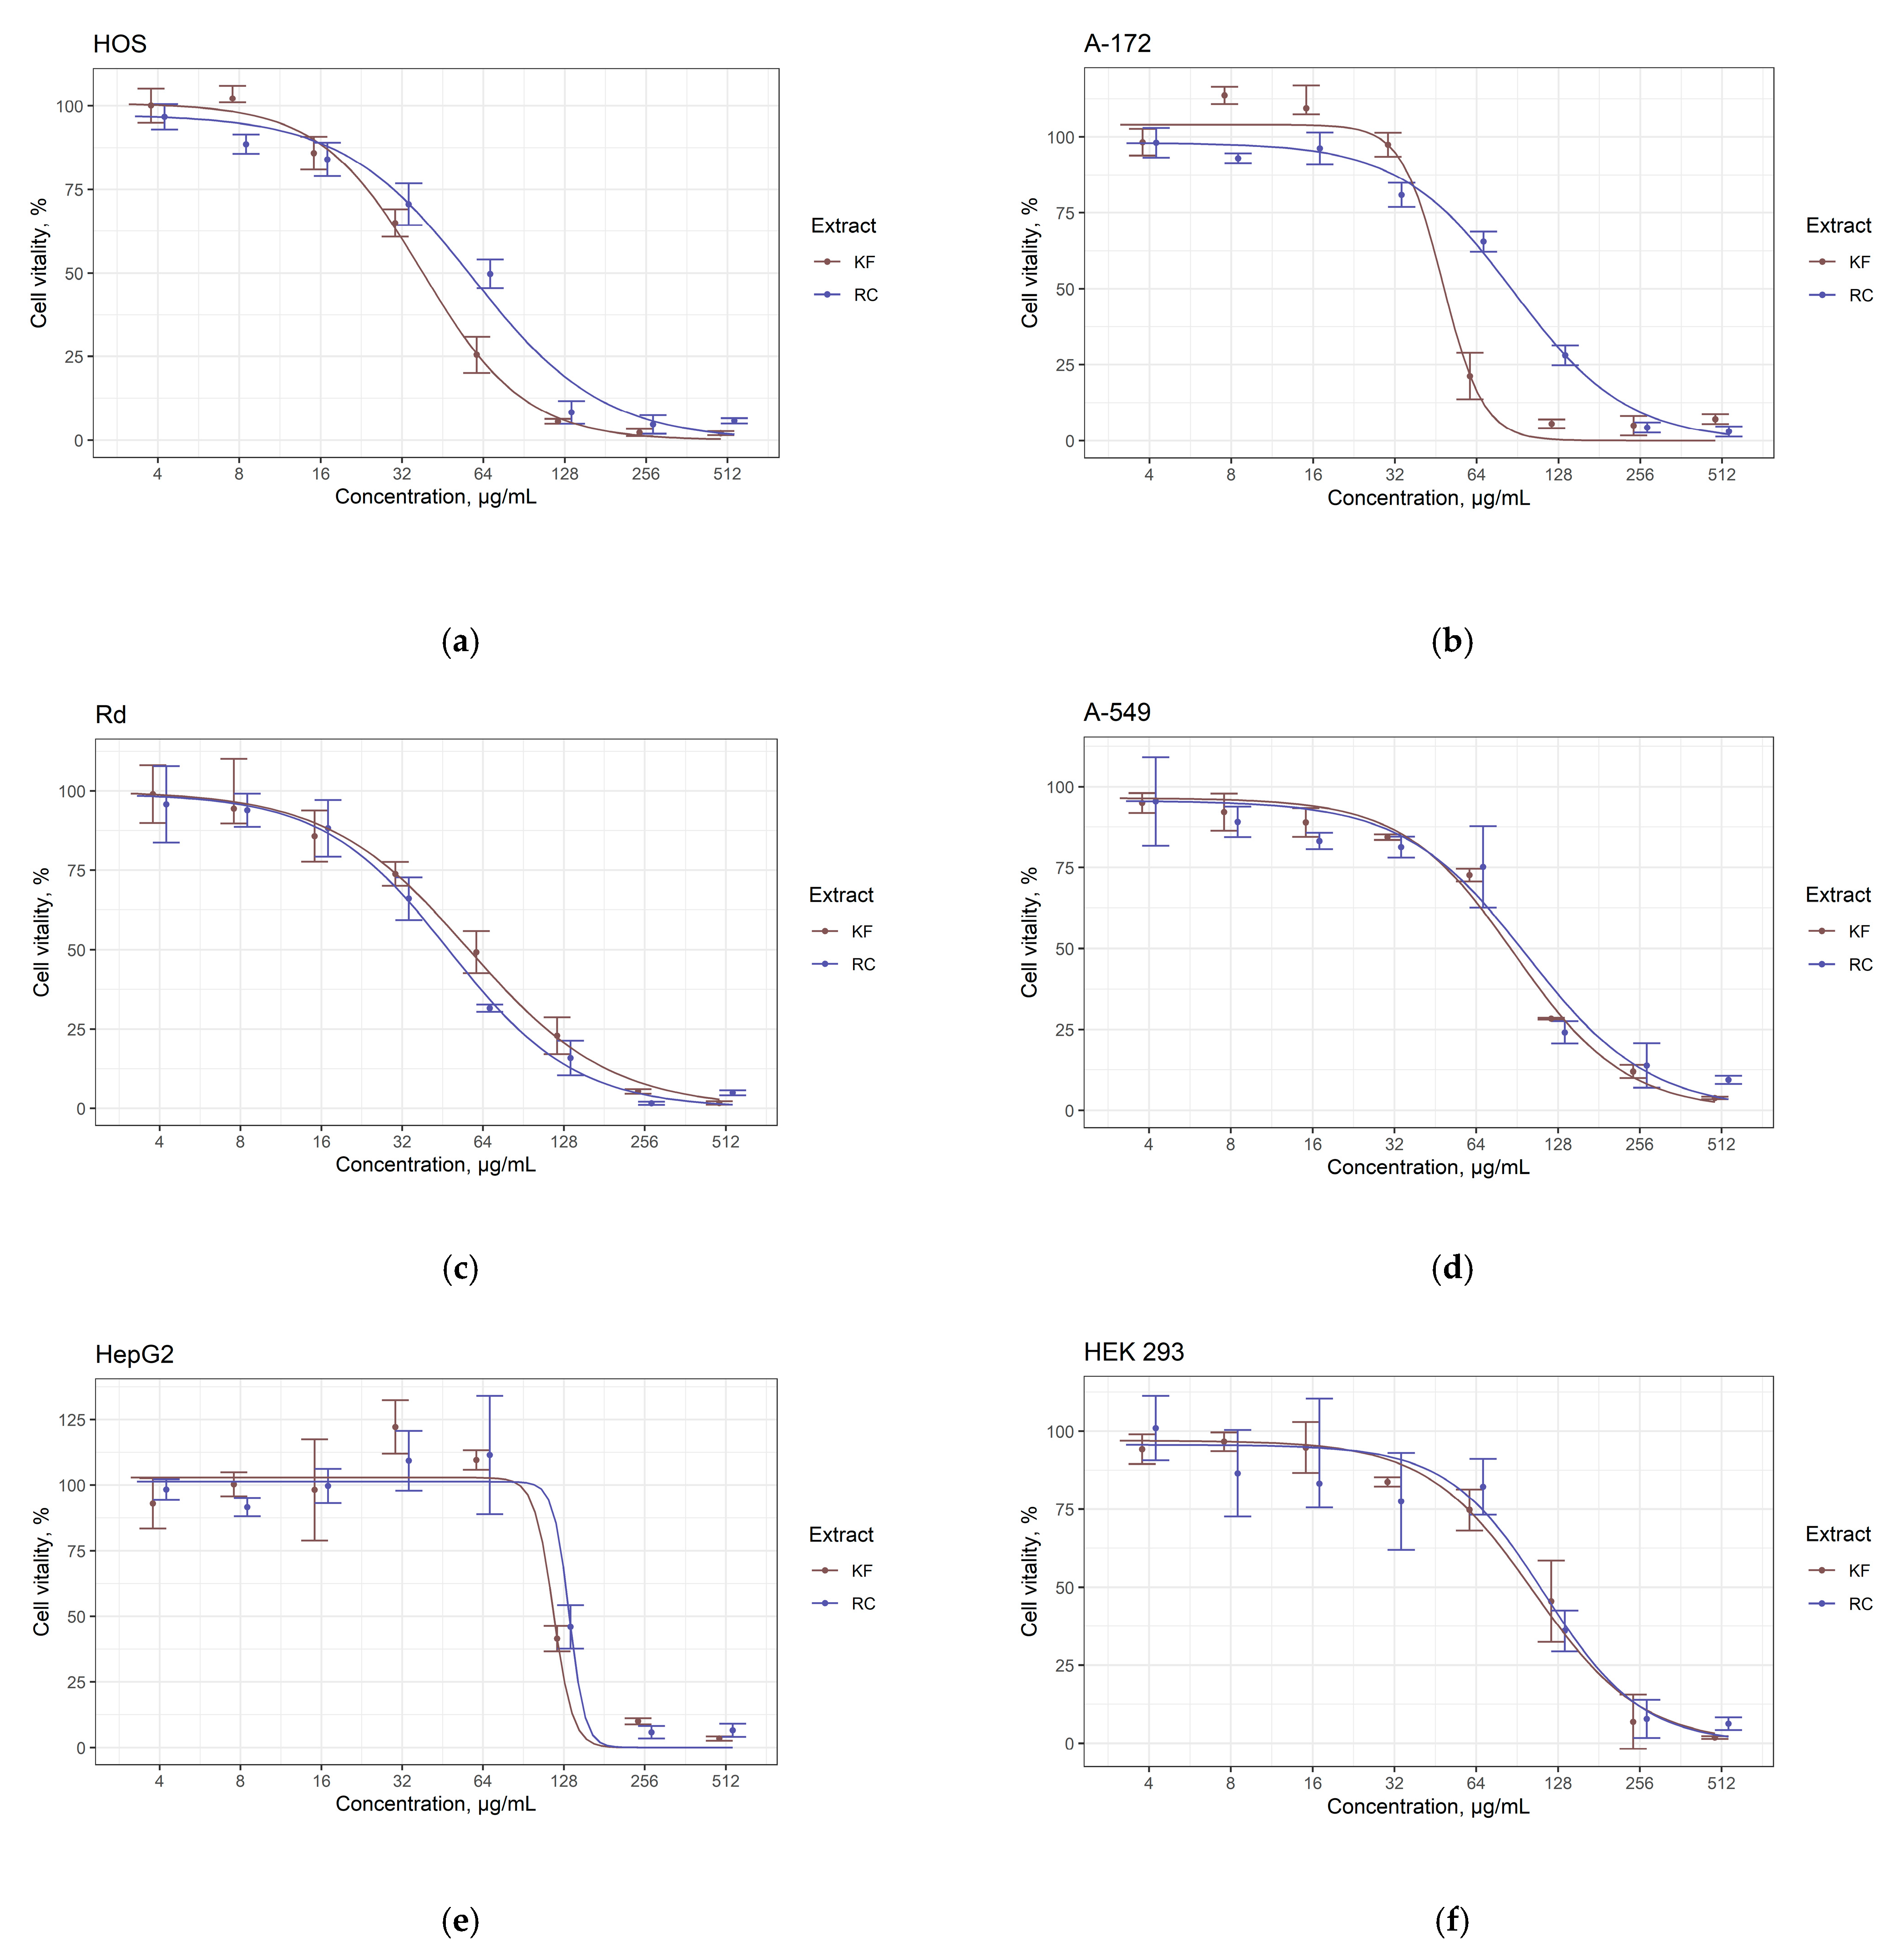
3.4. Cytotoxicity Activity of KF and RC Extracts on Different Cancer Cell Lines

In the current study, the effects of fractionated KF and RC extracts were investigated in different human cell lines. MTT assay was used to predetermine the antiproliferative properties of the fractionated extracts. The reduction of tetrazolium salt into a colored formazan product under the action of mitochondrial dehydrogenase of viable cancer cells allowed us to evaluate IC50 using a spectrophotometric method after dissolution. The IC50 value was referred to as cytotoxicity.
Thus, the present study revealed the cytotoxicity of KF and RC extracts on human cancer cells (GOELL). As shown in Table 5, the values of IC50 of both extracts fell within the range of 40 to 124 μg/mL. Meanwhile, cisplatin, which is considered a first-line therapy against many types of cancers, demonstrated pronounced toxic properties even at the minimum studied concentration of 4 µg/mL. Holm multiple comparisons following one-way ANOVA showed that both extracts were significantly different from cisplatin (p < 0.001) in all cell lines (Table 5). The most pronounced cytotoxic action of the extract was detected in HOS and Rd cell lines. Additionally, IC50 values of HOS and Rd cancer cell lines were found to lie within the extract concentration of 40–60 μg/mL. These values are comparable to that of the remaining cell lines including HEK-293 cells where IC50 values were recorded higher than 60 μg/mL. Compared to RC extract, KF exerted a greater non-significant antiproliferative effect in decreasing the proliferation of HOS cell lines. This was not the case in the case of Rd cancer cell lines where RC induced a non-significant antiproliferative effect against Rd than KF. Interestingly, both cell lines belong to the sarcoma group. In general, the results of IC50 for both extracts between different cell lines are comparable.
Surprisingly, IC50 values of HepG2 cell lines were found greater than that of the counterpart control cell lines (HEK-293), which reflects the resistance of HepG2 cell lines to the flavonoid-rich extracts even after exposure to the extracts for 72 h. Nevertheless, there was a remarkably sharp decline in the viability of HepG2 cell lines at approximately extract concentrations of 100 μg/mL (Figure 2e). This characteristic feature in HepG2 cell lines was not observed in the other cell lines, despite having lower IC50. In general, cytotoxicity curves are elucidated in Figure 2a–f where it was found that both KF and RC extracts were able to exert antiproliferative effects in most cancer cell lines in a dose-dependent manner.
A previous study reported that Pueraria lobata extracts reduced ethanol-induced cytotoxicity in HepG2 Cell (57% cell viability), and exhibited cytotoxicity against breast cancer (MCF7) and A549 cancer cell lines [69]. Another research on another Pueraria species (Pueraria tuberosa) revealed significant cytotoxic of its extract against HepG2 cell lines with IC50 (69 μM) [70] and human ovarian cancer cell line A2780 [22]. Similarly, RC extract was documented to show cytotoxicity against glioblastoma multiforme cell line (U87MG) [24], and human breast cancer cell lines (MCF-7 and MDA-MB-231) [71,72]. To our knowledge, no previous reports on the cytotoxicity of RC on GOELL cancer cell lines.
The present study has some limitations since cytotoxicity was assessed on a mixture of bioactive compounds, not purified compounds, which in turn may interact with each other or/and exhibit different mechanisms of action. Irrespectively, cells of malignant neoplasms of mesenchymal origin may have a greater sensitivity to the extracts under study, but this hypothesis requires additional experimental verification. Overall, it is suggested that further study on the isolation of the individual compound of KF and RC extracts and analyze their cytotoxic effect on various cell lines. Based on the cytotoxicity results, Rd and HOS cancer cell lines exhibited the lowest IC50 among other cell lines owing to the effect of KF and RC flavonoid-rich extract. Therefore, Rd and HOS cancer cell lines were selected for further experiments for morphological observation.

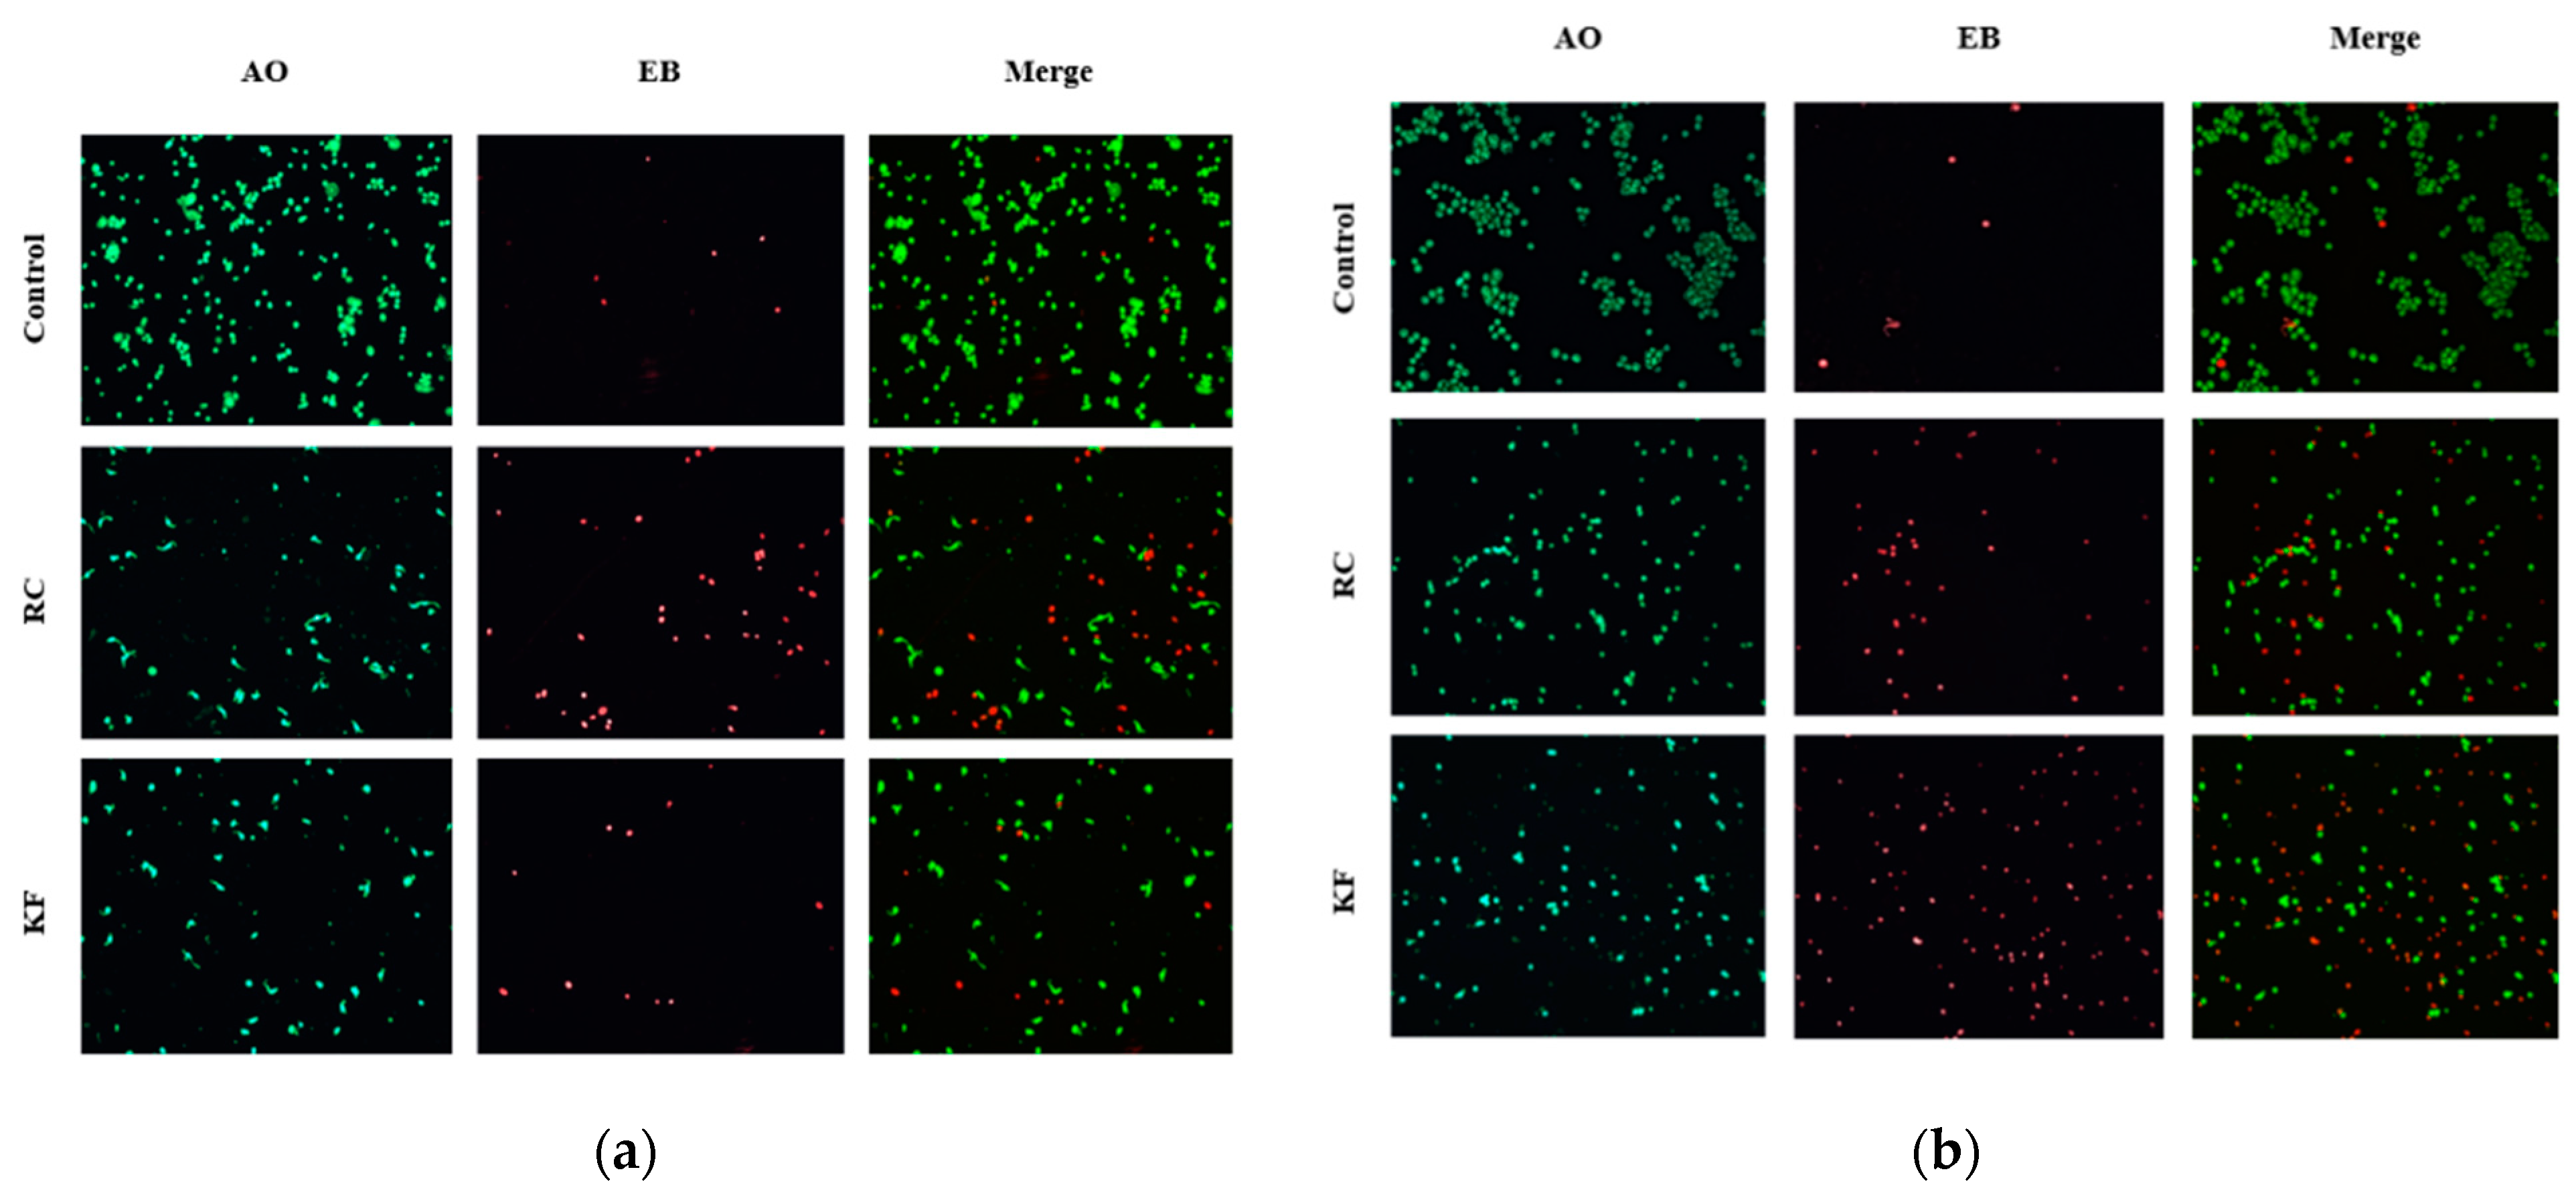
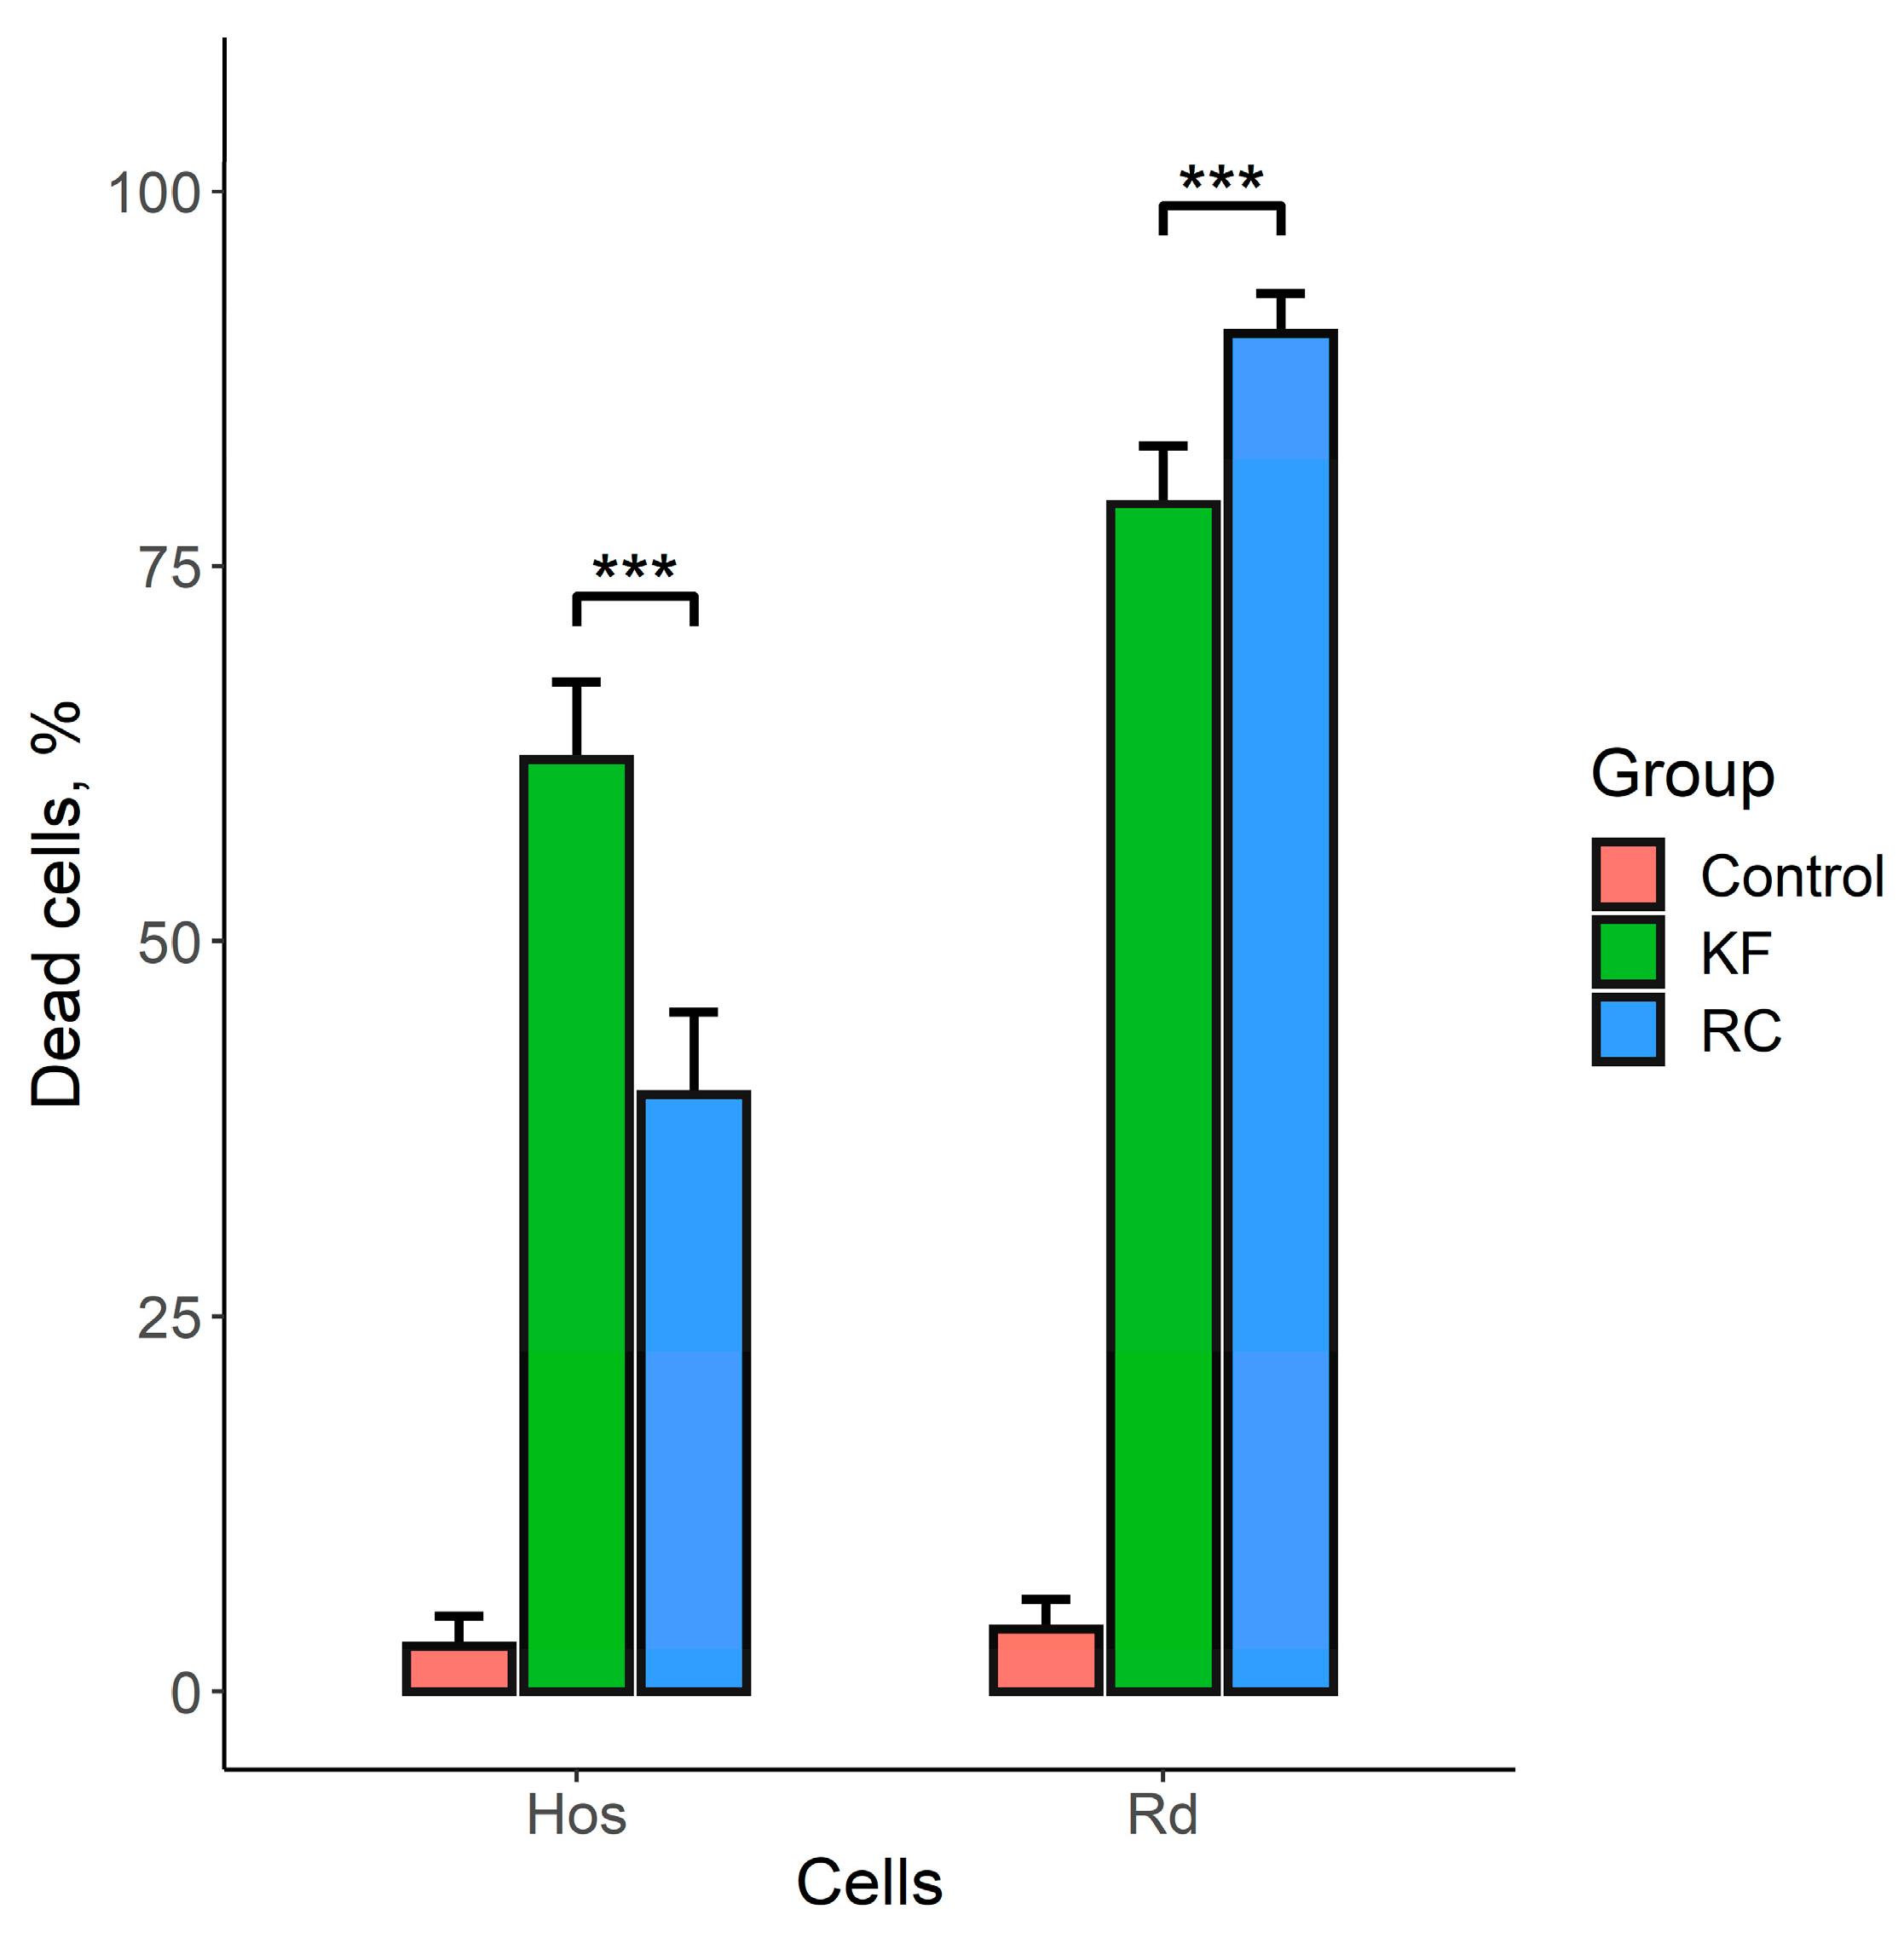
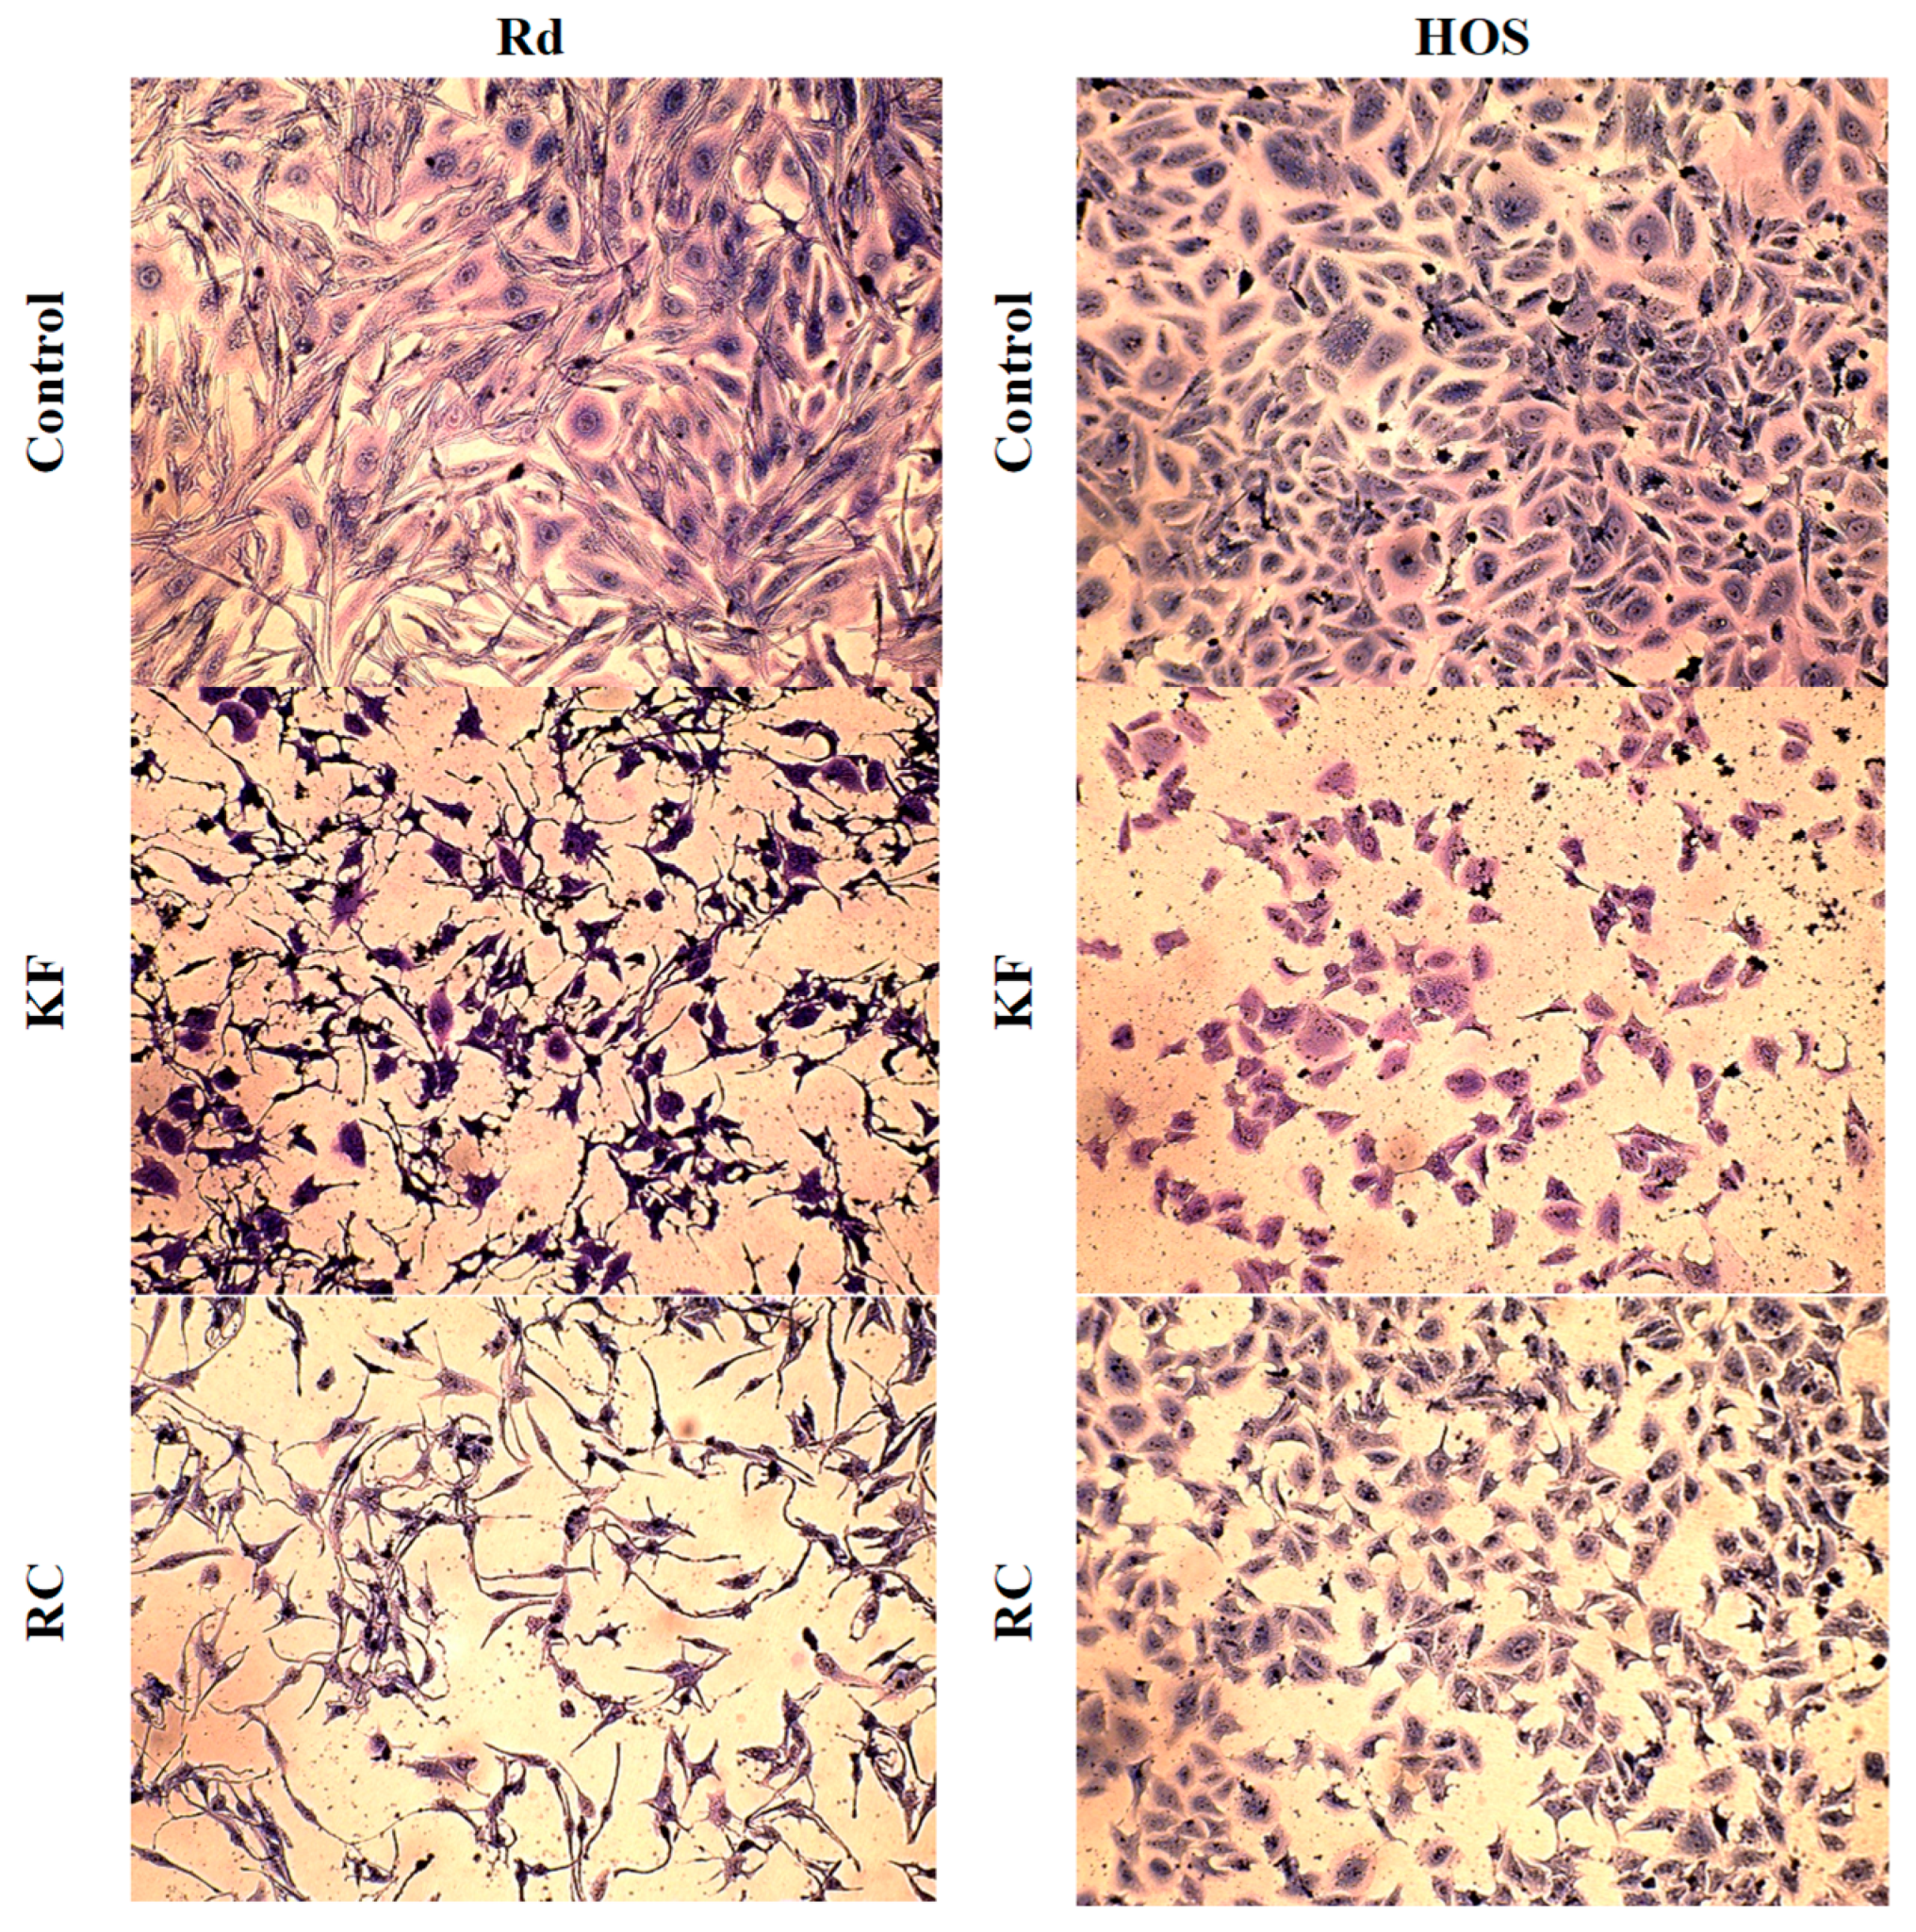
3.5. Morphological Observation

3.5.1. Acridine Orange and Ethidium Bromide

The cancer cell lines were stained with AO/EB fluorescent stain combination to distinguish between the living, early apoptotic, and late apoptotic or necrotic cells upon treatment with KF or RC-rich flavonoid extracts. It is well-known that acridine orange stains both live and dead cells, whereas ethidium bromide stains cells with lost integrity of their cytoplasmic membrane [73]. A single concentration was selected based on the values of IC50 previously evaluated by MTT assay.
Treatment with KF or RC extracts and the control outcomes did not exhibit the same phenomenon. Figure 3 elucidates that the living untreated or control cells showed uniform normal structures and their nuclear chromatin stained green. The apoptotic bodies were also stained green. The necrotic cells and late apoptotic cells emitted red fluorescence color nuclear chromatin. It was found that KF extracts had a substantial cytotoxic effect on the HOS that appeared in emitted a higher fluorescence intensity in a homogenous manner, compared to RC. While Rd cells treated with RC exhibited an intense fluorescence color higher than that of KF. The data obtained confirm the pronounced cytotoxic effect of KF and RC extracts on malignant neoplastic cells using the example of Rd and HOS cell lines (Figure 3a,b).
The cell death assay in Figure 4 elucidated that our extracts caused 64 μg/mL of KF extract caused necrosis in >60% and >75% of HOS and Rb tumor cells, respectively, while RC extracts caused cell death in >35% and >80% of tumor cells extract. This was not the case in control or intact cells where cell death was found to be approximately 5%. The degree of cell death in HOS and Rd cell lines upon treatments with KF and RC extracts increased, respectively (Figure 4). In other words, compared to the control or untreated cell lines, KR and RC extracts showed a significant percentage of cell death in HOS and Rd lines after a 72-h incubation period. Previous research confirmed that flavonoid-rich extracts caused apoptosis in different cancer cell lines in a dose-dependent manner [74]. Based on the results of cell staining with a mixture of AO and EB, the number of living and dead Rd and HOS cells was determined (Table S1). These results highlight the selective cytotoxicity of both extracts against cancer cell lines which was previously confirmed by MTT assay. However, further studies are suggested to confirm the results by flow cytometry.

3.5.2. Giemsa Stain

The Giemsa staining of cells allowed us to assess the morphological changes that occur in the cells when exposed to extracts. As shown in Figure 5, the morphology of the control or untreated cell that was not exposed to any material exhibited no changes and appeared typically with monolayer cells. In contrast, the cells subjected to treatments with KF, or RC extracts exhibited morphological changes and displayed cell detachment with elliptic cell spindles, reduced cell adhesions, and cell shrinkage. The treated cells also showed pigmented cell nuclei, condensed chromatin, and decreased cell size after 72 h of incubation with 64 μg/mL extracts.
In Figure 5, Rd cells exhibited more shrinkage and a sharp decrease in number after exposure to RC extract than KF. It was also observed that the cell adhesions upon exposure to RC extract were remarkably lowered. Nevertheless, Rd cells subjected to KF appeared with darker nuclei. On the other side, HOS cells were visualized with a severe reduction in the number of cells and pyknotic nuclei upon treatment with KF than RC extract. These findings are also in an agreement with the previous outcomes from MTT assay or AO/EB fluorescent stained cells. The morphological changes after exposure to extracts showed patterns of cell death and nuclear changes which correlate with AO/EB staining. Anyway, studying the morphological changes of different concentrations of flavonoid-rich extracts on various human tumor cell lines is warranted.

4. Conclusions

A total of 23 flavonoids were comprehensively identified in KF and RC fractionated extracts using HPLC-DAD-HRMS where isoflavones revealed abundant chemical constituents. UV spectra of HPLC-HRMS were useful to identify the bioactive compounds present in KF and RC extracts which were not detected using HPLC-DAD. For the first time, a comparative analysis of the anticancer activity of eco-friendly extracted flavonoids from KF and RC on different human cancer cell lines in vitro was performed. The presence of various polyphenols and flavonoids in both plant extracts makes them promising candidates for further research in cancer cell therapy. Our findings provide scientific validation of the abundant bioactive compounds in KF and RC, suggesting that they could potentially exert an anticancer effect. Further studies on isolating the pure individual compounds of KF and RC, evaluating their anticancer activities, and studying their mechanisms of action are warranted.

Supplementary Materials

The following are available online at https://www.mdpi.com/article/10.3390/appliedchem3010009/s1, Figure S1. CID spectrum of genistin (CE = 20 eV), Figure S2. CID spectrum of genistin (CE = 40 eV), Figure S3. CID spectrum of 6- or 8- hydroxygenistein (CE = 20 eV), Figure S4. CID spectrum of 6- or 8- hydroxygenistein (CE = 40 eV), Figure S5. CID spectrum of 6- or 8- hydroxygenistein-glucoside (CE = 40 eV), Figure S6. CID spectrum of 6- or 8- hydroxygenistein-glucoside (CE = 50 eV), Figure S7. CID spectrum of tectorigenin (CE = 40 eV), Figure S8. CID spectrum of tectorigenin isomer 1 (CE = 40 eV), Figure S9. CID spectrum of tectorigenin isomer 2 (CE = 40 eV), Figure S10. CID spectrum of tectoridine (CE = 20 eV), Figure S11. CID spectrum of tectoridine (CE = 40 eV), Figure S12. CID spectrum of tectoridine (CE = 60 eV), Figure S13. CID spectrum of apigenin (CE = 20 eV), Figure S14. CID spectrum of apigenin (CE = 40 eV), Figure S15. CID spectrum of luteolin (CE = 20 eV), Figure S16. CID spectrum of luteolin (CE = 40 eV), Figure S17. CID spectrum of kaempferol (CE = 20 eV), Figure S18. CID spectrum of kaempferol (CE = 40 eV), Figure S19. CID spectrum of dihydrokaempferol (CE = 20 eV), Figure S20. CID spectrum of naringenin (CE = 20 eV), Figure S21. CID spectrum of quercetin (CE = 20 eV), Figure S22. CID spectrum of quercetin (CE = 40 eV), Table S1. Qualitative and quantitative analysis of cells stained with a mixture of AO/EB after 72 h of incubation with RC and KF extracts at a concentration of 64 μg/mL compared to intact cells (control).

Author Contributions

Conceptualization, S.A.A. and E.G.K.; formal analysis, S.A.A., V.A.S. and V.V.M.; investigation, methodology, data collection, S.A.A., E.G.K., V.A.S., V.V.M., E.I.A. and O.G.M.; writing—original draft preparation, S.A.A., E.G.K., V.A.S. and V.V.M.; writing—review and editing, S.A.A. and E.G.K.; visualization, S.A.A., V.A.S. and V.V.M.; supervision, E.G.K.; project administration, E.G.K.; funding acquisition, E.G.K. All authors have read and agreed to the published version of the manuscript.

Funding

This work was supported by the Russian Science Foundation, Grant No. 20-66-47017.

Institutional Review Board Statement

Not applicable.

Informed Consent Statement

Not applicable.

Data Availability Statement

Not applicable.

Conflicts of Interest

The authors declare no conflict of interest.

References

  1. Sushma, P.S.; Jamil, K.; Udaykumar, P.; Aldakheel, F.M.; Alduraywish, S.A.; Alali, B.H.; Mateen, A.; Syed, R. Analysis of CCND1 protein and circulatory antioxidant enzyme activity association in oral squamous cell carcinoma. Saudi J. Biol. Sci. 2021, 28, 6987–6991. [Google Scholar] [CrossRef]
  2. Sung, H.; Ferlay, J.; Siegel, R.L.; Laversanne, M.; Soerjomataram, I.; Jemal, A.; Bray, F. Global Cancer Statistics 2020: GLOBOCAN Estimates of Incidence and Mortality Worldwide for 36 Cancers in 185 Countries. CA Cancer J. Clin. 2021, 71, 209–249. [Google Scholar] [CrossRef] [PubMed]
  3. Siegel, R.L.; Miller, K.D.; Wagle, N.S.; Jemal, A. Cancer statistics, 2023. CA Cancer J. Clin. 2023, 73, 17–48. [Google Scholar] [CrossRef] [PubMed]
  4. Zia ur, R.; Gurgul, A.; Youn, I.; Maldonado, A.; Wahid, F.; Che, C.-T.; Khan, T. UHPLC-MS/MS-GNPS based phytochemical investigation of Equisetum arvense L. and evaluation of cytotoxicity against human melanoma and ovarian cancer cells. Saudi J. Biol. Sci. 2022, 29, 103271. [Google Scholar] [CrossRef] [PubMed]
  5. Esposito, T.; Sansone, F.; Franceschelli, S.; Del Gaudio, P.; Picerno, P.; Aquino, R.P.; Mencherini, T. Hazelnut (Corylus avellana L.) Shells Extract: Phenolic Composition, Antioxidant Effect and Cytotoxic Activity on Human Cancer Cell Lines. Int. J. Mol. Sci. 2017, 18, 392. [Google Scholar] [CrossRef]
  6. Yock, T.I.; Yeap, B.Y.; Ebb, D.H.; Weyman, E.; Eaton, B.R.; Sherry, N.A.; Jones, R.M.; MacDonald, S.M.; Pulsifer, M.B.; Lavally, B.; et al. Long-term toxic effects of proton radiotherapy for paediatric medulloblastoma: A phase 2 single-arm study. Lancet Oncol. 2016, 17, 287–298. [Google Scholar] [CrossRef] [PubMed]
  7. Kwon, Y. Mechanism-based management for mucositis: Option for treating side effects without compromising the efficacy of cancer therapy. Onco Targets Ther. 2016, 9, 2007–2016. [Google Scholar] [CrossRef] [Green Version]
  8. Kopustinskiene, D.M.; Jakstas, V.; Savickas, A.; Bernatoniene, J. Flavonoids as Anticancer Agents. Nutrients 2020, 12, 457. [Google Scholar] [CrossRef] [Green Version]
  9. Ionescu, V.S.; Popa, A.; Alexandru, A.; Manole, E.; Neagu, M.; Pop, S. Dietary Phytoestrogens and Their Metabolites as Epigenetic Modulators with Impact on Human Health. Antioxidants 2021, 10, 1893. [Google Scholar] [CrossRef]
  10. Xiao, Y.; Zhang, S.; Tong, H.; Shi, S. Comprehensive evaluation of the role of soy and isoflavone supplementation in humans and animals over the past two decades. Phytother. Res. 2018, 32, 384–394. [Google Scholar] [CrossRef]
  11. Patel, D.K. Biological Activities and Therapeutic Potential of Irigenin on Gastric, Lung, Prostate, Breast, and Endometrial Cancer: Pharmacological and Analytical Aspects. Curr. Cancer Ther. Rev. 2022, 18, 172–182. [Google Scholar] [CrossRef]
  12. Sekikawa, A.; Wharton, W.; Butts, B.; Veliky, C.V.; Garfein, J.; Li, J.; Goon, S.; Fort, A.; Li, M.; Hughes, T.M. Potential Protective Mechanisms of S-equol, a Metabolite of Soy Isoflavone by the Gut Microbiome, on Cognitive Decline and Dementia. Int. J. Mol. Sci. 2022, 23, 11921. [Google Scholar] [CrossRef] [PubMed]
  13. Chakraborty, D.; Gupta, K.; Biswas, S. A mechanistic insight of phytoestrogens used for Rheumatoid arthritis: An evidence-based review. Biomed. Pharmacother. 2021, 133, 111039. [Google Scholar] [CrossRef] [PubMed]
  14. Chen, L.-R.; Ko, N.-Y.; Chen, K.-H. Isoflavone Supplements for Menopausal Women: A Systematic Review. Nutrients 2019, 11, 2649. [Google Scholar] [CrossRef] [PubMed] [Green Version]
  15. Vidya, N.; Saravanan, K.; Halka, J.; Kowsalya, K.; Preetha, J.S.Y.; Gurusaravanan, P.; Radhakrishnan, R.; Nanthini, A.U.R.; Arun, M. An insight into in vitro strategies for bioproduction of isoflavones. Plant Biotechnol. Rep. 2021, 15, 717–740. [Google Scholar] [CrossRef]
  16. Aboushanab, S.A.; Khedr, S.M.; Gette, I.F.; Danilova, I.G.; Kolberg, N.A.; Ravishankar, G.A.; Ambati, R.R.; Kovaleva, E.G. Isoflavones derived from plant raw materials: Bioavailability, anti-cancer, anti-aging potentials, and microbiome modulation. Crit. Rev. Food Sci. Nutr. 2022, 63, 261–287. [Google Scholar] [CrossRef]
  17. Yu, Y.; Pauli, G.F.; Huang, L.; Gan, L.-S.; van Breemen, R.B.; Li, D.; McAlpine, J.B.; Lankin, D.C.; Chen, S.-N. Classification of Flavonoid Metabolomes via Data Mining and Quantification of Hydroxyl NMR Signals. Anal. Chem. 2020, 92, 4954–4962. [Google Scholar] [CrossRef]
  18. Duru, K.C.; Slesarev, G.P.; Aboushanab, S.A.; Kovalev, I.S.; Zeidler, D.M.; Kovaleva, E.G.; Bhat, R. An eco-friendly approach to enhance the extraction and recovery efficiency of isoflavones from kudzu roots and soy molasses wastes using ultrasound-assisted extraction with natural deep eutectic solvents (NADES). Ind. Crops Prod. 2022, 182, 114886. [Google Scholar] [CrossRef]
  19. Lu, J.; Xie, Y.; Tan, Y.; Qu, J.; Matsuda, H.; Yoshikawa, M.; Yuan, D. Simultaneous determination of isoflavones, saponins and flavones in Flos Puerariae by ultra performance liquid chromatography coupled with quadrupole time-of-flight mass spectrometry. Chem. Pharm. Bull. 2013, 61, 941–951. [Google Scholar] [CrossRef] [Green Version]
  20. Lee, S.; Kim, H.-W.; Lee, S.-J.; Kwon, R.H.; Na, H.; Kim, J.H.; Choi, Y.-M.; Yoon, H.; Kim, Y.-S.; Wee, C.-D.; et al. Comprehensive characterization of flavonoid derivatives in young leaves of core-collected soybean (Glycine max L.) cultivars based on high-resolution mass spectrometry. Sci. Rep. 2022, 12, 14678. [Google Scholar] [CrossRef]
  21. Qi, P.; Zhou, Q.-Q.; Lin, Z.-H.; Liu, J.; Cai, W.-y.; Mao, X.-W.; Jiang, J.-J. Qualitative screening and quantitative determination of multiclass water-soluble synthetic dyes in foodstuffs by liquid chromatography coupled to quadrupole Orbitrap mass spectrometry. Food Chem. 2021, 360, 129948. [Google Scholar] [CrossRef] [PubMed]
  22. Kim, Y.; Kim, J.; Son, S.-R.; Kim, J.-Y.; Choi, J.-H.; Jang, D.S. Chemical Constituents of the Flowers of Pueraria lobata and Their Cytotoxic Properties. Plants 2022, 11, 1651. [Google Scholar] [CrossRef] [PubMed]
  23. Li, Y.; Saravana Kumar, P.; Qiu, J.; Ran, Y.; Tan, X.; Zhao, R.; Ai, L.; Yuan, M.; Zhu, J.; He, M. Production of bioactive compounds from callus of Pueraria thomsonii Benth with promising cytotoxic and antibacterial activities. Arab. J. Chem. 2022, 15, 103854. [Google Scholar] [CrossRef]
  24. Khazaei, M.; Pazhouhi, M.; Khazaei, S. Evaluation of Hydro-Alcoholic Extract of Trifolium Pratens L. for Its Anti-Cancer Potential on U87MG Cell Line. Cell J. 2018, 20, 412–421. [Google Scholar] [CrossRef] [PubMed]
  25. Aboushanab, S.A.; Shevyrin, V.A.; Slesarev, G.P.; Melekhin, V.V.; Shcheglova, A.V.; Makeev, O.G.; Kovaleva, E.G.; Kim, K.H. Antioxidant and Cytotoxic Activities of Kudzu Roots and Soy Molasses against Pediatric Tumors and Phytochemical Analysis of Isoflavones Using HPLC-DAD-ESI-HRMS. Plants 2022, 11, 741. [Google Scholar] [CrossRef]
  26. Dai, Y.; van Spronsen, J.; Witkamp, G.-J.; Verpoorte, R.; Choi, Y.H. Natural deep eutectic solvents as new potential media for green technology. Anal. Chim. Acta 2013, 766, 61–68. [Google Scholar] [CrossRef]
  27. Noreen, H.; Semmar, N.; Farman, M.; McCullagh, J.S.O. Measurement of total phenolic content and antioxidant activity of aerial parts of medicinal plant Coronopus didymus. Asian Pac. J. Trop. Med. 2017, 10, 792–801. [Google Scholar] [CrossRef]
  28. Sumi, S.A.; Siraj, M.A.; Hossain, A.; Mia, M.S.; Afrin, S.; Rahman, M.M. Investigation of the key pharmacological activities of Ficus racemosa and analysis of its major bioactive polyphenols by HPLC-DAD. Evid. Based Complement. Alternat. Med. 2016, 2016, 3874516. [Google Scholar] [CrossRef] [Green Version]
  29. Huang, R.; Wu, W.; Shen, S.; Fan, J.; Chang, Y.; Chen, S.; Ye, X. Evaluation of colorimetric methods for quantification of citrus flavonoids to avoid misuse. Anal. Methods 2018, 10, 2575–2587. [Google Scholar] [CrossRef]
  30. Ritz, C.; Baty, F.; Streibig, J.C.; Gerhard, D. Dose-Response Analysis Using R. PLoS ONE 2015, 10, e0146021. [Google Scholar] [CrossRef] [Green Version]
  31. Wang, T.; Guo, Q.; Yang, H.; Gao, W.; Li, P. pH-controlled reversible deep-eutectic solvent based enzyme system for simultaneous extraction and in-situ separation of isoflavones from Pueraria lobata. Sep. Purif. Technol. 2022, 292, 120992. [Google Scholar] [CrossRef]
  32. Liu, J.; Li, X.; Row, K.H. Development of deep eutectic solvents for sustainable chemistry. J. Mol. Liq. 2022, 362, 119654. [Google Scholar] [CrossRef]
  33. Ivanović, M.; Grujić, D.; Cerar, J.; Islamčević Razboršek, M.; Topalić-Trivunović, L.; Savić, A.; Kočar, D.; Kolar, M. Extraction of Bioactive Metabolites from Achillea millefolium L. with Choline Chloride Based Natural Deep Eutectic Solvents: A Study of the Antioxidant and Antimicrobial Activity. Antioxidants 2022, 11, 724. [Google Scholar] [CrossRef] [PubMed]
  34. Zhang, J.; Zhang, Y.; Ma, H.; Yang, F.; Duan, T.; Zhang, Y.; Dong, Y. Quantitative analysis of nine isoflavones in traditional Chinese medicines using mixed micellar liquid chromatography containing sodium dodecylsulfate/β-cyclodextrin supramolecular amphiphiles. J. Sep. Sci. 2021, 44, 3188–3198. [Google Scholar] [CrossRef] [PubMed]
  35. Aloo, S.-O.; Ofosu, F.K.; Kim, N.-H.; Kilonzi, S.M.; Oh, D.-H. Insights on Dietary Polyphenols as Agents against Metabolic Disorders: Obesity as a Target Disease. Antioxidants 2023, 12, 416. [Google Scholar] [CrossRef]
  36. Zhao, X.; Zhang, S.; Liu, D.; Yang, M.; Wei, J. Analysis of Flavonoids in Dalbergia odorifera by Ultra-Performance Liquid Chromatography with Tandem Mass Spectrometry. Molecules 2020, 25, 389. [Google Scholar] [CrossRef] [Green Version]
  37. Tchoumtchoua, J.; Njamen, D.; Mbanya, J.C.; Skaltsounis, A.L.; Halabalaki, M. Structure-oriented UHPLC-LTQ Orbitrap-based approach as a dereplication strategy for the identification of isoflavonoids from Amphimas pterocarpoides crude extract. J. Mass Spectrom. 2013, 48, 561–575. [Google Scholar] [CrossRef]
  38. Lei, H.; Zhang, Y.; Ye, J.; Cheng, T.; Liang, Y.; Zu, X.; Zhang, W. A comprehensive quality evaluation of Fuzi and its processed product through integration of UPLC-QTOF/MS combined MS/MS-based mass spectral molecular networking with multivariate statistical analysis and HPLC-MS/MS. J. Ethnopharmacol. 2021, 266, 113455. [Google Scholar] [CrossRef]
  39. Cai, T.; Guo, Z.-Q.; Xu, X.-Y.; Wu, Z.-J. Recent (2000–2015) developments in the analysis of minor unknown natural products based on characteristic fragment information using LC–MS. Mass Spectrom. Rev. 2018, 37, 202–216. [Google Scholar] [CrossRef]
  40. National Institute of Standards and Technology. NIST20: Updates to the NIST Tandem and Electron Ionization Spectral Libraries. 2020. Available online: https://www.nist.gov/programs-projects/nist20-updates-nist-tandem-and-electron-ionization-spectral-libraries (accessed on 12 August 2022).
  41. METLIN Metabolomics Database and Library. Available online: https://www.agilent.com/en/product/liquid-chromatography-mass-spectrometry-lc-ms/lc-ms-application-solutions/life-sciences-solutions/metlin-metabolomics-database-library (accessed on 12 August 2022).
  42. MassBank of North America (MoNA). Available online: https://mona.fiehnlab.ucdavis.edu/ (accessed on 12 August 2022).
  43. MS-DIAL. Available online: http://prime.psc.riken.jp/compms/msdial/main.html#MSP (accessed on 12 August 2022).
  44. Schmidt, J. Negative ion electrospray high-resolution tandem mass spectrometry of polyphenols. J. Mass Spectrom. 2016, 51, 33–43. [Google Scholar] [CrossRef]
  45. Yu, Y.; Wei, X.; Liu, Y.; Dong, G.; Hao, C.; Zhang, J.; Jiang, J.; Cheng, J.; Liu, A.; Chen, S. Identification and quantification of oligomeric proanthocyanidins, alkaloids, and flavonoids in lotus seeds: A potentially rich source of bioactive compounds. Food Chem. 2022, 379, 132124. [Google Scholar] [CrossRef] [PubMed]
  46. Franski, R.; Gierczyk, B.; Kozik, T.; Popenda, L.; Beszterda, M. Signals of diagnostic ions in the product ion spectra of [M—H](-) ions of methoxylated flavonoids. Rapid Commun. Mass Spectrom. 2019, 33, 125–132. [Google Scholar] [CrossRef] [PubMed]
  47. Gao, B.; Ma, Y.; Zhang, L.T.; Ren, Q. Identification and characterization of the chemical components of Iris tectorum Maxim. and evaluation of their nitric oxide inhibitory activity. Rapid Commun. Mass Spectrom. 2021, 35, e8959. [Google Scholar] [CrossRef] [PubMed]
  48. Yang, M.; Li, J.; Zhao, C.; Xiao, H.; Fang, X.; Zheng, J. LC-Q-TOF-MS/MS detection of food flavonoids: Principle, methodology, and applications. Crit. Rev. Food Sci. Nutr. 2021, 1–21. [Google Scholar] [CrossRef]
  49. Liu, Q.; Pei, Y.; Wan, H.; Wang, M.; Liu, L.; Li, W.; Jin, J.; Liu, X. Chemical profiling and identification of Radix Cudramiae and their metabolites in rats using an ultra-high-performance liquid chromatography method coupled with time-of-flight tandem mass spectrometry. J. Sep. Sci. 2022, 1–13. [Google Scholar] [CrossRef]
  50. Han, J.; Xu, K.; Yan, Q.; Sui, W.; Zhang, H.; Wang, S.; Zhang, Z.; Wei, Z.; Han, F. Qualitative and quantitative evaluation of Flos Puerariae by using chemical fingerprint in combination with chemometrics method. J. Pharm. Anal. 2022, 12, 489–499. [Google Scholar] [CrossRef]
  51. Dabeek, W.M.; Marra, M.V. Dietary Quercetin and Kaempferol: Bioavailability and Potential Cardiovascular-Related Bioactivity in Humans. Nutrients 2019, 11, 2288. [Google Scholar] [CrossRef] [Green Version]
  52. Gercek, Y.C.; Celik, S.; Bayram, S. Screening of Plant Pollen Sources, Polyphenolic Compounds, Fatty Acids and Antioxidant/Antimicrobial Activity from Bee Pollen. Molecules 2022, 27, 117. [Google Scholar] [CrossRef]
  53. Huang, W.; Wen, F.; Ruan, S.; Gu, P.; Gu, S.; Song, S.; Zhou, J.; Li, Y.; Liu, J.; Shu, P. Integrating HPLC-Q-TOF-MS/MS, network pharmacology and experimental validation to decipher the chemical substances and mechanism of modified Gui-shao-liu-jun-zi decoction against gastric cancer. J. Tradit. Complement. Med. 2023, in press. [Google Scholar] [CrossRef]
  54. Ferrario, G.; Baron, G.; Gado, F.; Della Vedova, L.; Bombardelli, E.; Carini, M.; D’Amato, A.; Aldini, G.; Altomare, A. Polyphenols from Thinned Young Apples: HPLC-HRMS Profile and Evaluation of Their Anti-Oxidant and Anti-Inflammatory Activities by Proteomic Studies. Antioxidants 2022, 11, 1577. [Google Scholar] [CrossRef]
  55. Paillat, L.; Bordier, E.; Guepet, A.; Lima, J.; Boudah, S.; Murtaugh, A. Development and Validation of an On-Line HPLC-DAD-Antioxidant Assay (ORAC)/ESI-HRMS System to Identify Antioxidant Compounds in Complex Mixtures. J. Chromatogr. Sci. 2023. [Google Scholar] [CrossRef]
  56. Shi, S.; Ma, Y.; Zhang, Y.; Liu, L.; Liu, Q.; Peng, M.; Xiong, X. Systematic separation and purification of 18 antioxidants from Pueraria lobata flower using HSCCC target-guided by DPPH–HPLC experiment. Sep. Purif. Technol. 2012, 89, 225–233. [Google Scholar] [CrossRef]
  57. Thapa, P.; Kim, H.M.; Hong, J.-P.; Kim, R.; Paudel, S.B.; Choi, H.; Jang, D.S.; Nam, J.-W. Absolute Quantification of Isoflavones in the Flowers of Pueraria lobata by qHNMR. Plants 2022, 11, 548. [Google Scholar] [CrossRef]
  58. Aboushanab, S.; Shevyrin, V.; Kamel, M.; Kambele, J.; Kovaleva, E. Phytochemical screening and properties of botanical crude extracts and ethyl acetate fractions isolated by deep eutectic solvent. Chim. Technol. Acta 2022, 9, 20229404. [Google Scholar] [CrossRef]
  59. Chen, X.; Zhang, J.; Li, R.; Zhang, H.; Sun, Y.; Jiang, L.; Wang, X.; Xiong, Y. Flos Puerariae-Semen Hoveniae medicinal pair extract ameliorates DSS-induced inflammatory bowel disease through regulating MAPK signaling and modulating gut microbiota composition. Front. Pharmacol. 2022, 13, 1034031. [Google Scholar] [CrossRef] [PubMed]
  60. Akbaribazm, M.; Khazaei, M.R.; Khazaei, M. Phytochemicals and antioxidant activity of alcoholic/hydroalcoholic extract of Trifolium pratense. Chin. Herb. Med. 2020, 12, 326–335. [Google Scholar] [CrossRef] [PubMed]
  61. Malca-Garcia, G.R.; Liu, Y.; Dong, H.; Nikolić, D.; Friesen, J.B.; Lankin, D.C.; McAlpine, J.; Chen, S.-N.; Dietz, B.M.; Pauli, G.F. Auto-hydrolysis of red clover as “green” approach to (iso)flavonoid enriched products. Fitoterapia 2021, 152, 104878. [Google Scholar] [CrossRef]
  62. Vlaisavljević, S.; Kaurinović, B.; Popović, M.; Vasiljević, S. Profile of phenolic compounds in Trifolium pratense L. extracts at different growth stages and their biological activities. Int. J. Food Prop. 2017, 20, 3090–3101. [Google Scholar] [CrossRef] [Green Version]
  63. Lertpatipanpong, P.; Janpaijit, S.; Park, E.-Y.; Kim, C.-T.; Baek, S.J. Potential Anti-Diabetic Activity of Pueraria lobata Flower (Flos Puerariae) Extracts. Molecules 2020, 25, 3970. [Google Scholar] [CrossRef]
  64. Zawiślak, A.; Francik, R.; Francik, S.; Knapczyk, A. Impact of Drying Conditions on Antioxidant Activity of Red Clover (Trifolium pratense), Sweet Violet (Viola odorata) and Elderberry Flowers (Sambucus nigra). Materials 2022, 15, 3317. [Google Scholar] [CrossRef]
  65. Vlaisavljevic, S.; Kaurinovic, B.; Popovic, M.; Djurendic-Brenesel, M.; Vasiljevic, B.; Cvetkovic, D.; Vasiljevic, S. Trifolium pratense L. as a Potential Natural Antioxidant. Molecules 2014, 19, 713–725. [Google Scholar] [CrossRef]
  66. Tang, Y.; Li, S.; Li, S.; Yang, X.; Qin, Y.; Zhang, Y.; Liu, C. Screening and isolation of potential lactate dehydrogenase inhibitors from five Chinese medicinal herbs: Soybean, Radix pueraria, Flos pueraria, Rhizoma belamcandae, and Radix astragali. J. Sep. Sci. 2016, 39, 2043–2049. [Google Scholar] [CrossRef] [PubMed]
  67. Speisky, H.; Shahidi, F.; Costa de Camargo, A.; Fuentes, J. Revisiting the Oxidation of Flavonoids: Loss, Conservation or Enhancement of Their Antioxidant Properties. Antioxidants 2022, 11, 133. [Google Scholar] [CrossRef] [PubMed]
  68. Li, Z.; Liu, Y.; Xiang, J.; Wang, C.; Johnson, J.B.; Beta, T. Diverse polyphenol components contribute to antioxidant activity and hypoglycemic potential of mulberry varieties. LWT 2023, 173, 114308. [Google Scholar] [CrossRef]
  69. Song, E.J.; Kim, N.Y.; Heo, M.Y. Protective effect of korean medicinal plants on ethanol-induced cytotoxicity in HepG2 Cells. Nat. Prod. Sci. 2013, 19, 329–336. [Google Scholar]
  70. Bulugonda, R.K.; Kumar, K.A.; Gangappa, D.; Beeda, H.; Philip, G.H.; Muralidhara Rao, D.; Faisal, S.M. Mangiferin from Pueraria tuberosa reduces inflammation via inactivation of NLRP3 inflammasome. Sci. Rep. 2017, 7, 42683. [Google Scholar] [CrossRef] [Green Version]
  71. Zgórka, G.; Maciejewska-Turska, M.; Makuch-Kocka, A.; Plech, T. In Vitro Evaluation of the Antioxidant Activity and Chemopreventive Potential in Human Breast Cancer Cell Lines of the Standardized Extract Obtained from the Aerial Parts of Zigzag Clover (Trifolium medium L.). Pharmaceuticals 2022, 15, 699. [Google Scholar] [CrossRef]
  72. Zakłos-Szyda, M.; Budryn, G. The Effects of Trifolium pratense L. Sprouts’ Phenolic Compounds on Cell Growth and Migration of MDA-MB-231, MCF-7 and HUVEC Cells. Nutrients 2020, 12, 257. [Google Scholar] [CrossRef] [Green Version]
  73. Lateef, R.; Marhaba; Mandal, P.; Ansari, K.M.; Javed Akhtar, M.; Ahamed, M. Cytotoxicity and apoptosis induction of copper oxide-reduced graphene oxide nanocomposites in normal rat kidney cells. J. King Saud Univ.—Sci. 2023, 35, 102513. [Google Scholar] [CrossRef]
  74. Serpeloni, J.M.; Leal Specian, A.F.; Ribeiro, D.L.; Tuttis, K.; Vilegas, W.; Martínez-López, W.; Dokkedal, A.L.; Saldanha, L.L.; de Syllos Cólus, I.M.; Varanda, E.A. Antimutagenicity and induction of antioxidant defense by flavonoid rich extract of Myrcia bella Cambess. in normal and tumor gastric cells. J. Ethnopharmacol. 2015, 176, 345–355. [Google Scholar] [CrossRef] [Green Version]
Figure 1. Representative HPLC-UV (254 nm) chromatographic profiles for kudzu flowers (a) and red clover (b) extracts and chemical structures of isoflavones; puerarin, daidzein, genistein, formononetin, and biochanin A (c).
Appliedchem 03 00009 g001
Figure 2. Evaluation of the effect of kudzu flower (KF) and red clover (RC) extracts on the viability of human osteosarcoma HOS cells (a), glioblastoma A-172 cells (b), human embryonic rhabdomyosarcoma Rd cells (c), human lung carcinoma A-549 cells (d), human liver carcinoma HepG2 cells (e) and human embryonic kidney cells HEK-293 (f), (mean ± CI95).
Appliedchem 03 00009 g002
Figure 3. Staining of Rd (a) and HOS (b) line cells with a mixture of fluorescent dyes (AO and EB) after 72 h of incubation with kudzu flower (KF) and clover (RC) extracts at a concentration of 64 μg/mL compared to intact cells (Control). Healthy or control cells and apoptotic bodies were visualized with green fluorescence, whereas necrotic cells and late apoptotic cells appear with red fluorescence. Images were captured at original magnification, ×100.
Appliedchem 03 00009 g003
Figure 4. Percent cell death of HOS and Rd lines after 72-h incubation with kudzu flower (KF) and clover (RC) extracts (p < 0.001). The representative figure shows that KF and RC extracts significantly inhibited the proliferation of HOS and Rd cells compared to the control cell lines. *** corresponds to p < 0.001.
Appliedchem 03 00009 g004
Figure 5. Morphological changes appeared under an ordinary inverted light microscope after staining the cells of the Rd and HOS lines with Giemsa and after exposure to 72 h of incubation with red clover and kudzu flower extracts in a concentration of 64 μg/mL. Images were captured at original magnification, ×100.
Appliedchem 03 00009 g005
Table 1. Results of quantification of the isoflavones of kudzu flowers and red clover flower extracts.
ParametersKF (%)RC (%)
Puerarinndnd
Daidzein0.31 ± 0.007 a0.07 ± 0.006 a
Genistein0.19 ± 0.015 a0.19 ± 0.008 b
Formononetinnd0.29 ± 0.007 b
Biochanin A0.09 ± 0.01 b0.19 ± 0.015 b
Sum0.59 ± 0.0910.74 ± 0.007
KF; kudzu flower, RC; red clover, nd: not detected. Data are shown as mean ± SD. a,b Means that do not share the same letter in each column are significantly different.
Table 2. Major flavonoids identified in the extract of kudzu flower using HPLC-HRMS.
No.Retention Time
(tr, min)
Chemical FormulaAccurate Mass
[M–H]
Exact Mass
[M–H]
Error,
ppm
MS/MS Fragment IonsPeak Area
(-EIC),
% of Genistein
Compound Name
Isoflavones
1i11.47C15H10O5269.0460269.0455−1.77239.0343, 223.0401, 180.0581, 159.0452, 135.0452, 133.0295, 117.0346, 107.0139, 91.0189, 63.0240100.0Genistein *
2i14.05C16H12O5283.0618283.0612−2.03267.0299, 239.0350, 223.0401, 211.0401, 195.0452, 167.0502, 132.021730.0Biochanin A *
3i10.40C15H10O4253.0506253.0506−0.03223.0401, 208.0530, 195.0452, 180.0581, 133.0295, 132.0217, 91.01897.4Daidzein *
4i7.91C21H20O10431.0985431.0984−0.39311.0561, 269.0455, 268.0377, 267.0299, 239.0350, 223.0401, 211.0401, 133.0295, 132.02172.4Genistein-7-O-glucoside (genistin) **
5i9.87C15H10O6285.0413285.0405−2.78151.0037, 133.0295, 123.0088, 117.0346240.36- or 8-hydroxygenistein **
6i7.19C21H20O11447.0940447.0933−1.68285.0405, 241.0506, 213.0557, 185.0608, 133.0295, 123.008812.36- or 8-hydroxygenistein-glucoside **
7i11.50C16H12O6299.0566299.0561−1.66284.0326, 283.0248, 255.0299, 240.0428, 227.0350, 211.0401, 200.0479, 183.0452, 133.0295, 132.0217344.6Tectorigenin **
8i8.22C16H12O6299.0564299.0561−1.02283.0248, 255.0299, 240.0428, 227.0350, 211.0401, 200.0479, 183.0452, 133.0295, 59.01396.4Tectorigenin isomer 1 **
9i12.56C16H12O6299.0570299.0561−2.97283.0248, 267.0299, 255.0299, 239.0350, 227.0350, 211.0401, 190.9986, 163.0037, 132.0217, 59.013953.0Tectorigenin isomer 2 **
10i8.22C22H22O11461.1102461.1089−2.73299.0561, 284.0326, 283.0248, 255.0299, 240.0428, 227.0350, 211.0401, 200.0479, 183.0452, 136.988047.9Tectoridine
Flavones
1f12.28C15H10O5269.0460269.0455−1.56225.0557, 151.0037, 149.0244, 117.0346, 107.01399.7Apigenin **
2f11.36C15H10O6285.0410285.0405−1.80241.0506, 217.0506, 199.0401, 175.0401, 151.0037, 133.0295, 107.013918.6Luteolin **
Flavonoles
1fl12.08C15H10O6285.0411285.0405−2.28255.0299, 239.0350, 227.0350, 211.0401, 159.0452, 143.0502, 117.0346, 93.034624.4Kaempferol **
2fl6.45C15H12O6287.0563287.0561−0.72259.0612, 243.0663, 177.0557, 151.0037, 125.02448.7Dihydrokaempferol **
Flavanones
1fn11.01C15H12O5271.0615271.0612−1.3177.0193, 151.0037, 119.0502, 107.013910.1Naringenin **
* Identity determined based on MS (MS/MS) spectral and retention data using authentic standards. ** Tentative identification. Details are provided in the text. -EIC: Extracted Ion Chromatogram in negative ion mode.
Table 3. Major flavonoids identified in the extract of red clover using HPLC-HRMS.
No.Retention Time
(tr, min)
Chemical
Formula
Accurate Mass
[M–H]
Exact Mass
[M–H]
Error,
ppm
MS/MS Fragment IonsPeak Area
(-EIC),
% of Formononetin
Compound Name
Isoflavones
1ir13.14C16H12O4267.0670267.0663−2.57251.0350, 223.0401, 195.0452, 167.0502, 135.0088, 132.0217, 91.0189100.0Formononetin *
2ir11.47C15H10O5269.0466269.0455−3.75239.0343, 223.0401, 180.0581, 159.0452, 135.0452, 133.0295, 117.0346, 107.0139, 91.0189, 63.024012.7Genistein *
3ir14.05C16H12O5283.0616283.0612−1.42267.0299, 239.0350, 223.0401, 211.0401, 195.0452, 167.0502, 132.021780.9Biochanin A *
4ir10.40C15H10O4253.0513253.0506−2.53223.0401, 208.0530, 195.0452, 180.0581, 133.0295, 132.0217, 91.018914.0Daidzein *
5ir6.35C21H20O9415.1039415.1035−1.03295.0612, 277.0506, 267.06630.4Puerarin *
Flavonoles
1fl12.08C15H10O6285.0411285.0405−2.22255.0299, 239.0350, 227.0350, 211.0401, 159.0452, 143.0502, 117.0346, 93.034683.3Kaempferol **
2fl6.45C15H12O6287.0569287.0561−2.84259.0612, 243.0663, 177.0557, 151.0037, 125.024411.1Dihydrokaempferol **
3fl11.17C15H10O7301.0360301.0354−2.2273.0405, 257.0455, 245.0455, 229.0506, 178.9986, 151.0037, 121.0295, 107.013995.5Quercetin **
* Identity determined based on MS (MS/MS) spectral and retention data using authentic standards. ** Tentative identification. Details are provided in the text. -EIC: Extracted Ion Chromatogram in negative ion mode.
Table 4. Evaluation of antioxidant activity (IC50; μg/mL), total polyphenols, and total flavonoids of kudzu flower and red clover extracts.
ParametersKFRC
DPPH radical (IC50, µg/mL)28.17 ± 1.19 a42.86 ± 1.14 b
AAE (IC50; μg/mL)2.83 ± 0.004 a4.19 ± 0.002 b
TP (mg GAEe/g)18.4 ± 2.207 a13 ± 0.46 b
TF (mg QEe/g)11.5 ± 1.60 a6.5 ± 0.58 b
KF; kudzu flower, RC; red clover, AAE; Ascorbic acid equivalence, GAEe; Gallic acid equivalent of extract, QEe; Quercetin equivalent of extracts, Data are shown as mean ± SD. a,b Means that do not share the same letter in each column are significantly different.
Table 5. Cytotoxicity index (IC50 ± SE) of plant extracts and cisplatin against human cancer cell lines, μg/mL.
HOSA-172RdA-549HepG2HEK-293
KF40.3 ± 1.4 a50.7 ± 3.0 a60.1 ± 4.2 a93.9 ± 8.1 a123.9 ± 11.2 a110.3 ± 7.2 a
RC54.9 ± 3.5 b82.5 ± 3.7 b42.4 ± 2.9 b92.9 ± 4.2 a126.4 ± 5.8 a107.8 ± 10.5 a
Cis<4 c<4 c<4 c<4 c<4 c<4 c
KF; kudzu flower, RC; red clover, CIS; cisplatin, HOS; human osteosarcoma cells, A-172; glioblastoma cells, Rd; human embryonic rhabdomyosarcoma cells, A-549; human lung carcinoma cells, HepG2; human liver carcinoma cells, HEK-293; human embryonic kidney cells. a,b,c Means that do not share the same letter in each column are significantly different (p < 0.05).
Disclaimer/Publisher’s Note: The statements, opinions and data contained in all publications are solely those of the individual author(s) and contributor(s) and not of MDPI and/or the editor(s). MDPI and/or the editor(s) disclaim responsibility for any injury to people or property resulting from any ideas, methods, instructions or products referred to in the content.

