Article

Evaluation of an Ion-Associate Phase Formed In Situ from the Aqueous Phase by Adding Benzethonium Chloride and Sodium Ethylbenzenesulfonate for Microextraction

Major of Environmental and Analytical Chemistry, Graduate School of Science and Engineering, University of Toyama, 3190 Gofuku, Toyama 930-8555, Japan
*
Author to whom correspondence should be addressed.
AppliedChem 2023, 3(1), 32-44; https://doi.org/10.3390/appliedchem3010003
Submission received: 9 December 2022 / Revised: 26 December 2022 / Accepted: 4 January 2023 / Published: 9 January 2023
(This article belongs to the Special Issue Feature Papers in AppliedChem)

Abstract

:
The concentration region at which the solvent is formed during in situ solvent formation microextraction is determined by varying the concentrations of the two components required to form a solvent. In particular, a solvent is formed in situ during ion-associate phase (IAP) microextraction by mixing an aqueous solution with an organic cation and an organic anion. In this study, benzethonium chloride (BenCl) and sodium ethylbenzenesulfonate (NaEBS) were employed as the organic cation and anion sources of model IAPs to thoroughly investigate the in situ solvent formation. Additionally, the formation of the IAPs and the solvent via centrifugation of the formed ion associates was examined. We demonstrated that ion associates are formed when the product of [EBS] and [Ben] is greater than the solubility product and [EBS] is greater than [Ben]. The highest extraction of polycyclic aromatic hydrocarbons (PAHs) was achieved with an amount of NaEBS 40 times greater than that of BenCl. A higher hydrophobicity in the IAP extraction of PAHs, estrogens, and pesticides facilitated extraction into the IAP.

Graphical Abstract

1. Introduction

The detection of chemicals in environmental water samples often requires pretreatments such as the separation and concentration of water [1,2,3,4]. Organic ion-associate phase (IAP) microextraction is one such pretreatment [5,6,7,8,9,10,11,12]. In ordinary solvent extraction, water and organic solvents are mutually soluble, allowing a maximum increase in concentration of approximately 40 times the initial concentration [13,14]. IAP microextraction, in contrast, increases the concentration by a factor of several hundred times using a liquid IAP, formed in situ from the aqueous phase by adding organic cations and organic anions. The IAP is an excellent extraction medium with a very low environmental impact. IAP microextraction enables solvent formation in situ from the aqueous solution.
The in situ formation of micro-liquid phases from the aqueous phase can be achieved by the use of ionic liquids [15,16,17,18,19], deep eutectic solvents [2,20,21,22,23] and their combination with dispersive liquid–liquid extraction [19,23]. However, to the best of our knowledge, no study has yet elucidated the optimum concentration of the reagents used to form the solvent. In the IAP extraction system used in this study, at least one of the components of the IAP is a synthetic dye [5,6], chelating reagent [7,8], or pH buffer [9,10,11]; consequently, their concentrations are often already predetermined and only the counterion concentration need be altered. In these systems, the ratio of organic cations to organic anions (the constituents of the IAP) is not 1:1 [5,7,8], possibly because the ionization state of many of the components depends on the pH. We assume that the IAP contains some form of neutral molecular species; therefore, to investigate the formation of IAPs independent of pH in a simple system, we searched for an organic cation source among quaternary ammonium salts, which are not affected by pH. Many quaternary ammonium salts are commercially available, and are typically more environmentally friendly and less expensive than organic phosphonium and arsonium salts. Thus, benzethonium chloride (BTC, Ben+Cl) was used as the cation source of the ion-associate system in all experiments, while the organic anions source varied. BTC was chosen first because it is a quaternary ammonium salt; second, the IAP forms at the bottom of the container, making it easy to decant the aqueous phase; third, the solubility of BTC is sufficiently to prepare a 0.1 M solution, allowing the study of solutions with a wide range of concentrations. Unlike IAPs formed from benzethonium (Ben), those formed from Zephyramine (benzyldimethyltetradecylammonium chloride 2H2O) may drift to the top of the aqueous phase and float, making it more difficult to discard the aqueous phase. The formation of micelles may interfere with IAP formation; however, the critical micelle concentrations (CMCs) of BTC and Zephyramine are 2 × 10⁻³ M and 8 × 10⁻⁴ M [24], respectively, and BTC does not form micelles at higher concentrations than Zephyramine. Therefore, alkylbenzenesulfonates and alkylsulfonates, which are not affected by pH, were investigated as organic anion sources for the model IAP.
The environmental pollution caused by polycyclic aromatic hydrocarbons (PAHs), estrogens and pesticides is of great concern [2,4,25,26]. The World Health Organization (WHO) recommends a maximum level of benzo[a]pyrene (BaP) in drinking water of just 0.0007 mg/L [25]. The pesticides pencycuron and pyrazolate are among those identified as water quality control targets by the Japanese Water Quality Standards, which set target values of 0.02 mg/L and 0.1 mg/L for pyrazolate (a herbicide) and pencycuron (a fungicide), respectively [26]. Similarly, estrogens, 17β-estradiol (E2) and ethinylestradiol (EE2) are among the estrogens restricted by the Japanese Water Quality Standards, which set targets of 0.00008 mg/L and 0.00002 mg/L for E2 and EE2, respectively [26]. Pretreatments such as enrichment and separation are often required to measure these environmental pollutants. The concentration conditions under which PAHs are easily extracted into the IAP were analyzed in detail in two dimensions. To evaluate the IAP as an extraction medium, the distribution coefficients of PAHs, estrogens, and pesticides were determined.

2. Experimental

2.1. Reagents

BTC (2.2 g, BenCl, Ben+Cl, organic cation, Kanto Chemical, Tokyo, Japan, Figure S1), was added to water to a total volume of 50 mL to obtain an aqueous solution of BTC (0.1 M), which was purified by recrystallization. A solution of sodium 4-ethylbenzenesulfonate (NaEBS, Na+EBS, organic anion, Tokyo Chemical Industry, Tokyo, Japan, Figure S1), was prepared by adding first-grade NaEBS (10.4 g) to water to a total volume of 100 mL. Sodium p-toluenesulfonate (9.7 g, NaTS, Na+TS, organic anion, Wako Pure Chemical, Osaka, Japan) was added to water to a total volume of 100 mL to obtain an aqueous NaTS solution (0.1 M). Sodium 1-hexanesulfonate (4.7 g, NaC6S, Na+C6S, organic anion, Wako Pure Chemical, Osaka, Japan) was added to water to a total volume of 50 mL to obtain an aqueous NaC6S solution (0.5 M). Sodium 1-heptanesulfonate (5.1 g, NaC7S, Na+C7S, organic anion, Wako Pure Chemical, Osaka, Japan) was added to water to a total volume of 50 mL to yield an aqueous NaC7S solution (0.5 M). Sodium 1-octanesulfonate (5.4 g, NaC8S, Na+C8S, organic anion, Wako Pure Chemical, Osaka, Japan) was added to water to a total volume of 50 mL, yielding an aqueous NaC8S solution (0.5 M). The NaC6S, NaC7S, and NaC8S solutions were used in ion-pair chromatography.
Standard solutions of the PAHs fluoranthene (FL), benzo[a]anthracene (BaA), benzo[b]fluoranthene (BbF), benzo[k]fluoranthene (BkF), BaP, and dibenzo[ah]anthracene (DahA) (Wako Pure Chemical, Osaka, Japan) were prepared by diluting the standards (10 mg) with acetonitrile (100 mL). Acetonitrile was used for high-performance liquid chromatography (Kanto Chemical, Tokyo, Japan).
To prepare the standard solution of estrone (E1, 5 mM), E2 (5 mM), and EE2, (5 mM), estrone (0.14 g, Sigma, London, UK), 17β-estradiol (0.14 g, Wako Pure Chemical, Osaka, Japan), and ethinylestradiol (0.15 g, Wako Pure Chemical, Osaka, Japan) were separately dissolved in ethanol to a total volume of 100 mL. A lithium acetate (pH 4.8) solution was prepared by dissolving lithium acetate (2.6 g, Wako Pure Chemical, Osaka, Japan) in purified water, adjusting the pH to 4.8 with acetic acid, and then adding water to a total volume of 500 mL. Suction filtration was performed using a cellulose mixed-ester membrane filter (0.2 µm) and the filtered pH buffer solution was stored in a brown bottle. The mobile phase was obtained by mixing this pH-buffered solution with methanol and acetonitrile in a ratio of 35:40:25.
Standard solutions of pencycuron and pyrazolate were prepared by separately dissolving pencycuron (5 mg, Kanto Chemical, Tokyo, Japan) and pyrazolate (5 mg, Kanto Chemical, Tokyo, Japan) in acetonitrile to a total volume of 50 mL.
All other reagents (e.g., nitric acid, sodium carbonate, methanol) were of analytical grade and used as received. Ultrapure water with a specific resistance of 18.2 MΩ cm (Direct-Q3 UV system, Millipore) was used throughout.

2.2. Apparatus

The PAHs were detected using a degassing system (Shimadzu in-line vacuum degasser DGU-20A3, Shimadzu, Kyoto, Japan), HPLC pump (LC-20AT), injection valve with a 20 μL loop (Rheodyne, Cotati, CA, USA), Inertsil ODS-3 chromatography column (150 × 4.0 mm, 3 μm, GLScience, Tokyo, Japan; column temperature: 40 °C, flow rate: 0.7 mL min−1), and fluorescence detector (FLD, Shimadzu RF-10AXL). Eluents were prepared by mixing acetonitrile and potassium chloride solution (0.05 M) in a ratio of 75:25. The eluents were filtered and degassed before use.
The estrogens and pesticides were analyzed using a Shimadzu HPLC pump LC-10ATP with a Shimadzu damper, in-line vacuum degasser DGU-12A, injection valve (Rheodyne) containing a 20 µL loop, and Inertsil ODS-3 analytical column (250 × 4.6 mm, 5 µm, GLScience, Tokyo, Japan). The samples were degassed at a column temperature of 40 °C prior to analysis.
The estrogens were detected using a coulometric detection system (ECD, ESA Guard Cell Model 5020, ESA Analysis Cell Model 5010) consisting of two porous carbon working electrodes controlled by a Coulochem II (ESA) potentiostat. The eluent was prepared by mixing lithium acetate solution (0.1 M) with methanol and acetonitrile in a ratio of 35:40:25. The eluent was filtered and degassed before use. The flow rate was 0.6 mL min−1.
The pesticides were detected using a Shimadzu SPD-10AVP UV-Vis detector at 242 nm for pencycuron and 260 nm for pyrazolate. The eluent was prepared by mixing acetonitrile and potassium chloride solution (0.1 M) in a ratio of 60:40. The eluent was filtered and degassed before use. The flow rate was 1.0 mL min−1.
The Cl concentration in the aqueous solutions was measured using an ion chromatograph (Compact IC 861, Metrohm, Herisau, Switzerland) containing an IC SI-90 4E column (250 × 4.6 mm, Shodex, Tokyo, Japan). The mobile phase contained Na2CO3 (0.18 M) and NaHCO3 (0.17 M), and the flow rate was 1.5 mL min−1.
The Na+ concentration in the aqueous solutions was measured using an ion chromatograph (Compact IC 761, Metrohm, Herisau, Switzerland) containing a TSK-GEL IC-CATION 1/2 HR column (100 × 4.6 mm, Tosoh, Tokyo, Japan). The mobile phase was HNO3 (2 mM) and the flow rate was 1 mL min−1.
Centrifugation was performed using Kubota (Type 5420) and Kokusan (Type H-80R) centrifuges. Ultraviolet (UV) spectra were measured with Hitachi Model U-2000A and Shimadzu Model UV-2450 spectrophotometers (1 cm quartz cell).

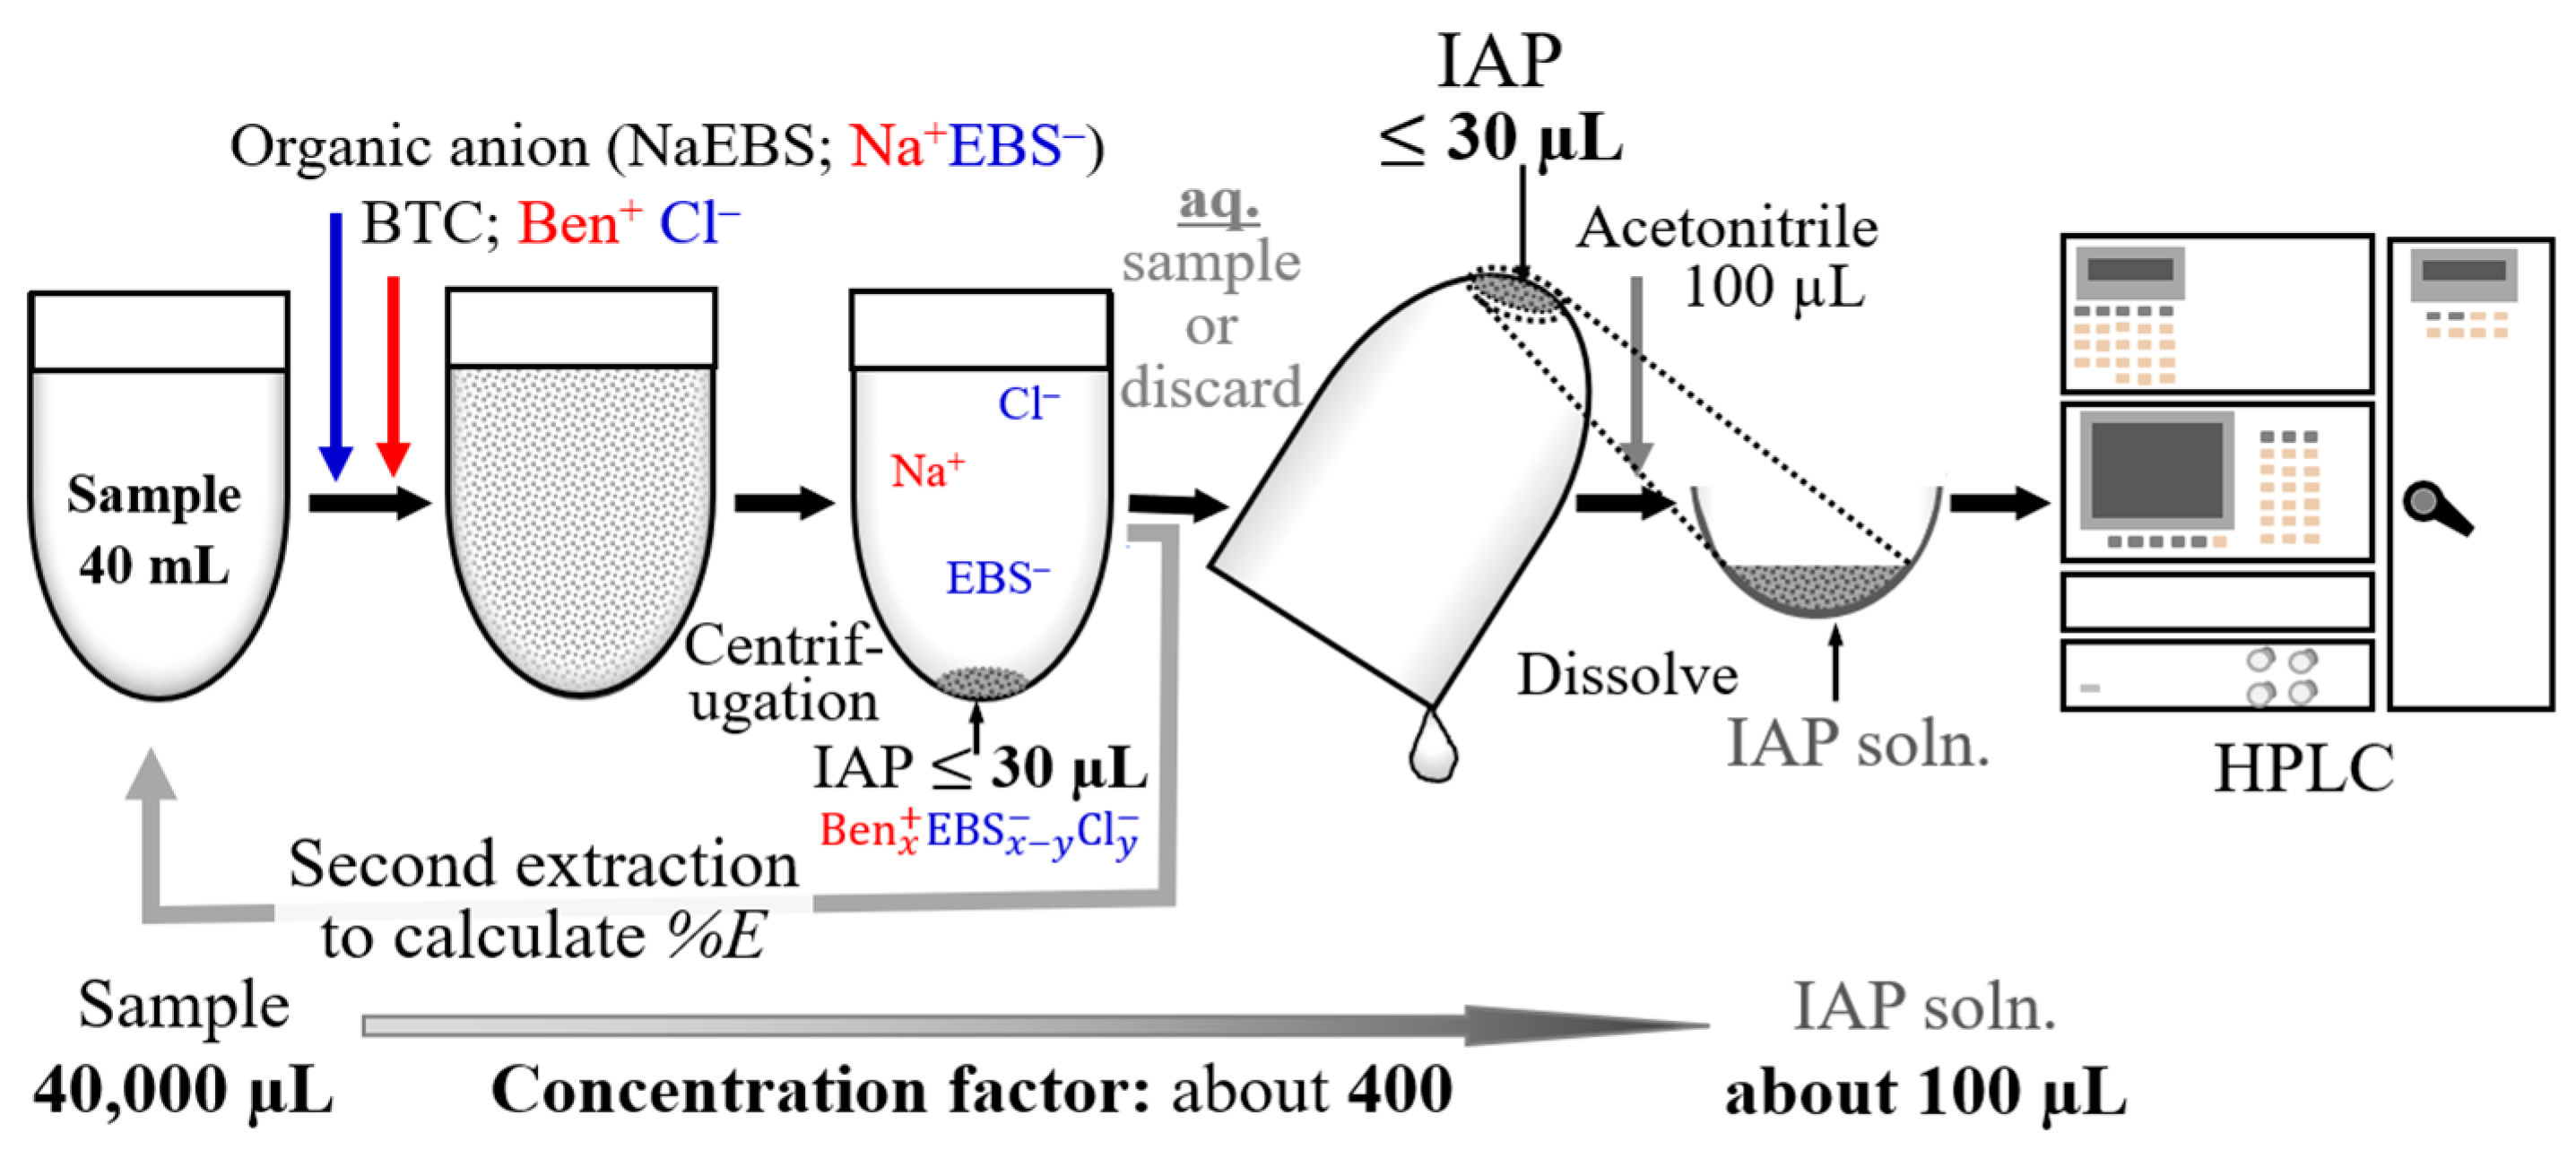
2.3. Determination of the Volume of IAP

To form the IAP, the organic anion solution (1.6 mL, 0.5 M) and BTC (0.2–3.0 mL, 0.1 M) were added to water (40 mL). After centrifugation, the aqueous phase was discarded, and the IAP was dissolved in acetonitrile (100 µL). The obtained IAP acetonitrile solution was aspirated with a microsyringe, and its volume was read from the microsyringe scale. The volume of the IAP (Viap) increased with the amount of added BTC. The equation describing this relationship was derived by least squares analysis, giving the Viap per 0.2 mL of BTC added.

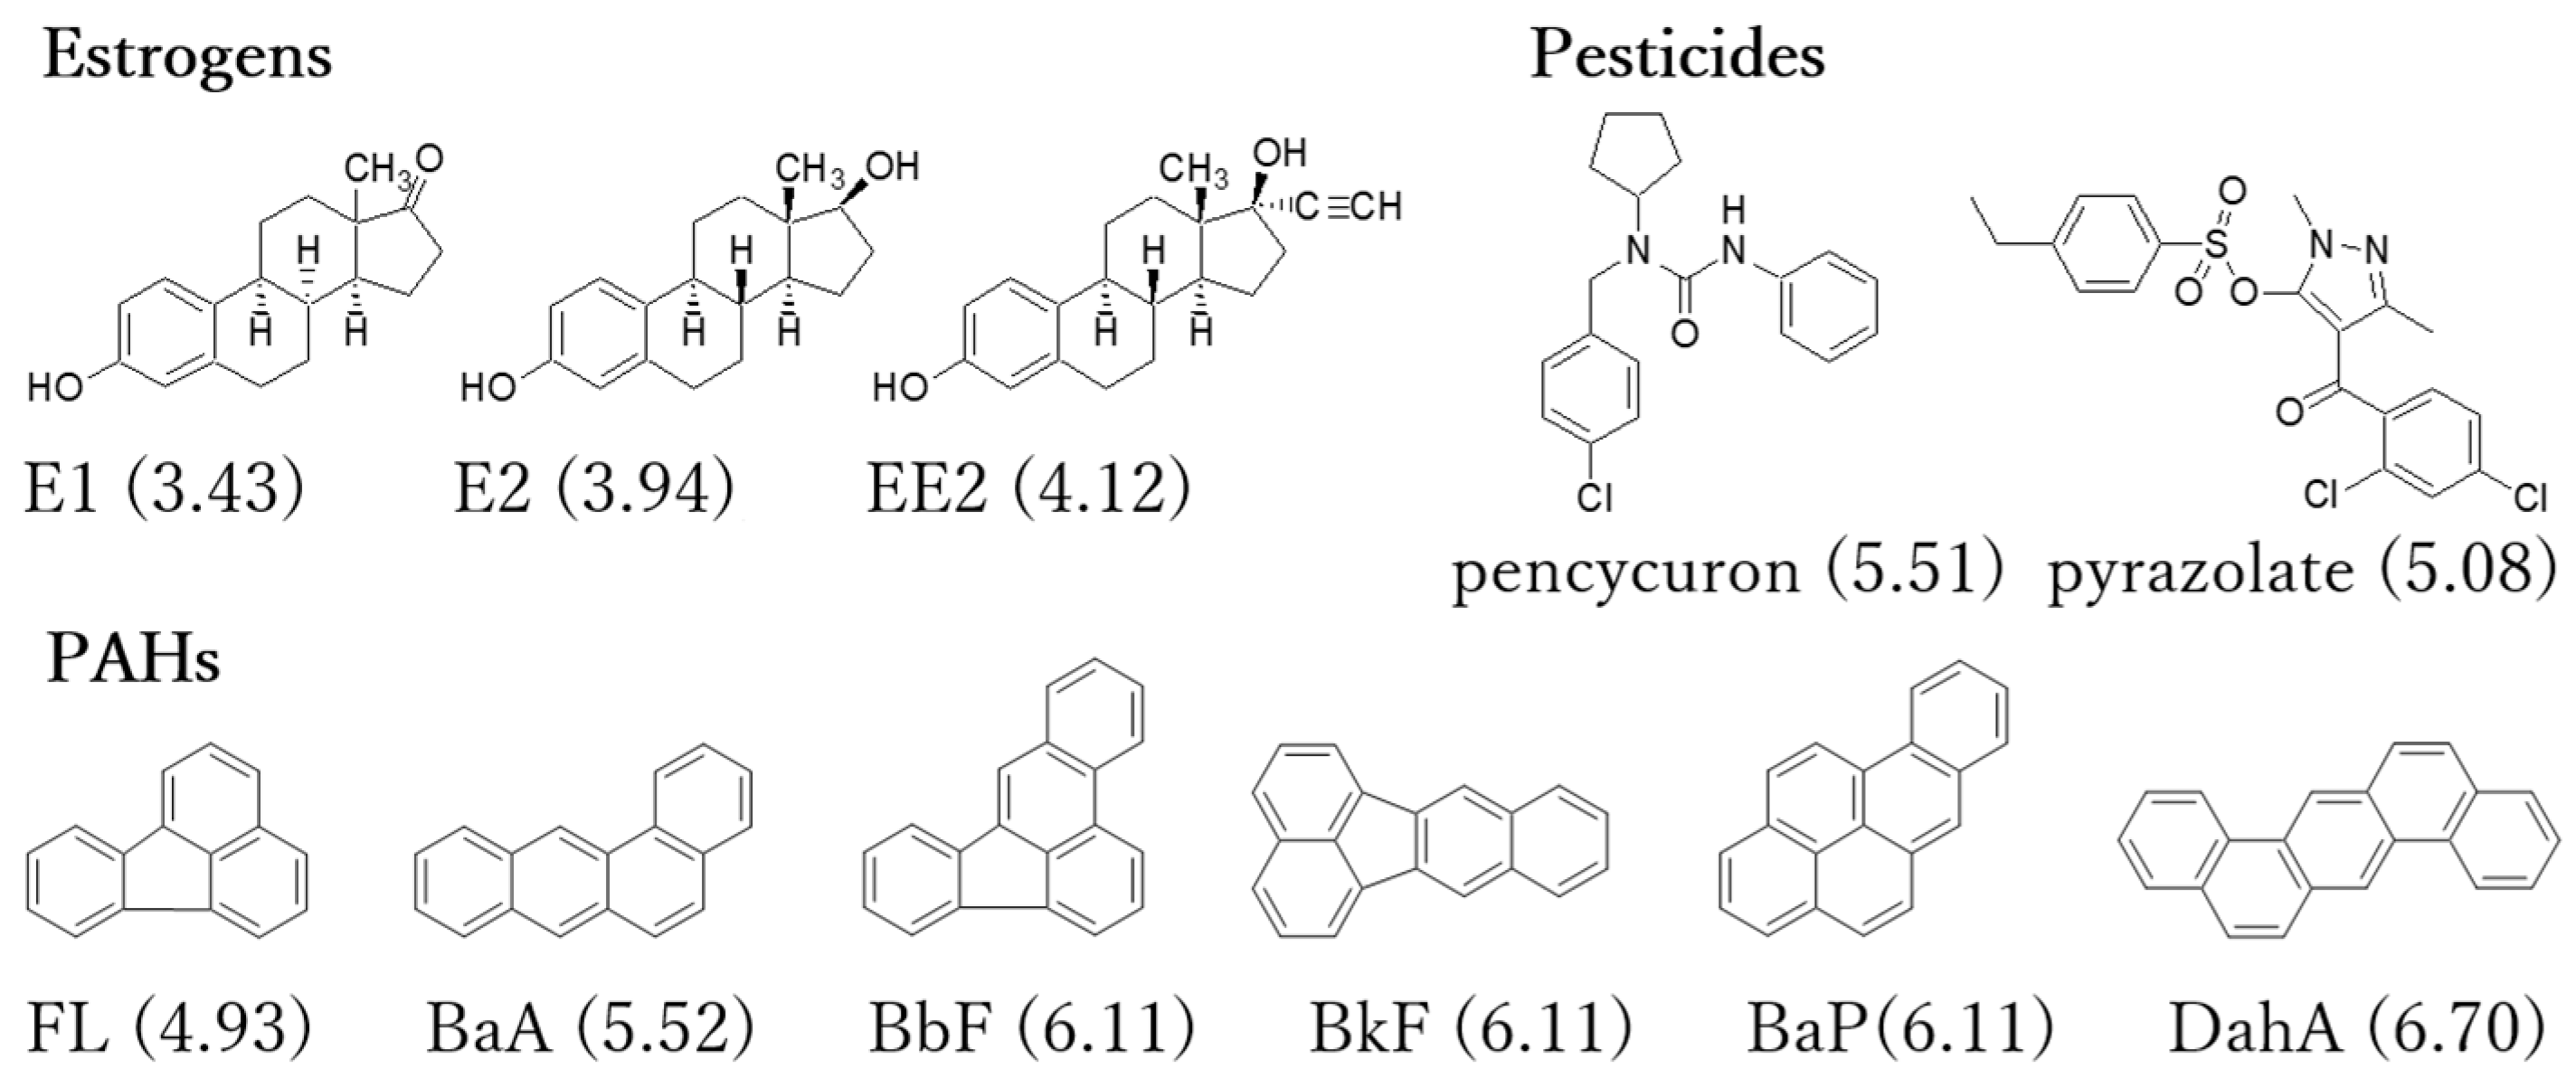
2.4. Determination of Percent Extraction (% E) of PAHs, Estrogen, and Pesticides in an IAP Consisting of Ben and EBS

A schematic illustration of the microextraction of an IAP formed in situ from the aqueous phase by adding BTC and NaEBS is shown in Figure 1. To prepare the IAP, the organic anions (1.6 mL, 0.5 M) and BTC (0.2 mL, 0.1 M) were added to the water sample (40 mL) in centrifuge tubes with different concentrations of the target compounds. After centrifugation at 3500× g rpm for 30 min, the IAP and aqueous phases were separated. The aqueous phase was transferred to another centrifuge tube, to which BTC (0.2 mL, 0.1 M) was added to form another IAP; this solution was centrifuged and separated from the aqueous phase (IAP separated second). The two IAPs were dissolved in acetonitrile (100 µL) and analyzed by HPLC-FLD, or HPLC-ECD, or HPLC-UV. The percent extraction (% E) of the PAHs and estrogens from IAPs consisting of BTC-EBS and BTC-TS was determined. Only the IAPs consisting of BTC-EBS was analyzed for pesticides.

3. Results and Discussion

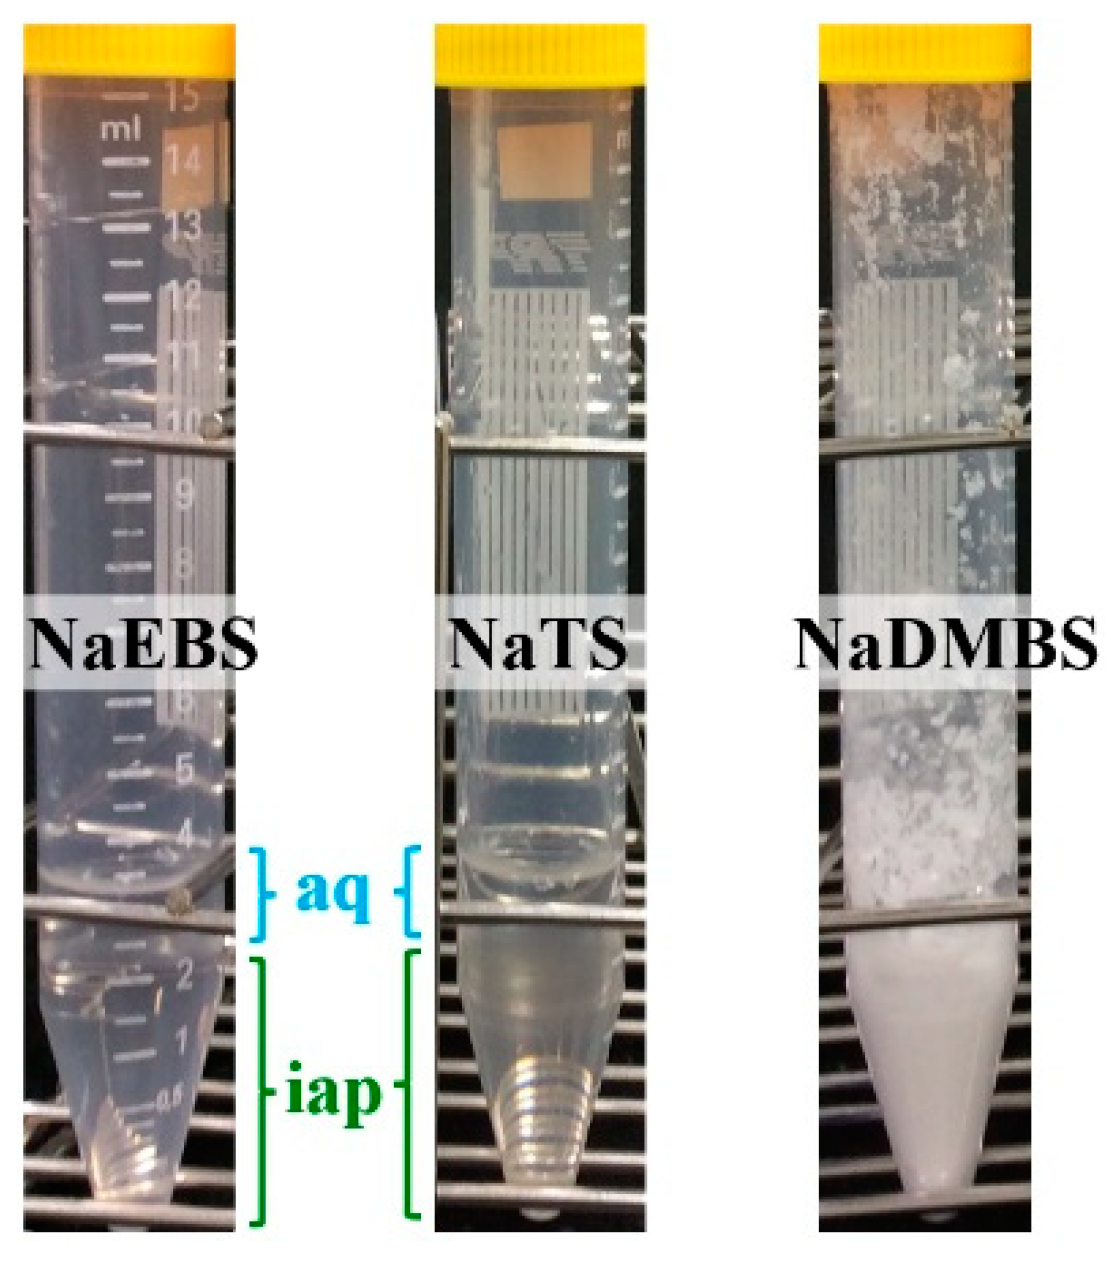
3.1. Analysis of IAP Combinations That Did Not Require pH Adjustment

Several types of organic ion associates were examined to identify suitable model IAPs to study the concentration conditions for the formation of further ion associates as solvents. Ben is a quaternary ammonium salt, which allows the preparation of solutions with higher concentrations than Zephyramine, allowing a wide concentration range to be considered; thus, all experiments used BTC as the organic cation source. Numerous types of anions were studied, with a focus on sulfonates, which are not affected by pH. The organic anions considered were benzenesulfonate, TS, 4-toluenesulfinic acid, EBS, 2,4-dimethylbenzenesulfonate, and alkylsulfonate (CnH2n+1SO3, CnS, n = 6–8). The IAP formed from some of the examined anions with Zephyramine floated [5,7], whereas those formed from Ben often formed at the bottom of the aqueous phase [5,9,10,11]. In the latter case, the IAP can be separated from the aqueous phase by decanting after centrifugation.
Unless otherwise noted, BTC and organic anion sources were added to 40 mL of sample water to produce 0.5 mM and 20 mM solutions, respectively. The solution of benzenesulfonate and BTC was cloudy, and the IAP could not be separated. The combination of 4-toluenesulfinate ion and BTC did not yield a cloudy solution, indicating that no ion associates were formed, likely owing to the high solubility of the ion associates in water. Ion associates were not formed even with high concentrations of organic anions and organic cations.
Although the solutions of benzenesulfonate, C6S and C7S and BTC were cloudy, no phase separation of the ion associates was observed, likely because the amount of ion associates formed was insufficient to form the IAP. The solution of C8S and BTC was cloudy, and the resulting ion associates formed a powdery solid.
The solutions of EBS, 2,4-dimethylbenzenesulfonate, and TS ions with BTC were cloudy, and the resulting ion associates could be separated by centrifugation.
Figure 2 shows photographs of a mixture containing the same concentrations of BTC and some organic anions with 120 mmol of water that was left overnight. BTC with NaEBS or NaTS produced clear IAPs when mixed with 40x the concentration of water; however, BTC with NaDMBS did not. BTC-EBS or BTC-TS are therefore more suitable as a model IAP than Ben+-DMBS.
The % E of the six PAHs in IAPs formed from BTC and EBS or TS was determined. IAPs from BTC-EBS show higher % Es than those from BTC-TS (Figure 3). Thus, IAPs from BTC-EBS are more suitable as model IAPs than those from BTC-TS.

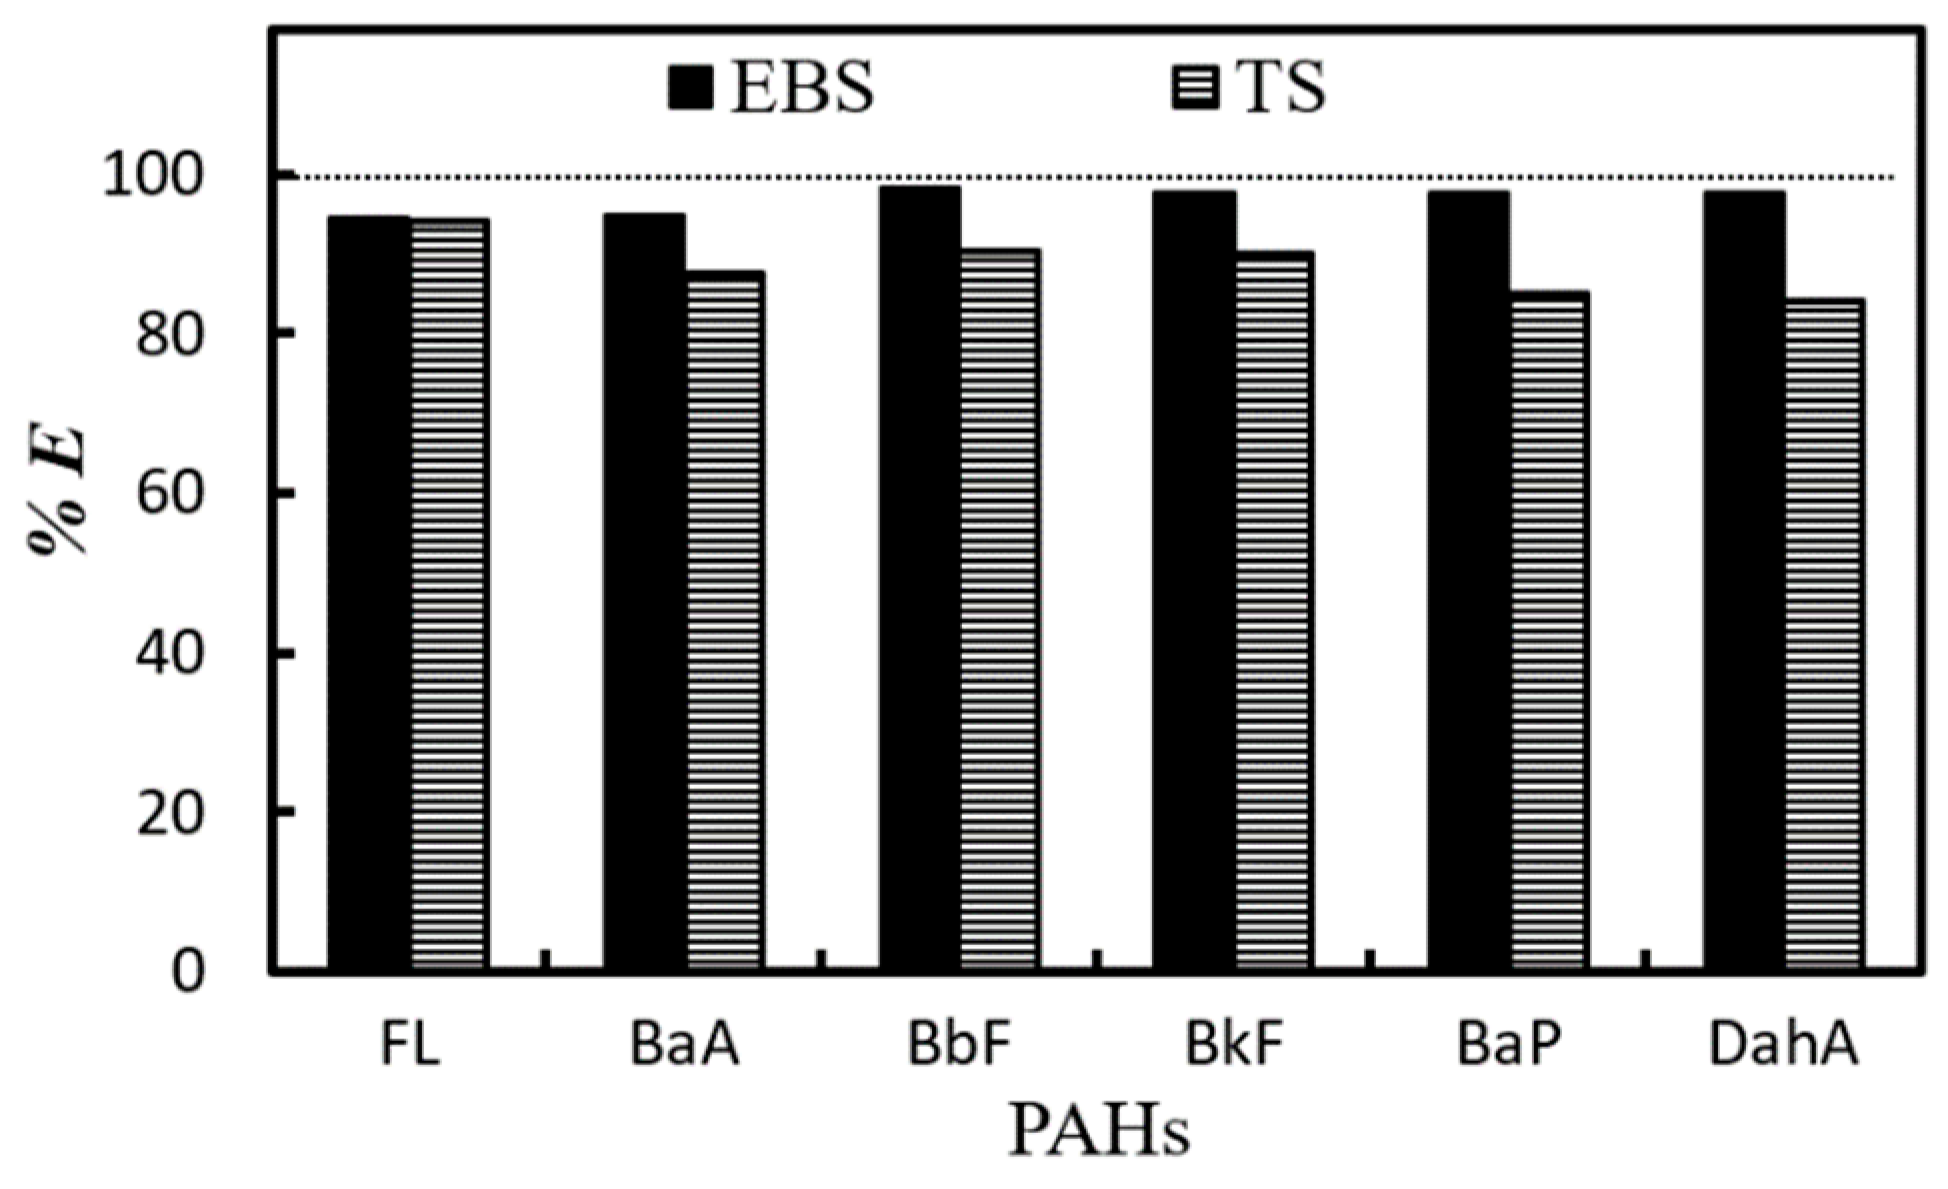
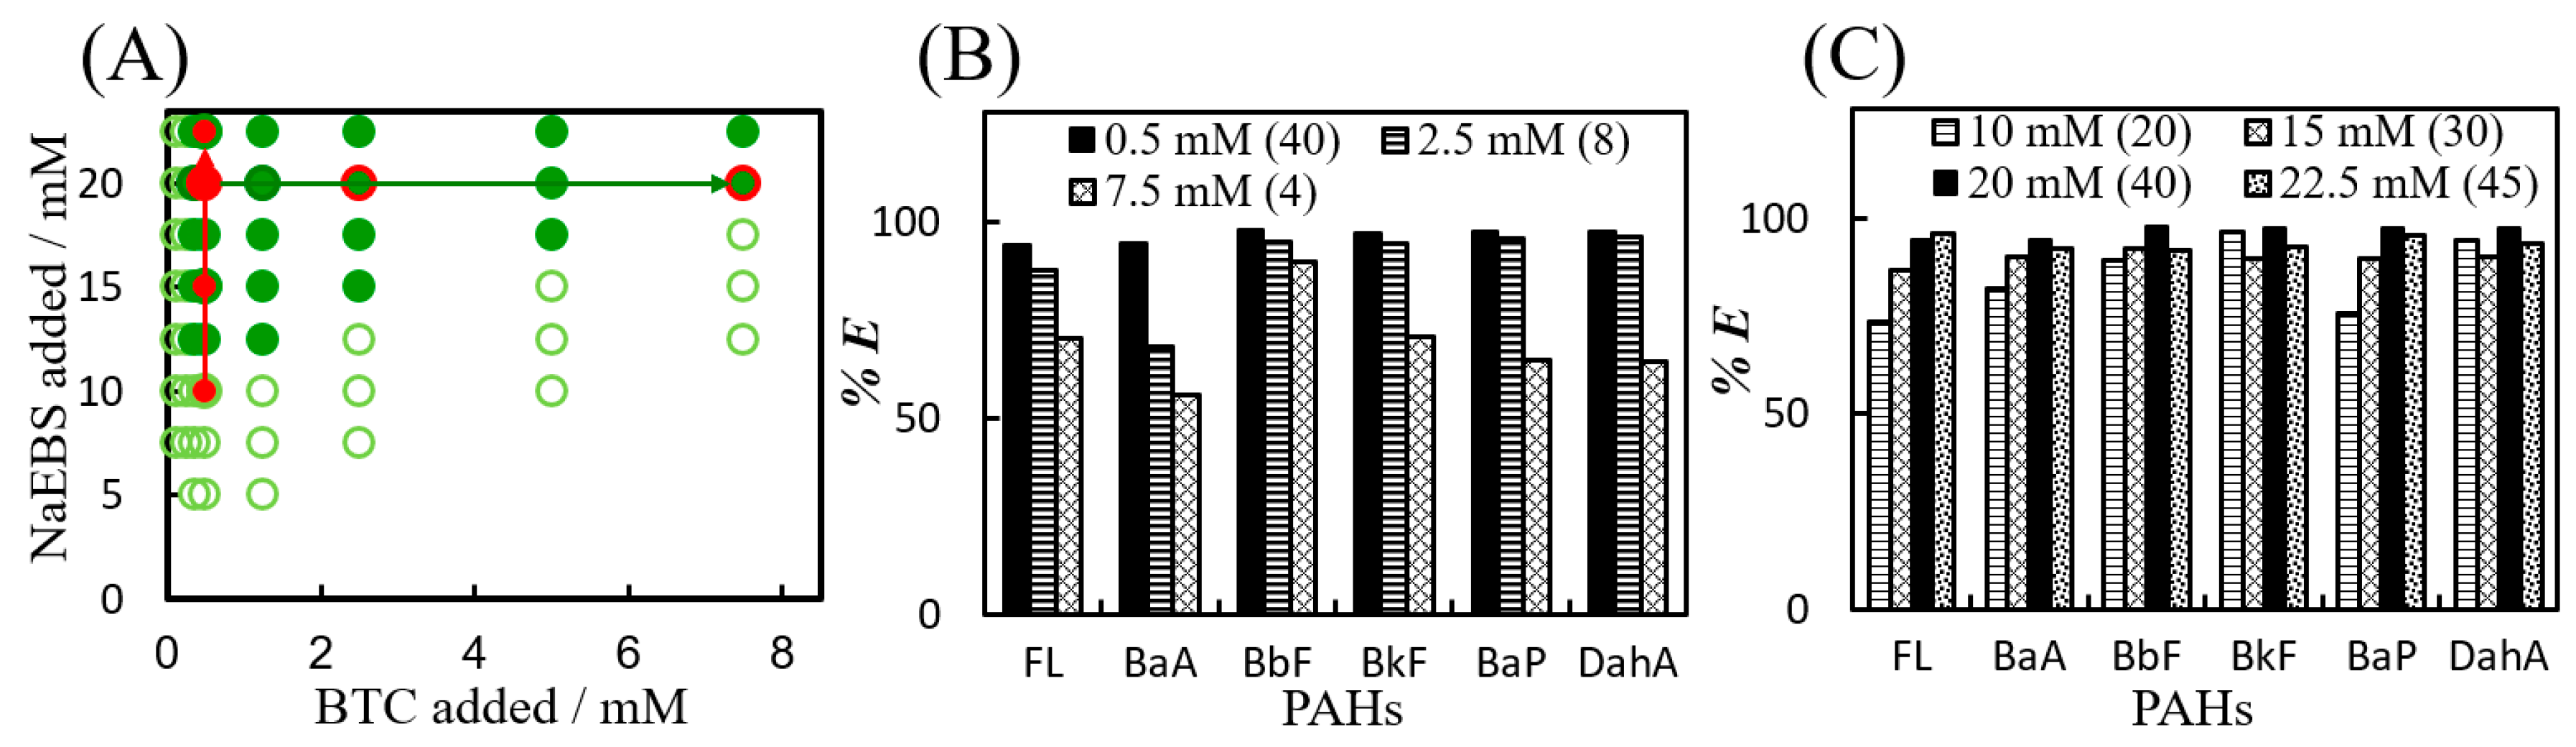
3.2. Effect of BTC and NaEBS Concentrations on PAH Extraction into IAPs

The effect of the concentrations of BTC and NaEBS on the extraction of PAHs was examined (Figure 4). The studied concentrations of BTC and NaEBS are plotted in Figure 4A. The data denoted by the filled (●) and open green circles (○) both indicate the formation of IAPs; however, the solution indicated by the former yields a clear aqueous phase, whereas that indicated by the latter yields a cloudy aqueous phase. The red circles denote the conditions under which the effects of the BTC (○) and NaEBS (●) concentrations were examined. The % E of the PAHs was extracted from two calibration curves obtained using different concentrations of BTC and NaEBS. % E was determined from the slopes of each calibration curve. The numbers in parentheses in Figure 4B,C are the molar ratios of NaEBS to BTC.
In one evaluation, the concentration of NaEBS was fixed at 20 mM by adding 8.0 mL of a 0.1 M solution, while that of BTC was varied (concentrations of 0.5, 2.5, and 7.5 mM were obtained by adding 0.2, 1.0, and 3.0 mL, respectively, of a 0.1 M solution). % E decreases with increasing BTC concentration within the examined concentration range (Figure 4B). This may result from the comparative lack of NaEBS relative to BTC or from the increased Viap.
In another evaluation, the concentration of BTC was fixed at 0.5 mM by adding 0.2 mL of a 0.1 M solution and the concentration of NaEBS was varied to (concentrations of 10, 15, 20, and 22.5 mM were obtained by adding 4.0, 6.0, 8.0, and 9.0 mL, respectively, of a 0.1 M solution). The respective % E values show that a NaEBS concentration of 20 mM results in the highest % E (Figure 4C).
High PAHs recoveries (94.6–98.2%) were obtained using BTC and NaEBS at concentrations of 0.5 mM and 20 mM (8.0 mL), respectively. The results obtained with 0.5 mM BTC and 0.5 mM NaEBS are denoted by the filled black bars in Figure 4B,C.

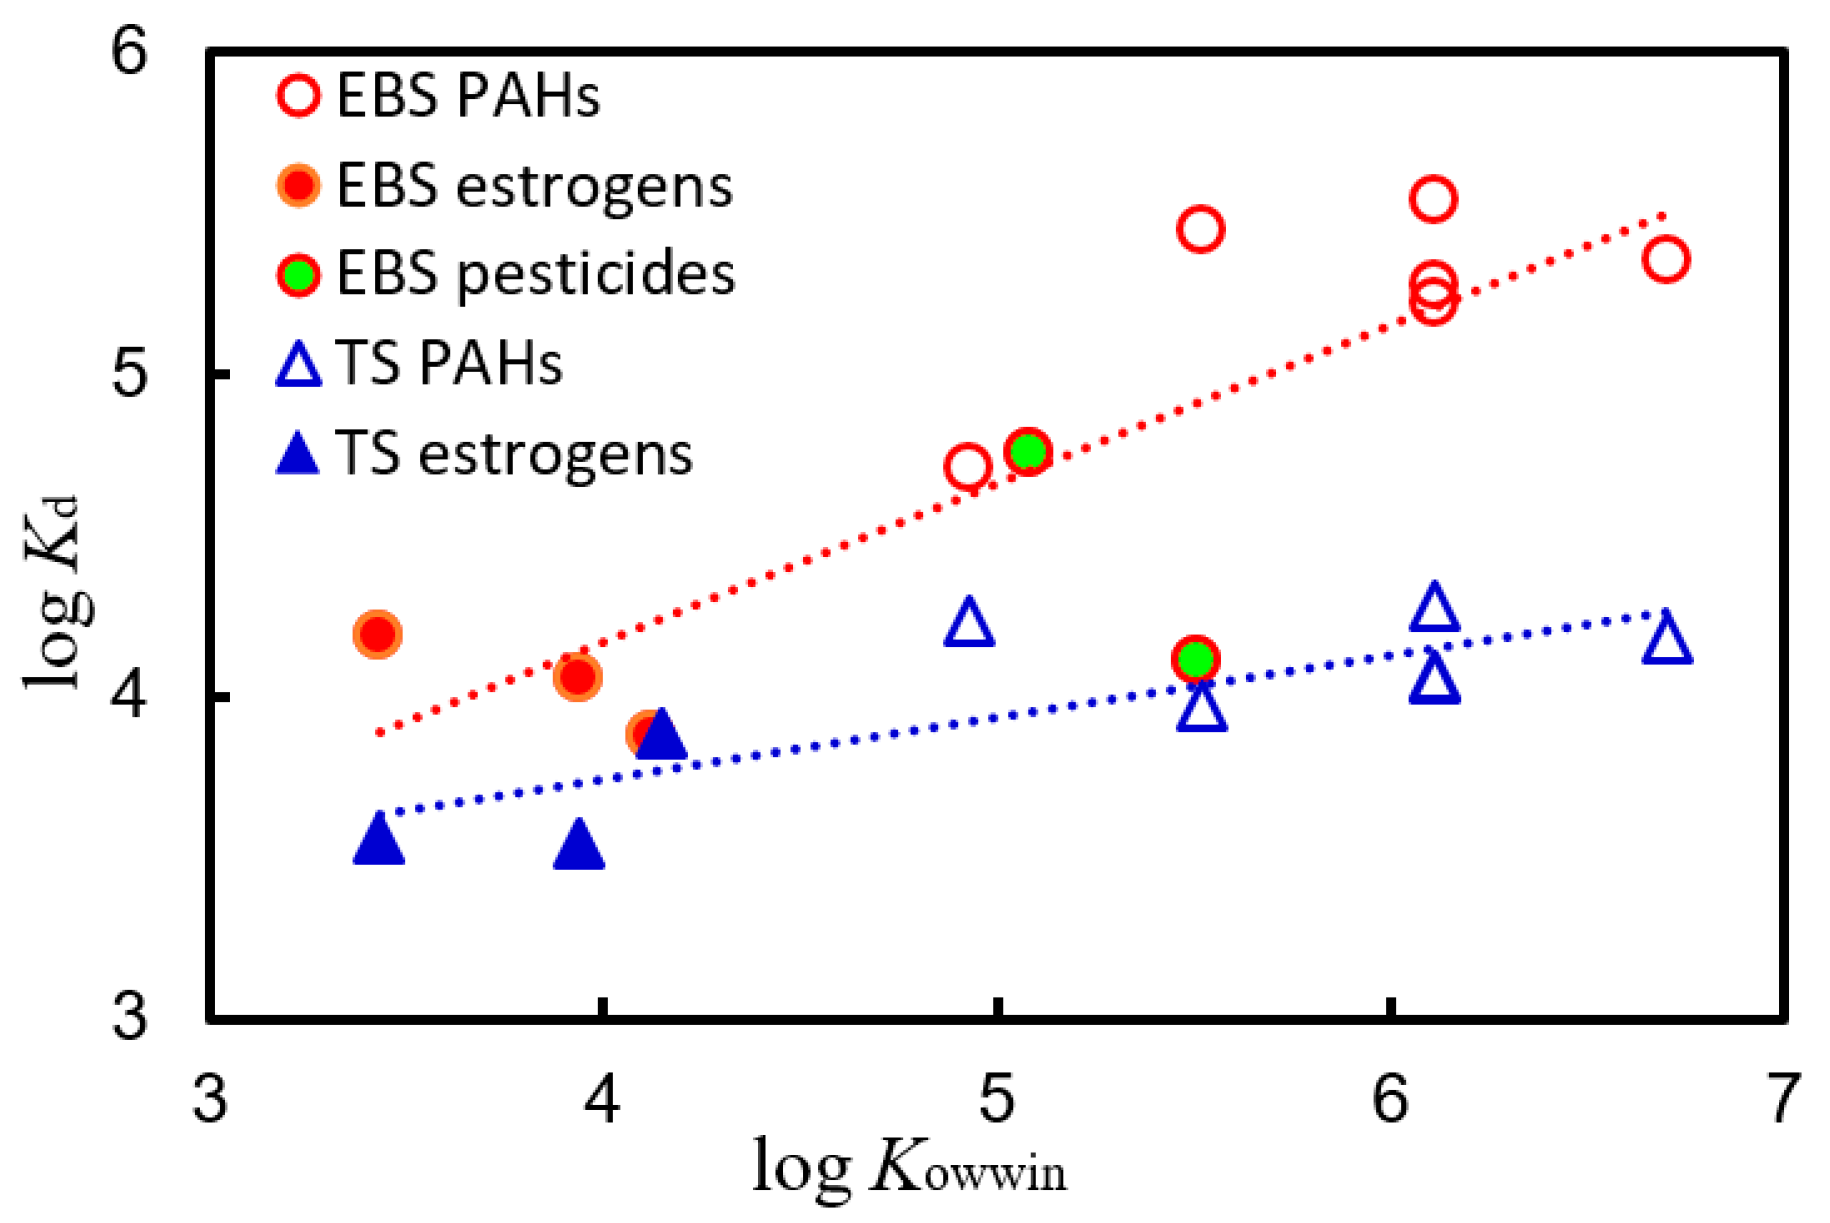
3.3. Distribution Coefficients for PAHs, Estrogens, and Pesticides

To evaluate the formed IAPs, the distribution coefficients of several environmental pollutants in IAPs consisting of BTC and TS or EBS ions were compared to the octanol-water distribution coefficients (Kow). The distribution coefficients were calculated from % E and Viap. Calibration curves were obtained based on the peak area or peak height in the first and second extractions, and % E was calculated from the slopes of the curves. Let “Grad” be the slope when % E is 100%; then, Equations (1) and (2) are obtained from the slopes, Grad1 and Grad2, of the first and second extraction calibration curves, respectively (Figures S2 and S3).
Grad 1 = Grad × %   E 100
Grad 2 = ( G r a d × 100 %   E 100 ) × %   E 100  
Solving this system of equations yields % E.
%   E = G r a d 1 G r a d 2 G r a d 1 × 100
E = G r a d 1 G r a d 2 G r a d 1
Assuming that the solute does not ionize and takes only one form, Kd is defined as:
K d = E ( 1 E ) × V a q V i a p
where Vaq and Viap are the volumes of the aqueous phase and IAP, respectively.
The denominator of % E is the total concentration in the IAP and the aqueous phase, whereas the denominator of Kd is the concentration in the aqueous phase.
To determine Viap, the amount of BTC added to form the IAP was varied. After centrifugation, the aqueous phase was discarded, dried, and dissolved in acetonitrile (100 µL), and Viap was measured with a microsyringe. The Viap of EBS, toluenesulfonate, and dimethylbenzenesulfonate increased by 52 µL, 54 µL, and 48 µL, respectively, for each additional 1 mL of the 0.1 M BTC solution. Thus, Viap was approximately 10 µL when 0.2 mL of 0.1 M BTC solution was added.
Dissolving 10 μL of the IAP in an organic solvent and resulted in a Ben concentration several times higher. Therefore, Viap was assumed to be 30 µL for the purposes of calculating the distribution coefficient.
The chemical structures of the environmental pollutants studied are shown in Figure 5. The relationship between the octanol-water distribution coefficients (log Kow) and the distribution coefficients of the IAP (log Kd) is shown in Figure 6. Here, log Kowwin, estimated using the EPI Suite software [27], was defined as log Kow.
The correlation between log Kowwin and log Kd indicates that hydrophobic chemicals are more readily extracted into the IAP. The IAPs consisting of Ben+ and EBS generally exhibits higher distribution coefficients than those consisting of Ben+ and TS.
The log Kd of pencycuron is considerably lower than that estimated from log Kowwin, implying that some of the pencycuron was ionized, or that the actual log Kow is much smaller [28,29].
IAP consisting of Ben+ and EBS can have similar extraction power to octanol for hydrophilic chemicals (log Kowwin < 5.5) and an apparent log Kd of about 5.5 for highly hydrophobic chemicals. The aqueous phase and IAP were separated by centrifugation; however, a very small amount of the IAP remained in the aqueous phase. As the distribution coefficient increased, the amount of the IAP remaining in the aqueous phase became negligible. Therefore, it is possible that high distribution coefficients are underestimated.
Even E1 (log Kow = 3.43), which is much less hydrophobic than the other analytes, exhibits a very large distribution coefficient of log Kd = 4 or more.

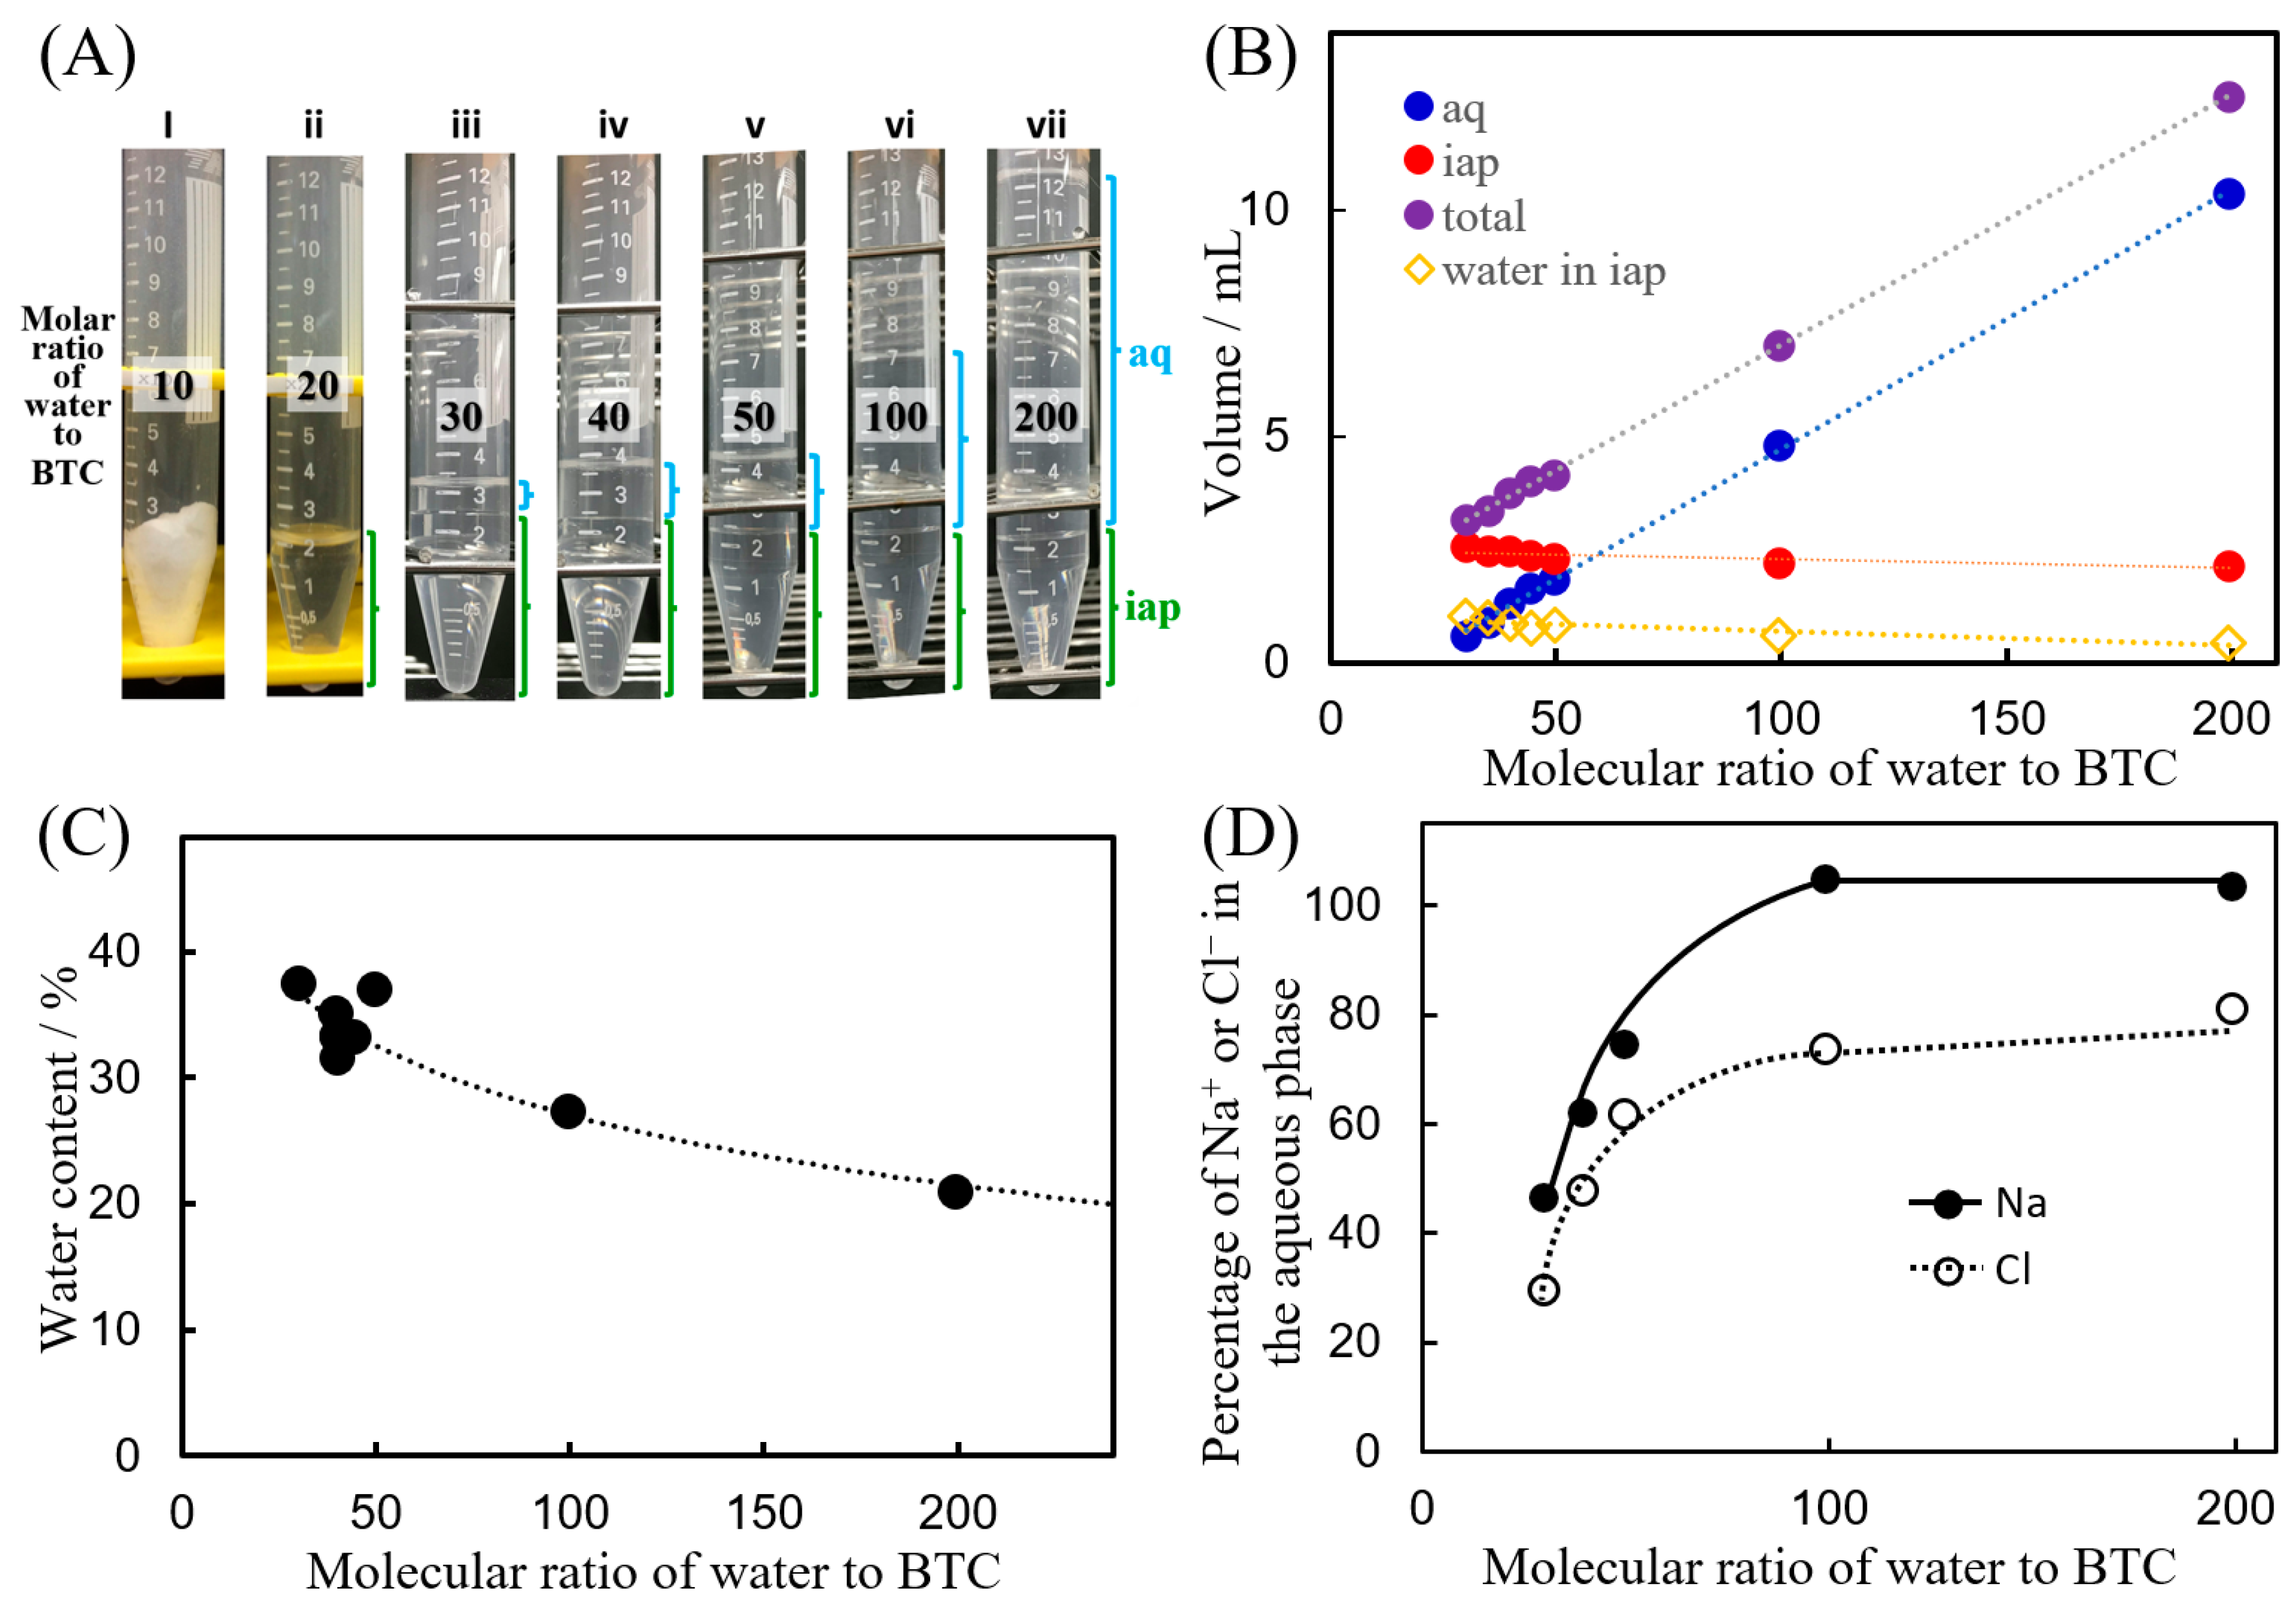
3.4. Composition of the IAP: Water Content, Chloride Ion Concentration, and Sodium Ion Concentration

Figure 7A shows solutions of BTC and NaEBS in water which were mixed well and left overnight. The addition of only 10 times more moles (30 mmol) of water relative to BTC or NaEBS does not result in a homogeneous and clear IAP (Figure 7(Ai)). An amount of water equivalent to approximately 20 times the molarity (60 mmol) of BTC or NaEBS is required to produce IAPs (Figure 7(Aii)). As the amount of water added increases, the volume of the aqueous phase of the IAP increases (Figure 7A). The volume of IAP, aqueous phase, and total volume, as read from the centrifuge tube scale, are shown in Figure 7A. The volume of water in the IAP was calculated by subtracting the volume of the aqueous phase from the volume of water added. The volume of the aqueous phase increases linearly with the amount of water added, while those of the IAP and of the water in the IAP decrease linearly (Figure 7B). Figure 7A depicts the solution obtained from a mixture of 3 mmol each of BTC and NaEBS, which was added to water, shaken well, and allowed to stand for at least 24 h. The molar ratio of water (water/(BTC or NaEBS)) at which the volume of the aqueous phase (aq) is 0 mL, or is at the intersection of the total and IAP volume, is 18 times higher (Figure 7B), implying that 18 times as much water is required to form a clear and homogeneous IAP from a 1:1 mixture of BTC and NaEBS. The amount of water transferred to the IAP was determined from the volume of the aqueous phase formed and the amount of water added.
The volumes of the aqueous phases and IAPs that were formed and separated measured using the centrifuge tube scale. The volume of the aqueous phase was subtracted from the total Viap (Equation (6)).
Volume of water in the IAP = volume of added water − volume of the aqueous phase
As the amount of added water increased, an increasing amount of the IAP dissolved into the aqueous phase.
The centrifuge tube, in which the IAP was formed and the aqueous phase was discarded was weighed before and after decompression drying to determine the moisture content. The moisture content of the IAP consisting of BTC and EBS was 24%. The water content can also be determined by mixing BTC, NaEBS, and water; the water content can then be determined using Equation (7). The water contents thus obtained are plotted in Figure 7C.
Water   content = ( volume   of   added   water     volume   of   aqueous   phase ) V i a p × 100
Taking Figure 7(Av) as an example, 300 mmol (5.4 mL) of water was added to 3 mmol each of BTC and NaEBS, mixed well, and left to stand for 24 h, resulting in 4.8 mL of the aqueous phase and 2.2 mL of the IAP. The water content in 2.2 mL of the IAP is 5.4 − 4.8 = 0.6 mL, giving a moisture content of 27%. The water content in the IAP formed from BTC and NaEBS is approximately 30% (Figure 7C). At a molar ratio of 1:200 between the ion-associate component (BTC or NaEBS) and water, the moisture content is 21%, which is in good agreement with that by decompression drying.
The chloride ion and sodium ion concentrations in the aqueous phase were measured by ion chromatography (Figure 7D). As the proportion of water increases, the concentration of chloride ion in the aqueous phase increases and reaches a plateau at approximately 80%. Subsequently, the concentration of chloride ion in the ionic coalescent phase decreases and reaches a minimum at approximately 20%. This implies that a proportion of of chloride ion remains in the IAP.
As shown in Figure 7B, Viap is 2.5 mL when the ratio of water to Ben+ is 18. Assuming that all Ben+ forms the IAP and is not present in the aqueous phase, the concentration of Ben+ in the IAP is 1.2 M when the ratio of water to Ben is 18 and is 1.4 M when the ratio is 200.

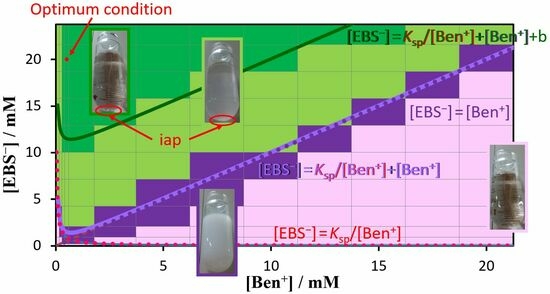
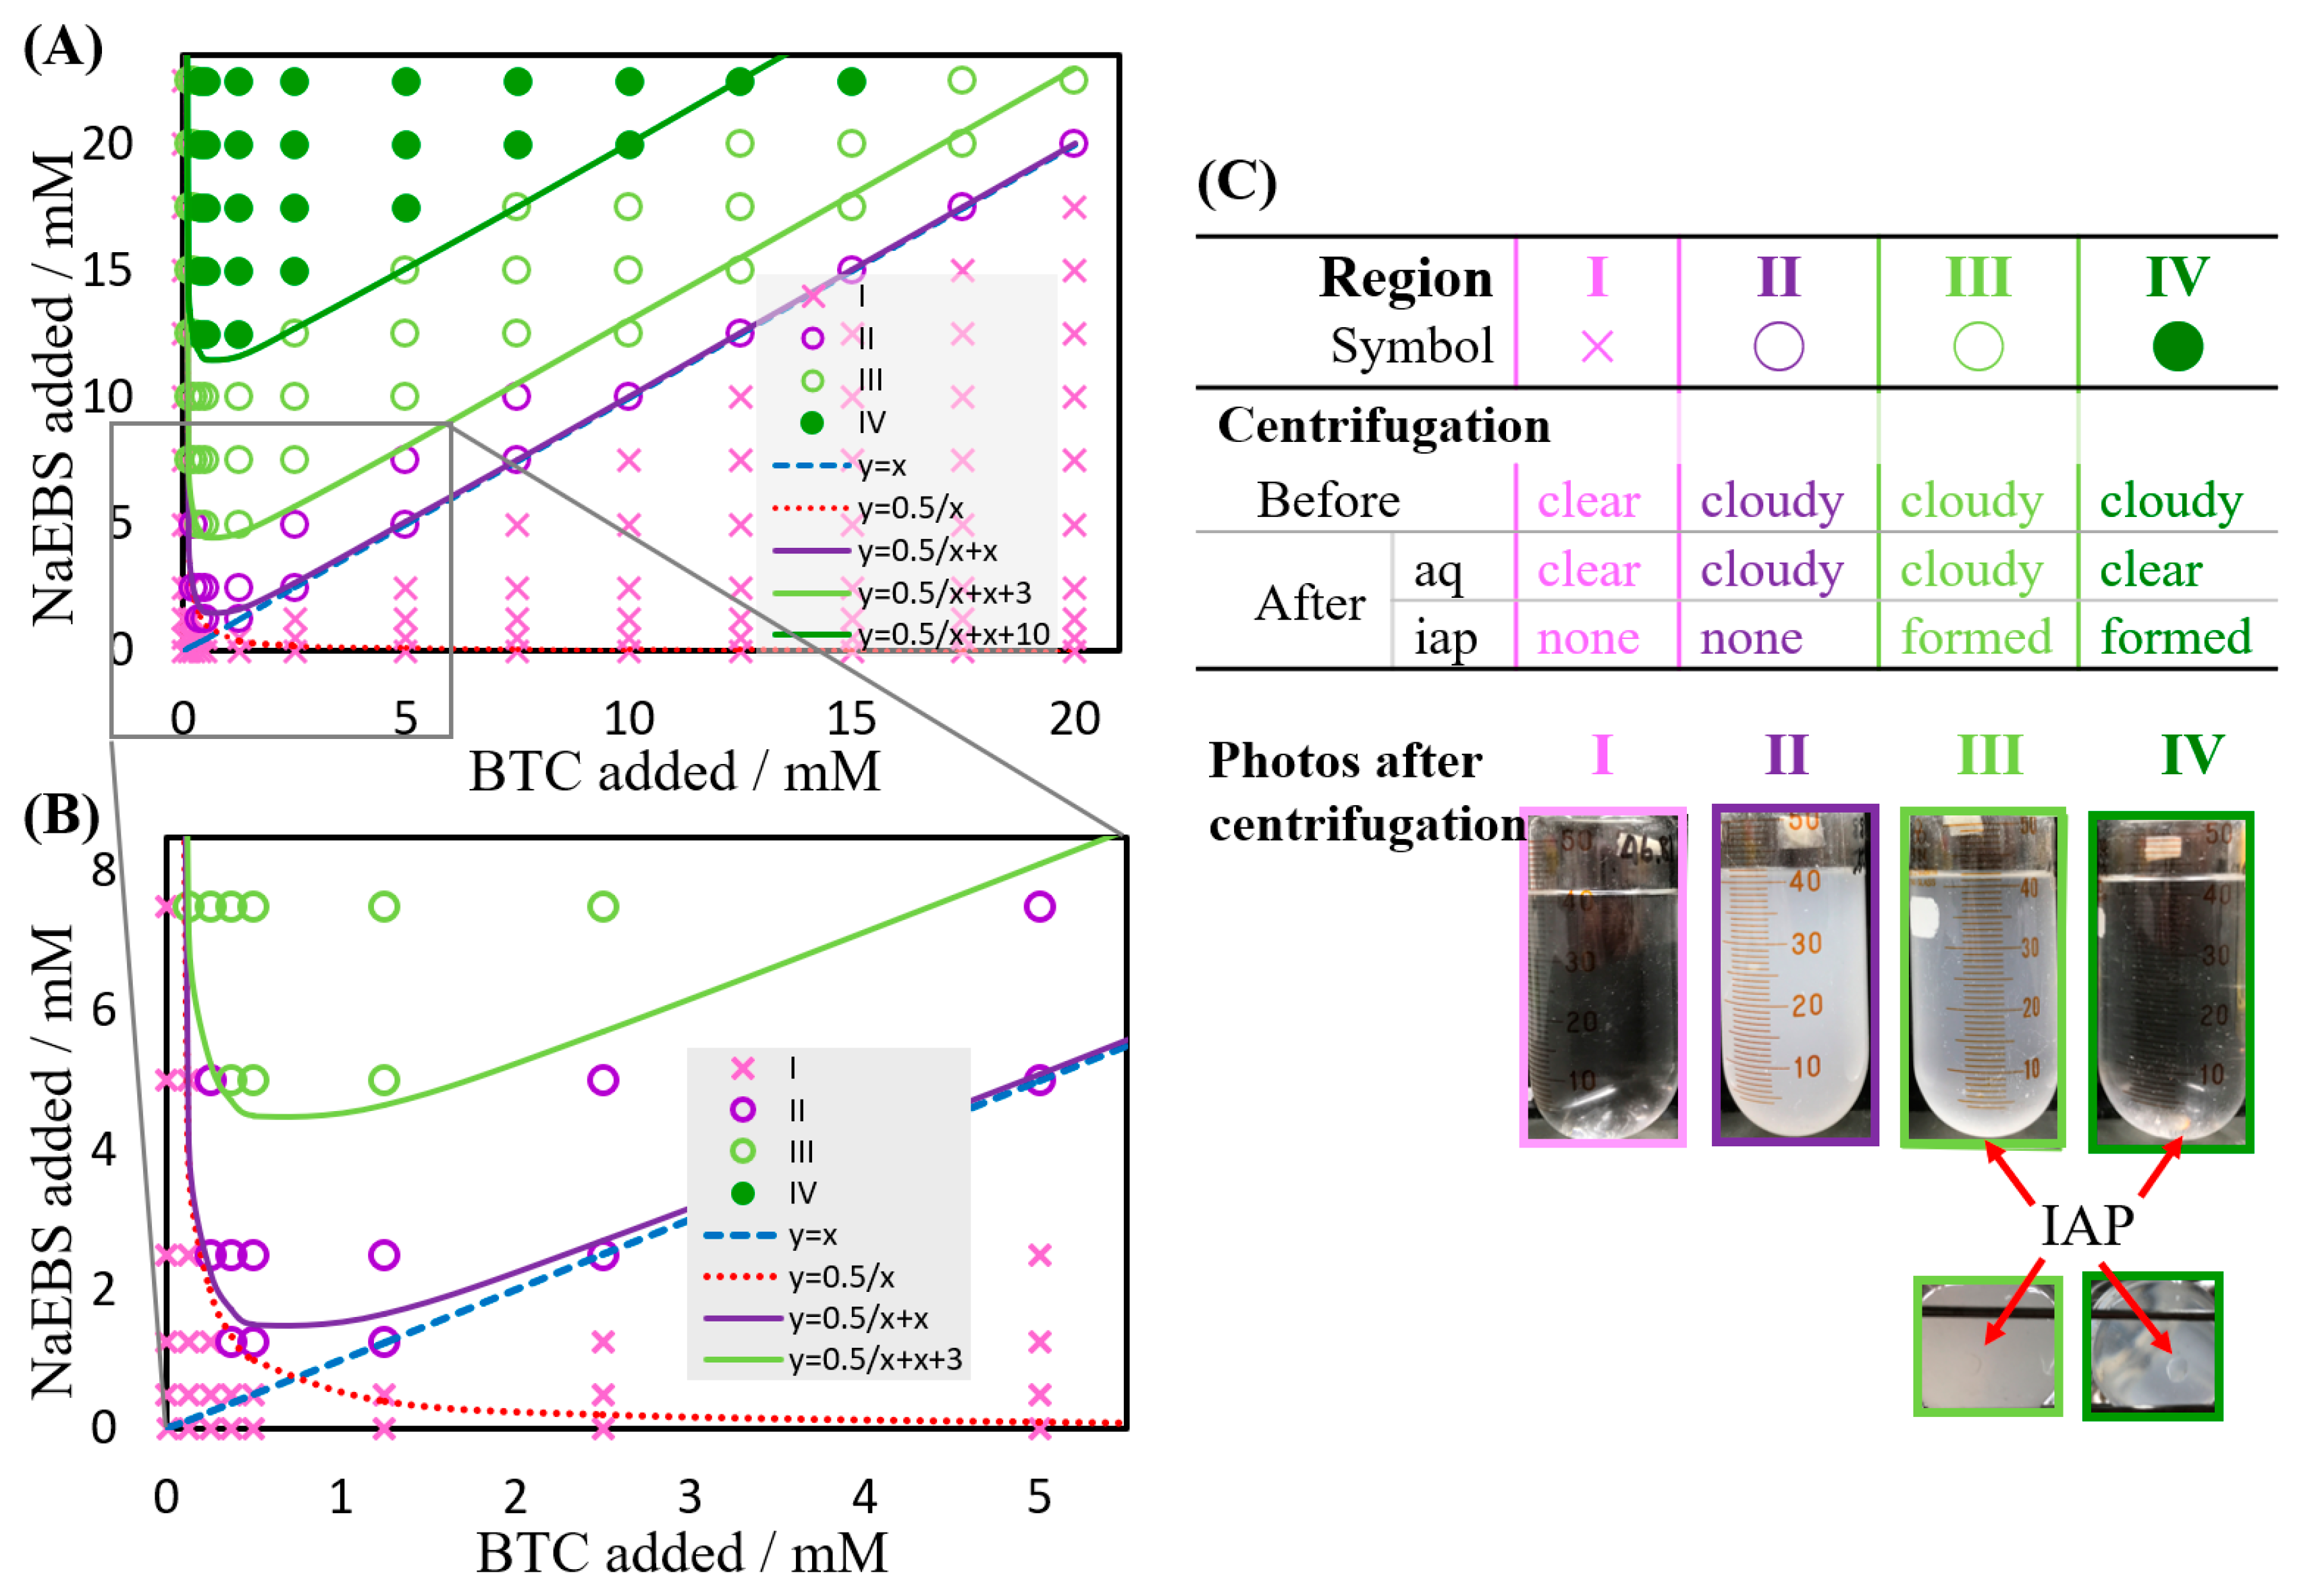
3.5. Regions of Ion Associate and Solvent Formation

Two-dimensional changes in the concentrations of BTC and NaEBS were investigated during the formation of ion associates and solvents (Figure 8).
Region I (Figure 8) can be divided into two regions with the same transparency. No ion associates are formed in one of these regions. When [EBS] < [Ben⁺], the Ben ions themselves may aggregate, thereby forming micelles, which cause ion associates to dissolve and prevent their isolation. In the presence of EBS ion, the association of EBS and Ben ions is thought to inhibit the aggregation of the Ben ion. In Region II, ion associates are formed and the solution becomes turbid, but no IAP is produced by centrifugation; thus, the ion associates are not produced in sufficient quantity for the IAP to be formed. In Region III, ion associates are formed and centrifugation produces an ion associate phase: however, the aqueous phase is turbid. In Region IV, ion associates are formed and centrifugation produces an IAP. The aqueous phase is also clear.
The conditions under which a new phase may precipitate can be described as follows:
(1) The theory of dissolution of insoluble salts (solubility product) is satisfied, i.e.,
[ EBS ]   ×   [ Ben + ] = K s p   ( constant )
holds.
(2) Ion associates are formed in the region satisfying [EBS] > [BTC].
[ EBS ] = [ Ben + ] + K s p / [ Ben + ]
The condition for the formation of the liquid IAP is
[ EBS ]   >   [ Ben + ] + K s p / [ Ben + ] + 10
K s p /[Ben+] is related to the solubility product of the insoluble salt, [EBS] [Ben+] = K s p , i.e., the ion product is constant. The Ben ion is a cationic surfactant that solubilizes organic matter by forming micelles. The coexistence of EBS ion may reduce the number of Ben ion that can form micelles and therefore reduce the solubilizing ability of Ben ion. In other words, ion associates may not form unless EBS ion are present at a concentration greater than that of Ben ion. Liquid IAPs are not formed unless a sufficient amount of ion associates is formed.
The optimal conditions for the extraction of PAHs into the IAPs required 40 times more NaEBS than BTC. Extraction with a 1:1 mixture of BTC:NaEBS and 200 times that amount water left 19% Cl in the IAP (Figure 7D). The Kowwin term does not depend on the concentrations of the inorganic compounds. For reference, the calculated Kowwin value of Cl is greater than that of EBS; thus, it is likely that a certain amount of Ben is present as Ben+ Cl.
BenCl + EBS ⇌ BenEBS + Cl
          0.19   0.19    0.81   0.81   mole ratio
Expressing the equilibrium in the above equation in terms of K gives:
K = n B e n E B S n B e n C l × n C l n E B S = constant
where nBenCl, nEBS, nBenEBS, and nCl are the mole ratios of BenCl, EBS, BenEBS, and Cl, respectively. The percentage of Ben+ EBS in the IAP increases with the concentration of NaEBS. Assuming that K is constant, the calculated value of nBenEBS when 40 times the number of moles of EBS are added to BenCl, is more than 0.998 that of Ben. Accordingly, Ben+ EBS is more likely to extract PAHs than Ben+ Cl. This nBenEBS value is obtained using the Cl value when 200 times more water is added to BTC and EBS. As the percentage of water increases, the Cl concentration decreases, making the nBenEBS value much closer to 1; thus, the presence of Cl cannot be ignored when considering the formation of ion associates.

4. Conclusions

The formation of an IAP composed of EBS and Ben+ requires:
(1) The formation of ion associates (i.e., precipitated microparticles due to the solubility product.)
(2) The presence of excess EBS, which promotes the growth of particulates (colloids). The quantitative collection of PAHs requires that the concentration of NaEBS is higher than that of BTC. The IAP contains water.
IAP extraction is capable of several hundred-fold enrichment and is applicable to the enrichment of trace constituents in a range of environmental water samples beyond those considered in this study. The success of IAP microextraction with Ben and EBS was confirmed by UV, fluorescence, and electrochemical detection using various detection principles. This confirmation can be made using electrochemical reaction, such as that of estrone, even if the hydrophobicity is small. Ben and EBS exhibit UV absorption and fluorescence; therefore, substances with low hydrophobicity cannot be detected owing to the presence of the Ben and EBS peaks in the UV and fluorescence spectra. Accordingly, a combination of organic cations and anions that exhibit lower UV absorption than BTC and EBS, i.e., that lack benzene rings or imidazolium groups, is required. This will reduce the influence of the IAP components in the HPLC analysis of environmental pollutants.

Supplementary Materials

The following supporting information can be downloaded at: https://www.mdpi.com/article/10.3390/appliedchem3010003/s1, Figure S1: Structures of organic ions constituting the ion-associate phase (IAP), Figure S2: Scheme for measuring percentage extraction, Figure S3: Example of calibration curves for calculating percentage extraction.

Author Contributions

Conceptualization, N.H., A.I. and S.T.; methodology, N.H. and A.I.; investigation, N.H., A.I., R.Y., M.M., N.K., T.K. and K.S.; resources, N.H., K.S., H.K. and S.T.; writing—original draft preparation, N.H., A.I. and S.T.; writing—review and editing, N.H., A.I., N.K., K.S., H.K., S.T. and S.T.; visualization, N.H., A.I., M.M., N.K. and S.T.; supervision, N.H., K.S., H.K. and S.T.; project administration, N.H.; funding acquisition, N.H. All authors have read and agreed to the published version of the manuscript.

Funding

This work was supported by the Japan Society for the Promotion of Science (JSPS) KAKENHI Grant Numbers 19K05561 and JP23615004.

Acknowledgments

We thank the student in our Laboratory, T. Tuchida, for his preliminary experiments.

Conflicts of Interest

The authors declare no conflict of interest.

References

  1. Beshana, S.; Hussen, A.; Seyoum Leta, S.; Kaneta, T. Dispersive liquid–liquid microextraction coupled with microfuidic paper-based analytical device for the determination of organophosphate and carbamate pesticides in the water sample. Anal. Sci. 2022, 38, 1359–1367. [Google Scholar] [CrossRef] [PubMed]
  2. Fattahi, N.; Shamsipur, M.; Nematifar, Z.; Babajani, N.; Moradi, M.; Soltani, S.; Akbari, S. Novel deep eutectic solvent-based liquid phase microextraction for the extraction of estrogenic compounds from environmental samples. RSC Adv. 2022, 12, 14467–14476. [Google Scholar] [CrossRef] [PubMed]
  3. Kohama, N.; Matsuhira, K.; Okazaki, T.; Sazawa, K.; Hata, N.; Kuramitz, H.; Taguchi, S. Colorimetric analysis based on solid-phase extraction with sedimentable dispersed particulates: Demonstration of concept and application for on-site environmental water analysis. Anal. Bioanal. Chem. 2022, 414, 8389–8400. [Google Scholar] [CrossRef] [PubMed]
  4. Song, X.L.; Li, J.H.; Xu, S.F.; Ying, R.J.; Ma, J.P.; Liao, C.Y.; Liu, D.Y.; Yu, J.B.; Chen, L.X. Determination of 16 polycyclic aromatic hydrocarbons in seawater using molecularly imprinted solid-phase extraction coupled with gas chromatography-mass spectrometry. Talanta 2012, 99, 75–82. [Google Scholar] [CrossRef] [PubMed]
  5. Hata, N.; Kasahara, I.; Taguchi, S. Micro-phase sorbent extraction for trace analysis via in situ sorbent formation: Application to the preconcentration and the spectrophotometric determination of trace ammonia. Anal. Sci. 2002, 18, 697–699. [Google Scholar] [CrossRef] [PubMed]
  6. Hata, N.; Kawashima, M.; Kasahara, I.; Taguchi, S. Micro-phase sorbent extraction for trace analysis via in situ sorbent formation: Application to the spectrophotometric determination of nitrite in environmental waters. Anal. Sci. 2003, 19, 239–243. [Google Scholar] [CrossRef] [PubMed]
  7. Mizuna, K.; Murashima, R.; Okazaki, T.; Sazawa, K.; Kuramitz, H.; Taguchi, S.; Nakayama, K.; Yamamoto, T.; Takamura, Y.; Hata, N. Organic Ion-associate Phase Extraction/Back-microextraction for the Preconcentration and Determination of Lithium Using 2,2,6,6-Tetramethyl-3,5-heptanedione by Liquid Electrode Plasma Atomic Emission Spectrometry and GF-AAS in Environmental Water. Anal. Sci. 2020, 36, 595–600. [Google Scholar] [CrossRef]
  8. Kosugi, M.; Mizuna, K.; Sazawa, K.; Okazaki, T.; Kuramitz, H.; Taguchi, S.; Hata, N. Organic Ion-Associate Phase Microextraction/Back-Microextraction for Preconcentration: Determination of Nickel in Environmental Water Using 2-Thenoyltrifluoroacetone via GF-AAS. Appl. Chem. 2021, 1, 130–141. [Google Scholar] [CrossRef]
  9. Hata, N.; Hieda, S.; Yamada, M.; Yasui, R.; Kuramitz, H.; Taguch, S. Formation of a liquid organic ion associate in aqueous solution and its application to the GF-AAS determination of trace cadmium in environmental water as a complex with 2-(5-bromo-2-pyridylazo)5-(N-propyl-N-sulfopropylamino)phenol. Anal. Sci. 2008, 24, 925–928. [Google Scholar] [CrossRef]
  10. Nakayama, K.; Yamamoto, T.; Hata, N.; Taguchi, S.; Takamura, Y. Liquid Electrode Plasma Atomic Emission Spectrometry Combined with Multi-Element Concentration Using Liquid Organic Ion Associate Extraction for Simultaneous Determination of Trace Metals in Water. Bunseki Kagaku 2012, 60, 515–520. [Google Scholar] [CrossRef]
  11. Noor, S.M.A.; Murashima, R.; Okazaki, T.; Taguchi, S.; Kuramitz, H.; Hata, N. Micro-organic Ion-associate Phase Extraction/micro-volume Back-extraction for the Preconcentration and GF-AAS Determination of Cadmium, Nickel and Lead in Environmental Water. Anal. Sci. 2018, 34, 1445–1448. [Google Scholar] [CrossRef] [PubMed]
  12. Hata, N.; Yuwatini, E.; Ando, K.; Yamada, M.; Kasahara, I.; Taguchi, S. Micro-organic ion-associate phase extraction via in situ fresh phase formation for the preconcentration and determination of di(2-ethylhexyl)phthalate in river water by HPLC. Anal. Sci. 2004, 20, 149–152. [Google Scholar] [CrossRef] [PubMed]
  13. Taguchi, S.; Kasahara, I.; Fukushima, Y.; Goto, K. An application of bis[2-(5-chloro-2-pyridylazo)-5-diethylaminophenolato]cobalt(III) chloride to the extraction and spectrophotometric determination of sulphonated and sulphated surfactants. Talanta 1981, 28, 616–618. [Google Scholar] [CrossRef] [PubMed]
  14. Kasahara, I.; Hashimoto, K.; Kawabe, T.; Kunita, A.; Magawa, K.; Hata, N.; Taguchi, S.; Goto, K. Spectrophotometric determination of anionic surfactants in sea-water based on ion-pair extraction with bis[2-(5-trifluoromethyl-2-pyridylazo)-5-diethylaminophenolato]cobalt(III) as counter ion. Analyst 1995, 120, 1803–1807. [Google Scholar] [CrossRef]
  15. Baghdadi, M.; Shemirani, F. In situ solvent formation microextraction based on ionic liquids: A novel sample preparation technique for determination of inorganic species in saline solutions. Anal. Chim. Acta 2009, 634, 186–191. [Google Scholar] [CrossRef] [PubMed]
  16. Vicente-Martínez, Y.; Caravaca, M.; Soto-Meca, A.; Francisco-Ortíz, Ó.D.; Fernández-López, C. In Situ Formation of Ionic Liquid by Metathesis Reaction for the Rapid Removal of Bisphenol A from Aqueous Solutions. Water 2019, 11, 2087. [Google Scholar] [CrossRef]
  17. Hosseini, M. Simultaneous Concentration and Determination of Cadmium and Lead Ions Using In Situ Solvent Formation Microextraction Method Based on Functionalized Ionic Liquid. J. Anal. Chem. 2021, 76, 1189–1197. [Google Scholar] [CrossRef]
  18. Llaver, M.; Chapana, A.L.; Wuilloud, R.G. Simultaneous and highly sensitive determination of selenium and tellurium species in environmental samples by on-line ionic liquid based in-situ solvent formation microextraction with hydride generation atomic fluorescence spectrometry detection. Talanta 2021, 222, 121460. [Google Scholar] [CrossRef]
  19. Vicente-Martínez, Y.; Caravaca, M.; Soto-Meca, A. Non-chromatographic speciation of arsenic by successive dispersive liquidliquid microextraction and in situ formation of an ionic liquid in water samples. Microchem. J. 2020, 157, 105102. [Google Scholar] [CrossRef]
  20. Li, K.; Jin, Y.; Jung, D.; Park, K.; Kim, H.; Lee, J. In situ formation of thymol-based hydrophobic deep eutectic solvents: Application to antibiotics analysis in surface water based on liquid-liquid microextraction followed by liquid chromatography. J. Chromatogr. A 2020, 1614, 460730. [Google Scholar] [CrossRef]
  21. Piao, H.; Jiang, Y.; Qin, Z.; Ma, P.; Sun, Y.; Wang, X.; Song, D.; Fei, Q. Application of an in-situ formulated magnetic deep eutectic solvent for the determination of triazine herbicides in rice. Talanta 2021, 222, 121527. [Google Scholar] [CrossRef] [PubMed]
  22. Yıldırım, S.; Sellitepe, H.E. Vortex assisted liquid-liquid microextraction based on in situ formation of a natural deep eutectic solvent by microwave irradiation for the determination of beta-blockers in water samples. J. Chromatogr. A 2021, 1642, 462007. [Google Scholar] [CrossRef] [PubMed]
  23. Wang, L.; Wang, Y.; Chen, M.; Qin, Y.; Zhou, Y. Hydrophobic deep eutectic solvent based dispersive liquid–liquid microextraction for the preconcentration and HPLC analysis of five rice paddy herbicides in water samples. Microchem. J. 2022, 181, 107790. [Google Scholar] [CrossRef]
  24. Sultana, A.; Sazawa, K.; Okazaki, T.; Islam, M.S.; Hata, N.; Sugawara, K.; Kuramitz, H. Adsorptive Voltammetry for the Determination of Ochratoxin A Using Enrichment Effect by Cationic Surfactants. Electroanalysis 2018, 30, 2265–2272. [Google Scholar] [CrossRef]
  25. WHO. Guidelines for Drinking-Water Quality, 4th ed.; Incorporating the 1st addendum; World Health Organization: Geneva, Switzerland, 2017; ISBN 978-92-4-154995-0. [Google Scholar]
  26. Ministry of Health, Labour and Welfare Japan. Drinking Water Quality Standards, Water Quality Control Target Setting Items. Available online: https://www.mhlw.go.jp/stf/seisakunitsuite/bunya/topics/bukyoku/kenkou/suido/kijun/kijunchi.html#01 (accessed on 15 November 2022).
  27. United States Environmental Protection Agency (US EPA, Washington, DC, USA). KOWWIN 1.68 in “Estimation Programs Interface Suite™ for Microsoft® Windows, v 4.11]”. 2012. Available online: http://www.epa.gov/oppt/exposure/pubs/episuite.htm (accessed on 8 November 2022).
  28. Bakanov, N.; Wieczorek, M.V.; Schulz, R. Retention of plant protection products (PPPs) by aquatic plants in flow-through systems. Chemosphere 2019, 216, 587–594. [Google Scholar] [CrossRef]
  29. Chikushi, H.; Hirota, K.; Yoshida, N.; Edamura, T.; Toda, K. Simple water analysis of golf link pesticides by means of batch-wise adsorption and supercritical fluid extraction. Talanta 2009, 80, 738–743. [Google Scholar] [CrossRef]
Figure 1. Schematic representation of the microextraction of an IAP formed in situ from the aqueous phase by adding BTC and NaEBS.
Appliedchem 03 00003 g001
Figure 2. Photographs of BTC and some organic anions mixed with water and left overnight. Organic anion sources: sodium ethylbenzenesulfonate (NaEBS, left); sodium toluenesulfonate (NaTS; center); and sodium dimethylbenzenesulfonate (NaDMBS, right); aq: aqueous phase, iap: ion-associate phase. The solutions contain 3 mmol BTC, NaEBS, NaTS, and NaDMBS in 120 mmol water.
Appliedchem 03 00003 g002
Figure 3. Comparison of the percent extraction (% E) of PAHs in IAPs with different components, BTC-EBS and BTC-TS.
Appliedchem 03 00003 g003
Figure 4. Effect of the concentrations of BTC and NaEBS on the percent extraction (% E) of PAHs extracted from an aqueous solution using liquid organic IAP. (A) % E of PAHs obtained with concentrations of BTC and NaEBS in the region of formation of IAPs. (B) Effect of the concentration of BTC on the % E of PAHs obtained by liquid organic IAP extraction from an aqueous solution. (C) Effect of the concentration of EBS ion on the % E of PAHs by liquid organic IAP extraction from an aqueous solution. BTC: benzethonium chloride, NaEBS: sodium ethylbenzenesulfonate, FL: fluoranthene, BaA: benzo[a]anthracene, BbF: benzo[b]fluoranthene, BkF: benzo[k]fluoranthene, BaP: benzo[a]pyrene, and DahA: dibenzo[a.h]anthracene.
Appliedchem 03 00003 g004
Figure 5. Chemical structure of environmental pollutants studied. The numbers in parentheses are the log Kowwin of the pollutant [27]. E1: estrone, E2: 17β-estradiol, EE2: ethinylestradiol, PAHs: polycyclic aromatic hydrocarbons, FL: fluoranthene, BaA: benzo[a]anthracene, BbF: benzo[b]fluoranthene, BkF: benzo[k]fluoranthene, BaP: benzo[a]pyrene, and DahA: dibenzo[ah]anthracene.
Appliedchem 03 00003 g005
Figure 6. Relationship between log Kowwin [27] and log Kd. Red circles indicate IAPs formed from BTC and NaEBS, blue triangles indicate IAPs produced from Ben and TS, open red circles indicate PAHs (FL, BaA, BbF, BkF, BaP, and DahA), filled circles indicate estrogens (E1, E2, and EE2), and yellow-green filled circles indicate pesticides (pencycuron and pyrazolate). All IAPs were formed using BTC as an organic cation source. The filled red circles denote EBS as organic anions and the filled blue triangles denote TS.
Appliedchem 03 00003 g006
Figure 7. Effect of the molar ratio of water added to the equimolar mixture of benzethonium chloride (BTC) and sodium ethylbenzenesulfonate (NaEBS). (A) Photographs of solutions with different proportions of water added (i): 30 mmol (0.54 mL), (ii): 60 mmol (1.1 mL), (iii): 90 mmol (1.6 mL), (iv): 120 mmol (2.2 mL), (v): 150 mmol (2.7 mL), (vi): 300 mmol (5.4 mL), (vii): 600 mmol (11 mL)) to a mixture of BTC and NaEBS, (B) variation in the volume of the aqueous phase and IAPs with respect to the molar ratio of water added to the mixture of BTC and NaEBS, (C) change in the water content as a function of the molar ratio of water to BTC, (D) effect of the molar ratio of water to BTC on the proportion of sodium and chloride ions in the aqueous phase. Blue and red circles denote sodium and chloride ions, respectively.
Appliedchem 03 00003 g007
Figure 8. Effects of BTC and NaEBS concentrations on the formation of IAPs, and their corresponding photographs. (A) Effects of BTC and NaEBS concentrations on the formation of IAPs, (B) magnification of part of A, (C) legend and corresponding photographs.
Appliedchem 03 00003 g008
Disclaimer/Publisher’s Note: The statements, opinions and data contained in all publications are solely those of the individual author(s) and contributor(s) and not of MDPI and/or the editor(s). MDPI and/or the editor(s) disclaim responsibility for any injury to people or property resulting from any ideas, methods, instructions or products referred to in the content.

