Article

Comparative Reactivity of Different Polyols in the PET Saponification Process

by
Valentin N. Sapunov
1,*,
Georgy V. Dzhabarov
1,
Violetta V. Shadrina
1,
Mikhail S. Voronov
1,
Roman A. Kozlovskiy
1,
Pavel A. Orel
2,
Lubov N. Magorina
1,
Tatiana D. Izmailova
1 and
Elena V. Boldina
3
1
Department of Chemical Technology of Basic Organic and Petrochemical Synthesis, Mendeleev University of Chemical Technology, 125047 Moscow, Russia
2
JSC “PMP”, 199004 Saint-Petersburg, Russia
3
Voronezhsintezkauchuk JSC, 394014 Voronezh, Russia
*
Author to whom correspondence should be addressed.
AppliedChem 2023, 3(1), 153-168; https://doi.org/10.3390/appliedchem3010011
Submission received: 29 January 2023 / Revised: 21 February 2023 / Accepted: 23 February 2023 / Published: 2 March 2023

Abstract

:
This work is concerned with polyethylene terephthalate (PET) saponification by different potassium compounds in various polyols as well as biodiesel’s main by-product, crude glycerol. It was established that reaction conditions (initial PET/K+ molar ratio, reaction time, etc.) could control the molecular weight of obtained oligomeric products. In ethylene glycol, depolymerization proceeds rapidly, and already at 10–30 min, PET is completely dissolved in the reaction mixture with the formation of liquid oligomers. Then, these oligomers react with potassium compounds, and after 200 min of the process, there are only solid, low-molecular-weight products (dipotassium terephthalate, monomers, and dimers). At the same time, PET saponification in pure glycerol is less effective, and solid polyether flakes could not fully decompose even after 200 min of the process. Crude glycerol takes the middle position between pure polyols. Based on the obtained data, an improved kinetic model was developed, and rate constants were estimated. This model takes into account PET saponification by potassium salts as well as direct PET glycolysis. Ethylene glycol is formed in situ by transesterification between fatty acid ethylene glycol esters and glycerol in the case of pure and crude glycerol.

1. Introduction

The accumulation of PET waste is one of the most important problems of the 21st century. Due to its structure, PET waste practically does not decompose in the environment, but at the same time, it is physically crushed into microplastics. Due to their extremely small size, microplastics transfer into water, minerals, and the human body [1,2,3,4]. To solve this problem, it is necessary to create effective technologies for recycling PET waste. To date, physico-mechanical methods of depolymerization are the most used methods because of their relative simplicity of design. On the other hand, depolymerization via physico-mechanical methods reduces the quality of the resulting secondary PET due to the processes of thermal and hydrolytic destruction, which limit the usage of such materials [5,6]. From the point of view of the quality of the obtained products, the methods of chemical PET recycling are the most promising. These methods make it possible to produce a chemically pure product from waste materials. The majority of the processes involve the synthesis of monomers (terephthalic acid (TPA), bis(2-hydroxyethyl) terephthalate (BHET), and dimethylterephthalate) [7,8,9]. Only a few studies have looked into the depolymerization of waste PET into oligomers [10]. At the same time, the polymer composites market is rapidly growing because it is used in construction and building; by 2027, it is expected to increase almost twice as much by volume and value [11], and polyurethane materials are an essential part of it. Polyols with terminated hydroxyl groups in their composition define the elastomeric properties of the compounds [12]. Therefore, there are several processes for the production of polyurethanes from BHET obtained from post-consumer PET [13,14]. Using hydroxyl-terminated polyols with long carbon chains makes it possible to provide polyurethanes with unique properties [15,16]. Additionally, terephthalic oligomers have great potency in this field, but their production from pure TPA and ethylene glycol is quite complicated [17]. On the other hand, waste PET saponification is one of the simplest methods of polyether treatment [7,18]. Their main disadvantage is the production of a large amount of wastewater that contains a lot of salt. There are two popular models for describing the PET depolymerization process: the “first-order reaction” model [17] and the “shrinking core” model [18]. Despite the fact that the second is more complicated, most studies only determine kinetic parameters by varying the amount of polyester. In our previous work [19], we studied the patterns of PET waste decomposition by the potassium compounds contained in crude glycerol. It was found that PET depolymerization occurs both through the outer surface of the solid-liquid phase contact and through the inner one due to the formation of stable intercalates [20]. The proposed model described experimental data with high accuracy at low PET/potassium soap molar ratios and with less accuracy at high ratios of reacting compounds. This may be explained by PET depolymerization not only by potassium compounds but also by the direct glycolysis of polyester by polyols contained in the reaction mixture.
The goal of this work is to investigate the effect of compounds found in crude glycerol (fatty acids, methyl esters, potassium soaps) on PET depolymerization, compare process patterns in different polyols, and improve the kinetic description of the processes by accounting for possible PET interactions with polyols.

2. Materials and Methods

2.1. Materials

As a major feedstock, crude glycerol (purchased from “AVK-HIM” Ltd.) was used. It contains almost equal amounts of glycerol and potassium soaps (Table 1). PET bottles from soft drinks were used as waste products. After double flushing with distilled water, they were cut into square flakes with a side length of 3-5 mm. Pure glycerol (GOST 6824-96), ethylene glycol (GOST 10164-75), and potassium stearate (KSt) (Huzhou City LinghuXinwang Chemical Co., Ltd., Huzhou, China) were used as feedstocks without any preparation. Ethanol (GOST 5962-2013) was used for product mixture separation.

2.2. Method of PET Depolymerization

Measured amounts of polyol and KSt were placed in a 100 mL three-necked glass reactor equipped with a magnetic PTFE stirrer, a condenser, and a thermometer. An empty neck was used for waste PET addition into the reaction mixture after heating it up to the required temperature. The depolymerization was performed at 170 °C or 190 °C with a stirring rate of 200–250 rpm.

2.3. Method of Product Mixture Separation

Before the separation process, the reaction kettle was cooled to 40–50 °C, and afterward, excess ethanol was added to form the suspension of unreacted polyester particles and form oligomers in alcohol. All other components of the reaction mixture were dissolved in ethanol and were isolated after two-stage filtration and ethanol removal by vacuum distillation. The obtained precipitate was twice washed with ethanol and then dried in an oven. At the last stage, the precipitate was mixed with distilled water for unreacted PET isolation. The molecular mass of PET was calculated from its repeating unit (192 g/mol) and was considered for further calculations. The weight of the formed oligomeric products was determined according to Equation (1):
m o l i g o = m p r e c i p i t a t e m P E T
where moligo represents the weight of the formed oligomers, g; mprecipitate represents the weight of precipitate obtained after filtration; and mPET represents the weight of the residual PET.

2.4. Methods of Products Analysis

Potentiometric titration was carried out on a titrator of the model Metrohm 794. To determine the potassium salt content of liquid products, BasicTitrino was used. Isopropanol was used as a titration solvent. Equation (2) was used for the calculation of the remaining potassium soaps in the liquid phase after the reaction (nKSt):
n K S t = V H C l × C H C l × m l i q u i d m s a m p l e * 1000
where VHCl and CHCl represent the volume and concentration of HCl used at titration, respectively; msample represents the weight of the titrated sample; and mliquid. represents the weight of the remaining liquid products.
The amount of dissolved PET was measured by gravimetry as the difference between the initial PET weight and the residual PET weight after the process.
The ester number (EN) was measured as follows: a sample (0.5–0.7 g) was placed in a conical flask with a volume of 100 mL, and then 20 mL of a 0.1 M alcoholic solution of potassium hydroxide was added. Then, the sample, along with a blank sample containing only KOH solution, was placed in a water bath for 60 min. The samples were then titrated with an HCl solution. The EN was calculated according to Equation (3):
E N = 56.1 × ( V H C l b l a n k V H C l s a m p l e ) × C H C l m s a m p l e
where 56.1 is the molar mass of potassium hydroxide; V H C l b l a n k and V H C l s a m p l e represent the volumes of aqueous hydrogen chloride solution for the titration of the blank and studied samples, respectively; CHCl represents the concentration of hydrogen chloride solution; and msample represents the weight of the studied sample.

3. Results

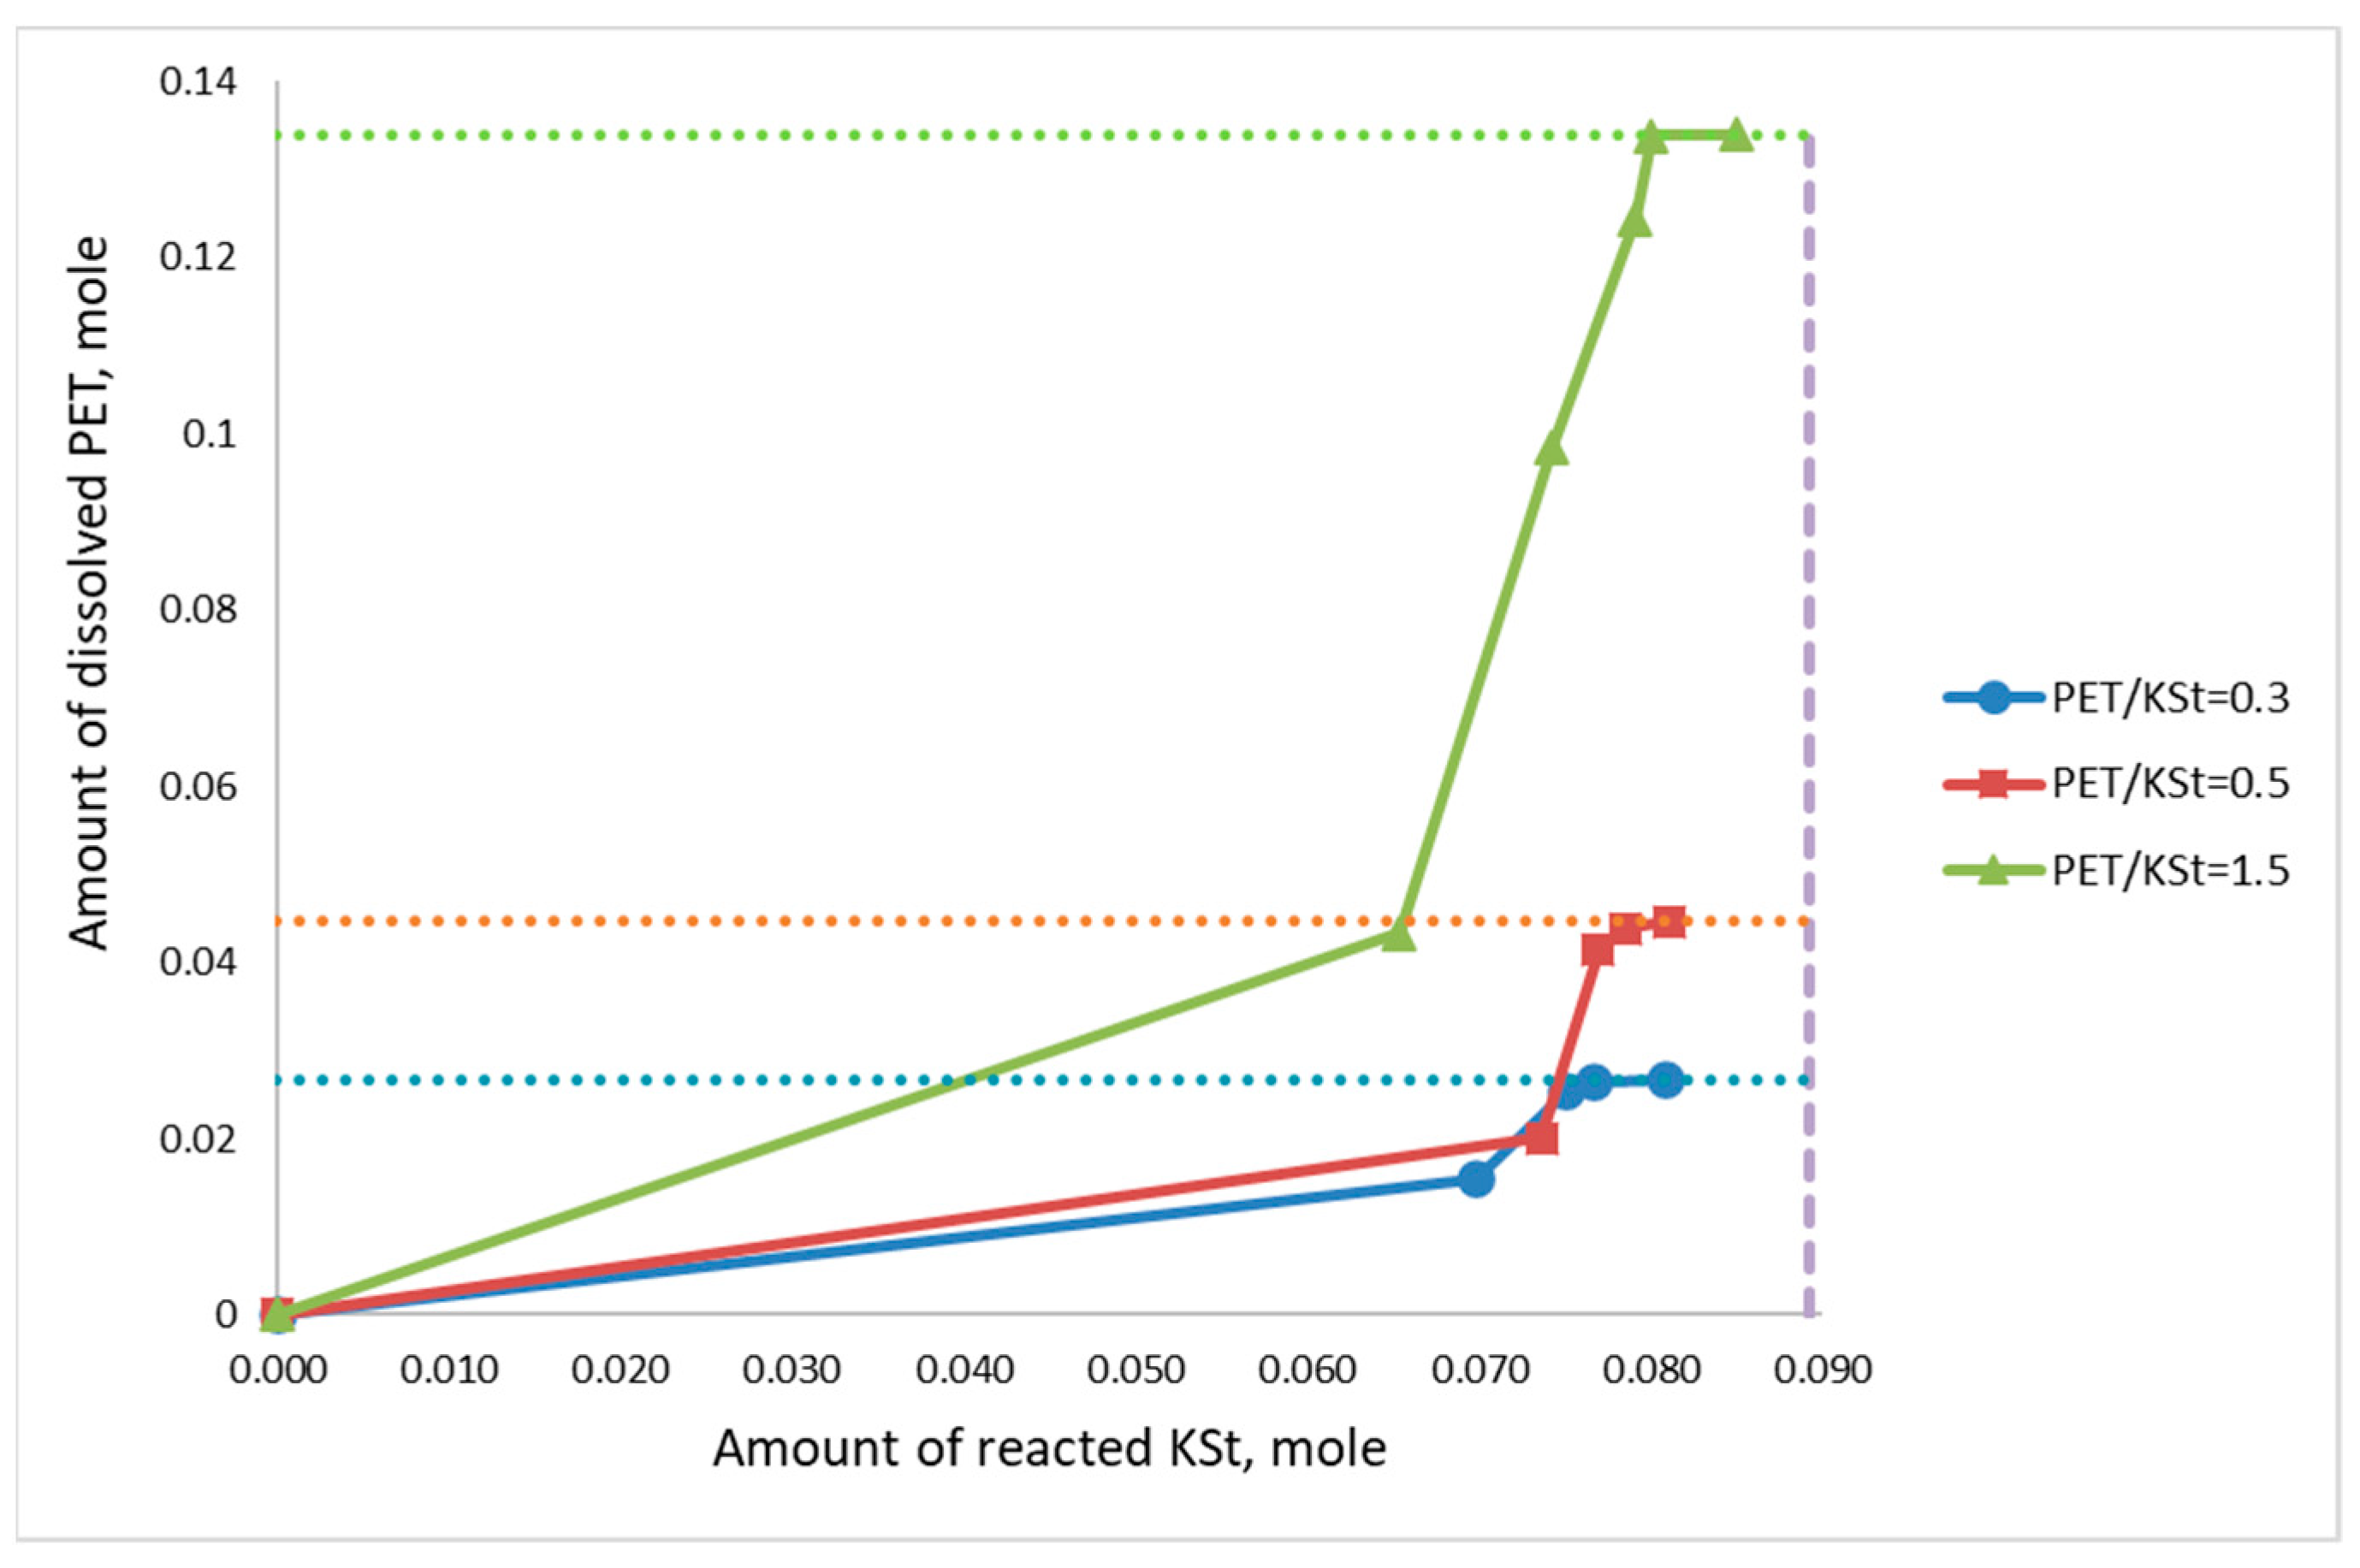
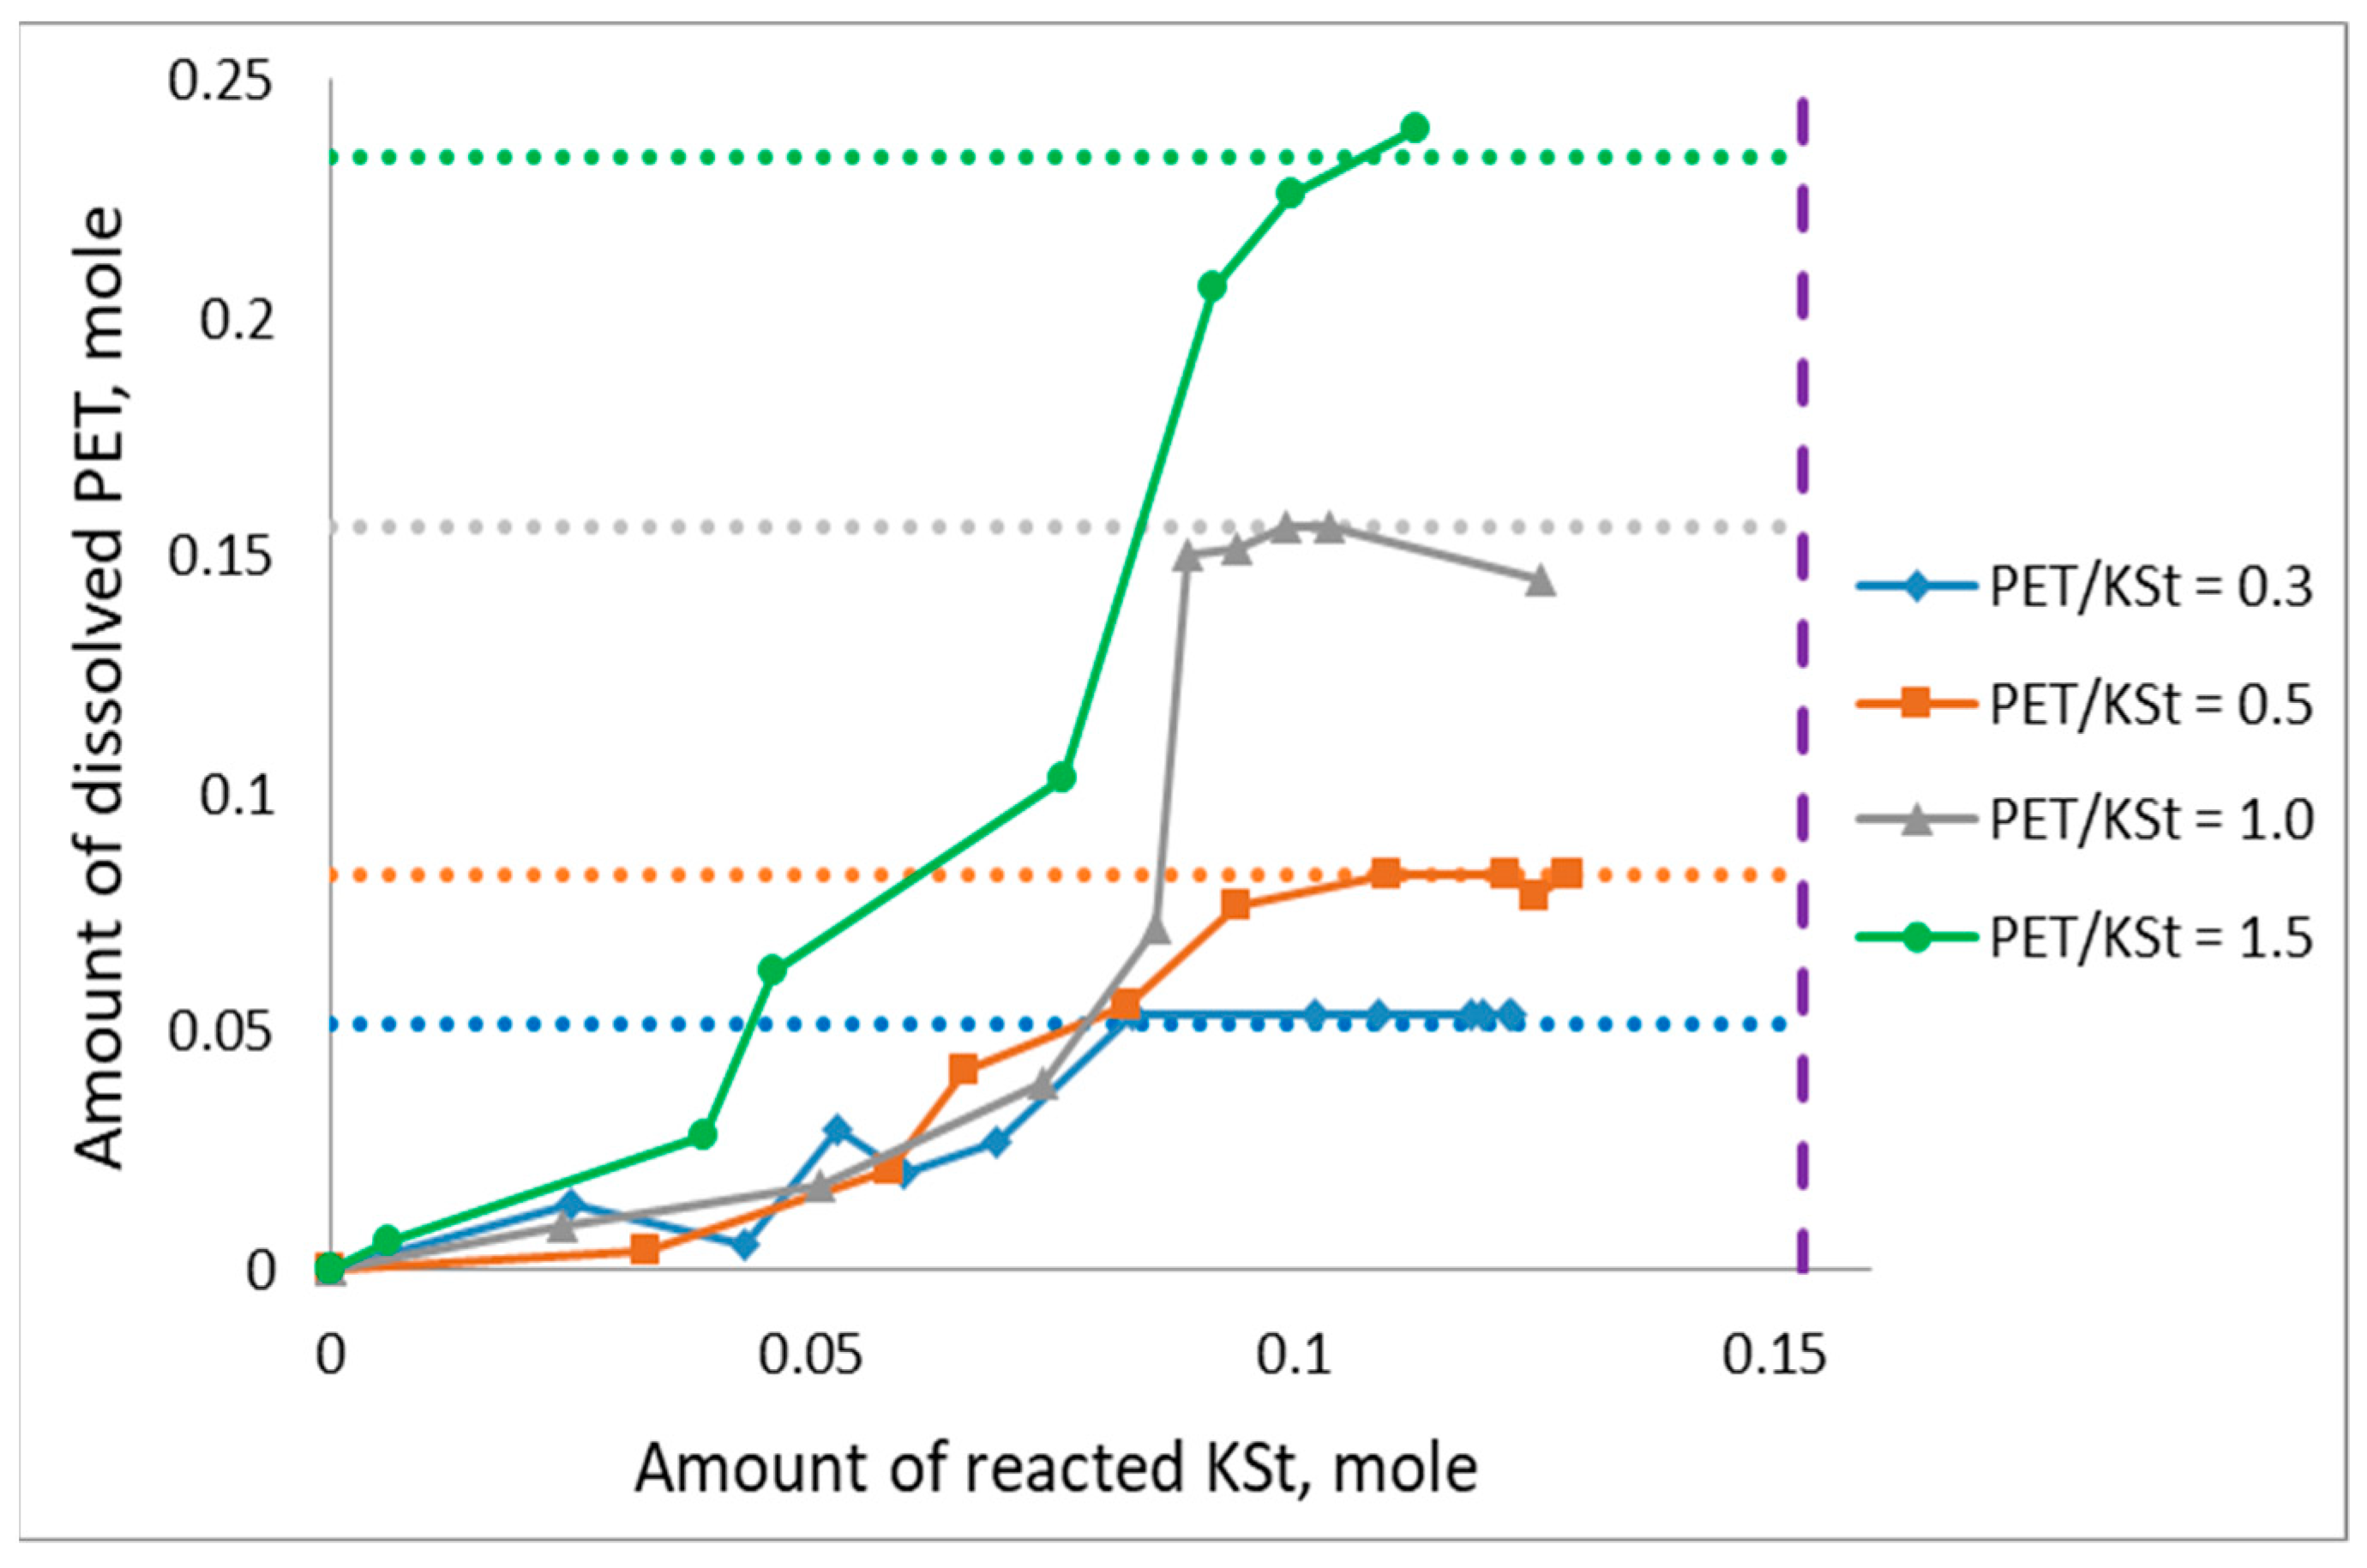
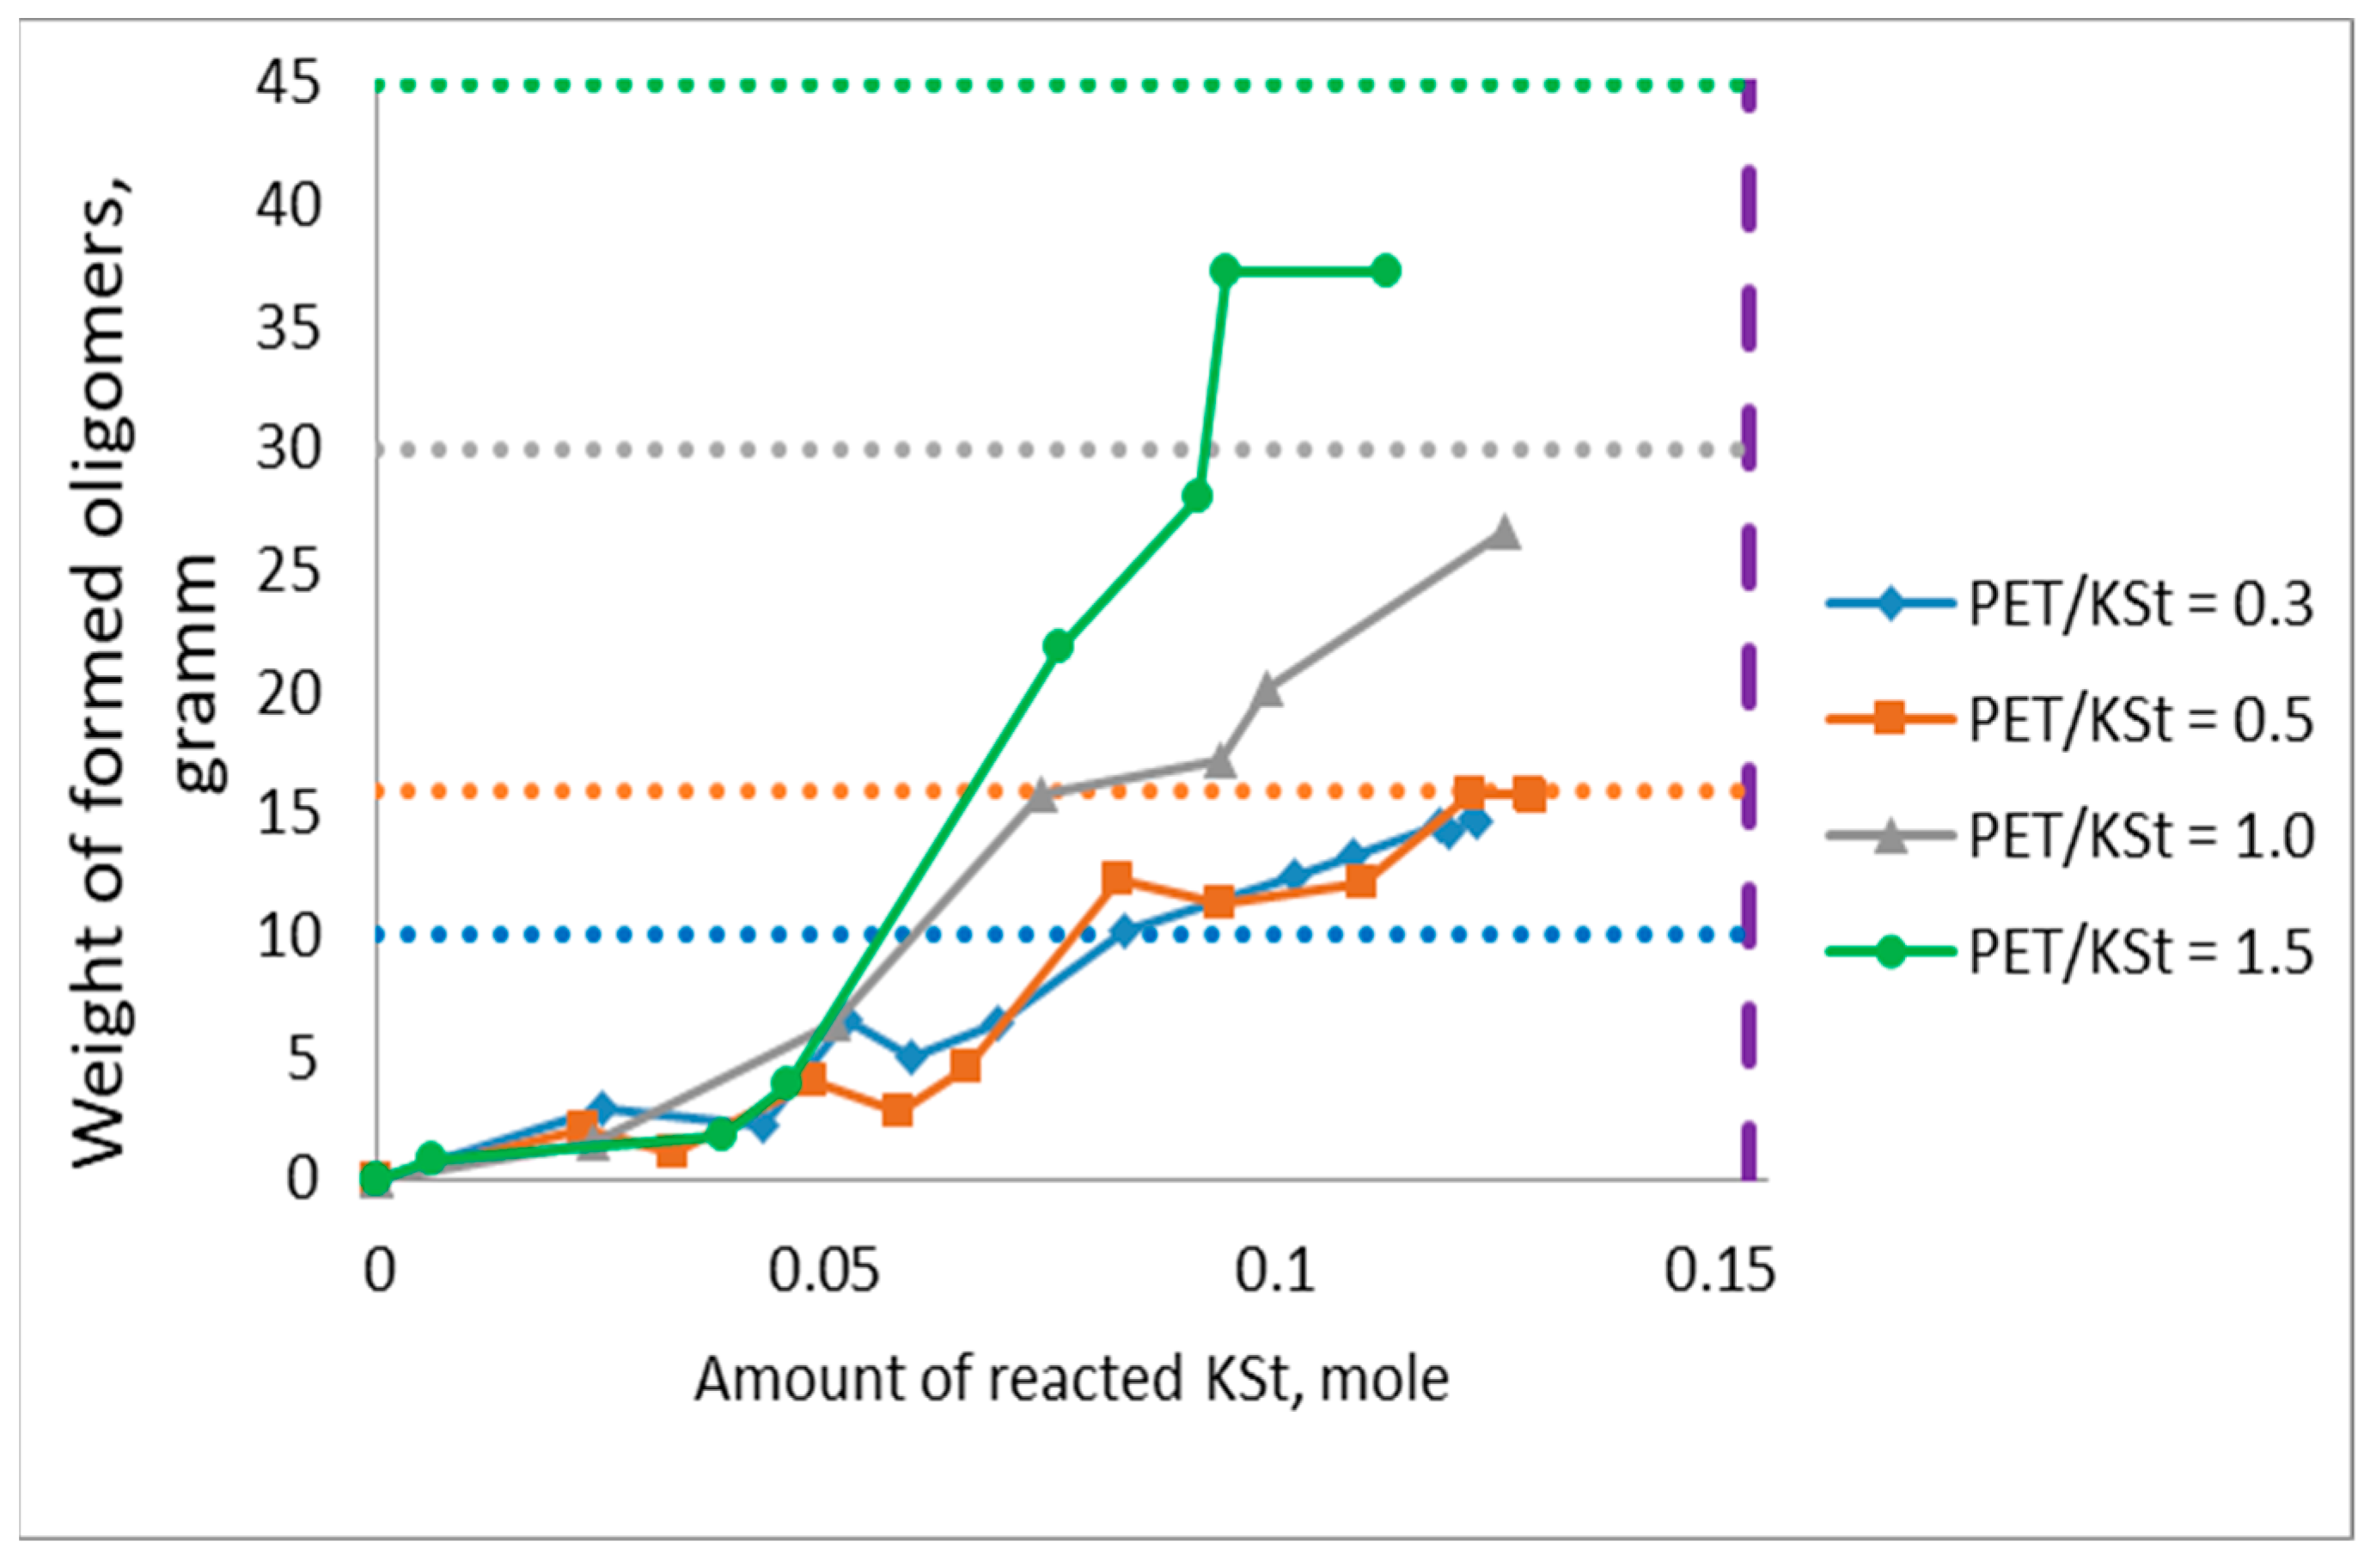
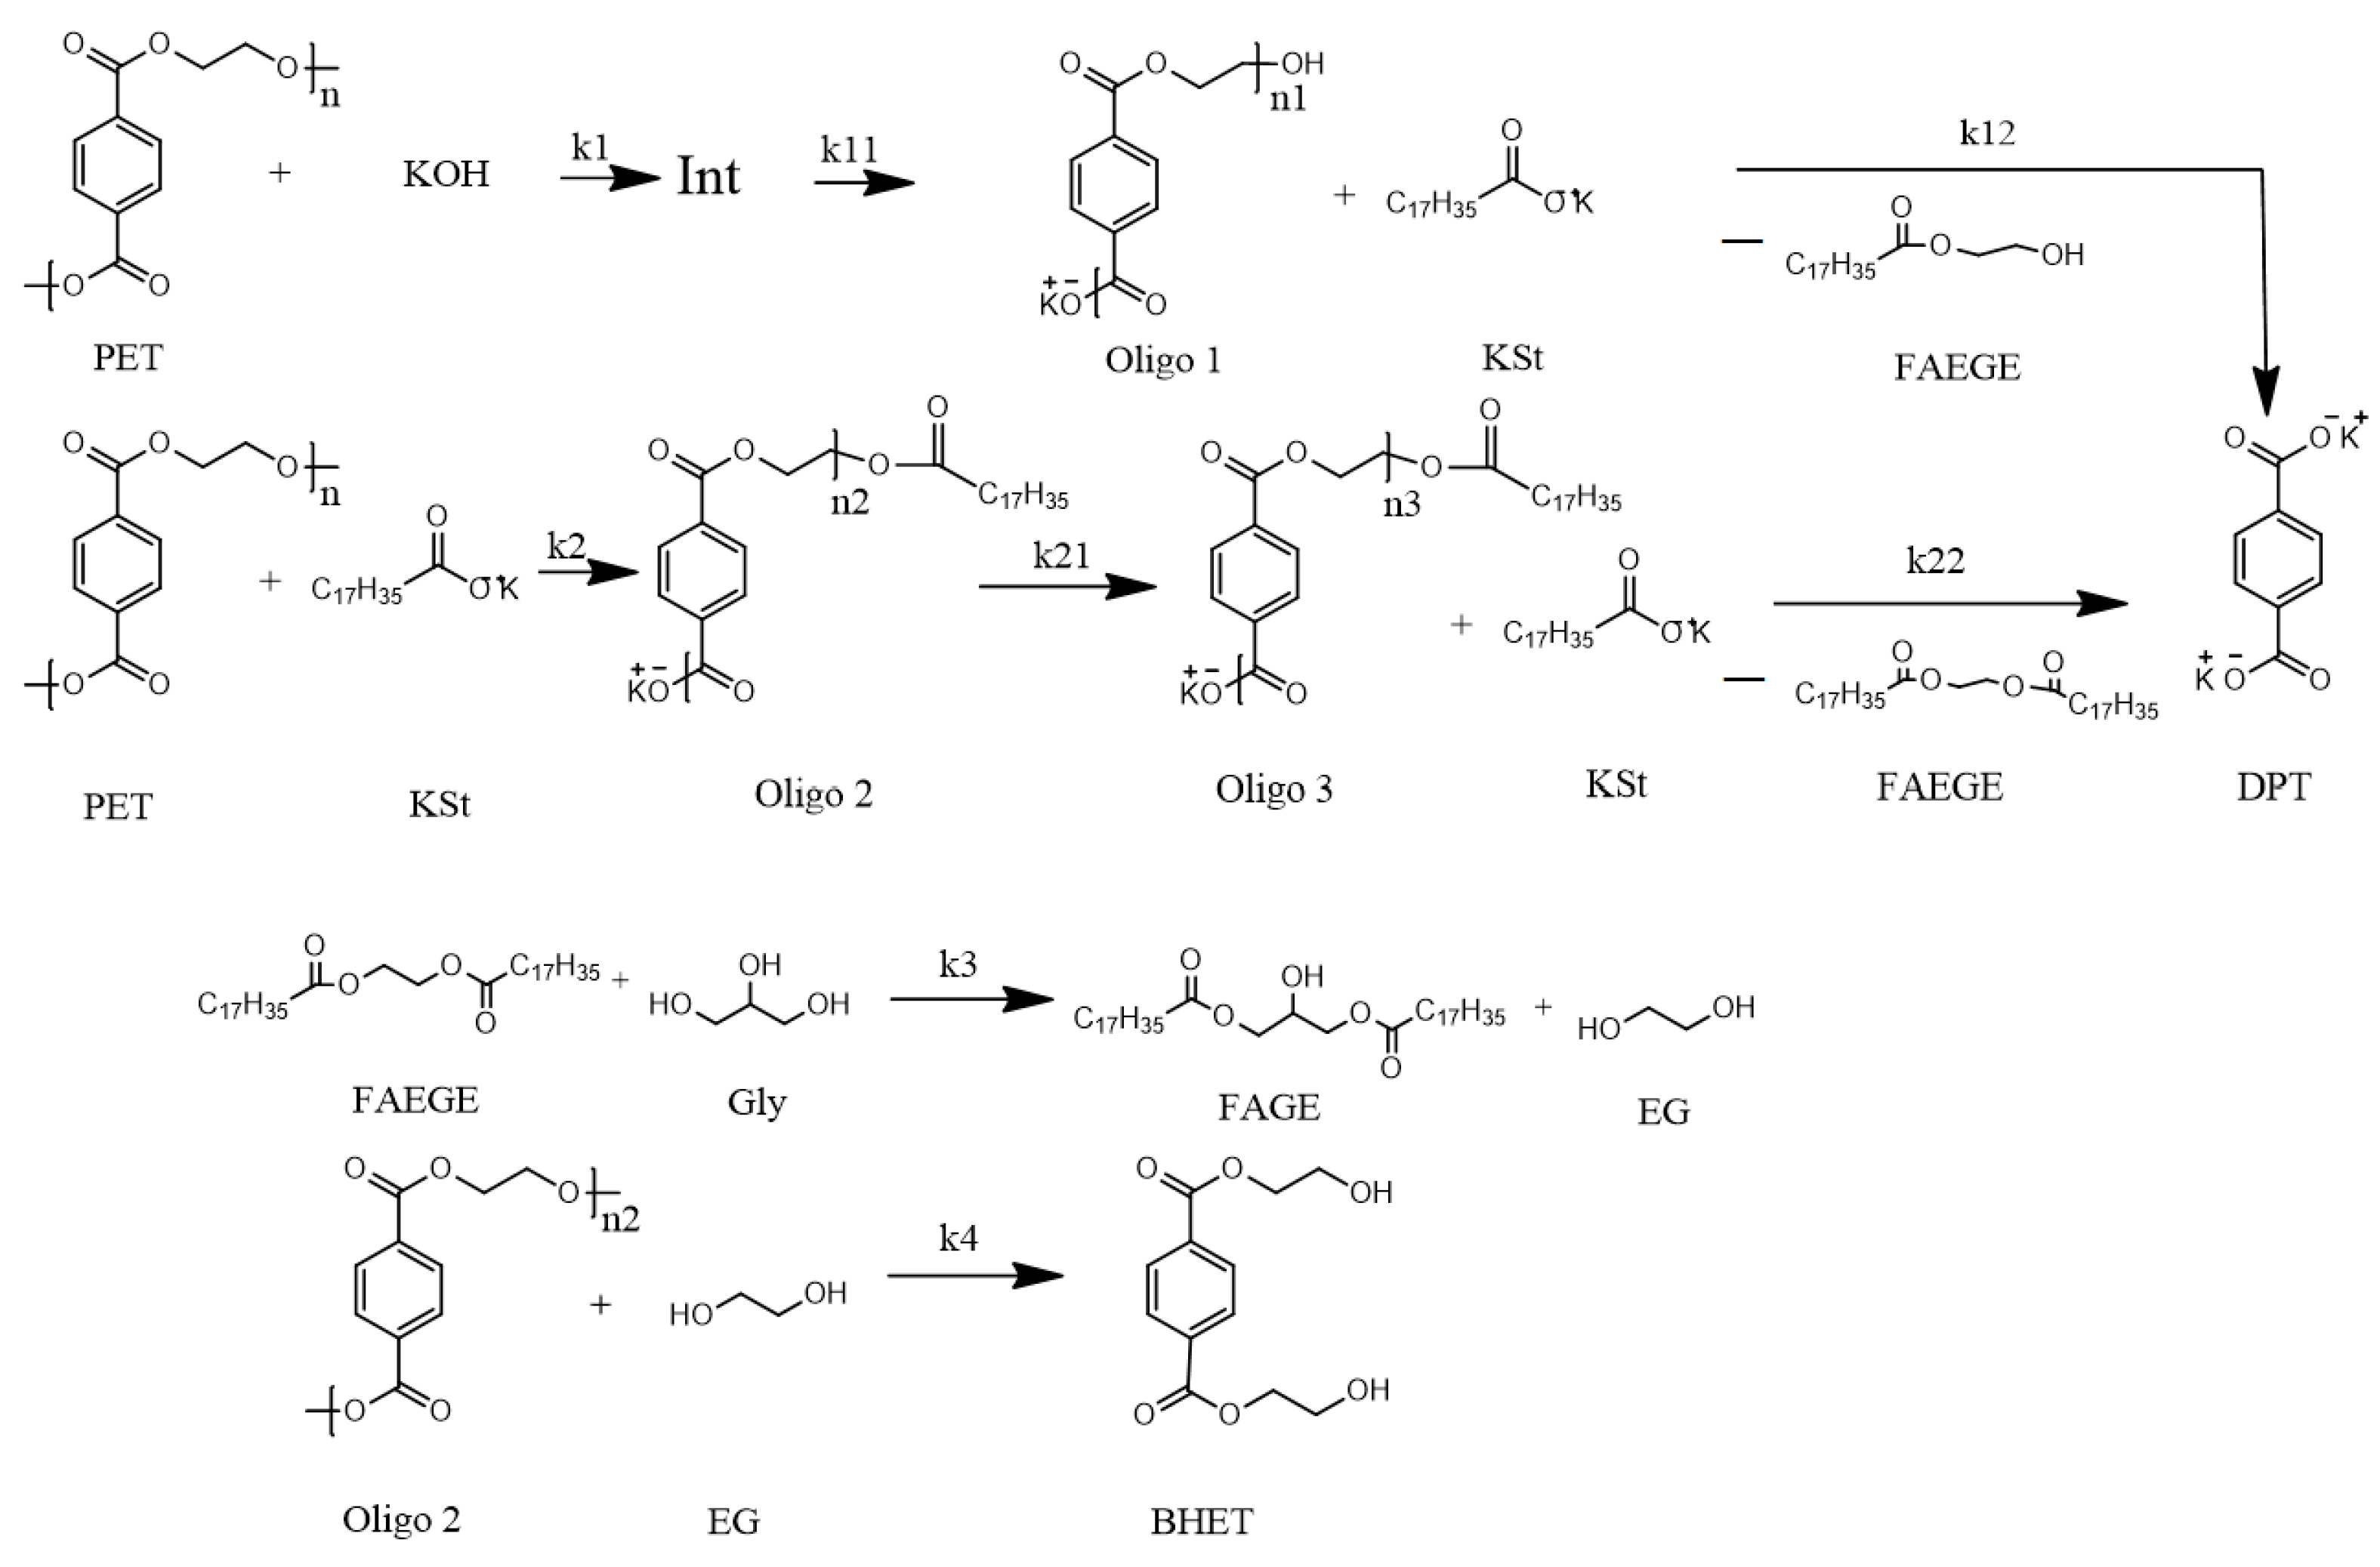
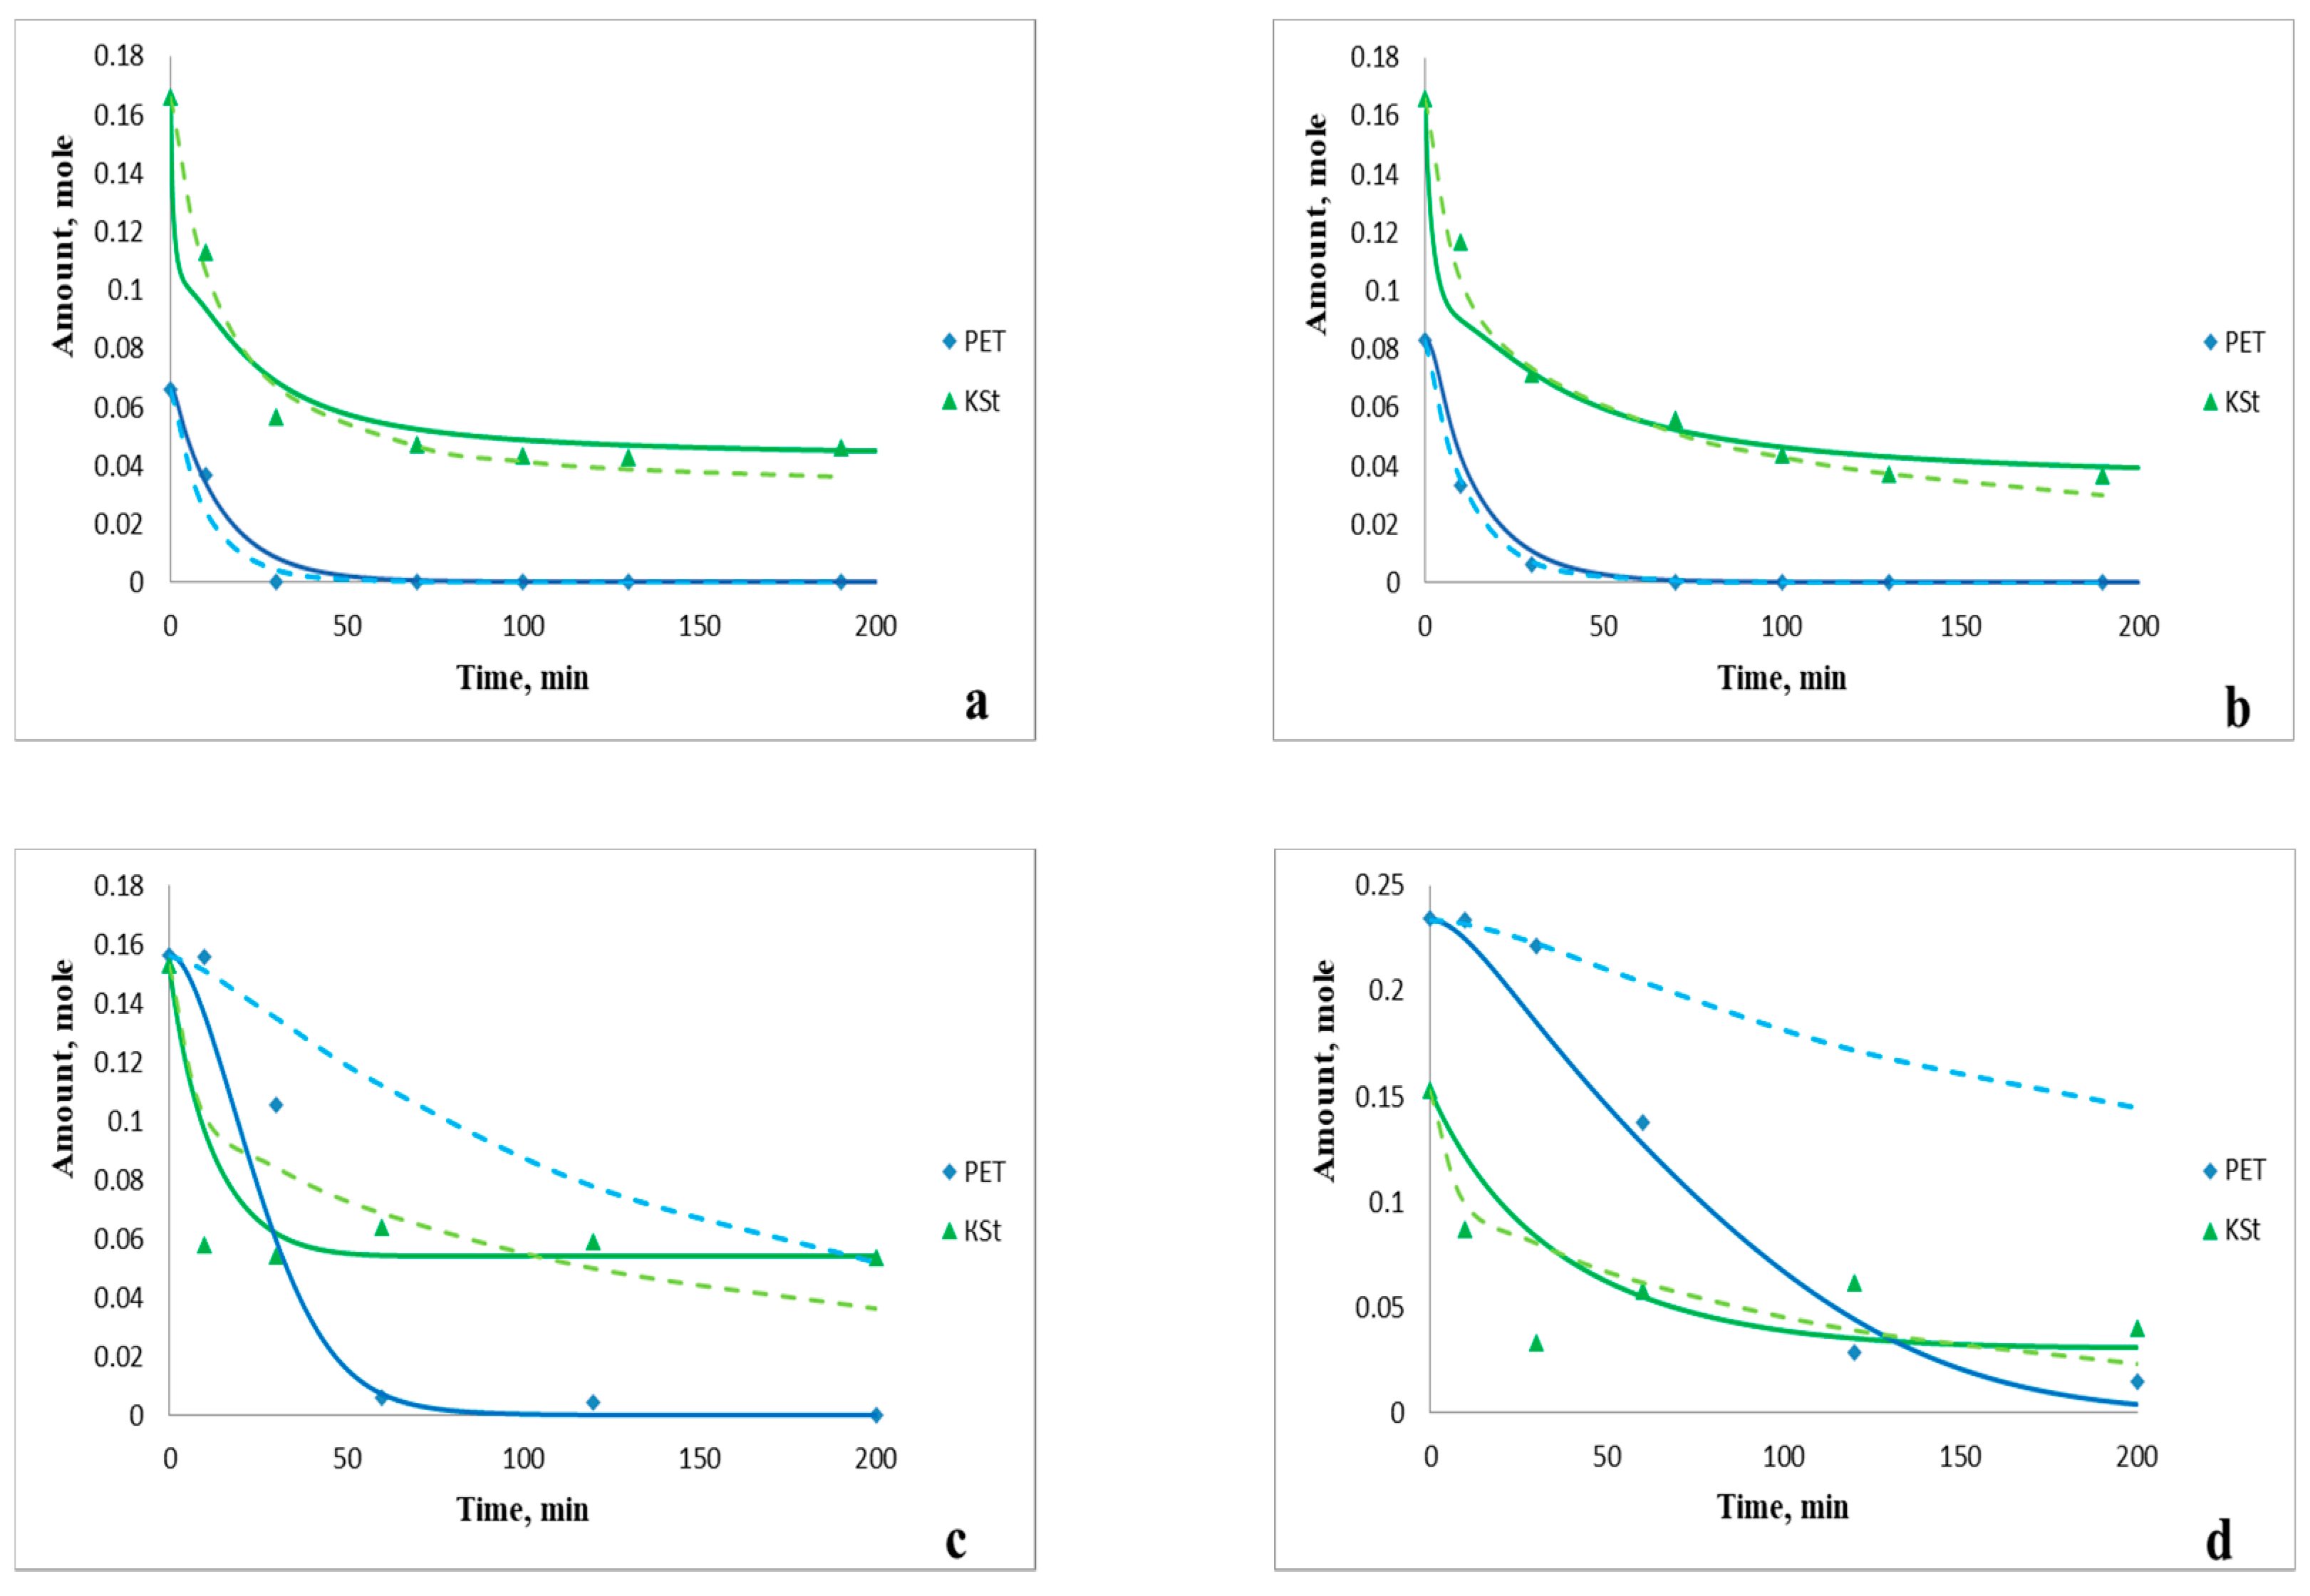
3.1. General Patterns of PET Depolymerization Process

In our previous work, we reported that at 170 °C, PET decomposition in crude glycerol began after decreasing a sufficient amount of potassium ions, and only increasing the temperature up to 190 °C leads to a parallel reaction of both reagents [17]. However, at the same temperature, the situation in pure ethylene glycol is the opposite: initially, there was an increase in the amount of reacted PET. When it reached its limit, the potassium ion concentration in the remaining liquid mixture began to fall (Figure 1). Simultaneously, the amount of reacted KSt weight in the solid oligomer increases (Figure 2). Obviously, it can be said that at the beginning, PET dissolution proceeds with the formation of potassium-containing liquid oligomers, so potassium ions are still present in the liquid mixture and can still be determined by titration. With an increase in reaction time, these oligomers start reacting with potassium compounds, resulting in the formation of solid products (dipotassium terephthalate (DPT), BHET, dimers, and trimers) that lead to the transfer of potassium ions to the solid phase, and they become unavailable for determination by titration of the reaction mixture.
At the initial molar ratio of PET/ KSt of 1.5, the weight of oligomers begins to exceed the initial weight of waste PET. This fact can be explained by changing the composition of the formed products. At these conditions, it begins to include fragments of stearic acid, having a significantly higher molecular weight. This is also confirmed by an increase in the values of the ether number of the precipitate. Thus, with an initial PET/KSt ratio of 0.3, the ether number is 30 mg KOH/g, and with an increase in the reagent ratio to 1.5, the ether number increases to 327 mg KOH/g (Figure 3).
At the same time, PET depolymerization in chemically pure glycerol is slower than in ethylene glycol, and significant polyether conversion cannot be achieved even after 200 min of the process (Figure 4). This fact can be explained by the lower solubility of polyester chains in glycerol [18]. As a result, at all ratios of reagents, a large excess of potassium equivalents is maintained in the solution, which leads to the complete decomposition of polyester chains to monomeric units (dipotassium terephthalate). This is confirmed by a linear increase in the weight of the precipitate with an increase in the mass of dissolved PET (Figure 5). The ester number of precipitate is close to 0 mg KOH/g and practically does not change.
After cooling the reaction mixture obtained at PET depolymerization in glycerol at 190 °C, its viscosity becomes very high, and it cannot be separate completely. More likely, the reason for that is the formation of oligomers, which are liquid at the depolymerization temperature and semi-solid at room temperature.
Moreover, it was noticed that the basic regularities of PET depolymerization by crude glycerol at 190 °C and a low PET/K+ molar ratio described in our previous work [17] do not suit the process at the same temperature and a high PET/KSt molar ratio. With increasing initial PET/KSt molar ratios up to 1.0 and 1.5, the regularities of the process take on features at 170 °C in ethylene glycol (Figure 6). Precipitation formation occurs when a significant amount of potassium ions in the reaction mixture are reacted and generally coincides with the time of complete PET dissolution (Figure 7).
Fatty acid ethylene glycol esters (FAEGEs) are a by-product of PET saponification by potassium soaps that remain in the liquid mixture after product separation, leading to an increase in ester number (Figure 8). At first, the EN of crude glycerol is 11 mg KOH/g. Its value is determined by the content of FAMEs. At the low PET/KSt initial molar ratio (0.3), PET dissolution proceeds rather quickly with the formation of mainly dipotassium terephthalate [19], as a result of which no liquid oligomers remain in the reaction mass and the increase in the ether number is due only to the accumulation of FAEGEs. The amount of FAEGEs formed increases as the PET/KSt initial molar ratio of 1.5 increases. At the same time, several PET fragments remain in the liquid phase in the form of liquid oligomers. Therefore, it leads to EN increasing up to 126 mg KOH/g. The presence of FAEGEs in the reaction mixture confirms the theory of their transesterification with glycerol with the formation of ethylene glycol, which we proposed in our early work [21]. The increase in the initial amount of PET leads to the accumulation of ethylene glycol, which is a highly effective PET depolymerizing agent, so PET glycolysis cannot be ignored in the kinetic model.

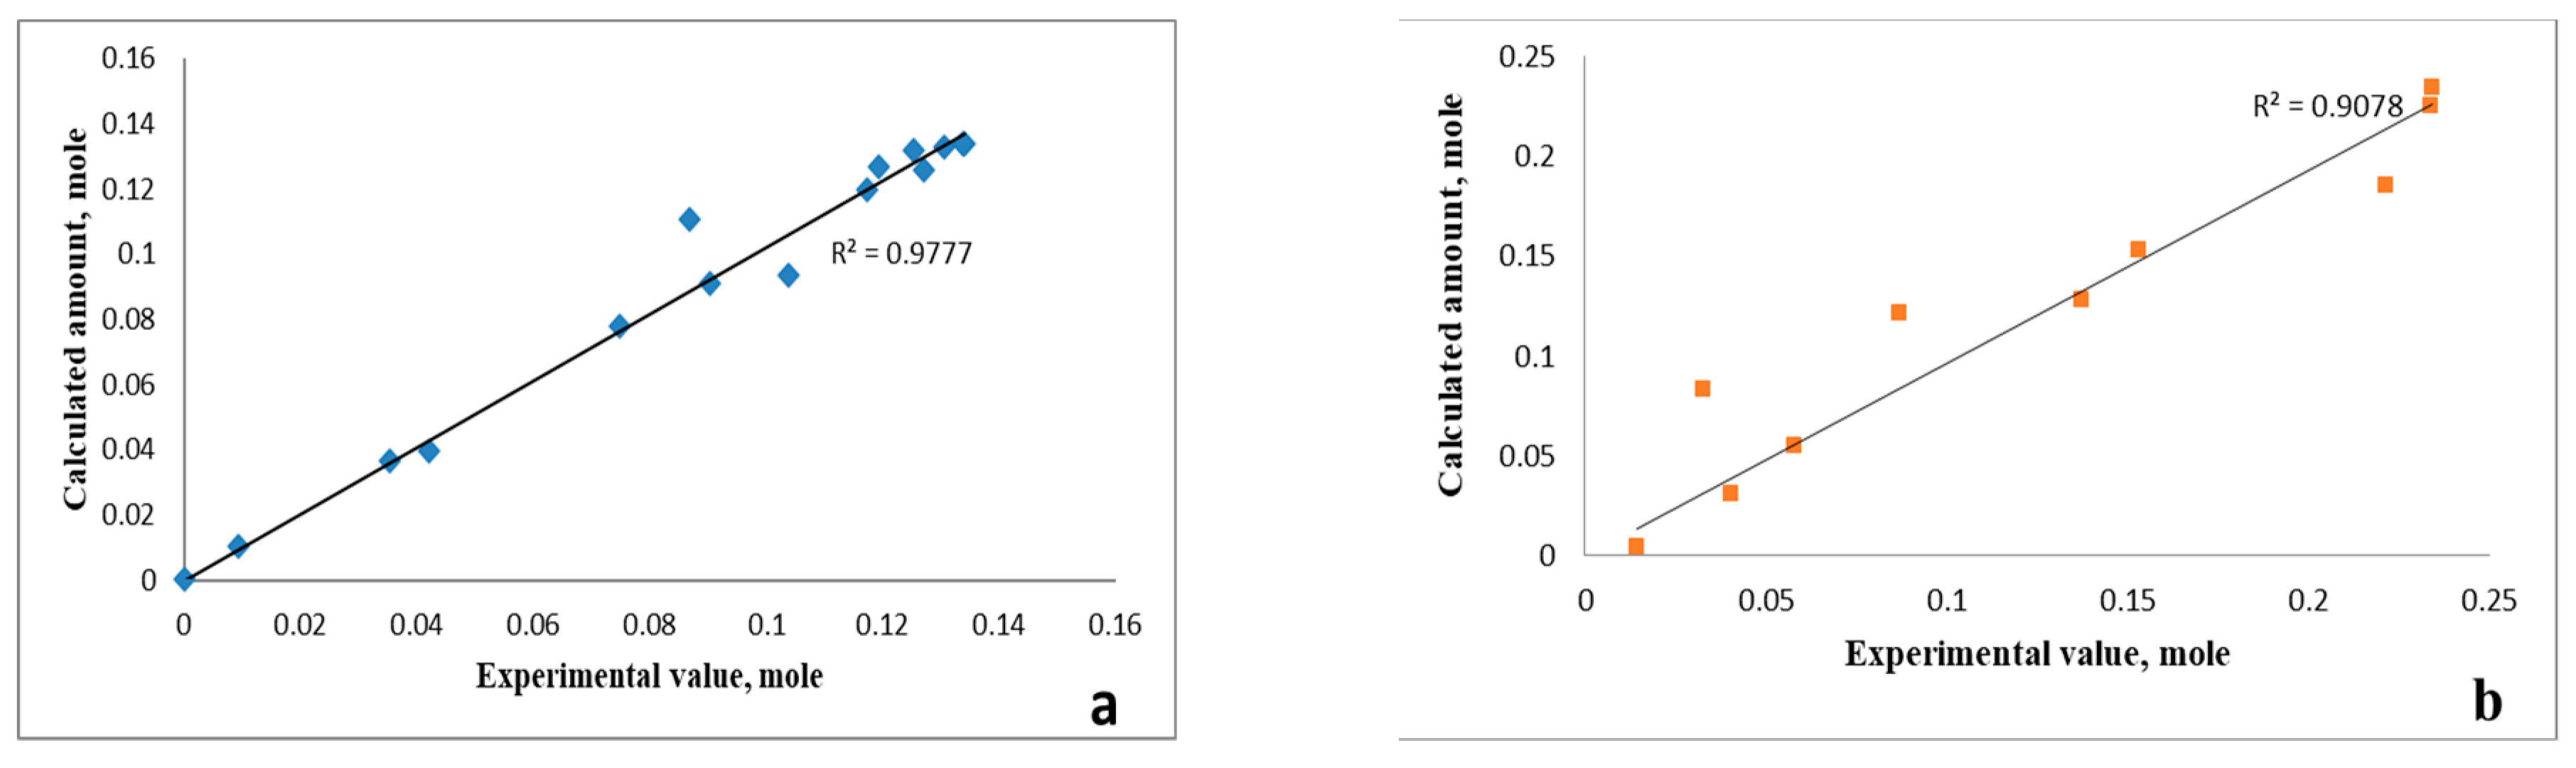
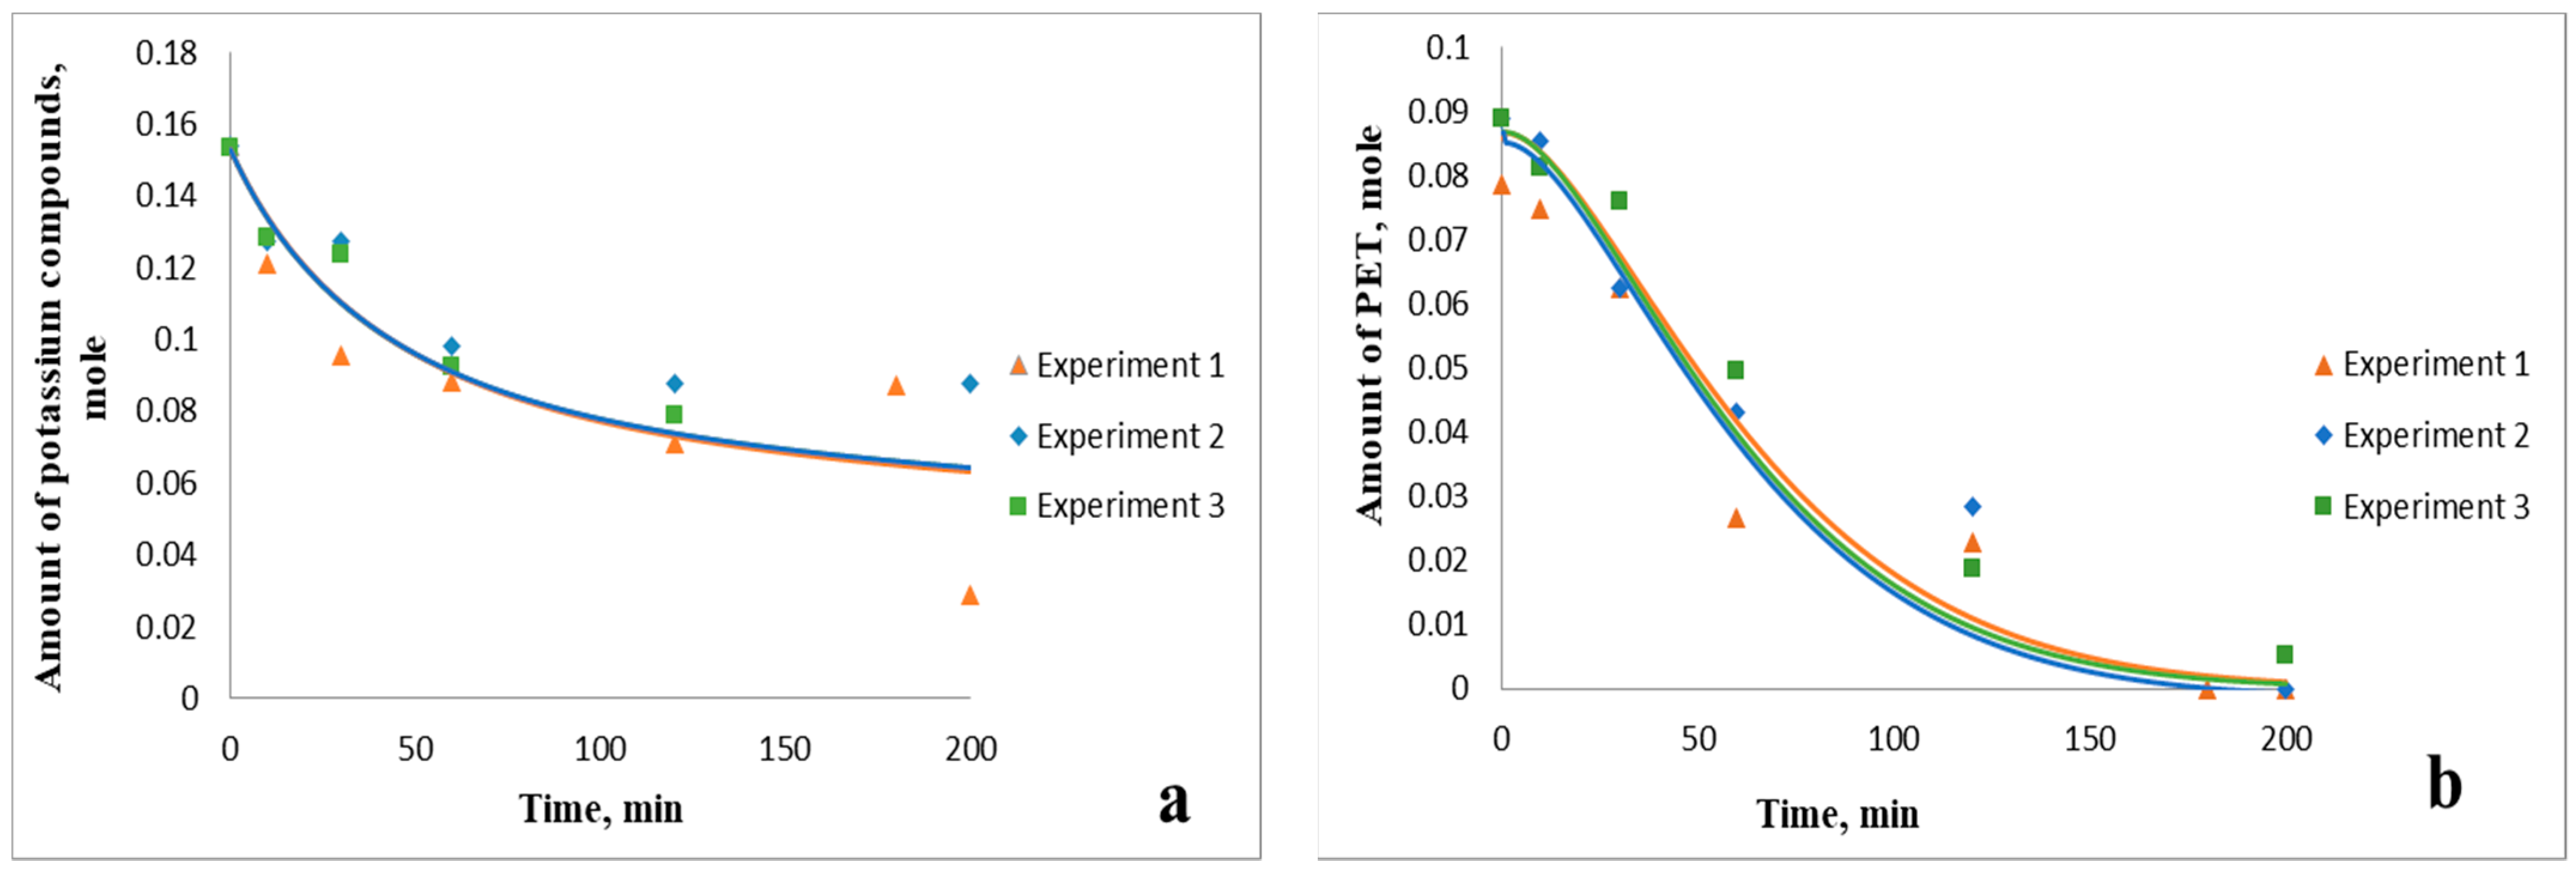
3.2. Kinetic Patterns of PET Depolymerization Process

According to the difference in ethylene glycol and glycerol activities described above and the confirmed presence of FAEGEs in the reaction mixture, the improved general scheme of the process (Figure 9) consists of four general stages:
(1)
PET saponification by potassium compounds through intercalate formation;
(2)
PET saponification by potassium compounds through the outer surface;
(3)
Transesterification of FAEGEs with glycerol with the formation of ethylene glycol (EG) and fatty acid glycerol esters (FAGEs);
(4)
PET glycolysis via in situ forming ethylene glycol.
The first two stages were fully described in our previous work [19]. They can be described by a system of Equations (4)–(11):
d [ K O H ] d t = k 1 · [ K O H ] · [ P E T ]
d [ I n t ] d t = k 1 · [ K O H ] · [ P E T ] k 11 · [ I n t ]
d [ O l i g o 1 ] d t =   k 11 · [ I n t ] k 12 · [ K S t ] · [ O l i g o 1 ]
d [ K S t ] d t = k 2 · [ K S t ] · [ P E T ] · k 22 · [ O l i g o   3 ] · [ K S t ] k 12 · [ K S t ] · [ O l i g o 1 ]
d [ O l i g o   2 ] d t = k 2 · [ K S t ] · [ P E T ] k 21 · [ O l i g o   2 ] k 4 · [ E G ] · [ O l i g o 2 ]
d [ O l i g o   3 ] d t =   k 21 · [ O l i g o   2 ] k 22 · [ O l i g o   3 ] · [ K S t ]
d [ D P T ] d t =   k 12 · [ K S t ] · [ O l i g o 1 ] + k 22 · [ O l i g o   3 ] · [ K S t ]
d [ P E T ] d t = k 1 · [ P E T ] · [ KOH ] k 2 · [ P E T ] · [ KSt ]
where [KOH]—amount of active part of potassium soaps;
[PET]—amount of initial PET;
[Int]—amount of formed potassium intercalates;
[Oligo1]—amount of formed oligomer fraction with low molecular weight;
[KSt]—amount of potassium soaps;
[Oligo 2] and [Oligo 3] –amount of formed intermediate oligomer fractions;
[EG]—amount of formed ethylene glycol;
[DPT]—amount of formed DPT;
k1, k11, k12, k2, k21, k22, k4—rate constants of the corresponding reactions.
The third stage includes the interaction of FAEGEs with glycerol and can be described by Equations (12)–(14). Because the reaction mixture contains a huge excess of glycerol comparable to FAEGEs and ethylene glycol, it was accepted that transesterification is irreversible.
d [ F A E G E s ] d t = k 12 · [ K S t ] · [ O l i g o 1 ] + k 22 · [ O l i g o   3 ] · [ K S t ] k 3 · [ G l y ] · [ F A E G E s ]
d [ G l y ] d t = k 3 · [ G l y ] · [ F A E G E s ]
d [ E G ] d t =   k 3 · [ F A E G E s ] · [ G l y ] k 4 · [ P E T ] · [ E G ]
where [FAEGEs]—amount of formed fatty acids ethylene glycol esters;
[Gly]—amount of glycerol;
k3—the rate constant of the corresponding reaction.
The fourth stage is the glycolysis of polyester to form ethylene glycol. The initial PET reacts rapidly with potassium compounds to form high-molecular-weight intermediates (intercalates and Oligo2), but the intercalates are located inside the layered structure of plastic and, therefore, are inaccessible to polyol. Thus, it was accepted that an intermediate product located on the surface of solid particles (oligo2) interacts with ethylene glycol. This stage can be described by Equation (15).
d [ B H E T ] d t =   k 4 · [ E G ] · [ O l i g o 2 ]
where [BHET] represents the amount of formed bis-2 hydroxyethylene terephthalate.
Basic principles of experimental data processing were presented in previous work [17]. As a result of this procedure, the values of all the observed rate constants of the differential system of Equations (4)–(15) were obtained (Table 2 and Table 3).
As a result of the optimization, a mathematical description of the kinetics of the PET depolymerization was obtained (Figure 10a–c and Figure 11a–d). At the same time, a novel model presented a better description of the process, which can be proved by the accuracy of the approximation (R2) for the correlation of experimental and calculated values of the amounts of PET and total determined potassium ions according to typical curves presented in Figure 12a,b.
The data show that at low initial PET/KSt molar ratios (Figure 10a,b and Figure 11a,b), the amount of obtained FAEGEs is low due to the low amount of dissolved PET, and the transesterification reaction proceeds to a minor extent. There is almost no ethylene glycol in the reaction mixture under these conditions. At the same time, there is a huge excess of potassium compounds that degrade PET into dipotassium terephthalate, which cannot react with polyols. The amount of FAEGEs obtained increases as the initial amount of PET molar weights of the formed oligomers increases. This leads to in situ ethylene glycol formation with further interactions between the formed polyol and high-molecular-weight oligomers. It should be noted that the real process is more complicated than the presented kinetic scheme. Ethylene glycol can react with different PET oligomers, not only Oligo 2. However, due to the high accuracy of the description, it was decided to simplify the model.

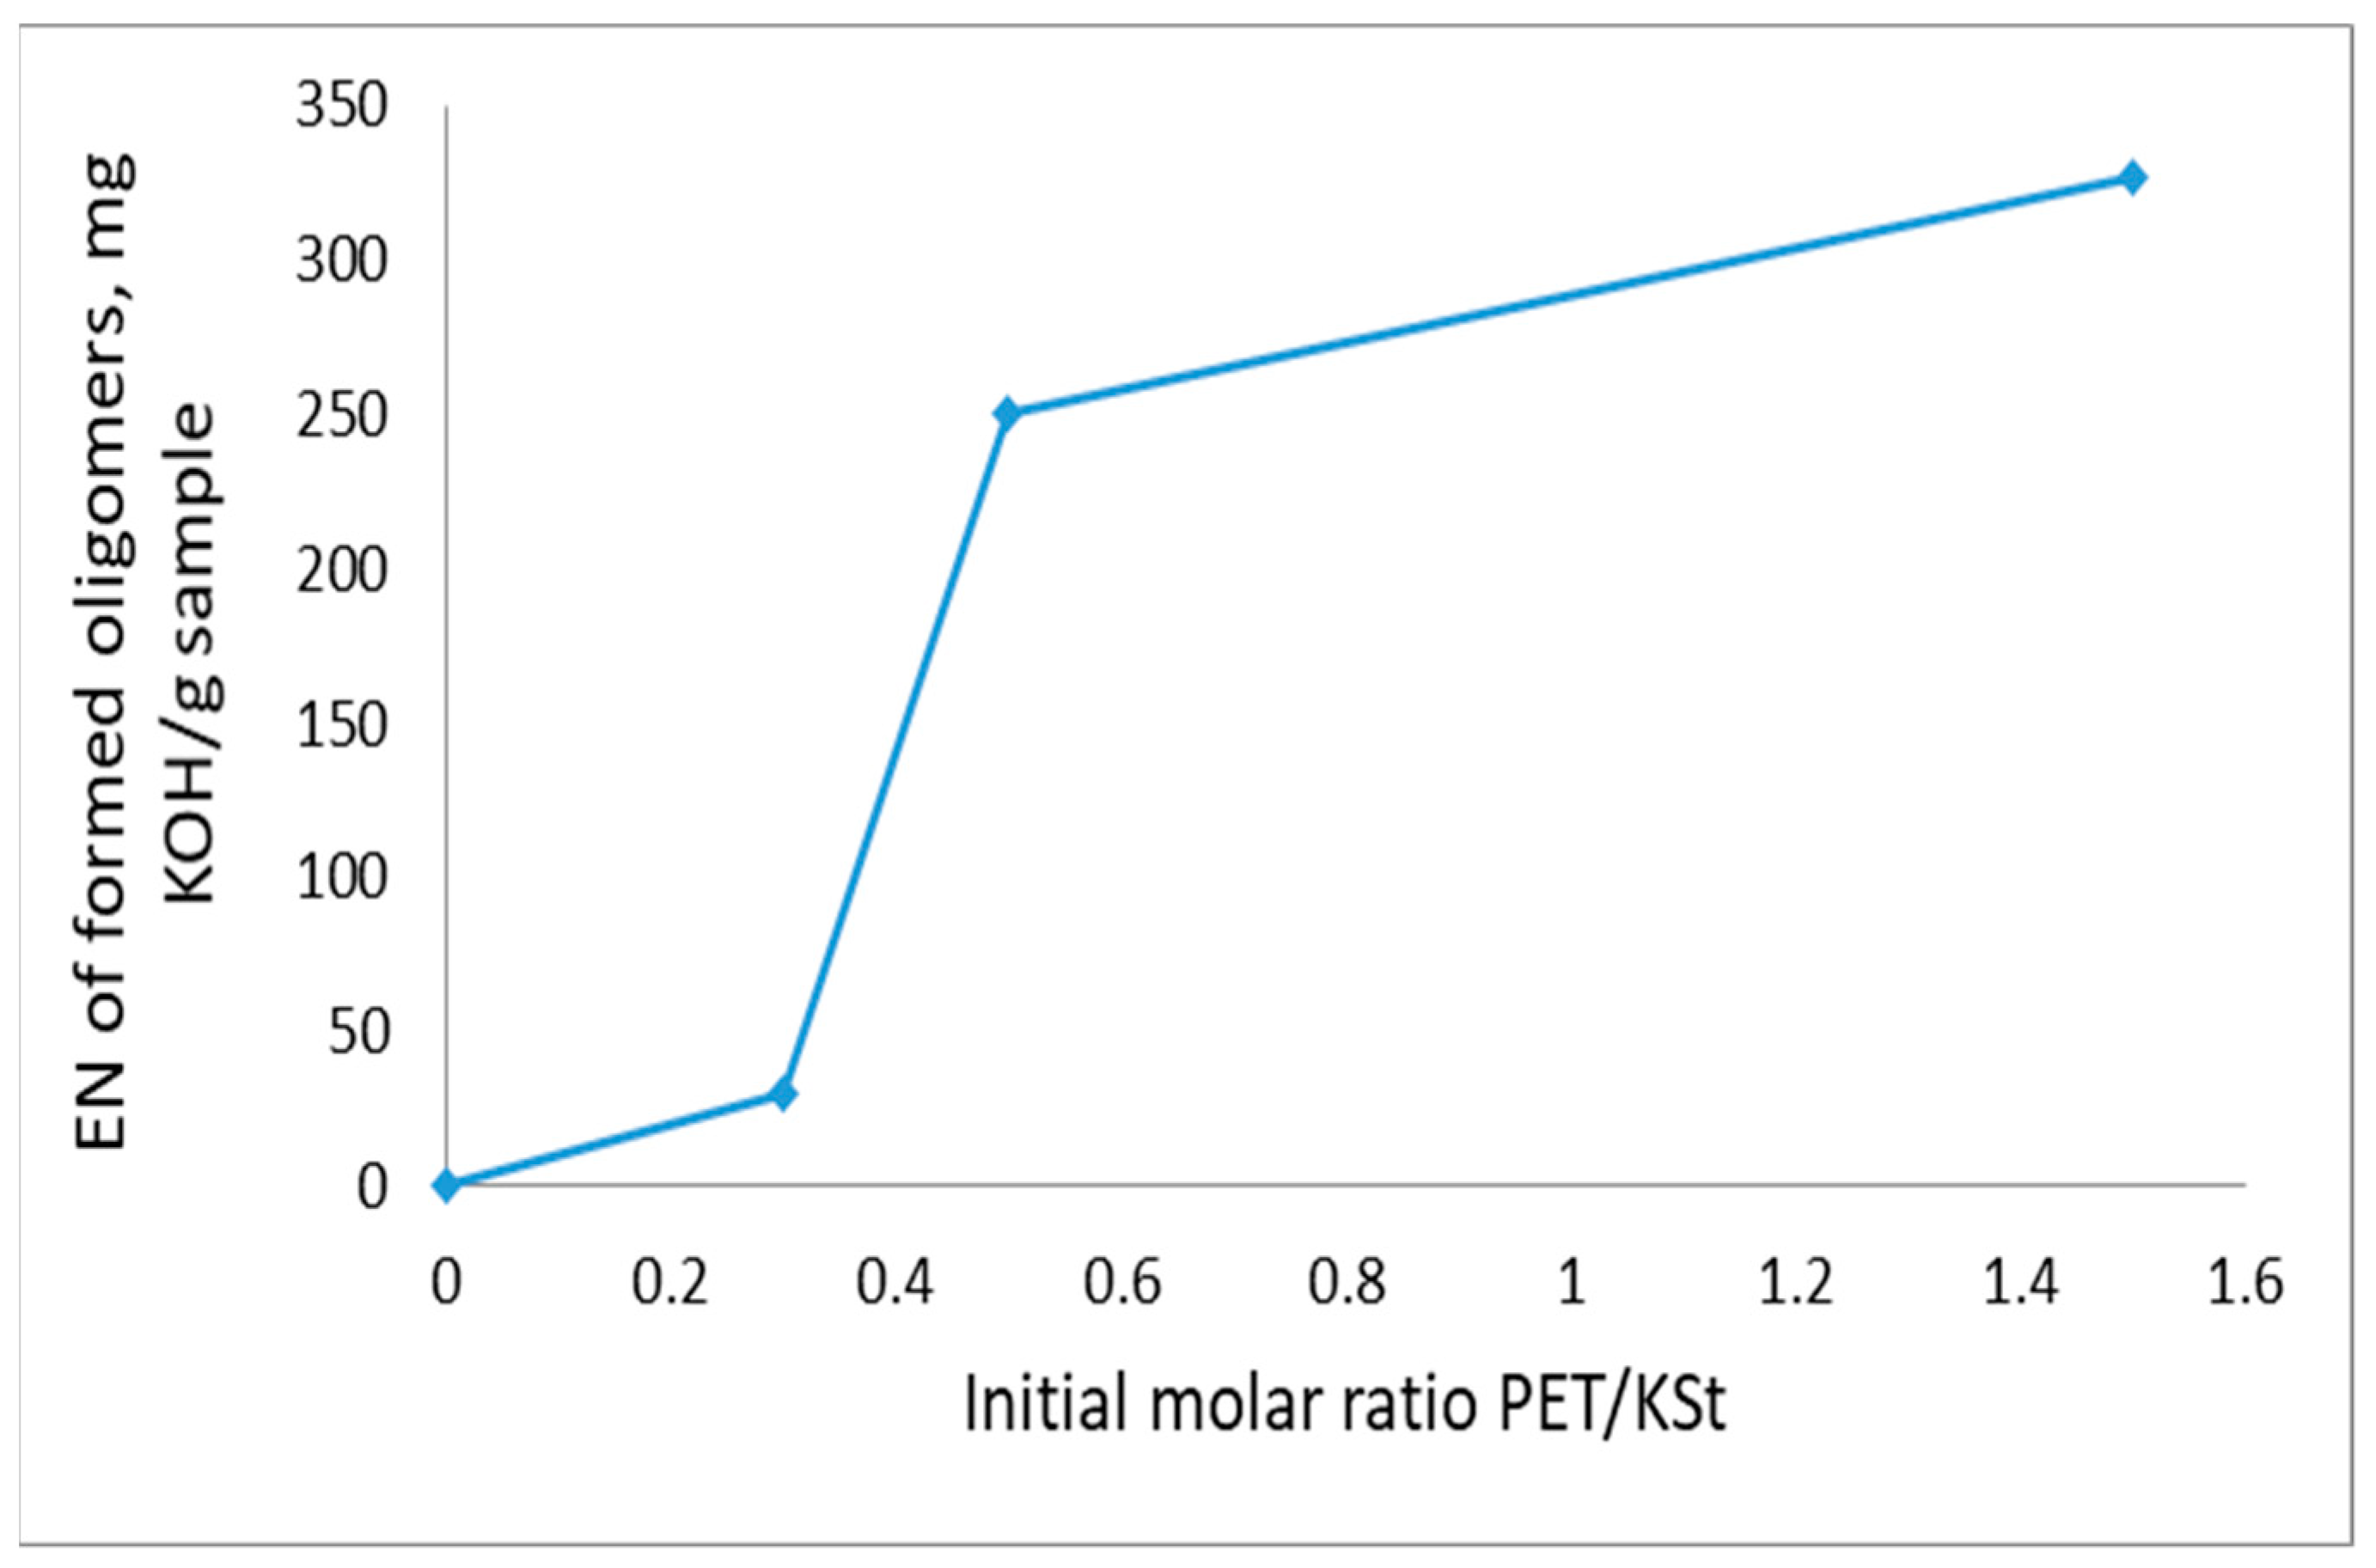
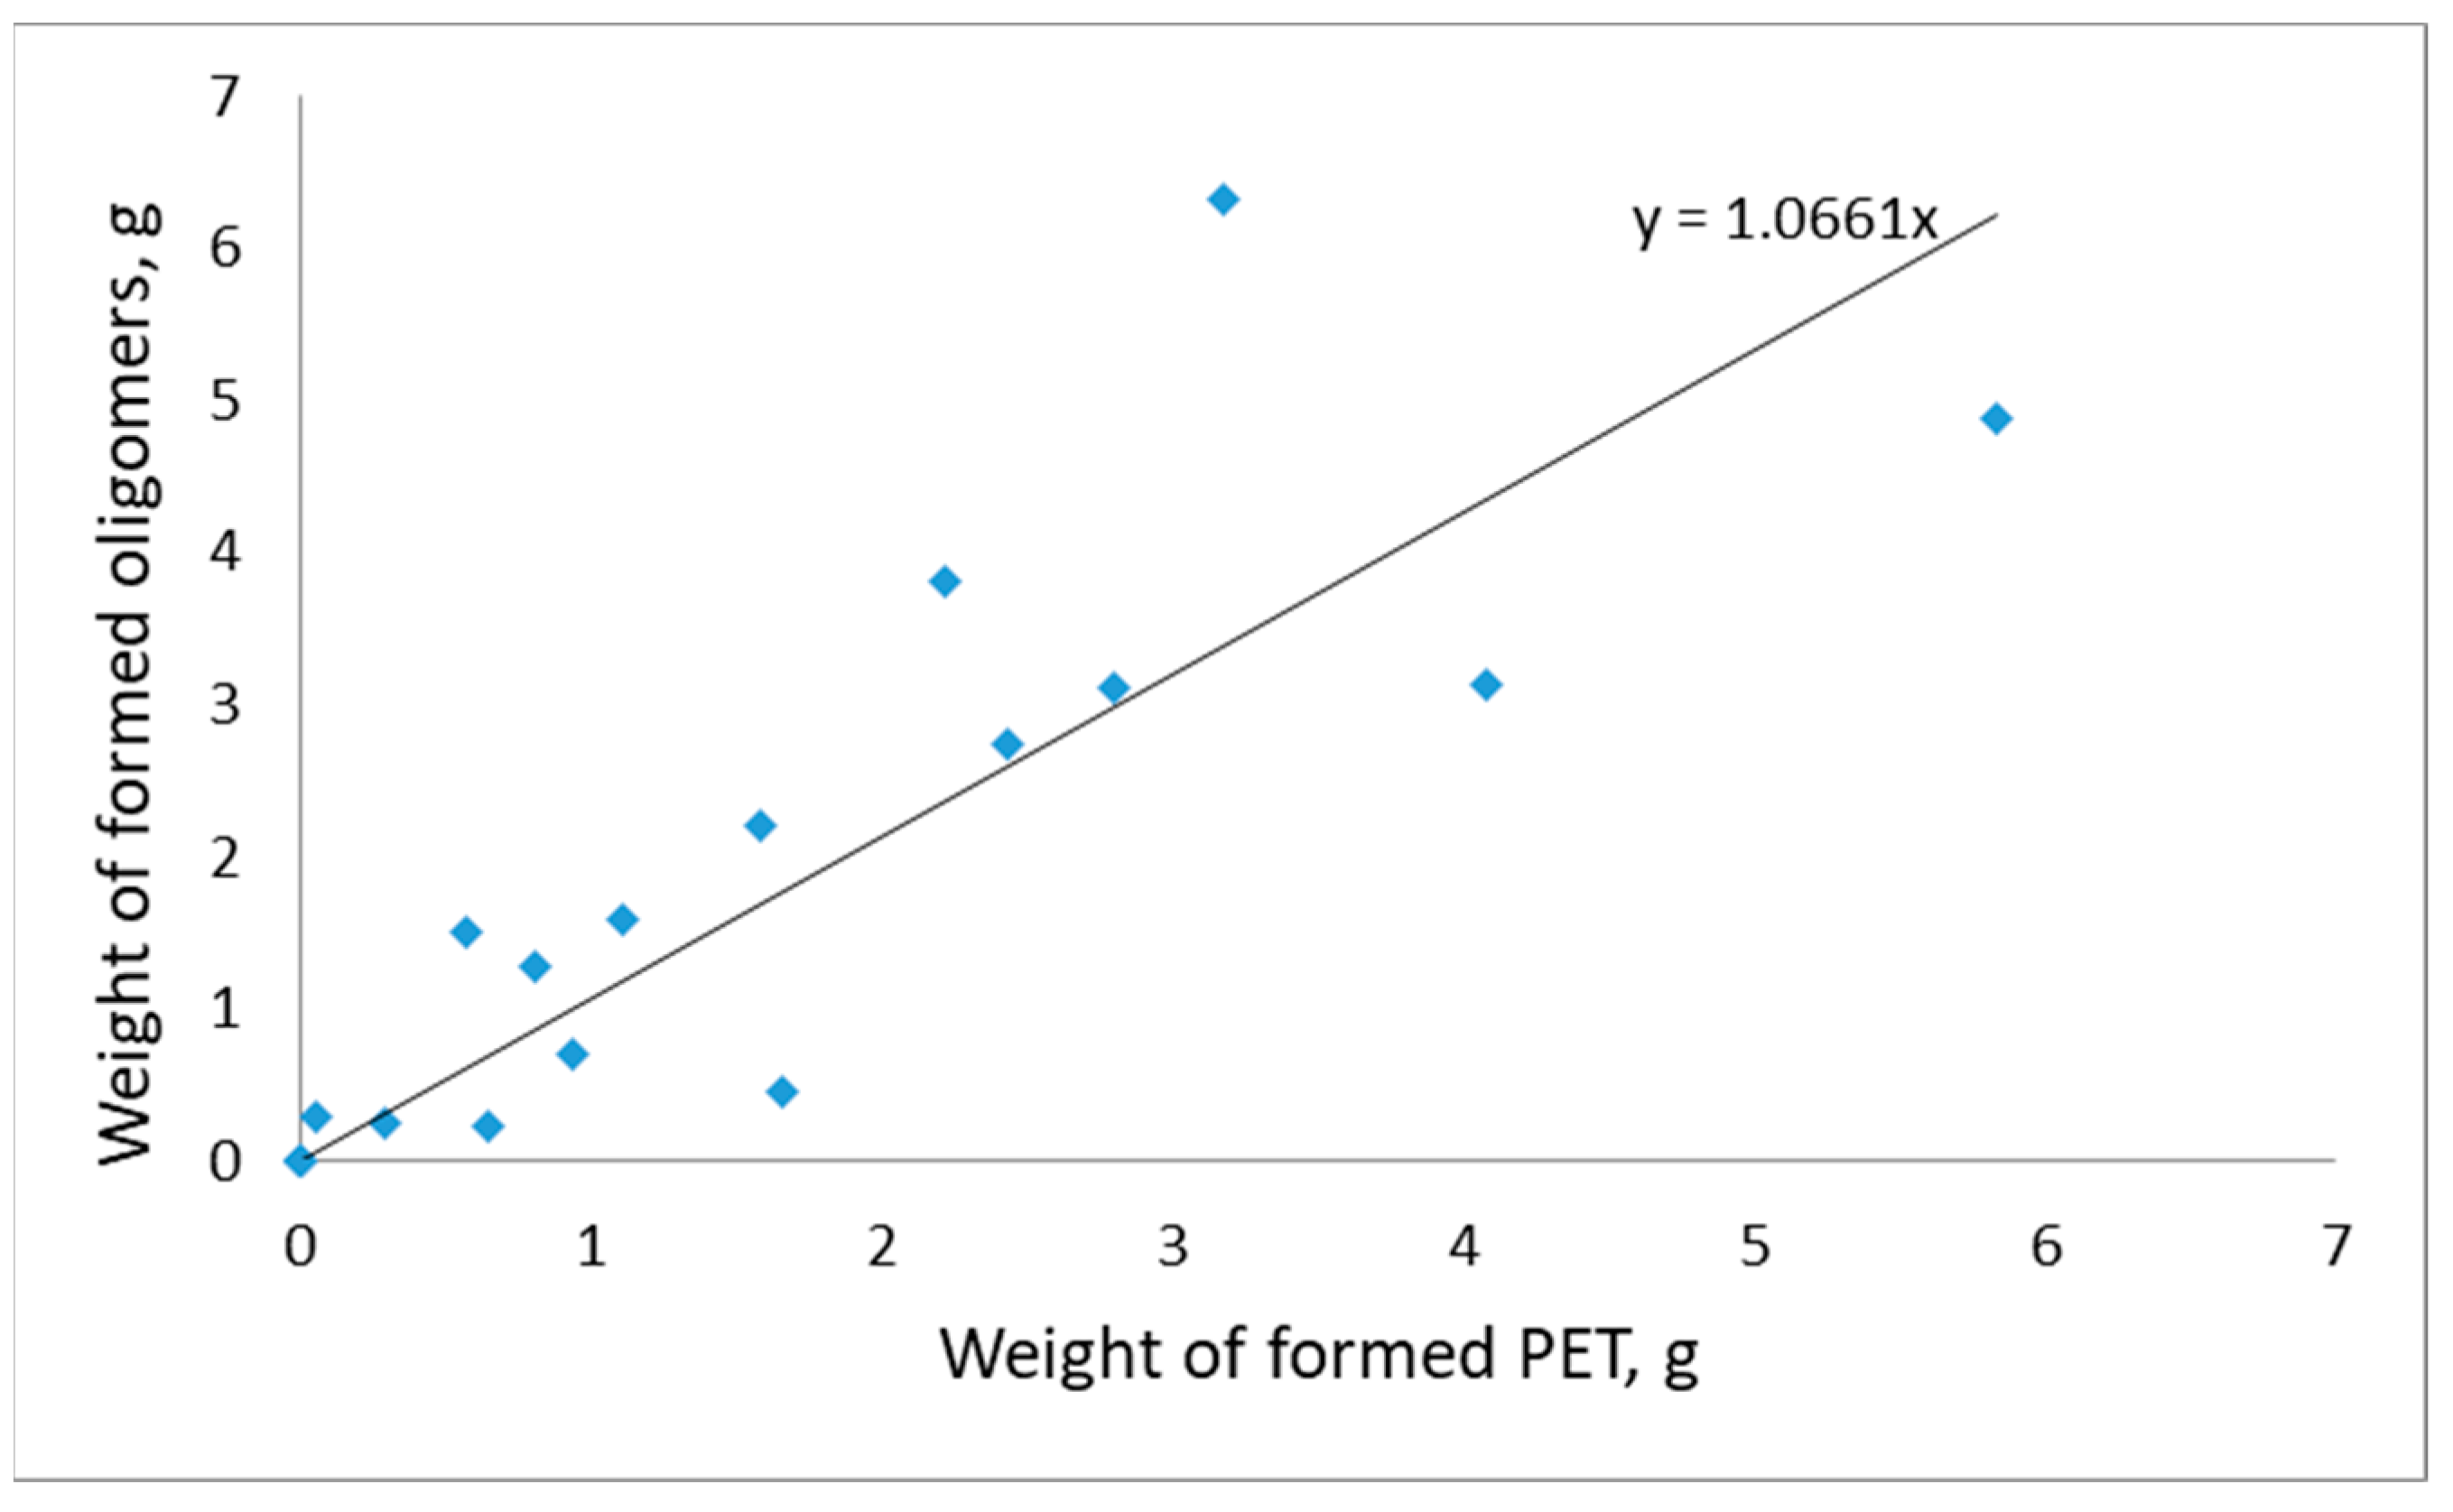
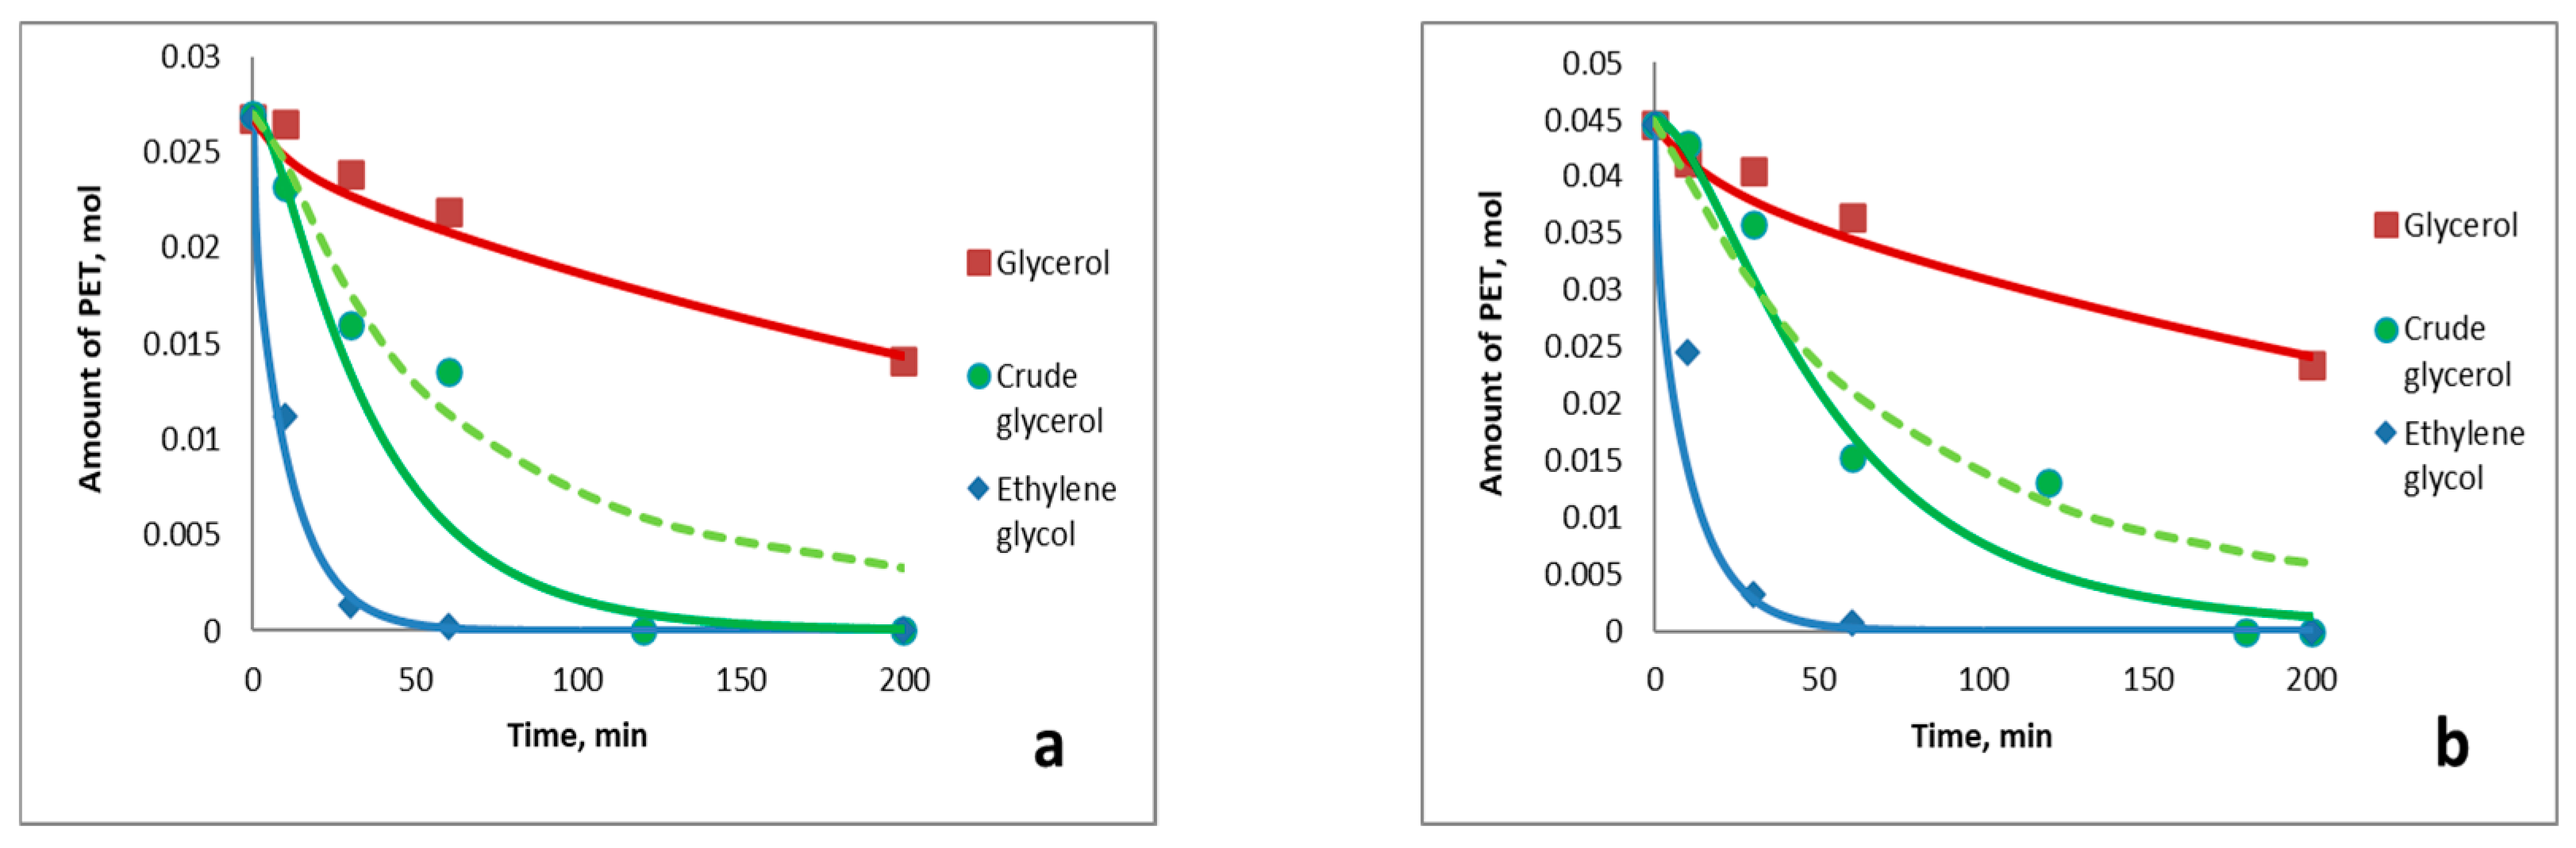
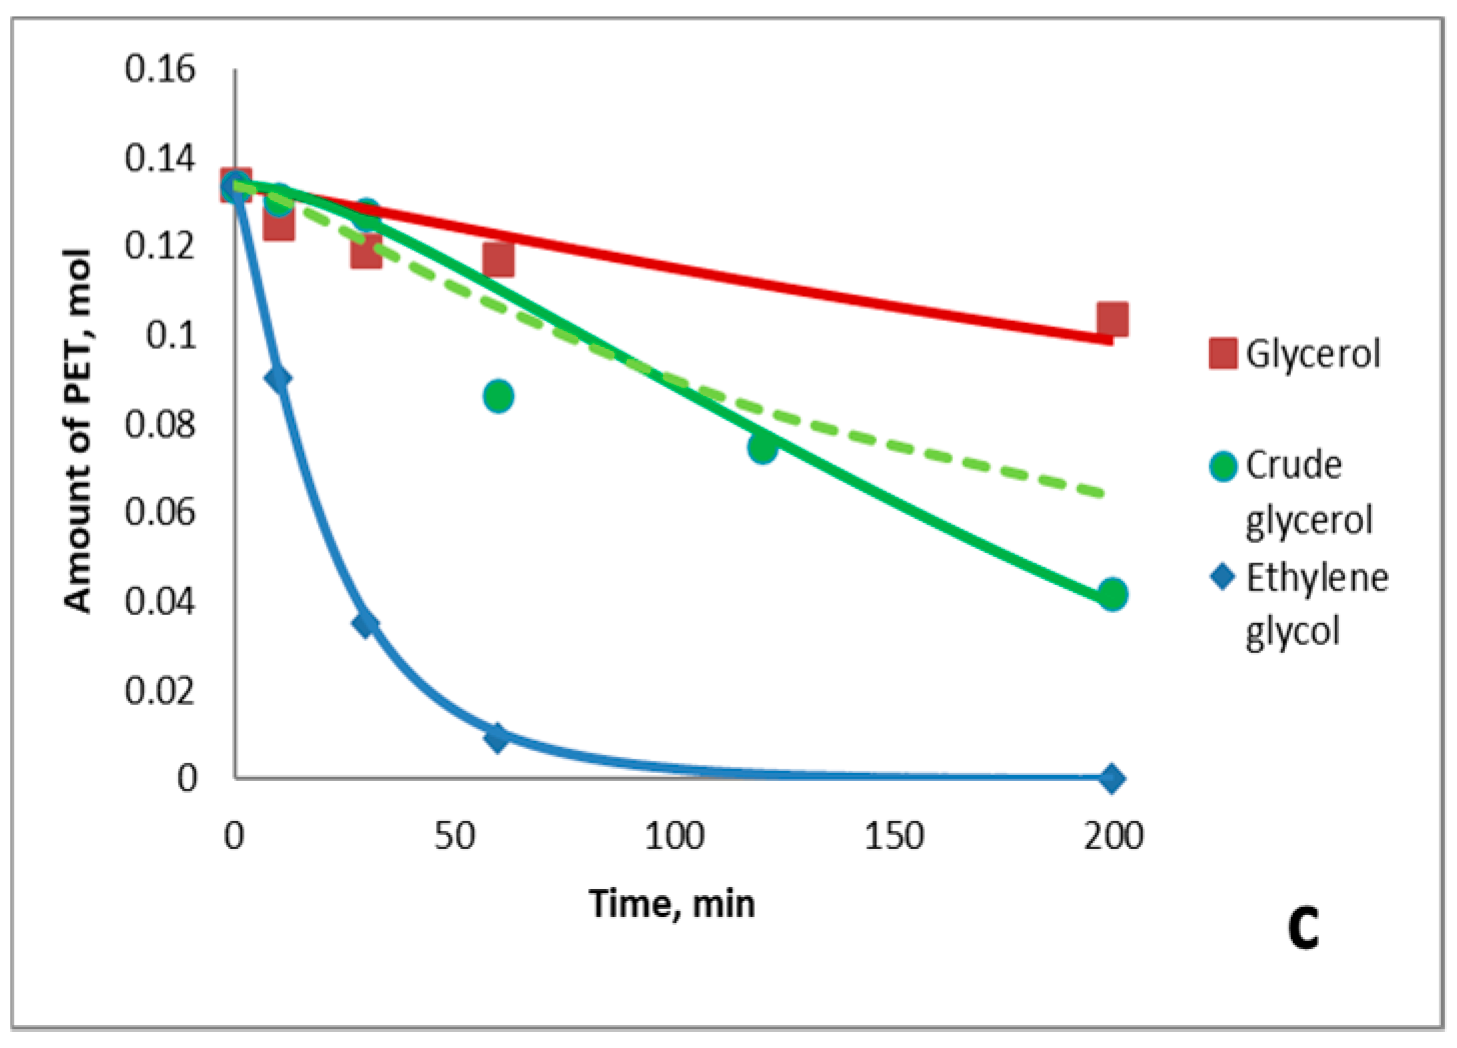
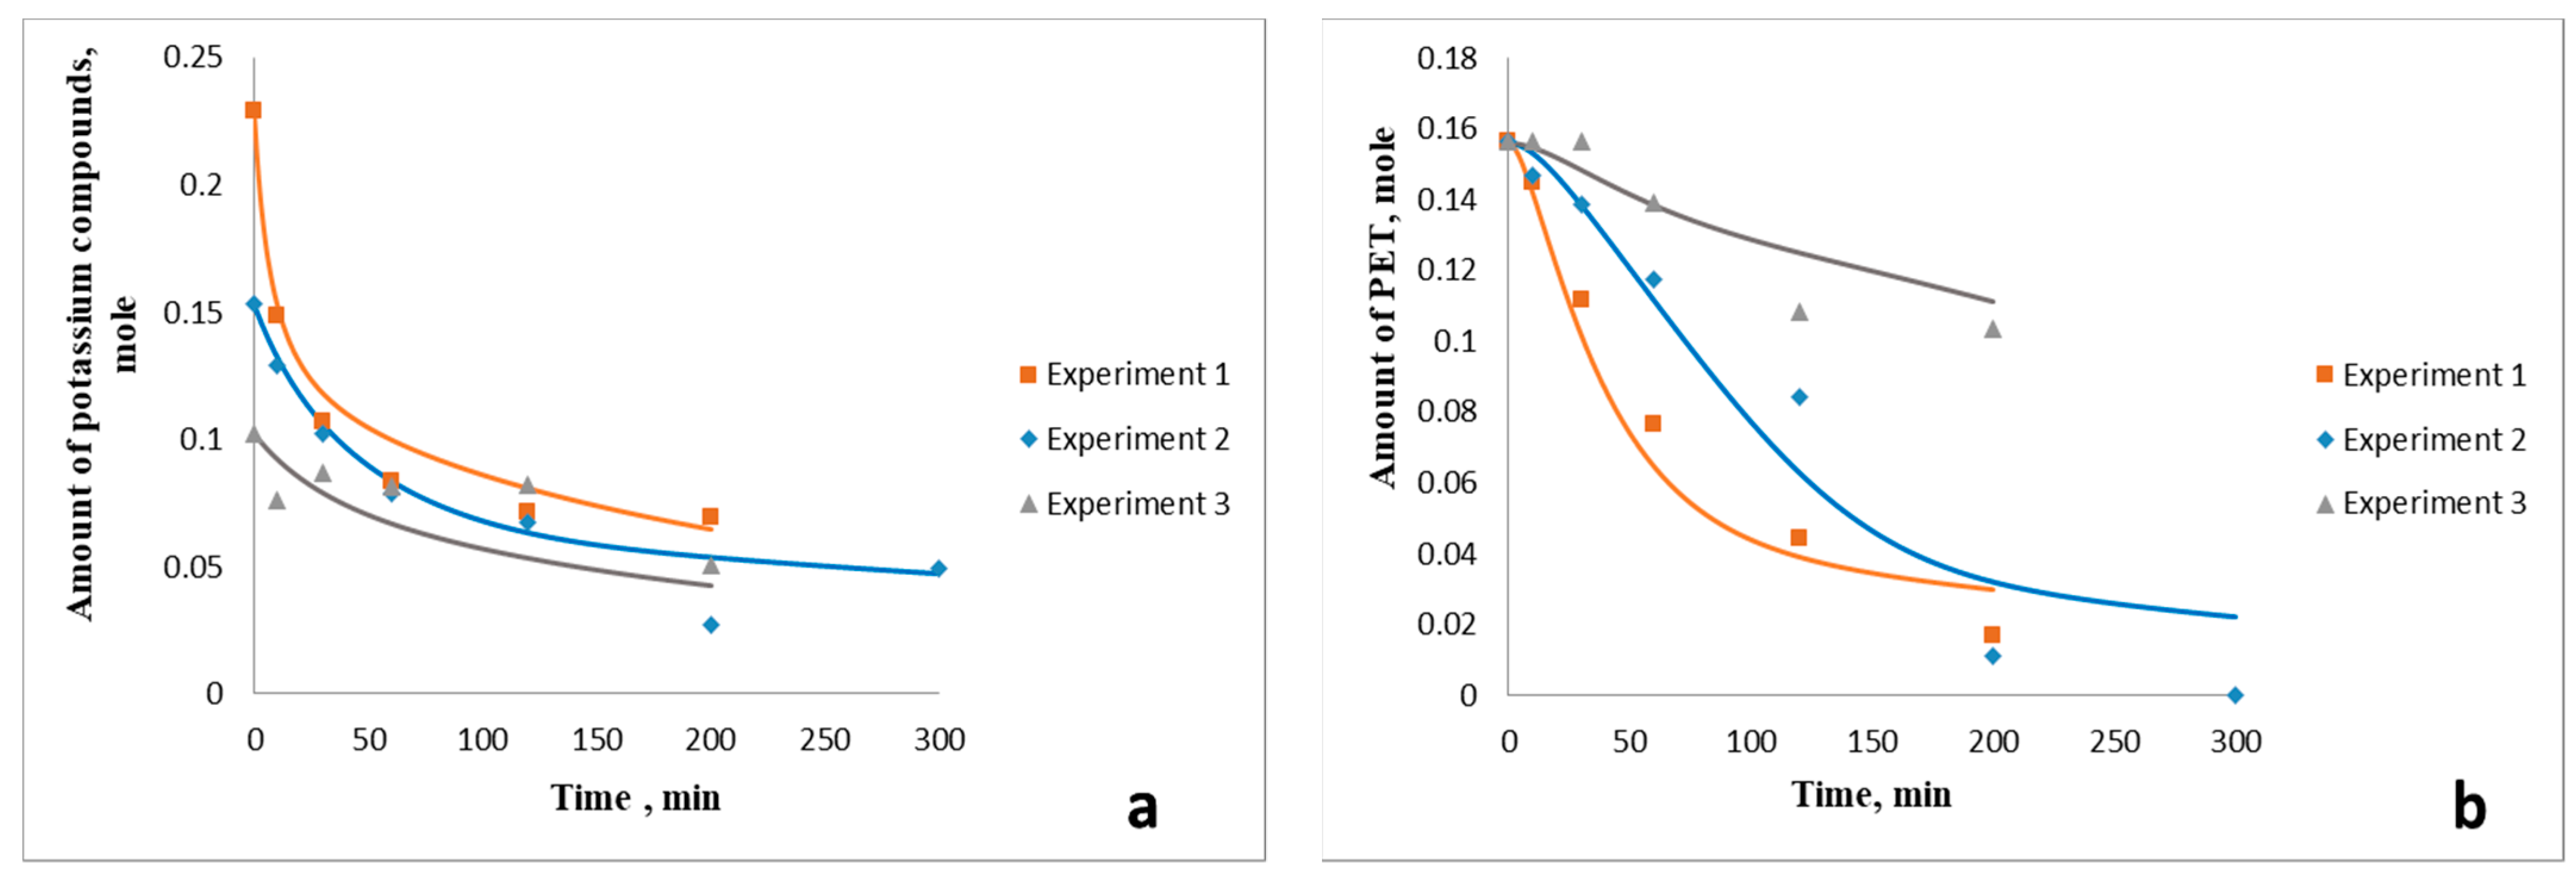
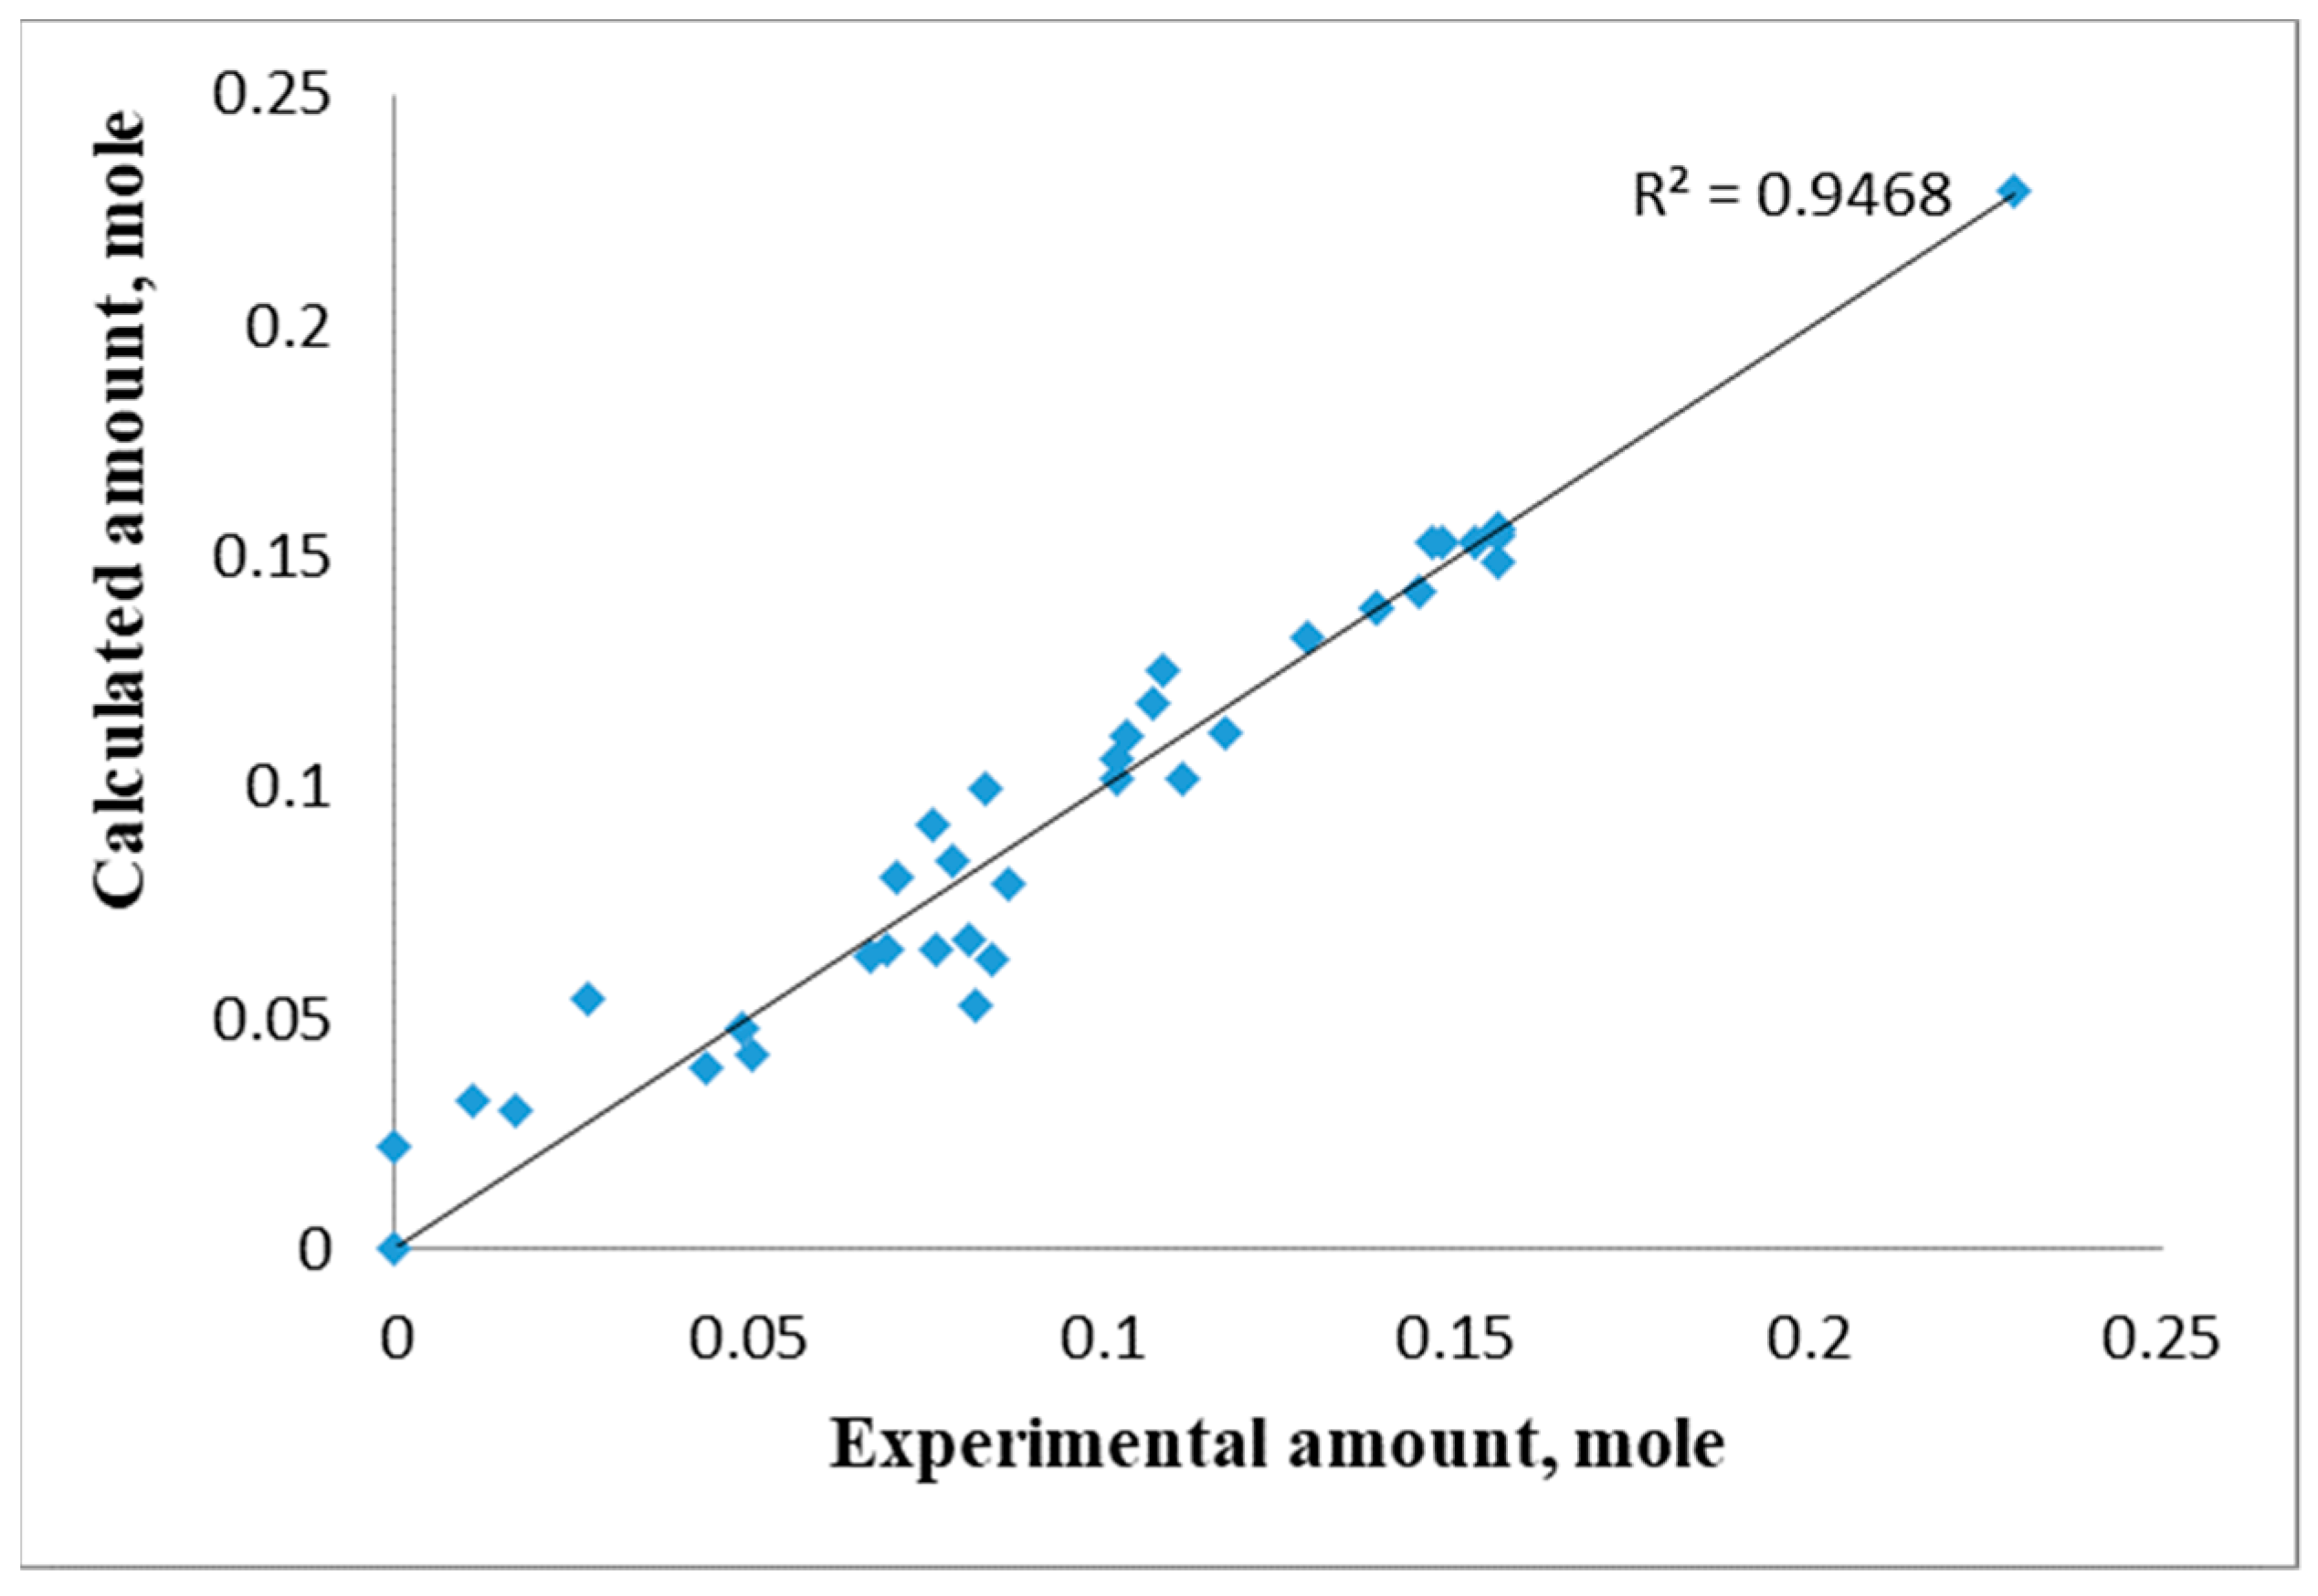
3.3. Influence of Crude Glycerol Composition on the Process Kinetics

Crude glycerol is a by-product, and its composition can vary widely. Therefore, it was extremely important to study its influence on the PET depolymerization process. For the analysis of the influence of different potassium compound contents, 0.072 mol of potassium hydroxide was added to the reaction mixture (Figure 13 experiment 1), or 50 g of pure glycerol was added to the 87 g of crude glycerol (Figure 13 experiment 3). The parameters of the kinetic model are presented in Table 4. These values of observed rate constants provide a good match between the model and the experimental data (Figure 14).
From the presented data, it can be seen that, regardless of the initial amount of potassium compounds, their complete conversion cannot be achieved. At the same time, the rate of PET depolymerization increases significantly with an increase in the content of potassium ions. This could be because in the absence of PET, its complete decomposition to dipotassium terephthalate (DPT) occurs, leaving an excess of potassium soaps in solution. At high PET/KSt ratios, due to the kinetic features of the reactions, the main products are oligomers with a large molecular weight (dimers, etc.), which are poorly soluble in the reaction medium. As a result, during depolymerization, they precipitate and become inaccessible to potassium compounds dissolved in crude glycerol. Whichever is more important, it should be noted that the intercalate formation constant increases significantly when potassium hydroxide is added to the reaction mass, while the remaining constants practically do not change. Therefore, this confirms the theory about the partial hydrolysis of potassium soaps in crude glycerol into potassium hydroxide.
Based on the obtained data, for each PET/K+ ratio, the values of the rate constants can be found by using Equations (16)–(22):
k 1 = k 1 [ K O H ] 0
k 11 = k 11
k 12 = k 12 [ K S t ] 0
k 2 = k 2 [ K S t ] 0
k 21 = k 21
k 22 = k 22 [ K S t ] 0
k 3 = k 3 [ K S t ] 0
where k1, k11, k12, k2, k21, k22, k3, k4—observed rate constants of the corresponding reactions;
k1′, k11′, k12′, k2′, k21′, k22′, k3′, k4rate constants of the corresponding reactions;
[KOH]0—initial amount of potassium hydroxide;
[KSt]0—initial amount of potassium soaps.
The values found for the rate constants are presented in Table 5.
The presented data confirm that the constants of the reactions of high-molecular-weight intermediate compounds decomposing into low-molecular-weight compounds (k11 and k22) do not depend on the initial concentration of potassium compounds. At the same time, the reaction constant of intercalate formation (k1) strongly depends on the number of active potassium ions to which the potassium hydroxide belongs. The initial content of less active potassium soaps also influences the remaining decomposition reactions of PET and high-molecularweight oligomers to low-molecular-weight monomers (k2, k12, k22), as well as the transesterification constant (k3). It should also be noted that the constancy of constants with a different PET/K+ ratio and a constant initial amount of plastic confirms the theory that the PET depolymerization rate is limited by the phase contact surface. Theoretically, depolymerization at a temperature higher than the melting point of PET (245 °C) can solve this problem. However, it is impossible to carry out such a process in crude glycerol since the polycondensation of glycerol begins at temperatures above 200 °C [20].
Thus, taking into account Equations (16)–(22), the parameters of the system of Equations (4)–(15) describing the process of depolymerization with crude glycerol at different amounts of PET will have the values presented in Table 6.
FAMEs are another important group of impurities in crude glycerol. For the study of their influence on PET depolymerization, different amounts of FAMEs were added to the reaction mixture while maintaining its constant volume. The initial PET/KSt molar ratio was 1.0, and the temperature of the process was 170 °C. As a result, it was determined that the amount of FAMEs does not affect the PET depolymerization (Figure 15), and the process can be described with parameters from Table 5 under the corresponding conditions.

4. Conclusions

In this work, it was determined that the rate of PET saponification highly depends on the type of polyol. The ethylene glycol-crude glycerol-pure glycerol PET conversion decreases for the second time in a row. The first one is the most effective, and PET can be fully decomposed after 30 min of reaction; in glycerol, 100% conversion of PET could not be achieved. The PET depolymerization by potassium soaps in polyols is a complicated process. It includes not only polyester’s interaction with potassium compounds but its direct glycolysis via polyols. The first direction leads to the formation of dipotassium terephthalate and fatty acid ethylene glycol ethers. Due to the alkaline environment and high glycerol content in the reaction mixture, the transesterification reaction proceeds with the in situ formation of ethylene glycol, which further reacts with solid PET oligomers with the formation of low-molecular-weight oligomers with functional groups. At low initial PET/KSt molar ratios, excess potassium compounds fully dissolve polyester into dipotassium terephthalate, and the importance of transesterification and glycolysis is low. However, as the initial PET/KSt molar ratio increases, so does the molecular weight of the formed oligomers, and the PET depolymerization process cannot be described without the involvement of ethylene glycol. Because of the surface nature of the process, the rate constants of transesterification and glycolysis decrease with increasing initial amounts of PET. The FAME content in the crude glycerol composition has almost no effect on the process. At the same time, increasing the potassium soap content in crude glycerol leads to an increase in the decomposition rate of PET.

5. Patents

Based on the principles of this work, a patent of the Russian Federation RU № 2 754 972 (2021) was received [22].

Author Contributions

V.N.S.: conceptualization, formal analysis, writing—review and editing and project administration. G.V.D.: conceptualization, methodology, formal analysis, investigation, writing—original draft. V.V.S.: formal analysis, investigation. M.S.V.: methodology, formal analysis, writing—review and editing. R.A.K.: formal analysis, resources, writing—review and editing, P.A.O.: formal analysis, investigation, L.N.M.: formal analysis, investigation, T.D.I.: investigation, E.V.B.: methodology, formal analysis. All authors have read and agreed to the published version of the manuscript.

Funding

This research received no external funding.

Institutional Review Board Statement

Not applicable.

Informed Consent Statement

Not applicable.

Data Availability Statement

All data used in this paper are given in the main text.

Conflicts of Interest

The authors declare no conflict of interest.

References

  1. Sarker, A.; Deepo, D.M.; Nandi, R.; Rana, J.; Islam, S.; Rahman, S.; Hossain, M.N.; Islam, M.S.; Baroi, A.; Kim, J.E. A review of microplastics pollution in the soil and terrestrial ecosystems: A global and Bangladesh perspective. Sci. Total Environ. 2020, 733, 139296. [Google Scholar] [CrossRef] [PubMed]
  2. Kirstein, I.V.; Gomiero, A.; Vollertsen, J. Microplastic pollution in drinking water. Curr. Opin. Toxicol. 2021, 28, 70–75. [Google Scholar] [CrossRef]
  3. James, A.; Rahman, M.R.; Khusairy Bin Bakri, M.; Mahbubul Matin, M. Introduction to Recycled Plastic Biocomposites. In Recycled Plastic Biocomposites; Woodhead Publishing: Sawston, UK; Elsevier: Amsterdam, The Netherlands, 2022. [Google Scholar]
  4. Rahman, M.R.; Khusairy Bin Bakri, M.; Mahbubul Matin, M.; Law Nyuk Khui, P. Micro and Nano Effects of Recycled Plastic Waste to Reinforce and Enhance in Biocomposites. In Recycled Plastic Biocomposites; Woodhead Publishing: Sawston, UK, 2022. [Google Scholar]
  5. Masmoudi, F.; Alix, S.; Buet, S.; Mehri, A.; Bessadok, A.; Jaziri, M.; Ammar, E. Design and Characterization of a New Food Packaging Material by Recycling Blends Virgin and Recovered polyethylene terephthalate. Polym. Eng. Sci. 2020, 60, 250–256. [Google Scholar] [CrossRef]
  6. Nait-Ali, K.L.; Bergeret, A.; Ferry, L.; Colin, X. Chain branching detection by Cole-Cole modeling of rheological properties changes during PET mechanical recycling. Polym. Test. 2012, 31, 500–504. [Google Scholar] [CrossRef] [Green Version]
  7. Lee, H.L.; Chiu, C.W.; Lee, T. Engineering terephthalic acid product from recycling of PET bottles waste for downstream operations. Chem. Eng. J. Adv. 2021, 5, 100079. [Google Scholar] [CrossRef]
  8. Zhou, X.; Wang, C.; Fang, C.; Yu, R.; Li, Y.; Lei, W. Structure and thermal properties of various alcoholysis products from waste poly(ethylene terephthalate). Waste Manag. 2019, 85, 164–174. [Google Scholar] [CrossRef] [PubMed]
  9. Xin, J.; Zhang, Q.; Huang, J.; Huang, R.; Jaffery, Q.Z.; Yan, D.; Zhou, Q.; Xu, J.; Lu, X. Progress in the catalytic glycolysis of polyethylene terephthalate. J. Environ. Manag. 2021, 296, 113267. [Google Scholar] [CrossRef] [PubMed]
  10. Nikles, D.E.; Farahat, M.S. New motivation for the depolymerization products derived from poly(ethylene terephthalate) (PET) waste: A review. Macromol. Mater. Eng. 2005, 290, 13–30. [Google Scholar] [CrossRef]
  11. Hughes, A. Building and Constructions Plastic Market—An Analysis. Reinf. Plast. 2021, 65, 194–198. [Google Scholar] [CrossRef]
  12. Das, A.; Mahanwar, P. A brief discussion on advances in polyurethane applications. Adv. Ind. Eng. Polym. Res. 2020, 3, 93–101. [Google Scholar] [CrossRef]
  13. Cevher, D.; Sürdem, S. Polyurethane adhesive based on polyol monomers BHET and BHETA depolymerised from PET waste. Int. J. Adhes. Adhes. 2021, 105, 102799. [Google Scholar] [CrossRef]
  14. Jamdar, V.; Kathalewar, M.; Dubey, K.A.; Sabnis, A. Recycling of PET wastes using Electron beam radiations and preparation of polyurethane coatings using recycled material. Prog. Org. Coat. 2017, 107, 54–63. [Google Scholar] [CrossRef]
  15. Paraskar, P.M.; Prabhudesai, M.S.; Hatkar, V.M.; Kulkarni, R.D. Vegetable oil based polyurethane coatings—A sustainable approach: A review. Prog. Org. Coat. 2021, 156, 106267. [Google Scholar] [CrossRef]
  16. Chen, K.; Ren, Q.; Li, J.; Chen, D.; Li, C. A highly stretchable and self-healing hydroxy-terminated polybutadiene elastomer. J. Saudi Chem. Soc. 2020, 24, 1034–1041. [Google Scholar] [CrossRef]
  17. Djapovic, M.; Milivojevic, D.; Ilic-Tomic, T.; Lješević, M.; Nikolaivits, E.; Topakas, E.; Maslak, V.; Nikodinovic-Runic, J. Synthesis and characterization of polyethylene terephthalate (PET) precursors and potential degradation products: Toxicity study and application in discovery of novel PETases. Chemosphere 2021, 275, 130005. [Google Scholar] [CrossRef]
  18. Bhogle, C.S.; Pandit, A.B. Ultrasound-Assisted Alkaline Hydrolysis of Waste Poly(Ethylene Terephthalate) in Aqueous and Non-aqueous Media at Low Temperature. Indian Chem. Eng. 2018, 60, 122–140. [Google Scholar] [CrossRef]
  19. Dzhabarov, G.V.; Sapunov, V.N.; Shadrina, V.V.; Voronov, M.S.; Nhi, T.D.; Staroverov, D.V. A kinetic study on the depolymerization of polyethylene terephthalate waste with crude glycerol. Chem. Pap. 2021, 75, 6035–6046. [Google Scholar] [CrossRef]
  20. Panasyuk, G.P.; Azarova, L.A.; Khaddaj, M.; Budova, G.P.; Voroshilov, I.L.; Grusha, T.V.; Izotov, A.D. Preparation and Properties of Sodium, Potassium, Magnesium, Calcium, and Aluminum Terephthalates. Inorg. Mater. 2003, 39, 1292–1297. [Google Scholar] [CrossRef]
  21. Dzhabarov, G.; Sapunov, V.; Kozlovskiy, R.; Makarova, E.; Dinh, P.; Voronov, M.; Shadrina, V.; Nhi, T.D.; Kurneshova, T. A Method of Polyethylene Terephthalate Depolymerization by Biodiesel Wastes. Pet. Coal 2020, 62, 19–26. [Google Scholar]
  22. Sapunov, V.N.; Voronov, M.S.; Dzhabarov, G.V.; Makarova, E.M.; Suchkov, Y.P.; Shadrina, V.V.; Orel, P.A.; Kurneshova, T.A.; Korovina, N.S. Method for Processing Polyethylene Terephthalate Waste. Patent RU 2754972, 8 September 2021. [Google Scholar]
Figure 1. Waste PET dissolves in ethylene glycol for different initial molar ratios of PET/KSt at 190 °C. Horizontal lines are total amounts of PET; vertical lines are total amounts of KSt.
Appliedchem 03 00011 g001
Figure 2. The precipitate formation in ethylene glycol for different initial molar ratios PET/KSt at 190 °C. Horizontal lines are total amounts of PET; vertical line is total amount of KSt.
Appliedchem 03 00011 g002
Figure 3. The change in the ether number of the formed oligomers after 300 min of the PET depolymerization by KSt in ethylene glycol at 170 °C and a different PET/KSt ratio.
Appliedchem 03 00011 g003
Figure 4. There is a correlation between the decrease in determined potassium ions and the amount of PET dissolved in pure glycerol for different initial molar ratios of PET/KSt at 170 °C. Horizontal lines are total amounts of PET; vertical lines are total amounts of KSt.
Appliedchem 03 00011 g004
Figure 5. There is a correlation between the weight of the obtained oligomers and the weight of PET dissolved in pure glycerol for different initial molar ratios of PET/KSt at 170 °C. Horizontal lines are total amounts of PET; vertical lines are total amounts of KSt.
Appliedchem 03 00011 g005
Figure 6. For different initial molar ratios of PET/KSt at 190 °C, there is a correlation between the decreasing amount of determined potassium ions (as potassium stearate equivalents) and the amount of dissolved PET. An initial amount of KSt—0.156 mole. Horizontal lines are total amounts of PET; vertical lines are total amounts of KSt.
Appliedchem 03 00011 g006
Figure 7. The mass of the precipitate formed at 190 °C with an initial amount of KSt = 0.156 mole correlates with the decreasing amount of determined potassium ions (as potassium stearate equivalents). The vertical line is the total number of potassium ions, the horizontal lines are the total mass of PET for each series of experiments, and the experimental points from left to right corresponded to an increase in reaction time from 10 to 200 min.
Appliedchem 03 00011 g007
Figure 8. The change in the ether number of the reaction mass over time during the depolymerization of crude glycerol at 190 °C and a different PET/KSt ratio.
Appliedchem 03 00011 g008
Figure 9. General scheme of the PET saponification process.
Appliedchem 03 00011 g009
Figure 10. Experimental (dots) and calculated amounts of PET in different polyols according to previous (dotted) and new (solid) models at different reaction conditions: (a): 170 °C PET/KSt = 0.3; (b): 170 °C PET/KSt = 0.5; (c): 170 °C PET/KSt = 1.5.
Appliedchem 03 00011 g010aAppliedchem 03 00011 g010b
Figure 11. Experimental (dots) and calculated amounts of PET and potassium compounds in crude glycerol according to the previous (dotted) and new (solid) models at different reaction conditions: (a) 190 °C PET/KSt = 0.4; (b) 190 °C PET/KSt = 0.5; (c) 190 °C PET/KSt = 1.0; (d) 190 °C PET/KSt = 1.5.
Appliedchem 03 00011 g011
Figure 12. Correlation between calculated and experimental amounts of PET and total potassium ions at PET/KSt = 1.5 molar ratio and different reaction conditions: (a) in different polyols at 170 °C; (b) in crude glycerol at 190 °C.
Appliedchem 03 00011 g012
Figure 13. Experimental (dots) and calculated (lines) amounts of potassium compounds (a) and PET (b) at 170 °C, and the initial amount of PET of 0.156 mol: Experiment 1: with the addition of KOH; Experiment 2: standard experiment with crude glycerol; Experiment 3: with the addition of pure glycerol.
Appliedchem 03 00011 g013
Figure 14. Correlation between calculated and experimental values.
Appliedchem 03 00011 g014
Figure 15. Experimental (dots) and calculated (lines) amounts of potassium compounds (a) and PET (b) at 170 °C and the initial amount of PET 0.156 mol: Experiment 1—an initial amount of FAMEs of 0.04 mole; Experiment 2—an initial amount of FAMEs of 0.07 mole; Experiment 3—an initial amount of FAMEs of 0.11 mole.
Appliedchem 03 00011 g015
Table 1. Composition of crude glycerol.
CompoundContent, % wt.Composition of FAMEs Fraction
Fatty acid methyl ethers (FAMEs)4.5C16:0palmitic10.2
C18:0+1stearic + oleic67.4
C18:2linoleic21.9
C18:3linolenic0.5
Glycerol50.4
Potassium salts of fatty acids * (KSt)45.1
*—as potassium stearate.
Table 2. Parameters of Equations (4)–(15) for PET depolymerization by KSt in pure polyols.
Polyol Type[PET]0/[K+]0k1
mol−1*min−1
k11
min−1
k12
mol−1*min−1
k2
mol−1
*min−1
k21
min−1
k22
mol−1*min−1
k3
mol−1*min−1
k4
mol−1*min−1
1Ethylene glycol0.30.2100.0906.0009.5000.0807.000-0.300
20.50.1400.0905.5007.0000.0805.000-0.250
31.50.0300.0900.6000.8500.0800.310-0.025
4Glycerol0.30.750.0222.80.990.00010.651.50.0005
50.50.680.0222.50.920.00010.51.50.001
61.50.140.0221.50.710.000101.50.022
Table 3. Parameters of Equations (4)–(15) for PET depolymerization by crude glycerol.
t, °C[PET]0/[K+]0[KOH]0
mol
[KSt]0
mol
k1
mol−1*min−1
k11
min−1
k12
mol−1*min−1
k2
mol−1
*min−1
k21
min−1
k22
mol−1*min−1
k3
mol−1*min−1
k4
mol−1*min−1
11700.30.0470.110.110.030.0401.20.0350.050.01050.65
20.50.0470.110.110.030.0080.20.0350.0080.00850.53
31.00.0470.110.1140.030.0060.120.0350.0050.00650.36
41.50.0470.110.0150.0300.0420.03500.00450.25
51900.40.0490.1171.50.061.97.50.071.50.952
60.50.0490.1171.350.060.53.10.070.550.551.7
71.00.0470.110.1850.0600.450.0700.0850.5
81.50.0470.110.0680.0600.120.0700.01050.4
Table 4. Parameters of Equations (3)–(14) for different initial potassium amounts.
t, °C[PET]0[KOH]0
mol
[KSt]0
mol
k1
mol−1*min−1
k11
min−1
k12
mol−1*min−1
k2
mol−1
*min−1
k21
min−1
k22
mol−1*min−1
k3
mol−1*min−1
k4
mol−1*min−1
11700.1560.1190.110.3170.030.0160.120.0350.0110.00650.58
20.0470.110.1140.030.0060.120.0350.0050.00650.36
30.0290.0730.0760.030.0110.080.0350.0070.00430.05
Table 5. Parameters of Equations (3)–(14) according to Equations (15)–(21) for different initial potassium amounts.
t, °C[PET]0[KOH]0
mol
[KSt]0
mol
k1
mol−1*min−1
k11
min−1
k12
mol−1*min−1
k2
mol−1
*min−1
k21
min−1
k22
mol−1*min−1
k3
mol−1*min−1
k4
mol−1*min−1
11700.1560.1190.112.6460.0300.1501.0890.0350.1010.0592.646
20.0470.112.6540.0300.1451.0910.0350.1000.0592.654
30.0290.0732.6510.0300.0551.0910.0350.0450.0592.651
Table 6. Parameters of Equations (3)–(14) according to Equations (15)–(21) for different temperatures and PET/KSt molar ratioss.
t, °C[PET]0/[K+]0[KOH]0
mol
[KSt]0
mol
k1
mol−1*min−1
k11
min−1
k12
mol−1*min−1
k2
mol−1
*min−1
k21
min−1
k22
mol−1*min−1
k3
mol−1*min−1
k4
mol−1*min−1
11700.30.0470.113.9530.030.0251.2290.0350.0490.0950.65
20.50.0470.112.5580.030.0100.2550.0350.0100.0770.53
31.00.0470.112.6510.030.0080.1690.0350.0070.0590.36
41.50.0470.110.3490.030.0000.0650.0350.0000.0410.25
51900.40.0490.11730.6120.062.2368.8250.071.7658.1202.00
60.50.0490.11727.5510.060.6023.7340.070.6634.7011.70
71.00.0430.114.3020.060.0000.6340.070.0000.7730.70
81.50.0430.111.5810.060.0000.1850.070.0000.0950.40
Disclaimer/Publisher’s Note: The statements, opinions and data contained in all publications are solely those of the individual author(s) and contributor(s) and not of MDPI and/or the editor(s). MDPI and/or the editor(s) disclaim responsibility for any injury to people or property resulting from any ideas, methods, instructions or products referred to in the content.

