
Nonignorable Consequences of (Partially) Ignoring Missing Item Responses: Students Omit (Constructed Response) Items Due to a Lack of Knowledge


1
IPN—Leibniz Institute for Science and Mathematics Education, Olshausenstraße 62, 24118 Kiel, Germany
2
Centre for International Student Assessment (ZIB), Olshausenstraße 62, 24118 Kiel, Germany
Knowledge 2023, 3(2), 215-231; https://doi.org/10.3390/knowledge3020015
Submission received: 16 March 2023
/
Revised: 4 April 2023
/
Accepted: 7 April 2023
/
Published: 30 April 2023
Abstract
:In recent literature, alternative models for handling missing item responses in large-scale assessments have been proposed. Based on simulations and arguments based on psychometric test theory, it is argued in this literature that missing item responses should never be scored as incorrect in scaling models but rather treated as ignorable or handled based on a model. The present article shows that these arguments have limited validity and illustrates the consequences in a country comparison using the PIRLS 2011 study. It is argued that students omit (constructed response) items because they do not know the correct item answer. A different treatment of missing item responses than scoring them as incorrect leads to significant changes in country rankings, which induces nonignorable consequences regarding the validity of the results. Additionally, two alternative item response models are proposed based on different assumptions for missing item responses. In the first pseudo-likelihood approach, missing item responses for a particular student are replaced by a score that ranges between zero and a model-implied probability computed based on the non-missing items. In the second approach, the probability of a missing item response is predicted by a latent response propensity variable and the item response itself. The models were applied to the PIRLS 2011 study, demonstrating that country comparisons change under different modeling assumptions for missing item responses.
1. Introduction
In educational large-scale assessment studies [1], such as the progress in international reading literacy study (PIRLS; [2]), the trends in international mathematics and science study (TIMSS; [3]), or the programme for international student assessment (PISA; [4]), students’ competencies are assessed using cognitive test items. However, students often do not respond to specific items, leading to missing item responses [5]. It is not obvious how item non-response [6,7] should be treated in the computation of values of competencies (i.e., values of the latent trait) in item response theory (IRT) models [8,9,10,11,12] that are used as scaling models.
While the treatment of missing data in statistical analyses in social sciences is now widely used [13,14], in recent literature, there has been criticism of conventional methods of treating missing item responses in item response models in large-scale assessment studies [5,15,16,17]. Typically, the treatment of item responses can be distinguished between the process of calibration (determination of item parameters) and scoring (determination of ability distributions) [18].
In PIRLS, TIMSS, and PISA (until PISA 2012), only missing item responses at the end of a test booklet (so-called not-reached items) are omitted (i.e., ignored) in calibration in order not to distort estimates of item parameters [2,18,19]. In the scoring step, missing item responses are evaluated as incorrect to compute values of the latent trait as plausible values [20,21]. Since PISA 2015, not-reached items have been ignored in calibration and scoring (although the proportion of missing items is used as a predictor in the latent regression model; see [17]).
However, some researchers [17,22,23,24,25,26] argued that missing item responses should never be treated as incorrect (i.e., in calibration, as well as in scoring). These researchers proposed alternative item response models to handle missing item responses properly. This article will first elaborate on the criticisms made in the literature [16,17,25] to treat missing item responses as incorrect and the proposed model-based alternatives. In contrast to the above-mentioned literature, we argue that only for reasons of validity and not for test-theoretical reasons should a particular method for handling (i.e., both in calibration and in scaling) be preferred. Since assumptions about the missingness of item responses are not empirically testable, we propose two alternative item response models that directly parametrize different assumptions of the missingness mechanism. Finally, we discuss potential psychometric consequences in large-scale assessment for the assessment of competencies with varying treatments for missing item responses.
2. Analysis of the Critique of Traditional Approaches to Handling Missing Item Responses
Typically, missing item responses are scored as incorrect when determining ability distributions in large-scale assessment studies [24]. In a series of recent publications, it was claimed that missing item responses should never be scored as incorrect. It is recommended that this traditional ad hoc method should never be used in large-scale assessment studies [5,17,23,24,25]. In the following, we discuss the arguments of these authors and conclude that they are based on assumptions and conclusions that are atypical in the application of item response models. Therefore, we find the recommendations in the above-mentioned literature somewhat doubtful.
2.1. Aleatoric and Epistemic Uncertainty
Useful for the following considerations is the distinction of Denoeux [27] in the quantification of uncertainty in data (the item responses) and corresponding IRT models. Denoeux distinguishes the concepts of probability and possibility. Uncertainty due to sampling or the modeling of existing data (a dataset containing all item responses) is denoted as aleatoric uncertainty [27]. Uncertainty (or fuzziness) for every single datum (i.e., each individual item response) is denoted as epistemic uncertainty [27]. Epistemic uncertainty (or systematic uncertainty) can be attributed to a lack of knowledge with respect to determining a single datum [28]. In contrast, aleatoric uncertainty refers to the notion of randomness. It describes the variability in the outcome of an experiment (which can be an educational large-scale assessment study) due to inherently random (i.e., sampling) effects. In [27], it is argued that aleatoric uncertainty can be best expressed by probabilities in a statistical model. In the case of educational large-scale assessment studies, this means that an IRT model for the dataset of item responses with fixed values is fitted. Each student’s individual item responses are viewed under the concept of epistemic uncertainty, which would result in fuzzy item responses [27,29]. Therefore, it is unclear how one should score missing item responses.
Nevertheless, in this interpretation, we would like to emphasize that it is vital that assumptions about the individual data points (i.e., the individual item responses) be strictly distinguished from the assumptions in a probability model, which is a statistical model for item responses of all students. To illustrate this conceptual distinction, we assume a distribution of the running times in a 50 m run for a defined population of Austrian students in the fourth grade. For this purpose, a sample of students is drawn. The associated uncertainty of sampling students from the population is associated with probabilities in the context of aleatoric uncertainty. However, the measurement of the running time of a student can never be precisely carried out (e.g., due to measurement uncertainty, the runtime is located in the interval between 8.75 and 8.85 s, which represents a fuzzy date). This kind of uncertainty corresponds to the concept of epistemic uncertainty.
In summary, we reiterate that assumptions about the emergence of data (aleatoric uncertainty) must be distinguished from assumptions about the modeling of existing data (epistemic uncertainty). It does not seem wise to mix up these two processes. Unfortunately, this is precisely the case in the reasoning of why missing item responses should not be scored as incorrect [15,23,24,25].
2.2. Reasoning Based on Foundations of Psychometric Test Theory
The criticism of treating missing item responses as incorrect is based on simulations and test-theoretical arguments [16,25], which we will discuss in detail below.
Most simulation studies convey that scoring of missing item responses as incorrect provides distorted item parameters and ability distributions [30]. In these simulation studies, a missing item response is mostly simulated due to a dependence on latent variables or person covariates but not depending on the item itself. Then, that the model would produce biased estimates when treating missing item responses as incorrect obviously (see [30,31]) follows because the simulation is based on a data-generating model that is not in correspondence with the analysis model (i.e., treating missing item responses as incorrect). In contrast, if a particular IRT model fits, and missing values are generated for all items for which the item was solved incorrectly, then scoring missing item responses not as incorrect will consequently provide distorted model parameters (see [30]). Whether simulation-based reasoning against the scoring of missing item responses as incorrect is valid depends on the plausibility of the data-generating model for the missingness process [31]. We argue that approaches that model missingness on an item independently of the unknown item response itself are implausible. Thus, simulation studies are not helpful in terms of justification for choosing an adequate treatment of missing item responses in real data [31,32].
In [33], simulation studies are classified into method-centred and neutral simulation studies. Method-centred simulation studies are included in research papers that propose a new statistical model. These kinds of simulation studies frequently simulate data that fit the proposed model. The criticized papers on missing item responses [15,17,24] are particular papers that include method-centred simulation studies. Neutral simulation studies are studies aiming at comparing different methods. They should not intentionally prefer one particular statistical approach. The issue with some method-centred simulation studies like [17,34] in the literature on missing item responses is not that they propose new models. However, they make recommendations on how to generally handle missing item responses based on generated datasets that were perfectly suited to their item response models implemented in their favorite toolbox. Therefore, we would like to emphasize that simulation conditions and studied models must be as wide as possible if there is a desire to derive recommendations for practitioners. Otherwise, it sounds more like an advertisement than serious research practice if researchers only focus on their selective toolbox.
In a reasoning based on psychometric test theory, the core of the criticism is that scoring missing item responses as incorrect would model missing item responses deterministically [16,25]. This modeling strategy would contradict model-implied item response probabilities in an IRT model, and it is therefore deemed invalid [17,25]. Let us denote the missingness indicator variable with , that for a person p an item i is observed (i.e., ). Then, formally, for the incorrect scoring, a missing item response is set to zero; thus, , independent of the latent trait of person p. This would lead to a contradiction because the prediction in the IRT model (e.g., in a two-parameter logistic (2PL; [35]) model) would result in a probability of , i.e., the data handling is deterministic, but the IRT model is probabilistic [16,25]. Hence, model assumptions in the IRT model would be violated. The contradiction can be tackled by using the different concepts of uncertainty according to [27] because in the reasoning of [16] or [17], epistemic and aleatory uncertainty are confounded. In this literature, the same probability model (i.e., the item response probability from an IRT model) for the occurrence of a single data point and modeling all item responses in the sample is employed.
If we embed our considerations now more firmly in concepts of psychometrics, it is noticeable that the rejection of treating missing item responses as incorrect relies on an intraindividual interpretation of the probabilities in the IRT model. This reasoning corresponds to a stochastic subject perspective (i.e., probabilities of the IRT model can be interpreted for each combination of a person p and an item i; see [36]), which is not typically employed in large-scale assessment studies [37]. If one uses a random sampling perspective [36,38], the probabilities are interpreted as the result of a sampling of persons, and item parameters, as well as a latent trait distribution for , are introduced as a representation of a high-dimensional contingency table for discrete multivariate observations . Then, formally, the IRT model for I discrete items can be written as
where f denotes the density function of the latent variable (i.e., latent trait or (latent) ability) . In this notation, it becomes clear that in IRT models, a distribution is modeled for a sample of persons, and individuals are not represented (see also [30]). However, if one assumes the intraindividual perspective in the sense of the stochastic subject perspective, the reasoning is based on the assertion that the scoring of missing item responses as incorrect would lead to a deterministic item response probability of zero because the scoring as incorrect leads to a wrong item response with a probability of one (i.e., ). However, the scoring of an item response as incorrect is not related to the probabilistic modeling of item responses of a person. This is because the missing item responses could also have been generated by a deterministic process, which does not contradict the probabilistic modeling in the statistical model for all item responses of all persons. Therefore, one has to distinguish between a real response process—which can be either deterministic or probabilistic but certainly follows the given probabilistic specification of the IRT model in only rare cases—and the statistical model assumptions for the definition of ability as defining elements for the construction of an ability scale (see [30]).
Furthermore, we argue, in the following, that statistical reasons from the stochastic subject perspective invalidate the criticism of scoring missing item responses as incorrect. When modeling intraindividual distributions in an IRT model for a person, item parameters are defined as fixed and known parameters, and the latent trait is required as a fixed effect that is assigned to a person. Then, the assumption of local stochastic independence refers to conditional independence of item responses for a fixed person p based on a set of items, and it is therefore not empirically falsifiable but a means for identifying the ability of this person. Hence, the ability is only defined by the specification of likelihood and item responses . In the Rasch model [39], for a fixed person p and item i, the probability of a correct item response is expressed by (where denotes the logistic function), which is used in the likelihood estimation for the distribution of the trait . Whether the value zero or one for a single observation ( fits) in the Rasch model is empirically undecidable, so scoring missing item responses as incorrect does not necessarily violate the IRT model [30].
It becomes clear that we prefer the random sampling perspective because the item response probabilities from an IRT model do not describe how likely a particular student p is to correctly solve item i. In contrast, we believe that the probability is likely deterministic at the item level. Randomness in IRT models (and, hence, probabilities between zero and one) only emerge because we summarize interindividual differences of multivariate item response data. For example, a particular written arithmetic item can be solved by a student if she or he is capable of applying the necessary rules required for written arithmetic. Hence, whether students correctly solve this item relates to opportunities to learn and whether items are instructionally sensitive [40,41]. As a consequence, specific item effects are regarded as construct-relevant and not as unsystematic errors [42,43].
We would like to emphasize that our arguments only apply to missing item responses for items that were administered to students in a test booklet. In large-scale assessment studies such as PIRLS, planned missingness designs (i.e., balanced incomplete block designs) are utilized in which only a subset of items is administered to students in a test booklet [44]. Such missing item responses should—of course—not be scored as incorrect because students never saw these items. Hence, lack of knowledge cannot be the reason for planned missing data. However, in the case of administered items, we cannot rule out the possibility that students do not provide an item response because they do not know the solution to this item.
To sum up, in our opinion, the reasonings given in the literature [16,17,25] for not scoring missing item responses as incorrect that are based on simulation studies or psychometric test-theory-based reasoning do not seem to be typical for applications in large-scale assessment studies. However, we note that for reasons of validity, quite different scoring methods than incorrect ones could be adequate in applications. Central to the argumentation of the authors’ criticism is that modeling the response processes of students in a cross-sectional measurement (interindividual perspective) is erroneously confounded with response processes associated with a single person (intraindividual perspective; see [45]).
3. Model-Based Treatment of Missing Item Responses
In this section, different model-based approaches for the treatment of missing item responses are discussed. In the following, we only consider IRT models for dichotomous data in Rasch models [39,46]. However, our considerations are also applicable to more general model classes, such as 2PL models or IRT models for polytomous data [47].
Among the model-based procedures, IRT models are often used for distinguishing between ignorable and nonignorable item responses [48]. By ignoring missing item responses for students in the likelihood function, missing item responses are omitted in the estimation. If one ignores missing item responses in the estimation, it can be shown that the missing item responses can be imputed (i.e., scored) under this assumption with a probability of (i.e., scored) as correct. Here, denotes the ability of person p that is being calculated exclusively with the observed item responses. This practically means that in the IRT model, observed item responses can be used to impute missing item responses. Since the probability is always larger than zero, ignoring missing item responses always leads to larger estimated trait values than scoring them as incorrect. Ignoring missing item responses does not mean that the item nonresponse is independent of the latent trait (i.e., the missingness is not missing completely at random (MCAR); see [13]). The missing process is characterized by the fact that the whole of the information about the ability is already recoverable from the observed item responses, i.e., the missing data are missing at random (MAR; [13]). Under this assumption, the proportion of missing item responses might be larger for students with lower abilities than for students with higher abilities.
The treatment of missing item responses as incorrect can be considered one extremum, with ignoring them as the opposing pole. In the first case, there is a risk of underestimating the ability of a person. In the second case, there is a risk of overestimating the ability of a person.
As an alternative to ignoring missing item responses, multidimensional IRT models for nonignorable item responses have been proposed [34,48,49,50,51,52,53,54,55,56,57,58,59,60,61,62,63]. The two-dimensional model proposed in [48] introduces a latent individual response propensity (response tendency) (besides the latent ability ), which predicts missingness in item responses. For the response indicators , a Rasch model is assumed.
The probability of responding to an item, therefore, depends on the response tendency and parameter . Whether an item is missing or not does not depend on the unknown item response itself. This means that and are conditionally independent, given and . The complete information for model parameters can be extracted from observed item responses and response indicators by specifying a particular parametric model. Formally, missing data are missing not at random (MNAR). However, missingness can be traced back to a further latent variable. This kind of missingness process is also denoted as latent ignorability ([64]; see also [31,65,66,67]).
Note that in a joint model for item responses and response indicators , a bivariate distribution for the latent variable is estimated [15,48,68]. Alternative model-based procedures generalize the two-dimensional IRT model of Holman and Glas (see [25,69]) or use mixture distribution approaches [70,71]. It should be emphasized that for an individual person, the maximum likelihood estimate for the ability does not exist; only the EAP estimate can be used [47]. As a consequence, a correlation of the ability and the response tendency has to be known to estimate individual ability values.
If the response tendency can be expressed as , one can show that missing item responses are approximately scored as (see [69]). In contrast to the model with ignorable item responses, the ability estimates are therefore adjusted by a constant . Only if the response tendency and the ability are uncorrelated (i.e., ) do both models lead to the same ability estimates.
4. Two Alternative Item Response Models for Nonignorable Item Responses: Approaches for a Sensitivity Analysis
In this section, two alternative model-based approaches for nonignorable missing item responses are discussed. In the first model, missing item responses are scored as partially correct [72]. In the second IRT model, the two-dimensional IRT model proposed in [48] is extended for the potential dependence of the missingness of an item from the unknown item response itself. In this model, the treatment of missing item responses as incorrect turns out to be a particular case. The two proposed models can be seen as a sensitivity analysis in which different assumptions about the missingness process can be investigated (e.g., [73]).
4.1. Pseudo-likelihood Approach for Partially Correct Scoring of Missing Item Responses
In the pseudo-likelihood approach of Lord [72], missing item responses are scored as partially correct. The pseudo-likelihood function (more precisely, the pseudo-log-likelihood function) for person p is defined as
where is the probability of a correct answer to item i for person p, and is the score of person p on item i. In the case of non-missing item responses, the score is equal to either one (for a correct answer) or zero (for an incorrect answer). In [72], it is argued that in the case of missing item responses for multiple-choice items with M alternatives, the scores can be set to , and the resulting pseudo-likelihood function (3) is maximized. As argued above, by ignoring missing item responses, the values of the missing responses are be scored by , where is the ability estimate for a person p based on the non-missing item responses. If the missing item is treated as incorrect, a score of would be chosen. These should be regarded as two extreme cases of missing item treatment responses. Interim assumptions can be expressed by a sensitivity parameter (scoring missings responses as incorrect) and (treating missing responses as ignorable) that can be examined in the context of a sensitivity analysis. This approach defines the score as , given a preliminary ability estimate . Then, ability estimates are derived as a function of the parameter . Note that one can also use a marginal pseudo-likelihood function in (3) in which a distribution for ability values is assumed. This technique of sensitivity analysis is frequently used for imputations of nonignorable missing data [73,74]. It should be noted that the parameter itself is not estimable but must be fixed in the estimation. This is also supported by the fact that the maximization of the pseudo-likelihood function with respect to can only result in or .
The likelihood function (3) can be written as
Consequently, the likelihood for person p on item i contributes with . The missing item responses can therefore be regarded as fuzzy data with values of zero and one and an associated membership function or [29]. The multiplicative term is also denoted as partial membership (see [75]). Alternatively, for fuzzy data, an additive likelihood term according to has been proposed (see [29]), which is also denoted as mixed membership ([75]).
When estimating the IRT model according to the pseudo-likelihood approach, scores are required in Equation (3). The concrete implementation of my proposed pseudo-likelihood approach proceeds as follows. The scores are computed for missing item responses based on an initial first scaling step. In this first step, missing item responses are treated as ignorable variables, and individual personal ability estimates are obtained (e.g., weighted likelihood estimates, see [76]), given the observed data and predetermined item difficulties. Alternatively, plausible values can be drawn from the individual posterior distribution [20]. The pseudo-likelihood approach (3) with fixed weights can be estimated with the usual EM algorithm (see, e.g., [21,77]). In this approach, the M step remains unchanged compared to evaluations in usual IRT models. In the evaluation of the individual likelihood and the expected counts, the pseudo-likelihood is used instead of an ordinary likelihood.
4.2. Modeling the Missing Response Process
In the second IRT model, missing item responses are handled similarly to the two-dimensional model by Holman and Glas ([48]; see also [15]). Let us again denote as the logistic function so that in the Rasch model [47], the probability of a correct item response is expressed as
The probability for a missing item response of item i conditional on the response propensity may now also be affected by the unknown item response itself (see [6,7,78]). Hence, we define
for . The probability of a non-missing item response (i.e., ) depending on the unknown item response can be modeled with . If is chosen, the IRT model for nonignorable item responses in [48] is obtained. It has been shown that the parameter can be identified from data ([31,79,80,81]; see also [82] for a similar model). Scaling results can also be studied in a sensitivity analysis as a function of a sequence of values. For very small values of (e.g., ), one obtains and, subsequently, . This means that all students who know the item would provide a correct non-missing item response with a probability of 1. Using the Bayes theorem, it follows that . Hence, all missing item responses are evaluated as incorrect for a very small value of . As in the pseudo-likelihood approach, one can use the proposed model to investigate the extremes of ignoring missing item responses but allowing the dependence on the latent response propensity () and scoring missing item responses as incorrect ().
In the proposed IRT model, item difficulties , item parameter for response tendency, and the bivariate distribution of are estimated. In the calculation of the likelihood for item i, the probabilities of three disjunctive events—, , and —are used. The probability of a missing item response can be computed as the total probability:
which can be calculated based on the item parameters and response models (5) and (6). Hence, missing item responses are integrated analogously to missing items in large-scale assessments studies by employing the integrated marginal maximum likelihood estimation method ([21]; see also [6,83]).
The proposed IRT model is based on the evaluation of item response probabilities conditional on the latent variables and . For observed correct item responses, the probability is expressed as
For observed incorrect item responses, one obtains
using . For missing item responses, according to Equation (7), one obtains
The two-dimensional IRT model can be estimated using an EM algorithm. A two-dimensional distribution for is estimated. Frequently, the bivariate normal distribution is utilized. However, this assumption can be weakened [68].
5. Comparison of Four Countries in PIRLS 2011
In the following section, a comparison of reading literacy performance in PIRLS 2011 is conducted using a test booklet for four selected countries: Austria (AUT), Germany (GER), France (FRA), and the Netherlands (NLD). The dependence of the country means is investigated for different treatments of the missing item responses.
5.1. Data
In the following analysis, item responses of booklet 13 in PIRLS 2011 (i.e., the “PIRLS Reader”) consisting of 35 items (15 multiple-choice items with four response alternatives; 20 constructed response items) were used. For this booklet, item responses of 968 Austrian, 809 German, 901 French, and 802 Dutch students were available. For simplicity, all polytomous items were dichotomized, and only the highest scores were recoded as correct. The dataset has been made available as data.pirlsmissing in the R [84] package sirt [85]. Student sampling weights were taken into account in the analyses.
Descriptive analyses show that the average proportion of missing item responses varied considerably between items and countries (AUT: 11.2%; DEU: 7.9%; FRA: 13.6%; NLD: 2.7%). Missing proportions for constructed response items were much higher than for multiple-choice items (e.g., for AUT, constructed response: 17.7%; multiple-choice: 2.6%). When scoring missing item responses as incorrect, Austrian students provided, on average, 55.1% correct item responses and slightly surpassed France (53.7%) but achieved significantly lower results than German students (63.0%) and Dutch students (64.4%).
5.2. Analysis
For the country comparison, six different IRT models (referred to as models M1, M2, M3, M4, M5, and M6) were specified. Student weights were taken into account in marginal maximum likelihood estimation. For a simplified description of the results, country means in each IRT model were transformed so that Austrian (AUT) students had a country mean of 500 and a country standard deviation of 100. The trait distributions for Germany (DEU), France (FRA), and the Netherlands (NLD) were subjected to the same transformation so that country comparisons in all IRT models should always be interpreted relative to the performance of Austria. This choice of standardization was made because Austria was considered a reference country in the analysis, and the other three countries should be compared to Austria (see [86,87]). However, there could also be good reasons for using a fixed mean and a fixed standard deviation in a total population comprising all countries (see [31,88]).
In model M1 (that corresponds to the official procedure in PIRLS), a unidimensional Rasch model with four groups (i.e., the four countries AUT, GER, FRA, and NLD) was specified in which missing item responses were scored as incorrect. In model M2, missing item responses were ignored, which means that they were omitted in the computation of the marginal likelihood. As an extension to model M2, model M3 was a two-dimensional Rasch model with two latent variables of ability and the response tendency . In model M4, a pseudo-likelihood approach of the Rasch model was specified in which missing item responses for multiple-choice items with four answer alternatives were scored with the score . In contrast, missing item responses for constructed response items were scored as incorrect (i.e., with a score of ). In models M1, M2, M3, and M4, item parameters and the distribution parameters for the trait(s) in the four countries were concurrently estimated.
In models M5 and M6, in a first analysis, missing item responses were scored as incorrect, and common item parameters for all four countries were obtained, which were subsequently fixed in a second step. In model M5, the pseudo-likelihood approach was used for the Rasch model, in which missing item responses were scored as , where is the personal ability, which was computed based on the non-missing item responses. The personal ability was a random draw from the individual posterior distribution. The country means were calculated depending on the sensitivity parameter . In model M6, the two-dimensional model M3 is extended by modeling the missingness process dependence of the absence on the item response itself. This model was calculated depending on the sensitivity parameter .
Additionally, we empirically determined the imposed missingness mechanism defined by Equation (6) for all four countries. In this model, the correlation between the latent trait and the response propensity can be fixed to zero or can be estimated (i.e., ). Moreover, the parameter can be fixed to 0 (i.e., ignoring the missing item response), fixed to (i.e., treating the missing item response as incorrect), or be estimated from the data assuming a common parameter across items. Hence, five different model specifications of the two-dimensional IRT model result. The analysis models were defined as N1: , ; N2: , ; N3: estimated, ; N4: , estimated; N5: , estimated; and N6: estimated, estimated. The models were compared using the Bayesian information criterion (BIC). Because the models were separately estimated for each country, the distributions of the latent trait were subsequently brought onto a common metric across countries using the mean–mean linking method [89].
For all item response models, the country means of Austria, Germany, France, and the Netherlands were compared. The entire data preparation and estimation of the models was conducted in the R software [84]. For estimation of models M1, M2, and M3, the R package TAM [90] was used. The models M4, M5, M6, and N1 to N6 were estimated with the rasch.mml2() function of the R package sirt [85].
5.3. Results
In Table 1, the country means for all models (M1 to M6) are shown. It is noteworthy that the two extreme treatments of missing item responses in model M1 (missing item responses were scored as incorrect) and model M2 (missing item responses were ignored) resulted in slight differences for Germany and France in comparison to the country mean of Austria (GER: M1: 537.5, M2: 534.2; FRA: M1: 488.7, M2: 492.4), while the different model specification led to significant differences for the Netherlands (NLD: M1: 540.3, M2: 523.4). These findings can be explained by the fact that the proportion of missing item responses for Dutch students (2.7%) was substantially lower than that for Austrian students (11.2%).
In models M5 and M6, the sensitivity parameters and are varied within the framework of sensitivity analysis that refers to different assumptions of the missing process for item responses. In practice, the findings presented in Table 1 span the range of the country means between the extremes of treating missing responses as incorrect (model M1) and treating them as ignorable (model M2).
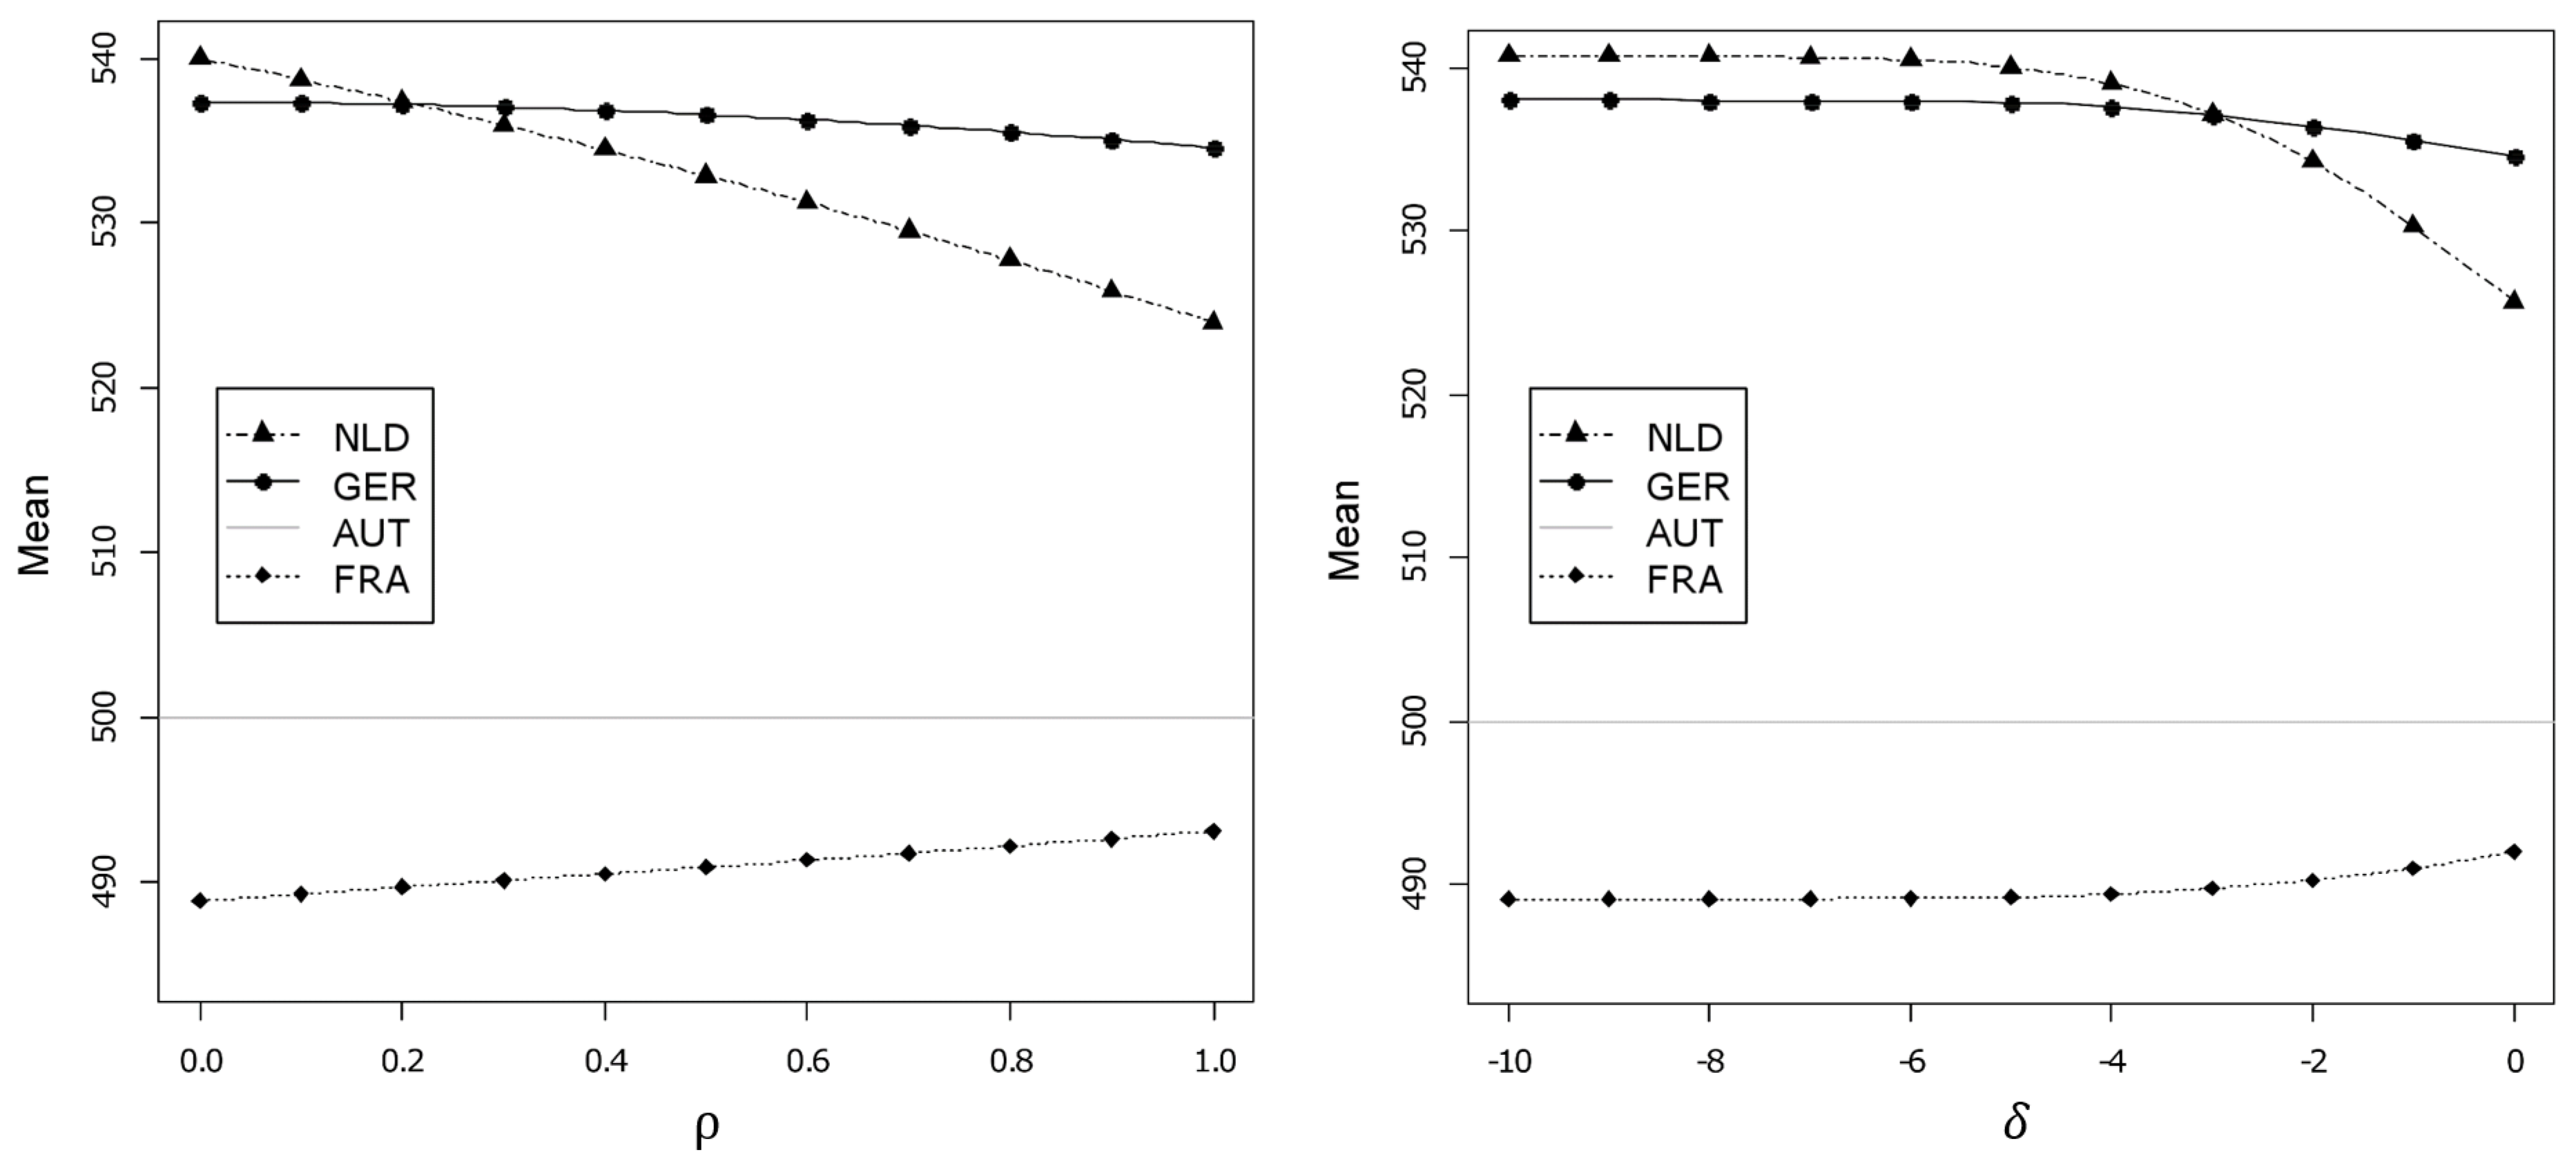
In Figure 1, the country means are shown as a function of the sensitivity parameters in models M5 and M6. The ranks of Germany and the Netherlands switch depending on the parameters and . Notably, the country means are continuous and monotone functions of the sensitivity parameters and , respectively.
In Table 2, the BIC is displayed for all five estimated models (N1, …, N5) and the four countries (AUT, DEU, FRA, and NLD). It turned out that for three of the four countries (i.e., AUT, FRA, and NLD), the most general model was preferred that estimated both missingness parameters and . Hence, the latent response propensity is not fully sufficient to explain missing item responses. The true but unobserved item response itself also governs the occurrence of missing item responses. Only for DEU, model N3, which includes a correlation between the latent trait and the latent response propensity but does not allow an influence of the item response on the response indicator, was the best-fitting model in terms of the BIC.
From model N6, country-specific missingness parameters can be extracted. The latent trait and the latent response moderately correlated positively (AUT: ; DEU: ; FRA: ; NLD: ). The parameter was smaller than zero, indicating that students who omitted items did so because they did not know the item (AUT: ; DEU: ; FRA: ; NLD: ). Interestingly, the parameter was slightly more negative in model N3, in which the correlation between the trait and the response propensity was set to zero (AUT: ; DEU: ; FRA: ; NLD: ). Importantly, these findings demonstrate that the response mechanisms differ across countries.
In Table 3, country means for the five different model specifications (N1 to N5) are presented. The largest relative changes across models occur for NLD because this country had the lowest missing item response rates. The models do not substantially differ regarding the question of whether the correlation between the trait and the response propensity is estimated or fixed to zero.
6. Discussion
In contrast to statements in the literature [17,24], our analyses of PIRLS 2011 showed that ignoring missing item responses has an impact on the central results of a study. Country means varied considerably in different treatments of missing item responses, which raises the question of the choice of a valid scaling approach.
We argued that the criticism against the scoring of missing item responses as incorrect based on test-theoretical arguments [17,25] utilizes an intraindividual interpretation of item response probabilities. In this reasoning, the concepts of aleatoric uncertainty (the statistical model) and epistemic uncertainty (concerning the assessment of data) are erroneously confounded. It was also argued that simulation studies to choose the appropriate way to handle missing item responses are irrelevant to choosing a scaling method (see also [30]). Since defining an adequate scoring rule for missing responses is not empirically determinable, two different IRT models were proposed, which served as a sensitivity analysis of different assumptions about missing item responses.
The first alternative one-dimensional IRT model (model M5) is based on a pseudo-likelihood approach in which the missing item responses can take values between zero and one. However, this approach has the disadvantage that for item responses, weights have to be computed. In the second model (model M6), the additional latent response tendency is introduced, which can be correlated with ability. The missingness of an item response is allowed to be dependent on the unknown item response itself.
Typically, the sensitivity analyses performed in this paper are preferred to more complex model specifications, such as pattern mixture models [34]. When imputing missing data, a range of analysis results can be obtained by varying plausible assumptions on the missingness [74]. If a prior distribution for a sensitivity parameter characterizing the assumptions of the missingness process is specified, then a multimodel inference analysis can be conducted that weighs different theoretical assumptions about the missingness process [91].
Within the scope of our analysis, we restricted ourselves to the Rasch model. However, the analysis can be extended to more complex IRT models such as the 2PL, the 3PL, or the generalized partial credit model. Instead of using a common sensitivity parameter for all items, this parameter can be separately estimated for each individual item or for individual item groups (such as multiple-choice items and constructed response items; see [31,80]). If a country-specific missingness process is estimated (i.e., by assuming country-specific parameters), the comparability of the country means obtained from such IRT models could be strongly questioned.
As an alternative to model-based treatments of missing item responses, missing values on items can be multiply imputed [92,93,94]. The advantage of imputation-based procedures might be that more complicated (e.g., multidimensional) IRT models might be used for imputation, while the analysis model is simpler and typically mis-specified (see [31,95]).
Undoubtedly, the best strategy for handling missing data would be to avoid their appearance [96]. In computerized administered tests, missing item responses can be avoided by forcing students to respond to an item. However, careless or unmotivated responses cannot be excluded by such modifications. Students who do not know a constructed response item will unlikely provide a valid item response if forced by the computer.
We would like to emphasize that we think that the choice of how to score missing item responses should mainly be made under from a validity perspective [97,98]. That is, a particular missing data treatment implies a scoring rule for obtaining ability estimates. The validity of the scoring rule must be discussed regarding the use of the score and its interpretations [99]. In this sense, we think that scoring missing item responses as incorrect is the most valid strategy for country comparisons in official reporting of large-scale educational assessment studies such as PIRLS but may be inappropriate for research questions involving relations of student abilities and questionnaire scales such as motivation or self-concept [32]. Hence, there cannot be a general optimal rule for how to handle missing item responses in all potential applications of a dataset. Our motivation for writing this article was that we find scoring strategies inappropriate that do not score missing item responses as incorrect (see [5]) in studies that involve reporting and comparison of several states or countries.
As pointed out by an anonymous reviewer, missing item responses should be classified into omitted and not-reached item responses [100]. Our arguments mainly apply to omitted item responses within a test. For speed tests, it might be preferable not to score not-reached item responses as incorrect. However, large-scale assessment studies such PIRLS are not strongly speeded, and we also think that not-reached items should be scored as incorrect [32]. However, the recently introduced use of multistage adaptive testing in educational assessment studies complicates the meaning of not-reached items across students [101].
The consequences of treating missing item responses as ignorable or incorrect can also be significant for scaling in longitudinal studies if missing proportions vary by grade, school track, or time point. In IRT models that assume ignorable missing item responses, the meaning of the identified ability remains unclear. If an ability in a particular domain is just defined by the correctly solved items in a test, in our view, a non-circular and more valid definition of ability is obtained. Consequently, it can be concluded that missing item responses cannot be ignorable or partially ignorable.
7. Conclusions
In this article, we argued that treating missing item responses as ignorable or partially ignorable in IRT models involving a latent response propensity does not necessarily lead to valid substantive conclusions. To handle such nonignorable item responses, we proposed two types of statistical sensitivity analyses that include scoring missing item responses as incorrect and the treatment as ignorable as two extreme cases. By doing so, a range of plausible parameter estimates can be obtained. The two types of sensitivity analyses were illustrated using PIRLS 2011 with four countries. It has been shown that assumptions about the missing data mechanism did impact the country means and the ranking, as well as differences between countries.
Funding
This research received no external funding.
Institutional Review Board Statement
Not applicable.
Informed Consent Statement
Informed consent was obtained from all subjects involved in the study.
Data Availability Statement
The PIRLS 2011 dataset is available at https://timssandpirls.bc.edu/pirls2011/international-database.html (accessed on 7 March 2023). The part of the dataset used in this article can be accessed as the object data.pirlsmissing in the R package sirt [85] and can be attached by the command data(data.pirlsmissing, package=’sirt’).
Conflicts of Interest
The authors declare no conflict of interest.
References
- Lietz, P.; Cresswell, J.C.; Rust, K.F.; Adams, R.J. (Eds.) Implementation of Large-scale Education Assessments; Wiley: New York, NY, USA, 2017. [Google Scholar] [CrossRef]
- Foy, P.; Yin, L. Scaling the PIRLS 2016 achievement data. In Methods and Procedures in PIRLS 2016; Martin, M.O., Mullis, I.V., Hooper, M., Eds.; IEA: Paris, France; Boston College: Chestnut Hill, MA, USA, 2017. [Google Scholar]
- Foy, P.; Yin, L. Scaling the TIMSS 2015 achievement data. In Methods and Procedures in TIMSS 2015; Martin, M.O., Mullis, I.V., Hooper, M., Eds.; IEA: Paris, France; Boston College: Chestnut Hill, MA, USA, 2016. [Google Scholar]
- OECD. PISA 2018. Technical Report; OECD: Paris, France, 2020; Available online: https://bit.ly/3zWbidA (accessed on 7 March 2023).
- Pohl, S.; Ulitzsch, E.; von Davier, M. Reframing rankings in educational assessments. Science 2021, 372, 338–340. [Google Scholar] [CrossRef] [PubMed]
- Mislevy, R.J.; Wu, P.K. Missing Responses and IRT Ability Estimation: Omits, Choice, Time Limits, and Adaptive Testing; Research Report No. RR-96-30; Educational Testing Service: Princeton, NJ, USA, 1996. [Google Scholar] [CrossRef]
- Mislevy, R.J. Missing responses in item response modeling. In Handbook of Item Response Theory, Volume 2: Statistical Tools; van der Linden, W.J., Ed.; CRC Press: Boca Raton, FL, USA, 2016; pp. 171–194. [Google Scholar] [CrossRef]
- Bernshausen, H.; Fuhrmann, C.; Harney, H.L.; Harney, K. Form invariance—An alternative answer to the measurement problem of item response theory. Math. Stat. 2022, 10, 690–700. [Google Scholar] [CrossRef]
- Bock, R.D.; Moustaki, I. Item response theory in a general framework. In Handbook of Statistics, Volume 26: Psychometrics; Rao, C.R., Sinharay, S., Eds.; CRC Press: Boca Raton, FL, USA, 2007; pp. 469–513. [Google Scholar] [CrossRef]
- van der Linden, W.J.; Hambleton, R.K. (Eds.) Handbook of Modern Item Response Theory; Springer: New York, NY, USA, 1997. [Google Scholar] [CrossRef]
- van der Linden, W.J. Unidimensional logistic response models. In Handbook of Item Response Theory, Volume 1: Models; van der Linden, W.J., Ed.; CRC Press: Boca Raton, FL, USA, 2016; pp. 11–30. [Google Scholar] [CrossRef]
- Wagner, W. Item-Response-Theorie (IRT) [Item response theory]. In Handbuch Geschichts- und Politikdidaktik; Weißeno, G., Ziegler, B., Eds.; Springer: Wiesbaden, Germany, 2022; pp. 377–393. [Google Scholar] [CrossRef]
- Graham, J.W. Missing data analysis: Making it work in the real world. Annu. Rev. Psychol. 2009, 60, 549–576. [Google Scholar] [CrossRef]
- Schafer, J.L.; Graham, J.W. Missing data: Our view of the state of the art. Psychol. Methods 2002, 7, 147–177. [Google Scholar] [CrossRef] [PubMed]
- Rose, N.; von Davier, M.; Xu, X. Modeling Nonignorable Missing Data with Item Response Theory (IRT); Research Report No. RR-10-11; Educational Testing Service: Princeton, NJ, USA, 2010. [Google Scholar] [CrossRef]
- Rose, N.; von Davier, M.; Nagengast, B. Commonalities and differences in IRT-based methods for nonignorable item nonresponses. Psych. Test Assess. Model. 2015, 57, 472–498. [Google Scholar]
- Pohl, S.; Gräfe, L.; Rose, N. Dealing with omitted and not-reached items in competence tests: Evaluating approaches accounting for missing responses in item response theory models. Educ. Psychol. Meas. 2014, 74, 423–452. [Google Scholar] [CrossRef]
- OECD. PISA 2012. Technical Report; OECD: Paris, France, 2014; Available online: https://bit.ly/2YLG24g (accessed on 7 March 2023).
- Foy, P.; Fishbein, B.; von Davier, M.; Yin, L. Implementing the TIMSS 2019 scaling methodology. In Methods and Procedures: TIMSS 2019 Technical Report; Martin, M.O., von Davier, M., Mullis, I.V., Eds.; IEA: Paris, France; Boston College: Chestnut Hill, MA, USA, 2020. [Google Scholar]
- Mislevy, R.J. Randomization-based inference about latent variables from complex samples. Psychometrika 1991, 56, 177–196. [Google Scholar] [CrossRef]
- von Davier, M.; Sinharay, S. Analytics in international large-scale assessments: Item response theory and population models. In A Handbook of International Large-Scale Assessment: Background, Technical Issues, and Methods of Data Analysis; Rutkowski, L., von Davier, M., Rutkowski, D., Eds.; Chapman Hall/CRC Press: London, UK, 2013; pp. 155–174. [Google Scholar] [CrossRef]
- De Ayala, R.J.; Plake, B.S.; Impara, J.C. The impact of omitted responses on the accuracy of ability estimation in item response theory. J. Educ. Meas. 2001, 38, 213–234. [Google Scholar] [CrossRef]
- Pohl, S.; Carstensen, C.H. NEPS Technical Report—Scaling the Data of the Competence Tests; NEPS Working Paper No. 14; Otto-Friedrich-Universität, Nationales Bildungspanel: Bamberg, Germany, 2012; Available online: https://bit.ly/2XThQww (accessed on 7 March 2023).
- Pohl, S.; Carstensen, C.H. Scaling of competence tests in the national educational panel study —Many questions, some answers, and further challenges. J. Educ. Res. Online 2013, 5, 189–216. Available online: https://bit.ly/39AETyE (accessed on 7 March 2023).
- Rose, N. Item Nonresponses in Educational and Psychological Assessment. Unpublished Dissertation, Friedrich-Schiller-Universität Jena, Jena, Germany, 2013. Available online: https://bit.ly/3i6eaOS (accessed on 7 March 2023).
- von Davier, M. Omitted response treatment using a modified Laplace smoothing for approximate Bayesian inference in item response theory. PsyArXiv 2023. [Google Scholar] [CrossRef]
- Denoeux, T. Maximum likelihood estimation from fuzzy data using the EM algorithm. Fuzzy Sets Syst. 2011, 183, 72–91. [Google Scholar] [CrossRef]
- Senge, R.; Bösner, S.; Dembczyński, K.; Haasenritter, J.; Hirsch, O.; Donner-Banzhoff, N.; Hüllermeier, E. Reliable classification: Learning classifiers that distinguish aleatoric and epistemic uncertainty. Inf. Sci. 2014, 255, 16–29. [Google Scholar] [CrossRef]
- Denoeux, T. Maximum likelihood estimation from uncertain data in the belief function framework. IEEE Trans. Knowl. Data Eng. 2011, 25, 119–130. [Google Scholar] [CrossRef]
- Rohwer, G. Making Sense of Missing Answers in Competence Tests; (NEPS Working Paper No. 30); Otto-Friedrich-Universität, Nationales Bildungspanel: Bamberg, Germany, 2013; Available online: https://bit.ly/3AGfsr5 (accessed on 7 March 2023).
- Robitzsch, A. On the treatment of missing item responses in educational large-scale assessment data: An illustrative simulation study and a case study using PISA 2018 mathematics data. Eur. J. Investig. Health Psychol. Educ. 2021, 11, 117. [Google Scholar] [CrossRef] [PubMed]
- Robitzsch, A.; Lüdtke, O. Some thoughts on analytical choices in the scaling model for test scores in international large-scale assessment studies. Meas. Instrum. Soc. Sci. 2022, 4, 9. [Google Scholar] [CrossRef]
- Hennig, C. Some thoughts on simulation studies to compare clustering methods. Arch. Data Sci. Ser. A 2018, 5, 1–21. [Google Scholar] [CrossRef]
- Rose, N.; von Davier, M.; Nagengast, B. Modeling omitted and not-reached items in IRT models. Psychometrika 2017, 82, 795–819. [Google Scholar] [CrossRef]
- Birnbaum, A. Some latent trait models and their use in inferring an examinee’s ability. In Statistical Theories of Mental Test Scores; Lord, F.M., Novick, M.R., Eds.; MIT Press: Reading, MA, USA, 1968; pp. 397–479. [Google Scholar]
- Holland, P.W. On the sampling theory foundations of item response theory models. Psychometrika 1990, 55, 577–601. [Google Scholar] [CrossRef]
- Wainer, H. Visual revelations: Schrödinger’s cat and the conception of probability in item response theory. Chance 2010, 23, 53–56. [Google Scholar] [CrossRef]
- Molenaar, I.W. Some background for item response theory and the Rasch model. In Rasch Models: Foundations, Recent Developments, and Applications; Fischer, G.H., Molenaar, I.W., Eds.; Springer: New York, NY, USA, 1995; pp. 3–14. [Google Scholar] [CrossRef]
- Rasch, G. Probabilistic Models for Some Intelligence and Attainment Tests; Danish Institute for Educational Research: Copenhagen, Denmark, 1960. [Google Scholar]
- Naumann, A.; Hartig, J.; Hochweber, J. Absolute and relative measures of instructional sensitivity. J. Educ. Behav. Stat. 2017, 42, 678–705. [Google Scholar] [CrossRef]
- Robitzsch, A. Methodische Herausforderungen bei der Kalibrierung von Leistungstests [Methodological challenges in calibrating performance tests]. In Bildungsstandards Deutsch und Mathematik; Bremerich-Vos, A., Granzer, D., Köller, O., Eds.; Beltz Pädagogik: Weinheim, Germany, 2009; pp. 42–106. [Google Scholar]
- Meredith, W.; Teresi, J.A. An essay on measurement and factorial invariance. Med. Care 2006, 44, S69–S77. [Google Scholar] [CrossRef]
- van Bork, R.; Rhemtulla, M.; Sijtsma, K.; Borsboom, D. A causal theory of error scores. Psychol. Methods, 2022; epub ahead of print. [Google Scholar] [CrossRef]
- Frey, A.; Hartig, J.; Rupp, A.A. An NCME instructional module on booklet designs in large-scale assessments of student achievement: Theory and practice. Educ. Meas. 2009, 28, 39–53. [Google Scholar] [CrossRef]
- Molenaar, P.C.M. A manifesto on psychology as idiographic science: Bringing the person back into scientific psychology, this time forever. Meas. Interdiscip. Res. Persp. 2004, 2, 201–218. [Google Scholar] [CrossRef]
- Fischer, G.H.; Molenaar, I.W. (Eds.) Rasch Models: Foundations, Recent Developments, and Applications; Springer: New York, NY, USA, 1995. [Google Scholar] [CrossRef]
- Yen, W.M.; Fitzpatrick, A.R. Item response theory. In Educational Measurement; Brennan, R.L., Ed.; Praeger Publishers: Westport, CT, USA, 2006; pp. 111–154. [Google Scholar]
- Holman, R.; Glas, C.A.W. Modelling non-ignorable missing-data mechanisms with item response theory models. Br. J. Math. Stat. Psychol. 2005, 58, 1–17. [Google Scholar] [CrossRef] [PubMed]
- Frey, A.; Spoden, C.; Goldhammer, F.; Wenzel, S.F.C. Response time-based treatment of omitted responses in computer-based testing. Behaviormetrika 2018, 45, 505–526. [Google Scholar] [CrossRef]
- Debeer, D.; Janssen, R.; De Boeck, P. Modeling skipped and not-reached items using IRTrees. J. Educ. Meas. 2017, 54, 333–363. [Google Scholar] [CrossRef]
- Glas, C.A.W.; Pimentel, J.L.; Lamers, S.M.A. Nonignorable data in IRT models: Polytomous responses and response propensity models with covariates. Psych. Test Assess. Model. 2015, 57, 523–541. Available online: https://bit.ly/3EOcX8M (accessed on 7 March 2023).
- Rosas, G.; Shomer, Y. Models of nonresponse in legislative politics. Legis. Stud. Q. 2008, 33, 573–601. [Google Scholar] [CrossRef]
- Fu, Z.H.; Tao, J.; Shi, N.Z. Bayesian estimation of the multidimensional graded response model with nonignorable missing data. J. Stat. Comput. Simul. 2010, 80, 1237–1252. [Google Scholar] [CrossRef]
- Santos, V.L.F.; Moura, F.A.S.; Andrade, D.F.; Gonçalves, K.C.M. Multidimensional and longitudinal item response models for non-ignorable data. Comput. Stat. Data Anal. 2016, 103, 91–110. [Google Scholar] [CrossRef]
- Kuha, J.; Katsikatsou, M.; Moustaki, I. Latent variable modelling with non-ignorable item nonresponse: Multigroup response propensity models for cross-national analysis. J. R. Stat. Soc. Ser. A Stat. Soc. 2018, 181, 1169–1192. [Google Scholar] [CrossRef]
- Okumura, T. Empirical differences in omission tendency and reading ability in PISA: An application of tree-based item response models. Educ. Psychol. Meas. 2014, 74, 611–626. [Google Scholar] [CrossRef]
- Pohl, S.; Becker, B. Performance of missing data approaches under nonignorable missing data conditions. Methodology 2020, 16, 147–165. [Google Scholar] [CrossRef]
- Köhler, C.; Pohl, S.; Carstensen, C.H. Investigating mechanisms for missing responses in competence tests. Psych. Test Assess. Model. 2015, 57, 499–522. Available online: https://bit.ly/3zOCcEp (accessed on 7 March 2023).
- Ulitzsch, E.; von Davier, M.; Pohl, S. Using response times for joint modeling of response and omission behavior. Multivar. Behav. Res. 2020, 55, 425–453. [Google Scholar] [CrossRef]
- Kreitchmann, R.S.; Abad, F.J.; Ponsoda, V. A two-dimensional multiple-choice model accounting for omissions. Front. Psychol. 2018, 9, 2540. [Google Scholar] [CrossRef]
- Zhou, S.; Huggins-Manley, A.C. The performance of the semigeneralized partial credit model for handling item-level missingness. Educ. Psychol. Meas. 2019, 80, 1196–1215. [Google Scholar] [CrossRef]
- Lu, J.; Wang, C. A response time process model for not-reached and omitted items. J. Educ. Meas. 2020, 57, 584–620. [Google Scholar] [CrossRef]
- Weeks, J.P.; von Davier, M.; Yamamoto, K. Using response time data to inform the coding of omitted responses. Psych. Test Assess. Model. 2016, 58, 671–701. Available online: https://bit.ly/3AG33U7 (accessed on 7 March 2023).
- Harel, O.; Schafer, J.L. Partial and latent ignorability in missing-data problems. Biometrika 2009, 96, 37–50. [Google Scholar] [CrossRef]
- Bartolucci, F.; Montanari, G.E.; Pandolfi, S. Latent ignorability and item selection for nursing home case-mix evaluation. J. Classif. 2018, 35, 172–193. [Google Scholar] [CrossRef]
- Beesley, L.J.; Taylor, J.M.G.; Little, R.J.A. Sequential imputation for models with latent variables assuming latent ignorability. Aust. N. Z. J. Stat. 2019, 61, 213–233. [Google Scholar] [CrossRef]
- Jung, H.; Schafer, J.L.; Seo, B. A latent class selection model for nonignorably missing data. Comput. Stat. Data Anal. 2011, 55, 802–812. [Google Scholar] [CrossRef]
- Köhler, C.; Pohl, S.; Carstensen, C.H. Taking the missing propensity into account when estimating competence scores: Evaluation of item response theory models for nonignorable omissions. Educ. Psychol. Meas. 2015, 75, 850–874. [Google Scholar] [CrossRef]
- Bertoli-Barsotti, L.; Punzo, A. Rasch analysis for binary data with nonignorable nonresponses. Psicologica 2013, 34, 97–123. Available online: https://bit.ly/3agqA2g (accessed on 7 March 2023).
- Bacci, S.; Bartolucci, F. A multidimensional finite mixture structural equation model for nonignorable missing responses to test items. Struct. Equ. Model. 2015, 22, 352–365. [Google Scholar] [CrossRef]
- Bacci, S.; Bartolucci, F.; Grilli, L.; Rampichini, C. Evaluation of student performance through a multidimensional finite mixture IRT model. Multivar. Behav. Res. 2017, 52, 732–746. [Google Scholar] [CrossRef] [PubMed]
- Lord, F.M. Estimation of latent ability and item parameters when there are omitted responses. Psychometrika 1974, 39, 247–264. [Google Scholar] [CrossRef]
- Resseguier, N.; Giorgi, R.; Paoletti, X. Sensitivity analysis: When data are missing not-at-random. Epidemiology 2011, 22, 282–283. [Google Scholar] [CrossRef] [PubMed]
- van Buuren, S. Flexible Imputation of Missing Data; CRC Press: Boca Raton, FL, USA, 2018. [Google Scholar] [CrossRef]
- Gruhl, J.; Erosheva, E.A. A tale of two (types of) memberships: Comparing mixed and partial membership with a continuous data example. In Handbook of Mixed Membership Models and Their Applications; Airoldi, E.M., Blei, D., Erosheva, E.A., Fienberg, S.E., Eds.; Chapman & Hall: Boca Raton, FL, USA, 2015; pp. 15–38. [Google Scholar] [CrossRef]
- Warm, T.A. Weighted likelihood estimation of ability in item response theory. Psychometrika 1989, 54, 427–450. [Google Scholar] [CrossRef]
- Aitkin, M. Expectation maximization algorithm and extensions. In Handbook of Item Response Theory, Volume 2: Statistical Tools; van der Linden, W.J., Ed.; CRC Press: Boca Raton, FL, USA, 2016; pp. 217–236. [Google Scholar] [CrossRef]
- Rosas, G.; Shomer, Y.; Haptonstahl, S.R. No news is news: Nonignorable nonresponse in roll-call data analysis. Am. J. Pol. Sci. 2015, 59, 511–528. [Google Scholar] [CrossRef]
- Guo, J.; Xu, X. An IRT-based model for omitted and not-reached items. arXiv 2019, arXiv:1904.03767. [Google Scholar]
- Robitzsch, A.; Lüdtke, O. An item response model for omitted responses in performance tests. In Proceedings of the International Meeting of the Psychometric Society (IMPS 2017), Switzerland, Zurich, 18–21 July 2017; Available online: https://bit.ly/3u8rgjy (accessed on 7 March 2023).
- Deribo, T.; Kroehne, U.; Goldhammer, F. Model-based treatment of rapid guessing. J. Educ. Meas. 2021, 58, 281–303. [Google Scholar] [CrossRef]
- Sportisse, A.; Boyer, C.; Josse, J. Imputation and low-rank estimation with missing not at random data. Stat. Comput. 2020, 30, 1629–1643. [Google Scholar] [CrossRef]
- Hanson, B. IRT Parameter Estimation Using the EM Algorithm. Technical Report. 2000. Available online: https://bit.ly/3i4pOdg (accessed on 7 March 2023).
- R Core Team. R: A Language and Environment for Statistical Computing; R Core Team: Vienna, Austria, 2022; Available online: https://www.R-project.org/ (accessed on 11 January 2022).
- Robitzsch, A. Sirt: Supplementary Item Response Theory Models. R Package Version 3.12-66. 2022. Available online: https://CRAN.R-project.org/package=sirt (accessed on 17 May 2022).
- Arts, I.; Fang, Q.; Meitinger, K.; van de Schoot, R. Approximate measurement invariance of willingness to sacrifice for the environment across 30 countries: The importance of prior distributions and their visualization. Front. Psychol. 2021, 12, 624032. [Google Scholar] [CrossRef] [PubMed]
- Asparouhov, T.; Muthén, B. Multiple-group factor analysis alignment. Struct. Equ. Model. 2014, 21, 495–508. [Google Scholar] [CrossRef]
- Robitzsch, A. Exploring the multiverse of analytical decisions in scaling educational large-scale assessment data: A specification curve analysis for PISA 2018 mathematics data. Eur. J. Investig. Health Psychol. Educ. 2022, 12, 54. [Google Scholar] [CrossRef]
- Kolen, M.J.; Brennan, R.L. Test Equating, Scaling, and Linking; Springer: New York, NY, USA, 2014. [Google Scholar] [CrossRef]
- Robitzsch, A.; Kiefer, T.; Wu, M. TAM: Test Analysis Modules. R Package Version 4.1-4. 2022. Available online: https://CRAN.R-project.org/package=TAM (accessed on 28 August 2022).
- Siddique, J.; Harel, O.; Crespi, C.M. Addressing missing data mechanism uncertainty using multiple-model multiple imputation: Application to a longitudinal clinical trial. Ann. Appl. Stat. 2012, 6, 1814–1837. [Google Scholar] [CrossRef]
- Dai, S. Handling missing responses in psychometrics: Methods and software. Psych 2021, 3, 43. [Google Scholar] [CrossRef]
- Huisman, M. Imputation of missing item responses: Some simple techniques. Qual. Quant. 2000, 34, 331–351. [Google Scholar] [CrossRef]
- Sinharay, S. Reporting proficiency levels for examinees with incomplete data. J. Educ. Behav. Stat. 2022, 47, 263–296. [Google Scholar] [CrossRef]
- Yucel, R.M. Multiple imputation inference for multivariate multilevel continuous data with ignorable non-response. Philos. Trans. R. Soc. A 2008, 366, 2389–2403. [Google Scholar] [CrossRef] [PubMed]
- Audet, L.A.; Desmarais, M.; Gosselin, É. Handling missing data through prevention strategies in self-administered questionnaires: A discussion paper. Nurse Res. 2022, 30, 9–18. [Google Scholar] [CrossRef] [PubMed]
- Shultz, K.S.; Whitney, D.J.; Zickar, M.J. Measurement Theory in Action: Case Studies and Exercises; Routledge: New York, NY, USA, 2020. [Google Scholar] [CrossRef]
- Wainer, H.; Braun, H.I. (Eds.) Test Validity; Routledge: New York, NY, USA, 1988. [Google Scholar] [CrossRef]
- Kane, M.T. Validating the interpretations and uses of test scores. J. Educ. Meas. 2013, 50, 1–73. [Google Scholar] [CrossRef]
- Gorgun, G.; Bulut, O. A polytomous scoring approach to handle not-reached items in low-stakes assessments. Educ. Psychol. Meas. 2021, 81, 847–871. [Google Scholar] [CrossRef] [PubMed]
- Robitzsch, A.; Lüdtke, O. Reflections on analytical choices in the scaling model for test scores in international large-scale assessment studies. PsyArXiv 2021. [Google Scholar] [CrossRef]
Figure 1.
Sensitivity analysis for the country means of Austria (AUT), Germany (GER), France (FRA), and the Netherlands (NLD). Left figure: Pseudo-likelihood estimation (model M5) as a function of the sensitivity parameter . Right figure: Two-dimensional model M6 as a function of the sensitivity parameter .


Table 1.
Country means for Austria (AUT), Germany (GER), France (FRA), and the Netherlands (NLD) in PIRLS 2011 for different treatments of missing item responses.
Table 1.
Country means for Austria (AUT), Germany (GER), France (FRA), and the Netherlands (NLD) in PIRLS 2011 for different treatments of missing item responses.
| Model | AUT | GER | FRA | NLD |
|---|---|---|---|---|
| M1: missing = incorrect | 500 | 537.5 | 488.7 | 540.3 |
| M2: missing = ignorable | 500 | 534.2 | 492.4 | 523.4 |
| M3: 2-dim. model | 500 | 534.9 | 492.5 | 524.8 |
| M4: pseudo-likelihood (for multiple-choice items) | 500 | 537.6 | 489.4 | 539.5 |
| M5: pseudo-likelihood | ||||
| 500 | 537.3 | 488.9 | 539.9 | |
| 500 | 537.0 | 490.1 | 535.9 | |
| 500 | 535.9 | 491.8 | 529.5 | |
| 500 | 534.6 | 493.1 | 524.0 | |
| M6: 2-dim. model | ||||
| 500 | 538.0 | 489.1 | 540.7 | |
| 500 | 535.9 | 490.6 | 532.4 | |
| 500 | 535.1 | 491.5 | 528.0 | |
| 500 | 534.6 | 492.1 | 525.7 |
Note. The mean and the standard deviation for Austria (AUT) were fixed at 500 and 100 in all item response models, respectively.
Table 2.
Model comparison based on the Bayesian information criterion (BIC) for Austria (AUT), Germany (GER), France (FRA), and the Netherlands (NLD) in PIRLS 2011.
Table 2.
Model comparison based on the Bayesian information criterion (BIC) for Austria (AUT), Germany (GER), France (FRA), and the Netherlands (NLD) in PIRLS 2011.
| Model | AUT | DEU | FRA | NLD |
|---|---|---|---|---|
| N1: , | 47,741 | 36,366 | 45,029 | 33,142 |
| N2: , | 47,827 | 36,414 | 45,263 | 33,144 |
| N3: estimated, | 47,722 | 36,365 | 45,028 | 33,130 |
| N4: , estimated | 47,677 | 36,285 | 44,888 | 33,127 |
| N5: , estimated | 47,790 | 36,355 | 45120 | 33134 |
| N6: estimated, estimated | 47,666 | 36,288 | 44,887 | 33,120 |
Note. The parameter is the correlation between the latent trait and the latent response propensity . The parameter indicates the dependency of the item response indicator from the (unobserved) item response (see Equation (6)). The model with the lowest BIC is printed in bold.
Table 3.
Country means for Austria (AUT), Germany (GER), France (FRA), and the Netherlands (NLD) in PIRLS 2011 for different model specifications of the missingness mechanism.
Table 3.
Country means for Austria (AUT), Germany (GER), France (FRA), and the Netherlands (NLD) in PIRLS 2011 for different model specifications of the missingness mechanism.
| Model | AUT | DEU | FRA | NLD |
|---|---|---|---|---|
| N1: , | 500 | 535.4 | 494.1 | 526.9 |
| N2: , | 500 | 537.6 | 489.8 | 542.0 |
| N3: estimated, | 500 | 537.1 | 497.9 | 530.9 |
| N4: , estimated | 500 | 535.1 | 493.3 | 526.9 |
| N5: , estimated | 500 | 537.6 | 489.9 | 542.0 |
| N6: estimated, estimated | 500 | 537.4 | 495.8 | 530.4 |
Note. The mean and the standard deviation for Austria (AUT) were fixed at 500 and 100 in all item response models, respectively.
Disclaimer/Publisher’s Note: The statements, opinions and data contained in all publications are solely those of the individual author(s) and contributor(s) and not of MDPI and/or the editor(s). MDPI and/or the editor(s) disclaim responsibility for any injury to people or property resulting from any ideas, methods, instructions or products referred to in the content. |
© 2023 by the author. Licensee MDPI, Basel, Switzerland. This article is an open access article distributed under the terms and conditions of the Creative Commons Attribution (CC BY) license (https://creativecommons.org/licenses/by/4.0/).
Share and Cite
MDPI and ACS Style
Robitzsch, A. Nonignorable Consequences of (Partially) Ignoring Missing Item Responses: Students Omit (Constructed Response) Items Due to a Lack of Knowledge. Knowledge 2023, 3, 215-231. https://doi.org/10.3390/knowledge3020015
AMA Style
Robitzsch A. Nonignorable Consequences of (Partially) Ignoring Missing Item Responses: Students Omit (Constructed Response) Items Due to a Lack of Knowledge. Knowledge. 2023; 3(2):215-231. https://doi.org/10.3390/knowledge3020015
Chicago/Turabian StyleRobitzsch, Alexander. 2023. "Nonignorable Consequences of (Partially) Ignoring Missing Item Responses: Students Omit (Constructed Response) Items Due to a Lack of Knowledge" Knowledge 3, no. 2: 215-231. https://doi.org/10.3390/knowledge3020015