Article

Interdisciplinary Analysis of Science Communication on Social Media during the COVID-19 Crisis

1
Information Science, University of Hildesheim, Universitätsplatz 1, 31141 Hildesheim, Germany
2
Specialized Communication, University of Hildesheim, Universitätsplatz 1, 31141 Hildesheim, Germany
*
Author to whom correspondence should be addressed.
Knowledge 2023, 3(1), 97-112; https://doi.org/10.3390/knowledge3010008
Submission received: 30 December 2022 / Revised: 27 January 2023 / Accepted: 6 February 2023 / Published: 13 February 2023

Abstract

:
In times of crisis, science communication needs to be accessible and convincing. In order to understand whether these two criteria apply to concrete science communication formats, it is not enough to merely study the communication product. Instead, the recipient’s perspective also needs to be taken into account. What do recipients value in popular science communication formats concerning COVID-19? What do they criticize? What elements in the formats do they pay attention to? These questions can be answered by reception studies, for example, by analyzing the reactions and comments of social media users. This is particularly relevant since scientific information was increasingly disseminated over social media channels during the COVID-19 crisis. This interdisciplinary study, therefore, focuses both on science communication strategies in media formats and the related comments on social media. First, we selected science communication channels on YouTube and performed a qualitative multi-modal analysis. Second, the comments responding to science communication content online were analyzed by identifying Twitter users who are doctors, researchers, science communicators and those who represent research institutes and then, subsequently, performing topic modeling on the textual data. The main goal was to find topics that directly related to science communication strategies. The qualitative video analysis revealed, for example, a range of strategies for accessible communication and maintaining transparency about scientific insecurities. The quantitative Twitter analysis showed that few tweets commented on aspects of the communication strategies. These were mainly positive while the sentiment in the overall collection was less positive. We downloaded and processed replies for 20 months, starting at the beginning of the pandemic, which resulted in a collection of approximately one million tweets from the German science communication market.

1. Introduction

The dissemination of scientific content to non-expert audiences is nowadays characterized by a multitude of different successful media formats. In this context, social media platforms have become particularly important channels for dissemination, including video platforms such as YouTube.
In a crisis, such as the COVID-19 pandemic, it was particularly important to understand the scientific facts concerning the virus. In times of crisis, media creators and, in particular, creators of science communication formats need to know what kind of information is needed and why some information sources are preferred over others, i.e., it is paramount for them to understand patterns of information behavior (see [1] for an overview). In this context, they specifically need to have an understanding of the quality expected by the audience. Information resources, in general, and media formats, in particular, differ in the way they portray scientific information (see [2] for an overview of different case studies). Research also needs to take into account how scientific information is disseminatedsuccessfully and which approaches are received positively by the public. Although popularity measures, such as clicks, likes and shares, are often used as indicators for success, they reveal nothing about the reasons for the success. In this contribution, we analyzed the online communication available concerning the COVID-19 crisis from the perspective of science communication. The products of science communication we studied were limited to formats communicating academic knowledge to non-expert audiences by means of popularization (i.e., they do not cover academic-to-academic communication). The goal of our study was to identify features of successful science communication during the COVID-19 crisis by considering the feedback provided on information products published via social media. Therefore, we explored social media posts that relate to features of science communication. Furthermore, our method included the qualitative analysis of online videos in order to analyze communication strategies for COVID-related content.
To this end, we extracted a subset of comments users had posted in science communication channels as reactions or feedback about the characteristics of the media formats. However, most comments on these channels were not related to the characteristics of the format and were more likely to express general political views on the COVID-19 pandemic. This phenomenon is inherent to a variety of topics in science communication [3]. Therefore, for media creators, it would be interesting to obtain an overview of posts that reacted to science communication formats and comment explicitly on their (multi modal) communication strategies. The posts could shed some light on what recipients think about these strategies, which is also why some science communication formats host social media channels, for example, the Facebook profile for the German documentary series Terra X [4].
In order to find such comments, an exploratory strategy was necessary. We had to analyze (a) what characteristics successful science communication formats displayed and (b) extract a large number of social media comments, a step for which we had expected massive information filtering to be required. Thus, topic modeling was applied as a computational method for selecting a relevant subset from the collection.
In the first part of this contribution, we discuss the state-of-the-art by highlighting research on information needs during crises, science communication strategies and analyses of social media communication. In the second step, we explain our mixed-methods setup, which combined approaches from qualitative media linguistics and quantitative approaches from the data analysis. The subsequent section includes the results of our study, which are presented, discussed and summarized in light of potential future research perspectives.

2. State of the Art

Our study included a qualitative analysis of videos that intend to communicate scientific information to a broader audience. Furthermore, we investigated the reactions to scientific information on social media and connected these two threads. To provide the research context for the interdisciplinary study at hand, the following subsections discuss prior work in several relevant research domains. Furthermore, we begin with a short overview on information behavior during the crisis to show that scientific information was in great demand.

2.1. Information Needs during the COVID-19 Crisis

The information needs of humans change during crises. Basic needs, such as safety and assurance of survival, influence the type of information people seek. The COVID-19 pandemic led to a high demand for information from citizens. Much knowledge had to be created during the crisis and disseminated rapidly. As a consequence, worldwide Internet traffic and, specifically, the number of visitors on news websites increased [5].
The behavior of citizens in German-speaking countries during the initial three months of the crisis was analyzed in a questionnaire study [6]. Participants reported that they relied heavily on public organizations (such as the Robert Koch Institute and the Federal Office of Public Health), public television, international sources (radio, broadcasting, newspapers), national newspapers and local newspapers to a greater extent than before the crisis. The increasing demand for reliable information was also demonstrated by the criteria the participants reported as personally important when choosing sources of information during the COVID-19 crisis. The most important criteria when choosing sources of information during the pandemic were credible information, followed by journalistic quality, interesting facts from research, and information from official sources. These characteristics clearly demonstrate the rising desire for trustworthy information during the crisis. During the pandemic, the most crucial factors in selecting information sources were verifiable information, high-quality journalism, intriguing research findings, and information from official sources.
Further studies on German-speaking countries confirmed that citizens sought information from the public broadcasters [7]. However, there seemed to be certain influencing factors on the sources used by an individual: A questionnaire study showed that higher individual health literacy led to a more selective behavior regarding information sources [8]. For students, it was shown that students of medicine typically select resources of higherquality [9]. An interview study suggests that reliance on public radio and television contributed to a stronger sense of societal cohesion [10].
The amount of knowledge that was disseminated, the presence of COVID-related topics in the news and the negative sentiment associated with these led to an information overload and information-avoidance behavior during the year 2020 [11].
To summarize, several studies explored diverse facets of information behavior during the crisis, and many stated that a growing demand for scientific information could beobserved [1,12,13]. These findings emphasize the need for reliable scientific information that is easily consumed. However, there have been a lack of studies on the consumption and dissemination of science information during the COVID-19 crisis.

2.2. Science Communication and Knowledge Dissemination

Science communication has been moving away from a simple top-down process and towards a more interactive nature that fosters dialogue between science and the broader public (see [14] for the evolution of science communication concepts). More than before, the COVID-19 crisis has illustrated the need for this evolution. To this end, formats where people can give feedback have been useful, and the online sphere provides such possibilities, for example, with its online posts and videos that form an important part of knowledge dissemination today. However, due to the emotional nature of online discourse, science communication on social media always bears the risk of factually unfounded and negative feedback [15]. The question, therefore, remains, to what extent do comment sections on YouTube or Twitter constitute a valuable element of participatory science communication [16]?
The factors relevant for analysis are, among others, the communication of scientific insecurity [17]; the degree of complexity, such as the use of technical terms [18]; the potential use of emotionalization [19]; and self-acknowledged experts [20]. As communication is inherently multi-modal (i.e., characterized by various communication resources, in addition to language, [21,22]), the analysis encompasses not only verbal but also visual strategies when it comes to science communication, particularly in the digital sphere (e.g., [23]). Whereas science communication formats are usually an amalgam of knowledge dissemination and entertainment [16], science communication during times of crisis poses new challenges, such as how to be persuasive without losing neutrality while remaining informative.

2.3. Analysis of Social Media Communication

Social media communication has been analyzed from many perspectives. Much research has been dedicated to patterns of communication that often extend beyond the use of specific words. These concepts include hate speech [24], misinformation [25] and propaganda [26]. The analysis of complex information needs on social media platforms during a crisis has been studied via information retrieval from micro-blogs during disasters (IRMiDis) at the FIRE conference [27]. Tweets about the Nepal earthquake were collected and provided. Systems were requested to extract information that was helpful for rescue workers or reported on specific needs for supplies.
Information propagation on social media during the COVID-19 crisis was typically focused on general trends, political attitudes or the dissemination of misinformation [28]. Studies were carried out on the sentiment of general communication [29] and the psychological problems of users [30].
Thus far, no studies focused specifically on the responses regarding scientific media formats as observed in comments on social media. Datasets for social media communication regarding COVID-19 are available, but they tend to collect information broadly and are unable to identify reactions to science communication specifically [31,32,33,34].
An analysis of a large amount of claims before the pandemic showed that misinformation spread faster than factual information [35]. Furthermore, artificially created information by bots had a high impact [36]. These results suggested that the quality of science communication should be studied. Several studies have already applied topic modeling, but again, they were not specifically addressing reactions to science communication [37,38,39,40].
One topic modeling study by Xue et al. concerning English-language tweets during the first three months of the pandemic revealed that the topics contained minimal content on treatments and symptoms. A sentiment analysis showed that negative sentiment and, in particular, fear of the unknown and uncertainty was dominant in the topics [41]. Another topic modeling approach on a COVID-19 collection confirmed the negative overall sentiment. The topics were divided into three categories: the COVID-19 emergency, how to control the virus and reports on COVID-19 cases [37]. Chandrasekaran et al. found 26 topics on 10 overall themes in tweets until May 2020 [42]. Overall, they observed significant negative sentiments. However, sentiments turned from negative to positive for several topics over time, including prevention, government response as well as treatment and recovery. An analysis of Greek-language tweets found a trend from positive-to-negative sentiment [43]. A study by Liu and colleagues analyzed the topics within news articles online [44]. However, they did not analyze any social media content. Overall, their sentiment analysis of tweets related to COVID-19 revealed significantly negative sentiments [37]. Although there are studies employing topic modeling for social media data during the pandemic, this was not the case for communication related to science communication.

3. Method

As mentioned above, the primary goal of this study was to identify features of successful science communication and social media posts related to features of science communication published during the COVID-19 crisis. The latter could include positive or negative feedback.
In more detail, we pursued the following research question: RQ: How useful are several quantitative text-mining methods for extracting feedback on science communication?
The ability to extract feedback specific to science communication could provide insight into what communication strategies were evaluated as positive or negative by recipients, which, in turn, could confirm whether some formats considered best practice were, indeed, best practice.
To answer the research question, we identified online videos for a qualitative analysis of science communication strategies in order to analyze them in COVID-related videos. Simultaneously, we identified social media comments reacting to scientific information. An example is shown in Figure 1.
As the nature of this study was exploratory, it was it not feasible to collect a set of words that had to appear in tweets or to find tweets using search strategies. The set of relevant tweets could not be specified using a pre-defined set of words. In addition, we were interested in whether these posts and comments by users were related to relevant design features, which we had identified in the qualitative analysis of YouTube videos.
We generally adopted a mixed-method approach. Within the notation of Creswell and Plano [45], we implemented a recursive process because quantitative and qualitative methods were used at several points throughout the research process. Within the terminology used by Molina-Azorín [46], our methodology follows the development model because the results from one method are used to inform another method. First, a qualitative approach was used to determine science communication channels. These were automatically crawled to collect data. The quantitative approach of topic modeling was applied to find themes within the content. The topics were represented by probability distributions in words. These were qualitatively reviewed and judged and some were selected as relevant for the goal of the study. In a further step, a selection of posts from these topics was qualitatively reviewed.
These individual steps of the approach, carried out on German-language data, are elaborated in the following sections.

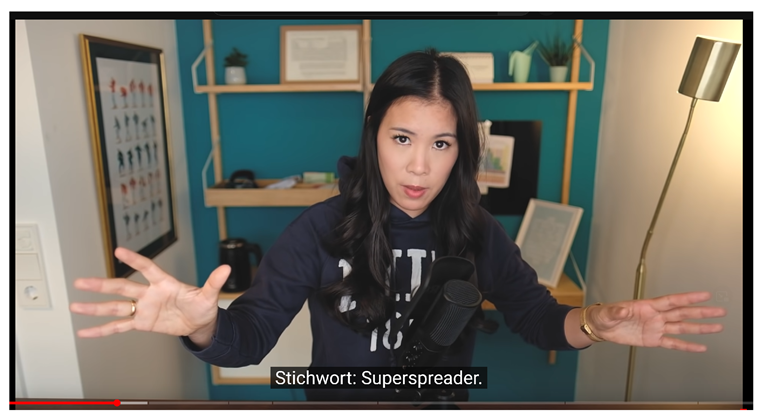
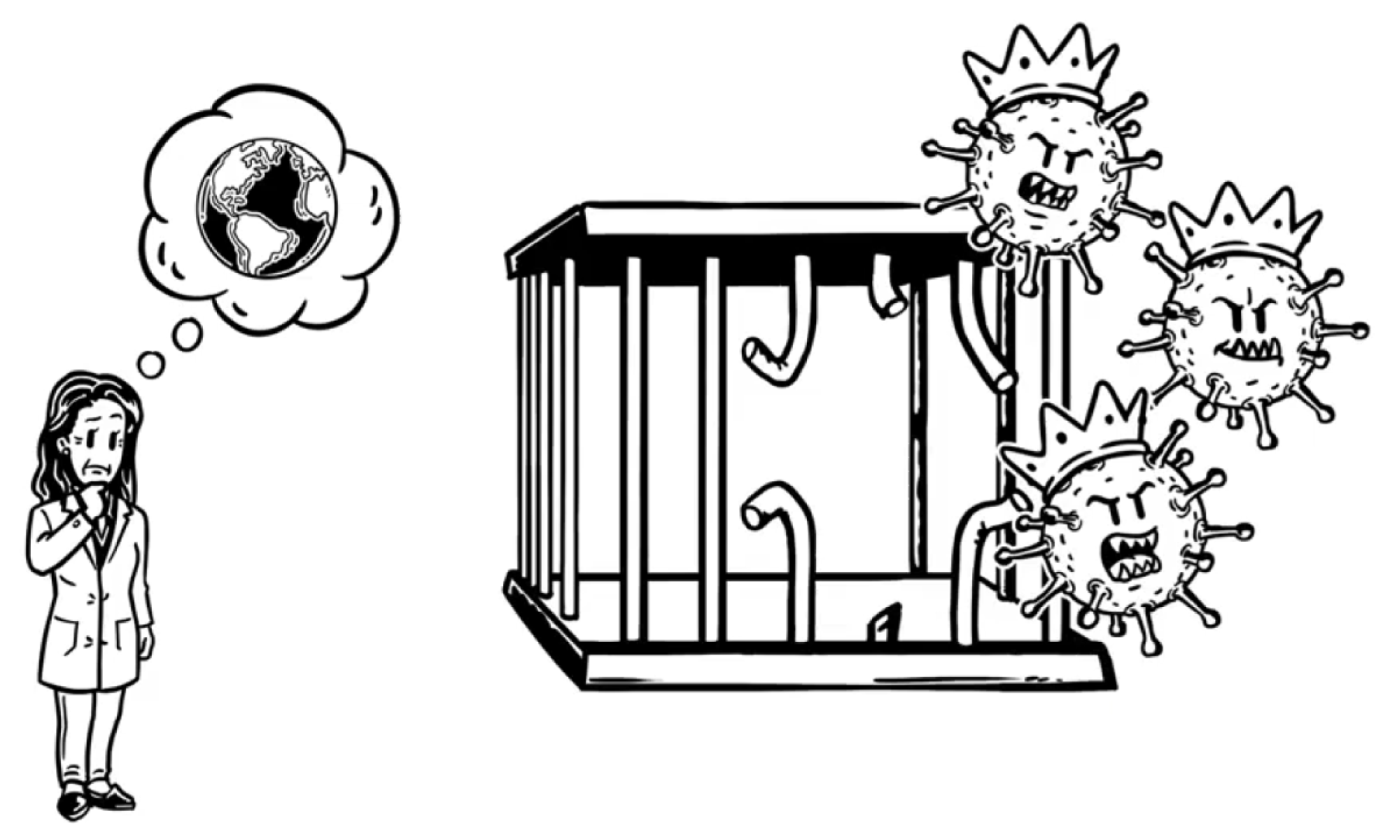
3.1. Qualitative Analysis of Video Formats

As mentioned above, the need for scientific information during the COVID-19 crisis increased. In order to understand best practices of science communication, a qualitative analysis of science communication formats was needed. Qualitative analysis, in this context, could elucidate, for example, what strategies communicators used to produce a broadly accessible yet attractive format.
In this step, we selected 21 YouTube videos in the German language. As video content on YouTube is quite heterogeneous, we focused on two common types of videos, i.e., presentation and animation clips. These are two of the four types of science videos that Bucher et al. had established in their categorization of science videos on YouTube, and they were characterized by the following features [23]. Animation videos (Figure 2) usually use computer-generated pictures or live drawings; they visualize scientific facts or theories using various strategies of visualization. These images accompany a voice over. Presentation videos (Figure 3) are presentation-like or lecture-like in so far as they include an actor who is often portrayed in medium-long shot and who directly addresses the public. While the spoken language is their most important element, they may also rely on different kinds of visualizations.
Examples are shown in Figure 2 and Figure 3.
The videos had to fulfill the following requirements: They needed to contain science communication on COVID-19; they needed to be relatively popular (i.e., with a high number of views); they could not contain disinformation; and their content needed to be scientific rather than political (e.g., how the virus spreads and how COVID-19 vaccines work). The collection contained videos by science journalists (maiLab, MrWissen2Go), one virologist (Melanie Brinkmann for Bundesministerium für Gesundheit (federal ministry of health)), one medical doctor (Doktor Weigl), and various other agents (e.g., Robert Koch-Institut, Quarks, explainity, Dinge erklärt - Kurz gesagt). For each video, several parts were then annotated by multi-modal means using the annotation software ELAN [47], which allowed us to annotate textual data, such as the usage of terms and metaphors; other audio elements, such as music and manufactured sounds; and visual elements such as inserts, gestures and colors. At the same time, qualitative analysis should be linked with different kinds of reception analysis, such as by means of interviews and questionnaires; eye-tracking studies; or social media comments (see [23] for different methods for YouTube videos). This link, at least to our knowledge, is still poorly understood regarding science communication during the COVID-19 crisis. To gain insight into how epidemiological information was communicated to non-expert audiences and how it was perceived, we extracted relevant comments by recipients.

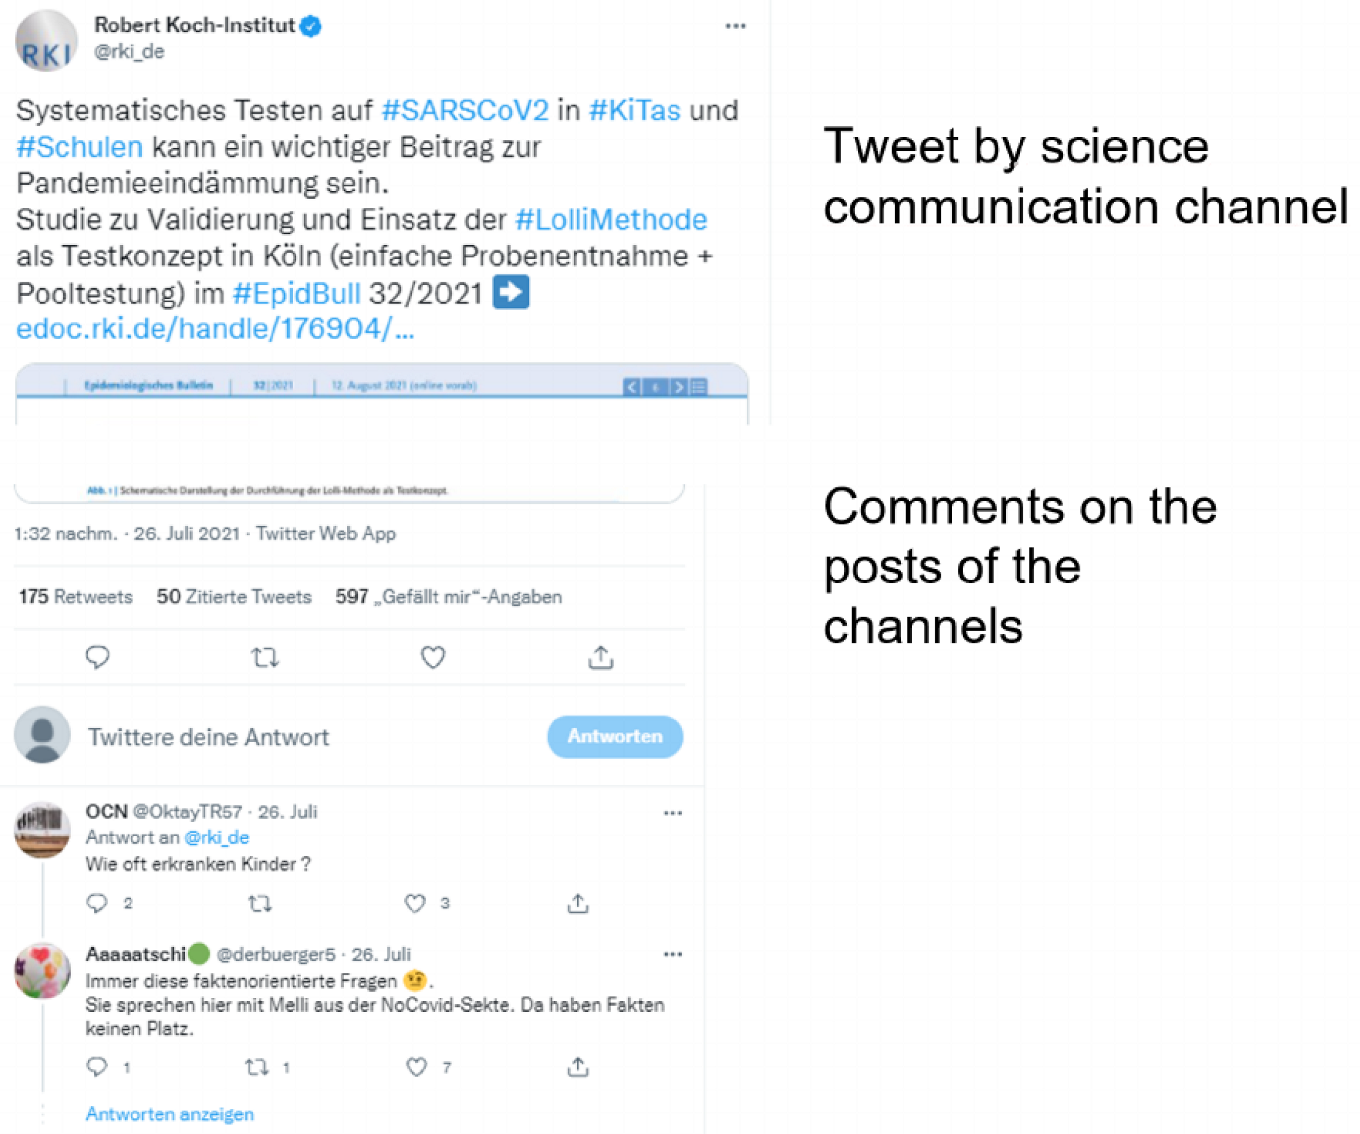
3.2. Science Communication Channels

For this study, we focused on the social media discussion on the platform Twitter, which offers diverse science communication scenarios. When selecting relevant channels for our study, we applied various criteria. First, we limited the channels to those active in Germany, Austria and Switzerland to obtain tweets and replies that would be in German. Furthermore, only accounts with a certain level of reach (at least 1000 followers) and thus a higher probability of public discussions were considered. Different types of accounts were considered. We only excluded news channels, as they provide an overview on a large amount of topics and did not contribute deeper scientific insights. Instead, accounts maintained by individuals were selected as well as those by research groups, institutions, authorities, etc. As we were aiming for a broad understanding of science communication, we included all channels with speakers that had purported expertise related to the COVID-19 crisis (doctors, virologists, science journalists, etc.) and used their knowledge to make pandemic-related information accessible for their audience. The COVID-19 pandemic and related aspects did not need to be the predominant subject on the channels, but the topic needed to be addressed several times. Furthermore, the given information had to be delivered in a neutral way and based on scientific and background knowledge, rather than personal experience and anecdotes. As with the YouTube videos, Twitter channels that delivered obviously misleading information or disinformation were excluded.
After determining these criteria, Twitter was reviewed for relevant channels. We considered different news resources and identified the channels of persons, organizations, etc. that were present in the news. From these starting points, we also reviewed the recommendations provided by Twitter for other accounts "you might like" as well as mentions by accounts we had already identified as relevant. Following this procedure, we obtained 49 channels in total that addressed the COVID-19 pandemic from various perspectives.
These different perspectives were provided by journalists (e.g., Korinna Hennig, @KorinnaHennig), science communicators (e.g., Mai-Thi Nguyen Kim, @maithi_nk; Annette Leßmöllmann, @annetteless), magazines (e.g., Spektrum, @spektrum), scientists (e.g., Christian Drosten, @c_drosten; Sandra Ciesek, @CiesekSandra), scientific institutions (e.g., Charité, @ChariteBerlin), practicing physicians (e.g., Marc Hanefeld, @Flying__Doc), politicians (e.g., Jens Spahn, @jensspahn) and political institutions (e.g., Bundesministerium für Gesundheit (German Ministry of Health), @BMG_Bund) in the corpus.
These channels served as seeds for the automated data collection of replies to their science communication. For this purpose, we used the official Twitter API. In the first step, all tweets of one channel were collected and stored in a file. The same was performed for all replies, and then those two files were combined. As a result, we obtained one JSON file for each channel, in which tweets and all replies were presented in a nested structure that represented the course of the conversations. For the following topic modeling, these files had to be transformed into a CSV format, which also served as a filtering step. We filtered the tweets by keywords to narrow the data down to tweets that were related to the pandemic. We also applied a German-language filter to procure German-only tweets and replies. After this filtering step, over one million replies remained in our collection for automated analysis. These were unevenly distributed over the channels, ranging from only 28 replies (@lehr_thorsten) to over 450,000 replies (@Karl_Lauterbach), as the lowest and highest numbers, respectively.

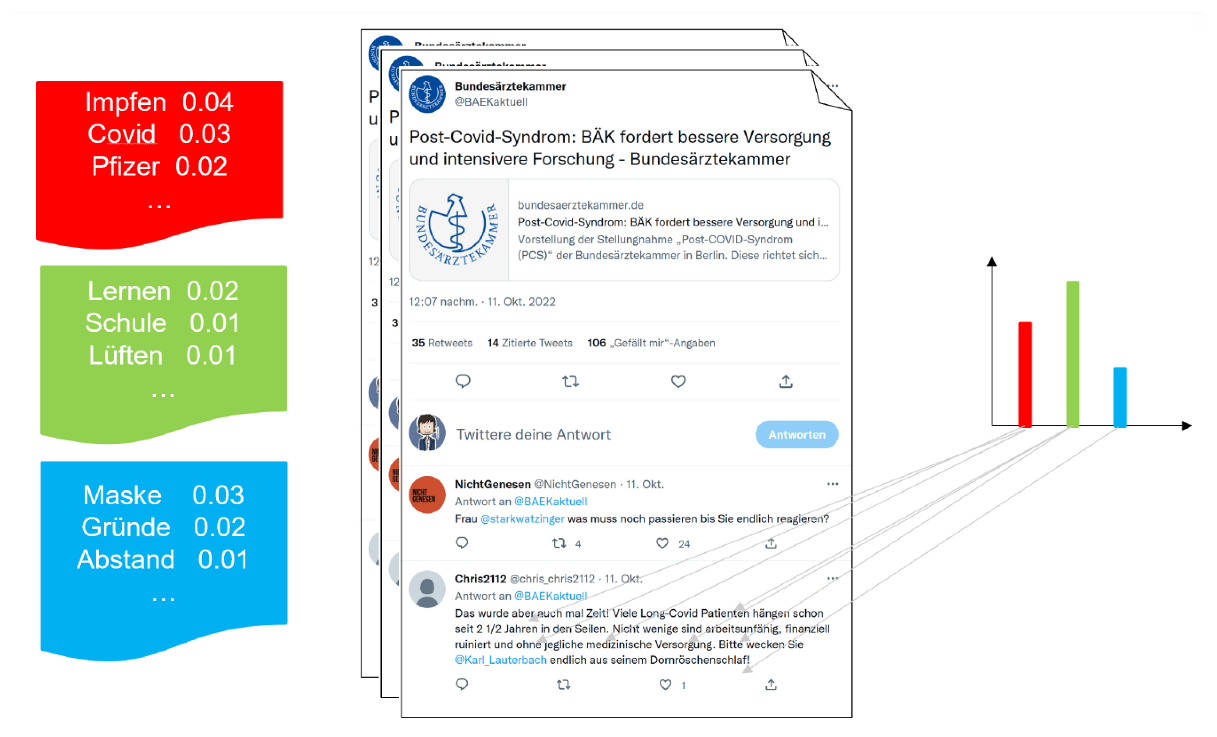
3.3. Topic Modeling and Interpretation

Topic modeling is a computational method for content analysis for applications in which the content of a large collection of documents requires analysis. Since topic modeling operates unsupervised, it does not require assumptions about content words and can be applied for exploring a collection without bias [48]. Topic modeling is considered a lexical method, as it is based on the occurrence of words within documents. A "topic" is a probability distribution over words. Within topic modeling, a document is seen as a combination of these topics. Each document consists of several topics. When a part of the text is written about this topic, it is assumed that the writer selects words from that topic. The principle is illustrated in Figure 4. Based on the probabilities assigned, these words are then chosen with different probabilities. An optimization approach, such as Latent Dirichlet Allocation (LDA) is applied to create homogeneous topics and ensure that documents are assembled from as few topics as possible [48]. These topics are often interpreted for humans and make up a coherent set of words that refer to a common theme.
For topic modeling, we used the library Gensim, which is available in Python [49]. Before creating the topic model, several design decisions needed to be made. The first decisions concerned the pre-processing of the data. We decided to eliminate as much noise as possible from the data in order to focus on the most important content of the tweets for our model. Therefore, we first removed all emojis and URLs from the text that could not be used for the topic modeling. Next, the remaining texts were tokenized, and the stop words were removed. Furthermore, we removed all tokens that consisted of less than three letters because we observed that those were mostly abbreviations and acronyms that could not be interpreted without any context or background knowledge. In the subsequent step, all tokens were lemmatized, and punctuation and special characters were removed, as well. After these pre-processing steps, topic modeling was initiated. Another important decision had to be made regarding the number of topics. To find the optimal number of topics, we calculated coherence scores for different options and selected the number accordingly. For this step we only used a subset of our data, consisting of almost 90,000 tweets, to reduce computation time. Coherence scores were calculated for 5,10,15,...,50 topics and plotted as a graph. At 30 topics, the incline of the coherence flattened, and an elbow bend was observed at this point. Therefore, we chose 30 topics (with a coherence score of 0.2350) for calculating the complete topic model. This provided relatively high coherence while still limiting the complexity of the model.

3.4. Tweet Labeling and Analysis

After calculating the final model with the above-stated design decisions, the resulting topics were analyzed manually. Based on this inspection, we selected five topics that were related to science communication, which was indicated by the most relevant words for each topic. From each of these five topics, we chose 500 tweets that had the highest contributing share from this topic for further analysis. Those tweets were given to an annotator who then annotated whether the tweets were actually related to science communication. The annotator classified the tweets into the four categories: highly relevant, somehow relevant, only slightly relevant and not relevant. As this step only functioned as a first pre-selection of tweets, everything that could be connected to science communication in a broad understanding was annotated as relevant. Afterwards, those pre-selected tweets were annotated by two other persons independently. The annotators used the same classification system but were asked to be more critical, i.e., only label tweets as relevant if they were clearly related to science communication.

3.5. Sentiment Analysis

For a deeper understanding of our data beyond the topic modeling, we decided to apply sentiment analysis. Sentiment analysis is a computational method that identifies the sentiment of a text. This can be carried out for entire texts or for parts. Sentiments are defined as ’emotions, or they are judgments or ideas prompted or colored by emotions" [50]. Typically, sentiment or polarity has been defined as either positive, neutral or negative [51]. For this study, the tool Textblob was applied. Textblob is a Python library that can be used with much ease [52]. It uses lexicon-based sentiment recognition. This means that it uses mainly sentiment scores of words to determine the sentiment polarity of sentences [53].
The scores ranged between extremely negative (−1) and extremely positive sentiments (+1).

4. Results

The following sections present the results based on the steps of the methodology.

4.1. Qualitative Analysis of Videos

A detailed description of the science communication strategies in the videos exceeded the scope of this contribution, and the following paragraphs were restricted to exemplary findings that were relevant to the subsequent steps of analysis and related to accessibility and trustworthiness.
The videos demonstrated the intent to communicate clearly by explaining technical terms that their audiences needed to understand. To signal that a newly introduced term had been used, the term was often stressed, introduced by sogenannt (“so-called”) and occasionally presented as written text. Animation videos generally used fewer terms than presentation videos, and typically, the technical term preceded the explanation (“Die sogenannten Alveolen, kleine Luftbläschen, mit denen wir atmen…” translated “the so-called alveoles, the small air bubbles with which we breathe…”) than vice versa (“Die liegt bei einer gewöhnlichen Grippe, bei der sogenannten Influenza, bei ungefähr 0,2 bis 0,3% weltweit" translated "It amounts to more or less 0.2 to 0.3 per cent worldwide with a common flu, the so-called influenza”). Metaphors were typical of science communication in general [54] and helped to explain abstract or invisible processes (such as those within the human body) clearly and make them accessible. To explain how the virus works in the human body, the explanations often relied on war metaphors (which is often used to speak about diseases in general), both in spoken and visual communication in animation videos. Another metaphor that occurred occasionally was that of a construction plan. In order to avoid distorting facts, stating scientific insecurities is important but was often met with criticism during the COVID-19 pandemic [13] because it decreased credibility in the eyes of some viewers. Both animation and presentation videos stated scientific insecurities, i.e., things that were not known about COVID-19 and the vaccine when the videos were published, but presentation videos provided this more consistently (e.g., “Es ist nicht ganz klar, ob man das auch genauso auf die Coronaimpfung übertragen kann” translated “It is not entirely clear whether this can also be directly transferred to the COVID-19 vaccine”). One reason for this could be that these kinds of videos were often considerably longer than shorter animation clips. Whereas it is rare for animation videos to mention scientific studies during the video (in contrast to the information box below the video, however), this was a common practice in presentation videos. It was also a characteristic of video presenters to occasionally use colloquialisms and to wear casual outfits in a (staged) domestic setting in order to help science journalists such as Mai Thi Nguyen-Kim and Martin Moder appear more approachable.

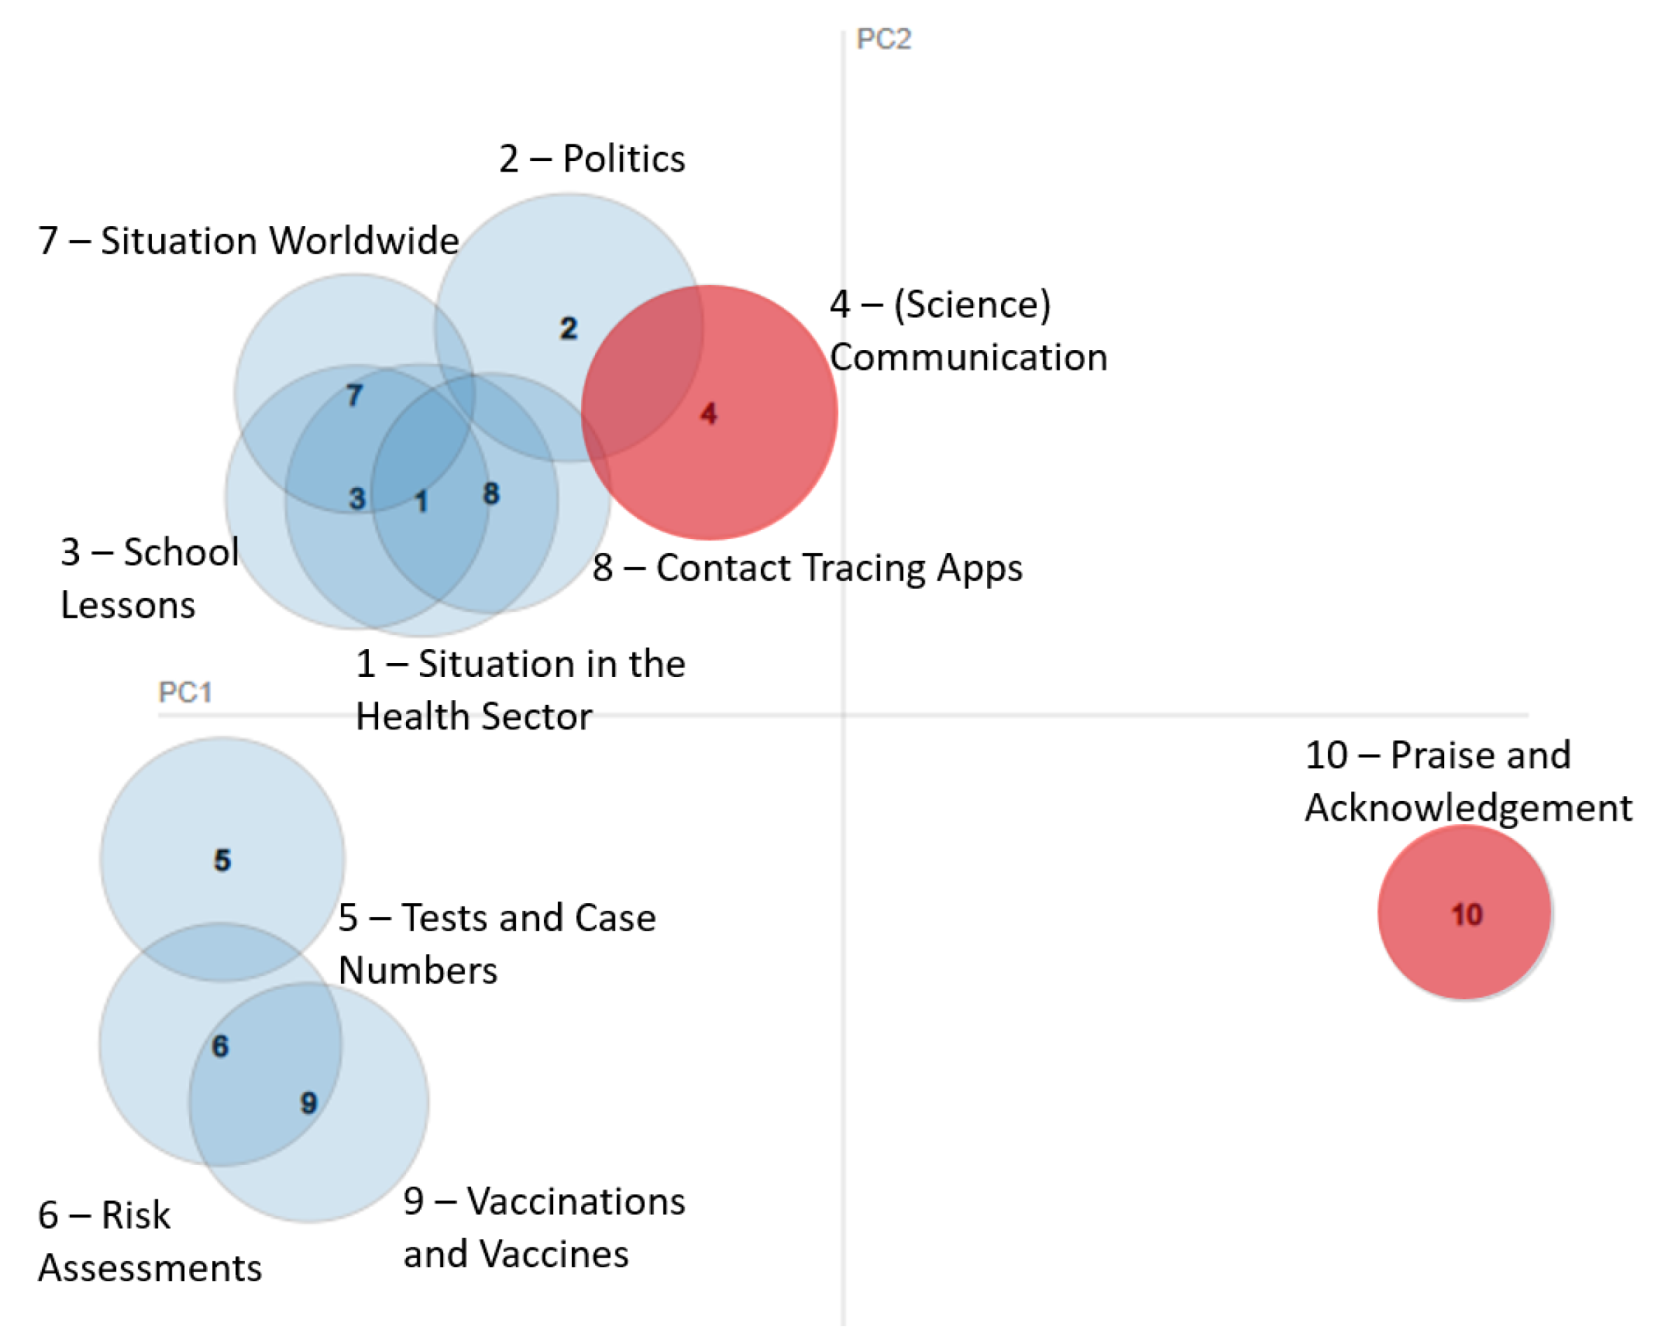
4.2. Topics within Comments on Science Communication

We collected data on Twitter from the 49 channels previously identified as relevant. The available comments posted on science communication channels were downloaded from 1 January 2020 to 20 August 2021. The original tweets had been omitted during the above-mentioned filtering steps since our study was focused on the reception of science communication rather than on the science communication itself. Therefore, we obtained a dataset of more than 1 million replies that were used in our topic model analysis according to 30 topics. In Table 1, the most relevant words for the first 15 topics are shown.
An overview of the topics is shown in Figure 5.
These results showed that the reactions to posts related to science communication were fairly general regarding the pandemic. The audience mainly discussed political and health issues. There was no single topic that was clearly identified as a collection of reactions to science communication strategies.

4.3. Tweets on Science Communication

Using our model of 30 topics, we identified the reactions to the science communication strategies employed on content related to those topics. As a next step, it was necessary to interpret the topics by finding the most relevant words for each topic. The method to calculate these words could be modified by a parameter. This was achieved by tuning the λ -value to emphasize the overall frequency of a word or the exclusivity of a word for a specific topic [55]. We used λ -values of 1, 0.75, 0.5 and 0.25 to achieve a better understanding of the dimensions of the topics. Unfortunately, there was no single topic that clearly pertained to comments on science communication, and all topics were more focused on content-related discussions, instead. However, we identified five topics that appeared to contain the desired comments based on the most relevant words. These words are shown according to five selected topics in Table 2.
For further analysis of these topics, we selected the 500 most important tweets for each of the topics and assigned them to three annotators, as described above. The first annotator who applied wider criteria for the relevance assessment sorted 189 of the 500 tweets into three categories for relevant tweets (highly relevant, somehow relevant, only slightly relevant). As for the other two annotators, we observed that there was little agreement between their classifications of the tweets into the proposed categories. Therefore, we chose to only review tweets marked as relevant, regardless of the degree of relevancy. In total, Annotator 2 marked 77 tweets as relevant and Annotator 3 marked 68 tweets as relevant. Overall, all annotators agreed that 44 tweets were relevant. The statistics of the annotation process are shown in Table 3.
Overall, only a few tweets were annotated as relevant and commented on the science communication itself, rather than its content. In addition, most tweets were referring to the mentioned channel in general and not a specific tweet or aspect. Some examples of relevant tweets are shown in Table 4.
These examples showed that the overall goal of finding tweets related to science communication was achieved by applying our methodology, although the overall number of tweets that could be identified using this method was relatively few. However, the approach could be applied by channel administrators to collect feedback about their work.

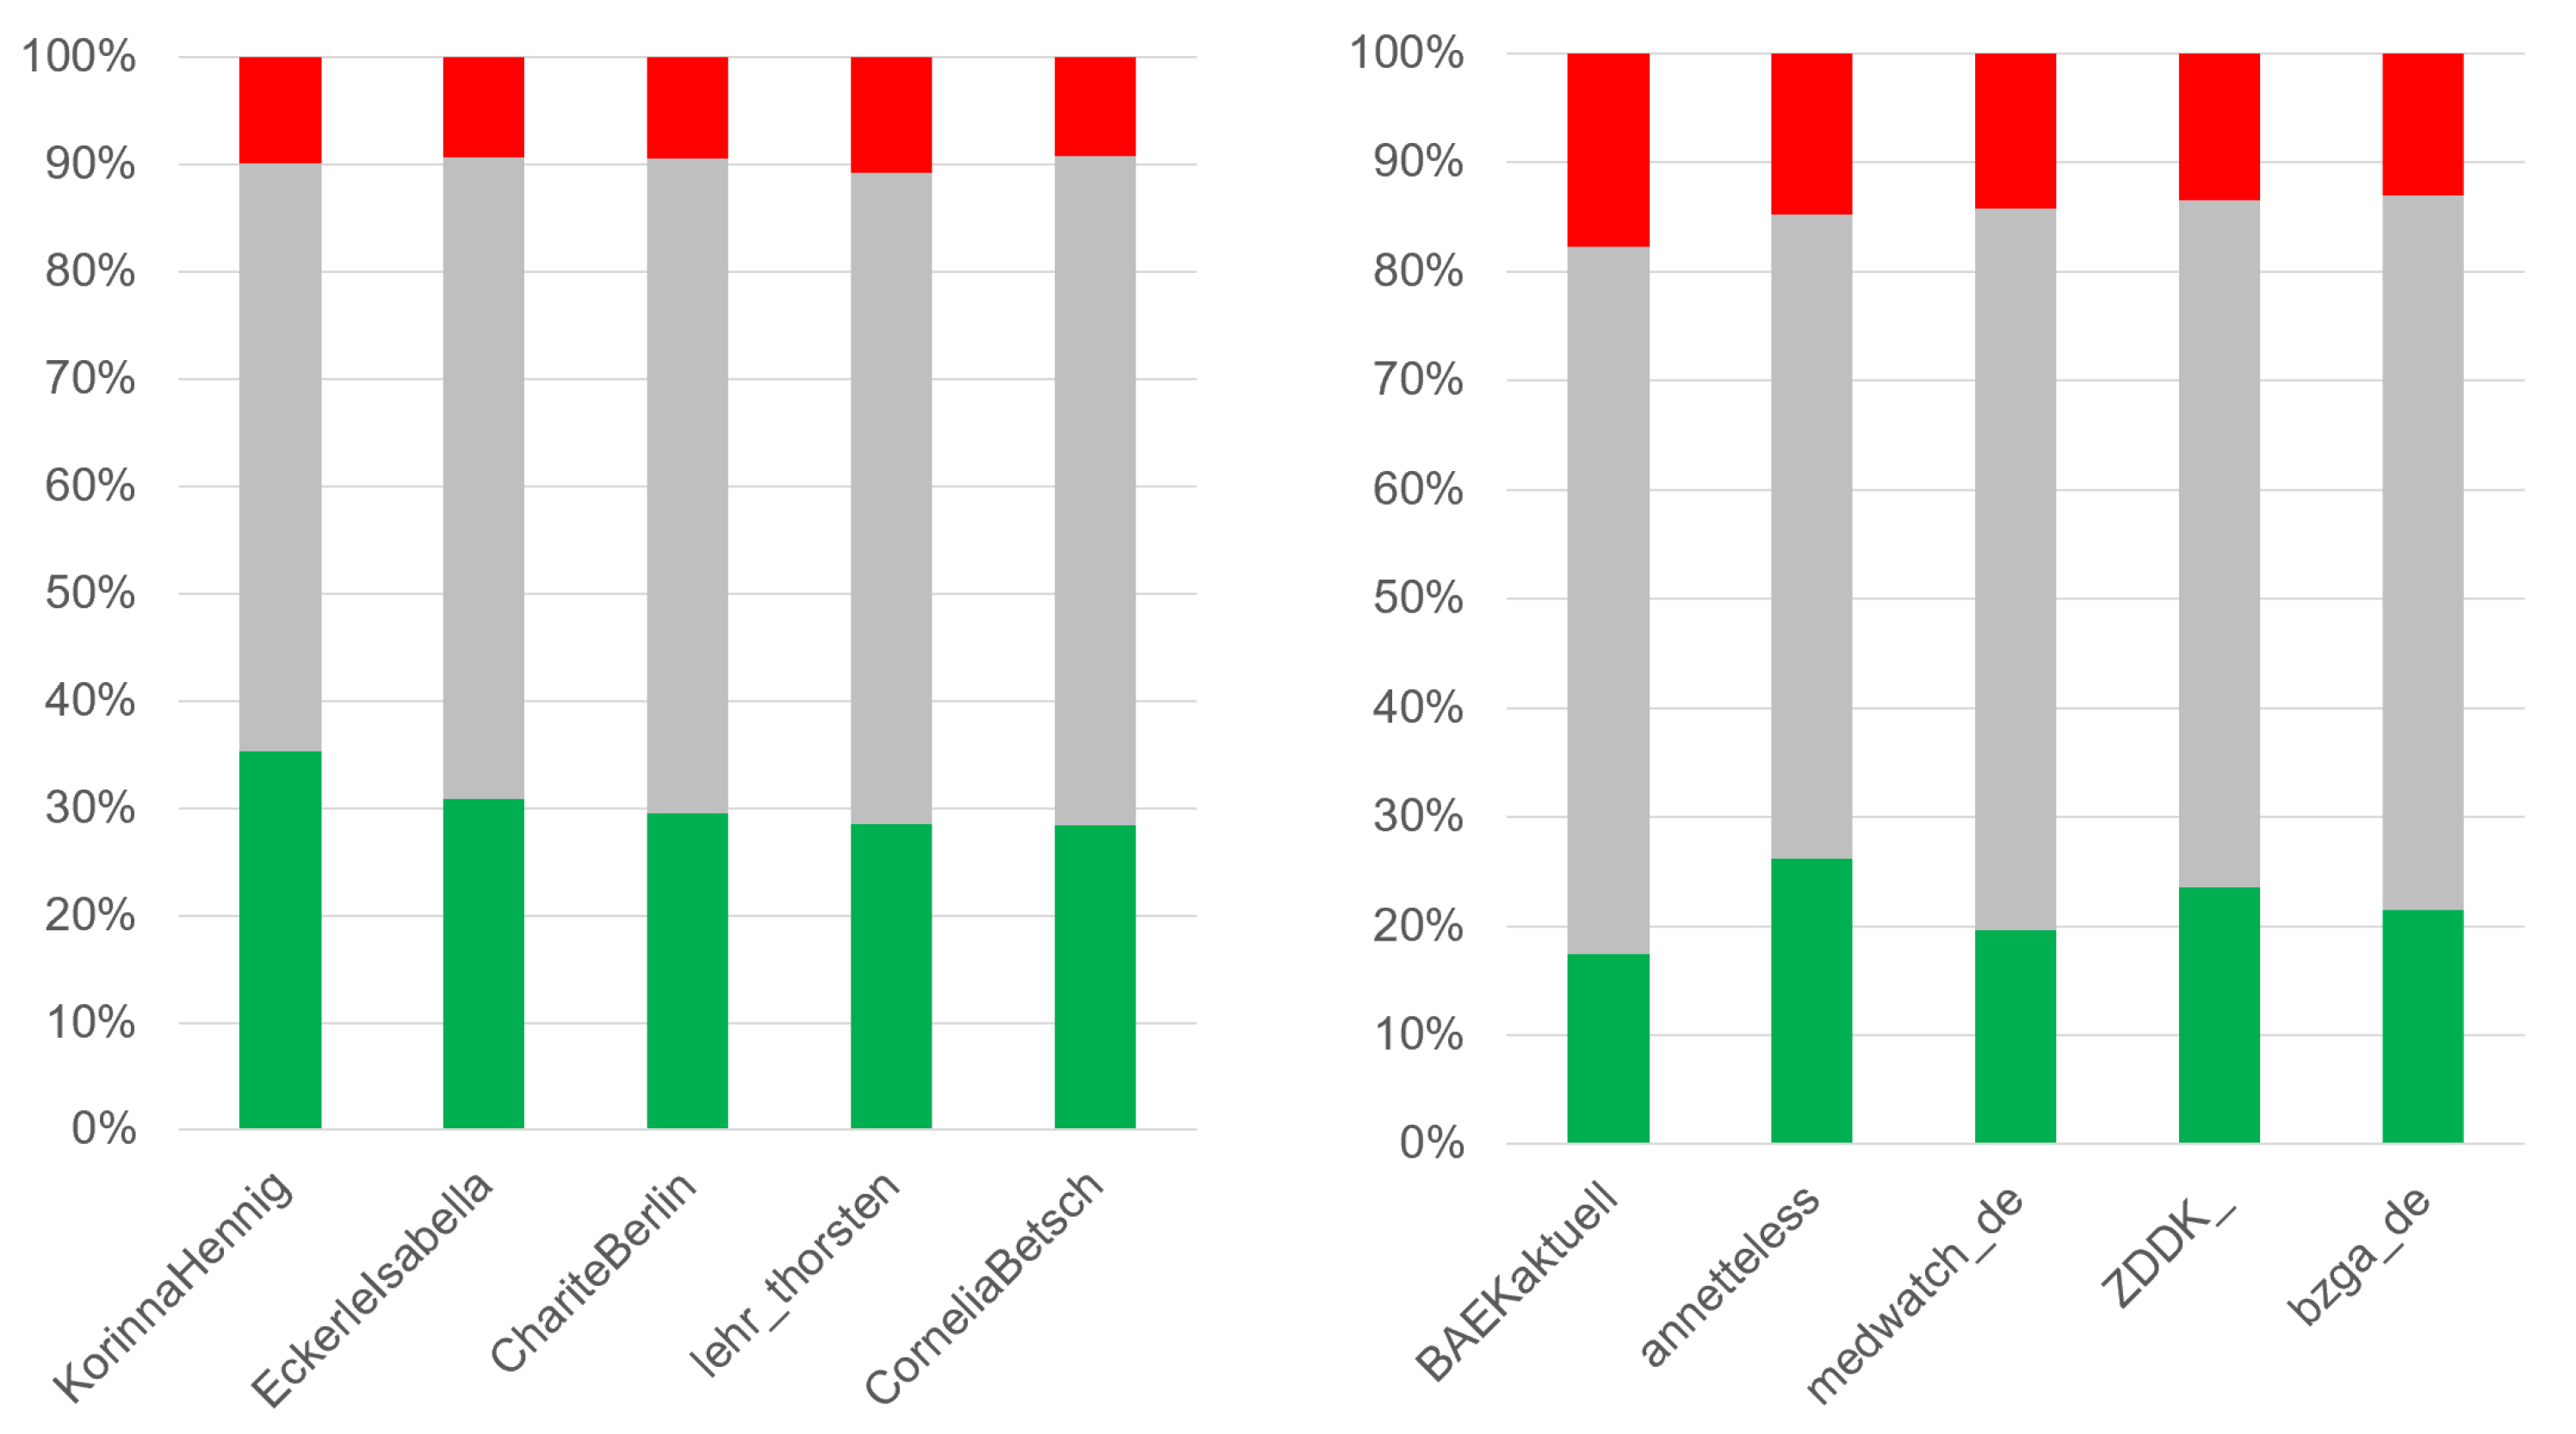
4.4. Sentiment Analysis for Channels

In the next step, we wanted to establish whether tweets by various channels produced different sentiments and reactions from viewers according to different science communication strategies. After calculating the polarity values for all tweets, we classified them into three categories of positive, neutral and negative sentiments. The thresholds between the categories were 0.33 and −0.33, respectively, so we had equally large segments for each. For the complete dataset, 24.48% of the tweets were positive sentiments, 60.13% were neutral, and 15.39% were negative. The automatic analysis of the sentiments in the entire set of tweets showed that the proportion of negative tweets was overall smaller than in other studies that had reported a higher number of negative sentiments (see Section 2.3 and [56]). Other thresholds may have been used; nonetheless, most results still reported higher numbers. One reason for this could be that science communication strategies are less polarizing (and, potentially, less inflammatory) than the contents that science communication seeks to address, which are often political by nature.
Figure 6 shows the five channels with the largest portion of positive tweets and the five channels with the largest portion of negative tweets.
It was remarkable that many channels showed a similar distribution over sentiment categories, but some differences were observed. The percentage of positive sentiments ranged from 35.71% to 16.39% and for negative sentiments from 23.19% to 11.73%. However, it could not be assumed that a higher share of positive replies indicated less negative replies: Only two of the ten channels with the highest percentage of positive replies were located among the bottom ten for negative sentiment percentages. Similarly, only three out of the ten channels with the highest percentage of negative replies were located among the bottom ten for positive sentiment. Overall, the patterns were similar. Therefore, there was no indication that any single channel was judged as more positive than others. This could have been related to the topics themselves, not necessarily the quality of the information products of the channel.
Furthermore, no differences between different types of channels was observed since the displayed channels in Figure 6 included channels from journalists (@KorinnaHennig), scientists (@EckerleIsabella, @lehr_thorsten), scientific institutions (@ChariteBerlin), science communicators (@CorneliaBetsch, @annetteless), political institutions (@BAEKaktuell, bzga_de) and magazines (@medwatch_de, @ZDDK_).

5. Conclusions

In this paper, we presented a predominantly quantitative approach to a reception analysis of science communication strategies. To achieve this, we employed a mixed-method approach by identifying science communication strategies (qualitative), identifying science communication channels on Twitter and mining their comment sections (quantitative), performing topic modeling on the filtered data (quantitative), and carrying out sentiment analysis on a subset (qualitative and quantitative).
The qualitative analysis demonstrated several strategies for communicating in an accessible manner and fostering trustworthiness. Given the tedious work of manually collecting comments on science communication strategies, previous studies have pointed out automatic identification as a way to fill the gap in the literature [4]. Overall, our method to identify tweets related to science communication strategies was proven valid. However, their frequency overall was quite low, and it was not feasible to build an automatic classifier for the task. The main reason was that comments on science communication strategies were relatively infrequent in comparison to content-related or politically motivated comments. Nevertheless, we did not conclude that the analysis of comment sections should be disregarded in reception analysis, only that it was methodologically challenging. Regarding the sentiment in the subset of our data that was restricted to comments on science communication strategies, the comments on Twitter were generally more positive than in the overall comments that are related to the science communication itself. This finding indicated that studies using huge datasets where politically motivated comments are not filtered out could lead to misleading conclusions.
The results presented suggested to the following implications. Methodologically, it was feasible to filter comments with the method presented although this led to a relatively small set of relevant comments. A set of automatically extracted comments could, therefore, serve as an addition for reception studies on science communication. Thus, social media analysis could complement other methods. Moreover, practitioners and channel administrators could use such comments as valuable feedback.
In future work, we also intend to apply our methodology to YouTube comments to determine whether the results could be replicated or whether they would differ for comment sections on different social media. The selection of the channels could also have an impact on the results. We intend to further analyze the comments per channel to investigate whether the commenting behavior varies for the channels. Furthermore, we are planning to extend the analysis to an international dimension. As a cases study, we intend to analyze the Brazilian science communication market (including governmental bodies such as the Butantã Institute and communicators such as the microbiologist Átila Iamarino).

Author Contributions

Conceptualization, S.J.; Methodology, T.M. and F.S.; Software, H.M.; Validation, H.M.; Investigation, F.S.; Data curation, H.M. and F.S.; Writing—original draft, T.M.; Writing—review & editing, S.J. and H.M.; Project administration, T.M. and S.J.; Funding acquisition, T.M. and S.J. All authors contributed equally. All authors have read and agreed to the published version of the manuscript.

Funding

This work was enabled and partially financed by a grant from the Volkswagen Foundation with the grant A133902 (ref. 98 945) (Project Information Behavior and Media Discourse during the Coronavirus Crisis: An interdisciplinary Analysis-InDisCo).

Conflicts of Interest

The authors declare no conflict of interest.

Abbreviations

The following abbreviation is used in this manuscript:
LDALatent Dirichlet Allocation

References

  1. Montesi, M. Human information behavior during the COVID-19 health crisis. A literature review. Libr. Inf. Sci. Res. 2021, 43, 101122. [Google Scholar] [CrossRef]
  2. Jaki, S.; Sabban, A. (Eds.) Wissensformate in den Medien: Analysen aus Medienlinguistik und Medienwissenschaft; Frank & Timme GmbH: Berlin, Germany, 2016; Volume 25. [Google Scholar]
  3. Shapiro, M.A.; Park, H.W. More than entertainment: YouTube and public responses to the science of global warming and climate change. Soc. Sci. Inf. 2015, 54, 115–145. [Google Scholar] [CrossRef]
  4. Jaki, S. This is simplified to the point of banality.: Social-Media-Kommentare zu Gestaltungsweisen von TV-Dokus. J. FüR Medien. 2021, 4, 54–87. [Google Scholar] [CrossRef]
  5. Latif, S.; Usman, M.; Manzoor, S.; Iqbal, W.; Qadir, J.; Tyson, G.; Castro, I.; Razi, A.; Boulos, M.N.K.; Weller, A.; et al. Leveraging data science to combat COVID-19: A comprehensive review. IEEE Trans. Artif. Intell. 2020, 1, 85–103. [Google Scholar] [CrossRef]
  6. Dreisiebner, S.; März, S.; Mandl, T. Information behavior during the COVID-19 crisis in German-speaking countries. J. Doc. 2022, 78, 160–175. [Google Scholar] [CrossRef]
  7. Viehmann, C.; Ziegele, M.; Quiring, O. Gut informiert durch die Pandemie? Nutzung unterschiedlicher Informationsquellen in der Corona-Krise. Media Perspekt. 2020, 11, 556–577. [Google Scholar]
  8. Brill, J.; Rossmann, C. Die Bedeutung von Gesundheitskompetenz für das Informationsverhalten deutscher Bundesbürger*innen zu Beginn der Corona-Pandemie. In Wissen um Corona: Wissenschaftskommunikation, Informationsverhalten, Diskurs; Schmidt, F., Jaki, S., Mandl, T., Eds.; Universitätsverlag Hildesheim: Hildesheim, Germany, 2022; pp. 45–82. [Google Scholar] [CrossRef]
  9. Schäfer, M.; Stark, B.; Werner, A.; Schäfer, M.; Stark, B.; Werner, A.; Mülder, L.; Reichel, J.; Heller, S.; Pavel Dietz, L. Gut informiert im Pandemie-Modus? Das Gesundheitsinformationsverhalten Studierender während der COVID-19-Pandemie: Zentrale Tendenzen und fachspezifische Unterschiede. Wissen Corona Wiss. Inform. Diskurs 2022, 83–111. [Google Scholar] [CrossRef]
  10. Viehmann, C.; Ziegele, M.; Quiring, O. Communication, Cohesion, and Corona: The Impact of People’s Use of Different Information Sources on their Sense of Societal Cohesion in Times of Crises. J. Stud. 2022, 23, 629–649. [Google Scholar] [CrossRef]
  11. Reinhardt, A.; Brill, J.; Rossmann, C. Eine Typologie des Informationsverhaltens der Deutschen in der Corona-Pandemie unter Berücksichtigung von Themenverdrossenheit. In Proceedings of the Jahrestagung der Fachgruppe Gesundheitskommunikation der Deutschen Gesellschaft für Publizistik-und Kommunikationswissenschaft; DEU: Leipzig, Germany, 2021; pp. 31–42. [Google Scholar] [CrossRef]
  12. Schmidt, F.; Jaki, S.; Mandl, T. (Eds.) Wissen um Corona: Wissenschaftskommunikation, Informationsverhalten, Diskurs; Universitätsverlag Hildesheim: Hildesheim, Germany, 2022. [Google Scholar] [CrossRef]
  13. Böcker, R.M.; Mitera, H.l.T.; Schmidt, F. Wissenschaftskommunikation und Informationsverhalten während der COVID-19-Pandemie: Eine Analyse von Umfragedaten und Interviews. Inf. Wiss. Prax. 2022. [Google Scholar] [CrossRef]
  14. Bucchi, M.; Trench, B. Science Communication and Science in Society: A Conceptual Review in Ten Keywords. Tecnoscienza 2016, 7, 151–168. [Google Scholar]
  15. Pasternack, P.; Beer, A. Die externe Kommunikation der Wissenschaft in der bisherigen Corona- Krise (2020/2021). Eine kommentierte Rekonstruktion (HoF-Arbeitsbericht 118); Institut für Hochschulforschung (HoF) an der Martin-Luther-Universität: Halle-Wittenberg, Germany, 2022. [Google Scholar]
  16. Geipel, A. Wissenschaft@YouTube. In Knowledge in Action: Neue Formen der Kommunikation in der Wissensgesellschaft; Lettkemann, E., Wilke, R., Knoblauch, H., Eds.; Springer Fachmedien: Wiesbaden, Germany, 2018; pp. 137–163. [Google Scholar] [CrossRef]
  17. Varwig, C. Kommunizieren oder verschweigen—Wie geht man mit wissenschaftlicher Unsicherheit um? In Wissenschaft und Gesellschaft: Ein Vertrauensvoller Dialog: Positionen und Perspektiven der Wissenschaftskommunikation Heute; Schnurr, J., Mäder, A., Eds.; Springer: Berlin/Heidelberg, Germany, 2020; pp. 205–214. [Google Scholar] [CrossRef]
  18. Jaki, S. Terms in Popular Science Communication: The Case of TV Documentaries. Hermes-J. Lang. Commun. Bus. 2018, 58, 257–272. [Google Scholar] [CrossRef]
  19. Jaki, S. Emotionalisierung in TV-Wissensdokus. Eine multimodale Analyse englischer und deutscher archäologischer Sendungen. In Mediale Emotionskulturen; Hauser, S., Luginbühl, M., Tienken, S., Eds.; Peter Lang: Frankfurt, Germany, 2019; pp. 83–107. [Google Scholar] [CrossRef]
  20. Luginbühl, M. Vom Dozieren am Schreibtisch zum Informieren und Einschätzen unterwegs: Die mediale Inszenierung von Geistes-und SozialwissenschaftlerInnen im Wissenschaftsfernsehen. In Geisteswissenschaften und Öffentlichkeit. Linguistisch betrachtet; Luginbühl, M., Schröter, J., Eds.; Peter Lang: Frankfurt, Germany, 2018; pp. 139–168. [Google Scholar]
  21. Kress, G. Multimodality: A Social Semiotic Approach to Contemporary Communication; Routledge: Oxfordshire, UK, 2009. [Google Scholar]
  22. Stöckl, H. 1. Multimodalität—Semiotische und textlinguistische Grundlagen. Handb. Sprache Multimodalen Kontext 2016, 3–35. [Google Scholar] [CrossRef]
  23. Bucher, H.J.; Boy, B.; Christ, K. Audiovisuelle Wissenschaftskommunikation auf YouTube: Eine Rezeptionsstudie zur Vermittlungsleistung von Wissenschaftsvideos; Springer: Berlin/Heidelberg, Germany, 2022. [Google Scholar] [CrossRef]
  24. Madhu, H.; Satapara, S.; Modha, S.; Mandl, T.; Majumder, P. Detecting offensive speech in conversational code-mixed dialogue on social media: A contextual dataset and benchmark experiments. Expert Syst. Appl. 2022, 215, 119342. [Google Scholar] [CrossRef]
  25. Nakov, P.; Barrón-Cedeño, A.; Martino, G.D.S.; Alam, F.; Struß, J.M.; Mandl, T.; Míguez, R.; Caselli, T.; Kutlu, M.; Zaghouani, W.; et al. The CLEF-2022 CheckThat! Lab on Fighting the COVID-19 Infodemic and Fake News Detection. In Proceedings of the 44th European Conference on IR Research ECIR, Stavanger, Norway, 10–14 April 2022; Volume 13186, pp. 416–428. [Google Scholar] [CrossRef]
  26. Vijayaraghavan, P.; Vosoughi, S. TWEETSPIN: Fine-grained Propaganda Detection in Social Media Using Multi-View Representations. In Proceedings of the Conference of the North American Chapter of the Association for Computational Linguistics: Human Language Technologies NAACL, Seattle, WA, USA, 10–15 July 2022; Carpuat, M., de Marneffe, M., Ruíz, I.V.M., Eds.; Association for Computational Linguistics: Stroudsburg, PA, USA, 2022; pp. 3433–3448. [Google Scholar] [CrossRef]
  27. Basu, M.; Ghosh, S.; Ghosh, K. Overview of the FIRE 2018 Track: Information Retrieval from Microblogs during Disasters (IRMiDis). In Proceedings of the Working Notes of FIRE-Forum for Information Retrieval Evaluation, Gandhinagar, India, 6–9 December 2018; Available online: https://ceur-ws.org/Vol-2266/T1-1.pdf (accessed on 5 February 2023).
  28. De, D.; Thakur, G.S.; Herrmannova, D.; Christopher, C. Methodology to Compare Twitter Reaction Trends between Disinformation Communities, to COVID related Campaign Events at Different Geospatial Granularities. In Proceedings of the Companion of The Web Conference 2022, Virtual Event/Lyon, France, 25–29 April 2022; pp. 458–463. [Google Scholar] [CrossRef]
  29. Kausar, M.A.; Soosaimanickam, A.; Nasar, M. Public sentiment analysis on Twitter data during COVID-19 outbreak. Int. J. Adv. Comput. Sci. Appl. 2021, 12, 2. [Google Scholar] [CrossRef]
  30. Koh, J.X.; Liew, T.M. How loneliness is talked about in social media during COVID-19 pandemic: Text mining of 4492 Twitter feeds. J. Psychiatr. Res. 2020, 145, 317–324. [Google Scholar] [CrossRef]
  31. DeVerna, M.R.; Pierri, F.; Truong, B.T.; Bollenbacher, J.; Axelrod, D.; Loynes, N.; Torres-Lugo, C.; Yang, K.; Menczer, F.; Bryden, J. CoVaxxy: A Collection of English-Language Twitter Posts About COVID-19 Vaccines. In Proceedings of the Fifteenth International AAAI Conference on Web and Social Media, ICWSM Held Virtually, 7–10 June 2021; AAAI Press: Washington, DC, USA, 2021; pp. 992–999. [Google Scholar]
  32. Shuja, J.; Alanazi, E.; Alasmary, W.; Alashaikh, A. COVID-19 open source data sets: A comprehensive survey. Appl. Intell. 2021, 51, 1296–1325. [Google Scholar] [CrossRef]
  33. Banda, J.M.; Tekumalla, R.; Wang, G.; Yu, J.; Liu, T.; Ding, Y.; Artemova, E.; Tutubalina, E.; Chowell, G. A large-scale COVID-19 Twitter chatter dataset for open scientific research—an international collaboration. Epidemiologia 2021, 2, 315–324. [Google Scholar] [CrossRef]
  34. Qazi, U.; Imran, M.; Ofli, F. GeoCoV19: A dataset of hundreds of millions of multilingual COVID-19 tweets with location information. Sigspatial Spec. 2020, 12, 6–15. [Google Scholar] [CrossRef]
  35. Vosoughi, S.; Roy, D.; Aral, S. The spread of true and false news online. Science 2018, 359, 1146–1151. [Google Scholar] [CrossRef]
  36. Ferrara, E. What Types of COVID-19 Conspiracies are Populated by Twitter Bots? CoRR 2020, abs/2004.09531. Available online: https://arxiv.org/abs/2004.09531 (accessed on 5 February 2023).
  37. Boon-Itt, S.; Skunkan, Y. Public perception of the COVID-19 pandemic on Twitter: Sentiment analysis and topic modeling study. Jmir Public Health Surveill. 2020, 6, e21978. [Google Scholar] [CrossRef]
  38. De Melo, T.; Figueiredo, C.M. Comparing news articles and tweets about COVID-19 in Brazil: Sentiment analysis and topic modeling approach. Jmir Public Health Surveill. 2021, 7, e24585. [Google Scholar] [CrossRef] [PubMed]
  39. Yin, H.; Song, X.; Yang, S.; Li, J. Sentiment analysis and topic modeling for COVID-19 vaccine discussions. World Wide Web 2022, 25, 1067–1083. [Google Scholar] [CrossRef]
  40. Mitera, H. Topic-Modeling-Ansätze für Social Media Kommunikation in der Coronapandemie. Inf.-Wiss. Prax. 2022, 73, 197–205. [Google Scholar] [CrossRef]
  41. Jia, X.; Chen, J.; Chen, C.; Zheng, C.; Li, S.; Zhu, T. Public discourse and sentiment during the COVID 19 pandemic: Using Latent Dirichlet Allocation for topic modeling on Twitter. PLoS ONE 2020, 15, e0239441. [Google Scholar] [CrossRef]
  42. Chandrasekaran, R.; Mehta, V.; Valkunde, T.; Moustakas, E. Topics, Trends, and Sentiments of Tweets About the COVID-19 Pandemic: Temporal Infoveillance Study. J. Med. Internet Res. 2020, 22, e22624. [Google Scholar] [CrossRef]
  43. Kydros, D.; Argyropoulou, M.; Vrana, V. A content and sentiment analysis of Greek tweets during the pandemic. Sustainability 2021, 13, 6150. [Google Scholar] [CrossRef]
  44. Liu, Q.; Zheng, Z.; Zheng, J.; Chen, Q.; Liu, G.; Chen, S.; Chu, B.; Zhu, H.; Akinwunmi, B.; Huang, J.; et al. Health Communication Through News Media During the Early Stage of the COVID-19 Outbreak in China: Digital Topic Modeling Approach. J. Med. Internet Res. 2020, 22, e19118. [Google Scholar] [CrossRef]
  45. Creswell, J.; Plano, V. Designing and Conducting Mixed Methods Research; SAGE: Thousand Oaks, CA, USA, 2018. [Google Scholar]
  46. Molina-Azorín, J.F. Understanding how mixed methods research is undertaken within a specific research community: The case of business studies. Int. J. Mult. Res. Approaches 2009, 3, 47–57. [Google Scholar] [CrossRef]
  47. Max Planck Institute for Psycholinguistics. ELAN (Version 6.4). 2022. Available online: https://www.mpi.nl/tools/elan/docs/ELAN_manual.pdf (accessed on 5 February 2023).
  48. Vayansky, I.; Kumar, S.A. A review of topic modeling methods. Inf. Syst. 2020, 94, 101582. [Google Scholar] [CrossRef]
  49. Rehurek, R.; Sojka, P. Gensim–Python framework for vector space modelling. NLP Cent. Fac. Inform. Masaryk. Univ. Brno 2011, 3, 2. [Google Scholar]
  50. Boiy, E.; Hens, P.; Deschacht, K.; Moens, M.F. Automatic Sentiment Analysis in On-line Text. In Proceedings of the Openness in Digital Publishing: Awareness, Discovery and Access-Proceedings of the 11th International Conference on Electronic Publishing, Vienna, Austria, 13–15 June 2007; pp. 349–360. [Google Scholar]
  51. Schulz, J.M.; Womser-Hacker, C.; Mandl, T. Multilingual Corpus Development for Opinion Mining. In Proceedings of the Proceedings of the Seventh International Conference on Language Resources and Evaluation (LREC’10); European Language Resources Association (ELRA): Valletta, Malta, 2010; Available online: http://www.lrec-conf.org/proceedings/lrec2010/pdf/689_Paper.pdf (accessed on 5 February 2023).
  52. Diyasa, I.G.S.M.; Mandenni, N.M.I.M.; Fachrurrozi, M.I.; Pradika, S.I.; Manab, K.R.N.; Sasmita, N.R. Twitter Sentiment Analysis as an Evaluation and Service Base on Python Textblob. In Proceedings of the IOP Conference Series: Materials Science and Engineering; IOP Publishing: Bristol, UK, 2021; Volume 1125, p. 012034. [Google Scholar] [CrossRef]
  53. Taboada, M.; Brooke, J.; Tofiloski, M.; Voll, K.; Stede, M. Lexicon-based methods for sentiment analysis. Comput. Linguist. 2011, 37, 267–307. [Google Scholar] [CrossRef]
  54. Göpfert, W. Beispiele, Vergleiche und Metaphern. In Wissenschafts-Journalismus: Ein Handbuch für Ausbildung und Praxis, 4th ed.; Göpfert, W., Ruß-Mohl, S., Eds.; Springer: Berlin/Heidelberg, Germany, 2020; pp. 107–121. [Google Scholar] [CrossRef]
  55. Sievert, C.; Shirley, K. LDAvis: A method for visualizing and interpreting topics. In Proceedings of the Workshop on Interactive Language Learning, Visualization, and Interfaces; Association for Computational Linguistics: Stroudsburg, PA, USA, 2014; pp. 63–70. [Google Scholar] [CrossRef]
  56. Chandrasekaran, G.; Hemanth, J. Deep Learning and TextBlob Based Sentiment Analysis for Coronavirus (COVID-19) Using Twitter Data. Int. J. Artif. Intell. Tools 2022, 31, 2250011. [Google Scholar] [CrossRef]
Figure 1. Schematic example of social media material used for analysis.
Knowledge 03 00008 g001
Figure 2. Example for a presentation video: Channel maiLab on YouTube.
Knowledge 03 00008 g002
Figure 3. Example for an animation video: Channel simpleshow on YouTube.
Knowledge 03 00008 g003
Figure 4. Principles of Topic Modeling including topics (left), documents and documents as topic mixtures (right).
Knowledge 03 00008 g004
Figure 5. Results of the topic modeling process.
Knowledge 03 00008 g005
Figure 6. Sentiment analysis for science communication channels.
Knowledge 03 00008 g006
Table 1. Most frequent 15 topics and their most frequent words (translated from German).
Topic NumberFrequent Words
1data, government, fear, people, before
2vaccination, vaccinated, infect, people, patients
3weeks, positive, last, week, tests
4exactly, past, situation, interventions, drosten
5simple, infection, sick, summer, sad
6opinion, flu, variant, mister, truth
7clear, hopefully, long, human, person
8important, mister, decision, sick, problems
9vaccinate, mask, masks, countries, immediately
10numbers, current, parents, schools, test
11politics, gladly, full, harm, group
12questions, virus, serious, out, mutations
13studies, German, reason, immunity, federal government
14thanks, scientific, work, people, twitter
15wrong, panic, free, country, great
Table 2. Selected topics and their most frequent words.
Topic NumberFrequent Words
17risk, low, answer, good, away
20beautiful, effectiveness, side, sometimes, wrong
21children, children, whatever, contacts, teen
26vaccinations, people, healthy, life, course
27school, happiness, state, solution, word
Table 3. Results of Annotation.
AnnotatorNumber of Tweets Marked as Relevant
1189
277
368
Two annotators57
All three annotators44
Two or three annotators101
Table 4. Examples tweets related to science communication.
Original Tweet in GermanTweet in English (Translated by Authors)
Wenn ein Artikel zu der Coronastrategie in einem Land mit 340,000 Pendlern täglich bebildert wird mit einem Foto von einer recht abgelegenen Insel, würde ich das allerdings nicht "Information" nennen. "Irreführung" scheint mir da der bessere Begriff zu sein.If an article on the COVID strategy in a country with 340,000 daily commuters is illustrated with a photo of a rather remote island, I would not call that "information," however. "Misleading" seems to be the better word.
Ich finde es sehr schön, dass Sie auch Studien zitieren, die nicht Ihren Thesen entsprechen! Damit will ich nicht sagen, dass man auch unseriösen Stimmen Gehör einräumen müsste, wie es leider in der Presse viel zu oft getan wird.I find it very good that you also quote studies that do not correspond to your theses! Nevertheless, that does not mean that you need to hear all sorts of questionable opinions, as it is done in the press way too often, unfortunately.
Danke für dieses sehr sprechende Beispiel. Wir können es ja einfach mal kurz plakativ zusammenfassen: Wir gefährden gerade Akut unsere Leistungsträger der Gesellschaft und unsere Zukunft. Das darf nicht passieren!Thank you for this very telling example. We can simply summarize it briefly as follows: We are currently acutely endangering our top performers in society as well as our future. This must be prevented!
Disclaimer/Publisher’s Note: The statements, opinions and data contained in all publications are solely those of the individual author(s) and contributor(s) and not of MDPI and/or the editor(s). MDPI and/or the editor(s) disclaim responsibility for any injury to people or property resulting from any ideas, methods, instructions or products referred to in the content.

