Article

Evaluation of an Organically Modified Clinoptilolite (OMC) and a Multi-Component Mycotoxin Detoxifying Agent (MMDA) on Survival, Growth, Feed Utilization and Disease Resistance of Nile Tilapia (Oreochromis niloticus) Fingerlings Fed with Low Aflatoxin

1
Aqua-Centre, School of Environment, Resources and Development (SERD), Asian Institute of Technology (AIT), Pathum Thani 12120, Thailand
2
PATENT CO. DOO, 24 211 Mišićevo, Serbia
3
Lucta S.A, Feed Additive Innovation Division, UAB Research Park, Edifici Eureka—Campus UAB, 08193 Bellaterra, Spain
*
Author to whom correspondence should be addressed.
Aquac. J. 2023, 3(1), 56-69; https://doi.org/10.3390/aquacj3010007
Submission received: 5 December 2022 / Revised: 24 February 2023 / Accepted: 28 February 2023 / Published: 15 March 2023

Abstract

:
Mycotoxins have become a serious issue in the animal feed industry and have also affected the aquaculture industry. Mycotoxins can create serious health problems in aquatic and terrestrial animals, and their presence in agricultural products may result in significant economic losses. To reduce the impact of mycotoxins on Nile tilapia fry, two commercially available products—Organically Modified Clinoptilolite (OMC) and multi-component mycotoxin detoxifying agent (MMDA)—were used in this study. Six diets as treatments (T1 = Control (C); T2 = Control + OMC 2 g/kg (OMC); T3 = Control + MMDA 2 g/kg (MMDA); T4 = AFB1 0.5 mg/kg (AF); T5 = AFB1 0.5 mg/kg + 2 g/kg OMC (AFOMC); T6 = AFB1 0.5 mg/kg + MMDA 2 g/kg (AFMMDA)) with similar crude protein levels (35.75 ± 0.35%) were formulated and fed to Nile tilapia fry (1.97 ± 0.1 g) for a period of 84 days. These fish were housed in 18 aquaria (100 L) at a density of 50 fish/aquarium. The results from this study showed that MMDA significantly (p < 0.05) improved the survival of fish by 16% as compared to the control group. Nevertheless, growth parameters were not affected among the treatments. These results also indicated that protein intake was significantly higher in the control and OMC diet (T2) compared to aflatoxin B1-fed tilapia. The protein efficiency ratio (PER) was significantly higher in the AFMMDA as compared to the control and MMDA. A 14-day bacterial challenge test with Aeromonas hydrophila demonstrated that diets containing MMDA or OMC improved survival when AFB1 was present in the diet. Therefore, the supplementation of feed with MMDA or OMC is recommended to ameliorate the negative effects of AFB1 in Nile Tilapia feeds.

1. Introduction

In aquaculture feed, higher levels of plant-based ingredients have been used as alternatives to fishmeal considering its high price and sustainability concerns [1,2]. However, plant-based ingredients commonly have anti-nutrients (e.g., cyanogens, saponins, tannins, etc.) and mycotoxins that are detrimental to fish and shrimp [3,4,5,6,7]. Mycotoxins have been detected in 60–80% of the samples of agricultural products although the FAO reported an overall 25% in general [4,5]. There is a tendency that when cereal grains or any agriculture products become low quality (often called animal grade) after being stored for long periods, they are fed to animals, assuming that animals are more tolerant than humans. However, the negative impacts of mycotoxins are often unnoticeable, underestimated, and often ignored [4]. Such disbelief in the negative effects of mycotoxins on aquatic species might be related to the incapability of observing certain direct negative effects of the mycotoxins on aquatic species, in contrast to what happens in livestock species [8,9,10]. Presently, the awareness of mycotoxin-related challenges in the industry has increased because feed manufacturers and producers have started to realize the problems of mycotoxins and their potential impact on the production or/and the quality and safety of final products [11,12].
Mycotoxins are secondary metabolites produced by molds, which are toxic to animals [4,13]. They are produced along with agricultural commodities before harvest and also after harvest, during transportation and storage. They can cause adverse effects on health when consumed by humans and animals. Mycotoxins have a wide range of chemical structures, which also differ in biological effects, e.g., carcinogenic, teratogenic, mutagenic, estrogenic, neurotoxic, or immunotoxic [14,15,16]. Causing negative direct effects on human and animal health, molds and mycotoxins account for the losses of millions of dollars annually worldwide due to losses in agricultural products [13,17,18,19]. Furthermore, as mycotoxins are relatively chemically and thermally stable, they cannot be destroyed by normal feed manufacturing techniques, i.e., extrusion [20,21].
Global tilapia production increased from 1 million tons in 2000 to 4.5 million tons in 2020 [22], making it the second-largest species group and the fastest-growing aquaculture species in the world [23,24]. Nowadays, tilapia diets predominantly contain plant-based feed ingredients [2], which makes this species group particularly exposed to mycotoxin-contaminated feed, which leads to economic losses due to losses in growth performance and disease vulnerability. It has been shown that Tilapia is prone to bioaccumulating aflatoxin, which may raise concerns about its safety for human consumption [8,21,25].
Aflatoxins are one of the most common mycotoxins found in Asia [9,10]. The toxicity of aflatoxins (AF), primarily AFB1, has been considerably investigated in farmed aquaculture species [26,27]. Regarding Nile tilapia, Oreochromis niloticus, several authors have tried to understand the toxicity of AF to this specie [28,29,30,31]. However, the biological effect of AF depends on the toxin concentration in the feed, the age of the animal, and their physiological conditions [32]. In previous studies, it has been reported that the growth and FCR of Nile tilapia were significantly affected by the AF present in the feed. Aflatoxin concentrations ranging from 100 to 2500 µg kg−1 of AFB significantly affect growth performance in tilapia [12,29,33,34]. Some other research showed that even lower concentrations of AF in the diets (50 µg kg−1 of AFB) led to the vacuolization and necrosis of hepatocytes [21]. Regarding apparent mortality directly associated with the ingestion of AF, this might not occur even when the diet contains a high level, e.g., 30,000 µg kg−1 as was reported for up to 25 days of exposure, which did not significantly reduce survival [29,34]. However, another study showed that in Nile tilapia fed a diet containing 200 µg kg−1 of AFB for 10 weeks, mortality increased by 16.7% [33].
Although a wide range of AF contamination work has been already tested for Tilapia, many of these studies tested AF concentration levels that are apparently unrealistic and used different systems and environments with results that were often inconclusive. Several surveys performed in aquaculture feeds in Asia showed that AF contamination may realistically be found at an average of 51.83 µg kg−1 with the possibility to reach a maximum of 220.61 µg kg−1 [10], which are adequate values to cause harm.
Various attempts have been made either to avoid mycotoxins from feed ingredients or add binders to the feed so that they could act in the animal guts. As a result, mycotoxins are undigested and expelled. On the other hand, mycotoxins could also be destroyed by enzymes in the guts. Specialized binders have to be effective in the gut environment, which is a small but vast microcosm world. The presence of other substances in diets, fish guts, and water also has effects. Therefore, two types of products were tested. The first objective of the present study was to test whether AFB1 contamination of 500 µg kg−1 could affect the performance of Nile tilapia. Other objectives of the study were to evaluate whether the commercial products used in livestock, namely, Organically Modified Clinoptilolite (OMC, Minazel Plus®, PATENT CO DOO., Misicevo, Republic of Serbia) and the multi-component mycotoxin detoxifying agent (MMDA, MycoRaid, Patent Co., Subotica, Serbia) [35,36,37,38,39] could improve the performance of aquatic animals such as tilapia being fed such AFB contamination levels.

2. Material and Methods

2.1. Experimental Fish and System

A 12-week trial was conducted using 18 glass aquaria at the Asian Institute of Technology (AIT), Bangkok, Thailand. All-male Nile tilapia (Oreochromis niloticus) fingerlings were sourced from the AIT tilapia hatchery for the trial. They had an adaptation period of one week in which they were fed a control diet three times daily until apparent satiation levels. On the 7th day, 15 fish were sampled for proximate analysis. The remaining acclimated fish (1.97 ± 0.01 g, mean ± SE) were distributed randomly at a rate of 50 fish per aquarium of 100 L capacity. All the aquaria were supplied with compressed air from an air pump and diffused through the air stones. Uneaten food and feces were collected daily by siphoning, reducing the water to 50%, then the water level was raised to the original level by adding new water. Dead fish, once they had appeared in aquaria, were recorded and removed.

2.2. Experimental Diet

A total of 30 kg (5 kg/treatment) of feed was prepared according to the formula shown in Table 1, mixed with different doses of supplements such as OMC, MMDA, and corn contaminated by AFB1 from PATENT CO DOO., Misicevo, Republic of Serbia. OMC contains organically modified natural clinoptilolite and MMDA is composed of modified zeolite (Clinoptilolite), Bacillus subtilis, Bacillus Licheniformis, Saccharomyces cerevisiae cell wall, and silymarin. Fish were fed the experimental diets to near satiation twice daily (08:30 h and 16:00 h) and feeding behaviors were observed. There were six treatments with three replications, which were named Treatments 1 to 6, i.e., T1 to T6, and were randomly allocated in 18 aquaria using a complete randomized design (CRD). Table 1 shows the ingredient composition to make a 1 kg diet for each treatment (T1 to T6) and the proximate composition of each diet. After preparing the diets, a sample of 1 kg of feed per treatment diet was sampled for the proximate analysis of moisture, ash, protein, lipid, and fiber.
The treatment groups were as below:
T1 = Control (C)
T2 = Control + OMC 2 g/kg (OMC)
T3 = Control + MMDA 2 g/kg (MMDA)
T4 = AFB1 0.5 mg/kg (AF)
T5 = AFB1 0.5 mg/kg + OMC 2 g/kg (AFOMC)
T6 = AFB1 0.5 mg/kg + MMDA 2 g/kg (AFMMDA)

2.3. Growth and Feed Utilization

The following parameters were analyzed and compared among the treatments:
Fish survival (%) = (Final fish number/Initial fish number) × 100.
Biomass gain = Final batch weight (g)—Initial batch weight (g).
Specific growth rate (SGR, %/day) = [Ln (Weight at harvest − [Ln (Weight at stocking)] × 100/no. of days.
Feed conversion ratio (FCR) = Feed intake (dry matter)/Wet weight gain.
Feed conversion efficiency (FCE) = Wet weight gain/Feed intake on a dry matter basis.
Protein efficiency ratio (PER) = Wet weight gain/Protein intake.

2.4. Proximate Analysis of Diets and Fish

Samples of the test diets and whole fish bodies from each treatment at the beginning and end of the experiment were taken, and the proximate composition, i.e., moisture, crude protein (CP), crude lipid (CL), crude fiber (CF), and total ash, was calculated in the Aquaculture Laboratory of AIT. The samples were dried in a hot-air oven at 105 °C until they reached a constant weight. The total ash was determined after combusting a dried sample in a muffle furnace at 550 °C. The Micro-Kjeldahl apparatus [40] was used to measure the nitrogen content, and the crude protein was calculated by multiplying the nitrogen content by 6.25. The Soxhlet method [41] was used to determine the total lipids. The crude fiber was analyzed following the Weende method using the Fibertec system [42]. Nitrogen-free extract (NFE) was estimated as the remaining content after deducting the crude protein, crude lipid, crude fiber, and ash from the total dry matter.

2.5. Histology Analysis

From each treatment, three fish, which were starved for 48 h, were sampled and dissected, and their intestine and liver samples were isolated, immediately fixed in a 10% formalin solution for 48 h, and then transferred to a 70% alcohol solution. The samples were then dehydrated in alcohol solutions placed in xylene and embedded in paraffin. Tissue blocks were then sectioned and stained with hematoxylin and eosin (H&E).

2.6. Blood Sampling

Five fish from each replicate group were randomly sampled after 12 weeks of the feeding trial. They were anesthetized using 60 mg/L of MS222 (Ethyl 3-aminobenzoate methane sulfonate). The fish were starved for 24 h before sampling. Blood samples were collected in a sterile syringe (1 mL) from the caudal vein of the sampled fish for hematological studies. The blood samples were then inserted into EDTA-coated tubes. The serum was separated from the blood after centrifuging at 3500 rpm for 15 min and stored at −20 °C until use. Blood samples were taken, recording their ages and sexes, and sent to the Thai Vet Lab Co., Ltd. to check CBC (cells blood count), Hematocrit, ALT (alanine aminotransferase), AST (Aspartate Aminotransferase), and LDH (Lactic acid dehydrogenase).

2.7. Water Quality Analysis

Water temperature and DO (dissolved oxygen) were recorded every two days at 08:30 h using a DO meter (HANNA, HI9147 model). pH was measured along with temperature using a pH meter. The ammoniacal-nitrogen concentration was analyzed weekly taking water samples using the Phenate method [43]. The experimental environment was controlled to maintain a 12:12 light: dark photoperiod cycle using a fluorescent tube light.

2.8. Bacterial Challenge Test

For the challenge test, Aeromonas hydrophila was isolated from infected Nile tilapia and freshly prepared in tryptone soya broth (TSB). The bacterial culture was incubated overnight at 25 °C and adjusted to 1 × 10⁸ CFU/mL in phosphate buffer saline (PBS). After the 10th week of the growing period, 10 fish were randomly sampled from each of the 18 aquaria for the bacterial challenge test to run for 14 days. Another set of 10 fish per aquarium (30 L) was continued in normal conditions without bacteria (mock-Infected). Each aquarium was stocked with those 10 fish (50.4 ± 3.31 g, mean weight ± SE). The volume of water was reduced to 10 L then A. hydrophila (1 × 10⁸ CFU/mL) prepared previously was added to each of the 18 aquaria for the challenge test in immersion. After those fish were kept for 3 h under bacterial challenge conditions, new water was added to increase the volume to 30 L in each aquarium. Fish in another set of 18 aquaria were subjected to the same protocol using only a 0.85% (w/v) NaCl solution without the bacteria. Mortality and the external appearance of fish were noted daily for 14 days. Dead fish were observed for the signs, recorded, and removed.

2.9. Data Analysis

Data were analyzed using a multi-factor ANOVA (analysis of variance) to determine the effects of factors, and regression to determine the cause-and-effect relationships. Pearson’s correlations were carried out to determine the associations between two variables, and Student’s t-test was used to compare two sample means with the help of Statistical Packages for Social Sciences (Ver. 22, SPSS Inc./IBM, Chicago, IL, USA). Differences and relationships were considered significant at 0.05. All means are given with ±1 standard error (SE).

3. Results

3.1. Performance during the Feeding Period

During the 70-day experimental period, the average survival of tilapia ranged from 50 to 82 %, but survival rates of the fish differ significantly (p < 0.05) among the treatments (Table 2). The group fed the diet containing MMDA had an approximately 16% (p < 0.05) higher survival rate compared to the Control but did not differ in the survival of fish in AFOMC and AFMMDA. Similarly, AFOMC and AFMMDA did not differ from the control and the treatment with OMC.
The multi-factor ANOVA showed MMDA had significant (p < 0.05) effects on the mean body weight of the fish. The initial mean weight of the fish was 1.97 ± 0.1 g but there was no significant (p > 0.05) difference. After 70 days, the weight of the fry ranged from 16.34 to 23.26 g but there was no significant difference (p > 0.05) in the final weight (FW), daily weight gain (DWG), weight gain (WG), and specific growth rate (SGR) during the experiment period (Table 2). However, there was an indication that MMDA had a positive effect on the growth observed when a biweekly growth curve was drawn. It showed that the fry fed the AFMMDA diet grew more (R2 = 0.97) than all the other groups after 6 weeks. However, all other diets except AFMMDA showed similar growth patterns with high R2 values ranging from 0.93 to 0.96. There were no signs of physical abnormalities and deformities found in any of the treatments during the experimental period. Feed conversion ratios (FCRs) were not significantly different (p > 0.05) among the treatments. The average FCR value was 1.21 ± 0.07. The average protein efficiency ratio (PER) was significantly (p < 0.05) higher in AFMMDA than in the Control and OMC. However, the protein efficiency ratio (PER) was significantly higher in AFMMDA than in the control, but all other treatments showed similar values. On the other hand, protein intake (PI) values were significantly (p < 0.05) higher in the Control and OMC compared to all other diets.

3.2. Proximate Analysis

Based on the proximate analysis, the average crude protein (CP) content of the feed was 35.75 ± 0.35% and there was no significant (p > 0.05) difference among the treatments. The control diet had an average of 35.76 ± 0.2% crude protein and 12.64 ± 0.6% crude lipid. Dry matter values differed among the treatments. Similar results were found in Nitrogen free extract (NFE) and gross energy (GE). NFE was significantly higher (p < 0.05) in MMDA (32.6 ± 0.5%) and AFOMC (31.9 ± 0.7%) diets as compared to the control treatment. Gross energy (GE) was significantly higher (p < 0.05) in AFMMDA compared to AFOMC; however, the ash did not differ significantly (p > 0.05) among the treatments. The detailed composition of all the experimental diets is shown in Table 1.
Proximate analysis (Table 1) of the whole body or carcass on a dry matter basis also showed that crude protein was significantly higher in OMC and MMDA than AFMMDA, but it was significantly higher than AF or AFOMC. There were no significant differences in carcass composition in terms of dry matter, ash, lipid, or gross energy (GE) among the treatments (Table 3).
Results showed that the treatments with OMC (without AFB1) and MMDA with or without AF had significantly higher crude protein values in the carcass as compared to the control, AFOMC, and AFB1 alone. The crude protein content of the carcass of the fish fed AFOMC was the lowest (58.3 ± 1.1) among all the treatments except the control. The ash content of the final fish body in the diets with MMDA was significantly higher as compared to the control (12.3 ± 1.5%) and only AFB1 diets (12.0 ± 0.8%). However, MMDA-included diets showed the highest ash amounts as compared to other treatments.
There was no clear visible damage to the eyes or liver; however, the obtained observation showed that there were some clear physical changes between the control and diet with AF. In particular, the AF diet showed reddish-colored skin, a sign of hemorrhages, possibly due to stress, when compared to the control (Figure 1).

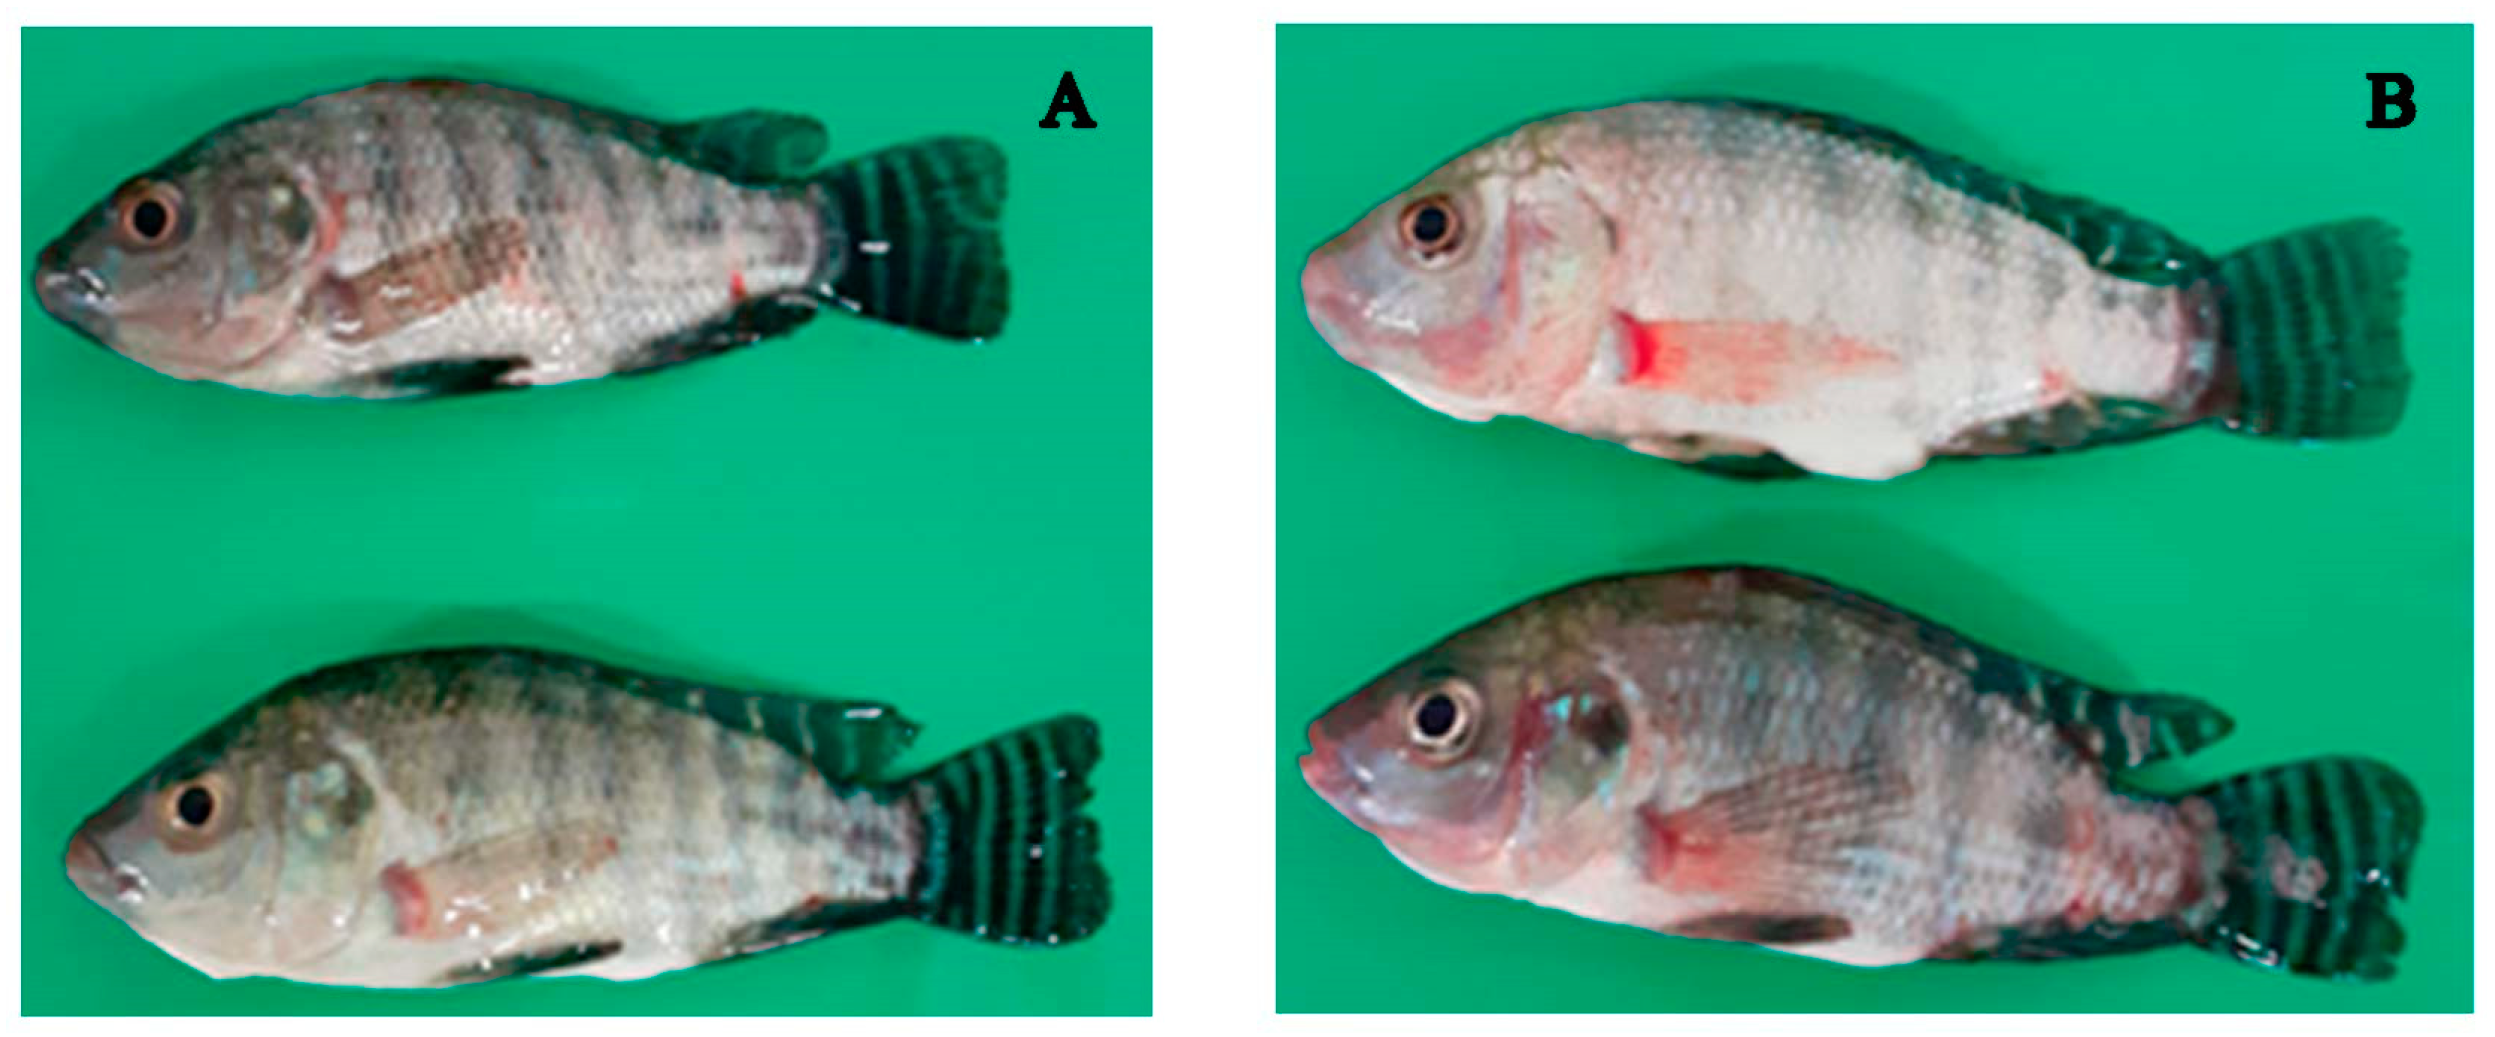
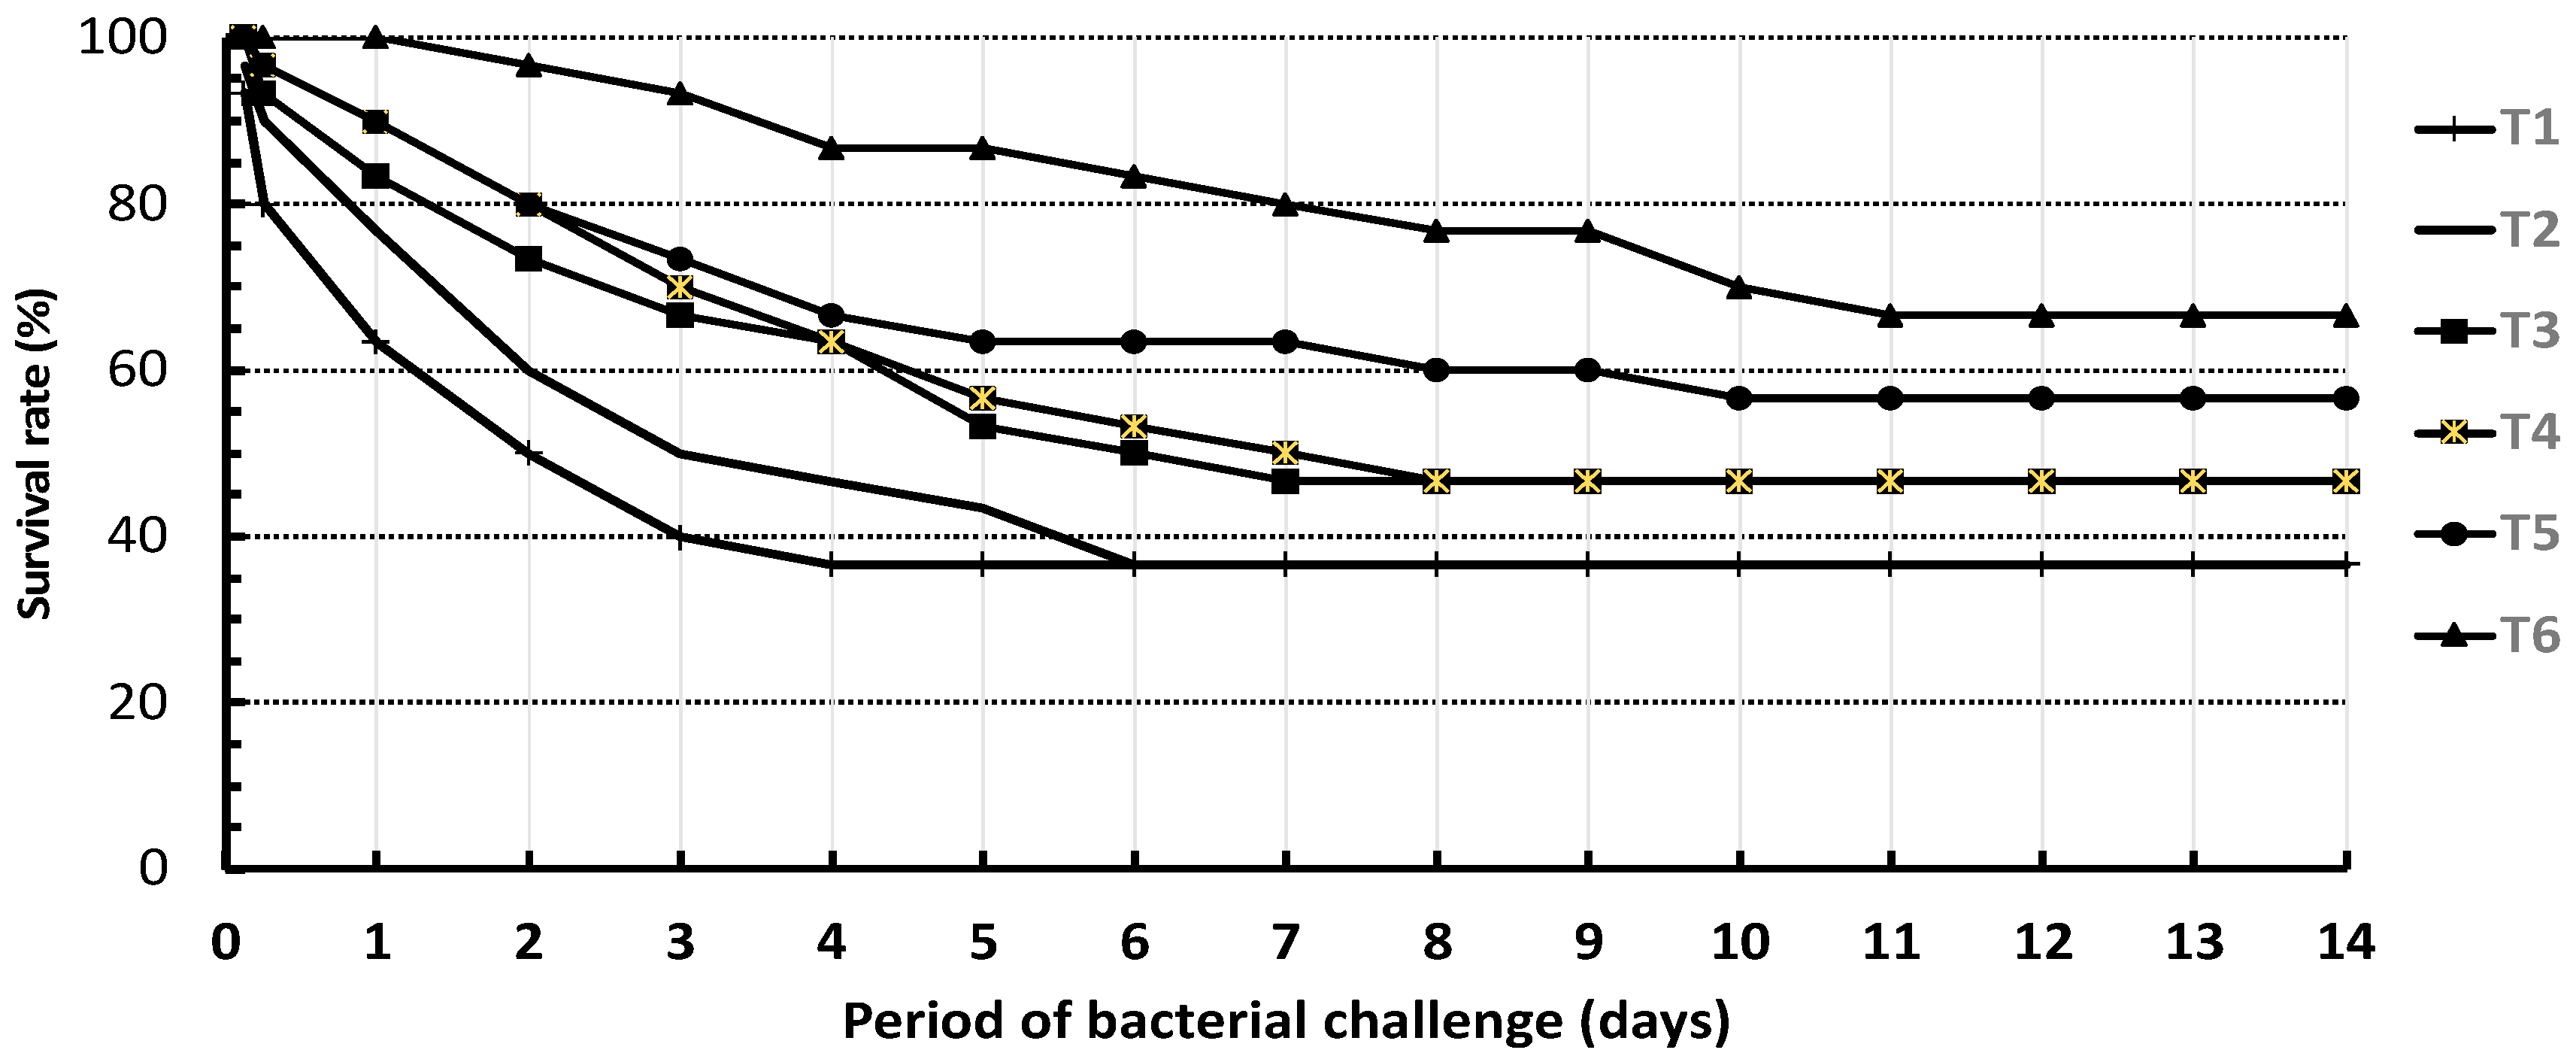
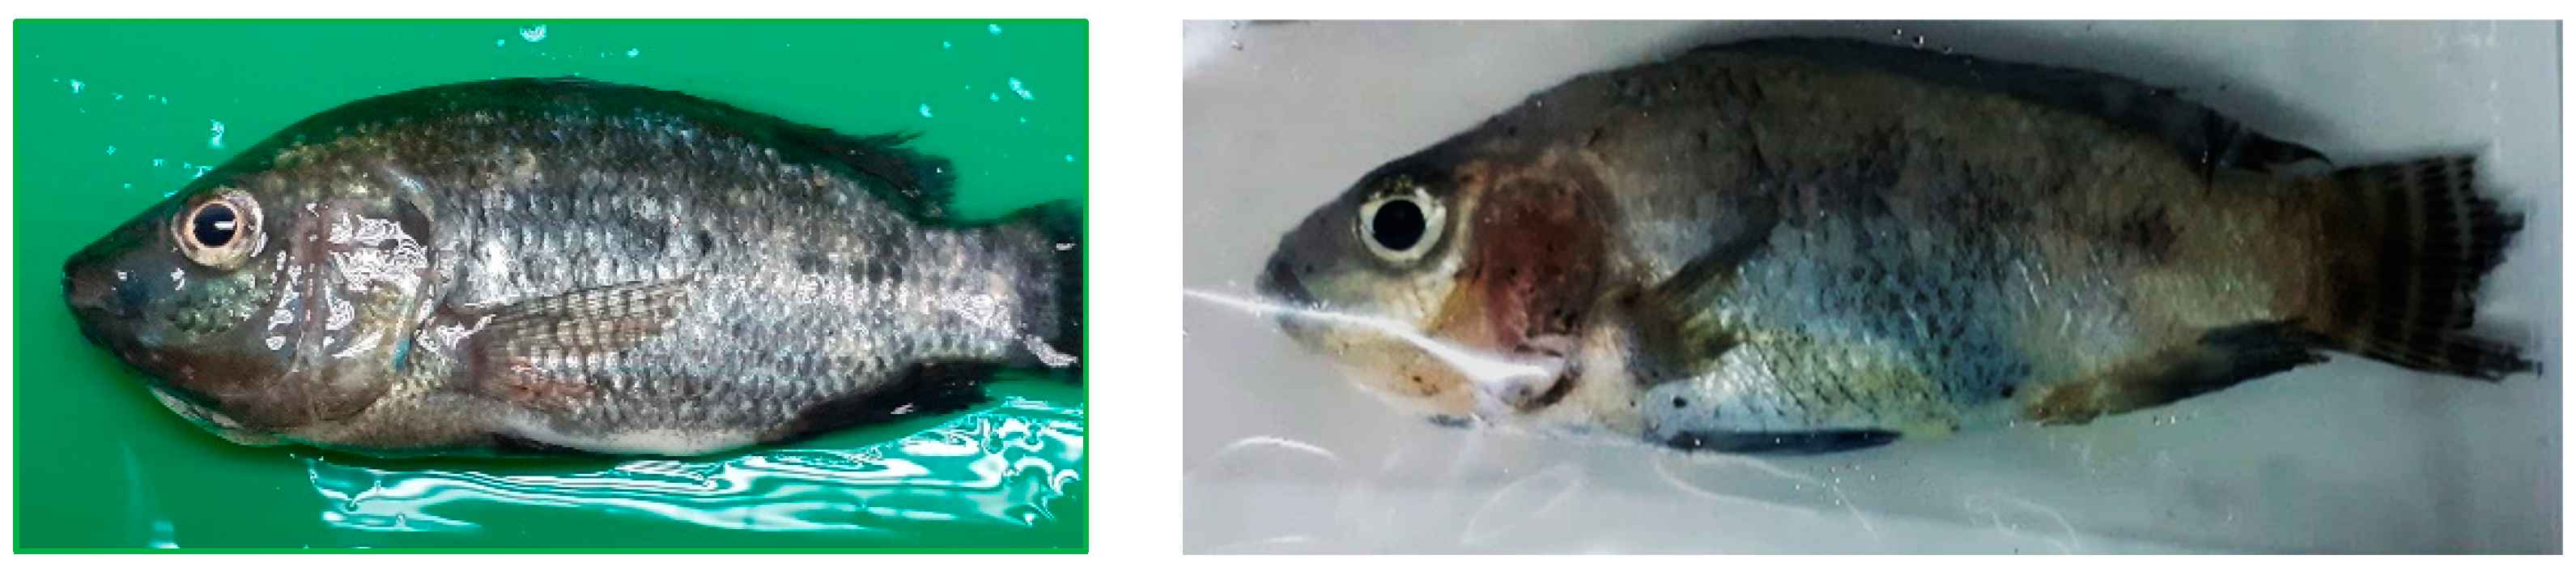
3.3. Bacterial Challenge Test with Aeromonas Hydrophila

The bacterial challenge test showed very clear effects on the survival or the mortality rate right from the 6th hour after exposure to A. hydrophila (Figure 2).
The survival rate dropped right from Day 1 and reached below 35% survival in the case of the control and OMC after Days 4 and 6, respectively, whereas AFMMDA maintained a survival rate above 80% until Day 6 and above 65% until it stabilized and maintained that level from the 13–14th days. The survival rate after the challenge between treatment groups and control is shown in Figure 2. With regards to the bacterial challenge, fish survival rates were significantly higher with the supplemented AFMMDA diet and AFOMC diet when compared with the Control treatment. Interestingly, when fish were not exposed to bacteria, survival remained high (>85%), and there was a clear sign of improved survival due to the supplementation of OMC and MMDA. Conversely, protein intake results were significantly higher in the control and OMC both with and without bacterial challenges. However, the specific growth rate (SGR), weight gain, daily weight gain (DWG), protein efficiency ratio (PER), and overall food conversion efficiency (FCE) did not show any differences between the challenge and non-challenge periods.
In all the groups challenged with bacteria, after 3 h of bacterial immersion, all fish became passive and often gathered in a corner of each aquarium. After 6 h, mortality started to occur. By the first day, the fish showed a reluctance to eat, reduced feed intake, and darkened skin. By the second day, focal hyperemia of the skin appeared over the pectoral fins. From the fourth day, fin rot was observed, especially on the tips of the pectorals and caudal fins. From day 6 until day 10 after the challenge, fish mortality decreased, and some fish may have been more tolerant as they started eating, but most of the fish had patches on the body, and fin rot and dark-colored skin were observed (Figure 3). From day 11 until day 15 after the challenge, fish skin became darker and fin rot was clearer. Interestingly, most of the remaining fish in AFMMDA were more tolerant (66.67 ± 8.82%) than other treatments, despite being challenged by A. hydrophila.

3.4. Hematological Results

No significant difference was found in the RBC (red blood cells), Hct (hematocrit), AST (Aspartate Aminotransferase), LDH (lactate dehydrogenase), and MCV levels among the treatment groups (p > 0.05). Conversely, the WBC of the OMC group was significantly (p < 0.05) lower (approximately half) as compared to the control and AFMMDA, but not different from the WBC of all the other treatments. Data on blood hematological parameters and serum sample parameters are shown in Table 4.

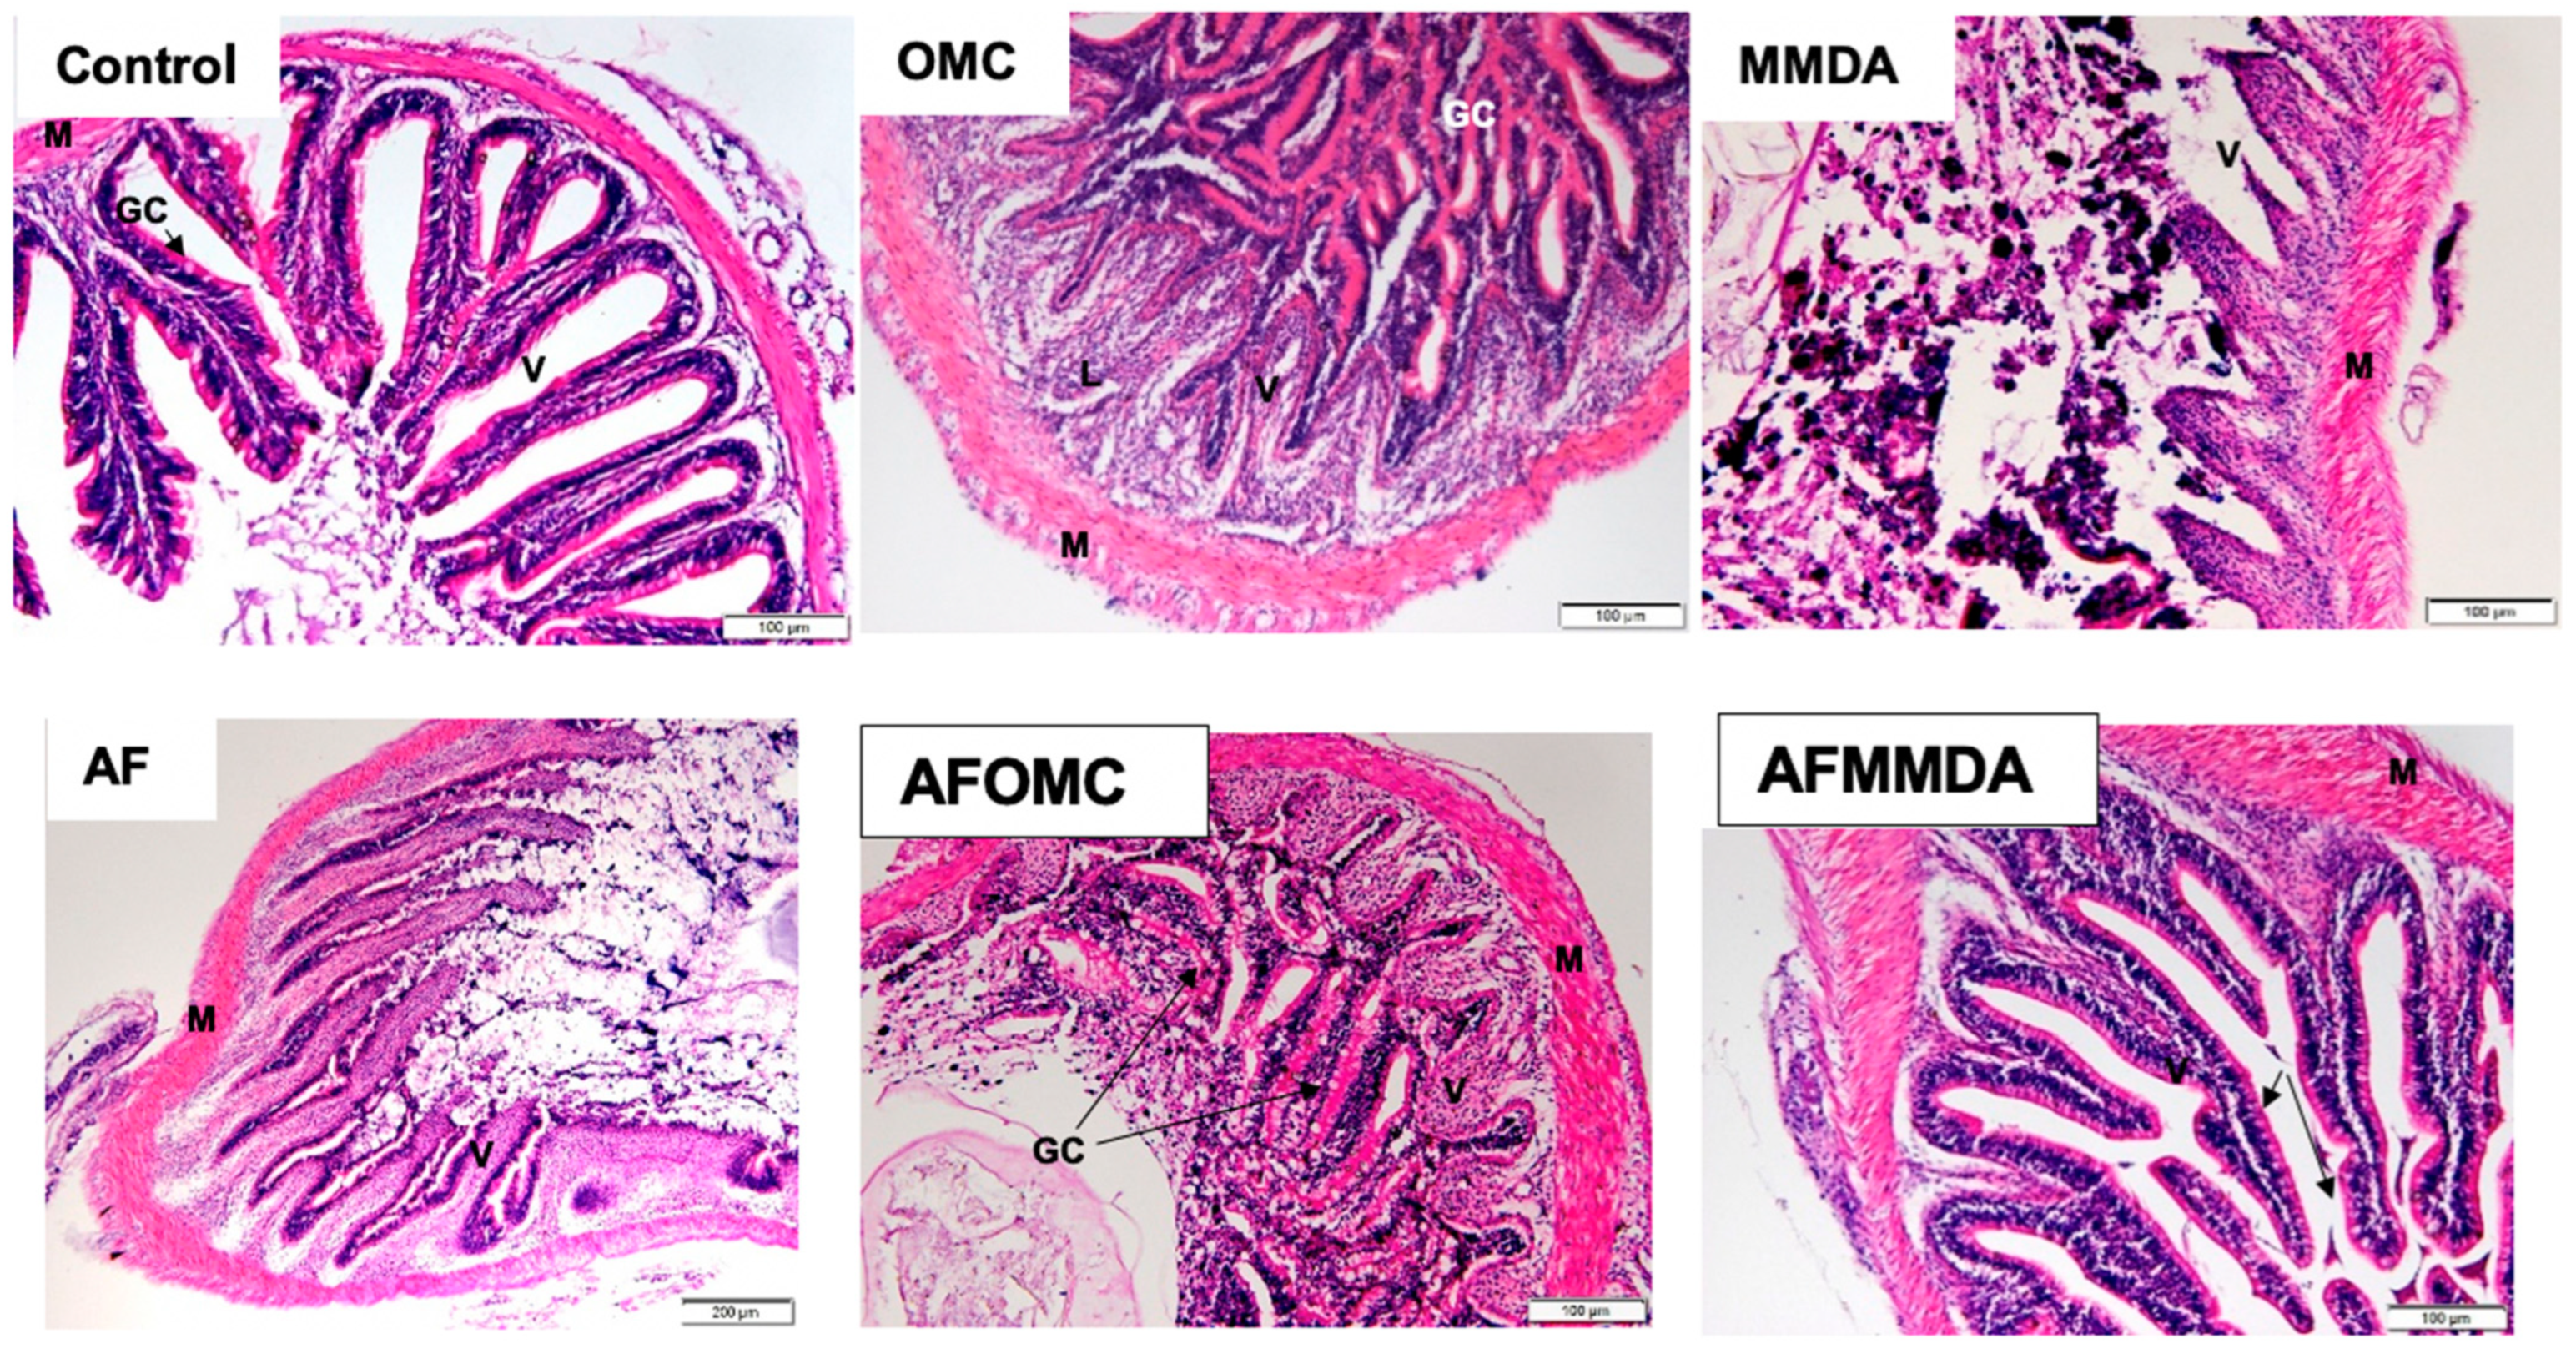
3.5. Histology Analysis of Intestine Samples

Results of the histology analysis (Table 5) of the intestine of fish showed that villus height (VH) was significantly higher in AFMMDA than in other treatments. Conversely, villus width (VW) was also significantly higher in AFMMDA than in the control (T1) and MMDA (T3). However, crypt depth (CD) was significantly higher in OMC than in AFOMC. Considering all the treatments, the MMDA-included diet showed significantly higher villus height, villus depth, and crypt depth values than the control. Similarly, the MMDA-included diet showed higher villus height and crypt depth values than the OMC-included diets. The goblet cell count was higher in the control treatment than in all others.
There were clear histological differences that characterized the intestines among the treatments. Histology of the intestine of OMC, MMDA, AF, and AFOMC showed some atrophy and necrosis of villi, while control and AFMMDA intestine samples showed an almost normal appearance of the villus (Figure 4).

3.6. Water Quality Results

Water temperature during the experimental period ranged from 28.0 to 28.4 °C with a 12:12 light: dark photoperiod cycle using fluorescent tubes as a light source. The dissolved oxygen concentration ranged from 6.18 to 6.40 mg/L, pH ranged from 7.68 to 7.74, and the ammonia-nitrogen concentration ranged from 0.51 to 0.81 mg/L. No significant (p > 0.05) differences were found in water quality parameters among the treatments. Therefore, all the water quality parameters were within acceptable ranges for fish.

4. Discussion

Nile Tilapia fingerlings used in the experiment fed 0.5 mg of AFB1 per kg of feed did not manifest clinical signs of exposure. During the first 10 weeks of the growth period in this study, the survival of tilapia ranged from 50–80% among the treatment replicates, which is normal in a recirculatory aquaculture system with a high-density culture. Furthermore, no significant differences were found when comparing OMC, MMDA, and AF. This indicates that fish culture conditions and the health of fish remained asymptomatic when AFB1 was applied up to 0.5 mg per kg of feed for up to 12 weeks among the treatments (AF, AFOMC, and AFMMDA).
Low growth performance with AFB1 has been reported in many species, such as Nile tilapia [30,35,44,45], grass carp [46], penaeid shrimps [9,11,47,48], rainbow trout [49,50,51], Gibel carp [52], and seabass [53]. During this trial period of 12 weeks, there were no adverse changes attributed to AFB1 exposure. Similar results were found when doses of 19, 85, 245, 638, 793, and 1641 μg/kg were used. Within the first 10 weeks, there was no significant difference in growth between the AFB1 groups. However, by the 15th week, they observed significant changes among the groups [30,54]. Thus, it can be concluded that the present research indicated that the dose of AFB1 (500 μg/kg diet) was rather low, and the period of exposure of 12 weeks was also too short to show the apparent effects on the growth performance and survival. Recent research has shown that AFB1 affects growth from the third month of exposure, especially when the dose was 2.0 mg/kg diet [54]. In a similar culture system of aquaria, other researchers used 2.5 mg of AFB1/kg diet [55]. Therefore, it is likely that OMC and MMDA did not have the opportunity to show their real effects on growth, appearance, and survival.
Growth and survival are the cumulative apparent effects of internal changes. Even though growth and survival are unnoticeable or unmeasurable, effects can be in internal organs and tissues. Conducting a 24-week trial using doses of 3.3, 22.3, and 1646.5 μg AFB1/kg diet, some researchers found a clear reduction in the gonado somatic index (GSI) and reduced fecundity in Gibel carp Carassius auratus gibelio) after the 20th week [52]. Therefore, the experimental period for the present experiment was possibly quite short. For such low AFB1 contamination levels and for periods lower than 12 weeks, the negative effects of AFB1 were possibly subclinical or were not observable. Some researchers have also reported that a low dose of AFB1 and a short experimental period may not be enough to show the symptoms and a longer period (15 weeks or more) experiment is needed to show the clear differences, especially in reproductive performance such as reduced GSI and fecundity [30,52,54].
The gross energy of feed was significantly higher in the AFMMDA diet, and it also showed a higher amount of ash and protein in the fish carcass. Interestingly, the fish protein efficiency ratio (PER) was also significantly higher in the diet with AFMMDA as compared to the control. A higher amount of ash in the carcass reflects a higher amount of minerals in the fish body that might help to improve fish metabolism as well as immunity [50].
When the fish are exposed to lower concentrations of mycotoxins, they might adapt easily and gradually or symptoms of AFB1 may appear, but they might have been subclinical or have been confused with the symptoms of bacterial infection such as A. hydrophila or others [56] as in the case of bacterial challenge groups. During the bacterial challenge test, all the fish in each tank became passive and often gathered in a corner of the aquarium after 3 h of bacterial exposure. Mortality started to occur after 6–12 h. By the first day, darkening of the skin, reluctance to eat, and decreased feed intake were seen. By the second day, focal hyperemia of the skin appeared over the pectoral fins. From the fourth day, fin rot especially on the tips of the pectoral and caudal fins was observed. From day 6 until day 10 during the challenge test, fish mortality decreased, and some fish might have been more tolerant as they started eating, but most of the fish had patches in the body and skin had a reddish color (Figure 3). From day 11 until day 15, during the challenge, fish skin became darker and fin rot was clearer. Similarly, confusion occurred in salmonids with Yersinia ruckeri [57]. Interestingly, most of the remaining fish with the AFMMDA treatment were more tolerant (66.67 ± 8.82%) than the fish in other treatments despite having been challenged by A. hydrophila.
Hematological results with and without OMC and MMDA showed significant differences in WBC, i.e., associated with immunity. WBC and the survival of fish in experimental treatment with OMC were significantly lower than in AFMMDA, indicating that MMDA has some positive effects on immunity. Nonetheless, treatment with AFMMDA, despite being fed with AFB1, did not show any decrease in WBC when compared to the control group. This might indicate that MMDA successfully inhibited the immunosuppressive effects of AFB1 and/or improved the immune status of tilapia. High levels of ALT and AST might be the result of fish liver necrosis and compromised membrane permeability [14,55]. Histological studies showed that the MMDA with AFB1 diet had clear positive changes in villus height and villus width when compared to the control. The higher villi height and width contribute to a significant increase in the surface area available to absorb nutrients, explaining the better performance of this treatment. Diets T2–T5-related samples showed atrophy and necrosis of villi. The intestinal damage can negatively affect the absorption of nutrients and reduce the growth performance of fish [45,58].

5. Conclusions and Recommendations

During the trial, the average survival of tilapia was relatively low in the case of tilapia, which is considered to be a hardy fish. It ranged from 58.7 to 76.7%. MMDA improved survival compared to the control indicating that it has positive effects. Although OMC did not show such effects on survival, the protein efficiency ratio (PER) increased because of both, i.e., MMDA and OMC. Higher survival of the fish that were exposed to AFB1 was maintained even during the 6th to 14th days of exposure due to OMC and MMDA treatments, after the bacterial challenge test with Aeromonas hydrophila and the histology of intestinal villi of the fish, which indicated that these adsorbents enhanced immune response and performance parameters. In addition, both the mycotoxin adsorbents enhanced the final crude protein of the carcass and ash when compared to the control and AFB1-included diets. Therefore, supplementation of MMDA and OMC in feed is recommended. However, more and longer-period research is needed to further investigate.

Author Contributions

Conceptualization, N.T. and M.V.; funding acquisition: M.V.; methodologies: N.T. and R.A.G.; editing, J.R.; Resources, A.D.P.; data curation and original draft preparation Project administration, supervision, data analysis and manuscript review, R.C.B. All authors have read and agreed to the published version of the manuscript.

Funding

The present research was sponsored by Patent Co Doo, 24 211 Mišićevo, Republic of Serbia.

Data Availability Statement

Detailed data that support the findings of this study will be available upon request to the corresponding author.

Acknowledgments

The experiment was conducted in the facilities of aquaculture program at the AIT, Bangkok, Thailand.

Conflicts of Interest

All the authors declare no conflict of interest. The paper has not been submitted to any other journal.

References

  1. Davis, D.A.; Sookying, D. Strategies for reducing and/or replacing fishmeal in production diets for the Pacific white shrimp, Litopenaeus vannamei. In The Rising Tide, Proceedings of the Special Session on Sustainable Shrimp Farming; Browdy, C.L., Jory, D.E., Eds.; World Aquaculture: Baton Rouge, LA, USA, 2019; pp. 108–114. [Google Scholar]
  2. Magbanua, T.O.; Ragaza, J.A. Selected dietary plant-based proteins for growth and health response of Nile tilapia. Oreochromis niloticus. Aquac. Fish 2022. [Google Scholar] [CrossRef]
  3. Krogdahl, A.; Penn, M.; Thorsen, J.; Refstie, S.; Bakke, A.M. Important antinutrients in plant feedstuffs for aquaculture: An update on recent findings regarding responses in salmonids. Aquac. Res. 2010, 41, 333–344. [Google Scholar] [CrossRef]
  4. Bhujel, R.C. Mycotoxins in Feed—An Underestimated Challenge for the Aquafeed Industry. 2021. Available online: https://mycotoxinsite.com/mycotoxins-feed-underestimated-challenge-aquafeed-industry/?lang=en&fbclid=IwAR1LawrpbuSoMu8eFRYgTeer-gOWTx9WTLJgTlZXkeZV7HrnqFF9k7jeIos (accessed on 12 February 2023).
  5. Eskola, M.; Kos, G.; Elliott, C.T.; Sultan Mayar, J.H.; Krska, R. Worldwide contamination of food-crops with mycotoxins: Validity of the widely cited ‘FAO estimate’ of 25%. Crit. Rev. Food Sci. Nutr. 2020, 60, 2773–2789. [Google Scholar] [CrossRef] [PubMed]
  6. Nogueira, W.V.; de Oliveira, F.K.; Sibaja, K.V.M.; Garcia, S.D.O.; Kupski, L.; Souza, M.M.D.; Tesser, M.B.; Garda-Buffon, J. Occurrence and bioaccessibility of mycotoxins in fish feed. Food Addit. Contam. Part B Surveill. 2020, 13, 244–251. [Google Scholar] [CrossRef] [PubMed]
  7. Rodrigues, K.; Naehrer, K. A three-year survey on the worldwide occurrence of mycotoxins in feedstuffs and feed. Toxins 2012, 4, 663–675. [Google Scholar] [CrossRef]
  8. Gonçalves, R.A.; Schatzmayr, D.; Albalat, A.; Mackenzie, S. Mycotoxins in aquaculture: Feed and food. Rev. Aquac. 2020, 12, 145–175. [Google Scholar] [CrossRef]
  9. Goncalves, R.A.; Schatzmayr, D.; Hofstetter, U.; Santos, G.A. Occurrence of mycotoxins in aquaculture: Preliminary overview of Asian and European plant ingredients and finished feeds. World Mycotoxin J. 2017, 10, 183–194. [Google Scholar] [CrossRef]
  10. Gonçalves, R.A.; Naehrer, K.; Santos, G.A. Occurrence of mycotoxins in commercial aquafeeds in Asia and Europe: A real risk to aquaculture? Rev. Aquac. 2016, 10, 263–280. [Google Scholar] [CrossRef]
  11. García-Pérez, O.D.; Tapia-Salazar, M.; Nieto-López, M.G. Effects of conjugated linoleic acid and curcumin on growth performance and oxidative stress enzymes in juvenile Pacific white shrimp (Litopenaeus vannamei) feed with aflatoxins. Aquac. Res. 2020, 51, 1051–1060. [Google Scholar] [CrossRef]
  12. Michelin, E.C.; Massocco, M.M.; Godoy, S.H.S.; Baldin, J.C.; Yasui, G.S.; Lima, C.G. Carryover of aflatoxins from feed to lambari fish (Astyanax altiparanae) tissues. Food Addit. Contam. Part A 2017, 34, 265–272. [Google Scholar] [CrossRef]
  13. Hussein, H.S.; Brasel, J.M. Toxicity, metabolism and impact of mycotoxins on humans and animals. Toxicol. Appl. Pharmacol. 2001, 167, 101–134. [Google Scholar] [CrossRef] [PubMed]
  14. El-Sayed, Y.S.; Khalil, R.H. Toxicity, biochemical effects and residue of aflatoxin B1 in marine water-reared sea bass (Dicentrarchus labrax L.). Food Chem. Toxicol. 2009, 47, 1606–1609. [Google Scholar] [CrossRef] [PubMed]
  15. Hooft, J.M.; Elmor, A.; Ibraheem, E.H.; Encarnação, P.; Bureau, D.P. Rainbow trout (Oncorhynchus mykiss) is extremely sensitive to the feed-borne Fusarium mycotoxin deoxynivalenol (DON). Aquaculture 2011, 311, 224–232. [Google Scholar] [CrossRef]
  16. McKean, C.; Tang, L.; Tang, M.; Billam, M.; Wang, Z.; Theodorakis, C.W.; Kendall, R.J.; Wang, J.S. Comparative acute and combinative toxicity of aflatoxin B1 and fumonisin B1 in animals and human cells. Food Chem. Toxicol. 2006, 44, 868–876. [Google Scholar] [CrossRef] [PubMed]
  17. CAST (Council of Agriculture and Technology). Mycotoxins: Risks in Plant, Animal and Human Systems; Task Force Report 139; CAST: Ames, IA, USA, 2003; pp. 1–199. [Google Scholar]
  18. Shane, S.H.; Eaton, D.L. Economic issues associated with aflatoxins. In Toxicology of Aflatoxins: Human Health, Veterinary, and Agricultural Significance; Academic Press: San Diego, CA, USA, 1994; pp. 513–527. [Google Scholar]
  19. Vasanthi, S.; Bhat, R.V. Mycotoxins in foods-occurrence, health & economic significance & food control measures. Ind. J. Med. Res. 1998, 108, 212–224. [Google Scholar]
  20. Kabak, B.; Dobson, A.D.; Var, I. Strategies to prevent mycotoxin contamination of food and animal feed: A review. Food Sci. Nutr. 2006, 46, 593–619. [Google Scholar] [CrossRef]
  21. Leung, M.C.K.; Díaz-Llano, G.; Smith, T.K. Mycotoxins in pet food: A review on worldwide prevalence and preventative strategies. J. Agric. Food Chem. 2006, 54, 9623–9635. [Google Scholar] [CrossRef]
  22. FAO. The State of Aquaculture and Fisheries—Towards Blue Revolution; FAO: Rome, Italy, 2022; pp. 1–236. [Google Scholar] [CrossRef]
  23. Martínez-Cordero, F.J.; Delgadillo, T.S.; Sanchez-Zazueta, E.; Cai, J. Tilapia Aquaculture in Mexico: Assessment with a Focus on Social and Economic Performance; FAO Fisheries and Aquaculture Circular No. 1219; FAO: Rome, Italy, 2021. [Google Scholar]
  24. Norman-López, A.; Bjørndal, T. Markets for Tilapia Globefish Research Programme; FAO: Rome, Italy, 2010; pp. 1–37. [Google Scholar]
  25. Pietsch, C.; Kersten, S.; Burkhardt-Holm, P.; Valenta, H.; Danicke, S. Occurrence of deoxynivalenol and zearalenone in commercial fish feed: An initial study. Toxins 2013, 5, 184. [Google Scholar] [CrossRef]
  26. Dirican, S. A review of effects of aflatoxins in aquaculture. Appl. Res. J. 2015, 1, 192–196. [Google Scholar]
  27. Santacroce, M.; Conversano, M.C.; Casalino, E.; Lai, O.; Zizzadoro, C.; Centoducati, G.; Crescenzo, G. Aflatoxins in aquatic species: Metabolism, toxicity and perspectives. Rev. Fish. Biol. Fish. 2008, 18, 99–130. [Google Scholar] [CrossRef]
  28. Anh Tuan, N.; Grizzle, J.M.; Lovell, R.T.; Manning, B.B.; Rottinghaus, G.E. Growth and hepatic lesions of Nile tilapia (Oreochromis niloticus) fed diets containing aflatoxin B1. Aquaculture 2002, 212, 311–319. [Google Scholar] [CrossRef]
  29. Chávez-Sánchez, M.C.; Martínez Palacios, C.A.; Osorio, M.I. Pathological effects of feeding young Oreochromis niloticus diets supplemented with different levels of aflatoxin B1. Aquaculture 1994, 127, 49–60. [Google Scholar] [CrossRef]
  30. Deng, S.-X.; Tian, L.-X.; Liu, F.-J.; Jin, S.-J.; Liang, G.-Y.; Yang, H.-J. Toxic effects and residue of aflatoxinAFB1 B1 in tilapia (Oreochromis niloticus & O. aureus) during long-term dietary exposure. Aquaculture 2010, 307, 233–240. [Google Scholar]
  31. Hassan, A.M.; Kenawy, A.M.; Abbas, W.T.; Abdel-Wahhab, M.A. Prevention of cytogenetic, histochemical and biochemical alterations in Oreochromis niloticus by dietary supplement of sorbent materials. Ecotoxicol. Environ. Saf. 2010, 73, 1890–1895. [Google Scholar] [CrossRef]
  32. Hendricks, J.D. Carcinogenicity of aflatoxins in nonmammalian organisms. In Toxicology of Aflatoxins: Human Health, Veterinary, and Agricultural Significance; Eaton, D.L., Groopman, J.D., Eds.; Academic Press: San Diego, CA, USA, 1994. [Google Scholar]
  33. El-Banna, R.; Teleb, H.M.; Hadi, M.M.; Fakhry, F.M. Performance and tissue residue of tilapias fed dietary aflatoxin. Vet. Med. J. 1992, 40, 17–23. [Google Scholar]
  34. Tuan, N.A.; Manning, B.B.; Lovell, R.T.; Rottinghaus, G.E. Responses of Nile tilapia (Oreochromis niloticus) fed diets containing different concentrations of moniliformin or fumonisin B1. Aquaculture 2003, 217, 515–528. [Google Scholar] [CrossRef]
  35. Raj, J.; Farkaš, H.; Jakovčević, Z.; Medina, A.; Magan, A.; Čepela, R.; Vasiljević, M. Comparison of multiple mycotoxins in harvested maize samples in three years (2018–2020) on four continents. Food Addit. Contam. Part A 2022, 39, 599–608. [Google Scholar] [CrossRef]
  36. Raj, J.; Vasiljević, M.; Farkaš, H.; Bošnjak-Neumüller, J.; Männer, K. Effects of a modified clinoptilolite zeolite on growth performance, health status and detoxification of aflatoxin B1 and ochratoxin A in male broiler chickens. Br. Poult. Sci. 2021, 62, 601–610. [Google Scholar] [CrossRef]
  37. Riahi, I.; Ramos, A.J.; Raj, J.; Jakovčević, Z.; Farkaš, H.; Vasiljević, M.; Pérez-Vendrell, A.P. Effect of a mycotoxin adsorbent (MMDA) on the growth performance, blood and carcass characteristics of broilers fed ochratoxin A and T-2 mycotoxin contaminated diets. Animals 2021, 11, 3205. [Google Scholar] [CrossRef]
  38. Kaya, D.; Genc, E.; Palić, D.; Genc, M.A.; Todorović, N.; Sevgili, H.; Vasiljević, M.; Kanyılmaz, M.; Guroy, D. Effect of dietary modified zeolite (clinoptilolite) on growth performance of gilthead sea bream (Sparus aurata) in the recirculating aquaculture system. Aquac. Res. 2021. [Google Scholar] [CrossRef]
  39. Vasiljevic, M.; Marinković, D.; Milicević, D.; Pleadin, J.; Stefanović, S.; Trialovic, S.; Raj, J.; Petrujkic, B.; Trialovic, J.N. Efficacy of a modified clinoptilolite based adsorbent in reducing detrimental effects of ochratoxin A in laying hens. Toxins 2021, 13, 469. [Google Scholar] [CrossRef] [PubMed]
  40. Tecator Manual, Tecator Kjeldahl Method800. Manual for Nitrogen/Protein Analysis. 1987. Available online: https://byjus.com/chemistry/kjeldahl-method/ (accessed on 12 February 2023).
  41. T43ecator Manual, 1980. Fat determination by solvent extraction with Soxtec System. Available online: https://www.labmakelaar.com/fjc_documents/tecator-soxtec-vetbepaling-manual1.pdf (accessed on 12 February 2023).
  42. Tecator Manual, 1978. Fibertec™ 1023—Semi-Automatic Crude Fiber Analyzer. Available online: https://www.fossanalytics.com/en/products/fibertec1023 (accessed on 12 February 2023).
  43. American Public Health Association; American Water Works Association; Water Pollution Control Federation. Standard Methods for the Examination of Water and Wastewater, 18th ed.; APHA: Washington, DC, USA, 1992. [Google Scholar]
  44. Hussain, D.; Mateen, A.; Gatlin, D.M. Alleviation of aflatoxin B 1 (AFB1) toxicity by calcium bentonite clay: Effects on growth performance, condition indices and bioaccumulation of AFB1 residues in Nile tilapia (Oreochromis niloticus). Aquaculture 2017, 475, 8–15. [Google Scholar] [CrossRef]
  45. Zahran, E.; Risha, E.; Hamed, M.; Ibrahim, T.; Palić, D. Dietary mycotoxicosis prevention with modified zeolite (Clinoptilolite) feed additive in Nile tilapia (Oreochromis niloticus). Aquaculture 2020, 115, 734562. [Google Scholar] [CrossRef]
  46. Zeng, Z.; Jiang, W.; Wu, P.; Liu, Y.; Zeng, Y.; Jiang, J.; Kuang, S.; Tang, L.; Zhou, X.; Feng, L. Dietary aflatoxin B1 decreases growth performance and damages the structural integrity of immune organs in juvenile grass carp (Ctenopharyngodon Idella). Aquaculture 2019, 500, 1–17. [Google Scholar] [CrossRef]
  47. Bautista, M.; Lavilla-Pitogo, C.; Subosa, P.; Begino, E. Aflatoxin B1 contamination of shrimp feeds and its effect on growth and hepatopancreas and pre-adult Penaeus monodon. J. Sci. Food Agric. 1994, 65, 5–11. [Google Scholar] [CrossRef]
  48. Jamshidizadeh, S.; Amrollahi Biuki, N.; Yousefzadi, M.; Aramideh, A. Response of Pacific white leg shrimp (Litopenaeus vannamei) on exposure to aflatoxin in feed. Aquac. Res. 2019, 50, 1973–1984. [Google Scholar] [CrossRef]
  49. Alinezhad, S.; Tolouee, M.; Kamalzadeh, A.; Motalebi, A.A.; Nazeri, M.; Yasemi, M. Mycobiota and AFB1 contamination of rainbow trout (Oncorhinchus mykiss) feed with emphasis to Aspergillus section Flavi. Iran. J. Fish. Sci. 2011, 10, 363–374. [Google Scholar]
  50. Greco, M.; Pardo, A.; Pose, G. Mycotoxigenic fungi and natural co-occurrence of mycotoxins in rainbow trout (Oncorhynchus mykiss) feeds. Toxins 2015, 7, 4595–4609. [Google Scholar] [CrossRef]
  51. Martínez, M.P.; Pereyra, M.L.G.; Juri, M.G.F.; Poloni, V.; Cavaglieri, L. Probiotic characteristics and aflatoxin B1 binding ability of Debaryomyces hansenii and Kazaschtania exigua from rainbow trout environment. Aquac. Res. 2018, 49, 1588–1597. [Google Scholar] [CrossRef]
  52. Huang, Y.; Han, D.; Xiao, X.; Zhu, X.; Yang, Y.; Jin, J.; Chen, Y.; Xie, S. Effect of dietary aflatoxin B1 on growth, fecundity and tissue accumulation in gibel carp during the stage of gonad development. Aquaculture 2014, 428–429, 236–242. [Google Scholar] [CrossRef]
  53. Almeida, I.F.M.; Martins, H.M.L.; Santos, S.M.O.; Freitas, M.S.; da Costa, J.M.G.N.; d’Almeida Bernardo, F.M. Microbiota and AFB1 in feed for farmed sea bass (Dicentrarchus labrax). Toxins 2011, 3, 163–171. [Google Scholar] [CrossRef] [PubMed]
  54. Marijani, E.; Charo-Karisa, H.; Gnonlonfin, G.J.B.; Kigadye, E.; Okoth, S. Effects of aflatoxin B1 on reproductive performance of farmed Nile tilapia. Int. J. Vet. Sci. Med. 2019, 7, 35–42. [Google Scholar] [CrossRef] [PubMed]
  55. Abdel-Daim, M.A.; Dawood, M.A.O.; AlKahtane, A.A.; Abdeen, A.; Abdel-Latif, H.M.R.; Senous, H.H.; Aleya, L.; Alkahtani, S. Spirulina platensis mediated the biochemical indices and antioxidative function of Nile tilapia (Oreochromis niloticus) intoxicated with aflatoxin b1. Toxicon 2020, 184, 152–157. [Google Scholar] [CrossRef] [PubMed]
  56. Yardimci, B.; Aydin, Y. Pathological findings of experimental Aeromonas hydrophila infection in Nile tilapia (Oreochromis niloticus). A letter to the editor. Ankara Universitesi Veteriner Fakultesi Dergisi 2011, 58, 47–54. [Google Scholar] [CrossRef]
  57. Tobback, E.; Decostere, A.; Hermans, K.; Haesebrouck, F.; Chiers, K. Yersinia ruckeri infections in salmonid fish. J. Fish Dis. 2007, 30, 257–268. [Google Scholar] [CrossRef] [PubMed]
  58. Mehrim, A.I.; Abdelhamid, A.M.; Shosha, A.A.M.; Salem, M.F.I.; El-Sharawy, M.A.M.M. Nutritious attempts to detoxify aflatoxic diets of tilapia fish 2-clinical, biochemical, and histological parameters. J. Arabian Aquac. Soc. 2006, 1, 69–90. [Google Scholar]
Figure 1. Physical changes in Nile tilapia between control (A) and diet with AF (B).
Aquacj 03 00007 g001
Figure 2. Survival (%) of tilapia after being challenged by A. hydrophila.
Aquacj 03 00007 g002
Figure 3. Clinical findings (patches and dark-colored skin (left), fin rot (right) during the challenge with Aeromonas hydrophila.
Aquacj 03 00007 g003
Figure 4. Histopathological view of the intestine of control and treated groups; control shows apparently normal structures of villi; OMC had atrophy and necrosis of villi; MMDA showed atrophy and necrosis of villi; AF shows necrosis of villi; AFOMC had atrophy and necrosis of villi and AFMMDA had normal structure of villi. M = Muscle layer, GC = Goblet cells, V = Villi.
Aquacj 03 00007 g004
Table 1. Ingredients (g/1000 g based on dry diets) and chemical composition (% on dry matter basis) of the experimental diets.
IngredientsCOMCMMDAAFAFOMCAFMMDA
FM150150150150150150
SB460460460460460460
CF72707044.653.353.3
Corn-AFB100027.316.616.6
RB200200200200200200
Cassava505050505050
Canola oil404040404040
Vitamin C151515151515
Mineral mix **101010101010
Vitamin mix *333333
OMC020020
NOMC002002
Total weight/g100010001000100010001000
Proximate composition
DM (%)95.6 b ± 0.095.0 c ± 0.196.5 a ± 0.196.5 a ± 0.195.0 c ± 0.094.6 c ± 0.1
Ash (%)24.4 ± 0.123.8 ± 0.224.2 ± 0.824.4 ± 0.223.9 ± 0.724.6 ± 0.5
Lipid (%)12.6 b ± 0.68.8 a ± 0.38.2 a ± 0.17.9 a ± 0.17.9 a ± 0.112.8 b ± 0.7
Protein (%)35.8 ± 0.235.9 ± 0.335.5 ± 0.336.0 ± 0.235.8 ± 0.635.5 ± 0.4
NFE (%)26.8 a ± 0.630.3 ab ±1.432.6 b ± 0.531.1 ab ± 0.531.9 b ± 0.729.6 ab ± 1.9
GE kcal/kg4317 ab ± 384102 ab ± 634122 ab ± 444065 a ± 264082 ab ± 204434 b ± 165
FM = Fishmeal; SB = soyabean; CF = corn flour; RB = Rice bran; OMC = Minazel-Plus; NOMC = New Mycotoxin Adsorbent; AFB1B1 = AFB1; * Vitamin premix (IU or mg/kg of diet): Vitamin A, 500,000 IU; vitamin D3, 100,000 IU; vitamin E, 10,000 IU; vitamin K, 800 mg; vitamin B 1250 mg; vitamin B2, 1200 mg; vitamin B6, 750 mg; vitamin B12, 5 mg; vitamin B5, 3000 mg; vitamin B3, 2150 mg; biotin, 25 mg; folic acid, 300 mg; inositol, 25,000 mg; Selenium, 30 mg; Iron, 20,000 mg; Zinc, 32,000 mg; Copper, 2000 mg. ** Mineral premix (g/kg of diet): Calcium biphosphate, 20 g; sodium chloride, 2.6 g; potassium chloride, 5 g; magnesium sulphate, 2 g; ferrous sulphate, 0.9 g; zinc sulphate, 0.06 g; cupric sulphate, 0.02 g; manganese sulphate, 0.03 g; sodium selenite, 0.02 g; cobalt chloride, 0.05 g; potassium iodide, 0.004 g. DM = Dry matters (%), GE = gross energy. Nitrogen free extract (NFE) = 100 − (crude protein % + crude lipid% + crude fiber %+ total ash %). Mean values (±SE) with the different superscripts within each row are significantly (p < 0.05) different.
Table 2. Growth, survival, and feed conversion of Nile tilapia.
ParametersGrowth, Survival and Feed Conversion
Control OMCMMDAAFAFOMCAFMMDA
IW (g)1.98 a ± 0.011.95 a ± 0.031.97 a ± 0.021.98 a ± 0.011.96 a ± 0.021.96 a ± 0.02
FW (g)18.8 a ± 1.5919.2 a ± 1.419.8 a ± 2.018.2 a ± 0.118.2 a ± 0.620.8 a ± 1.2
WG (g/fish)16.84 a ± 1.417.27 a ± 1.317.79 a ± 2.016.22 a ± 0.816.21 a ± 0.618.83 a ± 1.2
Survival (%)58.7 a ± 5.261.0 a ± 2.574.7 b ± 2.976.7 b ± 2.972.0 ab ± 3.568.7 ab ± 3.7
FCR1.24 a ± 0.11.22 a ± 0.11.18 a ± 0.11.29 a ± 0.11.32 a ± 0.01.21 a ± 0.1
FCE0.48 a ± 0.10.82 a ± 0.00.86 a ± 0.10.78 a ± 0.00.76 a ± 0.00.84 a ± 0.1
PER3.4 a ± 0.43.2 a ± 0.14.4 ab ± 0.34.0 ab ± 0.24.3 ab ± 0.24.8 b ± 0.4
SGR3.21 a ± 0.13.26 a ± 0.113.28 a ± 0.143.16 a ± 0.63.18 a ± 0.13.37 a ± 0.1
PI5.0 b ± 0.15.2 b ± 0.24.03 a ± 0.24.09 a ± 0.63.74 a ± 0.14.0 a ± 0.1
Note. All values are Mean ± SE, calculated from three replicates. Means of the treatments appearing in the same row with different superscripts are significantly different at p < 0.05. IW = Initial weight: FW = final weight; WG = Weight gain per fish; Sur = Survival%; FCR = Feed conversion ratio; FCE = Feed conversion efficiency; PER = protein efficiency ratio; SGR = specific growth rate (%/day), PI = protein intake.
Table 3. Carcass composition (% on dry weight basis) of the fry.
NutrientProximate Composition of the Fry Carcass
ControlOMCMMDAAFAFOMCAFMMDA
DM (%)21.3 ± 0.721.2 ± 0.422.6 ± 1.121.1 ± 0.720.5 ± 0.320.8 ± 1.1
Protein (%)68.5 ab ± 0.577.3 d ± 1.280.5 d ± 1.164.4 b ± 1.358.3 a ± 1.172.1 c ± 0.3
Lipid (%)17.4 ± 0.618.9 ± 1.018.2 ± 0.919.1 ± 0.219.0 ± 0.518.2 ± 0.9
Ash (%)12.3 a ± 1.511.3 a ± 0.317.4 b ± 0.912.0 a ± 0.813.8 ab ± 1.317.4 b ± 0.4
GE5590 ± 985848 ± 745607 ± 265625 ± 205455 ± 465475 ± 59
Note. Means for each treatment group in the same row with different superscripts are significantly (p < 0.05) different. DM = Dry matters (%), GE = gross energy.
Table 4. Hematological blood parameters of Nile tilapia.
Treatments
ControlOMCMMDAAFAFOMCAFMMDA
WBC 119,827 ± 1770 b9909 ± 1138 a12,707 ± 1828 ab16,520 ± 1323 ab18,267 ± 2662 ab19,200 ± 1695 b
RBC 21.71 ± 0.151.91 ± 0.121.77 ± 0.082.05 ± 0.131.81 ± 0.131.68 ± 0.10
Hct 325.9 ± 2.328.8 ± 1.827.5 ± 1.232.0 ± 2.027.8 ± 1.926.0 ± 1.6
MCV 4151.7 ± 1.2152.0 ± 2.3155.7 ± 1.8156.3 ± 2.2154.5 ± 1.9154.4 ± 2.1
ALT 58.9 ± 0.612.6 ± 1.56.1 ± 0.712.3 ± 2.723.0 ± 9.516.6 ± 2.4
AST 670.5 ± 15.1 c78.3 ± 20.5 ab42.2 ± 8.0 a68.9 ± 15.9 a59.5 ± 7.6 abc97.2 ± 25.9 bc
LDH 71554 ± 4811854 ± 3951031 ± 2331277 ± 2441358 ± 1512209 ± 604
1 WBC (×106 cell μL): White blood cell. 2 RBC (×106 cell μL): Red blood cell. 3 Hct (%); Hematocrit. 4 MCV (Mean corpuscular volume): Hematocrit/Red blood cell. 5 ALT (Alanine Aminotransferase): IU/L 6 AST (Aspartate Aminotransferase): IU. 7 LDH (lactate dehydrogenase) (U/L). Means for each experimental treatment in the same row with different superscripts are significantly (p < 0.05) different.
Table 5. Histology of the intestine of Nile tilapia.
VHVWCDVH/CDGoblet Cells/0.01 mm2
Control 92.51 ± 7.52 a49.7 ± 2.77 a46.57 ± 6.54 ab2.87 ± 0.64 a31 ± 2 b
OMC 189.5 ± 24.0 a62.9 ± 3.9 b29.5 ± 2.2 ab6.9 ± 1.2 b14 ± 4.5 a
MMDA 102.2 ± 5.1 a57.8 ± 6.9 a51.2 ± 0.2 b2.17 ± 7.7 aNV
AF 189.1 ± 36.8 ab61.3 ± 6.6 ab47.2 ± 6.6 ab3.9 ± 0.5 ab16 ± 3 a
AFOMC 85.1 ± 14.7 a56.3 ± 4.8 ab24.8 ± 1.9 a3.5 ± 0.6 ab14 ± 1.5 a
AFMMDA 282.2 ± 66.7 b66.5 ± 4.9 b55.3 ± 15.9 ab5.81 ± 1.1 ab16 ± 1 a
Note. VH = Villus height; VW = Villus width; CD = Crypt depth; VH/CD = Villus height to crypt depth ratio, NV = non-visible. Means of the treatment groups in the same row having different superscripts are significantly (p < 0.05) different.
Disclaimer/Publisher’s Note: The statements, opinions and data contained in all publications are solely those of the individual author(s) and contributor(s) and not of MDPI and/or the editor(s). MDPI and/or the editor(s) disclaim responsibility for any injury to people or property resulting from any ideas, methods, instructions or products referred to in the content.

