Article

Electrical Stunning Has the Potential to Delay Fillet Degradation Post-Harvest in Red Seabream (Pagrus major)

by
Rafael Angelakopoulos
1,
Arkadios Dimitroglou
2,3,
Leonidas Papaharisis
2 and
Katerina A. Moutou
1,*
1
Laboratory of Genetics, Comparative and Evolutionary Biology, Department of Biochemistry and Biotechnology, School of Medical Sciences, University of Thessaly, Viopolis, Mezourlo, 41500 Larissa, Greece
2
Department of Research and Development, Avramar S.A., 34100 Chalkida, Greece
3
Laboratory of Applied Hydrobiology, Department of Animal Science, Agricultural University of Athens, Iera odos 75, 11855 Athens, Greece
*
Author to whom correspondence should be addressed.
Aquac. J. 2022, 2(4), 302-315; https://doi.org/10.3390/aquacj2040018
Submission received: 22 August 2022 / Revised: 20 October 2022 / Accepted: 31 October 2022 / Published: 7 November 2022

Abstract

:
Ensuring the humane harvest of farmed fish without compromising the quality of the fresh product is paramount to the welfare of fish and in meeting consumer demands. Electrical stunning is a quick and effective way to render fish unconscious and it has emerged as the suggested harvest method by EFSA and OIE. The present study evaluated the effects of electrical stunning on the biochemical processes that lead to fillet degradation postmortem, in the red seabream (Pagrus major). Two distinct electrical stunning conditions (low and high) were compared along with the conventional harvest method (an ice slurry). The activity patterns of calpain, collagenase, and cathepsin B and L were assessed and compared to stereological changes in white muscles at different time points up to 13 days post-harvest. Histological examinations, independent of the harvest technique, revealed a progressively declining trend in fiber volume density and increasing interfibrillar spaces over time, indicative of degradation activity within and between the muscle fibers. Strong correlations between the stereological measures and the individual protease activities were recorded. The higher current condition (electric field 1.8 V/cm and velocity 1.6 m/s) consistently exhibited the lowest protease activity levels and the slowest pace of stereological changes, making it the suggested method of all harvest methods explored.

1. Introduction

Fish is a nutritious and healthy food product with a high market demand that is rapidly increasing [1]. Aquaculture production is expected to double by 2030 to meet these high demands [2]. Fresh fish rank among the most perishable animal food products due to endogenous fish proteases, microbial activities, and lipid oxidation [3]; extending their shelf-life is key to resilient supply chains and the ecological footprint of fresh products. The proteolytic cleavage of structural proteins in myofibrils and the extracellular matrix connecting them occurs postmortem, reducing muscle collagen and disassembling the myofibrils. As a result, a softening of the fillet and a gaping in the myocommata is observed [4]. Proteases, such as collagenases, are responsible for degrading the native triple helix of collagen, while lysosomal cathepsins and cytoplasmic calpains extend the disassembly of the myofibril complex-cleaving proteins of the myofibril, such as Z-Disk, desmin, etc. [5,6].
Handling and harvesting methods are known to induce stress, compromising fish welfare and their quality attributes post-harvest. Handling stress pre-harvest has been found to have an extreme effect on muscle pH accompanied by a rapid onset of rigor mortis [7]. This may enhance protein denaturation, leading to easier access to protein substrates for proteolytic enzymes, faster muscle softening, and impaired organoleptic quality of the final product [8]. Reduced stress prior to slaughter has been proven to have a positive influence on flesh quality in various farmed fish species, including Atlantic salmon [9], trout [10], eel [11], turbot [12], red seabream, gilthead seabream, and European seabass [13].
The available slaughtering procedures vary greatly. In most cases, removal from water followed by asphyxiation in an ice slurry is employed to slaughter farmed marine fish in Europe [13] and is known to cause excessive stress to harvested fish before killing them via hypothermia [14]. Research shows that immersion in cold water and crowding are stressful for many fish, raising cortisol levels and heart rate; in some species, aversive behavior is observed [15,16,17].
Crowding, air exposure, and extreme hypothermia as attributes of the slaughtering process in fish farms underline the need for a less stressful, more humane, harvest method while maintaining the high quality of the fillet. This has led to exploring novel harvest methods, such as electrical stunning, a method suggested by both the EFSA and OIE [18]. Electrical stunning has been found to be a quick and effective way to render fish unconscious [19]. The main premise of electrical stunning is to pass enough current into the brain, inducing an epileptic-like fit, resulting in brain function loss [20]. The effectiveness of electrical stunning can be ascertained by previous studies by assessing brain and heart activity [17,21]. However, injuries associated with the electrical field strength, the duration of the current, the conductivity of the water, and the fish species [22,23], such as blood spots on the fish, are commercially unacceptable, lowering the market value [13].
Mediterranean marine fish farming is dominated by gilthead seabream and European seabass. Only a small percentage (3%) of the market share is about other species, including red seabream (Pagrus major). Yet, the dynamic of red seabream is strong and constantly growing with an annual growth rate of 12.3% (2015–2019), making it a species of high market value with great prospects [24]. The objective of this study was to evaluate the effects of different electrical stunning conditions on the post-mortem biochemical processes that underlie the fillet’s histological changes, connected to fillet quality, in order to make electrical stunning a realistic option for red seabream harvesting.

2. Materials and Methods

2.1. Ethics Statement

All examined biological materials were derived from fish reared and harvested at commercial farms, registered for aquaculture production in EU countries. Animal sampling followed routine procedures and samples were collected by a qualified staff member from standard production cycles. The legislation and measures implemented by the commercial producers complied with existing national and EU (Directive 1998/58/EC) legislation (protection of animals kept for farming).

2.2. Fish Sampling

The experiment was performed at the installations of Nireus S.A., currently AVRAMAR S.A., in Astakos, Aitoloakarnania, Greece, in August 2020, at a water temperature of 25 °C. Red seabream were farmed in a rectangular cage (7 m × 7 m and 8 m in depth). The stocking density of red sea bream was 10 kg/m3 and the fish weight at harvest was 800–1200 g. Fish were killed by either hypothermia through chilling on an ice slurry (CS), which is the harvesting method currently used, or electrical stunning, which is the alternate recommended method considered more humane. In the case of electrical stunning, the fish were crowded in the net and pumped with a fish pump (1080-P; Aqua Life) connected in line with an electrical stunning machine (HSU stunner, Aquatech). Fish were separated from marine water using a stainless-steel dewatering device to remove excess water. The electrodes on the apparatus were parallel and extended to the full width and height of the water, where the fish were orientated so their head–tail axes were perpendicular to the direction of the electric field [22]. Finally, the fish were killed in an ice slurry. A free-view video demonstrating the structure and function of the device is available on YouTube (URL: https://www.youtube.com/watch?v=pgLBUpul1Ps, accessed on: 20 October 2022).
Two different electrical stunning settings were compared with the conventional harvest method (CS); a higher current treatment (HC), with an electric field of 1.8 V/cm and passage velocity of 1.6 m/s; and a lower current treatment (LC), with an electric field of 1.5 V/cm and passage velocity 1.6 m/s. The higher current appeared to be more effective at keeping the fish stunned until their deaths. More details regarding the water conductivity and the features of the nature of the electrical stunning can be found in Table 1. In the ordinary slaughtering method, fish were harvested with a brail, exposed to air for a few seconds, and killed in an ice slurry.
Fish were packed as a whole without bleeding in polystyrene boxes filled with ice flakes and transported to the Department of Biochemistry and Biotechnology, University of Thessaly. Upon arrival, the boxes were stored isothermally at 0 °C in high-precision (±0.2 °C) professional low-temperature incubators. White muscle samples from the areas below the dorsal fins were extracted from eight individuals at each sampling point; harvest day (day 0) and on days 1, 2, 5, 7, 13 post-harvest.

2.3. Proteolytic Enzyme Activities

Samples of white muscles were collected, snapped-frozen in liquid nitrogen, and stored at −80 °C until the preparation of enzyme extracts and the determination of the activities of calpain, collagenase, cathepsin B, and cathepsin L.
A crude enzyme extract was prepared for cathepsin determination by homogenizing minced muscle in a 1:2 ratio with cold water (4 °C). The homogenate was centrifuged at 14,600× g (4 °C) for 20 min, and the supernatant was kept at −80 °C until further analysis [25]. For the determination of calpain and collagenase activities, crude enzyme extracts were obtained according to Chéret et al. with slight modifications [6]. Samples were homogenized in 500 mM Tris-HCl (pH 7.5), 10 mM β-mercaptoethanol, and 1 mM EDTA at a ratio of 1:3. The homogenate was centrifuged at 10,000× g for 40 min (10 °C), and the supernatant was transferred and stored at −80 °C until enzymatic analysis.
Calpain, collagenase, and cathepsins B and L activities were measured using the Barret and Kirschke method with minor refinements [26]. L-methionine-AMC trifluoroacetic salt in DMSO and Suc-Gly-Pro-Leu-Gly-Pro-AMC in DMSO were used as substrates for calpain and collagenases, respectively. Enzyme extracts were mixed with the substrate solution in 100 mM bis-Tris, 5 mM CaCl2 pH 6.5. Z-arginine-arginine-7-amido-4-methyl-coumarin hydrochloride and Z-phenylalanine-arginine-7-amido-4-methylcoumarin hydrochloride were used as substrates for cathepsin B and cathepsin L, respectively. The enzyme extract was mixed with the substrate solution (100 mmol/L Tris-HCl, 20 mmol/L EDTA, 4 mmol/L DTT, pH 6.5). In all assays, 7-amino-4-methylcoumarin (AMC) was released as the final product and its concentration was determined in all the enzyme assays (excitation = 360 nm, emission = 460 nm) using a spectrofluorometer (Varioskan™ LUX multimode microplate reader, Thermo Fisher). The protein content of the crude extracts was quantified via the Bradford method, in duplicates, and using bovine serum albumin as a standard [27]. Enzymatic activity was expressed as the fluorescence unit (FU) change per minute per mg protein. Two replicates per sample were performed [28].

2.4. Stereological Analysis

Samples for the histological analysis were obtained from red seabream on the harvest day (day 0) and days 7 and 13 post-harvest. Freshly dissected tissue was merged in cold 4% formaldehyde (PFA in PBS) pH 7.4 and stored overnight at 4 °C. Subsequently, PFA was washed twice with cold 1× PBS while shaken. Samples were then stored at −20 °C until embedding. Samples were dehydrated by graded ethanol and xylene in a series of washes with increasing concentrations and included in paraffin. Samples were embedded in molten paraffin (58 °C); serial transverse microsections (6 μm) for each sample were prepared, placed on glass slides, and dried at room temperature overnight [29].
Sections were stained with hematoxylin and 1% eosin Y after dewaxing in xylene, rehydrated through baths of decreasing ethanol concentrations (100%, 95%, and 70%), and immersed in distilled water. Following staining, sections were dehydrated through increasing concentrations of ethanol washes (70%, 95%, and 100%) [29].
Multistage sampling and morphometrical evaluation were performed according to the principles of Weibel et al. (1969) and Weibel (1979) [30,31]. Three tissue blocks were prepared from each individual sample. One block was selected at random and serial sections were prepared. Five (5) randomly chosen sections were observed by using a light microscope coupled to a digital camera (100×). Captured images were analyzed using Fiji packages incorporated in ImageJ software [32].
The number of white muscle fibers per unit area and volume densities of white muscle fibers and inter-fiber spaces were determined by standard histological methods and stereology. Volume densities were estimated by placing a lattice of test points (PT) on micrographs of the 10 μm2 area and determining the fraction (Pi/PT) of these points enclosed within profiles of the muscle fibers (Pm) and in the inter-fiber space (Ps), respectively. The average single fiber volume density was calculated by dividing the total white muscle volume density by the number of fibers in the examination area.

2.5. Statistical Analysis

A statistical analysis of the harvest method and enzymatic activities of calpain, collagenase, cathepsin B, and cathepsin L were performed by R packages [33]. Firstly, summary statistics were carried out and min, max, mean, median, and standard deviations were calculated. Data normality was checked using a Shapiro–Wilk test; since our data deviated from the normal distribution, non-parametric tests were conducted. Kruskal–Wallis test was by rank and a non-parametric alternative to the one-way ANOVA test was performed since the assumptions of the one-way ANOVA test were not met for either the time post-harvest or the harvest method as factors. Significance was determined by a p-value < 0.05. Furthermore, statistical dependencies between the rankings of two variables were computed using Spearman’s rank correlation coefficient. Coefficients were plotted using the corrplot function, where positive correlations are displayed in blue and negative correlations in red color. The color intensity and the size of the circle are proportional to Spearman’s correlation coefficient (rho).

3. Results and Discussion

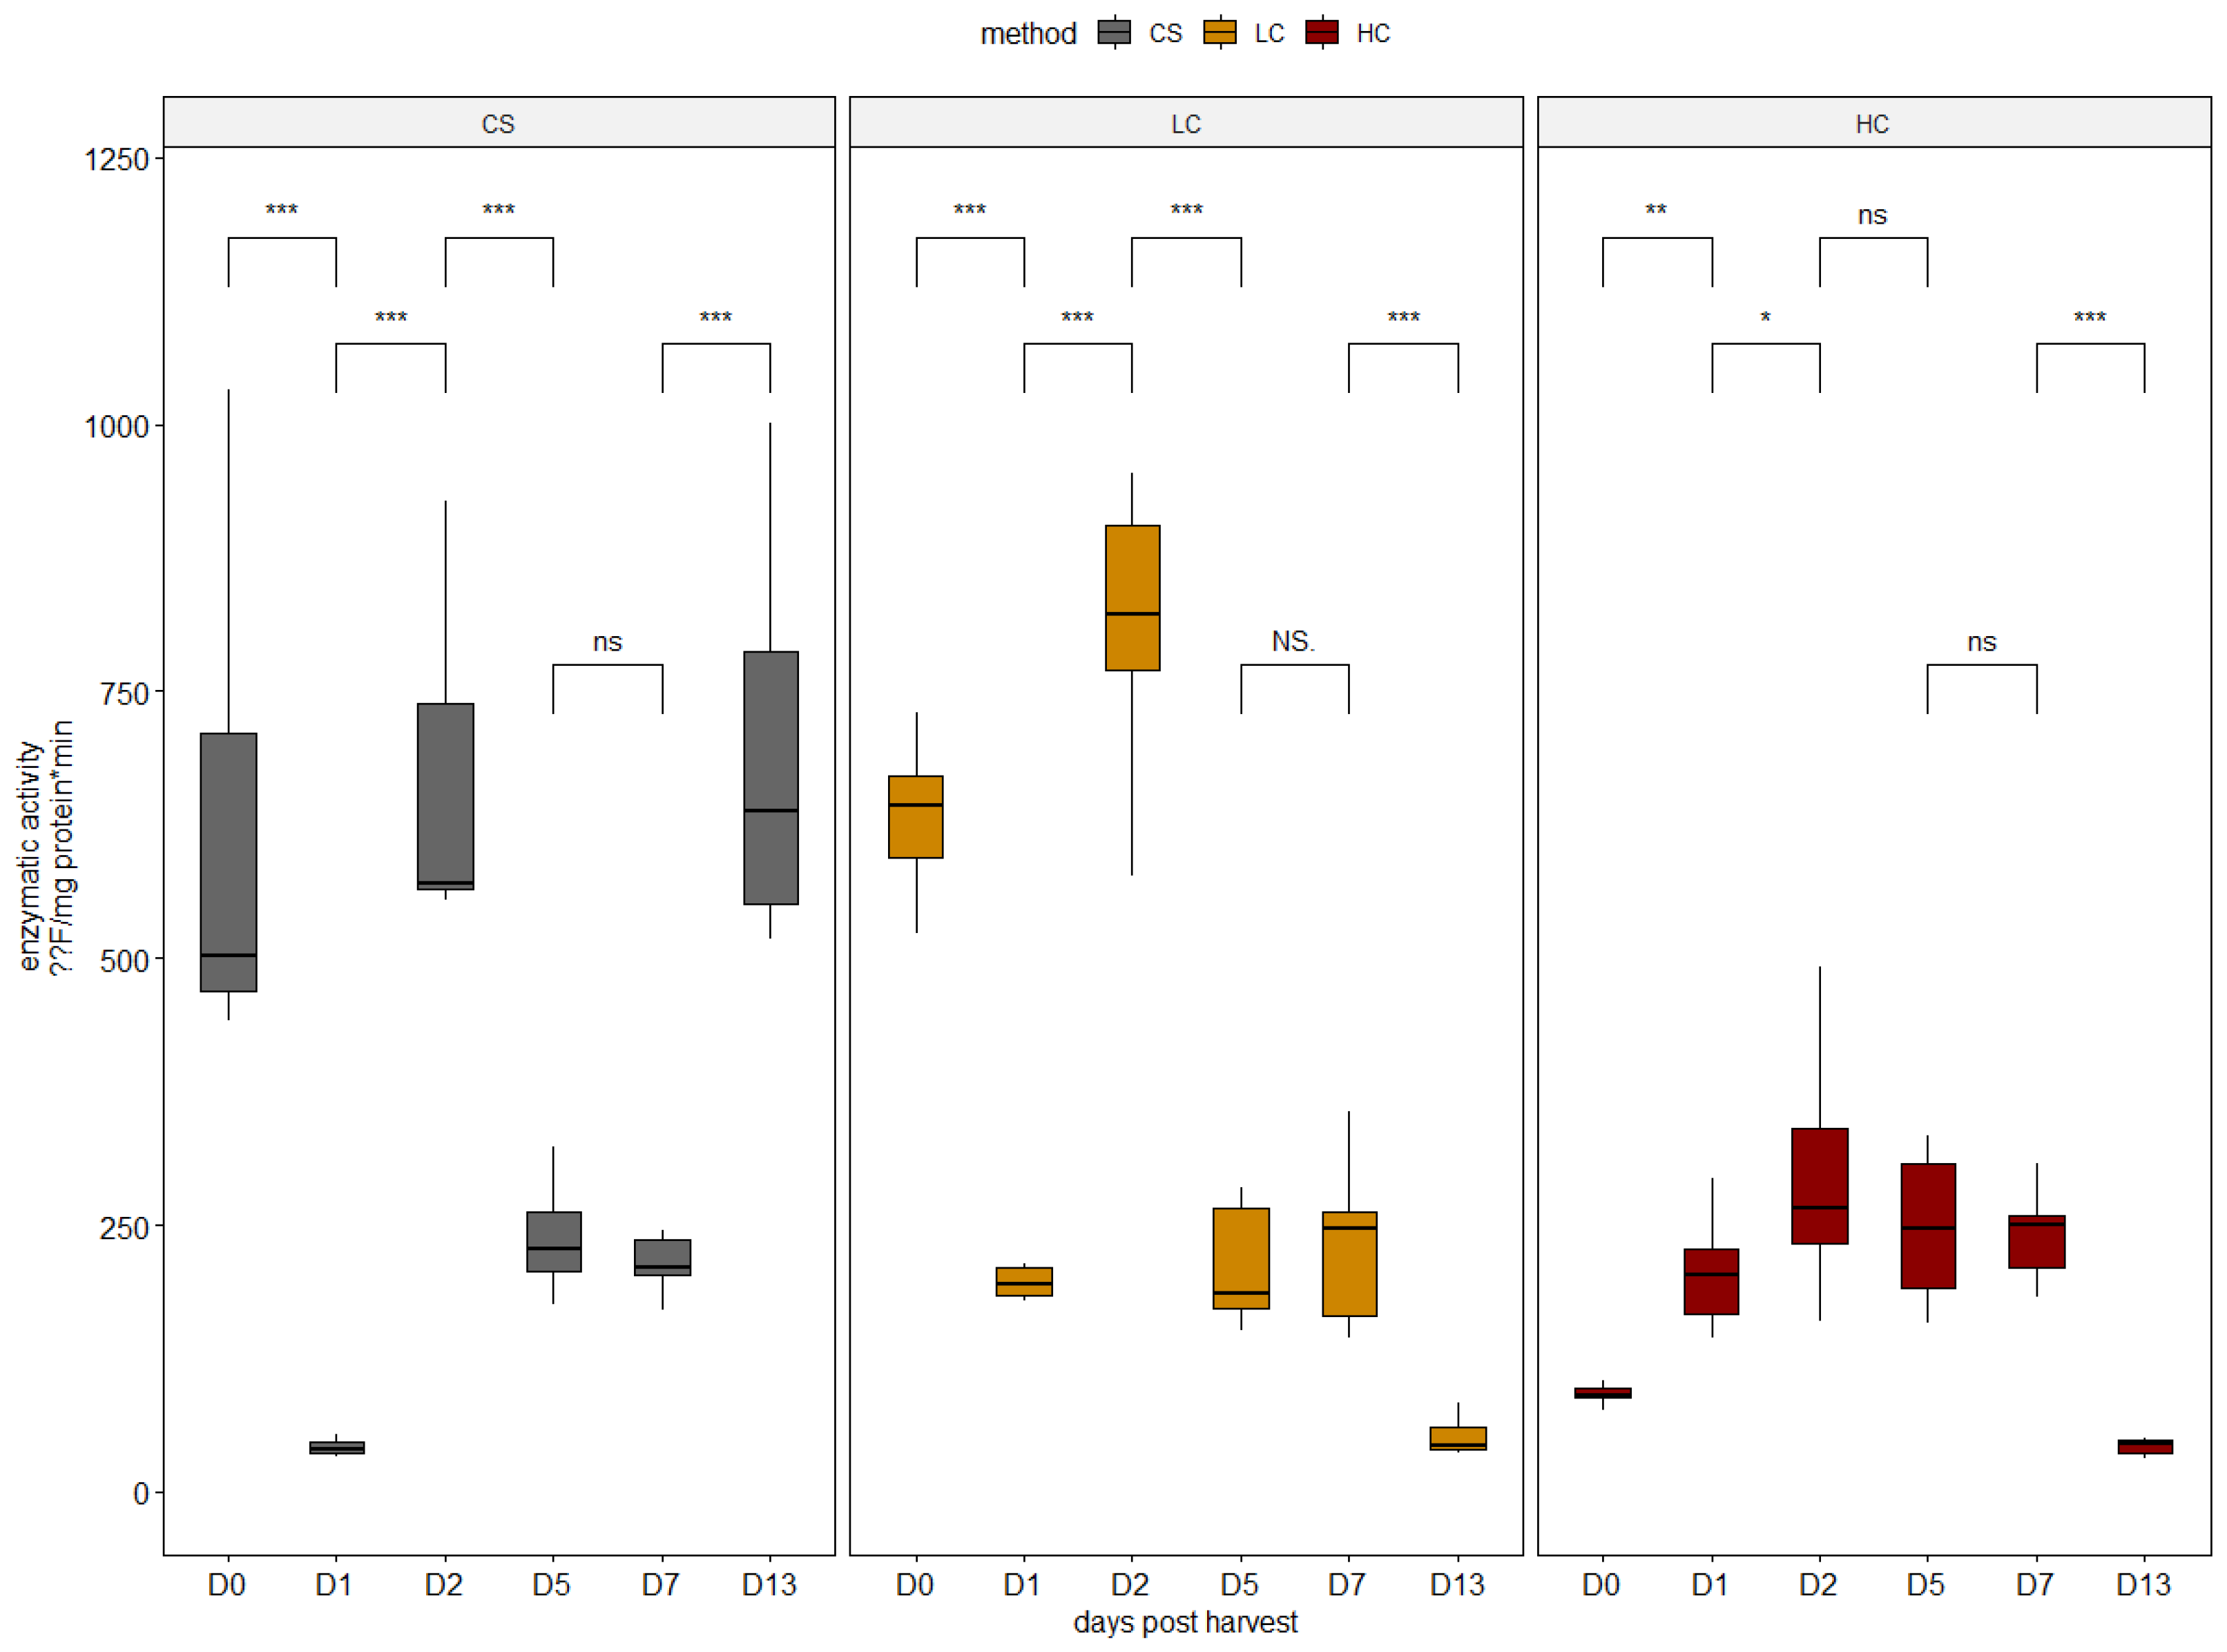
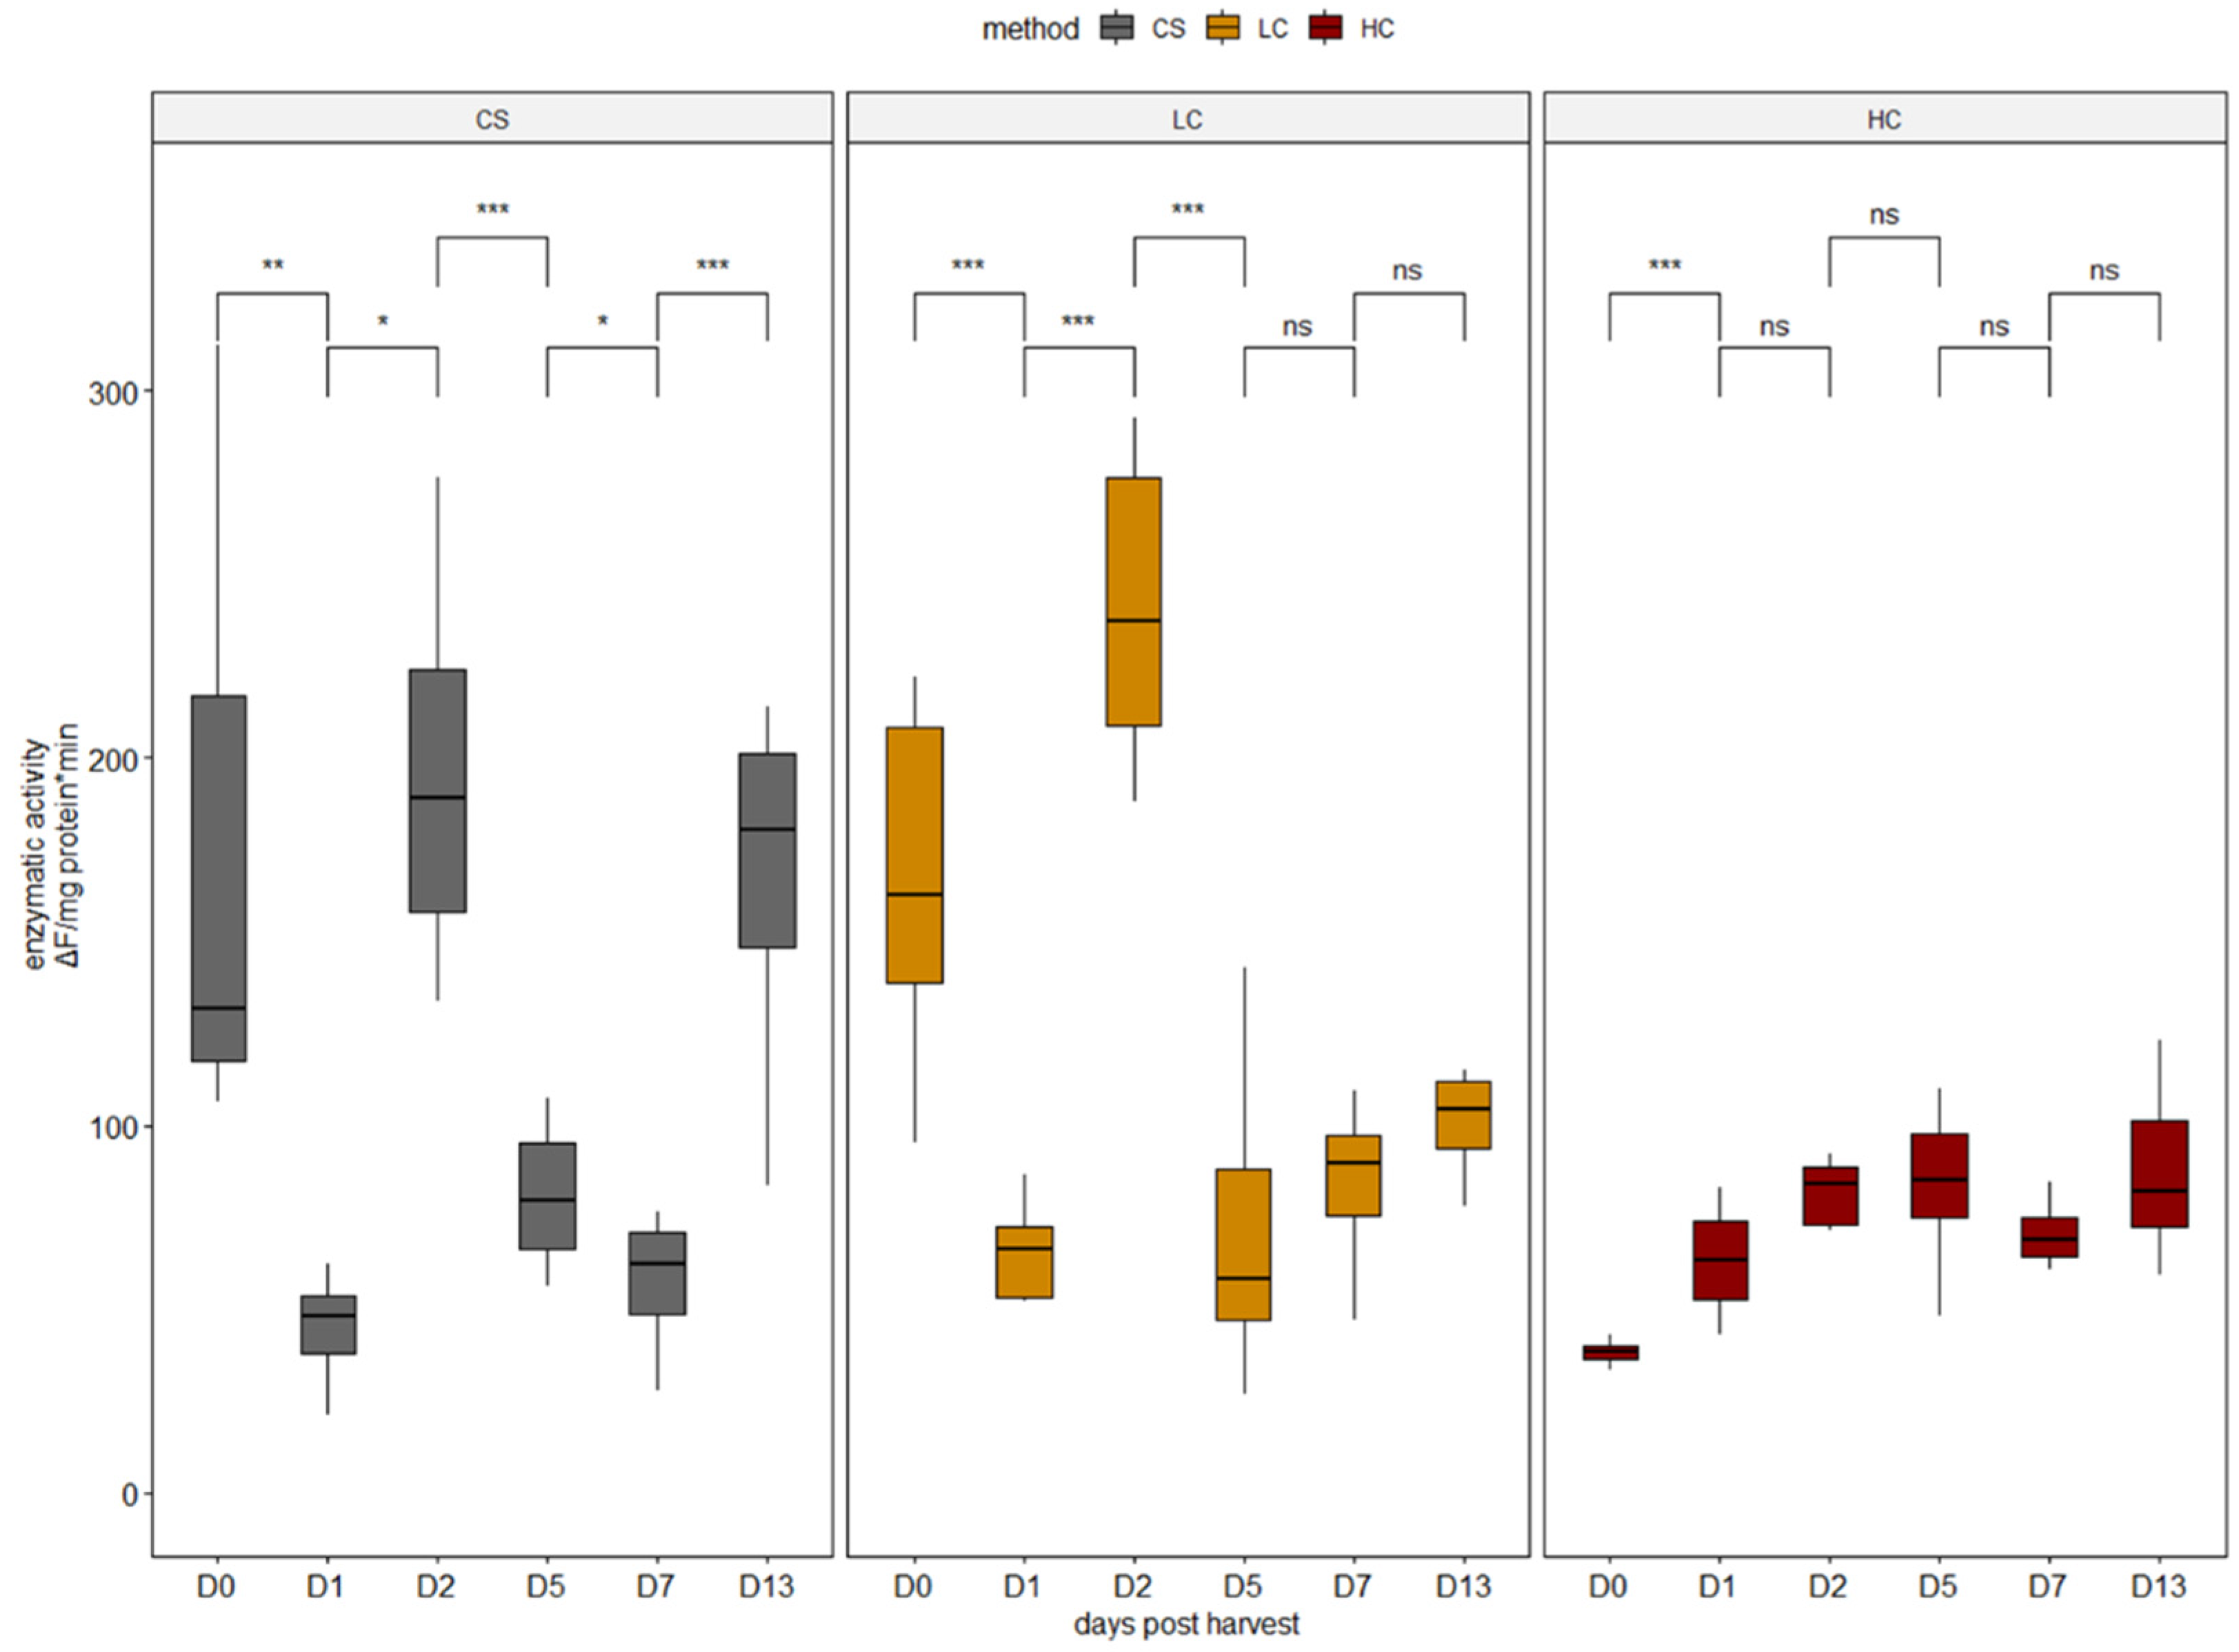
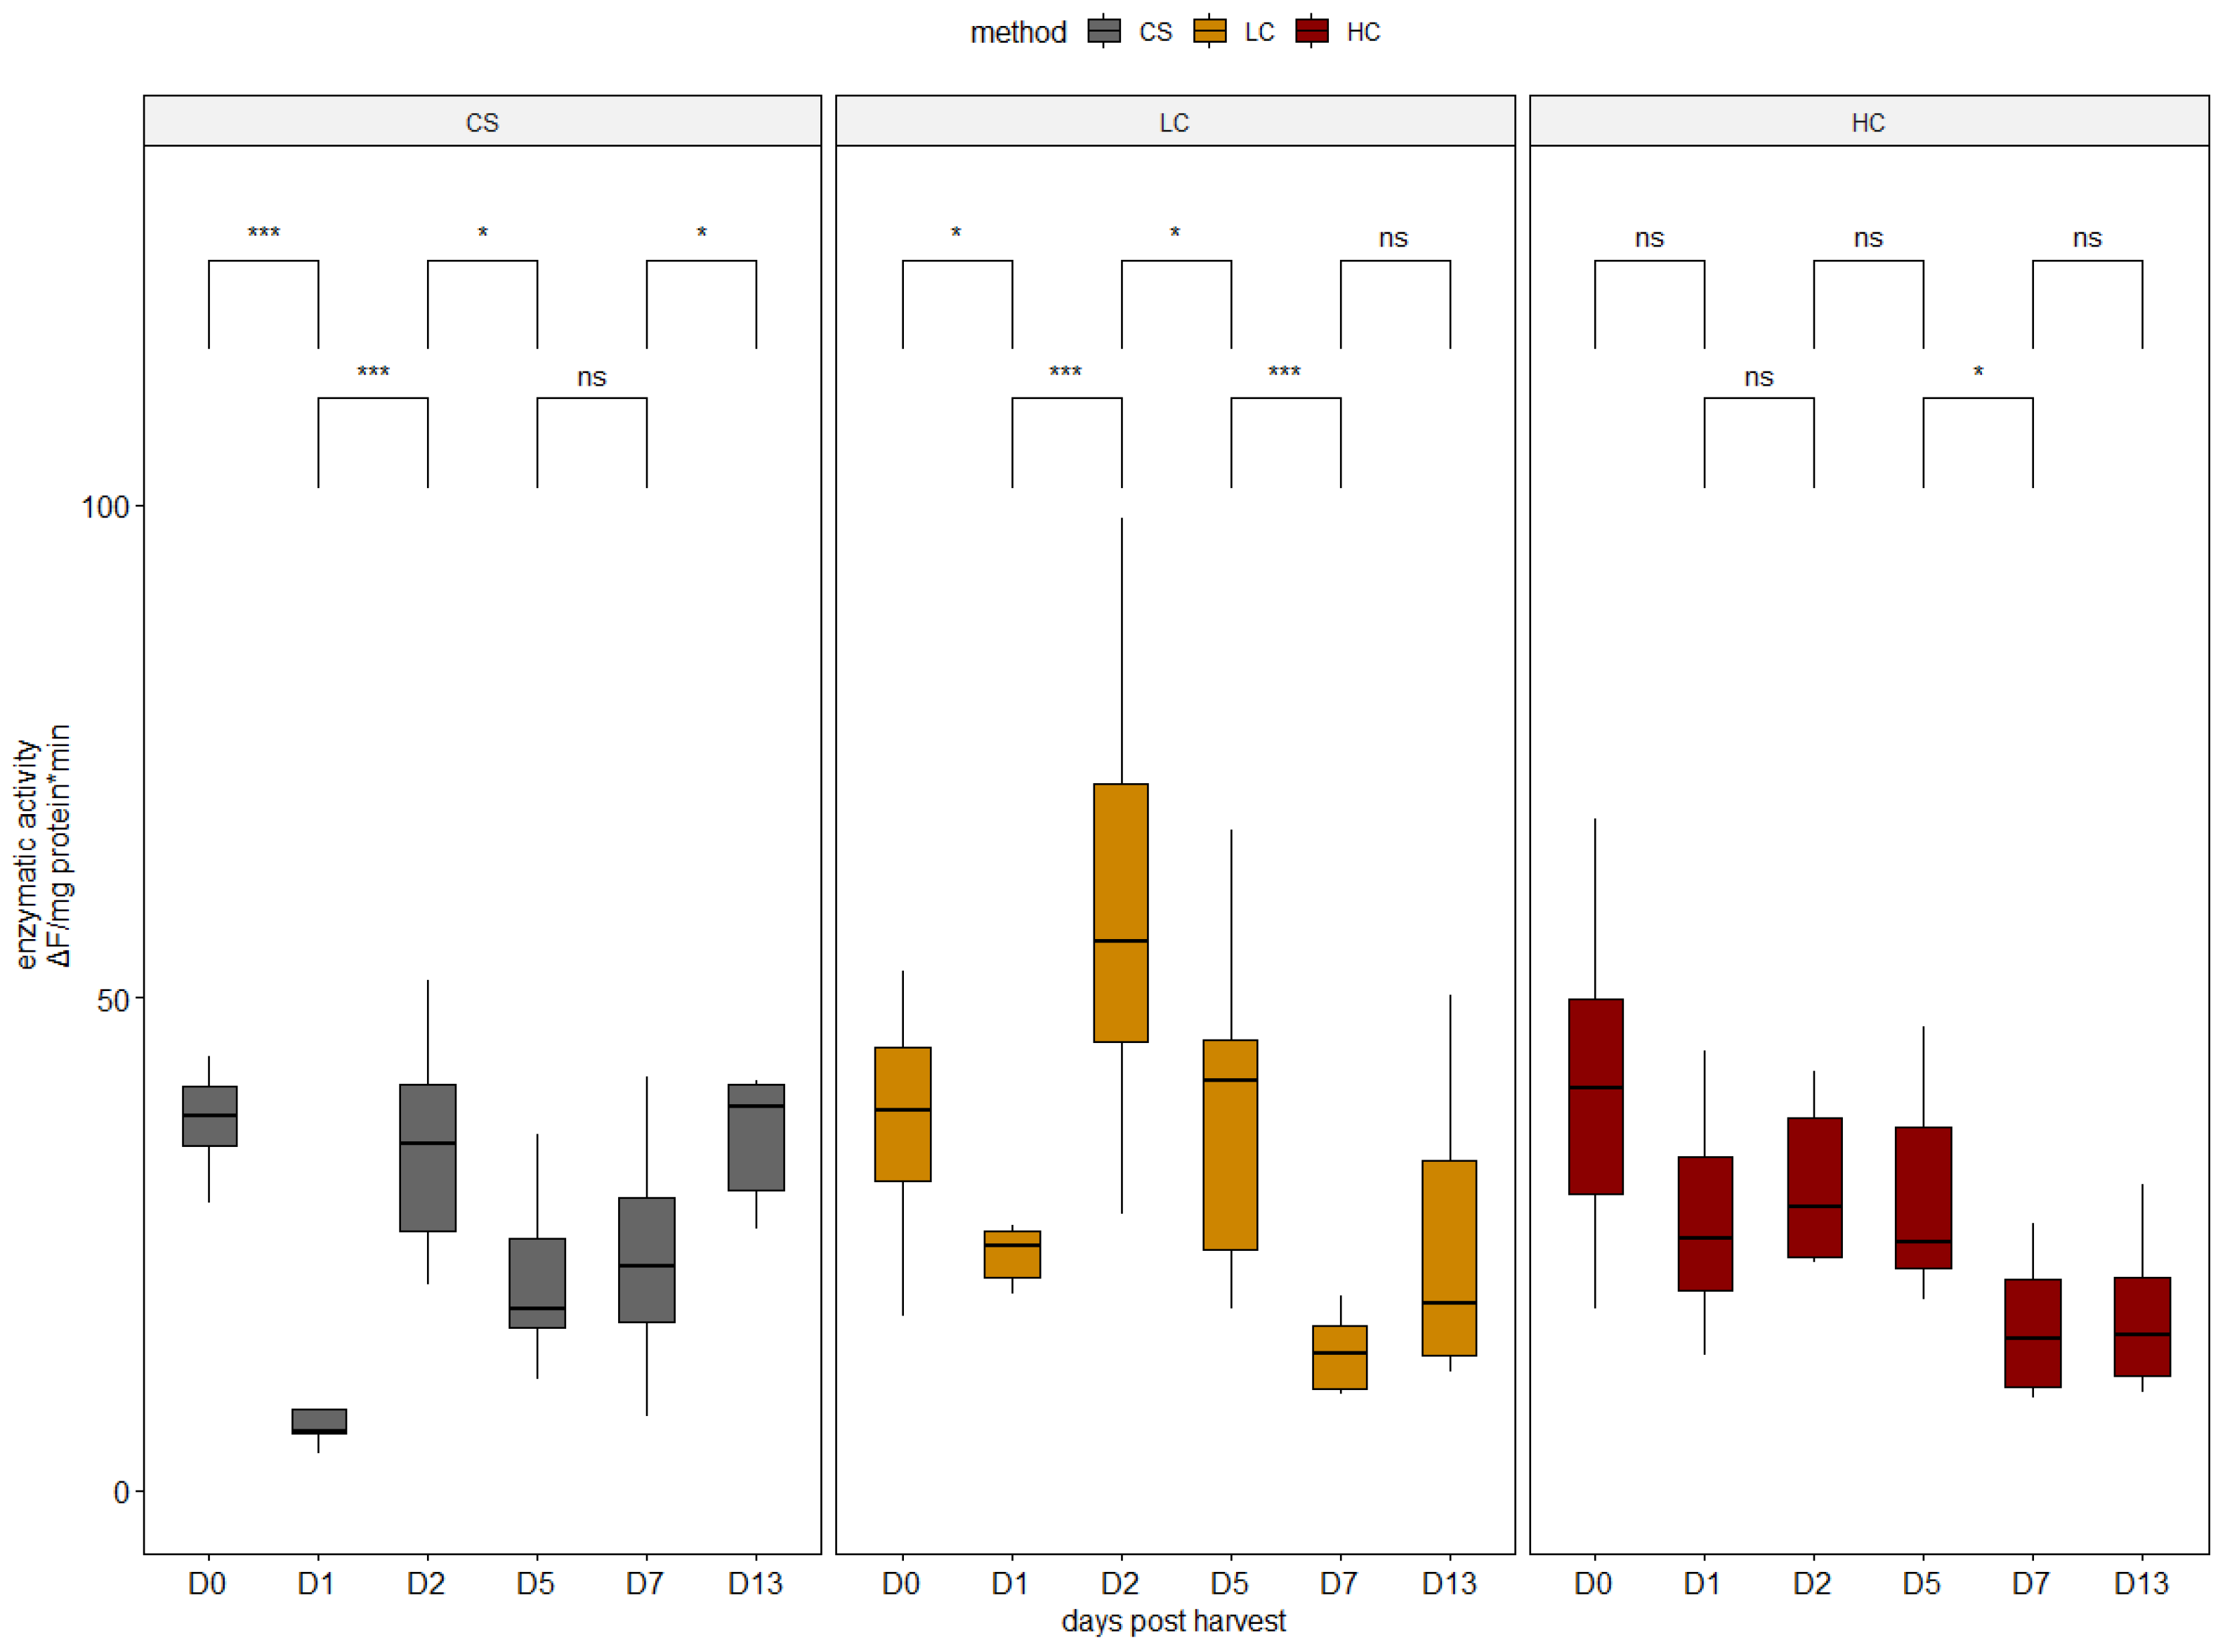
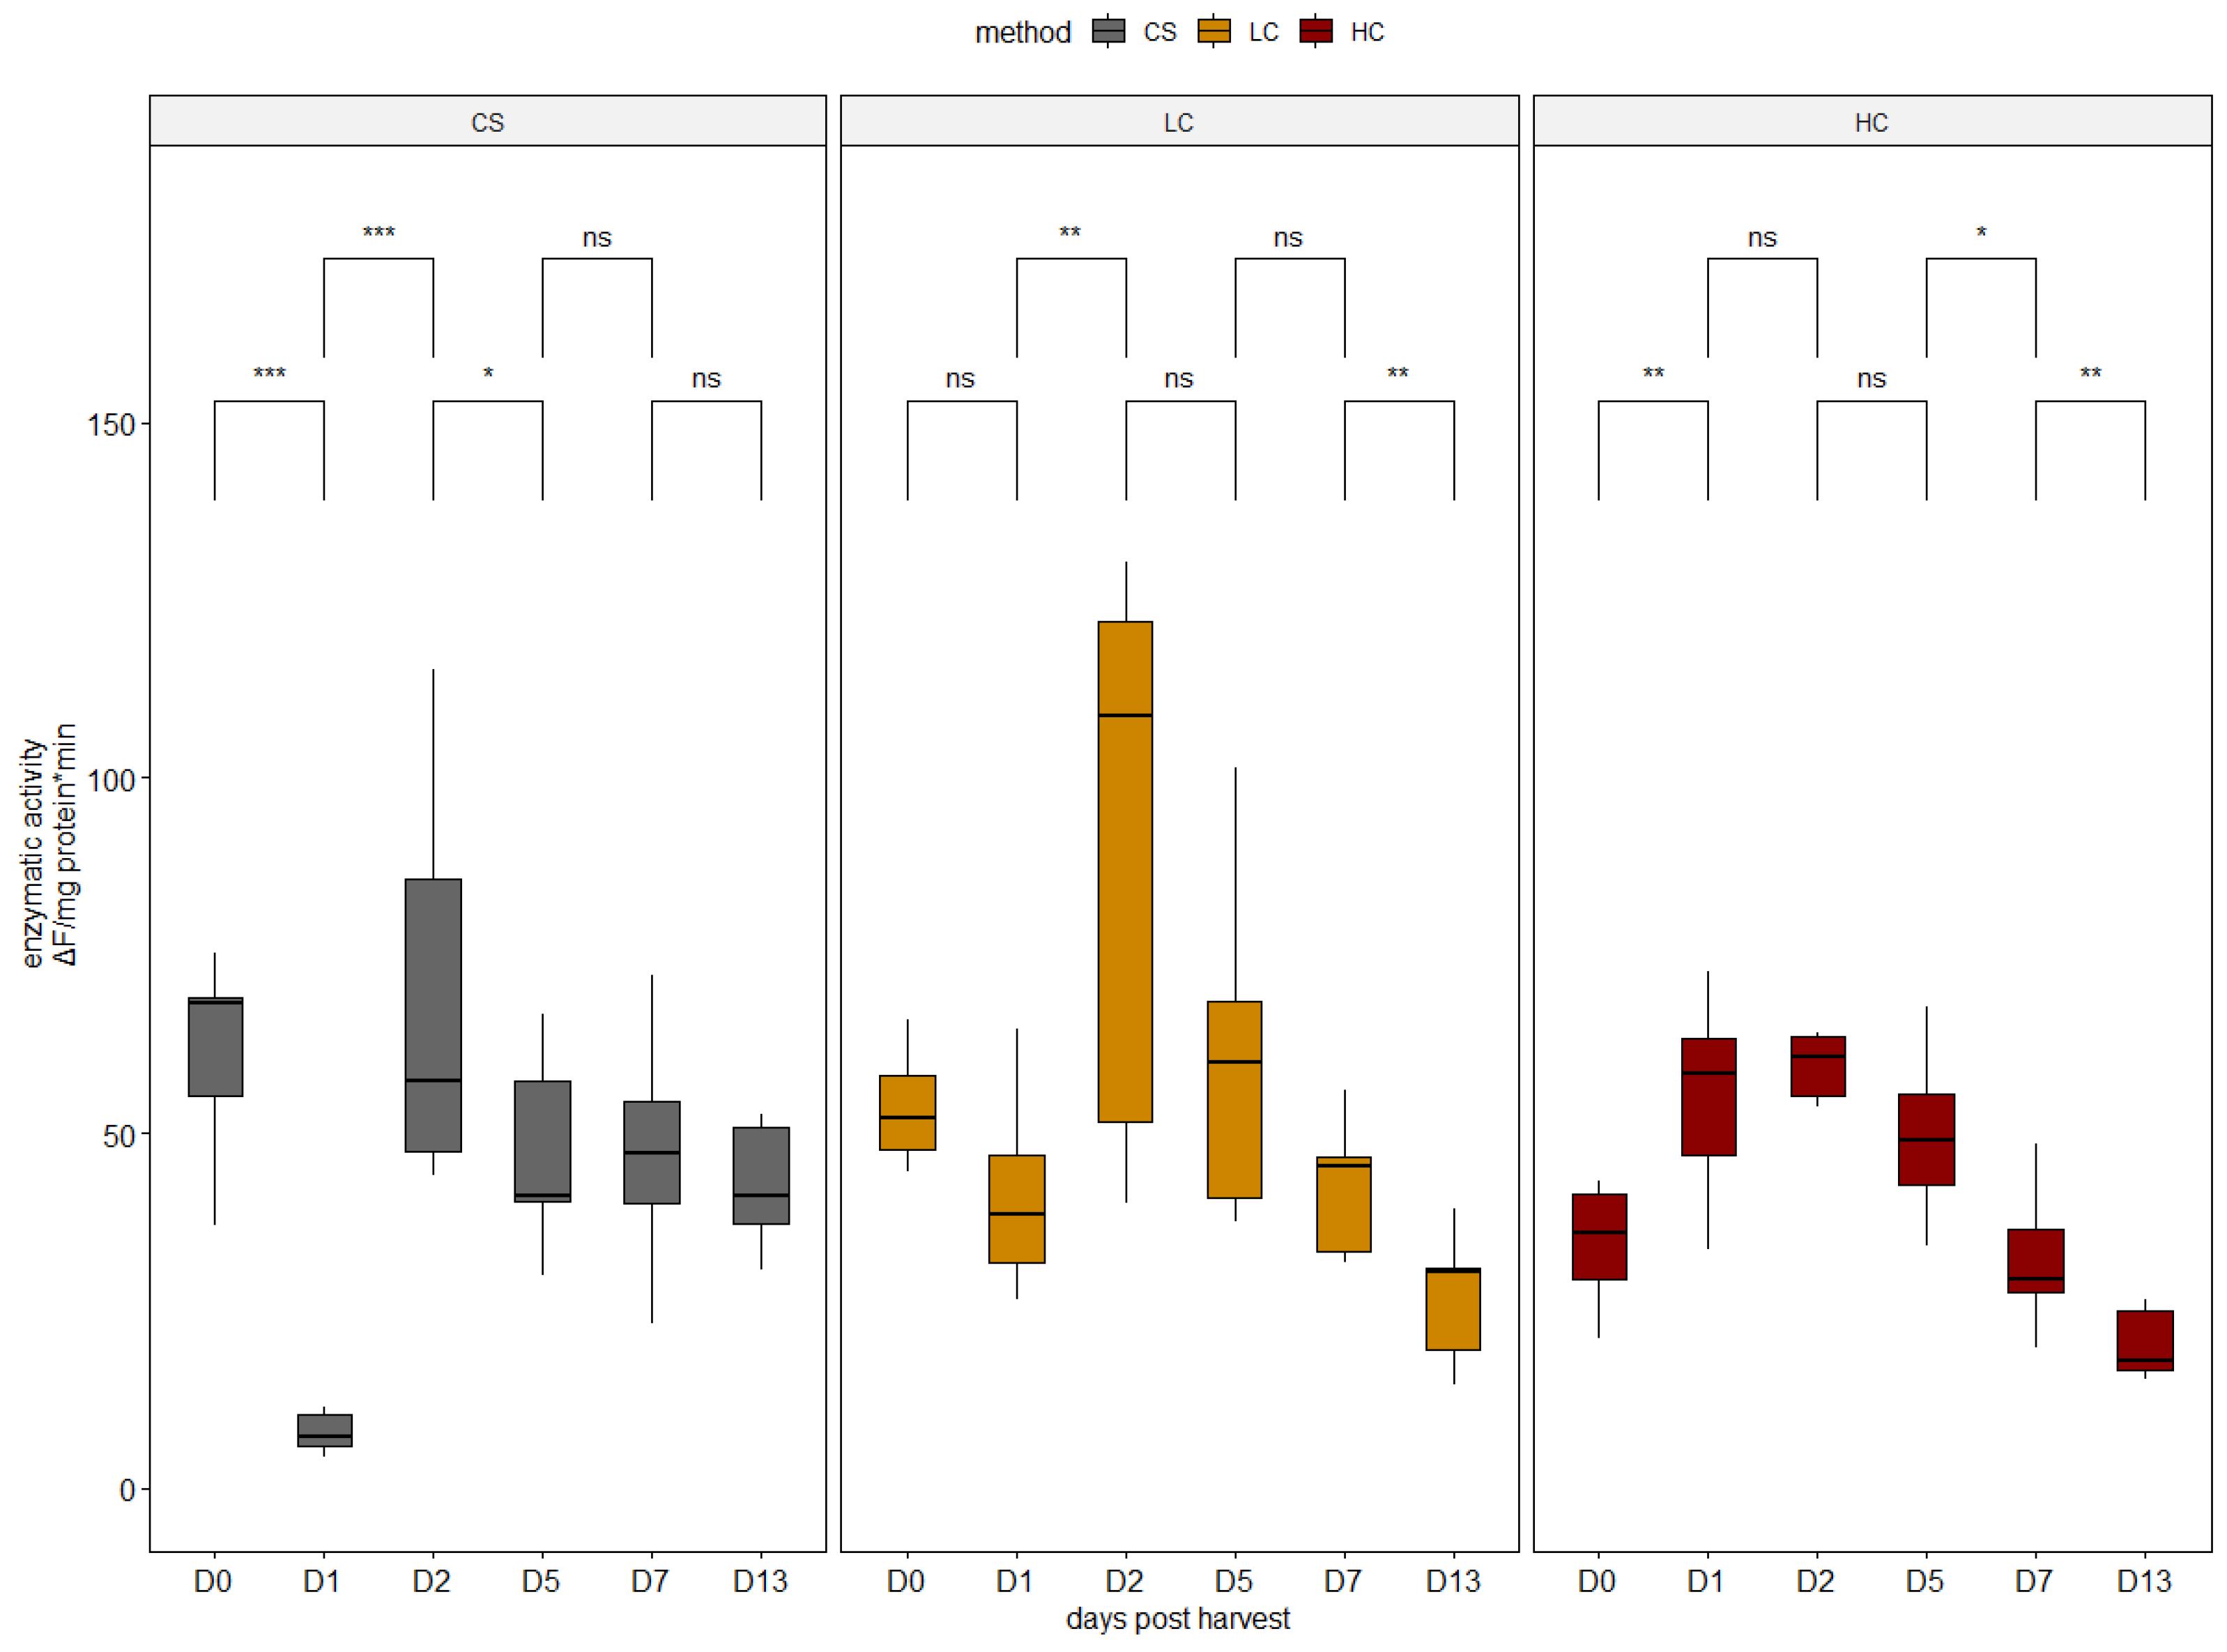
3.1. Enzymatic Activity Analysis

Following harvest, blood circulation, oxygen supply, and defense mechanisms are violently disrupted in fish. The ATP required for breaking the actin–myosin cross-bridges during muscle relaxation is depleted and the fish go into rigor mortis, and at the same time, lactic acid is produced, leading to a decrease in the pH levels [4]. This underlies the activation of calpains, cathepsins, and collagenases, which are enzymes that hold the key to the loss of the fillet’s texture and freshness [34] by degrading muscle proteins and connective tissue [35].
Cytoplasmic calpains are the first to be activated, leading to the degradation of the Z-disk. In the present study, calpain activity levels varied significantly between sampling days in all harvest methods (Figure 1). The variation pattern was differentiated from the harvest method. Significantly higher calpain activities were recorded in CS and LC specimens on harvest day compared with HC. HC electrical stunning elicited the lowest on-average calpain activity throughout the sampling period, unlike LC, which led to the highest overall calpain activity on day 2. This early activation pattern of calpain has also been recorded in previous studies in other marine fishes [28,36,37].
Moreover, significantly higher collagenase activities were recorded in CS and LC specimens on harvest day compared with HC (Figure 2). The highest collagenase activity was also recorded on day 2 post-harvest in CS and LC specimens (Figure 2). HC elicited the lowest on-average collagenase activities. Interestingly, calpain and collagenase appeared to share a similar activation pattern (Figure 1 and Figure 2), in agreement with a previously recorded study on grass carp stored on ice [38].
Electrical stunning, although improving the killing conditions of fish, has been shown to cause a decrease in muscle pH peri mortem due to intense muscle stimulation and subsequent production of lactic acid from glycogen, and may, therefore, have a strong mobilization effect on cathepsins, thus hastening the beginning of their proteolytic action, having adverse effects on the fish fillet quality [12]. However, no significant differences were recorded in cathepsin L activity in the present study between the harvest methods on harvest day. Subsequently, the activity in HC specimens followed a decreasing trend throughout the sampling period (Figure 3). The activation pattern of cathepsin L in CS and LC specimens was different, with the highest activity on average observed in LC specimens (Figure 3).
Different patterns of activation were observed in cathepsin B (Figure 4). HC specimens exhibited the lowest activity on harvest day (day 0), and after a peak on days 1 and 2, it decreased to the lowest levels by day 13. On the contrary, cathepsin B activity in CS specimens was the highest on day 0 and day 13 (Figure 4). Previous studies on seabass have shown that a combination of cathepsin B, D, and L effectively degrades the myosin heavy chain, actin, α-actin, desmin, troponin T, and tropomyosin, as these three can also act synergistically [5]. This fact can possibly interpret the high positive correlation (0.48 < r < 0.77) observed between the two enzymes, regardless of the sampling day.

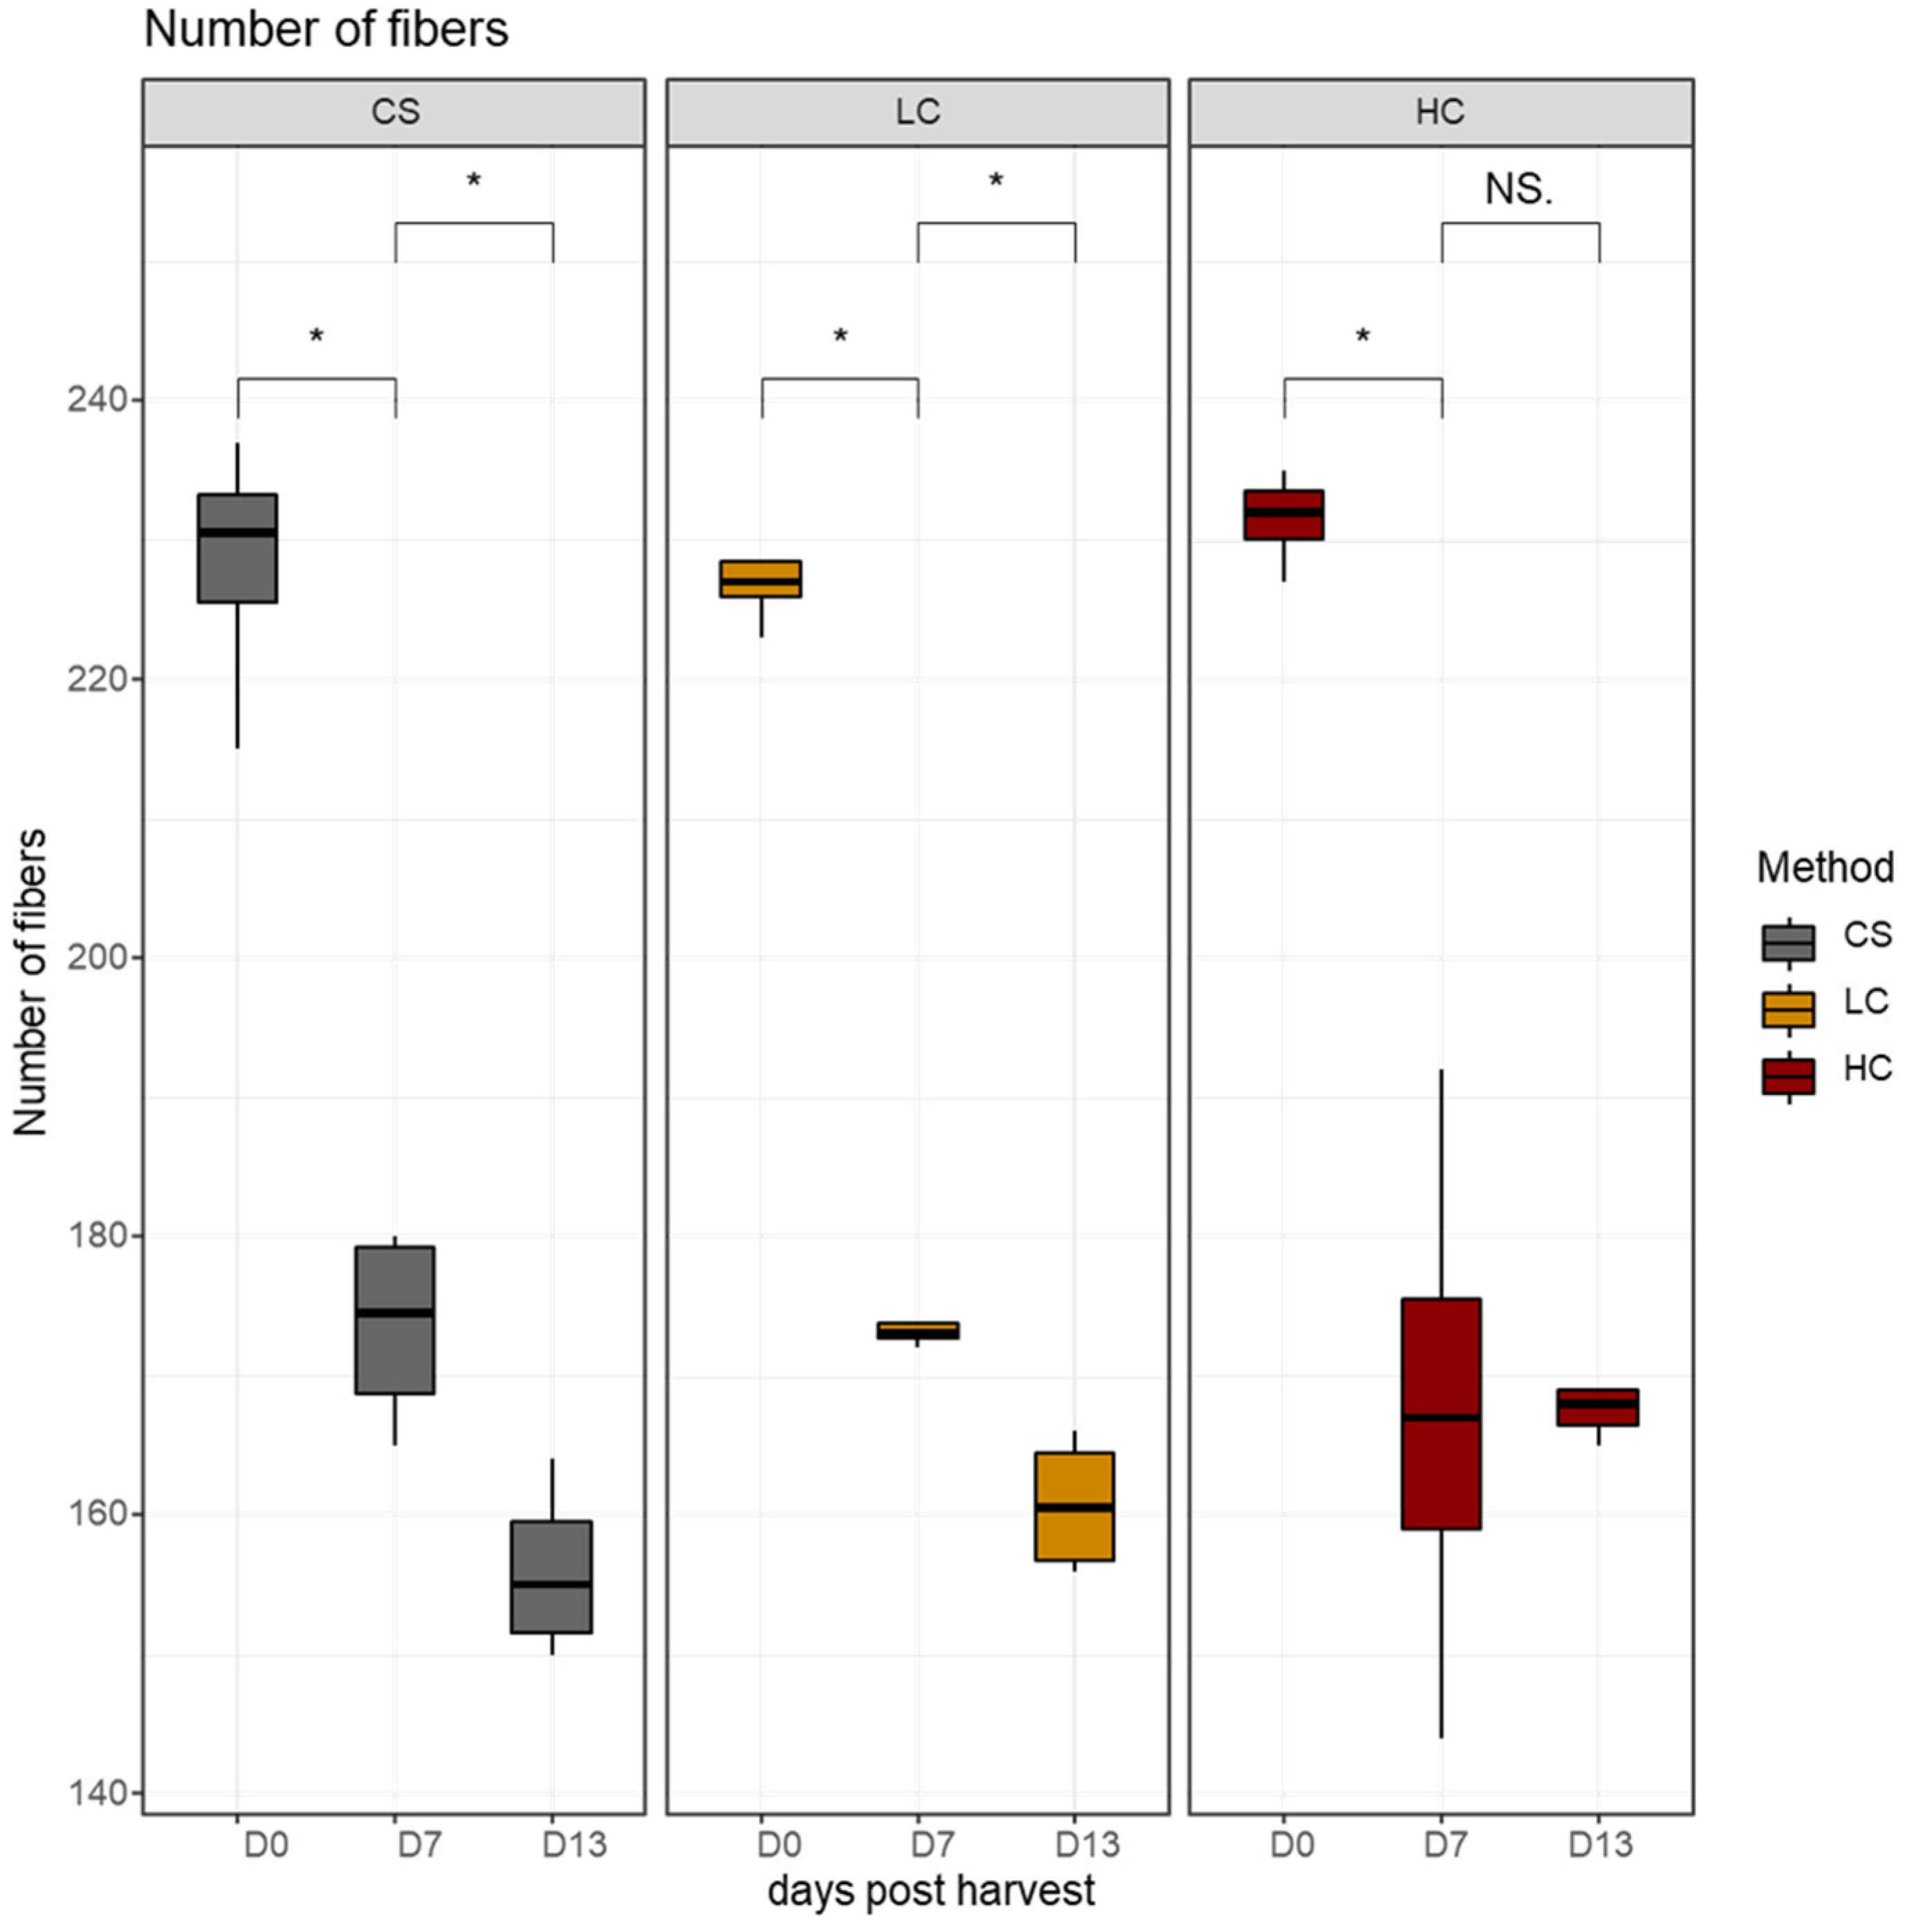
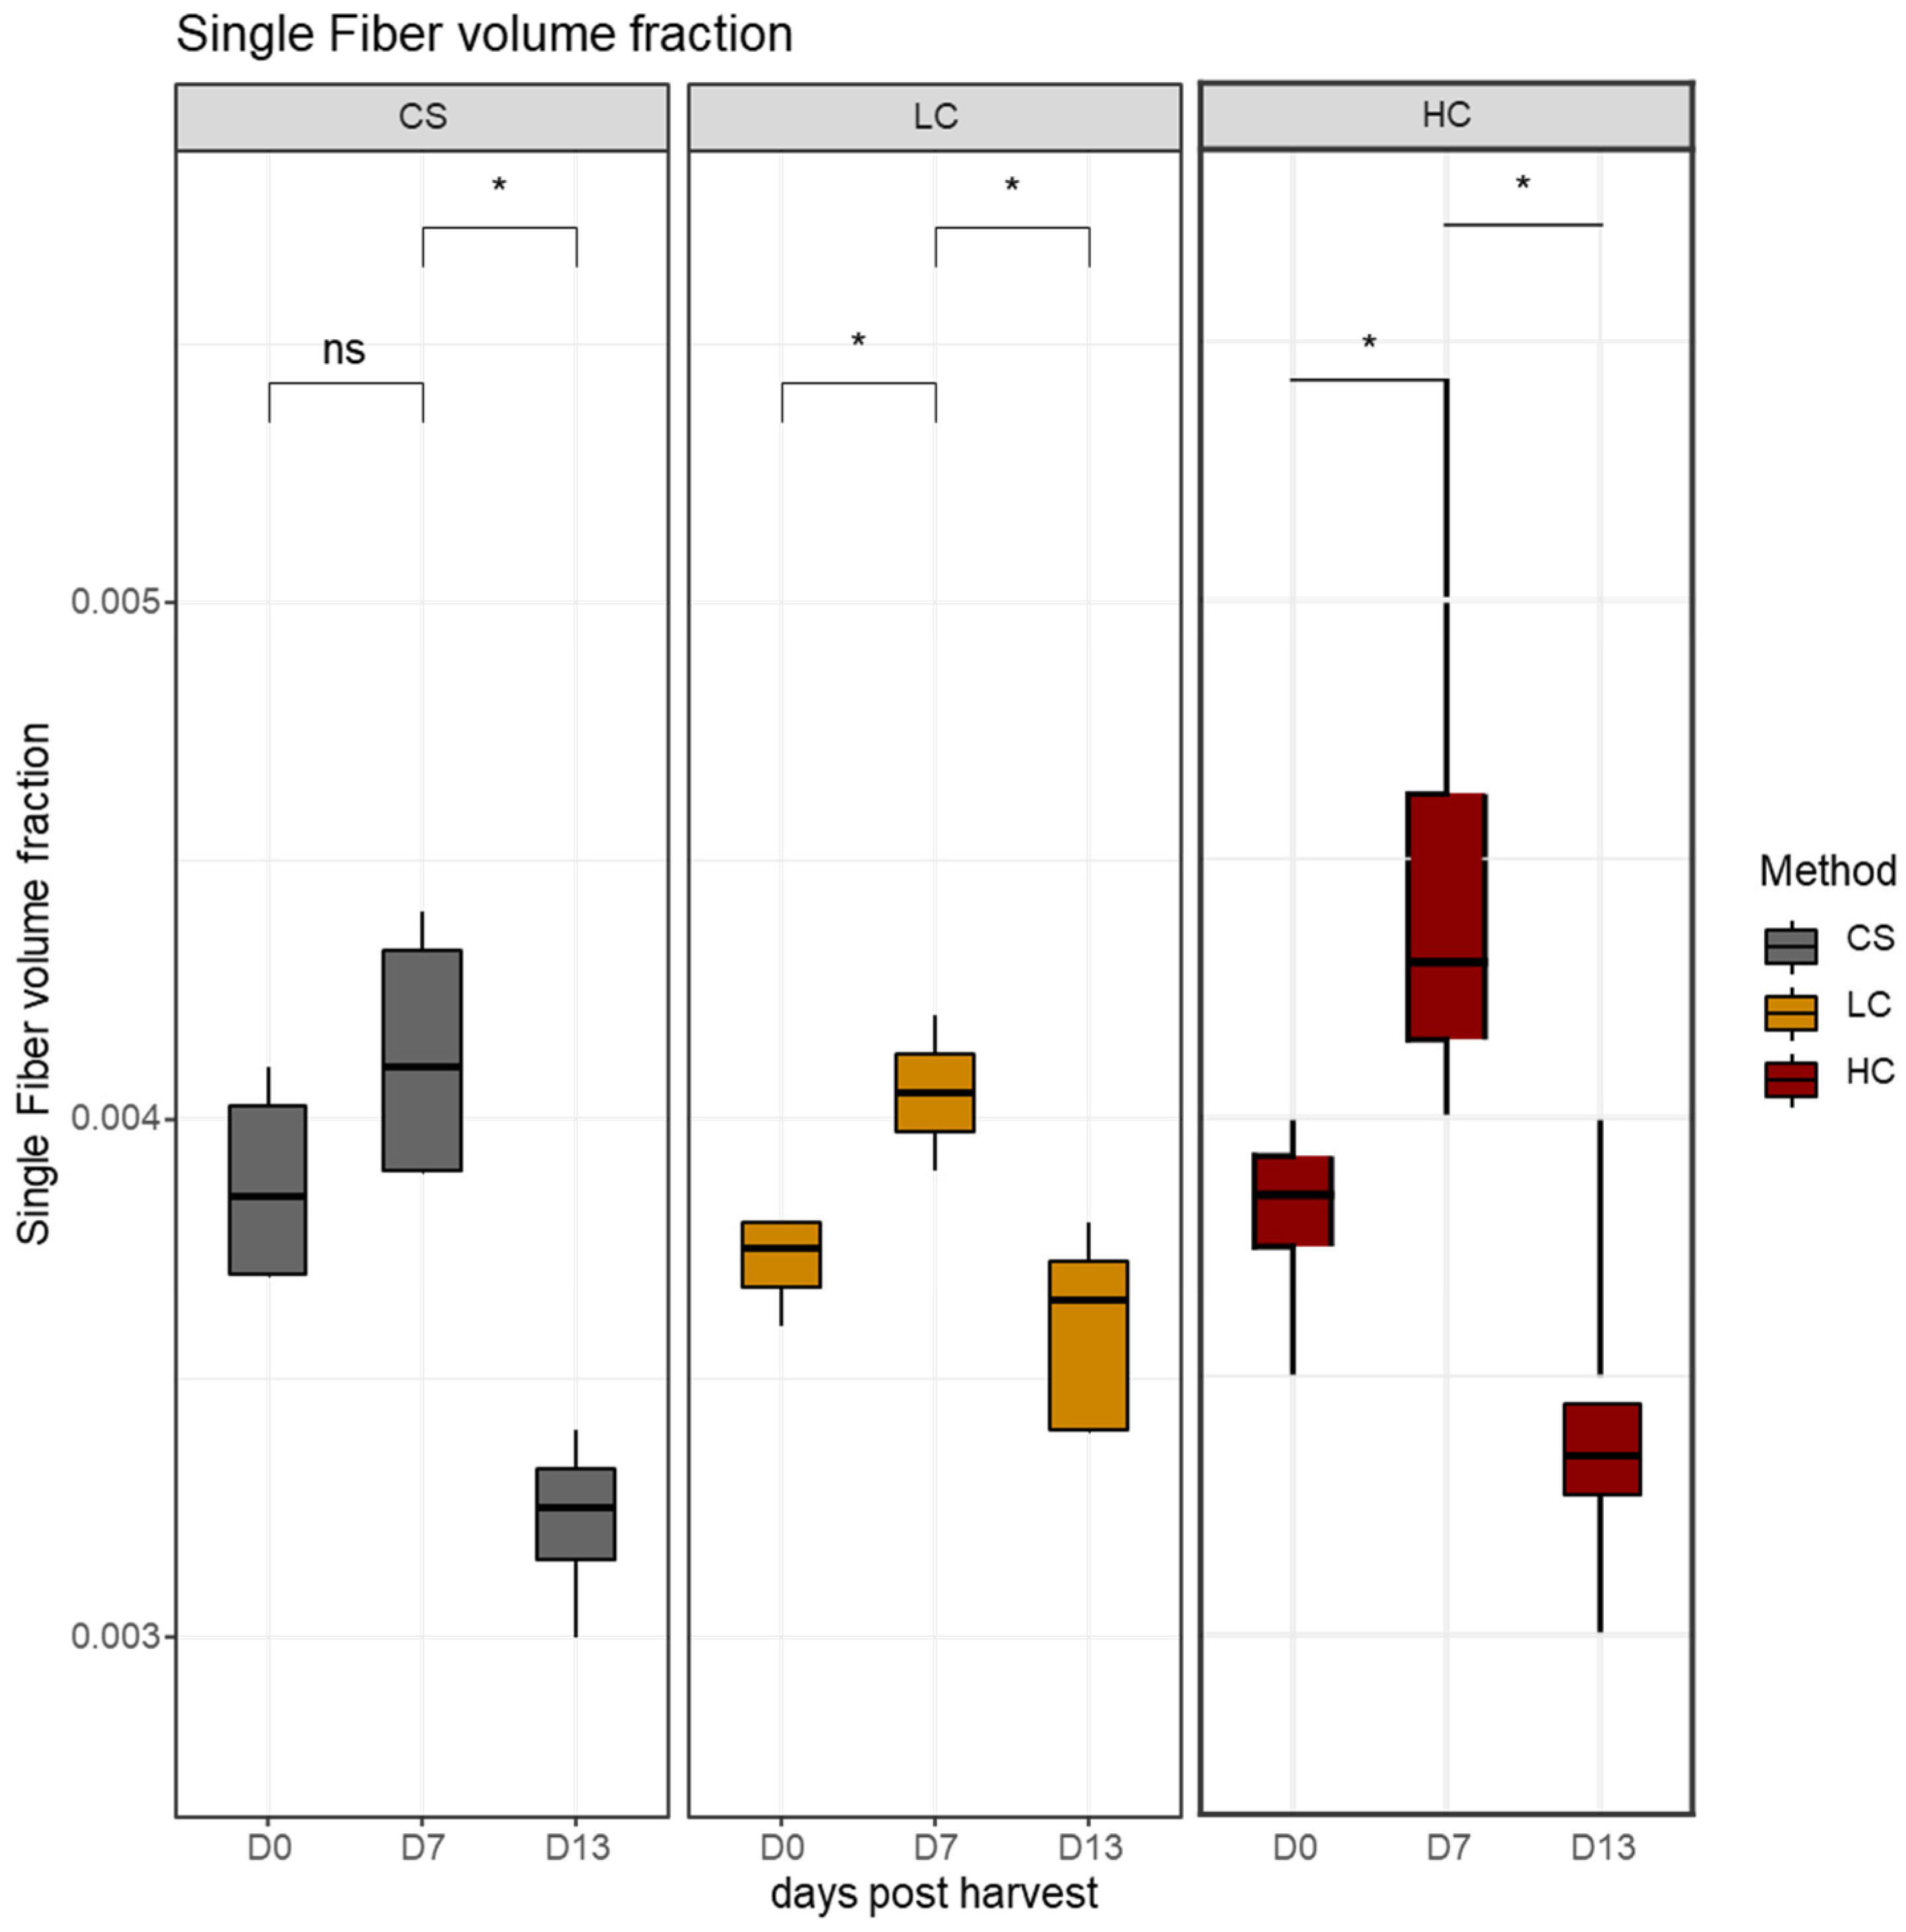
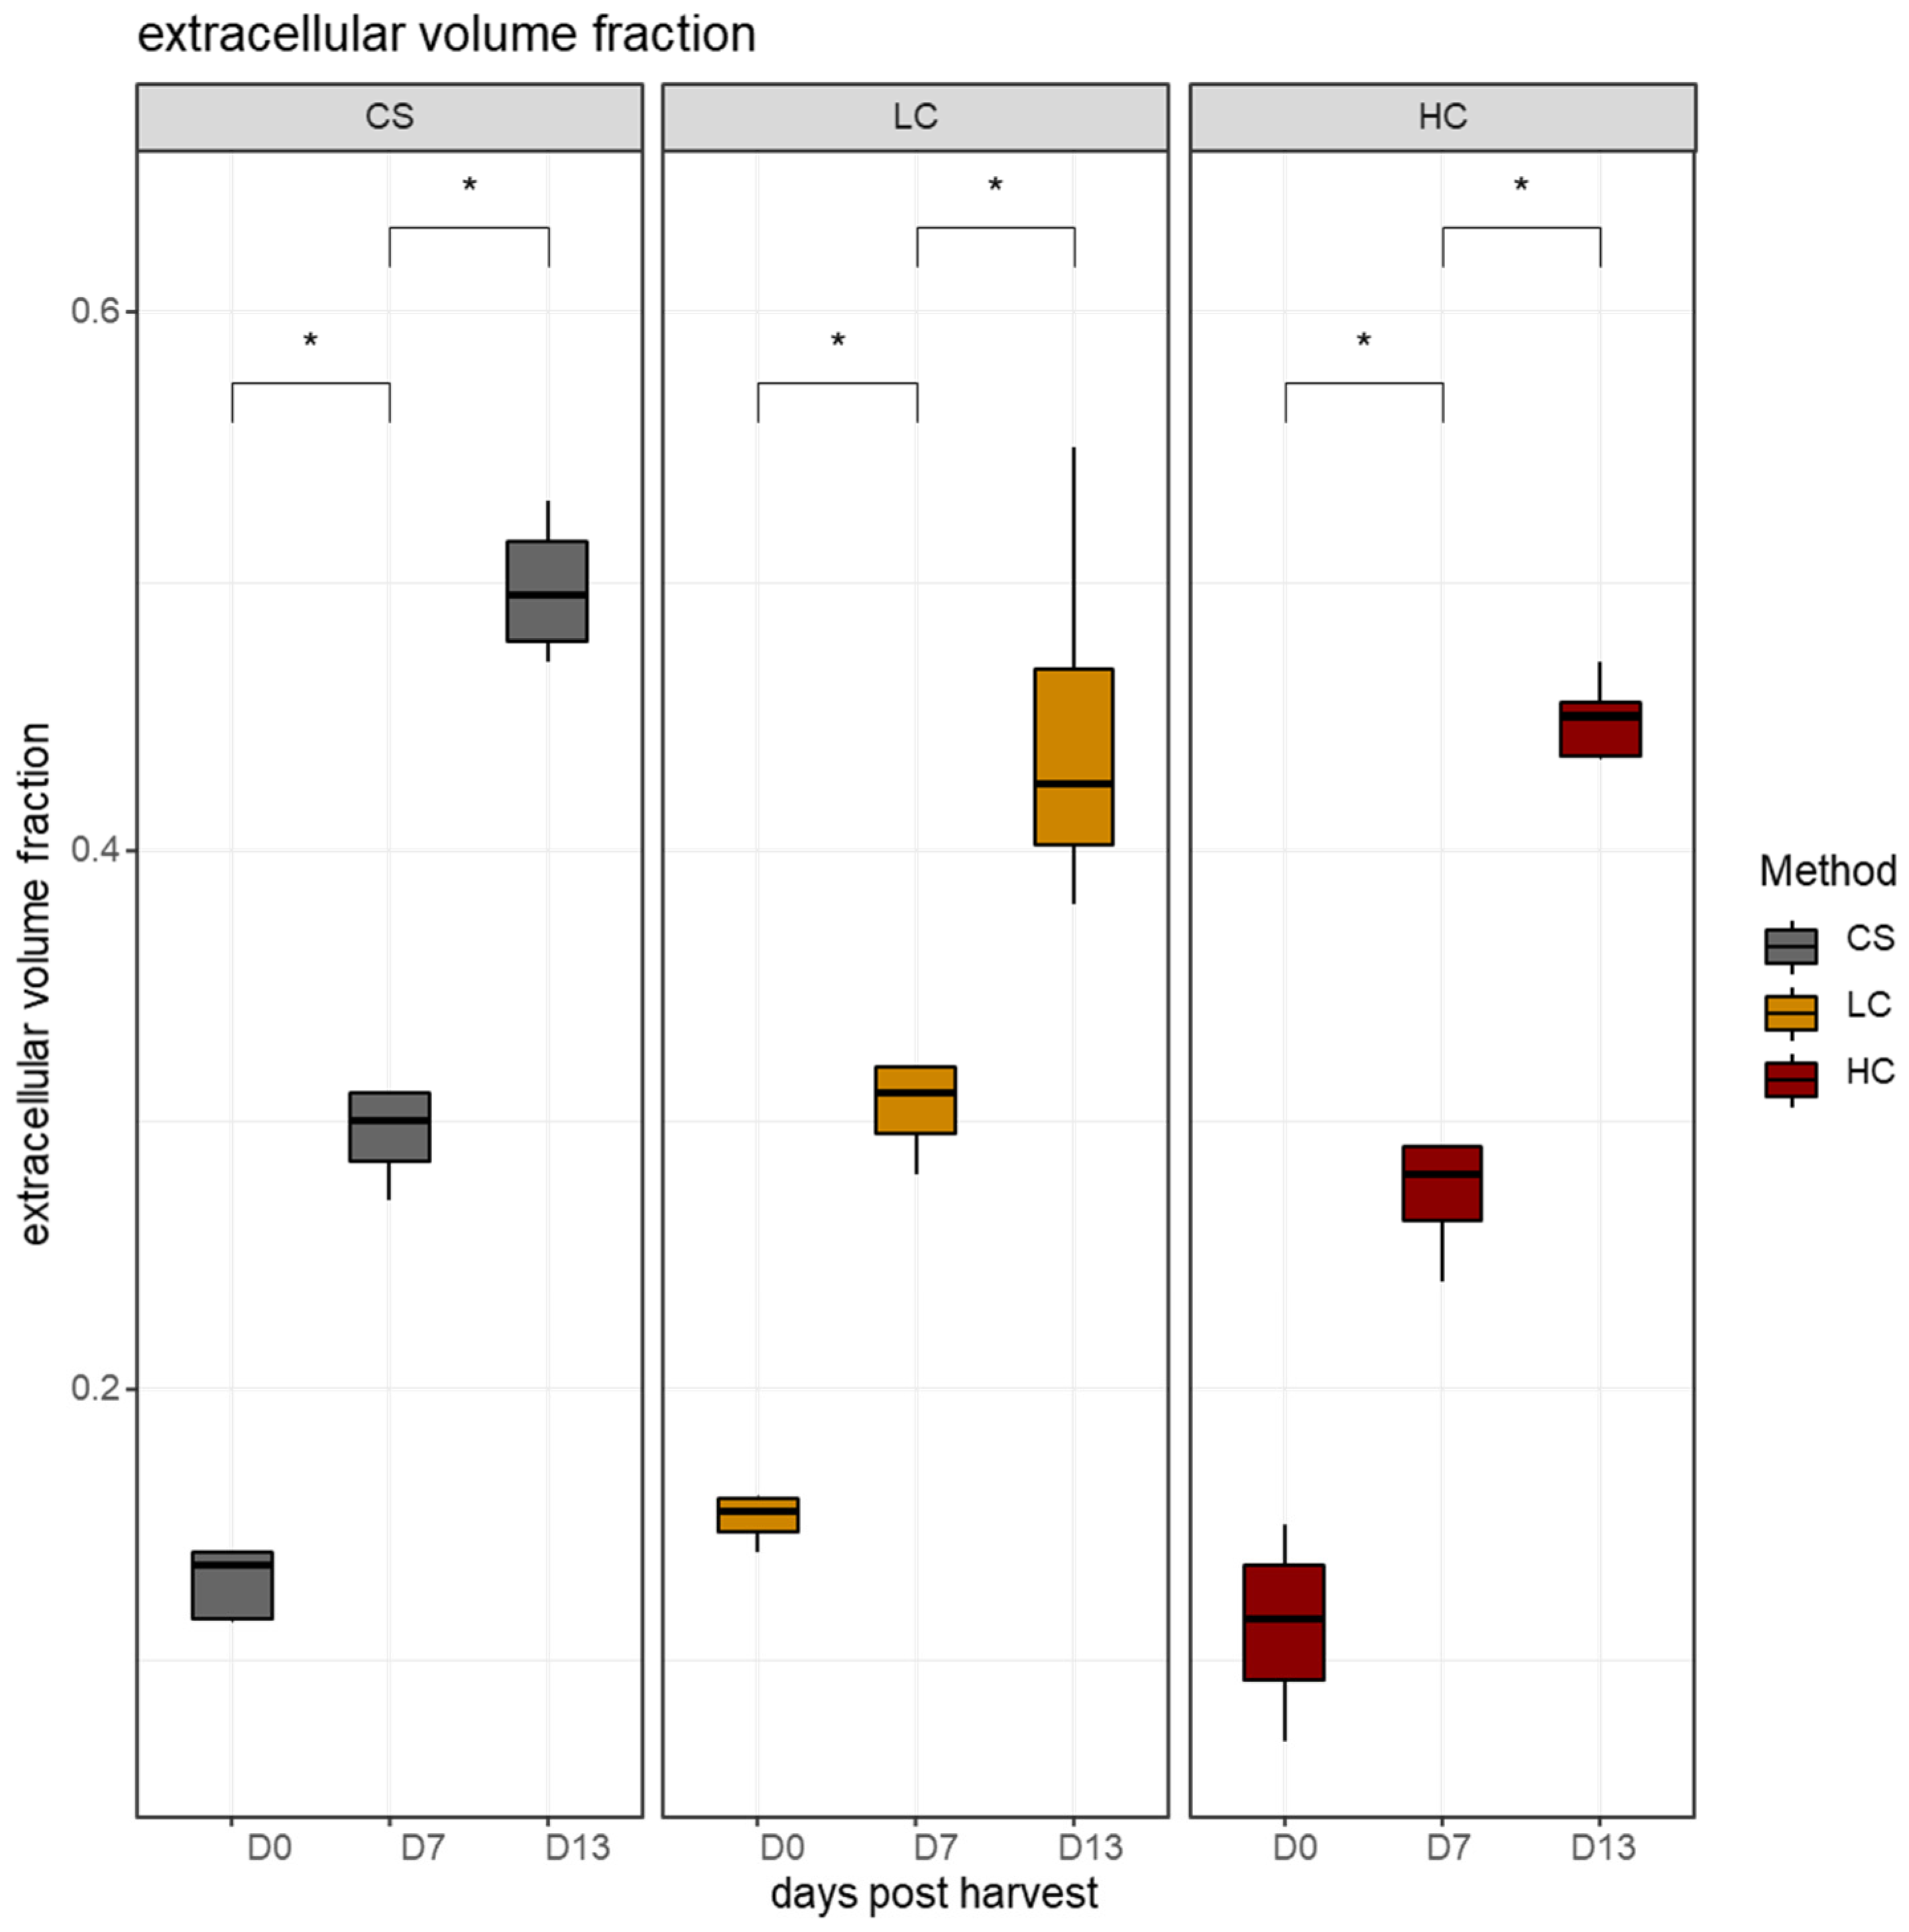
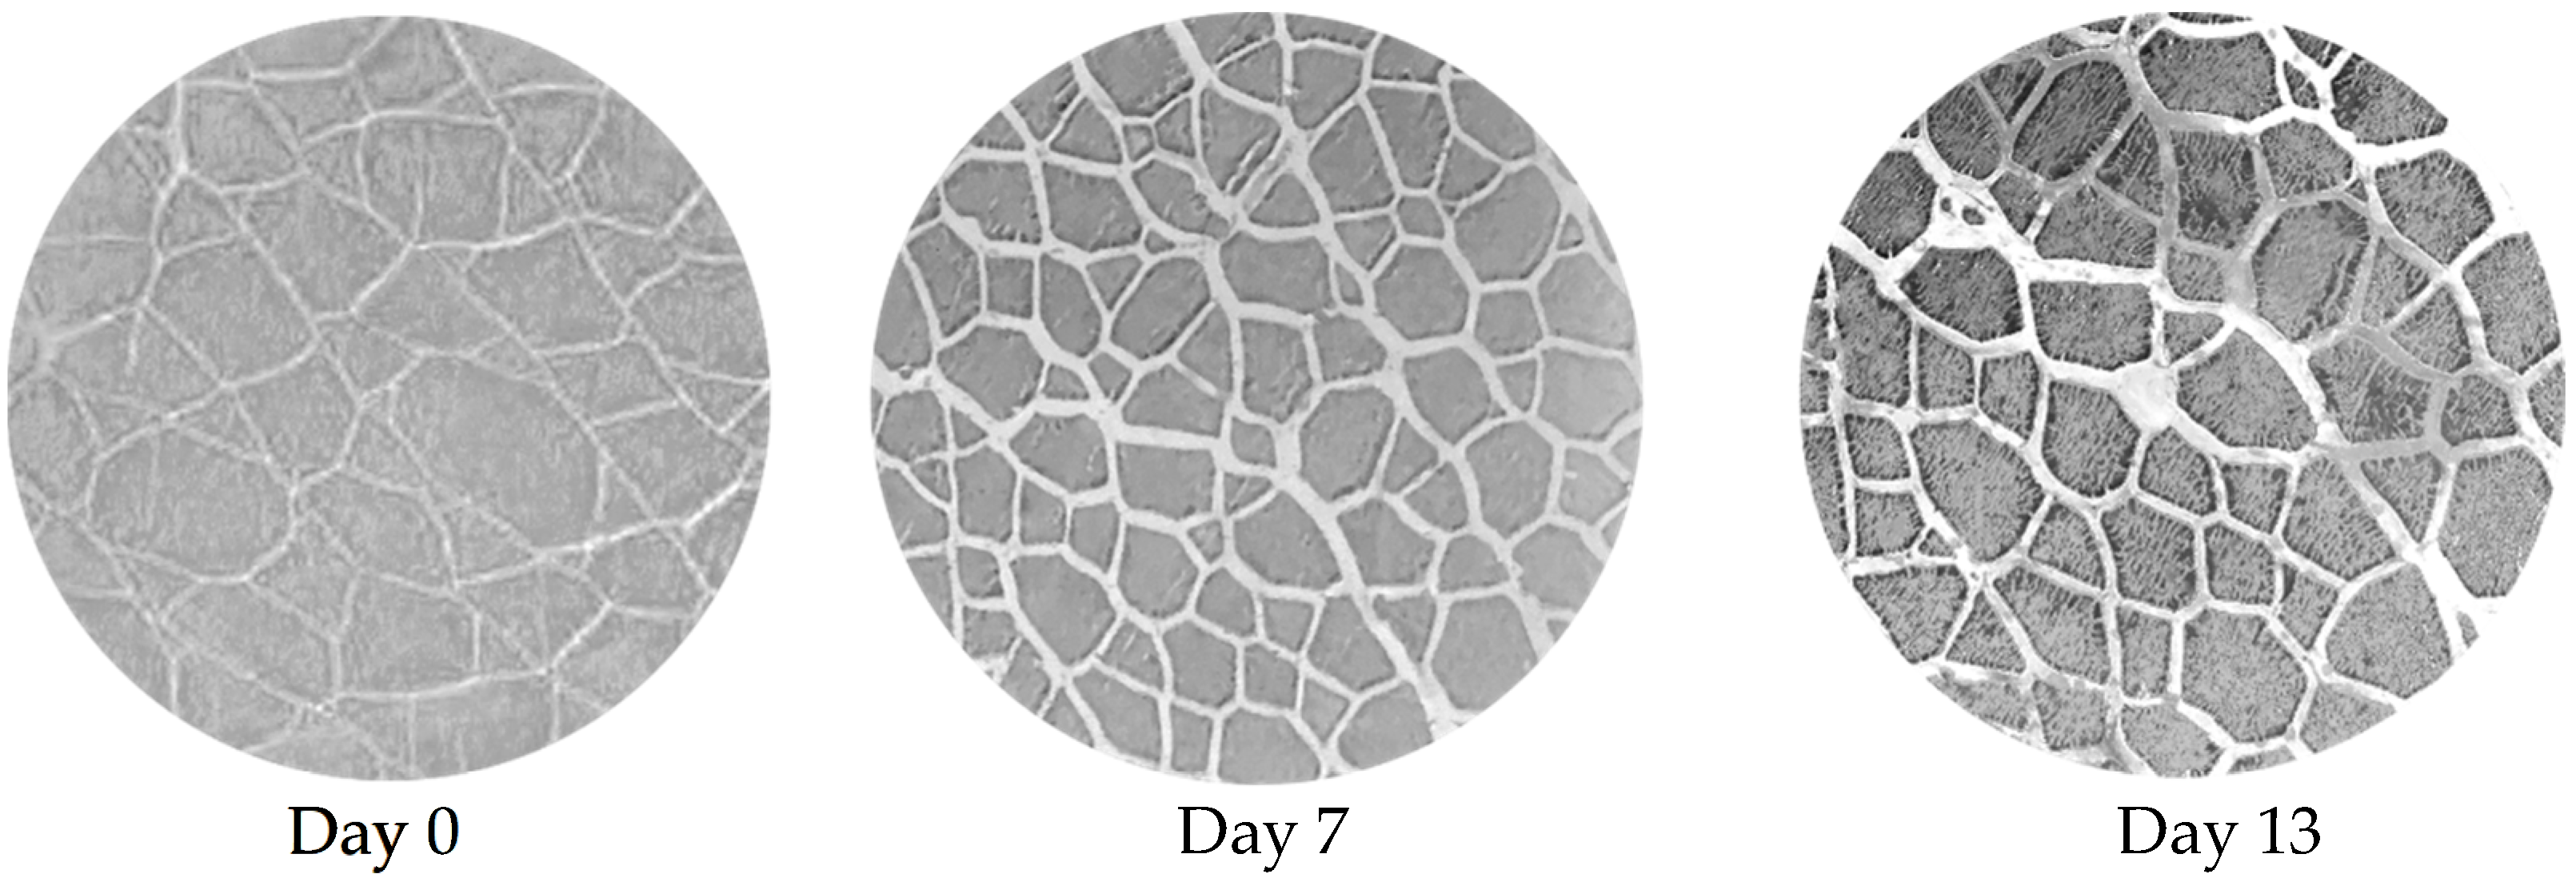
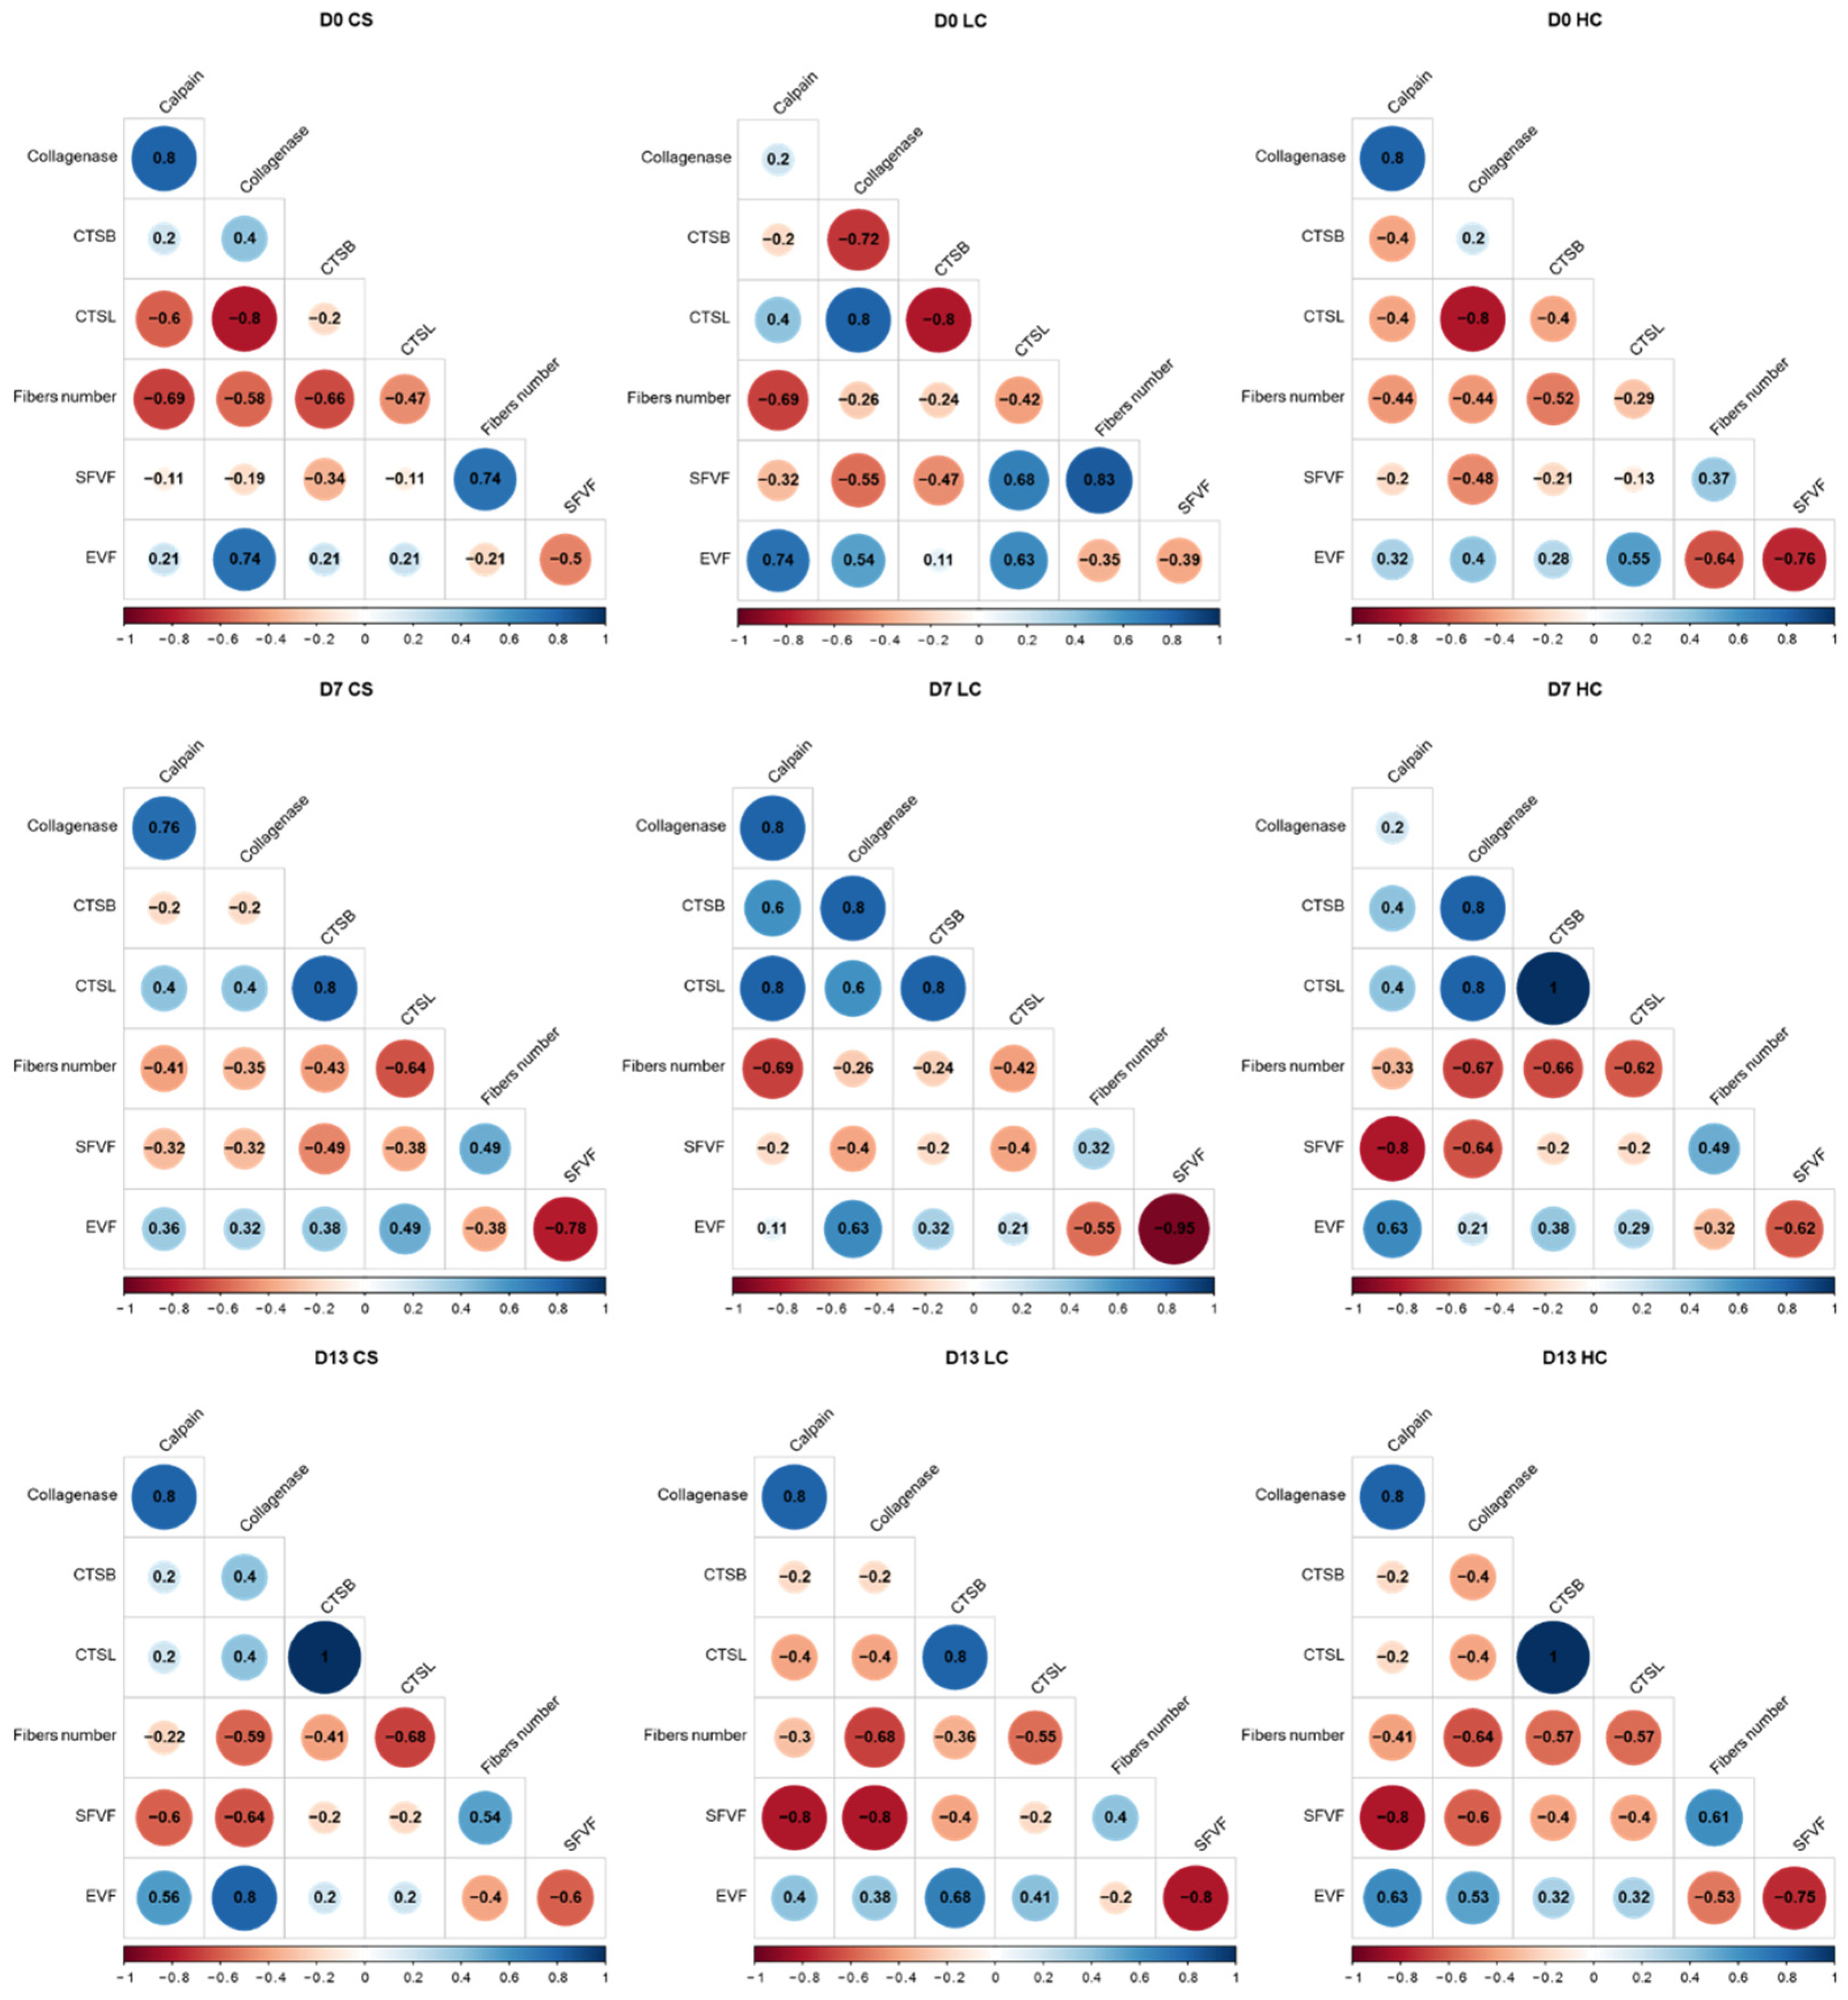
3.2. Stereological Analysis

The number of muscle fibers, the average single fiber volume density, and the volume density of the inter-fiber space were determined. Muscle fibers are the basic structural and functional units of striated muscle tissues. Myofibrils, or muscle fiber subunits, run longitudinally and parallel to each other in each muscle fiber. The structural and functional units of the myofibrils, take up the majority of the muscle fiber volume [39] and they are the targets of the endogenous proteases. Thus, flesh softening and loss of texture are mainly due to the muscle histological changes brought about by the action of proteases on muscle proteins and connective tissues [35].
The number of muscle fibers in the 10 μm2 area examined in this study significantly decreased between day 0 and day 7 regardless of the harvest method. A histological examination is a reliable tool used to prove how freezing and storage can affect the muscle structure. During storage, the distance between muscle fibers is increased due to physicochemical changes and enzymatic activity [39,40]. The number of fibers decreased further between day 7 and day 13 and this decrease was significant in groups CS and LC (Figure 5). As a result, the HC group exhibited the highest number of muscle fibers on day 13.
Changes in the number of muscle fibers within a standard area can be the result of changes in the average volume, changes in the intermyofibrillar space, or a combination of both. In the present study, the average single fiber volume density increased between days 0 and 7, irrelevant of the harvest method (Figure 6). This increase was significant in electro-stunned groups LC and HC, and it may be due to osmotic phenomena following changes in the intracellular membrane permeability and disruption of ion balance in the cytoplasm as reported in previous studies [34,41]. From this point onward, a significant decrease in average single fiber volume density followed in all groups by day 13 post-harvest, indicative of the intense degradation processes within the muscle fibers.
Proteases are principally responsible for the degradation of collagenous tissue, including the perimysium and endomysium connective tissues, as well as proteins located in the Z-line and H-zones. This can lead to an increased distance between muscle fibers [42]. The space between the muscle fibers increased significantly between sampling days in all harvest methods (Figure 7).
The muscle cross-sections in Figure 8 show the temporal changes in the histological phenotype. Notably, on day 0 (harvest day), there was a rather regular dispersion of muscle fibers and a compact shape. On day 7, inter-fiber spaces were enlarged probably due to loss of connective tissues, and some fibers appear to be damaged. Finally, by day 13 post-harvest, there was a greater loss of connective tissue, with fibers significantly separated and highly fragmented.
Previous studies indicated that fish myocommata disintegration is caused by the degradation of matrix proteoglycans, by proteases, resulting in the structural breakdown of the collagen [43]. No significant differences between sampling methods were recorded on harvest day and seven days later. By day 13, the space enlargement between muscle fibers had progressed, yet it was lower on average in the HC group, indicative of lower rates of disassembly of the myofibril complex and degradation of the connective tissue. A pattern was also revealed, showing a constant negative correlation between collagenase, the enzyme that degrades the collagenous fibrils. Likewise, the other proteolytic enzymes (calpain, cathepsin B and L) showed correlation patterns similar to collagenase, indicating that these enzymes likely function in a complimentary and synergistic way during the degradation of myofibrillar proteins (Figure 9) [44]. As a result, a constant positive correlation on all sampling days between all four proteolytic enzymes and the volume density of the inter-fiber space were recorded along with a similar negative correlation between the proteolytic enzymes and the volume density of single white muscle fibers (Figure 8).

4. Conclusions

Electrical stunning is recognized as a more humane and less stressful method for fish slaughter, as long as the electric field settings do not affect the quality of the fish post-harvest. In the present study, HC elicited the lowest proteolytic activity of calpain, collagenase, and cathepsin. A correlation between these enzymes with stress and pH levels was previously described [45,46]. Papaharisis et al., using a similar electrical stunning method on red seabream, found statistically significantly lower mean cortisol levels in the electrical stunning group [13]. The significant differentiation of proteolytic activity at HC conditions compared with the other methods explored here was also evident in the white muscle histology. Overall, the results of the present study support that electrically stunning red seabream via an electric field of 1.8 V/cm and a velocity of 1.6 m/s leads to lower activities of endogenous proteases and delayed fillet degradation compared with other harvest methods.

Author Contributions

Conceptualization, K.A.M. and L.P.; methodology, L.P. and R.A.; sampling, A.D. and R.A.; investigation, A.D. and R.A.; data curation, K.A.M. and R.A.; writing—original draft preparation, R.A.; writing—review and editing, K.A.M.; visualization, R.A.; supervision, K.A.M.; project administration, L.P. All authors have read and agreed to the published version of the manuscript.

Funding

This research was co-financed by Greece and the European Union, the European Maritime and Fisheries Fund, in the context of the implementation of the Greek Operational Programme for Fisheries, Priority Axis “Innovation in Aquaculture”, project title “Development and industrial scale evaluation of an innovative humane slaughter system and assessment of welfare in aquaculture marine fish species” MIS 5010690. Aquacj 02 00018 i001

Institutional Review Board Statement

Animals used in this study were reared in commercial installations registered for aquaculture production in EU countries, following certified procedures (GLOBAL GAP) of commercial production. The legislation and measures implemented by the commercial producers complied with existing national and EU (Directive 1998/58/EC) legislation (protection of animals kept for farming). The ultimate objective of the study was to avoid unnecessary pain and suffering during harvest.

Data Availability Statement

All data are provided in the article.

Conflicts of Interest

The authors declare no conflict of interest.

References

  1. Tavares, J.; Martins, A.; Fidalgo, L.; Lima, V.; Amaral, R.; Pinto, C.; Silva, A.; Saraiva, J. Fresh Fish Degradation and Advances in Preservation Using Physical Emerging Technologies. Foods 2021, 10, 780. [Google Scholar] [CrossRef] [PubMed]
  2. LeDuc, A.; Zatylny-Gaudin, C.; Robert, M.; Corre, E.; Le Corguille, G.; Castel, H.; Lefevre-Scelles, A.; Fournier, V.; Gisbert, E.; Andree, K.B.; et al. Dietary aquaculture by-product hydrolysates: Impact on the transcriptomic response of the intestinal mucosa of European seabass (Dicentrarchus labrax) fed low fish meal diets. BMC Genom. 2018, 19, 396. [Google Scholar] [CrossRef] [PubMed] [Green Version]
  3. Shouchun, L.; Wen, F.; Saiyi, Z.; Changwei, M.; Pinglan, L.; Kang, Z.; Zhaohui, P.; Meijun, Z. Quality evaluation of tray-packed tilapia fillets stored at 0 °C based on sensory, microbiological, biochemical and physical attributes. Afr. J. Biotechnol. 2010, 9, 692–701. [Google Scholar] [CrossRef] [Green Version]
  4. Duarte, A.M.; Silva, F.; Pinto, F.R.; Barroso, S.; Gil, M.M. Quality Assessment of Chilled and Frozen Fish—Mini Review. Foods 2020, 9, 1739. [Google Scholar] [CrossRef] [PubMed]
  5. Delbarre-Ladrat, C.; Verrez-Bagnis, V.; Noël, J.; Fleurence, J. Relative contribution of calpain and cathepsins to protein degradation in muscle of sea bass (Dicentrarchus labrax L.). Food Chem. 2004, 88, 389–395. [Google Scholar] [CrossRef] [Green Version]
  6. Cheret, R.; Ladrat, C.D.; Lamballerieanton, M.; Verrez-Bagnis, V. Calpain and cathepsin activities in post mortem fish and meat muscles. Food Chem. 2007, 101, 1474–1479. [Google Scholar] [CrossRef] [Green Version]
  7. Digre, H.; Erikson, U.; Misimi, E.; Lambooij, B.; van de Vis, H. Electrical stunning of farmed Atlantic cod Gadus morhua L.: A comparison of an industrial and experimental method. Aquac. Res. 2009, 41, 1190–1202. [Google Scholar] [CrossRef]
  8. Fanouraki, E.; Mylonas, C.; Papandroulakis, N.; Pavlidis, M. Species specificity in the magnitude and duration of the acute stress response in Mediterranean marine fish in culture. Gen. Comp. Endocrinol. 2011, 173, 313–322. [Google Scholar] [CrossRef]
  9. Daskalova, A. Farmed Fish Welfare: Stress, Post-Mortem Muscle Metabolism, and Stress-Related Meat Quality Changes; Springer: Berlin, Germany, 2019; Volume 11, pp. 113–124. [Google Scholar]
  10. Berg, T.; Erikson, U.; Nordtvedt, T. Rigor Mortis Assessment of Atlantic Salmon (Salmo salar) and Effects of Stress. J. Food Sci. 1997, 62, 439–446. [Google Scholar] [CrossRef]
  11. Morzel, M.; Van De Vis, H. Effect of the slaughter method on the quality of raw and smoked eels (Anguilla anguilla L.). Aquac. Res. 2003, 34, 1–11. [Google Scholar] [CrossRef]
  12. Morzel, M.; Sohier, D.; Van De Vis, H. Evaluation of slaughtering methods for turbot with respect to animal welfare and flesh quality. J. Sci. Food Agric. 2003, 83, 19–28. [Google Scholar] [CrossRef]
  13. Papaharisis, L.; Tsironi, T.; Dimitroglou, A.; Taoukis, P.; Pavlidis, M. Stress assessment, quality indicators and shelf life of three aquaculture important marine fish, in relation to harvest practices, water temperature and slaughter method. Aquac. Res. 2019, 50, 2608–2620. [Google Scholar] [CrossRef]
  14. Zampacavallo, G.; Parisi, G.; Mecatti, M.; Lupi, P.; Giorgi, G.; Poli, B.M. Evaluation of different methods of stunning/killing sea bass (Dicentrarchus labrax) by tissue stress/quality indicators. J. Food Sci. Technol. 2015, 52, 2585–2597. [Google Scholar] [CrossRef] [PubMed] [Green Version]
  15. Skjervold, P.O.; Fjæra, S.O.; Østby, P.B.; Einen, O. Live-chilling and crowding stress before slaughter of Atlantic salmon (Salmo salar). Aquaculture 2001, 192, 265–280. [Google Scholar] [CrossRef]
  16. Rorvik, K.-A.; Skjervold, P.O.; Fjaera, S.O.; Mørkøre, T.; Steien, S.H.; Fjæra, S.O. Body temperature and seawater adaptation in farmed Atlantic salmon and rainbow trout during prolonged chilling. J. Fish Biol. 2001, 59, 330–337. [Google Scholar] [CrossRef]
  17. Van De Vis, H.; Kestin, S.; Robb, D.; Oehlenschläger, J.; Lambooij, B.; Münkner, W.; Kuhlmann, H.; Kloosterboer, K.; Tejada, M.; Huidobro, A.; et al. Is humane slaughter of fish possible for industry? Aquac. Res. 2003, 34, 211–220. [Google Scholar] [CrossRef]
  18. Lambooij, B.; Gerritzen, M.A.; Reimert, H.; Burggraaf, D.; André, G.; Van De Vis, H. Evaluation of electrical stunning of sea bass (Dicentrarchus labrax) in seawater and killing by chilling: Welfare aspects, product quality and possibilities for implementation. Aquac. Res. 2008, 39, 50–58. [Google Scholar] [CrossRef]
  19. Llonch, P.; Lambooij, E.; Reimert, H.; Van De Vis, J. Assessing effectiveness of electrical stunning and chilling in ice water of farmed yellowtail kingfish, common sole and pike-perch. Aquaculture 2012, 364–365, 143–149. [Google Scholar] [CrossRef]
  20. Algers, B.; Blokhuis, H.J.; Bøtner, A.; Broom, D.M.; Costa, P.; Domingo, M.; Greiner, M.; Hartung, J.; Koenen, F.; Müller-Graf, C.; et al. Species-specific welfare aspects of the main systems of stunning and killing of farmed Atlantic Salmon. EFSA J. 2009, 7, 1011. [Google Scholar] [CrossRef] [Green Version]
  21. Sattari, A.; Lambooij, E.; Sharifi, H.; Abbink, W.; Reimert, H.; Van De Vis, J. Industrial dry electro-stunning followed by chilling and decapitation as a slaughter method in Claresse® (Heteroclarias sp.) and African catfish (Clarias gariepinus). Aquaculture 2010, 302, 100–105. [Google Scholar] [CrossRef]
  22. Lines, J.; Kestin, S. Electrical stunning of fish: The relationship between the electric field strength and water conductivity. Aquaculture 2004, 241, 219–234. [Google Scholar] [CrossRef] [Green Version]
  23. Lines, J.; Spence, J. Humane harvesting and slaughter of farmed fish. OIE Rev. Sci. Tech. 2014, 33, 255–264. [Google Scholar] [CrossRef] [PubMed]
  24. Federation of Greek Mariculture. Aquaculture in Greece 2020; Annual Report; FGM: Athens, Greece, 2020. [Google Scholar]
  25. Teixeira, B.; Fidalgo, L.; Mendes, R.; da Costa, G.; Cordeiro, C.; Marques, A.; Saraiva, J.; Nunes, M.L. Changes of Enzymes Activity and Protein Profiles Caused by High-Pressure Processing in Sea Bass (Dicentrarchus labrax) Fillets. J. Agric. Food Chem. 2013, 61, 2851–2860. [Google Scholar] [CrossRef] [PubMed]
  26. Barrett, A.J.; Kirschke, H. Cathepsin B, cathepsin H, and cathepsin L. Methods Enzymol. 1981, 80, 535–561. [Google Scholar] [CrossRef]
  27. Bradford, M.M. A rapid and sensitive method for the quantitation of microgram quantities of protein utilizing the principle of protein-dye binding. Anal. Biochem. 1976, 72, 248–254. [Google Scholar] [CrossRef]
  28. Ntzimani, A.; Angelakopoulos, R.; Semenoglou, I.; Dermesonlouoglou, E.; Tsironi, T.; Moutou, K.; Taoukis, P. Slurry ice as an alternative cooling medium for fish harvesting and transportation: Study of the effect on seabass flesh quality and shelf life. Aquac. Fish. 2021, in press. [Google Scholar] [CrossRef]
  29. Georgiou, S.; Alami-Durante, H.; Power, D.M.; Sarropoulou, E.; Mamuris, Z.; Moutou, K.A. Transient up- and down-regulation of expression of myosin light chain 2 and myostatin mRNA mark the changes from stratified hyperplasia to muscle fiber hypertrophy in larvae of gilthead sea bream (Sparus aurata L.). Cell Tissue Res. 2016, 363, 541–554. [Google Scholar] [CrossRef]
  30. Weibel, E.R.; Staubli, W.; Gnagi, H.R.; Hess, F.A. Correlated Morphometric and Biochemical Studies on the Liver Cell: I. Morphometric Model, Stereologic Methods, and Normal Morphometric Data for Rat Liver. J. Cell Biol. 1969, 42, 68–91. [Google Scholar] [CrossRef]
  31. Weibel, E.R. Morphometry of the human lung: The state of the art after two decades. Bull. Eur. Physiopathol. Respir. 1979, 15, 999–1013. [Google Scholar]
  32. Schindelin, J.; Arganda-Carreras, I.; Frise, E.; Kaynig, V.; Longair, M.; Pietzsch, T.; Preibisch, S.; Rueden, C.; Saalfeld, S.; Schmid, B.; et al. Fiji: An open-source platform for biological-image analysis. Nat. Methods 2012, 9, 676–682. [Google Scholar] [CrossRef] [Green Version]
  33. RStudio Team. RStudio: Integrated Development Environment for R 2020; RStudio, PBC: Boston, MA, USA, 2020. [Google Scholar]
  34. Caballero, M.; Betancor, M.; Escrig, J.; Montero, D.; Monteros, A.E.D.L.; Castro, P.; Ginés, R.; Izquierdo, M. Post mortem changes produced in the muscle of sea bream (Sparus aurata) during ice storage. Aquaculture 2009, 291, 210–216. [Google Scholar] [CrossRef]
  35. Mendes, R. Technological processing of fresh gilthead seabream (Sparus aurata): A review of quality changes. Food Rev. Int. 2018, 35, 20–53. [Google Scholar] [CrossRef]
  36. Irianto, H.E. Enzymes in Fermented Fish. Adv. Food Nutr. Res. 2017, 80, 199–216. [Google Scholar] [CrossRef]
  37. Bao, Y.; Wang, K.; Yang, H.; Regenstein, J.M.; Ertbjerg, P.; Zhou, P. Protein degradation of black carp (Mylopharyngodon piceus) muscle during cold storage. Food Chem. 2020, 308, 125576. [Google Scholar] [CrossRef] [PubMed]
  38. Xu, Y.; Jiang, X.; Ge, L.; Zang, J.; Xia, W.; Jiang, Q. Inhibitory Effect of Edible Additives on Collagenase Activity and Softening of Chilled Grass Carp Fillets. J. Food Process. Preserv. 2017, 41, e12836. [Google Scholar] [CrossRef]
  39. Strateva, M.; Penchev, G. Histological, Physicochemical and Microbiological Changes in Fresh and Frozen/Thawed Fish. Trakia J. Sci. 2020, 18, 69–80. [Google Scholar] [CrossRef]
  40. Hu, R.; Zhang, M.; Liu, W.; Mujumdar, A.S.; Bai, B. Novel synergistic freezing methods and technologies for enhanced food product quality: A critical review. Compr. Rev. Food Sci. Food Saf. 2022, 21, 1979–2001. [Google Scholar] [CrossRef] [PubMed]
  41. Zhang, L.; Zhang, Y.; Jia, S.; Li, Y.; Li, Q.; Li, K.; Hong, H.; Luo, Y. Stunning stress-induced textural softening in silver carp (Hypophthalmichthys molitrix) fillets and underlying mechanisms. Food Chem. 2019, 295, 520–529. [Google Scholar] [CrossRef]
  42. Singh, A.; Benjakul, S. Proteolysis and Its Control Using Protease Inhibitors in Fish and Fish Products: A Review. Compr. Rev. Food Sci. Food Saf. 2018, 17, 496–509. [Google Scholar] [CrossRef] [Green Version]
  43. Ayala, M.D.; Abdel, I.; Santaella, M.; Martínez, C.; Periago, M.J.; Gil, F.; Blanco, A.; Albors, O.L. Muscle tissue structural changes and texture development in sea bream, Sparus aurata L., during post-mortem storage. LWT Food Sci. Technol. 2010, 43, 465–475. [Google Scholar] [CrossRef]
  44. Ge, L.; Xu, Y.; Xia, W.; Jiang, Q. Synergistic action of cathepsin B, L, D and calpain in disassembly and degradation of myofibrillar protein of grass carp. Food Res. Int. 2018, 109, 481–488. [Google Scholar] [CrossRef] [PubMed]
  45. Ohmori, T.; Shigehisa, T.; Taji, S.; Hayashi, R. Biochemical Effects of High Hydrostatic Pressure on the Lysosome and Proteases Involved in It. Biosci. Biotechnol. Biochem. 1992, 56, 1285–1288. [Google Scholar] [CrossRef] [Green Version]
  46. Sentandreu, M.; Coulis, G.; Ouali, A. Role of muscle endopeptidases and their inhibitors in meat tenderness. Trends Food Sci. Technol. 2002, 13, 400–421. [Google Scholar] [CrossRef]
Figure 1. Enzymatic activity of calpain in all sampling days per harvest method. CS (gray): control group, LC (orange): low current group, HC (red): high current group. Superscripts indicate statistically significant differences between sampling days in each harvest method (ns: p > 0.05, NS. = 1, *: p < 0.05, **: p < 0.01, ***: p < 0.001).
Aquacj 02 00018 g001
Figure 2. Enzymatic activity of collagenase in all sampling days per harvest method. CS (gray): control group, LC (orange): low current group, HC (red): high current group. Superscripts indicate statistically significant differences between sampling days in each harvest method (ns: p > 0.05, *: p < 0.05, **: p < 0.01, ***: p < 0.001).
Aquacj 02 00018 g002
Figure 3. Enzymatic activity of cathepsin L in all sampling days per harvest method. CS (gray): control group, LC (orange): low current group, HC (red): high current group. Superscripts indicate statistically significant differences between days in each harvest method (ns: p > 0.05, *: p < 0.05, ***: p < 0.001).
Aquacj 02 00018 g003
Figure 4. Enzymatic activity of cathepsin B in all sampling days per harvest method. CS (gray): control group, LC (orange): low current group, HC (red): high current group. Superscripts indicate statistically significant differences between days in each harvest method (ns: p > 0.05, *: p < 0.05, **: p < 0.01, ***: p < 0.001).
Aquacj 02 00018 g004
Figure 5. Number of white muscle fibers in the 10 μm2 area in sampling days per harvest method. CS (gray): Control group, LC (orange): Low current group, HC (red): High current group. Superscripts indicate statistically significant differences between days in each harvest method (NS. = 1, *: p < 0.05).
Aquacj 02 00018 g005
Figure 6. The volume density of single white muscle fibers in sampling days per harvest method. CS (gray): control group, LC (orange): low current group, HC (red): high current group. Superscripts indicate statistically significant differences between days in each harvest method (ns: p > 0.05, *: p < 0.05).
Aquacj 02 00018 g006
Figure 7. The volume density of the inter-fiber space in sampling days per harvest method. CS (gray): control group, LC (orange): low current group, HC (red): high current group. Superscripts indicate statistically significant differences between days in each harvest method (*: p < 0.05).
Aquacj 02 00018 g007
Figure 8. Cross-sections of white muscle fillets stained with H&E. The sections are representative of the fillet structure on harvest day (day 0), and 7- and 13-days post-harvest. The temporal differences in white muscle structure did not differentiate from the harvest method.
Aquacj 02 00018 g008
Figure 9. Pairwise correlation coefficients of proteolytic enzymes and muscle fiber properties in the control group (D0 CS: control group day 0, D7 CS: control group day 7 post-harvest, D13 CS: control group day 13 post-harvest), low current treatment group (D0 LC: low current treatment group day 0, D7 LC: low current treatment group day 7 post-harvest, D13 LC: low current treatment group day 13 post-harvest) and high current treatment group (D0 HC: high current treatment group day 0, D7 HC: high current treatment group day 7 post-harvest, D13 HC: high current treatment group day 13 post-harvest) treatment groups. SFVF: single fiber volume fraction, EVF: extracellular volume fraction, CTSB: cathepsin B, CTSL: cathepsin L. Spearman’s correlation coefficient (rho) is shown. The intensity of the color and the size of the circle are proportional to the correlation coefficient.
Aquacj 02 00018 g009
Table 1. Properties of the electric field applied in electrical stunning; the water conductivity, waveform type, amperage, electric field, and frequency for each electrical stunning (LC: Lower current treatment; HC: Higher current treatment) setting are shown; the velocity, exposure, and length of the water pipe are also specified.
PropertiesLCHC
Water Conductivity50 ms/cm50 ms/cm
WaveformAC (sinusoidal voltage)AC (sinusoidal voltage)
Amperage27 A48 A
Electric field1.5 V/cm1.8 V/cm
Frequency1000 Hz1000 Hz
Velocity1.6 m/s1.6 m/s
Exposure9 s9 s
Water pipe length14 m14 m
Publisher’s Note: MDPI stays neutral with regard to jurisdictional claims in published maps and institutional affiliations.

