
Influence of pH, N, P, N: P Ratio, and Dissolved Inorganic Carbon on Ulva ohnoi Growth and Biomass Quality: Potential Implications in IMTA-RAS
 , and
, and 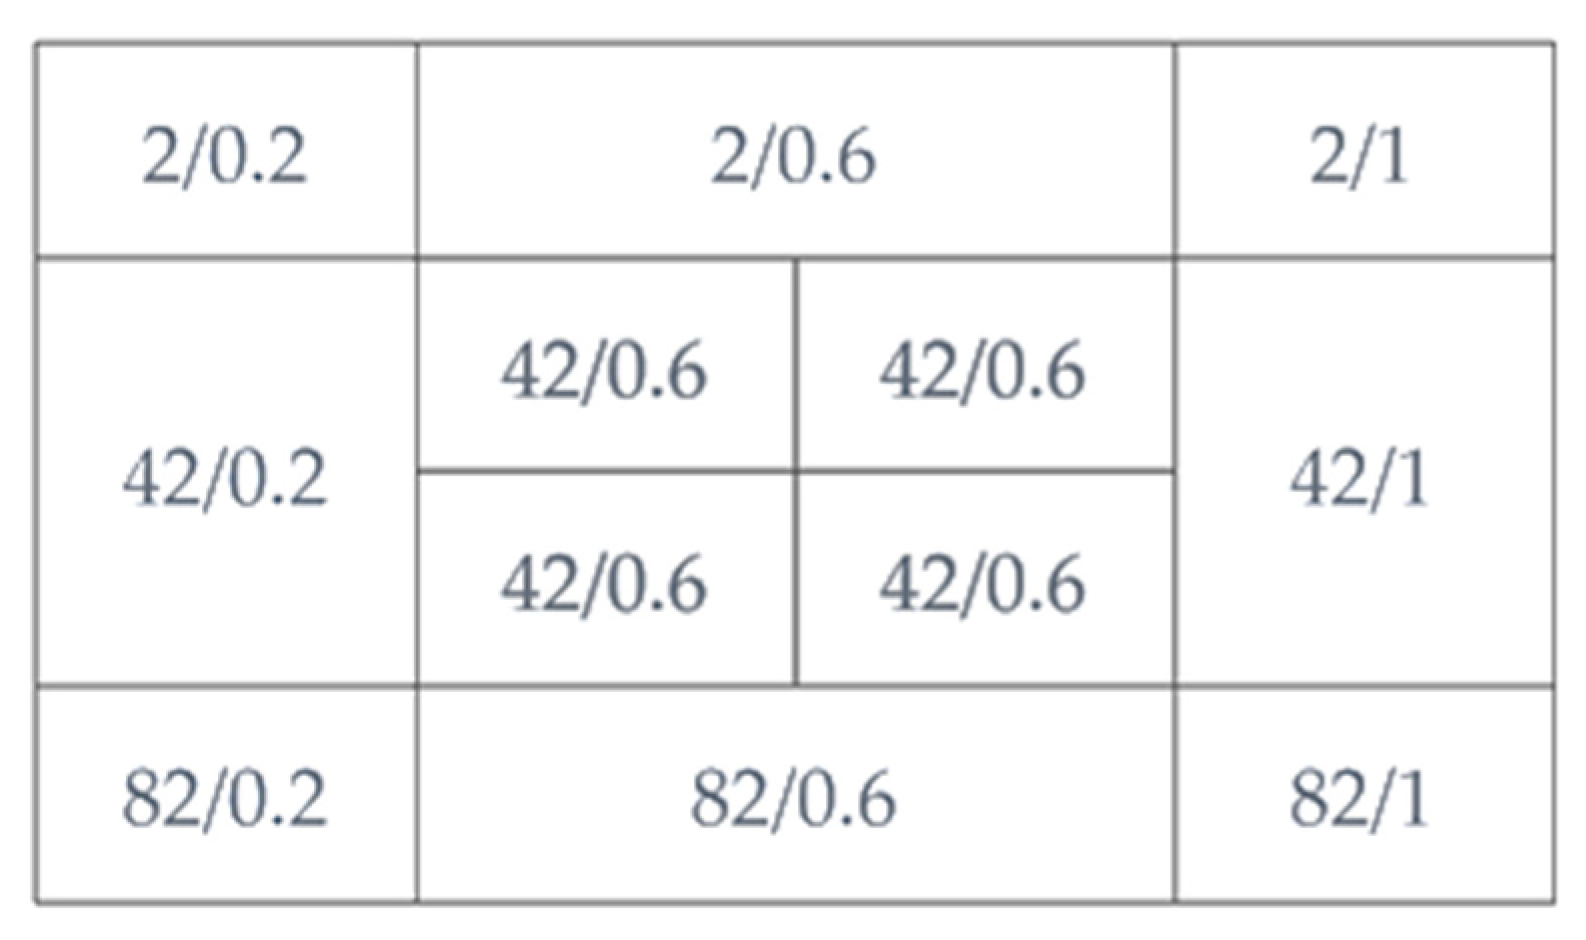
Abstract
:1. Introduction
2. Materials and Methods
2.1. Ulva ohnoi Clone: Morphological, Compositional and Physiological Characteristics
2.2. Measurement of Basic Water Parameters
2.3. Influence of the Variations in pH and DIC
2.4. Influence of N, P Levels, and N: P Ratio
2.5. Statistical Analysis
3. Results
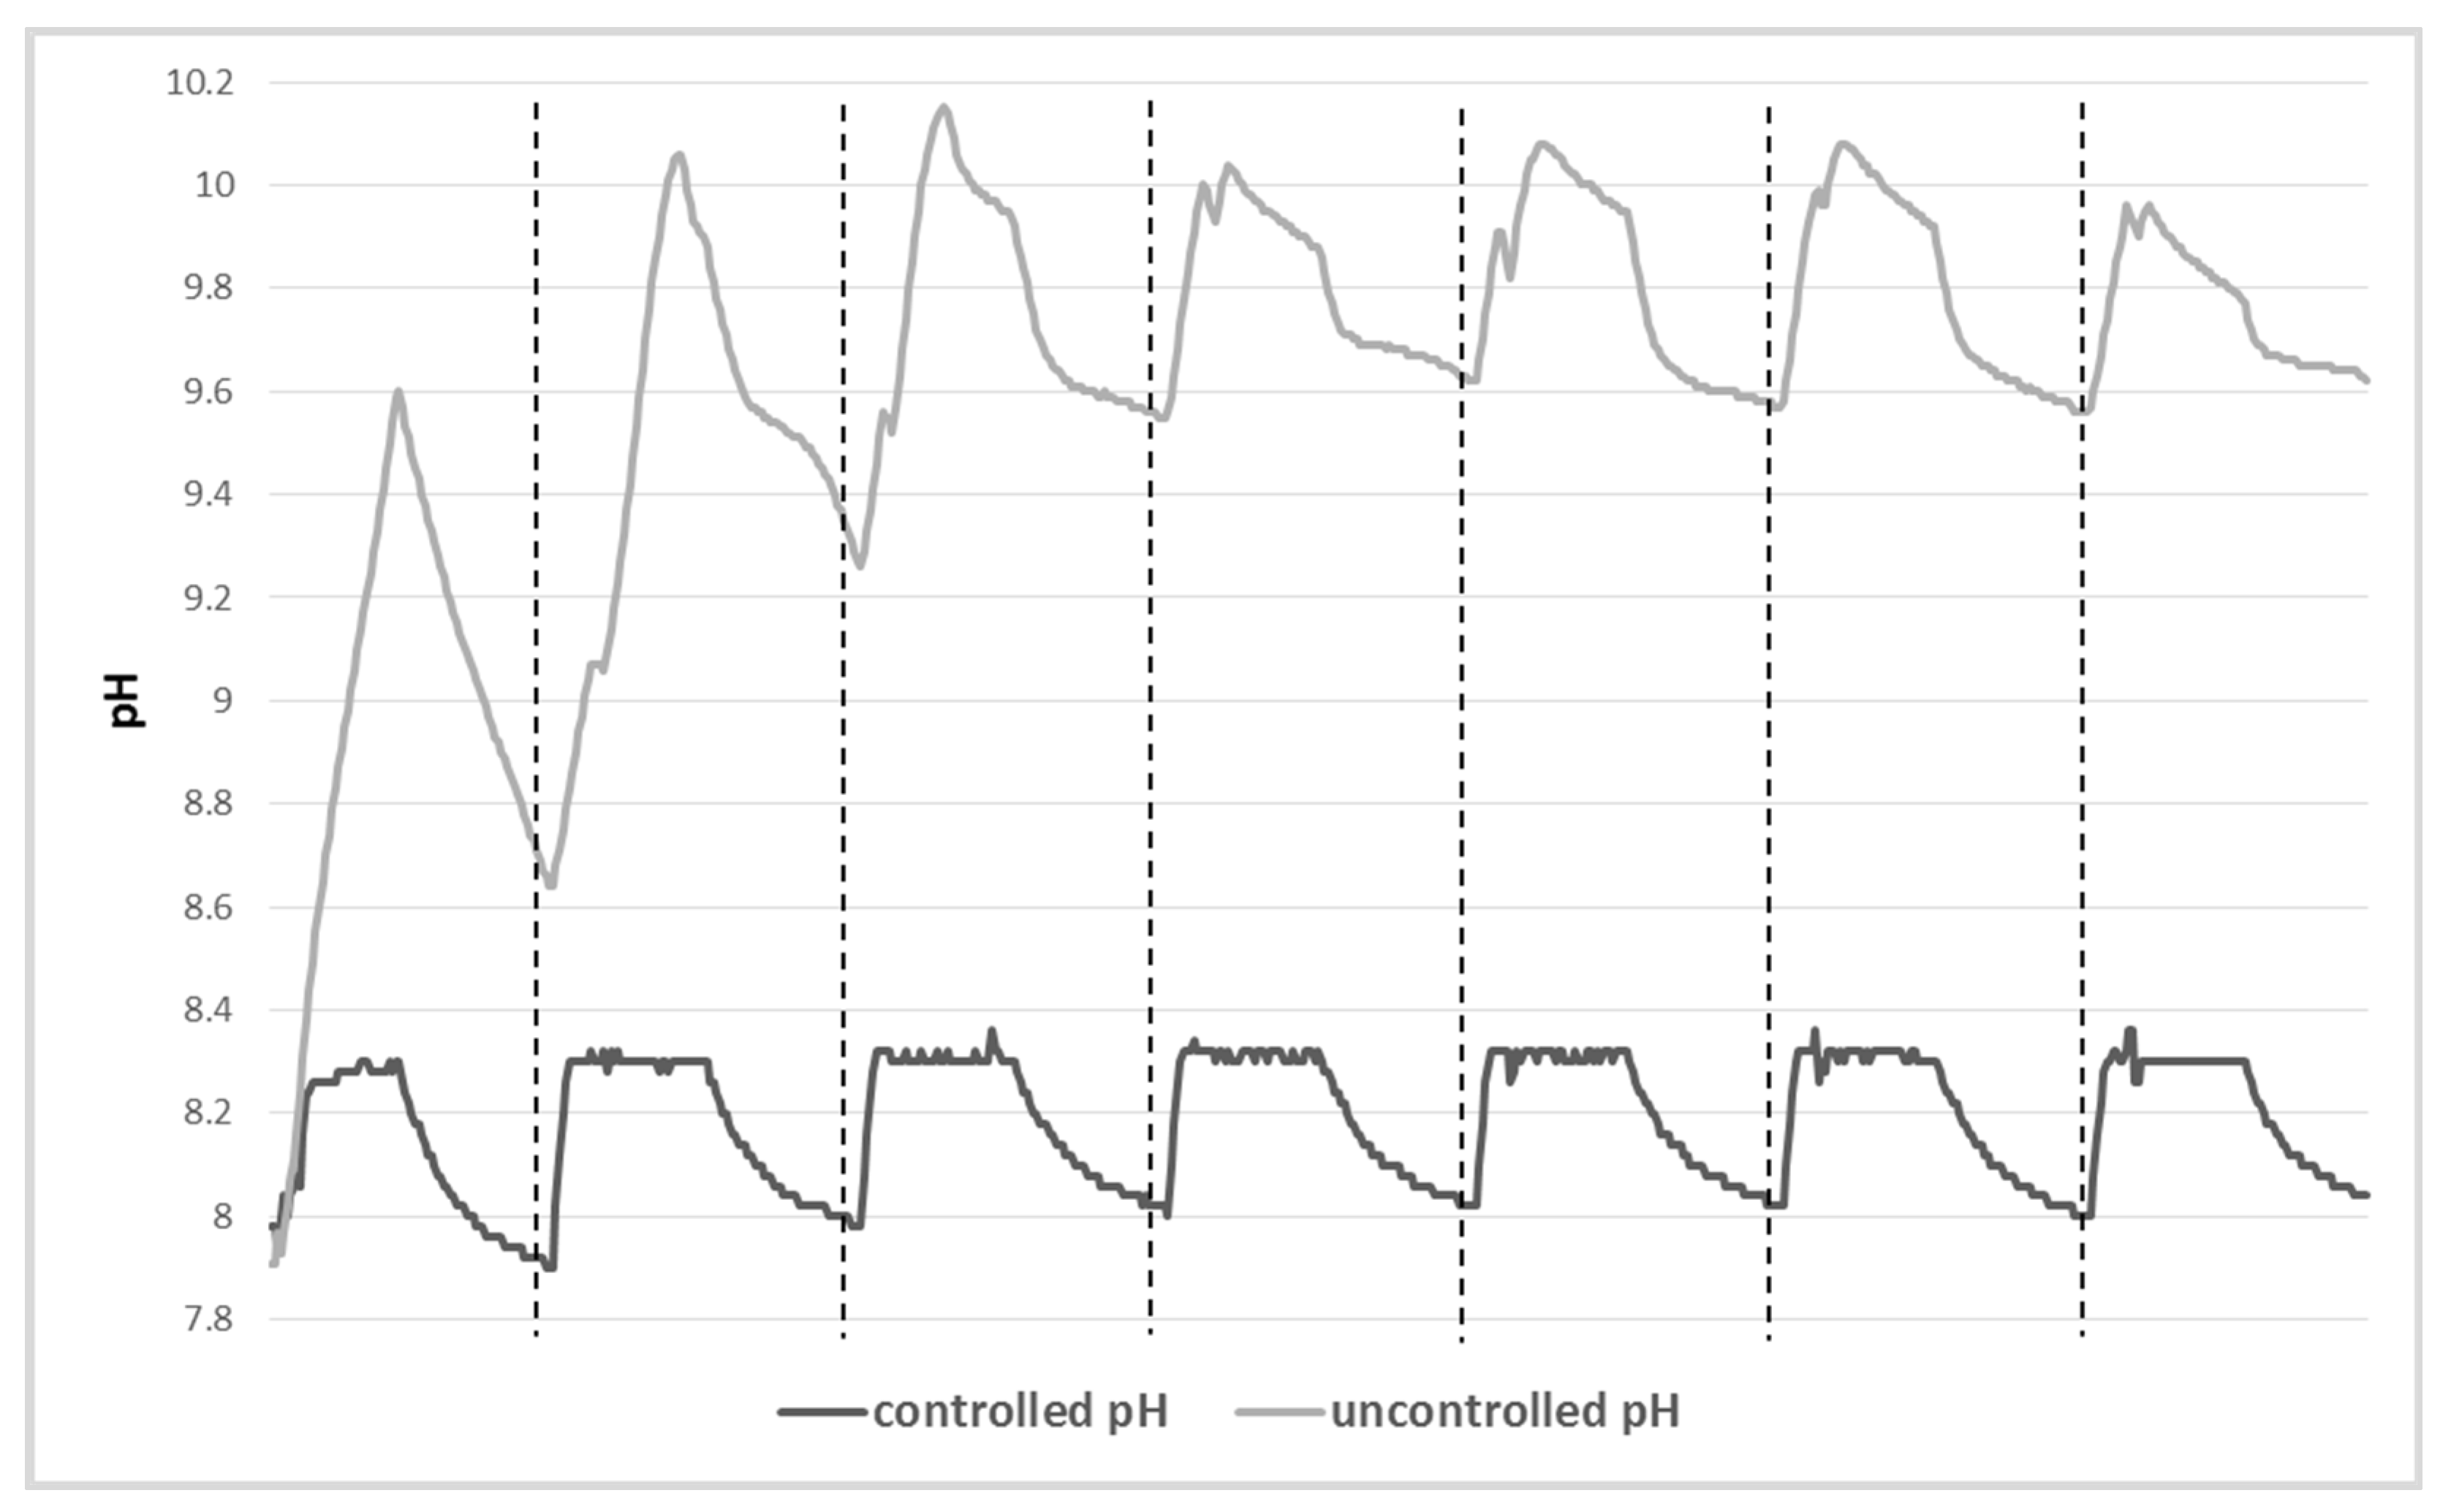
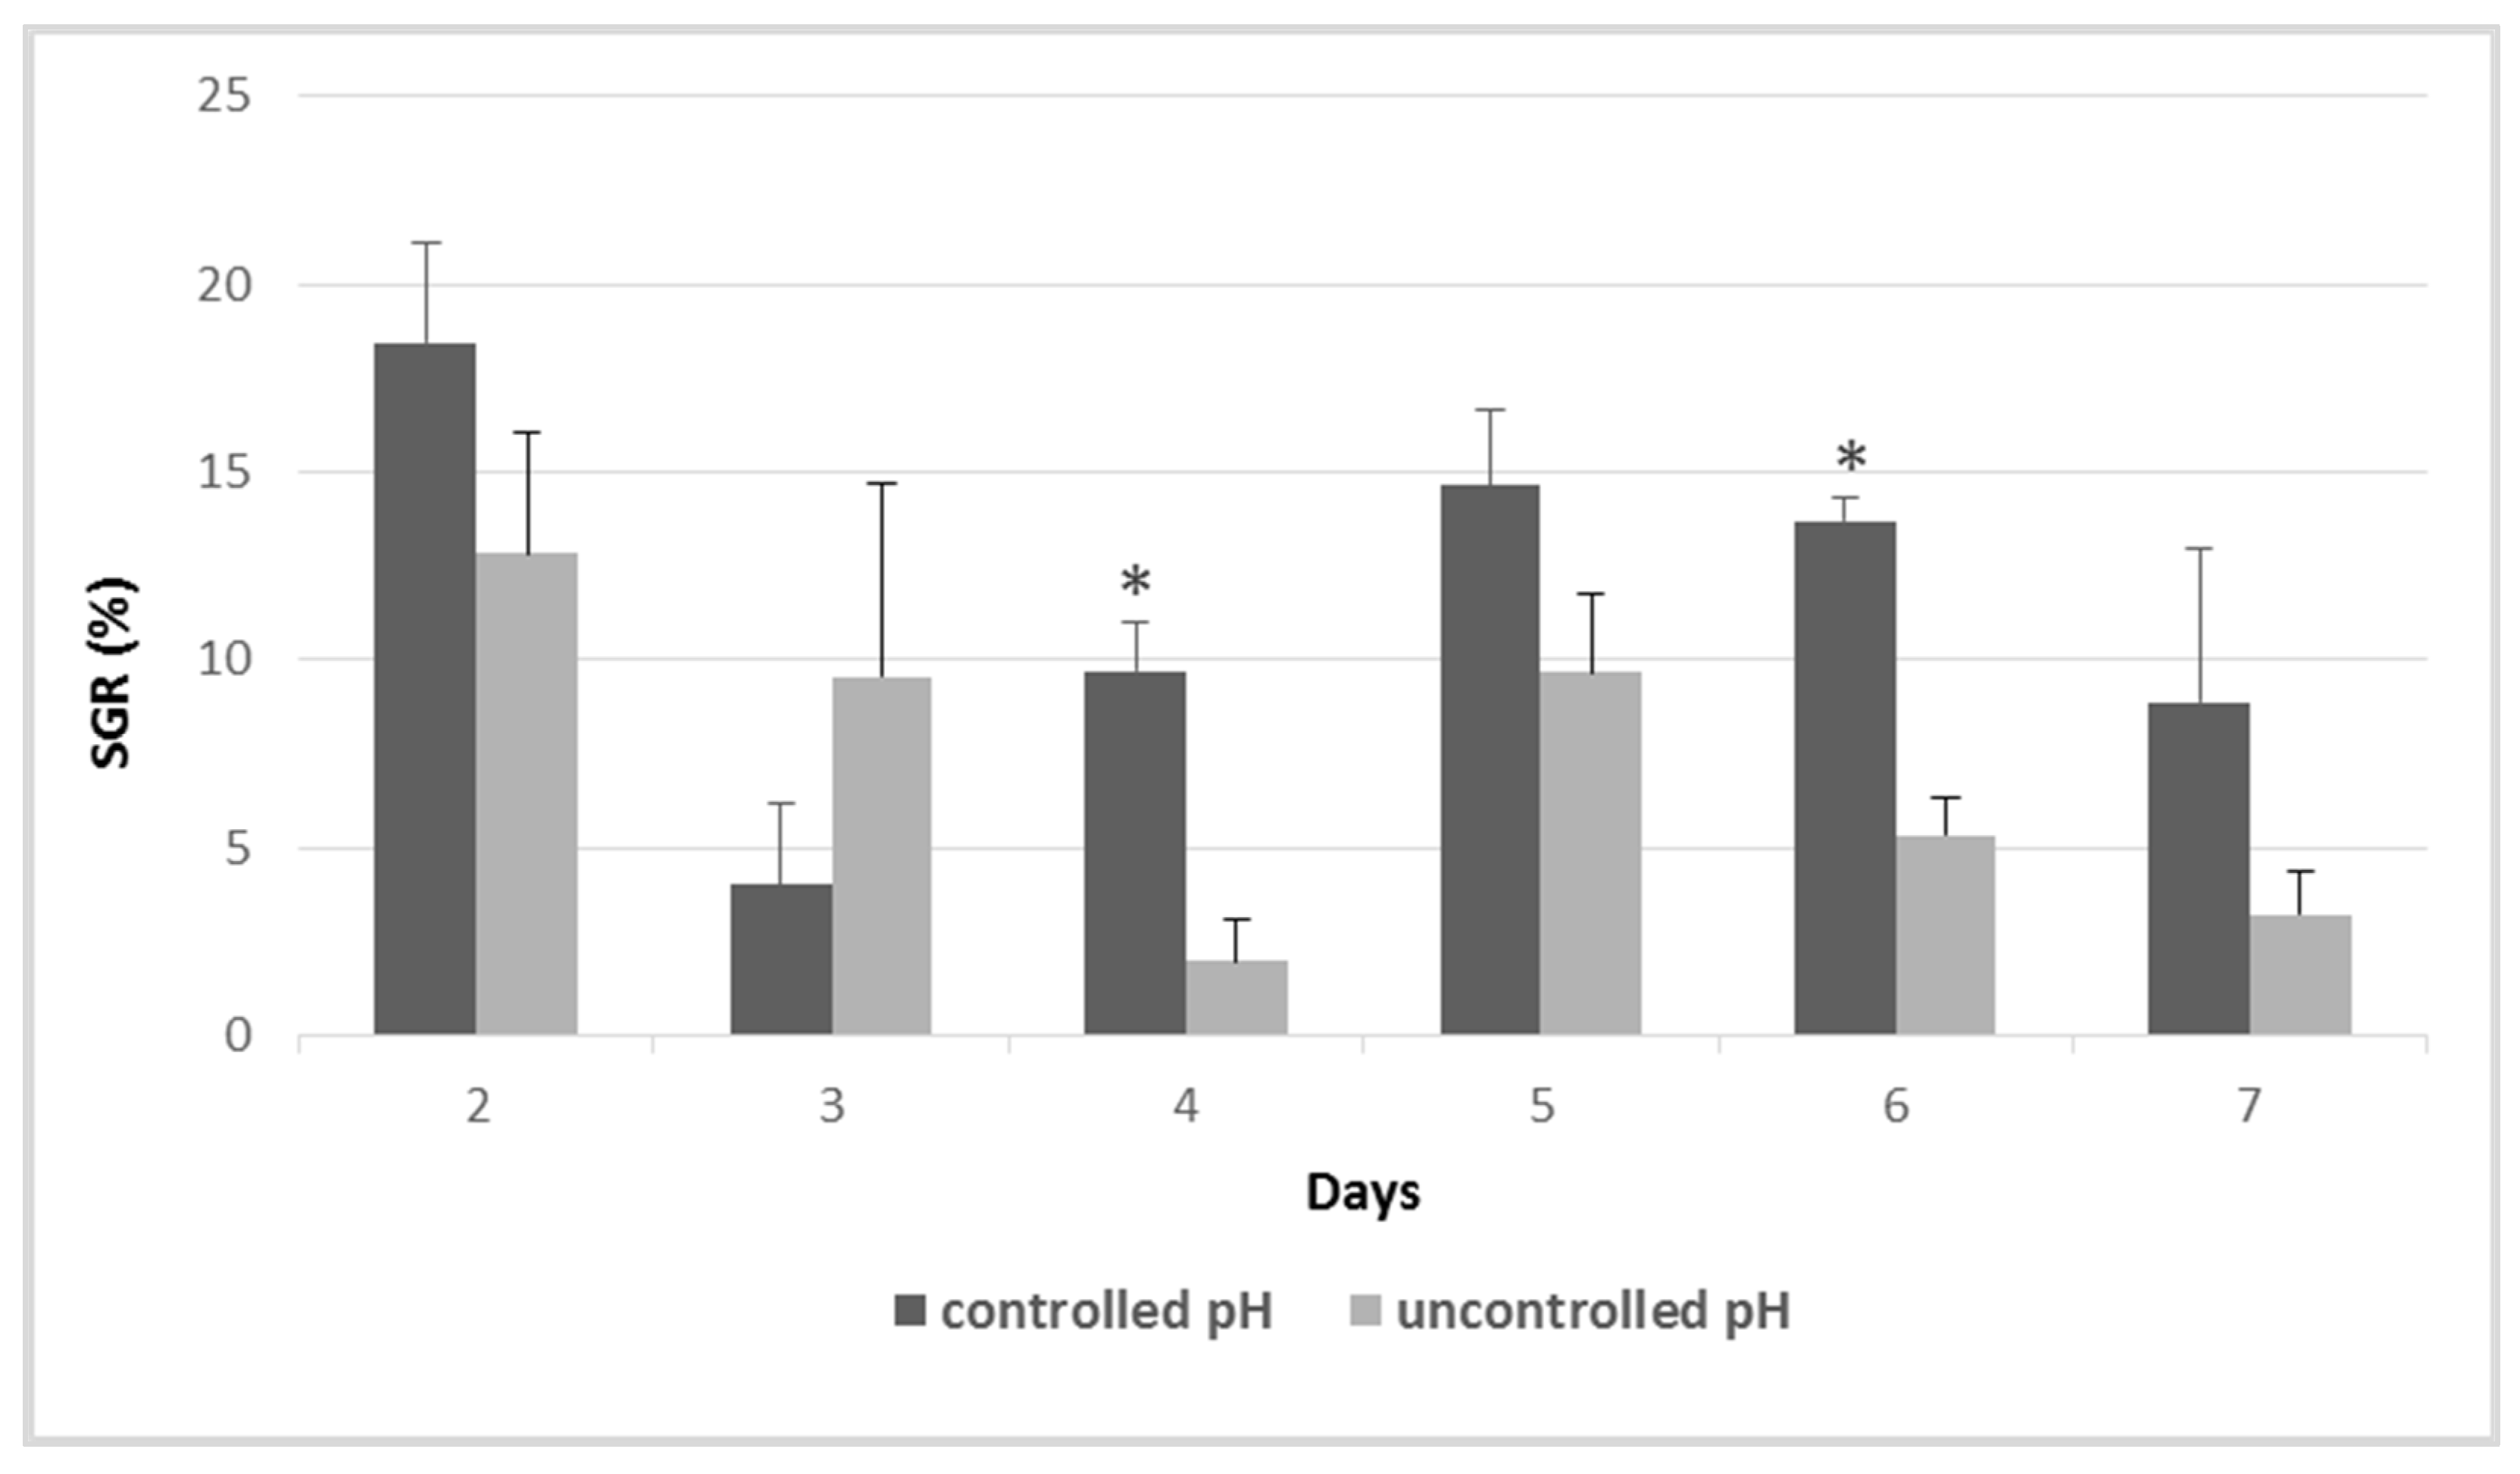
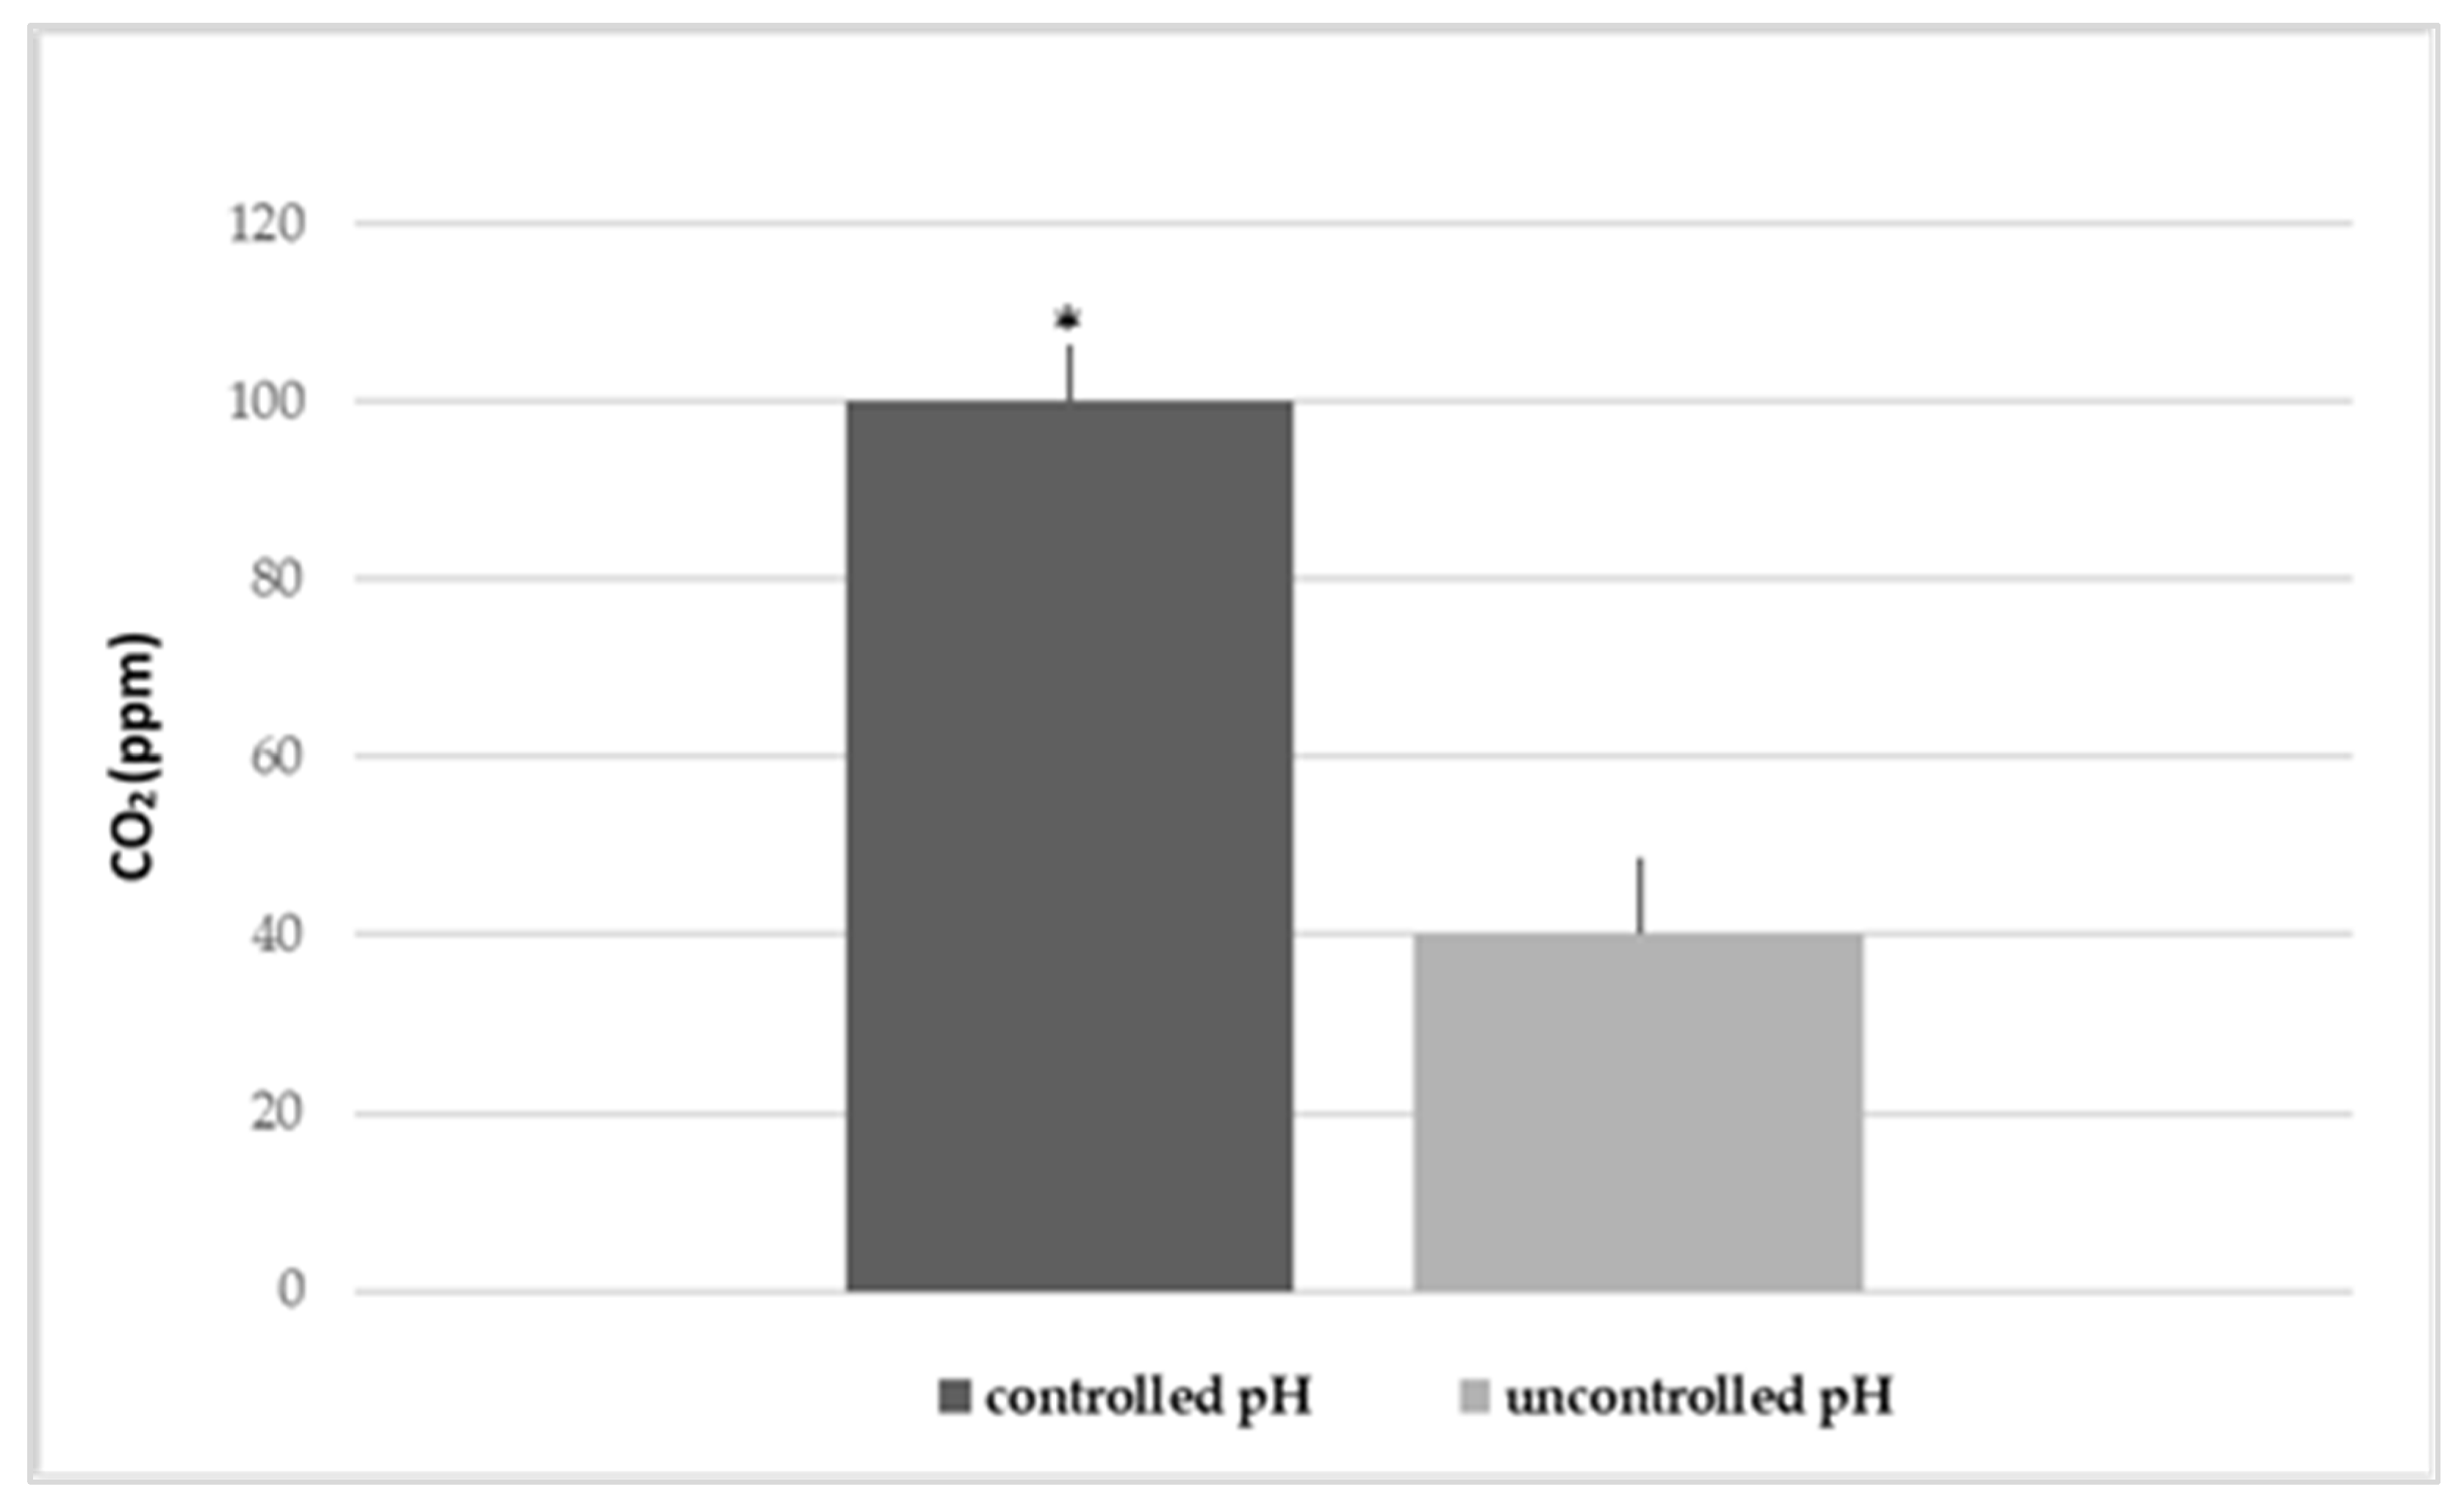
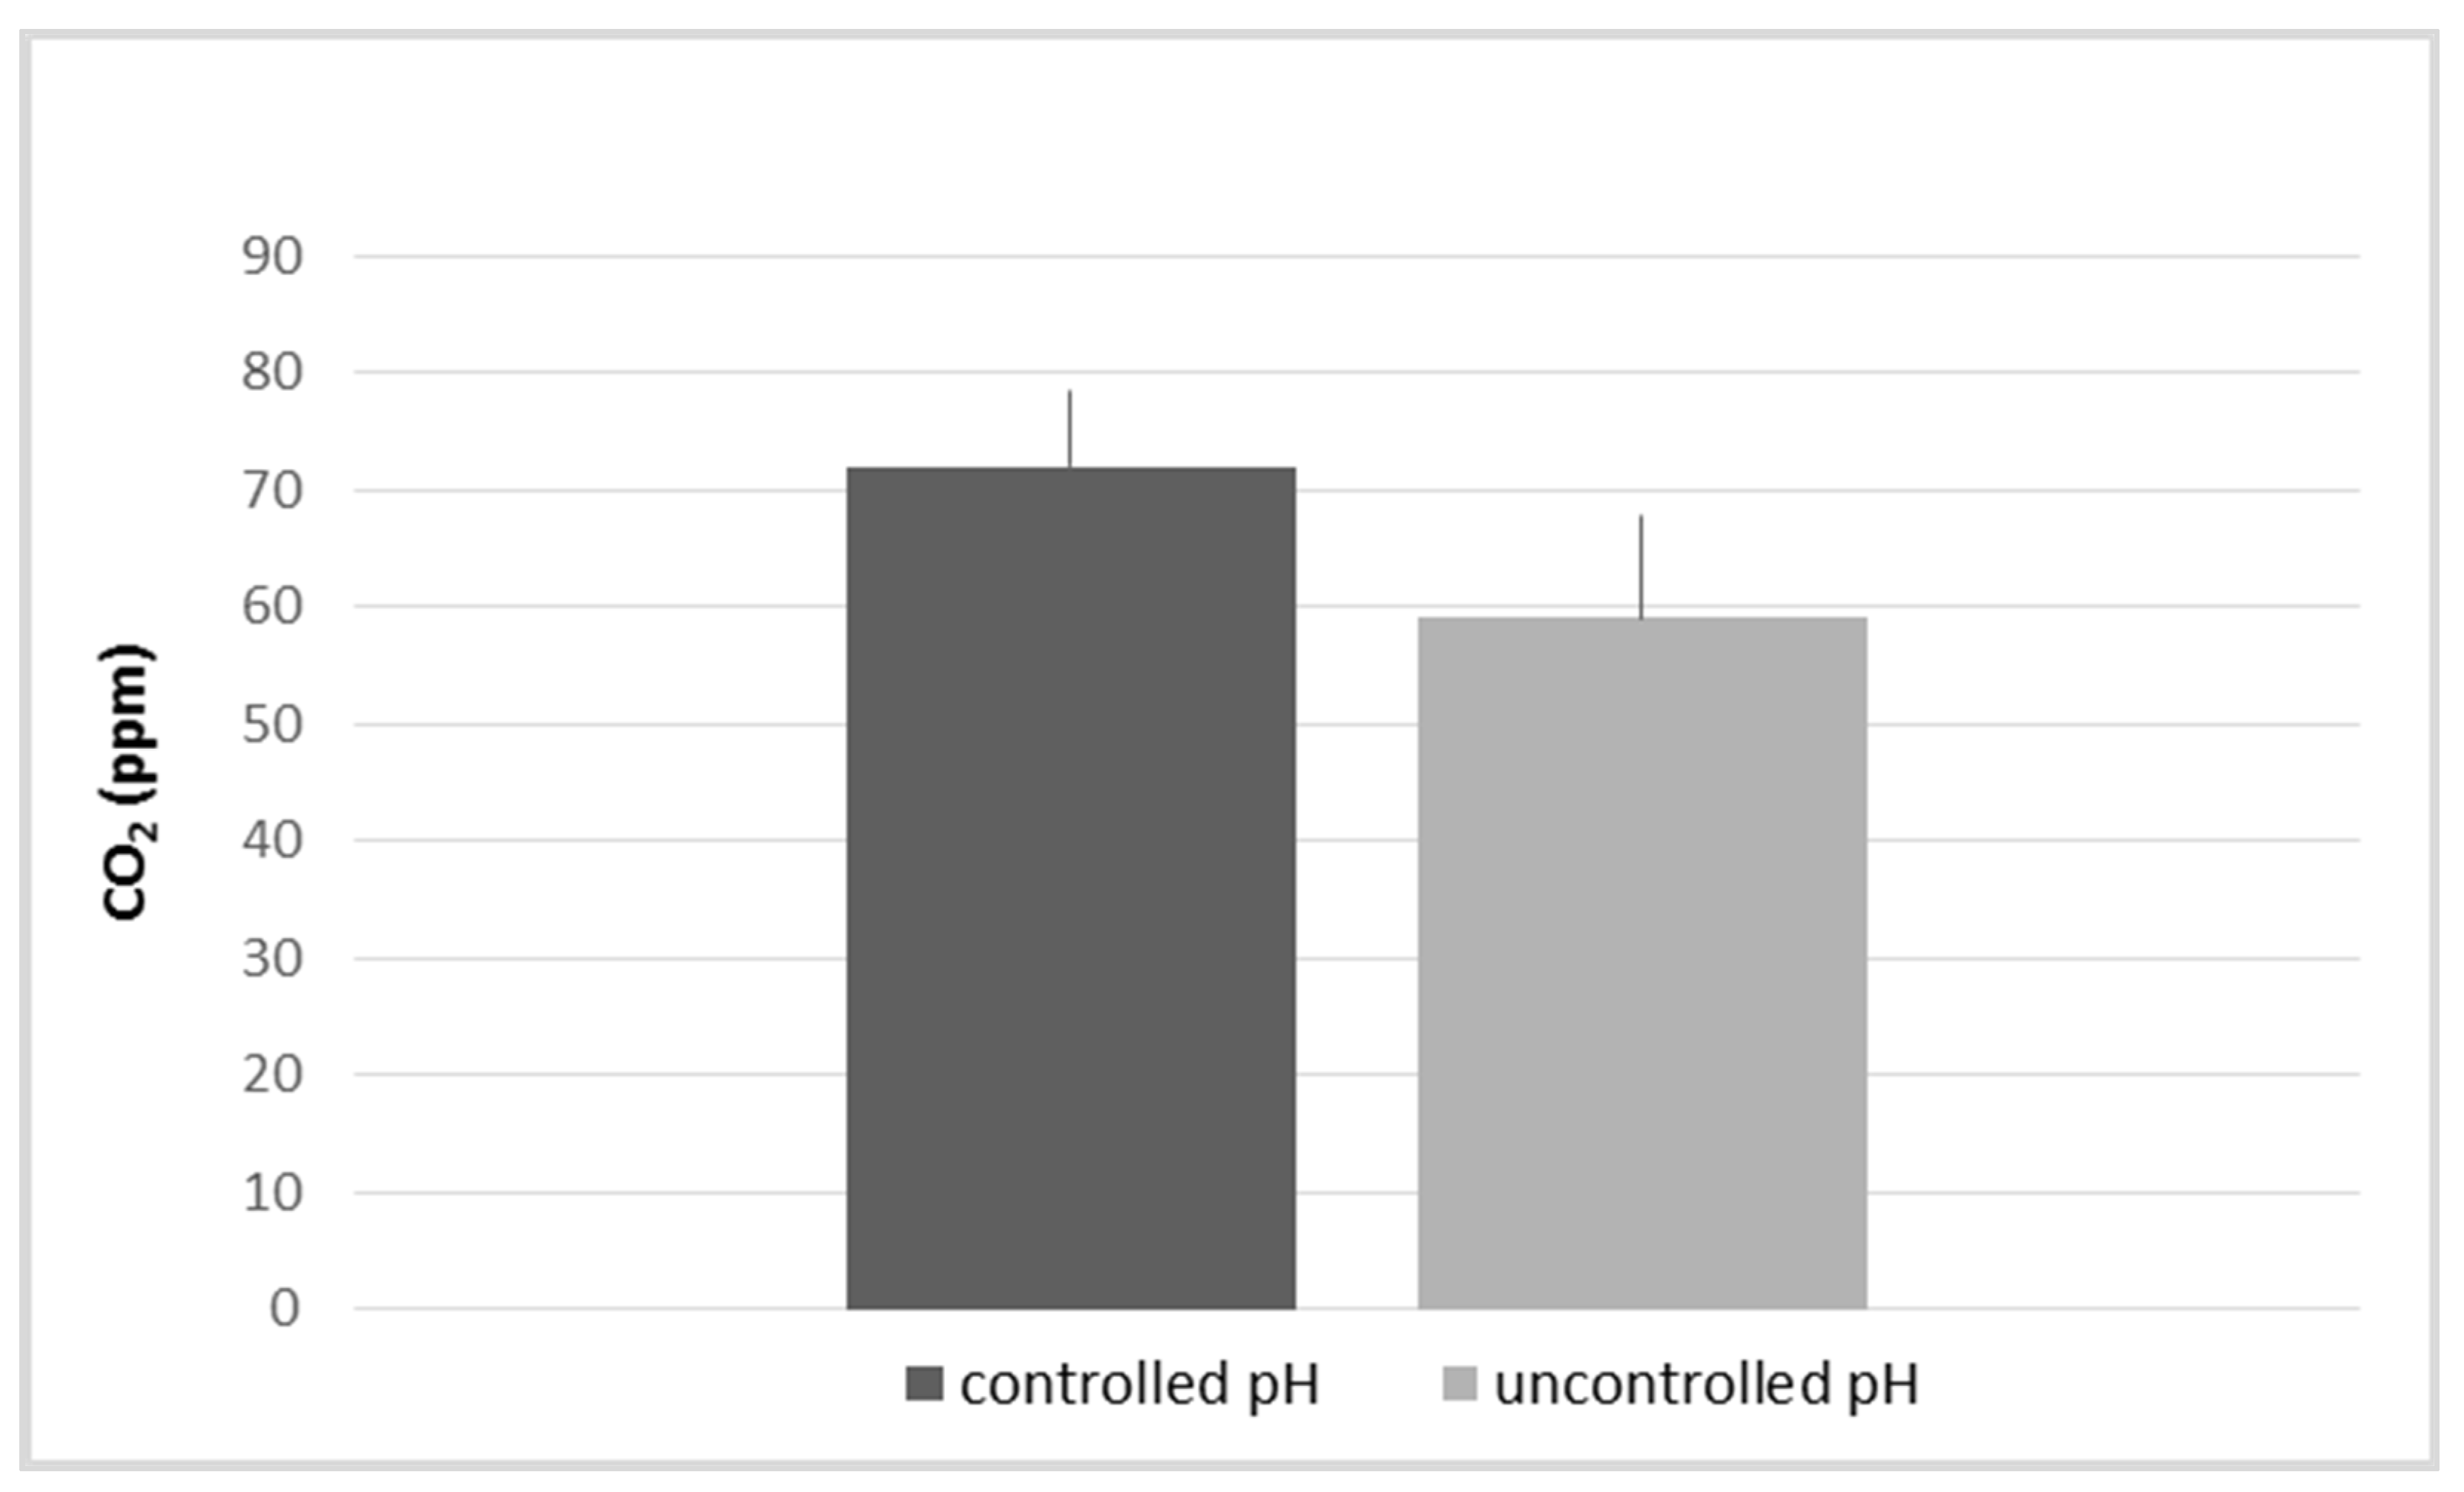
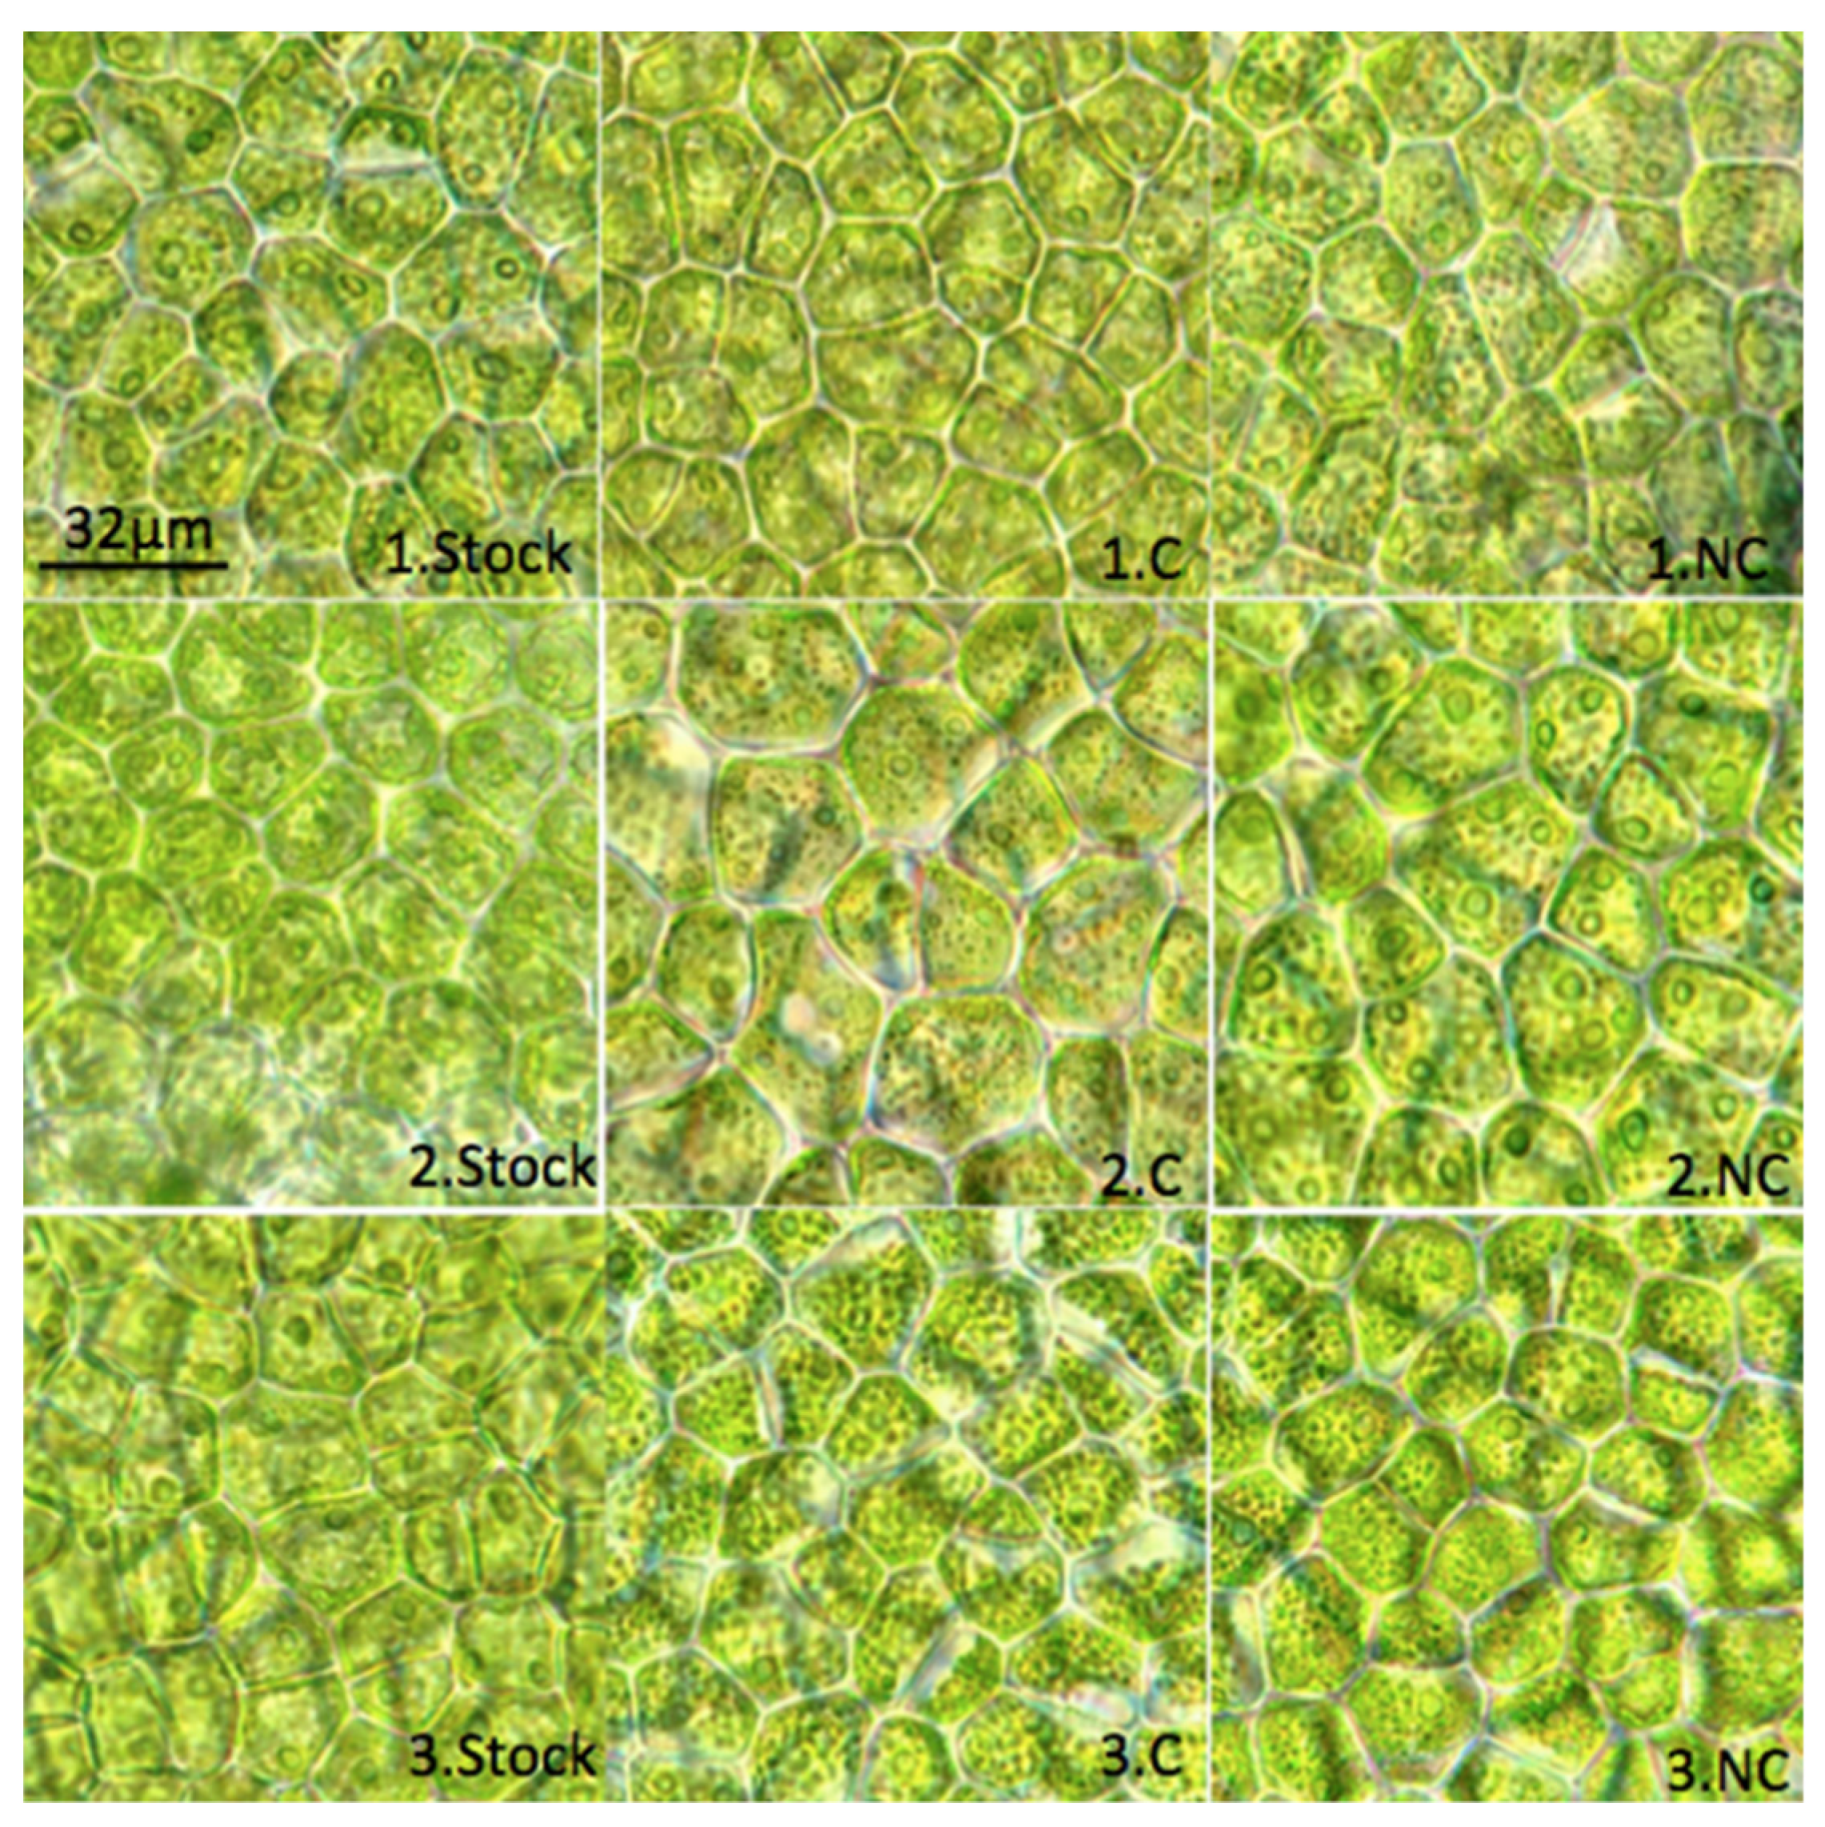
3.1. Influence of the Variations in pH and Alkaline Reserve
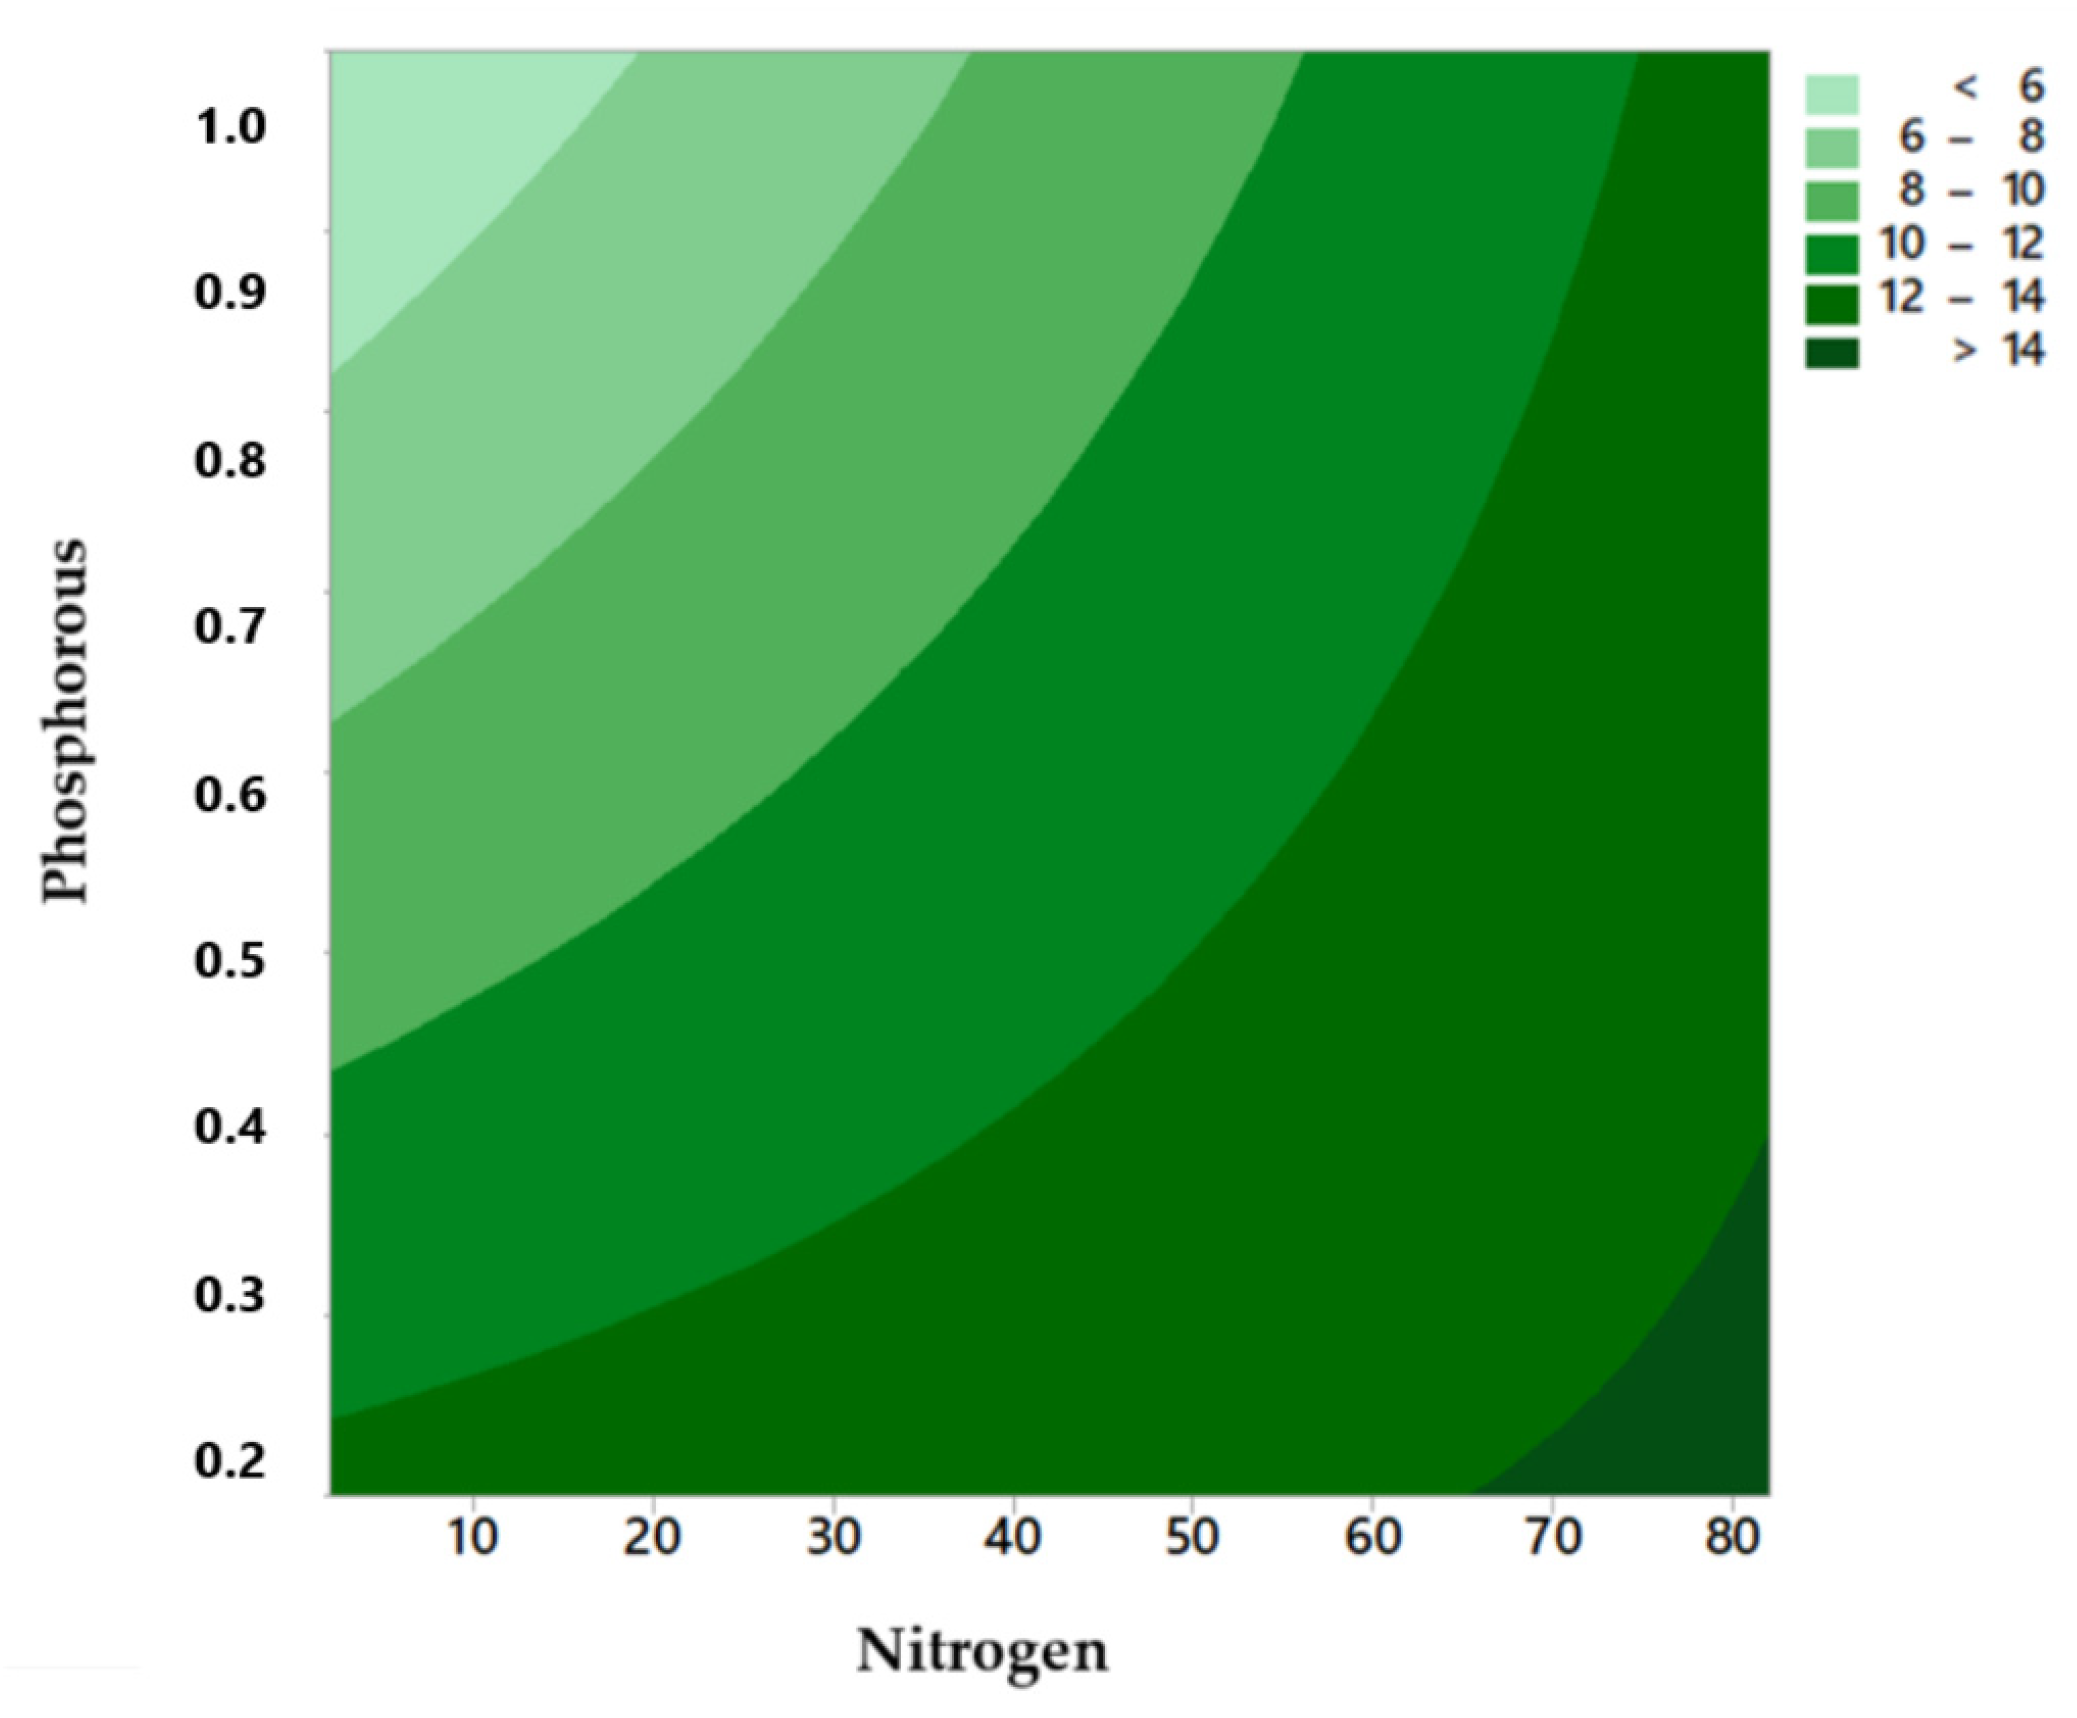
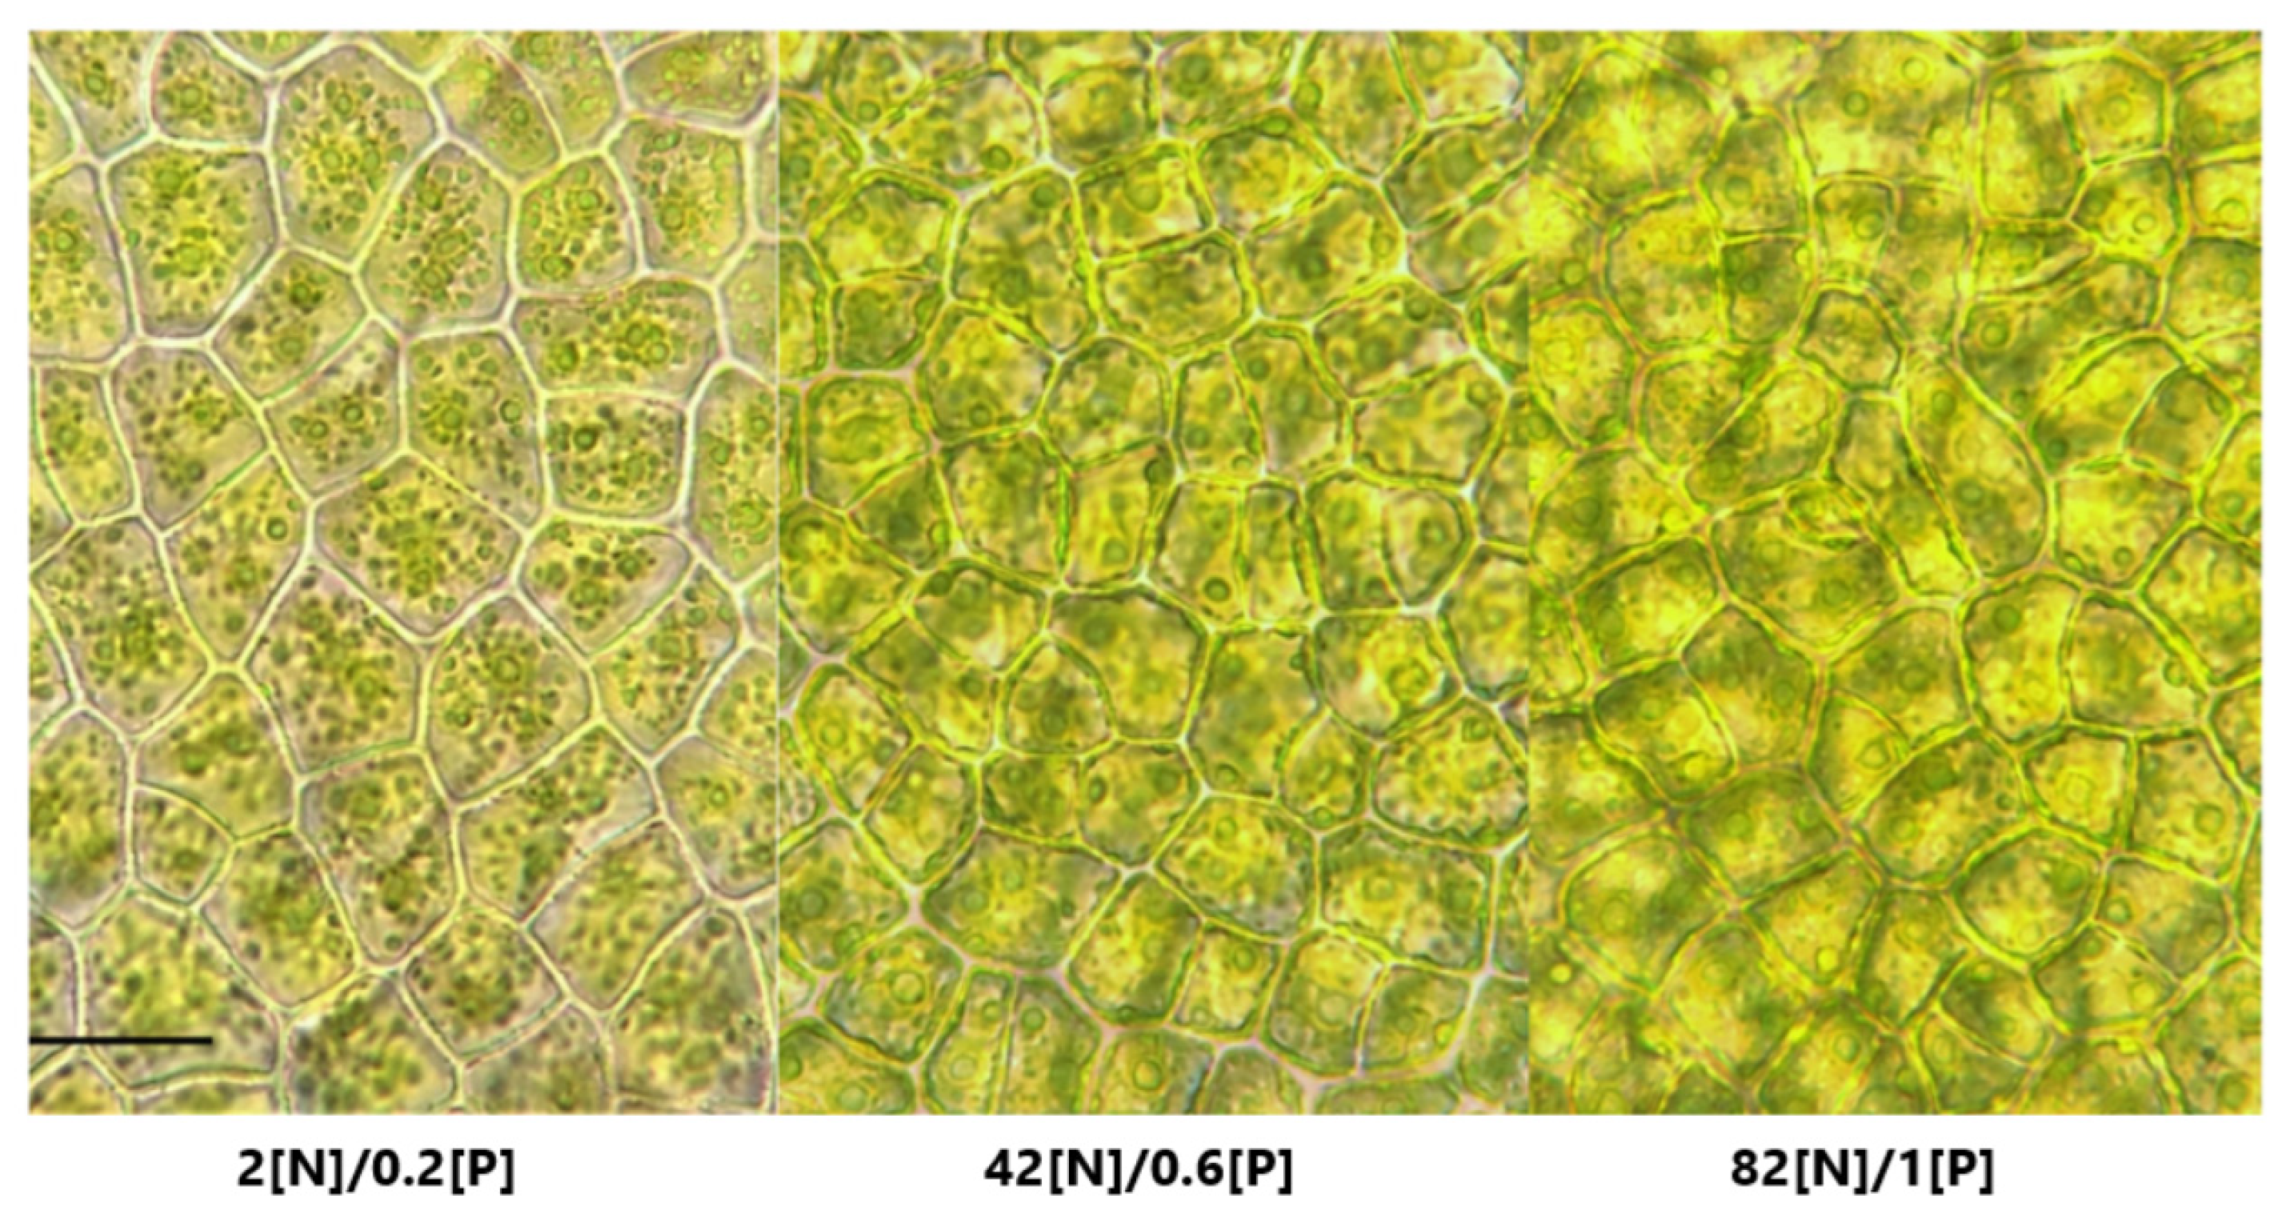
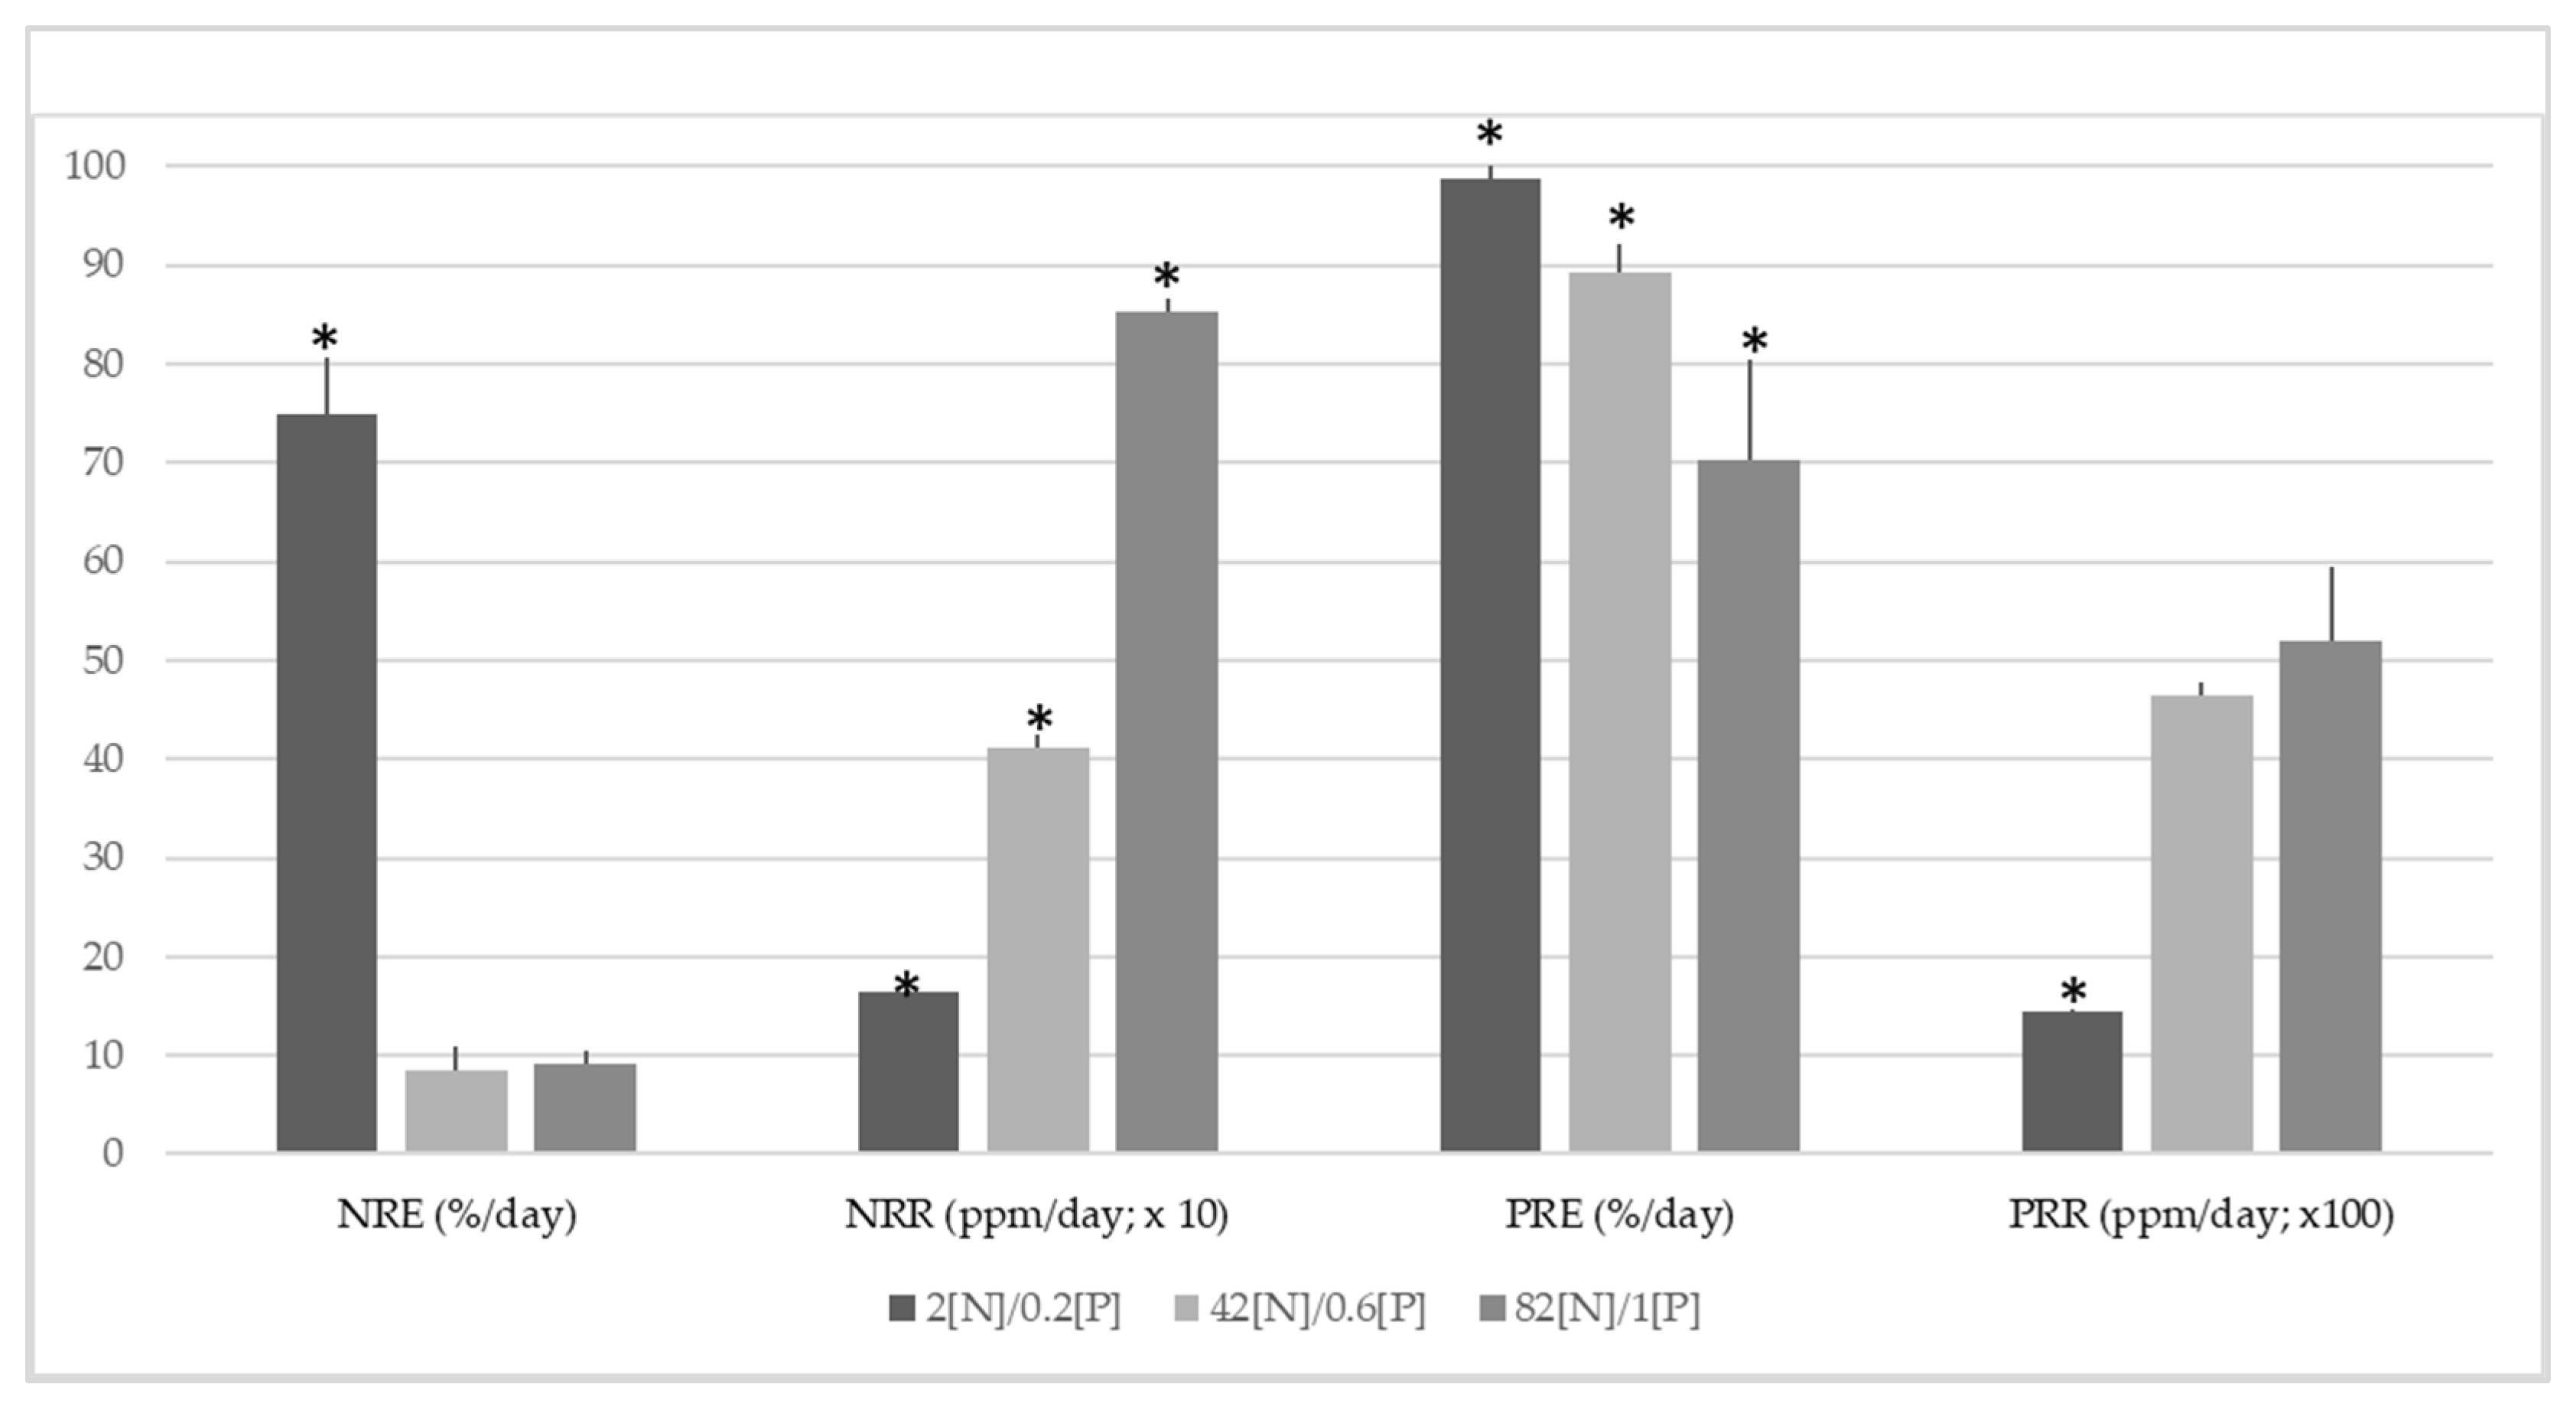
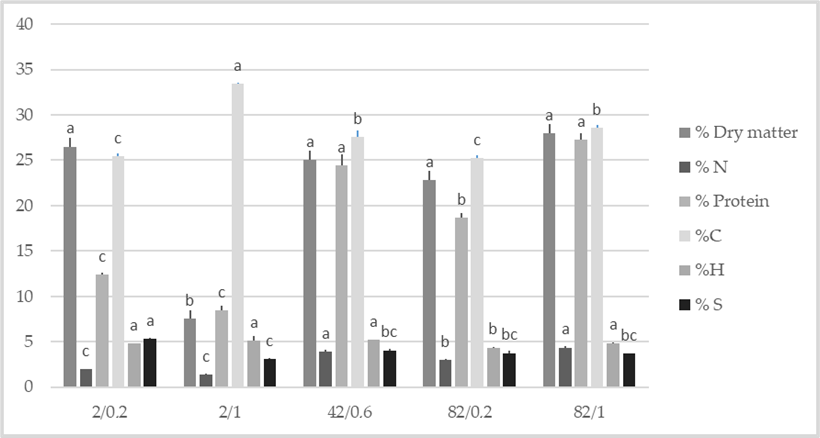
3.2. Influence of N, P Levels, and N: P Ratio
4. Discussion
4.1. Influence of the Variations in pH and DIC
4.2. Influence of N, P Levels, and N: P Ratio
5. Conclusions
Author Contributions
Funding
Institutional Review Board Statement
Informed Consent Statement
Data Availability Statement
Conflicts of Interest
References
- Cohen, Y.; Neori, A. Ulva lactuca biofilters for marine fishpond effluents. Bot. Mar. 1991, 34, 475–482. [Google Scholar] [CrossRef]
- Cohen, R.A.; Fong, P. Physiological responses of a bloom-forming green macroalga to short-term change in salinity, nutrients, and light help explain its ecological success. Estuaries 2004, 27, 209–216. [Google Scholar] [CrossRef]
- Bolton, J.J.; Robertson-Andersson, D.V.; Shuuluka, D.; Kandjengo, L. Growing Ulva (Chlorophyta) in integrated systems as a commercial crop for abalone feed in South Africa: A SWOT analysis. J. Appl. Phycol. 2009, 21, 575–583. [Google Scholar] [CrossRef]
- Jiménez del Río, M.; Ramazanov, Z.; García-Reina, G. Ulva rigida (Ulvales, Chlorophyta) tank culture as biofilters for dissolved inorganic nitrogen from fishpond effluents. Hydrobiologia 1996, 326, 61–66. [Google Scholar] [CrossRef]
- Mata, L.; Schuenhoff, A.; Santos, R. A direct comparison of the performance of the seaweed biofilters, Asparagopsis armata and Ulva rigida. J. Appl. Phycol. 2010, 22, 639–644. [Google Scholar] [CrossRef]
- Wan, A.H.; Davies, S.J.; Soler-Vila, A.; Fitzgerald, R.; Johnson, M.P. Macroalgae as a sustainable aquafeed ingredient. Rev. Aquac. 2019, 11, 458–492. [Google Scholar] [CrossRef]
- Vizcaíno, A.J.; Fumanal, M.; Sáez, M.I.; Martínez, T.F.; Moriñigo, M.A.; Fernández-Díaz, C.; Anguis, V.; Balebona, M.C.; Alarcón, F.J. Evaluation of Ulva ohnoi as functional dietary ingredient in juvenile Senegalese sole (Solea senegalensis): Effects on the structure and functionality of the intestinal mucosa. Algal Res. 2019, 42, 101608. [Google Scholar] [CrossRef]
- Lahaye, M.; Robic, A. Structure and functional properties of Ulvan, polysaccharide from green seaweeds. Biomacromolecules 2007, 8, 1765–1774. [Google Scholar] [CrossRef]
- Yu, P.; Ning, L.; Xiguang, L.; Gefei, Z.; Quanbin, Z.; Pengchen, L. Antihyperlipidemic Effects of Different Molecular Weight Sulfated Polysaccharides from Ulva pertusa (Chlorophyta). Pharmacol. Res. 2003, 48, 543–549. [Google Scholar]
- Mata, L.; Magnusson, M.; Paul, N.A.; de Nys, R. The intensive land-based production of the green seaweeds Derbesia tenuissima and Ulva ohnoi: Biomass and bioproducts. J. Appl. Phycol. 2016, 28, 365–375. [Google Scholar] [CrossRef]
- Buschmann, A.H.; Camus, C.; Infante, J.; Neori, A.; Israel, Á.; Hernández-González, M.C.; Pereda, S.V.; Gómez-Pinchetti, J.L.; Golberg, A.; Tadmor-Shalev, N.; et al. Seaweed production: Overview of the global state of exploitation, farming and emerging research activity. Eur. J. Phycol. 2017, 52, 391–406. [Google Scholar] [CrossRef]
- Glasson, C.R.K.; Sims, I.M.; Carnachan, S.M.; de Nys, R.; Magnusson, M. A cascading biorefinery process targeting sulfated polysaccharides (ulvan) from Ulva ohnoi. Algal Res. 2017, 27, 383–391. [Google Scholar] [CrossRef]
- Hughey, J.R.; Gabrielson, P.W.; Maggs, C.A.; Mineur, F. Genomic analysis of the lectotype specimens of European Ulva rigida and Ulva lacinulata (Ulvaceae, Chlorophyta) reveals the ongoing misapplication of names. Eur. J. Phycol. 2022, 57, 143–153. [Google Scholar] [CrossRef]
- Fort, A.; McHale, M.; Cascella, K.; Potin, P.; Perrineau, M.-M.; Kerrison, P.D.; Costa, E.; Calado, R.; Domingues, M.D.R.; Azevedo, I.C.; et al. Exhaustive reanalysis of barcode sequences from public repositories highlights ongoing misidentifications and impacts taxa diversity and distribution. Mol. Ecol. Resour. 2022, 1, 86–101. [Google Scholar] [CrossRef] [PubMed]
- Bliding, C. A critical survey of European taxa in Ulvales, II, Ulva, Ulvaria, Monostroma, Kornmania. Bot. Not. 1968, 121, 535–629. [Google Scholar]
- Hiraoka, M.; Shimada, S.; Uenosono, M.; Masuda, M. A new green-tide-forming alga, Ulva ohnoi Hiraoka & Shimada sp. nov. (Ulvales, Ulvophyceae) from Japan. Phycol. Res. 2004, 52, 17–29. [Google Scholar]
- Gallardo, T.; Bárbara, I.; Alfonso-Carrillo, J.; Bermejo, R.; Altamirano, M.; Gómez-Garreta, A.; Barceló, C.; Rull, J.; Ballesteros, E.; De la Rosa, J. Nueva lista crítica de las algas bentónicas marinas de España. Algas 2016, 51, 1–48. [Google Scholar]
- Yokoyama, H.; Ishihi, Y. Bioindicator and biofilter function of Ulva spp. (Chlorophyta) for dissolved inorganic nitrogen discharged from a coastal fish farm—Potential role in integrated multi-trophic aquaculture. Aquaculture 2010, 310, 74–83. [Google Scholar] [CrossRef]
- Lawton, R.J.; Mata, L.; de Nys, R.; Paul, N.A. Algal bioremediation of waste waters from land-based aquaculture using Ulva: Selecting target species and strains. PLoS ONE 2013, 8, e77344. [Google Scholar] [CrossRef] [Green Version]
- Angell, A.R.; Mata, L.; de Nys, R.; Paul, N.A. Variation in amino acid content and its relationship to nitrogen content and growth rate in Ulva ohnoi (Chlorophyta). J. Phycol. 2014, 50, 216–226. [Google Scholar] [CrossRef]
- Casais, E.; Couce, A.; Alamrousi, A.; Cremades, J. Calidad comercial de distintas especies de Ulva (Ulvales, Chrolophyta) potencialmente cultivables en sistemas de acuicultura multitrófica integrada (AMTI) en recirculación (RAS). In Foro dos Recursos Mariños e da Acuicultura das Rías Galegas; Rey-Méndez, M., Lodeiros, C., Fernández Casal, J., Guerra, A., Eds.; Foroacui: Santiago de Compostela, Spain, 2017; Volume 19, pp. 227–234. [Google Scholar]
- Oca, J.; Cremades, J.; Jiménez, P.; Pintado, J.; Masaló, I. Culture of the seaweed Ulva ohnoi integrated in a Solea senegalensis recirculating system: Influence of light and biomass stocking density on macroalgae productivity. J. Appl. Phycol. 2019, 31, 2461–2467. [Google Scholar] [CrossRef] [Green Version]
- Salas-Leiton, E.; Anguis, V.; Manchado, M.; Cañavate, J.P. Growth, feeding and oxygen consumption of Senegalese sole (Solea senegalensis) juveniles stocked at different densities. Aquaculture 2008, 285, 84–89. [Google Scholar] [CrossRef]
- Morais, S.; Aragão, C.; Cabrita, E.; Conceição, L.E.C.; Constenla, M.; Costas, B.; Dias, J.; Duncan, N.; Engrola, S.; Estevez, A.; et al. New developments and biological insights into the farming of Solea senegalensis reinforcing its aquaculture potential. Rev. Aquac. 2016, 8, 227–263. [Google Scholar] [CrossRef] [Green Version]
- Skirrow, G. The dissolved gases-carbon dioxide. In Chemical Oceanography; Riley, J.P., Skirrow, G., Eds.; Academic Press: Cambridge, MA, USA; London, UK; New York, NY, USA, 1975; Volume 2, pp. 227–322. [Google Scholar]
- Beer, S. Photosynthetic utilisation of inorganic carbon in Ulva. Sci. Mar. 1996, 60, 125–128. [Google Scholar]
- Harrison, P.J.; Hurd, C.L. Nutrient physiology of seaweeds: Application of concepts to aquaculture. Cah. Biol. Mar. 2001, 42, 71–82. [Google Scholar]
- Hurd, C.L.; Harrison, P.J.; Bischof, K.; Lobban, C.S. Seaweed Ecology and Physiology; Cambridge Univ. Press: Cambridge, MA, USA, 2014. [Google Scholar]
- DeBusk, T.A.; Ryther, J.H. Effects of seawater exchange, pH and carbon supply on the growth of Gracilaria tikvalhiae (Rhodophyceae) in large scale cultures. Bot. Mar. 1984, 27, 357–362. [Google Scholar] [CrossRef]
- Al-Hafedh, Y.S.; Alam, A.; Buschmann, A.H. Bioremediation potential, growth and biomass yield of the green seaweed, Ulva lactuca in an integrated marine aquaculture system at the Red Sea coast of Saudi Arabia at different stocking densities and effluent flow rates. Rev. Aquac. 2015, 7, 161–171. [Google Scholar] [CrossRef]
- Mendoza, W.; Mendola, D.; Kim, J.; Yarish, C.; Velloze, A.; Greg Mitchell, B. Landbased drip-irrigated culture of Ulva compressa: The effect of culture platform design and nutrient concentration on biomass production and protein content. PLoS ONE 2018, 13, e0199287. [Google Scholar] [CrossRef]
- Revilla-Lovano, S.; Sandoval-Gil, J.M.; Zertuche-González, J.A.; Belando-Torrentes, M.D.; Bernardeau-Esteller, J.; Rangel-Mendoza, L.K.; Ferreira-Arrieta, A.; Guzmán-Calderón, J.M.; Camacho-Ibar, V.F.; Muñiz-Salazar, R.; et al. Physiological responses and productivity of the seaweed Ulva ohnoi (Chlorophyta) under changing cultivation conditions in pilot large land-based ponds. Algae Res. 2021, 56, 102316. [Google Scholar] [CrossRef]
- Timmons, M.B.; Ebeling, J.M.; Wheaton, F.W.; Summerfelt, S.T.; Vinci, B.J. Recirculating Aquaculture Systems, 2nd ed.; Cayuga Aqua Ventures: Ithaca, NY, USA, 2002; p. 800. [Google Scholar]
- Bird, K.T.; Hanisak, M.D.; Ryther, J. Chemical quality and production of agars extracted from Gracilaria tikvahiae grown in different nitrogen enrichment conditions. Bot. Mar. 1981, 24, 441–444. [Google Scholar] [CrossRef]
- Bird, K.T.; Habig, C.; DeBusk, T. Nitrogen allocation and storage patterns in Gracilaria tikvahiae. J. Phycol. 1982, 18, 344–348. [Google Scholar] [CrossRef]
- Bird, K.T. Seasonal variation in protein: Carbohydrate ratio in a subtropical estuarine alga, Gracilaria verrucosa, and the determination of nitrogen limitation status using these ratios. Bot. Mar. 1984, 27, 111–115. [Google Scholar] [CrossRef]
- Pedersen, M.F.; Borum, J.; Fotel, F.L. Phosphorus dynamics and limitation of fast- and slow-growing temperate seaweeds in Oslofjord, Norway. Mar. Ecol. Prog. Ser. 2010, 399, 103–115. [Google Scholar] [CrossRef]
- Neori, A.; Cohen, I.; Gordin, H. Ulva lactuca biofilter for marine fishpond effluents: II. Growth rate, yield and C: N ratio. Bot. Mar. 1991, 34, 389–398. [Google Scholar] [CrossRef]
- Msuya, F.E.; Neori, A. Effect of water aeration and nutrient load level on biomass yield, N uptake and protein content of the seaweed Ulva lactuca cultured in seawater tanks. J. Appl. Phycol. 2008, 20, 1021–1031. [Google Scholar] [CrossRef]
- Angell, A.R.; Mata, L.; de Nys, R.; Paul, N.A. The protein content of seaweeds: A universal nitrogen-to-protein conversion factor of five. J. Appl. Phycol. 2016, 28, 511–524. [Google Scholar] [CrossRef]
- Hayden, H.S.; Blomster, J.; Maggs, C.A.; Silva, P.C.; Stanhope, M.J.; Waaland, J.R. Linnaeus was right all along: Ulva and Enteromorpha are not distinct genera. Eur. J. Phycol. 2003, 38, 277–294. [Google Scholar] [CrossRef]
- Manhart, J. Phylogenetic analysis of green plant rbcL sequences. Mol. Phylogenet. Evol. 1994, 3, 114–127. [Google Scholar] [CrossRef]
- Evans, G.C. The Quantitative Analysis of Plant Growth; Blackwell: Oxford, UK, 1972; p. 734. [Google Scholar]
- APHA. Standard Methods for the Examination of Water and Wastewater, 18th ed.; American Public Health Association (APHA): Weybridge, UK; American Water Works Association (AWWA): Denver, CO, USA; Water Pollution Control Federation (WPCF): Alexandria, VA, USA, 1992. [Google Scholar]
- Grasshoff, K. Methods of Seawater Analysis; Wiley-vch.: Weinheim, Germany, 1999; p. 600. [Google Scholar]
- Friedlander, M.; Ben-Amotz, A. The effect of outdoor culture conditions on growth and epiphytes of Gracilaria conferta. Aquat. Bot. 1991, 39, 315–333. [Google Scholar] [CrossRef]
- Lignell, Å.; Pedersén, M. Effects of pH and inorganic carbon concentration on growth of Gracilaria secundata. Br. Phycol. J. 1989, 24, 83–89. [Google Scholar] [CrossRef]
- Gordillo, F.J.L.; Jiménez, C.; Goutx, M.; Niell, X. Effects of CO2 and nitrogen supply on the biochemical composition of Ulva rigida with especial emphasis on lipid class analysis. J. Plant Physiol. 2001, 158, 367–373. [Google Scholar] [CrossRef] [Green Version]
- Zou, D. The effects of severe carbon limitation on the green seaweed, Ulva conglobata (Chlorophyta). J. Appl. Phycol. 2014, 26, 2417–2424. [Google Scholar] [CrossRef]
- Pillay, T.V.R.; Kutty, M.N. Aquaculture, Principles and Practices, 2nd ed.; Blackwell Publishing Ltd.: Oxford, UK, 2005; p. 630. [Google Scholar]
- Björnsäter, B.R.; Wheeler, P.A. Effect of nitrogen and phosphorus supply on growth and tissue composition of Ulva fenestrata and Enteromorpha intestinalis (Ulvales, Chlorophyta). J. Phycol. 1990, 26, 603–611. [Google Scholar] [CrossRef]
- Navarro-Angulo, L.; Robledo, D. Effects of nitrogen source, N: P ratio and N-pulse concentration and frequency on the growth of Gracilaria cornea (Gracilariales, Rhodophyta) in culture. Hydrobiologia 1999, 398, 315–320. [Google Scholar] [CrossRef]
- Friedlander, M.; Levy, I. Cultivation of Gracilaria in outdoor tanks and ponds. J. Appl. Phycol. 1995, 7, 315–324. [Google Scholar] [CrossRef]
- Gerard, V.A. The role of nitrogen nutrition in high-temperature tolerance of the kelp Laminaria saccharina (Chromophyta). J. Phycol. 1997, 33, 800–810. [Google Scholar] [CrossRef]
- Andría, J.R.; Vergara, J.J.; Pérez-Lloréns, J.L. Biochemical responses and photosynthetic performance of Gracilaria sp. (Rhodophyta) from Cádiz, Spain, cultured under different inorganic carbon and nitrogen levels. Eur. J. Phycol. 1999, 34, 497–504. [Google Scholar] [CrossRef]
- Gordillo, F.J.L.; Figueroa, F.L.; Niell, F.X. Photon- and carbon-use efficiency in Ulva rigida at different CO2 and N levels. Planta 2003, 218, 315–322. [Google Scholar] [CrossRef]
- Zou, D.H.; Gao, K.S.; Luo, H.J. Short- and long-termeffects of elevated CO2 on photosynthesis and respiration in the marine macroalga Hizikia fusiformis (Sargassaceae, Phaeophyta) grown at low and high N supplies. J. Phycol. 2011, 47, 87–97. [Google Scholar] [CrossRef]
- Bruhn, A.; Dahl, J.; Nielsen, H.B.; Nikolaisen, L.; Rasmussen, M.B.; Markager, S.; Olesen, B.; Arias, C.; Jensen, P.D. Bioenergy potential of Ulva lactuca: Biomass yield, methane production and combustion. Bioresour. Technol. 2011, 102, 2595–2604. [Google Scholar] [CrossRef]


Publisher’s Note: MDPI stays neutral with regard to jurisdictional claims in published maps and institutional affiliations. |
© 2022 by the authors. Licensee MDPI, Basel, Switzerland. This article is an open access article distributed under the terms and conditions of the Creative Commons Attribution (CC BY) license (https://creativecommons.org/licenses/by/4.0/).
Share and Cite
Alamrousi, A.; Casais, E.; García-Cardesín, É.; Masaló, I.; Pintado, J.; Cremades, J. Influence of pH, N, P, N: P Ratio, and Dissolved Inorganic Carbon on Ulva ohnoi Growth and Biomass Quality: Potential Implications in IMTA-RAS. Aquac. J. 2022, 2, 285-301. https://doi.org/10.3390/aquacj2040017
Alamrousi A, Casais E, García-Cardesín É, Masaló I, Pintado J, Cremades J. Influence of pH, N, P, N: P Ratio, and Dissolved Inorganic Carbon on Ulva ohnoi Growth and Biomass Quality: Potential Implications in IMTA-RAS. Aquaculture Journal. 2022; 2(4):285-301. https://doi.org/10.3390/aquacj2040017
Chicago/Turabian StyleAlamrousi, Ahmed, Eduardo Casais, Érika García-Cardesín, Ingrid Masaló, José Pintado, and Javier Cremades. 2022. "Influence of pH, N, P, N: P Ratio, and Dissolved Inorganic Carbon on Ulva ohnoi Growth and Biomass Quality: Potential Implications in IMTA-RAS" Aquaculture Journal 2, no. 4: 285-301. https://doi.org/10.3390/aquacj2040017