Article

The Effects of a Multi-Ingredient Supplement Containing Wasabia Japonica Extract, Theacrine, and Copper (I) Niacin Chelate on Peripheral Blood Mononuclear Cell DNA Methylation, Transcriptomics, and Sirtuin Activity

1
School of Kinesiology, Auburn University, Auburn, AL 36849, USA
2
The Center for Applied Health Sciences, Canfield, OH 44406, USA
3
TruDiagnostic, Lexington, KY 40503, USA
*
Author to whom correspondence should be addressed.
Physiologia 2023, 3(2), 233-246; https://doi.org/10.3390/physiologia3020016
Submission received: 8 February 2023 / Revised: 31 March 2023 / Accepted: 6 April 2023 / Published: 18 April 2023
(This article belongs to the Special Issue Feature Papers in Human Physiology–2nd Edition)

Abstract

:
Herein, we determined if a multi-ingredient supplement (NAD3; 312 mg of combined Wasabia japonica extract, theacrine, and copper (I)niacin chelate) versus a placebo (CTL) affected peripheral blood mononuclear (PMBC) transcriptomic, DNA methylation, and sirtuin activity profiles in middle-aged adults after 12 weeks of supplementation. Several mRNAs demonstrated interactions (n = 148 at ±1.5-fold change, p < 0.01), and more stringent filtering indicated that 25 mRNAs were upregulated and 29 were downregulated in the NAD3 versus CTL group. Bioinformatics on these 64 mRNAs suggested that DNA conformational alterations may have been promoted with NAD3 supplementation, and this was corroborated with more CpG sites being hypermethylated (p < 0.001) in the CTL versus the NAD3 group when examining pre- to post-intervention changes (369 versus 35). PBMC SIRT activity decreased in CTL participants (p < 0.001), but not in NAD3 participants (p = 0.289), and values at 12 weeks trended higher in NAD3 participants (p = 0.057). Interestingly, the pre- to post- changes in SIRT activity values significantly correlated with changes in PBMC NAD+: NADH values obtained from a previous investigation in these participants (r = 0.534, p = 0.015). In conclusion, the current mRNA and DNA methylation data indirectly suggest that NAD3 supplementation may affect PBMC DNA conformation, while other direct assays suggest that NAD3 supplementation maintains SIRT activity through the potential maintenance of NAD+: NADH levels. However, these results are preliminary due to limited n-sizes and the study being performed in middle-aged adults.

1. Introduction

There are several nutritional supplements that affect hallmark features of aging, including creatine monohydrate [1]; omega-3 fatty acids [2]; NAD+ precursors, such as niacin, niacinamide, NMN (nictotinamide mononucleotide) and NR (nicotinamide riboside) [3]; and various plant-based polyphenols [4]. Pre-clinical and human studies have been performed on a multi-ingredient supplement termed NAD3 (312 mg of combined wasabia japonica extract, theacrine, and copper (I)niacin chelate). Two human studies (one which provided theacrine-only and the other providing NAD3) have shown that 12 weeks of supplementation improves blood cholesterol levels [5,6]. Additionally, one of these studies demonstrated that supplementation significantly maintained peripheral blood mononuclear cell (PBMC) NAD+: NADH levels compared to those in a placebo control group [5], and this corroborated prior in vitro data demonstrating NAD3 was capable of increasing NAD+ concentrations in murine muscle cells [7].
Theacrine is an alkaloid found in wild tea plants [8], and it has been demonstrated in pre-clinical and clinical trials to reduce inflammation [9,10], act as an antioxidant [11], and favorably alter blood lipid profiles [5,6]. Preclinical data also suggests that long-chain 6, 7, and 8-methylsulfinylhexyl/heptyl/octyl isothiocyanates (ITCs) in wasabi (Wasabia japonica) elicit anti-inflammatory and cytoprotective effects [12,13,14]. Additionally, ITCs can affect histone deacetylase (HDAC) and DNA methyltransferase (DNMT) activities [15], thus implicating their potential role in gene regulation. Cuprous niacin chelate (Cu(I)NA2) provides copper in the reduced +1 valance state, and is an essential cofactor in the superoxide dismutase antioxidant enzymes [16]. Hence, it is apparent that each of the active ingredients in NAD3 possesses data, albeit much of it being pre-clinical or in vitro, to substantiate its efficacy in affecting gene expression and cellular anti-aging markers.
Considering our recent data demonstrating that 12 weeks of NAD3 supplementation maintained peripheral blood mononuclear cell (PBMC) NAD+: NADH levels better than those seen in a placebo group [5], the purpose of the current study was to expand this analysis and determine if NAD3 supplementation affected PBMC transcriptomic profiles (with an emphasis on SIRT1-7 mRNA), DNA methylation profiles, and PBMC global sirtuin activity. In our original investigation, 28 participants were randomly assigned to receive either NAD3 or a cellulose placebo, and blood was drawn in the morning, following an overnight fast prior to supplementation (pre) and after 12 weeks of daily pill consumption (post) [5]. In this secondary analysis, most, but not all, of these same participants were analyzed due to sample yield limitations, depending on cell lysate limitations required for assays. Given the unbiased and exploratory nature of -omics-based investigations, we adopted null hypotheses for most outcomes assessed herein. However, we hypothesized that changes in DNA methylation and/or mRNA expression patterns may be linked to the positive effects previously observed regarding the effects of NAD3 supplementation on PBMC NAD+: NADH levels.

2. Results

2.1. Participant Characteristics from Our Prior Data Analysis

For convenience, general participant characteristics and outcomes reported in the parent publication are presented in this section [5]. Regarding pre-intervention participant characteristics, there were no differences in age (NAD3: 51 ± 5 years old, CTL: 52 ± 6 years old, p = 0.57), BMI (NAD3: 29.0 ± 5.0 kg/m2, CTL: 28.3 ± 3.9 kg/m2, p = 0.68), systolic blood pressure (NAD3: 127 ± 11 mmHg, CTL: 128 ± 15 mmHg, p = 0.84), or diastolic blood pressure (NAD3: 78 ± 10 mmHg, CTL: 80 ± 7 mmHg, p = 0.54).
Over the 12-week supplement intervention, no supplement × time interactions existed for body mass changes (p = 0.77), systolic blood pressure changes (p = 0.52), or diastolic blood pressure changes. We did report that significant interactions existed for serum total cholesterol (p = 0.01) and LDL cholesterol (p = 0.01), and post hoc tests indicated that significant decreases in these markers occurred in the NAD3-supplemented participants (p < 0.05 for both). We also reported that a significant interaction occurred for the NAD+: NADH ratio in PBMCs (p = 0.02), and post hoc testing indicated that values were significantly higher in NAD3-supplemented participants at week 12.

2.2. PBMC mRNA Expression Differences between Treatment Groups

All mRNA comparisons are included as supplemental data (titled “Supplementary File S1. mRNA comparisons”). There were 148 mRNAs that showed significant interactions between supplementation groups over time, with 76 being upregulated and 72 being downregulated in the NAD3 versus CTL group (p < 0.01). Table 1 shows the top 15 upregulated and downregulated PBMC mRNAs over time with supplementation.
When entering the upregulated and downregulated gene list from Table 1 into PANTHER pathway analysis, certain biological processes in PBMCs according to Gene Ontology [17] were predicted to be potentially affected by supplementation. These processes are listed in Table 2 below.
Given that several mRNAs that showed significant interactions significantly differed at pre-testing between groups, we performed a more stringent analysis on these 148 mRNAs. First, we screened out mRNAs that significantly differed (p < 0.05) at pre-testing between groups (54 genes omitted). Next, we screened out mRNAs that were not significantly different (p > 0.05) at post-testing between groups (29 additional genes omitted). This yielded 64 mRNAs that showed a significant interaction between supplementation groups over time, with 25 being upregulated and 29 being downregulated in the NAD3 versus CTL group (p < 0.01). Table 3 shows the top 15 upregulated and downregulated PBMC mRNAs over time with supplementation.
When entering the upregulated and downregulated gene list from Table 3 into PANTHER pathway analysis, certain biological processes in PBMCs according to Gene Ontology [17] were predicted to be potentially affected with supplementation. These processes are listed in Table 4 below.

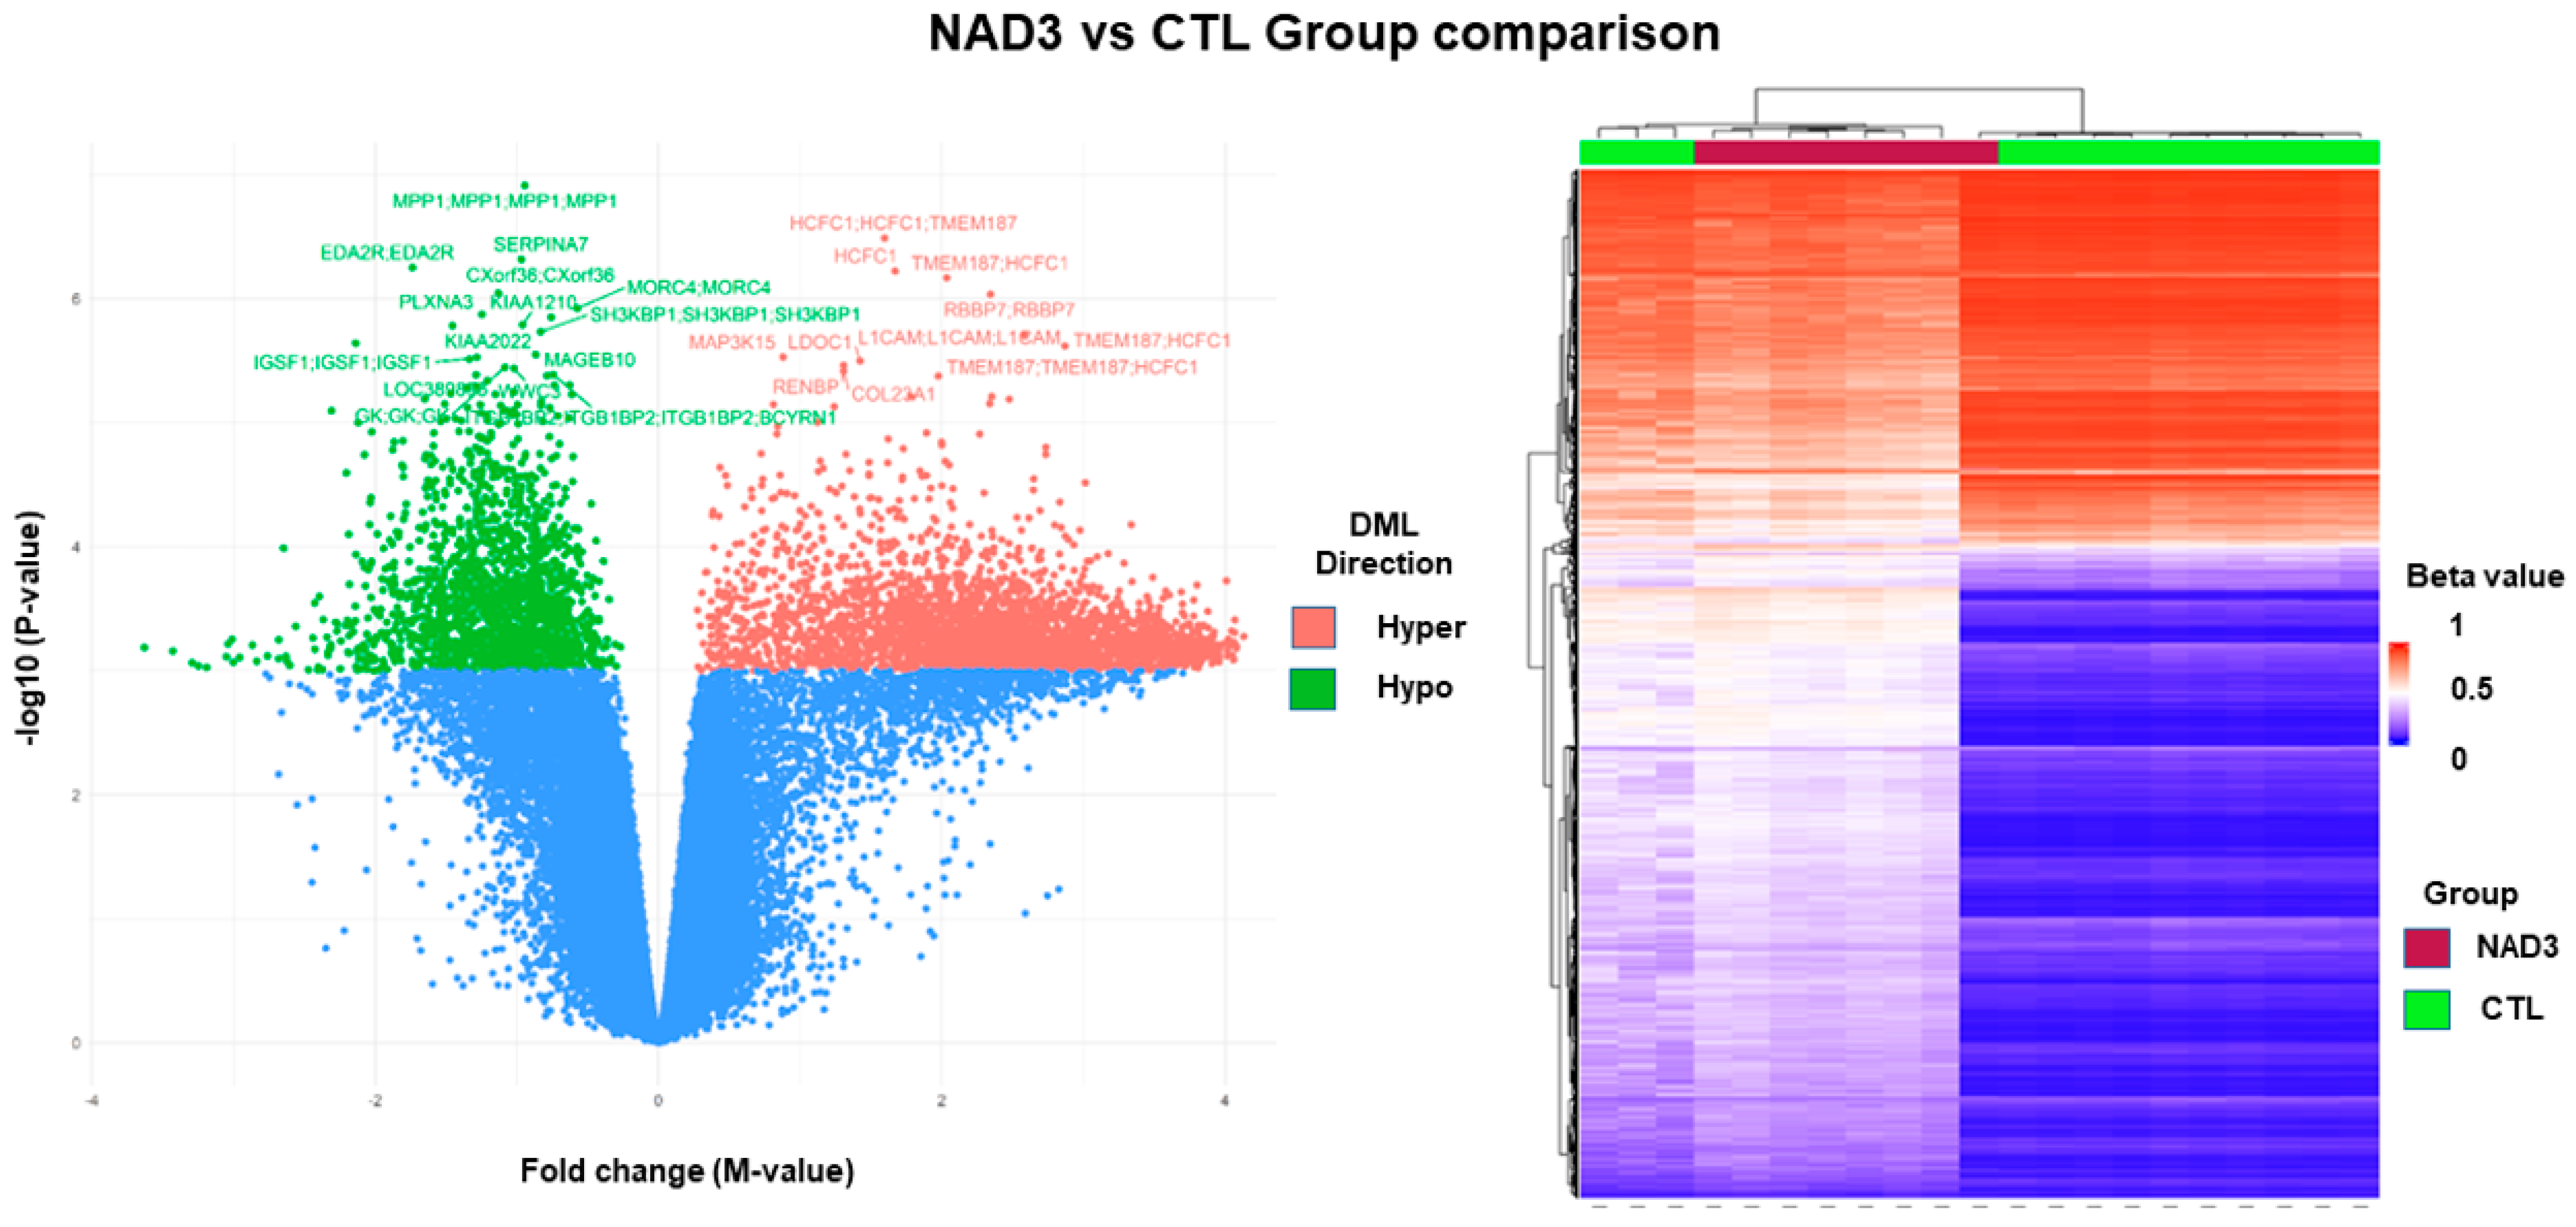
2.3. PBMC Methylome Differences between Groups

Differential methylation analysis on isolated PBMC DNA was conducted to identify CpG loci undergoing significant methylation changes from pre- to post-intervention. In an initial analysis comparing the 12-week methylation states relative to the baseline identified the CTL group as having the greatest number of methylation changes at a CpG level; a total of 547 differentially methylated CpG sites (DMLs) were significantly altered in the CTL group (p < 0.001) and 107 DMLs in the NAD supplementation group. In addition, the CTL group exhibited greater hypermethylation as evidenced by a greater number of hypermethylated DMLs (n = 369 DMLs) compared to hypomethylated DMLs (n = 178 DMLs). Conversely, the NAD3 group exhibited greater hypomethylation (n = 78 DMLs) compared to hypermethylation (n = 35 DMLs). These data are depicted in Table 5.
To capture methylation changes at the completion of the study, a second analysis comparing each group at 12 weeks was conducted. Overall, this analysis revealed greater methylation changes than comparing each group individually, as previously described. Between the NAD3 and CTL groups at week 12 (n = 5110 DMLs), a majority of these significantly different DMLs were hypermethylated in the CTL group (n = 3301), relative to the NAD3 group (n = 1809) (Figure 1).
Gene Ontology analysis was conducted on the DMLs identified in the 12-week comparisons. Among the NAD3 versus CTL comparison at 12 weeks, a total of 716 GO terms (390 GO-CC, 326 GO-MF, 0 GO-BP) were significantly associated (adjusted p-value < 0.05) to the hypermethylated DMLs identified, and 669 significant GO terms (82 GO-CC, 160 GO-MF, 427 GO-BP) to the hypomethylated DMLs of the same comparison. Table 6 contains the top-predicted pathways based on week 12 DNA methylation data between groups after removal of non-relevant (non-PBMC-specific) and redundant molecular or cellular pathways.

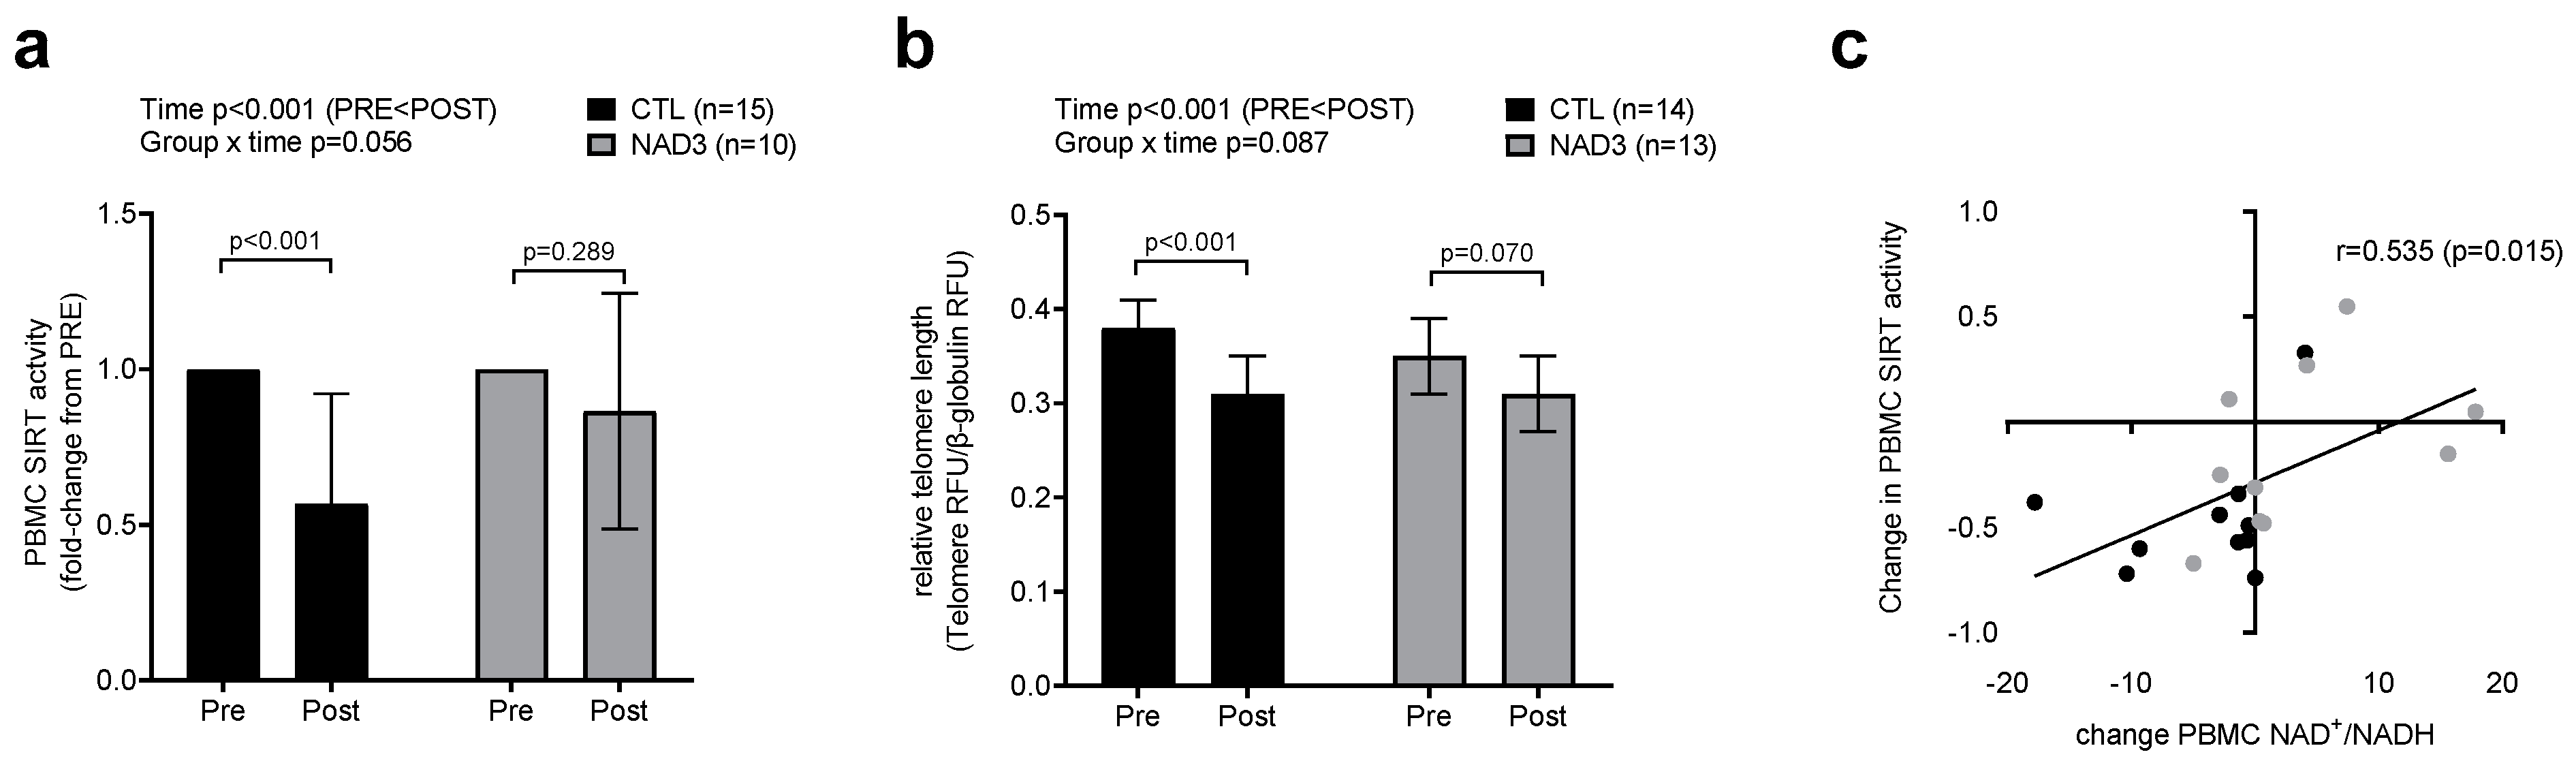
2.4. PBMC Telomere Length and SIRT Activity Differences between Treatment Groups

Group × time interactions approached statistical significance for PBMC SIRT activity (p = 0.056, Figure 2a) and telomere length (p = 0.067, Figure 2b). Post hoc analyses indicated that both metrics decreased from pre- to post-testing in the CTL group (p < 0.001 for both variables). Further, PBMC SIRT activity trended lower in the CTL group versus the NAD3 group at post-treatment (p = 0.057). Finally, it is notable that a decrease in telomere length approached statistical significance in the NAD3 group as well (p = 0.070), and there was no statistical difference between groups for this variable at week 12 (p = 0.765). Interestingly, the pre- to post-treatment change scores in SIRT activity values significantly correlated with change scores in PBMC NAD+/NADH values from our original investigation [5] when analyzing 20 participants (n = 10 from each group) who had both assays performed (r = 0.534, p = 0.015; Figure 2c).

3. Discussion

This study sought to expand upon our previous molecular analysis of NAD3 supplementation in which we reported that 12 weeks of supplementation positively affected PBMC NAD+: NADH values, as well as blood lipids [5]. Herein, we observed that 12 weeks of NAD3 supplementation altered the PBMC expression of 148 mRNAs (±1.5-fold change, p < 0.01) from pre- to post-treatment, with 76 being upregulated and 72 being downregulated. According to transcriptomics, certain biological processes were also predicted to be affected in PBMCs, including a downregulation in mRNA transcription, a downregulation in mRNA processing, a downregulation in ER stress, and an upregulation in helicase activity. When analyzing mRNAs that showed interactions and were not different between groups at pre-testing, the top predicted pathways shown to be affected included “DNA conformational change” (GO:0071103), “DNA duplex unwinding” (GO:0032508), “DNA geometric change” (GO:0032392), and “DNA replication” (GO:0055133). Interestingly, the mRNA expression of POT1 (a gene in the aforementioned GO pathways and critical for telomere length maintenance) increased with NAD3 versus CTL supplementation from pre- to post-treatment. However, PBMC DNA telomere length (as determined using PCR-based methods) showed similar post-treatment values between groups, indicating that telomere length was not altered via NAD3 supplementation. Interestingly, PBMC global SIRT activity decreased in CTL participants from pre- to post-treatment, but not in NAD3-supplementated participants, and week 12 values trended higher in NAD3 versus CTL participants. SIRT1-7 mRNA expression patterns did not differ between supplementation groups over time, according to our transcriptomic significance thresholds (see supplemental data file). However, the pre-to post- testing change scores in SIRT activity values significantly correlated with the change scores in the PBMC NAD+: NADH values from our original investigation [5]. These collective data suggest PBMC SIRT activity may be modulated through the maintenance of NAD+: NADH levels, rather than through altered SIRT1-7 mRNA expression. These findings are discussed in greater detail below.
This is the second study in which we have observed that NAD3 supplementation affects cellular sirtuin activity. In our first in vitro investigation [7], we noted that 24 h NAD3 treatments significantly increased SIRT activity, along with NAD+ concentrations in immortalized murine myotubes. In the current participants, NAD3 supplementation maintained, but did not increase, PBMC global sirtuin activity levels relative to the control participants. As reported previously [5], the same was also true of NAD+: NADH values in the NAD3-supplemented versus CTL participants, and interestingly, there was a significant positive association between the change values in both variables. Hence, while only based on association data, we believe that PBMC sirtuin activity was better maintained in the NAD3-supplemented participants because of the effects of supplementation on the cellular NAD+: NADH status. There is ample enthusiasm regarding roles that tissue NAD+ concentrations may play in aging [18], and some research suggests that the age-associated loss in tissue NAD+ levels contribute to a loss of cellular function [19]. However, it remains to be determined whether the effects observed herein translate to altered PBMC function or immune resilience, and this will be the crux of our future investigations. Moreover, as the current participants were middle-aged, more information is needed to determine if NAD3 supplementation has beneficial effects on the assayed markers in younger adults, given that they do not have lower cellular NAD+ levels or impaired sirtuin activity relative to middle-aged participants [20].
Exploratory findings to note include the way in which NAD3 supplementation affected biological processes in PBMCs, according to transcriptome- and methylome-wide bioinformatics. According to mRNA bioinformatics, biological processes predicted to be downregulated included regulation of transcription, mRNA processing, and response to endoplasmic reticulum (ER) stress. It is difficult to contemplate what the former two processes may signify, given that transcriptional arrest is a stress-related response [21]. Hence, this requires more clarity from an in vitro approach. The potential reduction in ER stress is intriguing and may be related to the niacin content in NAD3 and/or the effects that NAD3 has on maintaining NAD+: NADH levels. In this regard, Li et al. [22] showed that increasing intracellular levels of NAD+ via nicotinamide treatments protected hepatocytes from ER stress in vitro. Finally, the potential increase in PBMC helicase activity with NAD3 supplementation (as well as bioinformatics from the more stringently filtered mRNAs) may indicate an increase in cell turnover through DNA conformational changes. PBMCs contain lymphocytes (T cells, B cells, and NK cells), monocytes, and dendritic cells [23]. T cells have long half-lives (i.e., 1–8 years) [24], whereas B cells and monocytes have relatively shorter half-lives (i.e., days to weeks) [25,26]. Given that increased helicase activity coincides with cell cycle progression [27], future research is needed to examine how some of the shorter-lived PBMCs (e.g., B cells and monocytes) are affected by NAD3 supplementation. Moreover, complementing said data with functional immune responses is needed.
There are limitations to the current analyses. First, given that the supplement contained multiple ingredients, it is difficult to ascertain which of the ingredients affected each of the assayed outcomes. Second, participants were examined under free-living conditions. While participants were instructed to resume her/his normal dietary habits and physical activity patterns during enrollment, it is possible that some participants did not follow this guidance. Third, and as shown in Table 1, we were limited in sample size depending on the assay, and this led to variable n-sizes per analyses. Finally, it should be noted that PBMCs are not a pool of homogenous cells. Estimates indicate that this pool of cells contains ~70–90% lymphocytes, ~10–20% monocytes, and ~1–2% dendritic cells [28]. In our parent publication, we reported that no significant interactions were evident regarding alterations in lymphocyte and monocyte percentages (interaction p-values were p = 0.34 and p = 0.61, respectively) [5]. Hence, while we have no reason to believe that changes in lymphocyte or monocyte counts appreciably affected the outcomes herein, it is possible that marginal changes in these cell counts (or alterations in lymphocyte sub-populations) could have affected the results.
These data continue to demonstrate that a theacrine and ITC-based supplement can alter the cellular–molecular milieu. In brief, our association data suggest that the maintenance of PBMC SIRT activity may be modulated through the maintenance of NAD+: NADH levels with NAD3 supplementation. The significance of the obtained mRNA and DNA bioinformatics data require further investigation, given that pathway analysis is predictive (but not indicative) of processes being affected. Given the limited data in this area, more studies are needed to determine how PBMC function and stress resilience are affected by supplementation. Moreover, additional research is warranted in other human tissues (e.g., skeletal muscle, skin, etc.).

4. Materials and Methods

4.1. Ethical Approval

Details related to ethical approval, inclusion/exclusion criteria, and recruitment of these participants have been previously published [5], and this study was approved by the Institutional Review Board at IntegReview, Inc. (Austin, TX, USA; Protocol #CS-01-2020) and conformed the latest revision of the Declaration of Helsinki with the exception of being pre-registered as a clinical trial.
As mentioned previously, a subset of participants was analyzed from our original investigation due to sample yield limitations. For the convenience of the reader, these data are presented in Table 7 below.

4.2. Testing Sessions and Supplementation

Baseline (pre) evaluation of participants was performed after an overnight fast. First, body mass was obtained using height and body mass collected to the nearest 0.5 cm and 0.1 kg, respectively. Participants were then seated, and blood pressure was obtained from the right arm following a five-minute rest period using an automated cuff (Omron HEM-780). For PBMC isolation, venous blood was then obtained in an 8 mL tube (CPT Cell Preparation Tube; BD Vacutainer) by a research nurse. Upon blood collection into these tubes, tubes were inverted ~8 times and incubated at room temperature for approximately 30 min. Tubes were then centrifuged at 1500× g for 20 min (room temperature), buffy coats were removed using standardized pipetting technique, and samples were aliquoted in 1.7 mL polypropylene tubes and stored at −80 °C until analyses.
Following pre-testing, participants were matched for age, sex, and body mass index prior to being randomized into the control group (cellulose pills) or NAD3 group (per 2 capsules: 312 mg of combined Wasabia japonica, theacrine, and cuprous niacin). Participants and investigators were blinded to the treatments, and participants were told to consume capsules with breakfast. Following the 12-week intervention, participants returned to the laboratory for post-testing, which replicated the pre-testing procedures outlined above.

4.3. PBMC Transcriptome Analyses

PBMC RNA was isolated using a column-based kit (RNeasy micro kit, catalog #74004; Qiagen; Germantown, MD, USA), according to manufacturer’s instructions. The average yielded 260/280 absorbance ratio was 1.80, and this was deemed acceptable for proceeding to microarray analysis. The RNA was then shipped to a commercial laboratory for transcriptomic analysis using the Clariom S Assay_Human mRNA array (Thermo Scientific Microarray Research Service Laboratory, Santa Clara, CA, USA).
Raw data were received as .CEL files and analyzed using the Transcriptome Analysis Console v4.0.2 (Thermo Scientific). The hg38 (H. sapiens) genome was used for annotations, and the eBayes ANOVA method was used to determine significant time effects or interactions. The significance thresholds for the delta-delta fold changes (i.e., interactions) were defined as ±1.5 and p < 0.01. mRNAs that exhibited interactions were further analyzed at pre- and post-testing using t-tests via the Transcriptome Analysis Console v4.0.2 (with significance being established as p < 0.05). Final gene lists were queried for functional annotations using PANTHER pathway analysis [29].

4.4. PBMC DNA Methylation Analysis

PBMC DNA was isolated using a column-based kit (DNeasy blood and tissue kit, catalog #69504; Qiagen), according to manufacturer’s instructions. PBMC DNA was then sent to a commercial laboratory (TruDiagnostic, Inc., Lexington, KY, USA) for DNA methylation quantification, similar to the method recently described by Sexton et al. [30]. Briefly, 500 ng of PBMC DNA was extracted, and bisulfite was converted using the EZ DNA Methylation kit (Zymo Research), according to the manufacturer’s instructions. Bisulfite-converted DNA samples were randomly assigned to a chip well on the Infinium HumanMethylationEPIC Beadchip, amplified, hybridized onto the array, stained, washed, and imaged with the Illumina iScan SQ instrument to obtain raw image intensities. Raw image intensities in the form of IDAT files were processed together using the SeSaME pipeline, with Noob-based beta normalization and pOOBAH masking engaged. To conduct differential methylation analysis, normalized beta values were converted to m-values, fit to a linear model, and empirical Bayes smoothing was applied to standardize errors. Moderated t-tests were performed to identify differentially methylated loci (DMLs) using an unadjusted p < 0.001. Contrasts were set, depending on the analysis run, and included the following: (i) for within-group analyses, paired, moderated t-tests were conducted comparing the 12-week sample against the baseline sample for each participant, for the CTL and NAD3 supplemented group. Hypermethylated loci represents an increase in methylation at the 12-week timepoint relative to the baseline, while hypomethylation is the inverse. Similarly, the 12-week samples collected for the NAD3 supplemented group were compared to the CTL group to identify changes at the conclusion of the study. Hypermethylated DMLs represent greater methylation in the supplement group relative to the CTL group, while hypomethylation shows the inverse relationship.

4.5. PBMC SIRT and Telomere Length Assays

Relative telomere length was assessed using qPCR methods similar to those of Joglekar et al. [31]. Briefly, PBMC DNA, which was isolated above, was standardized to 5 ng/µL concentrations using DEPC water after concentration determination was performed on samples using a spectrophotometer (Nanodrop-2000; ThermoFisher Scientific, Waltham, MA, USA). For each sample, two reactions (in duplicate per participant time point) were performed including: (i) one using telomere-specific primers (forward primer sequence 5′ → 3′ end: CGGTTTGTTTGGGTTTGGGTTTGGGTTTGGGTTTGGGTT; reverse primer sequence 5′ → 3′ end: GGCTTGCCTTACCCTTACCCTTACCCTTACCCTTACCCT), and (ii) one using β-globulin-specific primers, which served as a normalizing gene (forward primer sequence 5′ → 3′end: GCTTCTGACACAACTGTGTTCACTAGC; reverse primer sequence 5′ → 3′ end: CACCAACTTCATCCACGTTCACC). Each reaction contained 10 µL of PerfeCTa SYBR green Master Mix (QuantaBio, Beverly, MA, USA), 1 µL of forward primers at the recommended working concentrations (1 μM for telomere primer and 3 μM for beta-globulin primer), 1 µL of reverse primers at the recommended working concentrations (3 μM telomere primer and 7 μM for beta-globulin primer), 13 µL of nuclease-free water, and 10 µL of diluted DNA sample (i.e., 50 ng total). The PCR reaction proceeded with a 3 min Taq enzyme activation phase, followed by 40 PCR cycles (annealing and extension temperature of 60 s, and a denaturation temperature of 15 s). Following the 40 cycles, a melt curve reaction was performed, and this confirmed the presence of one PCR product for each reaction. End-point relative fluorescent values (RFU) were obtained for the telomere and β-globulin PCR reactions, and a ratio was obtained for data presentation.
PBMC global SIRT activity levels were determined in duplicate on cell lysates (Abcam; catalog#: Ab156915) using methods similar to those we have previously described [7]. Briefly, 4 μL of PBMC lysates were loaded in duplicate onto 96-well plates provided by the kit for enzymatic reactions. Following execution of the assay, per manufacturer’s recommendations, absorbances were read at OD450 using a plate reader (BioTek Synergy H1), and absorbances were divided by the protein loaded (in µg). Duplicate CV values for all samples averaged 10.5%.

4.6. Statistics

Aside from -omics-based data, where statistical analyses are described above, SPSS v25.0 (IBM Corp, Armonk, NY, USA) was used for statistical analyses. Dependent variables were analyzed using two-way (group × time) repeated measures ANOVAs. Post hoc tests were performed by using dependent samples t-tests within groups from pre- to post-testing, and between-samples t-tests between each group at the pre- and post- time points. Pearson correlations were also performed on select variables. All data are presented in figures and tables as means ± standard deviation (SD) values, and statistical significance for non-omics-based data was established as p < 0.05.

Supplementary Materials

The following supporting information can be downloaded at: https://www.mdpi.com/article/10.3390/physiologia3020016/s1, Supplementary File S1. mRNA comparisons—provides between group comparisons and p-values of all genes provided by the Clariom S Assay_Human mRNA array.

Author Contributions

Conceptualization, H.L.L., T.N.Z. and M.D.R.; methodology, all authors; investigation, all authors; data curation, all authors; writing—original draft preparation, H.L.L., T.N.Z. and M.D.R.; writing—review and editing, all authors; funding acquisition, H.L.L. and T.N.Z. All authors have read and agreed to the published version of the manuscript.

Funding

Costs involved with executing the study and assays were covered by JUVN3 Holdings.

Institutional Review Board Statement

This study was approved by the Institutional Review Board at IntegReview, Inc. (Austin, TX, USA; Protocol #CS-01-2020).

Informed Consent Statement

Informed consent was obtained from all subjects involved in the study.

Data Availability Statement

Raw data will be provided upon reasonable request upon emailing the corresponding author ([email protected]).

Acknowledgments

We thank the participants for volunteering for this study.

Conflicts of Interest

M.D.R. has been paid as a writing consultant in the past for scientific writing endeavors related to assay development for CAHS and Compound Solutions. Additionally, the JUVN3 Holdings provided a multiple-year laboratory donation to the laboratory of M.D.R. between 2019–2022 for partial graduate student stipends, non-related graduate student projects, and assay development. H.L.L. has received grants and contracts to conduct research on dietary supplements; has served as a paid consultant for industry; has received honoraria for speaking at conferences and writing lay articles about dietary supplement ingredients; and receives compensation from licensing multiple patents as a co-inventor in the nutra-biosciences industry (including, NAD3, the topic of this manuscript). T.N.Z. has received grants and contracts to conduct research on dietary supplements; has served as a paid consultant for industry; has received honoraria for speaking at conferences and writing lay articles about dietary supplement ingredients; and receives compensation from licensing multiple patents as a co-inventor in the nutra-biosciences industry (including, NAD3, the topic of this manuscript).

References

  1. Gualano, B.; Rawson, E.S.; Candow, D.G.; Chilibeck, P.D. Creatine supplementation in the aging population: Effects on skeletal muscle, bone and brain. Amino Acids 2016, 48, 1793–1805. [Google Scholar] [CrossRef]
  2. Troesch, B.; Eggersdorfer, M.; Laviano, A.; Rolland, Y.; Smith, A.D.; Warnke, I.; Weimann, A.; Calder, P.C. Expert opinion on benefits of long-chain omega-3 fatty acids (DHA and EPA) in aging and clinical nutrition. Nutrients 2020, 12, 2555. [Google Scholar] [CrossRef] [PubMed]
  3. Cercillieux, A.; Ciarlo, E.; Canto, C. Balancing NAD+ deficits with nicotinamide riboside: Therapeutic possibilities and limitations. Cell Mol. Life Sci. 2022, 79, 463. [Google Scholar] [CrossRef] [PubMed]
  4. Serino, A.; Salazar, G. Protective role of polyphenols against vascular inflammation, aging and cardiovascular disease. Nutrients 2018, 11, 53. [Google Scholar] [CrossRef] [PubMed] [Green Version]
  5. Roberts, M.D.; Osburn, S.C.; Godwin, J.S.; Ruple, B.A.; La Monica, M.B.; Raub, B.; Sandrock, J.E.; Ziegenfuss, T.N.; Lopez, H.L. Enhance Trial: Effects of NAD3&reg; on Hallmarks of Aging and Clinical Endpoints of Health in Middle Aged Adults: A Subset Analysis Focused on Blood Cell NAD+ Concentrations and Lipid Metabolism. Physiologia 2022, 2, 20–31. [Google Scholar]
  6. Taylor, L.; Mumford, P.; Roberts, M.; Hayward, S.; Mullins, J.; Urbina, S.; Wilborn, C. Safety of TeaCrine(R), a non-habituating, naturally-occurring purine alkaloid over eight weeks of continuous use. J. Int. Soc. Sports Nutr. 2016, 13, 2. [Google Scholar] [CrossRef] [Green Version]
  7. Mumford, P.W.; Osburn, S.C.; Fox, C.D.; Godwin, J.S.; Roberts, M.D. A Theacrine-Based Supplement Increases Cellular NAD+ Levels and Affects Biomarkers Related to Sirtuin Activity in C2C12 Muscle Cells In Vitro. Nutrients 2020, 12, 3727. [Google Scholar] [CrossRef]
  8. Sheng, Y.Y.; Xiang, J.; Wang, Z.S.; Jin, J.; Wang, Y.Q.; Li, Q.S.; Li, D.; Fang, Z.T.; Lu, J.L.; Ye, J.H.; et al. Theacrine From Camellia kucha and Its Health Beneficial Effects. Front. Nutr. 2020, 7, 596823. [Google Scholar] [CrossRef]
  9. Gao, M.; Zheng, J.; Zheng, C.; Huang, Z.; Huang, Q. Theacrine alleviates chronic inflammation by enhancing TGF-beta-mediated shifts via TGF-beta/SMAD pathway in Freund’s incomplete adjuvant-induced rats. Biochem. Biophys. Res. Commun. 2020, 522, 743–748. [Google Scholar] [CrossRef]
  10. Wang, G.E.; Li, Y.F.; Zhai, Y.J.; Gong, L.; Tian, J.Y.; Hong, M.; Yao, N.; Wu, Y.P.; Kurihara, H.; He, R.R. Theacrine protects against nonalcoholic fatty liver disease by regulating acylcarnitine metabolism. Metabolism 2018, 85, 227–239. [Google Scholar] [CrossRef]
  11. Li, W.X.; Li, Y.F.; Zhai, Y.J.; Chen, W.M.; Kurihara, H.; He, R.R. Theacrine, a purine alkaloid obtained from Camellia assamica var. kucha, attenuates restraint stress-provoked liver damage in mice. J. Agric. Food Chem. 2013, 61, 6328–6335. [Google Scholar] [CrossRef] [PubMed]
  12. Uto, T.; Hou, D.X.; Morinaga, O.; Shoyama, Y. Molecular Mechanisms Underlying Anti-Inflammatory Actions of 6-(Methylsulfinyl)hexyl Isothiocyanate Derived from Wasabi (Wasabia japonica). Adv. Pharmacol. Sci. 2012, 2012, 614046. [Google Scholar] [CrossRef] [PubMed] [Green Version]
  13. Greaney, A.J.; Maier, N.K.; Leppla, S.H.; Moayeri, M. Sulforaphane inhibits multiple inflammasomes through an Nrf2-independent mechanism. J. Leukoc. Biol. 2016, 99, 189–199. [Google Scholar] [CrossRef] [PubMed] [Green Version]
  14. Caglayan, B.; Kilic, E.; Dalay, A.; Altunay, S.; Tuzcu, M.; Erten, F.; Orhan, C.; Gunal, M.Y.; Yulug, B.; Juturu, V.; et al. Allyl isothiocyanate attenuates oxidative stress and inflammation by modulating Nrf2/HO-1 and NF-kappaB pathways in traumatic brain injury in mice. Mol. Biol. Rep. 2019, 46, 241–250. [Google Scholar] [CrossRef]
  15. Gerhauser, C. Epigenetic impact of dietary isothiocyanates in cancer chemoprevention. Curr. Opin. Clin. Nutr. Metab. Care 2013, 16, 405–410. [Google Scholar] [CrossRef]
  16. Arredondo, M.; Munoz, P.; Mura, C.V.; Nunez, M.T. DMT1, a physiologically relevant apical Cu1+ transporter of intestinal cells. Am. J. Physiol. Cell Physiol. 2003, 284, C1525–C1530. [Google Scholar] [CrossRef]
  17. Thomas, P.D.; Campbell, M.J.; Kejariwal, A.; Mi, H.; Karlak, B.; Daverman, R.; Diemer, K.; Muruganujan, A.; Narechania, A. PANTHER: A library of protein families and subfamilies indexed by function. Genome Res. 2003, 13, 2129–2141. [Google Scholar] [CrossRef] [Green Version]
  18. Sexton, C.L.; Godwin, J.S.; McIntosh, M.C.; Ruple, B.A.; Osburn, S.C.; Hollingsworth, B.R.; Kontos, N.J.; Agostinelli, P.J.; Kavazis, A.N.; Ziegenfuss, T.N. Skeletal muscle DNA methylation and mRNA responses to a bout of higher versus lower load resistance exercise in previously trained men. Cells 2023, 12, 263. [Google Scholar] [CrossRef]
  19. Joglekar, M.V.; Satoor, S.N.; Wong, W.K.; Cheng, F.; Ma, R.C.; Hardikar, A.A. An optimised step-by-step protocol for measuring relative telomere length. Methods Protoc. 2020, 3, 27. [Google Scholar] [CrossRef] [Green Version]
  20. Ashburner, M.; Ball, C.A.; Blake, J.A.; Botstein, D.; Butler, H.; Cherry, J.M.; Davis, A.P.; Dolinski, K.; Dwight, S.S.; Eppig, J.T.; et al. Gene ontology: Tool for the unification of biology. The Gene Ontology Consortium. Nat. Genet. 2000, 25, 25–29. [Google Scholar] [CrossRef] [Green Version]
  21. Verdin, E. NAD+ in aging, metabolism, and neurodegeneration. Science 2015, 350, 1208–1213. [Google Scholar] [CrossRef]
  22. Goody, M.F.; Henry, C.A. A need for NAD+ in muscle development, homeostasis, and aging. Skelet. Muscle 2018, 8, 9. [Google Scholar] [CrossRef] [PubMed] [Green Version]
  23. Lamb, D.A.; Moore, J.H.; Mesquita, P.H.C.; Smith, M.A.; Vann, C.G.; Osburn, S.C.; Fox, C.D.; Lopez, H.L.; Ziegenfuss, T.N.; Huggins, K.W.; et al. Resistance training increases muscle NAD+ and NADH concentrations as well as NAMPT protein levels and global sirtuin activity in middle-aged, overweight, untrained individuals. Aging 2020, 12, 9447–9460. [Google Scholar] [CrossRef] [PubMed]
  24. Sawarkar, R. Transcriptional lockdown during acute proteotoxic stress. Trends Biochem. Sci. 2022. [Google Scholar] [CrossRef] [PubMed]
  25. Li, J.; Dou, X.; Li, S.; Zhang, X.; Zeng, Y.; Song, Z. Nicotinamide ameliorates palmitate-induced ER stress in hepatocytes via cAMP/PKA/CREB pathway-dependent Sirt1 upregulation. Biochim. Biophys. Acta-Mol. Cell Res. 2015, 1853, 2929–2936. [Google Scholar] [CrossRef] [Green Version]
  26. Alexovic, M.; Lindner, J.R.; Bober, P.; Longuespee, R.; Sabo, J.; Davalieva, K. Human peripheral blood mononuclear cells: A review of recent proteomic applications. Proteomics 2022, 22, e2200026. [Google Scholar] [CrossRef]
  27. Farber, D.L.; Yudanin, N.A.; Restifo, N.P. Human memory T cells: Generation, compartmentalization and homeostasis. Nat. Rev. Immunol. 2014, 14, 24–35. [Google Scholar] [CrossRef] [Green Version]
  28. Fulcher, D.A.; Basten, A. B cell life span: A review. Immunol. Cell Biol. 1997, 75, 446–455. [Google Scholar] [CrossRef]
  29. Patel, A.A.; Ginhoux, F.; Yona, S. Monocytes, macrophages, dendritic cells and neutrophils: An update on lifespan kinetics in health and disease. Immunology 2021, 163, 250–261. [Google Scholar] [CrossRef]
  30. Gu, J.; Xia, X.; Yan, P.; Liu, H.; Podust, V.N.; Reynolds, A.B.; Fanning, E. Cell cycle-dependent regulation of a human DNA helicase that localizes in DNA damage foci. Mol. Biol. Cell 2004, 15, 3320–3332. [Google Scholar] [CrossRef]
  31. Kleiveland, C.R. Peripheral blood mononuclear cells. In The Impact of Food Bioactives on Health: In Vitro and Ex Vivo Models; Springer: Berlin/Heidelberg, Germany, 2015; pp. 161–167. [Google Scholar]
Figure 1. Volcano plots and heatmaps for the 12-week sample PBMC DNA methylation comparisons between the NAD3 and CTL groups. Legend: the left inset illustrates methylation scores (M-values) at week 12, when fold-change was calculated as CTL values relative to NAD3 values. The right inset is a heat map that illustrates the 12-week methylation scores (Beta values) between n = 8 NAD3 participants and n = 13 CTL participants.
Physiologia 03 00016 g001
Figure 2. Effects of supplementation on PBMC SIRT activity, PBMC telomere length, and the relationship between changes in PBMC SIRT activity and NAD+/NADH ratio. Legend: these data show PBMC SIRT activity from pre- to post-testing between groups (panel (a)), PBMC telomere length from pre-to-post-testing between groups (panel (b)), and the relationship between changes in PBMC SIRT activity and NAD+/NADH ratio between groups (panel (c)). Note, black data points in panel (c) are CTL participants, and gray data points are NAD3 participants. Data are presented as means ± standard deviation values.
Physiologia 03 00016 g002
Table 1. Top 15 upregulated and downregulated PBMC mRNAs with supplementation from pre- to post-testing.
GeneCTL
PRE
CTL
POST
NAD3
PRE
NAD3
POST
Delta-Fold ChangeInteraction
p-Value
Downregulated in NAD3 versus CTL from pre-to post-testing
ADAM225.666.096.73 *5.27−3.700.0063
PTPRO4.975.346.25 *5.07−2.940.0089
DCAF65.696.26.265.21−2.940.0094
SRF4.184.665.13 *4.06 #−2.930.0004
LYRM24.895.056.08 *4.80−2.720.0011
RRAS26.126.806.55 *5.84 #−2.630.00001
ZNF4154.655.095.124.21 #−2.550.002
SNX14.915.425.62 *4.79 #−2.530.0003
THEGL6.617.097.236.39 #−2.510.0086
ECD5.936.626.265.64 #−2.490.0086
PPP6R14.624.895.29 *4.30 #−2.400.0007
FBXO166.086.626.80 *6.08−2.390.0017
TNFRSF10B4.825.525.57 *5.02−2.380.0016
EPT14.635.065.12 *4.31−2.360.0044
GEMIN25.165.675.81 *5.12 #−2.310.0004
Upregulated in NAD3 versus CTL from pre- to post-testing
TNFSF13B6.975.235.10 *5.945.990.00006
ST55.965.504.79 *6.25 #3.790.0022
NDUFB46.535.545.726.573.590.0017
ZZZ35.044.824.21 *5.66 #3.180.0009
TRPC56.625.836.247.09 #3.100.0015
OSBPL1A6.405.785.30 *6.313.090.00008
STKLD17.006.196.20 *6.94 #2.920.0002
POGZ6.995.865.96 *6.37 #2.920.0044
CNTROB7.296.056.34 *6.652.900.0094
MYO65.054.294.565.32 #2.870.0021
POT16.265.715.486.40 #2.780.0006
PPIE5.014.614.335.41 #2.780.0023
ARMC24.273.884.005.01 #2.640.0067
STXBP46.015.795.636.68 #2.410.0067
CNIH35.325.065.216.21 #2.400.0083
Legend: values are presented as log2 expression data averaged for n = 16 CTL participants and n = 9 NAD3 participants. Symbols: *, indicates values were different between groups at pre- (p < 0.05); #, indicates values were different between groups at post-testing.
Table 2. Significant functionally annotated terms from significantly altered PBMC mRNA with supplementation.
Biological Process GOTERMCount
(% of Pathway)
mRNAsSignificance of GOTERM
Upregulated in NAD3 versus CTL from pre- to post-testing
Helicase activity3 (4%)DDX60, HFM1, SNRNP2000.021
Downregulated in NAD3 versus CTL from pre- to post-testing
Regulation of transcription from RNA PolII promoter 10 (14.3%)DCAF6, PRDM4, ECD, FOXOA1, GMEB1, IL17F, MOSPD1, NPAT, PHOX2B, SRF0.012
Response to ER stress3 (4.3%)DNAJB9, TNFRSF10B, HYOU10.028
mRNA processing4 (5.7%)ADAR, ECD, GEMIN2, PAN30.029
Legend: significance for GOTERM was established as p < 0.05.
Table 3. Top 15 upregulated and downregulated PBMC mRNAs with supplementation from pre- to post-testing that were not significantly different at pre- and were significantly different at post-testing.
GeneCTL
PRE
CTL
POST
NAD3
PRE
NAD3
POST
Delta-Fold ChangeInteraction
p-Value
Downregulated in NAD3 versus CTL from pre- to post-testing
ZNF4154.655.095.124.21−2.550.002
THEGL6.617.097.236.39−2.510.0086
ECD5.936.626.265.64−2.490.0086
SPATA174.835.714.834.53−2.270.0001
ZNF529-AS15.756.176.355.74−2.040.003
ST56.26.616.435.84−2.010.0074
OXR15.245.605.384.73−2.010.0013
HINT16.086.496.525.96−1.960.0029
ZNF2334.865.595.184.94−1.960.009
GLCCI14.474.984.584.12−1.950.0034
DTD15.936.476.265.86−1.920.0027
MOSPD14.654.765.064.28−1.870.0071
DDX115.846.545.715.51−1.870.0042
C14orf1594.194.674.404.00−1.830.0028
FOXA15.516.115.855.60−1.800.0025
Upregulated in NAD3 versus CTL from pre- to post-testing
ST55.965.54.796.253.790.0022
NDUFB46.535.545.726.573.590.0017
TRPC56.625.836.247.093.100.0015
MYO65.054.294.565.322.870.0021
PPIE5.014.614.335.412.780.0023
POT16.265.715.486.402.780.0006
ARMC24.273.884.005.012.640.0067
STXBP46.015.795.636.682.410.0067
CNIH35.325.065.216.212.400.0083
WRNIP14.944.484.325.112.370.0057
SASS65.274.805.426.172.340.0082
SLC26A66.025.255.505.912.290.0096
ASB175.074.824.535.482.290.0047
LNX14.244.244.105.172.110.0059
C3orf525.044.824.675.472.030.0054
Legend: values are presented as log2 expression data averaged for n = 16 CTL participants and n = 9 NAD3 participants.
Table 4. Significant functionally annotated pathways from significantly altered PBMC mRNAs with supplementation where these mRNAs were not significantly different at pre- and were significantly different at post-testing between groups.
Biological Process GOTERMCount
(% of Pathway)
mRNAsSignificance of GOTERM
Top upregulated biological processes in NAD3 versus CTL from pre- to post-testing
DNA conformation change *5 (4.7%)POT1, HFM1, WRNIP1, DTD1, DDX111.4 × 10−5
Only downregulated biological process in NAD3 versus CTL from pre- to post-testing
Cell communication8 (0.1%)RAB12, STXBP4, ASB17, MYO6, CD24, HINT1, TEAD2, FOXA10.047
Legend: these data were from the 64 mRNAs that were not significantly different between groups at pre- but differed between groups at post-testing. Symbol: *, these genes also belonged to the following GOTERM biological processes that were predicted to be significantly upregulated with NAD3 supplementation: “DNA duplex unwinding” (GO:0032508), “DNA geometric change” (GO:0032392), and “DNA replication” (GO:0055133).
Table 5. Number of significant PBMC DMLs from pre- to post-intervention.
Differentially Methylated SitesCTL GroupNAD3 Group
Hypermethylated36935
Hypomethylated17872
Total differentially methylated sites547107
Legend: Significance for DML was established using an unadjusted p < 0.001.
Table 6. GO terms associated with DNA methylation data at week 12.
ClassificationIDDescriptionGenes
GO-related terms predicted to be upregulated based on genes hypomethylated at week 12 in the NAD3 versus CTL group
GO Molecular FunctionGO:0003712transcription cofactor activityBCOR,CITED1,FOXP3,HCFC1,KDM1A,MAGED1,MECP2,MED12,MED14,MSX2,MYOCD,NR0B1,NR2F2,PIR,POU3F2,PQBP1,RAP2C,RBBP8,RLIM,SMARCC1,SOX3,SSX4B,TADA2A,TAF1,TAF7L,TAF9B,TBL1X,TFDP1,UBE3A,UXT,VGLL1,YY1,ZCCHC12,ZCCHC18
GO Molecular FunctionGO:0017064fatty acid amide hydrolase activityFAAH,FAAH2
GO Cellular ComponentGO:0000794condensed nuclear chromosomeATRX,FAM9B,FAM9C,HSPA2,RGS12,SMC1A,SUV39H1,SYN1,TEX11
GO Molecular FunctionGO:0005275amine transmembrane transporter activitySLC22A16,SLC32A1
GO Molecular FunctionGO:0052846inositol-1,5-bisdiphosphate-2,3,4,6-tetrakisphosphate 1-diphosphatase activityNUDT10,NUDT11
GO Molecular FunctionGO:0016300tRNA (uracil) methyltransferase activityKIAA1456,TRMT2B
GO-related terms predicted to be downregulated based on genes hypermethylated at week 12 in the NAD3 versus CTL group
GO Molecular FunctionGO:0008484sulfuric ester hydrolase activityARSD,ARSE,ARSF,ARSH,ENSG00000241489,IDS,STS,SULF1
GO Biological ProcessGO:0002755MyD88-dependent toll-like receptor signaling pathwayBTK,IRAK1,TAB2,TAB3,TLR7,TLR8
GO Biological ProcessGO:0008215spermine metabolic processSAT1,SATL1,SMS
GO Cellular ComponentGO:0002189ribose phosphate diphosphokinase complexPRPS1,PRPS2
GO Molecular FunctionGO:0048365Rac GTPase bindingARHGAP4,CDKL5,FLNA,NOX1,OCRL,PAK3,WAS
GO Molecular FunctionGO:0035586purinergic receptor activityADORA2A,GPR34,P2RX2,P2RY10,P2RY4
GO Biological ProcessGO:0016570histone modificationATXN3L,BCOR,BRCC3,CUL4B,HCFC1,HDAC6,HDAC8,HUWE1,JADE3,KDM5C,KDM6A,MECP2,MORF4L2,MSL3,OGT,PADI1,PADI3,PHF8,RBBP7,SUV39H1,TAF1,TAF9B,TBL1X,UBE2A,USP51
GO Molecular FunctionGO:0035197siRNA bindingFMR1,MECP2,TLR7
GO Molecular FunctionGO:0061578Lys63-specific deubiquitinase activityBRCC3,OTUD5,USP27X
GO Biological ProcessGO:0071394cellular response to testosterone stimulusAR,ELK1,MSN
GO Biological ProcessGO:0009169purine ribonucleoside monophosphate catabolic processHPRT1,NUDT10,NUDT11
GO Cellular ComponentGO:0005741mitochondrial outer membraneACSL4,ARMCX1,ARMCX2,ARMCX3,ARMCX6,DDX3X,FUNDC1,FUNDC2,GK,MAOA,MAOB,MLXIP,MTX2,SPATA19
GO Molecular FunctionGO:0008013beta-catenin bindingAJAP1,AMER1,AR,CDH5,FOXO4,HDAC6,MED12,SHROOM2,TBL1X
GO Biological ProcessGO:0048488synaptic vesicle endocytosisNLGN3,NLGN4X,OPHN1,SYP,SYT5
GO Molecular FunctionGO:0004145diamine N-acetyltransferase activitySAT1,SATL1
GO Biological ProcessGO:0009128purine nucleoside monophosphate catabolic processHPRT1,NUDT10,NUDT11
GO Molecular FunctionGO:0036459thiol-dependent ubiquitinyl hydrolase activityALG13,ATXN3L,BRCC3,OTUD5,OTUD6A,TAF9B,USP11,USP27X,USP51,USP9X,USP9Y
GO Biological ProcessGO:0016569covalent chromatin modificationATRX,ATXN3L,BCOR,BCORL1,BRCC3,CUL4B,HCFC1,HDAC6,HDAC8,HMGN5,HUWE1,JADE3,KDM5C,KDM6A,MECP2,MORF4L2,MSL3,OGT,PADI1,PADI3,PHF8,RBBP7,SMARCA1,SUV39H1,TAF1,TAF9B,TBL1X,TSPYL2,UBE2A,USP51
GO Molecular FunctionGO:0101005ubiquitinyl hydrolase activityALG13,ATXN3L,BRCC3,OTUD5,OTUD6A,TAF9B,USP11,USP27X,USP51,USP9X,USP9Y
GO Molecular FunctionGO:0099095ligand-gated anion channel activityGABRE,GLRA2,GLRA4
Legend: the ontology ID, description, regions, and genes associated with the one significant GO-CC term identified between 12-week samples among the NAD3 versus CTL comparison. An adjusted Bonferroni corrected p-value < 0.05 was selected as the threshold, and redundant or non-relevant processes (e.g., neurogenic processes) were removed.
Table 7. Number of CTL and NAD3 participants per PBMC assay.
AssayCTL GroupNAD3 Group
TranscriptomicsN = 16 (51 ± 6 years old; 7 M/9 W)N = 9 (53 ± 7 years old; 4 M/5 W)
Global DNA methylationN = 13 (52 ± 6 years old; 7 M/6 W)N = 8 (53 ± 8 years old; 3 M/5 W)
SIRT activityN = 15 (52 ± 5 years old; 6 M/9 W)N = 10 (51 ± 6 years old; 3 M/7 W)
Telomere lengthN = 14 (51 ± 5 years old; 4 M/10 W)N = 13 (50 ± 6 years old; 3 M/10 W)
NAD+: NADH *N = 10 (51 ± 6 years old; 2 M/8 W)N = 10 (52 ± 6 years old; 5 M/5 W)
Legend: for convenience, these data show the number of participants per group used for each assay. Notably, a different number of participants were used per assay due to lysate constraints (i.e., transcriptomics, SIRT activity, telomere length) or costs (i.e., global DNA methylation). Abbreviations: M, men; W, women. Symbol: *, indicates that this assay was performed by Roberts et al. (2022), whereby 10 CTL and 12 NAD3 participants were originally analyzed; however, given that we aimed to associate PBMC SIRT activity and NAD+/NADH data, two NAD3 participants were not included herein, since they did not have enough lysate for SIRT analysis. Other notes: no significant differences in age existed between CTL and NAD3 participants who donated PBMCs prior to and following the 12-week intervention for global DNA methylation (p = 0.787), transcriptomics (p = 0.604), SIRT activity analysis (p = 0.806), telomere length analysis (p = 0.492), or NAD+/NADH analysis (p = 0.737).
Disclaimer/Publisher’s Note: The statements, opinions and data contained in all publications are solely those of the individual author(s) and contributor(s) and not of MDPI and/or the editor(s). MDPI and/or the editor(s) disclaim responsibility for any injury to people or property resulting from any ideas, methods, instructions or products referred to in the content.

