Seasonal Response of Major Phytoplankton Groups to Environmental Variables along the Campeche Coast, Southern Gulf of Mexico

 ,
,  , and
, and 
Abstract
:1. Introduction
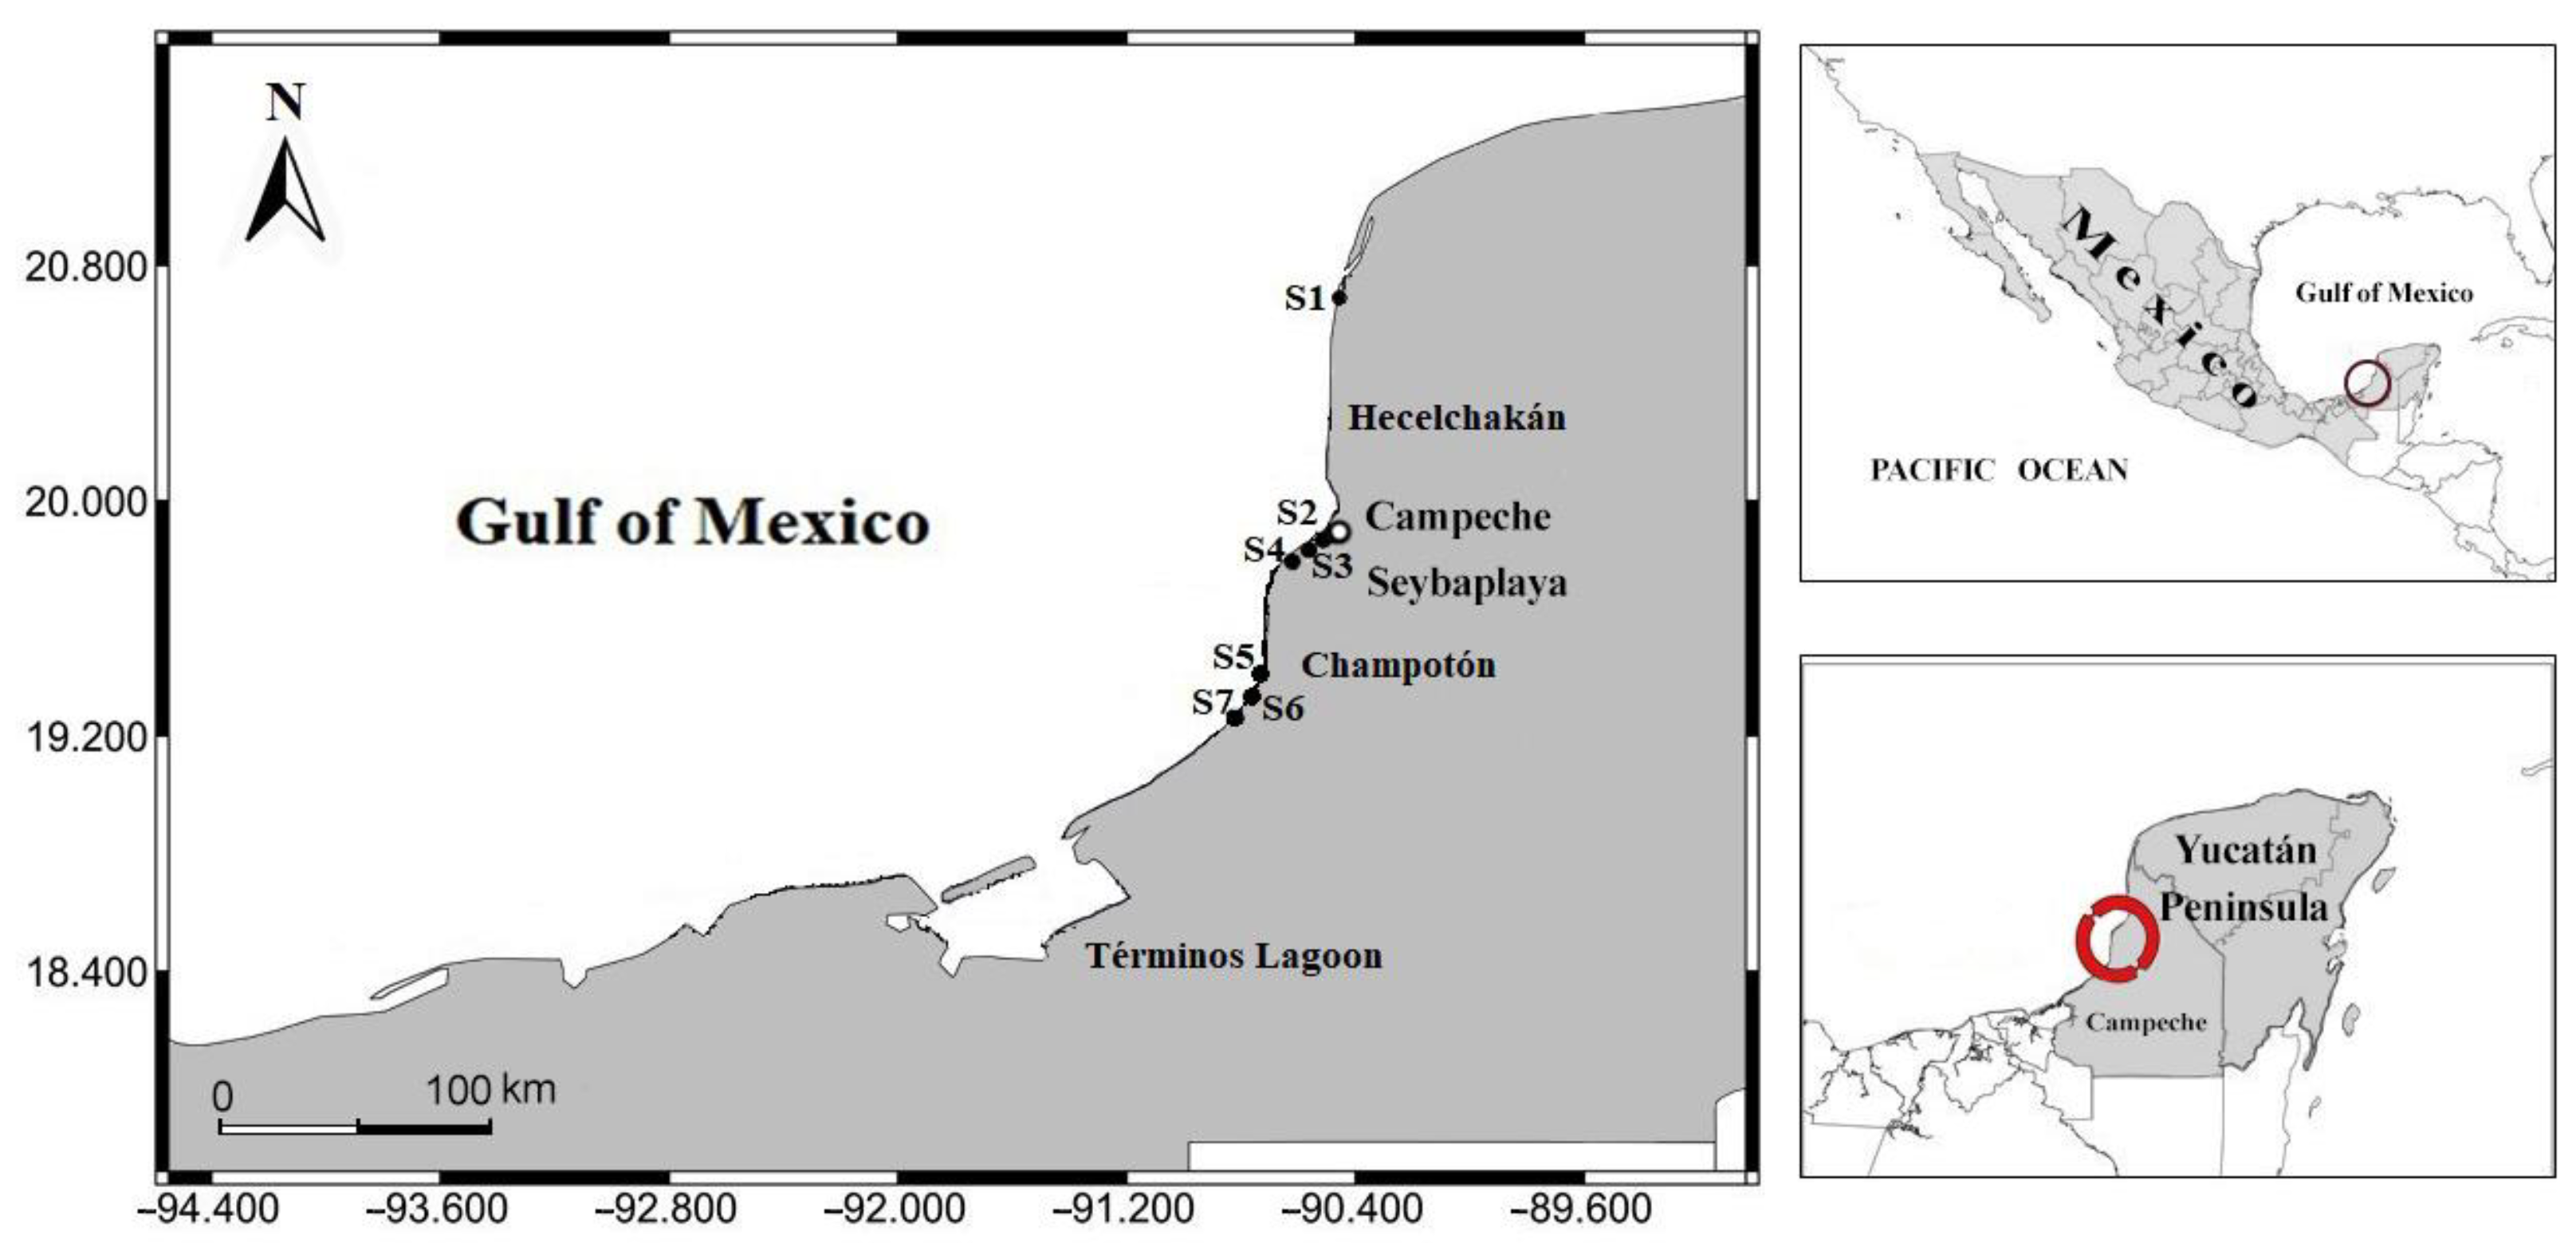
2. Materials and Methods
3. Results
3.1. Physical–Chemical Variables
3.2. Inorganic Nutrients
3.3. Major Phytoplankton Groups
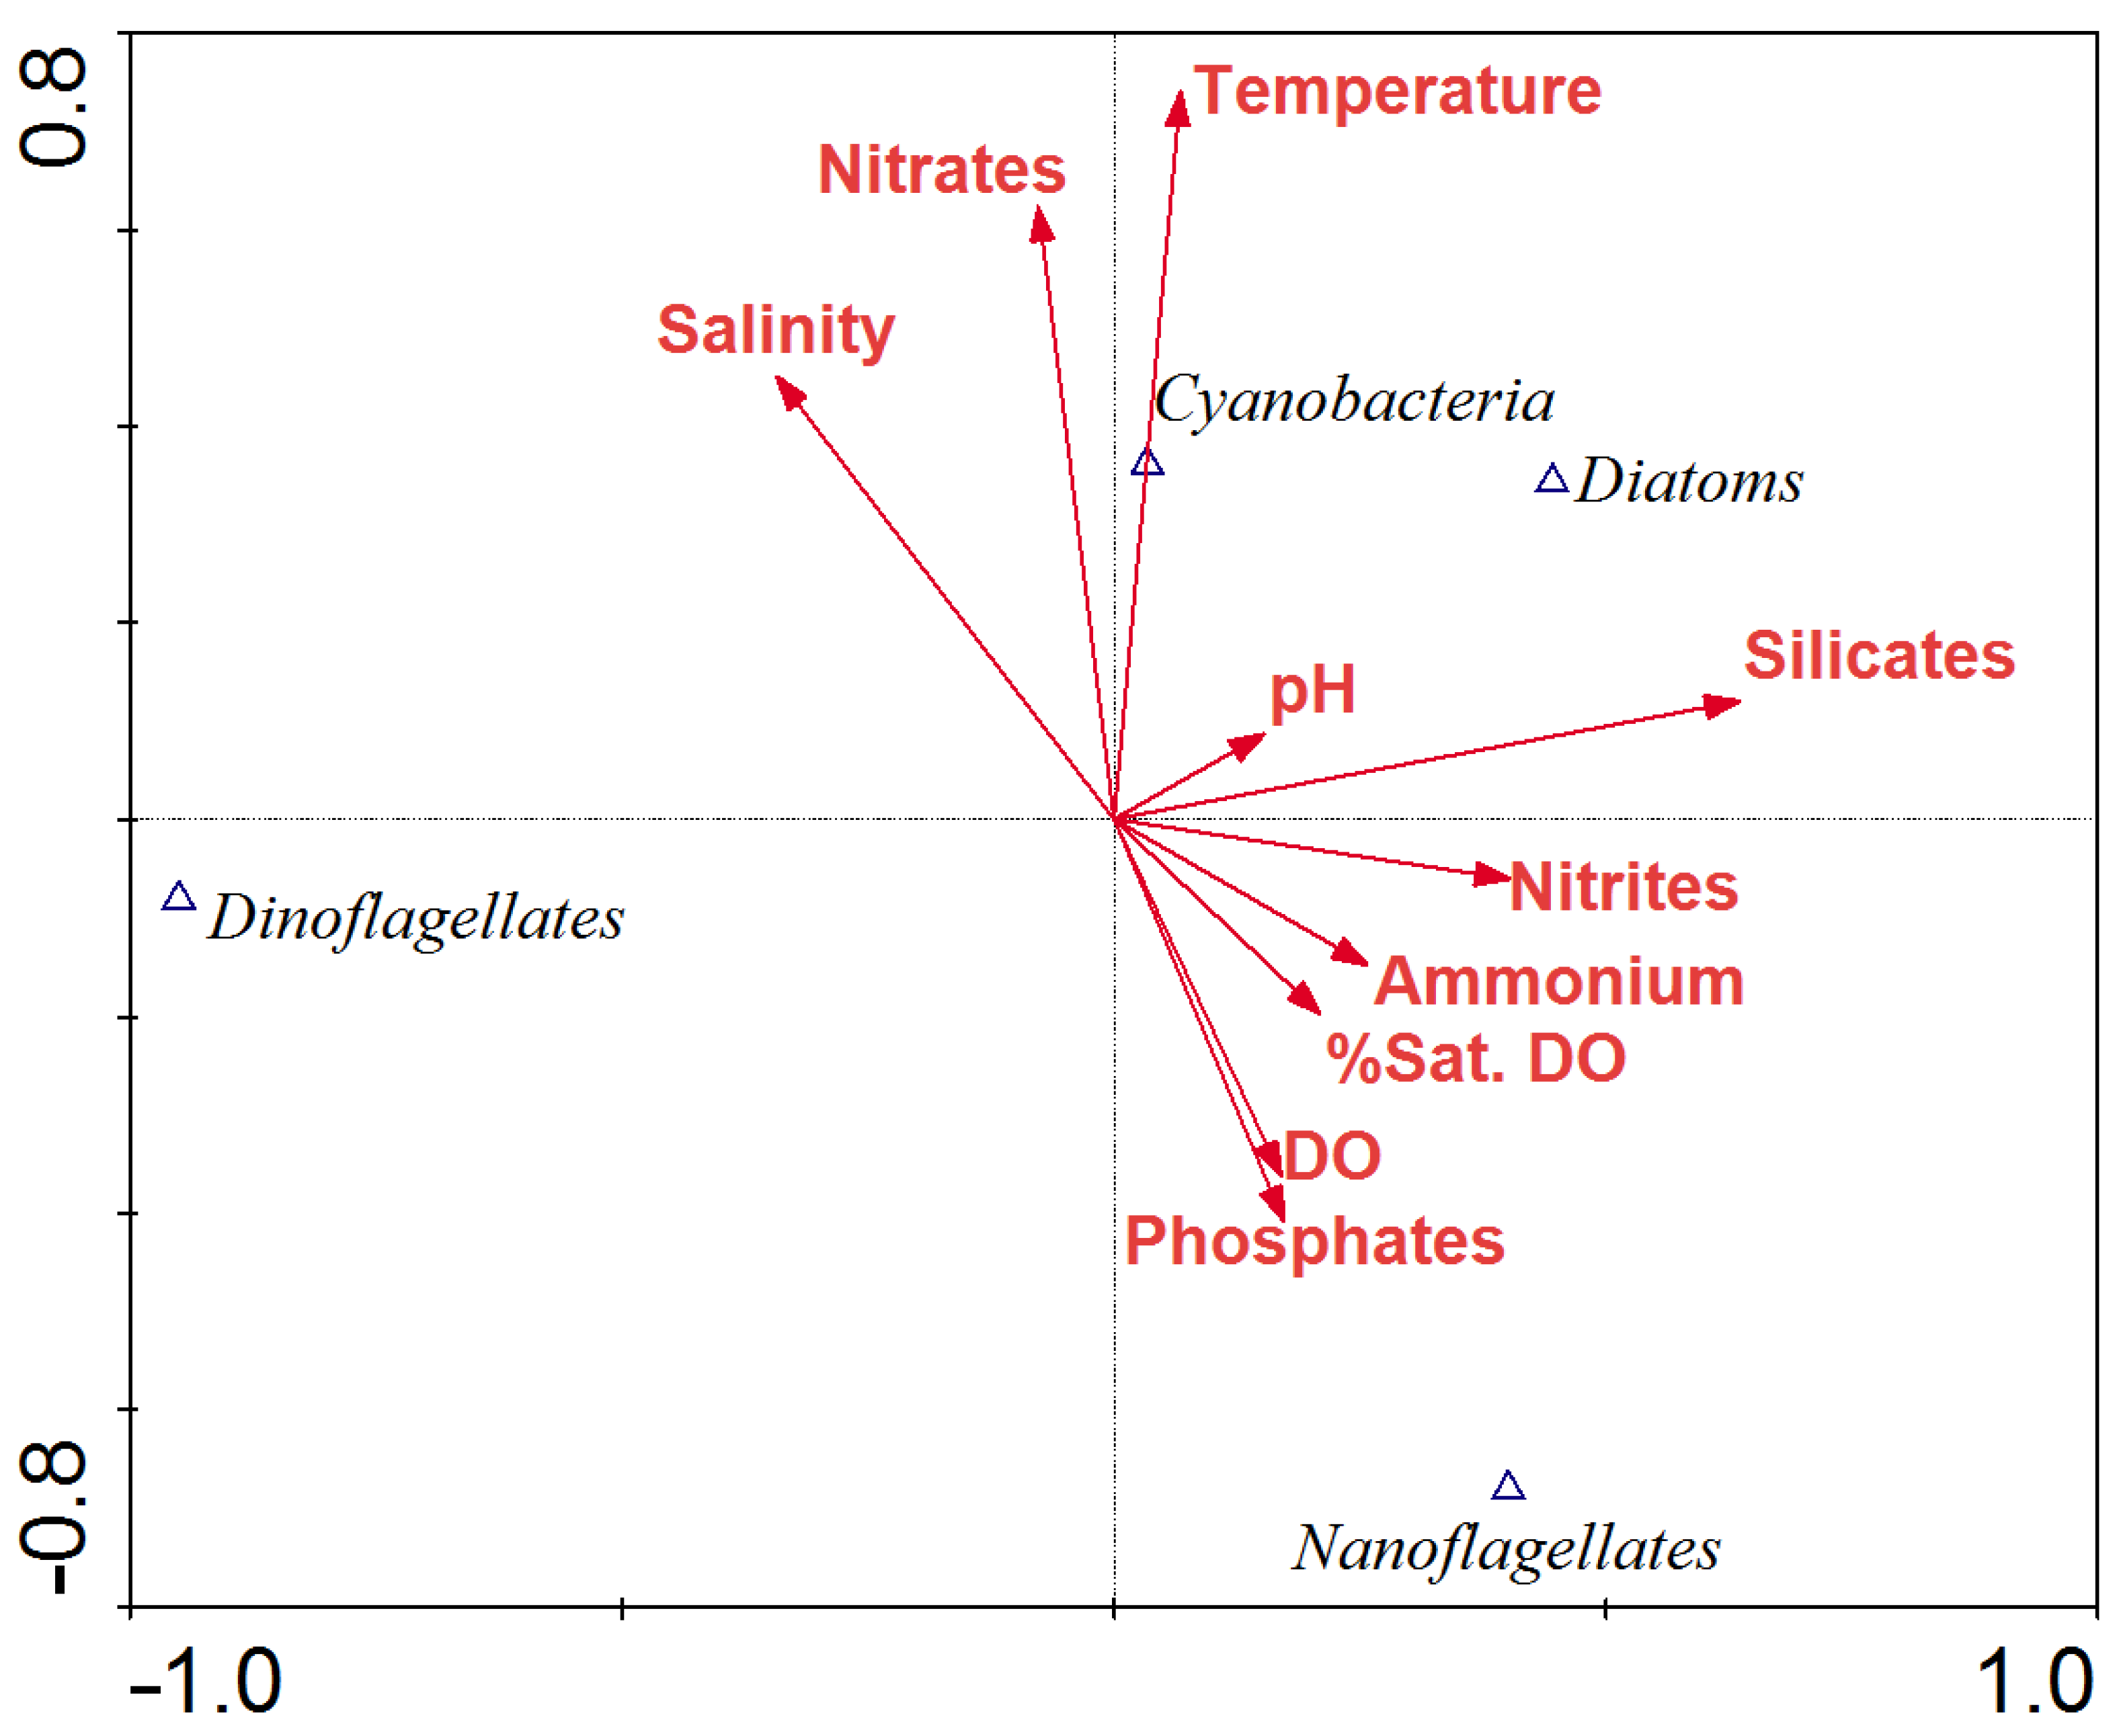
3.4. Relationship between Physical–Chemical Variables, Inorganic Nutrients and Phytoplankton
4. Discussion
5. Conclusions
Author Contributions
Funding
Institutional Review Board Statement
Informed Consent Statement
Data Availability Statement
Acknowledgments
Conflicts of Interest
References
- Griffith, A.W.; Gobler, C.J. Harmful algal blooms: A climate change co-stressor in marine and freshwater ecosystems. Harmful Algae 2020, 91, 101590. [Google Scholar] [CrossRef] [PubMed]
- Wells, M.L.; Trainer, V.L.; Smayda, T.J.; Karlson, B.S.O.; Trick, C.G.; Kudela, R.M.; Ishikawa, A.; Bernard, S.; Wulff, A.; Anderson, D.M.; et al. Harmful algal blooms and climate change: Learning from the past and present to forecast the future. Harmful Algae 2015, 49, 68–93. [Google Scholar] [CrossRef]
- Pedreira-Conceição, L.; De Jesus-Affe, H.M.; Lopes da Silva, D.M.; De Castro-Nunes, J.M. Spatio-temporal variation of the phytoplankton community in a tropical estuarine gradient, under the influence of river damming. Reg. Stud. Mar. Sci. 2021, 43, 101642. [Google Scholar] [CrossRef]
- Barcelos e Ramos, J.; Schulz, K.G.; Voss, M.; Narciso, Á.; Müller, M.N.; Reis, F.V.; Cachão, M.; Azevedo, E.B. Nutrient-specific responses of a phytoplankton community: A case study of the North Atlantic Gyre, Azores. J. Plankton Res. 2017, 39, 744–761. [Google Scholar] [CrossRef]
- Poot-Delgado, C.A.; Okolodkov, Y.B. Microalgae as water quality indicators: An overview. In Aquatic Ecosystems Influences, Interactions and Impact on the Environment, 1st ed.; Snyder, M., Ed.; Nova Science Publishers, Inc.: Hauppauge, NY, USA, 2014; pp. 41–65. [Google Scholar]
- Jørgensen, B.B.; Richardson, K. (Eds.) Eutrophication in Coastal Marine Ecosystems, 1st ed.; American Geophysical Union. Coastal and Estuarine Studies 52: Washington, DC, USA, 1996; 273p. [Google Scholar]
- Sun, C.C.; Wang, Y.S.; Wu, M.L.; Dong, J.D.; Wang, Y.T.; Sun, F.L.; Zhang, Y.Y. Seasonal variation of water quality and phytoplankton response patterns in Daya Bay, China. Int. J. Environ. Res. Public Health 2011, 8, 2951–2966. [Google Scholar] [CrossRef]
- Comisión Nacional de Acuacultura y Pesca. Anuario Estadístico de Acuacultura y Pesca; Comisión Nacional de Acuacultura y Pesca: Mazatlán, México, 2018; 293p.
- Rivera-Arriaga, E.; Alpuche-Gual, L.; Negrete-Cardoso, M.; Nava-Fuentes, J.C.; Lemus-Pablo, E.; Arriaga-Zepeda, C. Programa de Manejo Costero Integrado para el Saneamiento de la Bahía de San Francisco de Campeche; Universidad Autónoma de Campeche: Campeche, México, 2012; 68p. [Google Scholar]
- García-Cuéllar, J.A.; Arreguín-Sánchez, F.; Vázquez, S.H.; Lluch-Cota, D.B. Impacto ecológico de la industria petrolera en la Sonda de Campeche, México, tras tres décadas de actividad: Una revisión. Interciencia 2004, 29, 311–319. [Google Scholar]
- Palacio-Aponte, A.; Silva-Casarín, R.; Bautista-Godínez, E.; Posada-Venegas, G.; Ruíz-Martínez, G. Atlas de Peligros Naturales a Nivel Ciudad, Campeche; Universidad Autónoma de Campeche: Campeche, México, 2006; 216p. [Google Scholar]
- Ramos-Miranda, J.; Flores-Hernández, D.; Ayala-Pérez, L.A.; Rendón-von Osten, J.; Villalobos-Zapata, G.; Sosa-López, A. Atlas Hidrológico e Ictiológico de la Laguna de Términos; Universidad Autónoma de Campeche: Campeche, México, 2006; 173p. [Google Scholar]
- Andersen, P.; Throndsen, J. Estimating cell numbers. In Manual on Harmful Marine Microalgae, Monographs on Oceanographic Methodology, No. 11, 1st ed.; Hallegraeff, G.M., Anderson, D.M., Cembella, A.D., Eds.; UNESCO Publishing: Place de Fontenoy, Paris, France, 2004; pp. 99–130. [Google Scholar]
- UNEP/IOC/IAEA; Standard Chemical Methods for Marine Environmental Monitoring. Reference Methods for Marine Pollution Studies 50. United Nations Environment Programme: Nairobi, Kenya, 1991; 50p.
- Utermöhl, H. Zur vervolkommung der quantitative. Phytoplankton-Methodik. Verh.-Int. Ver. Theor. Angew. Limnol. 1958, 9, 1–38. [Google Scholar]
- Schiller, J. Dinoflagellatae (Peridineae) In Dr. L. Rabenhorst’s Kryptogamen-Flora von Deutschland; Kolkwitz, R., Ed.; Österreich und der Schweiz, Teil 1. Akademische Verlagsgesellschaft, M.B.H.: Leipzig, Germany, 1933; 617p. [Google Scholar]
- Schiller, J. Dinoflagellatae (Peridineae) In Dr. L. Rabenhorst’s Kryptogamen-Flora von Deutschland; Kolkwitz, R., Ed.; Österreich und der Schweiz, Teil 2. Akademische Verlagsgesellschaft, M.B.H.: Leipzig, Germany, 1937; 590p. [Google Scholar]
- Cupp, E.E. Marine Plankton Diatoms of the West Coast of North America; University of California Press: Berkeley, CA, USA, 1943; 241p. [Google Scholar]
- Dodge, J.D. Marine Dinoflagellates of the British Isles; Her Majesty’s Stationery Office: London, England, UK, 1982; 146p. [Google Scholar]
- Komárek, J.; Anagnostidis, K. Modern approach to the classification system of cyanophytes (Croococcales). Arch. Hydrobiol. Suppl. 1986, 43, 157–226. [Google Scholar]
- Komárek, J.; Anagnostidis, K. Modern approach to the classification system of cyanophytes (Nostocales). Arch. Hydrobiol. Suppl. 1986, 56, 247–345. [Google Scholar]
- Garson, D. Testing Statistical Assumptions. Blue Book Series; Statistical Associates Publishing: Asheboro, NC, USA, 2012; 52p. [Google Scholar]
- Daniel, W.W. Bioestadística. Base para el Análisis de las Ciencias de la Salud; Edit. Limusa: México, México, 1993; 665p. [Google Scholar]
- Ter Braak, C.J.F. Canonical correspondence analysis: A new eigenvector technique for multivariate direct gradient analysis. Ecology 1986, 67, 1167–1179. [Google Scholar] [CrossRef]
- Comisión Nacional del Agua. Ley Federal de Derechos. Disposiciones Aplicables en Materia de Aguas Nacionales 2016; Secretaría de Medio Ambiente y Recursos Naturales: Ciudad de México, México, 2016; 173p.
- Álvarez-Góngora, C.; Herrera-Silveira, J.A. Variations of phytoplankton community structure related to water quality trends in a tropical karstic coastal zone. Mar. Pollut. Bull. 2006, 52, 48–60. [Google Scholar] [CrossRef] [PubMed]
- Troccoli Ghinaglia, L.; Herrera-Silveira, J.A.; Comín, F.A. Structural variations of phytoplankton in the coastal seas of Yucatan, Mexico. Hidrobiologia 2004, 519, 85–102. [Google Scholar] [CrossRef]
- Herrera-Silveira, J.A.; Aranda-Cirerol, N.; Troccoli Ghinaglia, L.; Comín, F.A.; Madden, C. Coastal eutrophication in the Yucatán Peninsula. In Environmental Analysis in the Gulf of Mexico, Harte Research Institute for Gulf of Mexico Studies Special Publication Series No. 1; Caso, M., Pisanty, I., Ezcurra, E., Eds.; SEMARNAT, Instituto de Ecología, AC: México, DF, Mexico; Harte Research Institute for Gulf of Mexico Studies, Texas A&M University: Corpus Christi, TX, USA, 2009; pp. 512–532. [Google Scholar]
- Poot-Delgado, C.A.; Rosado-García, P.I.; Guzmán-Noz, Y.A. Fitoplancton marino potencialmente nocivo en las aguas costeras de Campeche. In Golfo de México. Contaminación e Impacto Ambiental: Diagnóstico y Tendencias, 3rd ed.; Botello, A.V., Rendón-vonOsten, J., Benítez, J.A., Gold-Bouchot, G., Eds.; UAC, UNAM-ICMyL, CINVESTAV-Unidad Mérida: Campeche, México, 2014; pp. 117–132. [Google Scholar]
- Poot-Delgado, C.A.; Rendón-von Osten, J.; Okolodkov, Y.B.; Lara-Flores, M. Water quality assessment in the coastal zone of Campeche, southeastern Gulf of Mexico. Cymbella 2021, 7, 79–99. [Google Scholar]
- Poot-Delgado, C.A.; Okolodkov, Y.B.; Rendón-von Osten, J. Spatio-temporal variation of harmful planktonic microalgae and cyanobacteria along the central coast of Campeche, southeastern Gulf of Mexico. Bull. Environ. Contam. Toxicol. 2022, 108, 15–23. [Google Scholar] [CrossRef] [PubMed]
- De la Lanza, G.; Gómez, S. Fisicoquímica del agua y cosecha del fitoplancton en una laguna costera tropical. CIENCIA Ergo-Sum 1999, 6, 147–153. [Google Scholar]
- Ortiz-Lozano, L.; Granados-Barba, A.; Solís-Weiss, V.; García-Salgado, M.A. Environmental evaluation and development problems of the Mexican Coastal Zone. Ocean Coast. Manag. 2005, 48, 161–176. [Google Scholar] [CrossRef]
- Alpuche-Gual, L. Clasificación de Playas Campechanas para Su Manejo Integral y Desarrollo Sostenible; Universidad Autónoma de Campeche: Campeche, México, 2014; 156p. [Google Scholar]
- Poot-Delgado, C.A.; Okolodkov, Y.B. Bloom of Cylindrotheca closterium originating from shrimp farming discharges in the SE Gulf of Mexico. Harmful Algae News 2020, 66, 10. [Google Scholar] [CrossRef]
- Glibert, P.M. Eutrophication, harmful algae and biodiversity—Challenging paradigms in a world of complex nutrient changes. Mar. Pollut. Bull. 2017, 124, 591–606. [Google Scholar] [CrossRef]
- Parker, M.S.; Armbrust, E.V. Synergistic effects of light, temperature and nitrogen source on transcription of genes for carbon and nitrogen metabolism in the centric diatom Thalassiosira pseudonana (Bacillariophyceae). J. Phycol. 2005, 41, 1142–1153. [Google Scholar] [CrossRef]
- Glibert, P.M. Margalef revisited: A new phytoplankton mandala incorporating twelve dimensions, including nutritional physiology. Harmful Algae 2016, 55, 25–30. [Google Scholar] [CrossRef]
- Choudhury, A.K.; Bhadury, P. Relationship between N:P:Si ratio and phytoplankton community composition in a tropical estuarine mangrove ecosystem. Biogeosciences 2015, 12, 2307–2355. [Google Scholar] [CrossRef]
- Chakraborty, S.; Lohrenz, S.E. Phytoplankton community structure in the river-influenced continental margin of the northern Gulf of Mexico. Mar. Ecol. Prog. Ser. 2015, 521, 31–47. [Google Scholar] [CrossRef]
- Parsons, M.L.; Brandt, A.L.; Turner, R.E.; Morrison, W.L.; Rabalais, N.N. Characterization of common phytoplankton on the Louisiana shelf. Mar. Pollut. Bull. 2021, 168, 112458. [Google Scholar] [CrossRef] [PubMed]
- Bonachela, J.A.; Raghib, M.; Levin, S.A. Dynamic model of flexible phytoplankton nutrient uptake. Proc. Natl. Acad. Sci. USA 2011, 108, 20633–20638. [Google Scholar] [CrossRef]
- Hernández-Becerril, D.U.; Flores, C. Species of the diatom genus Chaetoceros (Bacillariophyceae) in the plankton from the southern Gulf of Mexico. Bot. Mar. 1998, 41, 505–519. [Google Scholar] [CrossRef]
- Licea, S.; Zamudio, M.E.; Luna, R.; Soto, J. Free-living dinoflagellates in the southern Gulf of Mexico: Report of data (1979–2002). Phycol. Res. 2004, 52, 419–428. [Google Scholar] [CrossRef]
- Hernández-Becerril, D.U.; García-Reséndiz, J.A.; Salas-de León, D.A.; Monreal-Gómez, M.A.; Signoret-Poillon, M.; Aldeco-Ramírez, J. Nanoplankton fraction in the phytoplankton structure in the southern Gulf of Mexico (April 2000). Cienc. Mar. 2008, 34, 77–90. [Google Scholar] [CrossRef]
- Balech, E. Dinoflagelados nuevos o interesantes del Golfo de México y Caribe. Rev. Mus. Argent. Cienc. Nat. Bernardino Rivadavia Hidrobiol. 1967, 2, 77–144. [Google Scholar]
- Saunders, R.P.; Glenn, D.A. Diatoms. Mem. Hourglass Cruises 1969, 1, 1–119. [Google Scholar]
- Norris, D.R.; Berner, L.D.J. Thecal morphology of selected species of Dinophysis (Dinoflagellata) from the Gulf of Mexico. Contrib. Mar. Sci. Univ. Texas 1970, 15, 146–192. [Google Scholar]
- Steidinger, K.A.; Williams, J. Dinoflagellates. Mem. Hourglass Cruises 1970, 2, 1–251. [Google Scholar]
- Poot-Delgado, C.A. Florecimientos algales nocivos en las costas de Campeche, golfo de México. Investig. Cienc. 2016, 67, 91–96. [Google Scholar] [CrossRef]
- Poot-Delgado, C.A.; Okolodkov, Y.B.; Núñez-Vázquez, E.J.; Tafoya del Angel, F.; Rendón-von Osten, J. Current status of the study of harmful algal blooms along the coast of Campeche, SE Gulf of Mexico. In Proceedings of the Abstracts of the 19th International Conference of Harmful Algae, La Paz, Baja California Sur, Mexico, 10–15 October 2021; p. 412. [Google Scholar]
- Wiśniewska, K.; Lewandowska, A.U.; Śliwińska-Wilczewska, S. The importance of cyanobacteria and microalgae present in aerosols to human health and the environment—Review study. Environ. Int. 2019, 131, 104964. [Google Scholar] [CrossRef] [PubMed]
- Poot-Delgado, C.A.; Okolodkov, Y.B.; Aké-Castillo, J.A.; Rendón-von Osten, J. Potentially harmful cyanobacteria in oyster banks of Términos lagoon, southeastern Gulf of Mexico. Acta Biol. Colomb. 2018, 23, 51–58. [Google Scholar] [CrossRef]
- Kuuppo, P.; Uronen, P.; Petermann, A.; Tamminen, T.; Granéli, E. Pectenotoxin-2 and dinophysistoxin-1 in suspended and sedimenting organic matter in the Baltic Sea. Limnol. Oceanogr. 2006, 51, 2300–2307. [Google Scholar] [CrossRef]
- Nixon, S.W. Eutrophication and the macroscope. Hydrobiologia 2009, 629, 5–19. [Google Scholar] [CrossRef]
- Pinckney, J.L.; Paerl, H.W.; Harrington, M.B.; Howe, K.E. Annual cycles of phytoplankton community-structure and bloom dynamics in the Neuse River Estuary, North Carolina. Mar. Biol. 1998, 131, 371–381. [Google Scholar] [CrossRef]


| Season | Physical–Chemical Variables | ||||
|---|---|---|---|---|---|
| T °C | Salinity | pH | DO (mg L−1) | DO% | |
| Rainy | 31.10–36.50 | 28.60–36.00 | 8.10–8.50 | 4.86–11.99 | 66.70–175.50 |
| 32.77 ± 1.85 | 31.98 ± 2.97 | 8.36 ± 0.16 | 7.73 ± 2.28 | 108.46 ± 35.17 | |
| Dry | 30.80–31.90 | 29.01–35.39 | 7.50–8.27 | 4.70–7.99 | 64.00–111.10 |
| 31.54 ± 0.44 | 32.79 ± 2.59 | 7.88 ± 0.28 | 6.42 ± 1.32 | 89.66 ± 19.05 | |
| Windy | 23.70–26.10 | 15.89–32.97 | 7.52–8.30 | 6.59–15.08 | 78.90–182.50 |
| 24.94 ± 0.84 | 22.56 ± 5.26 | 7.99 ± 0.24 | 11.63 ± 3.51 | 140.50 ± 43.23 | |
| Differences between seasons | F = 88.41 p < 0.005 | F = 15.70 p < 0.005 | F = 8.08 p < 0.005 | F = 8.00 p < 0.005 | F = 4.00 p < 0.005 |
| * Upper limits established for marine coastal waters | ±1.5 of natural conditions reported previously | >5 to >10 | >5 mg L−1 | ||
| Season | Inorganic Nutrients (mg L−1) | ||||
| Nitrite | Nitrate | Ammonium | Phosphate | Silicate | |
| Rainy | 0.38–3.24 | 9.76–51.00 | 5.06–29.58 | 14.86–57.44 | 1.60–9.70 |
| 0.99 ± 1.01 | 35.70 ± 17.56 | 10.54 ± 8.57 | 36.10 ± 13.93 | 5.21 ± 3.46 | |
| Dry | 0.23–3.51 | 0.54–56.07 | 0.05–3.14 | 1.39–2.56 | 0.80–8.50 |
| 2.11 ± 1.03 | 21.17 ± 20.56 | 1.72 ± 1.21 | 1.84 ± 0.42 | 4.49 ± 2.99 | |
| Windy | 0.81–1.03 | 1.53–7.14 | 4.32–8.86 | 12.96–67.63 | 1.50–10.70 |
| 0.93 ± 0.07 | 4.34 ± 1.83 | 6.24 ± 1.43 | 29.90 ± 20.69 | 4.70 ± 3.56 | |
| Differences between seasons | F = 4.45 p < 0.005 | F = 7.04 p < 0.005 | F = 5.31 p < 0.005 | F = 11.25 p < 0.005 | F = 0.09 p > 0.005 |
| * Upper limits established for marine coastal waters | 0.002 | 0.04 | 0.01 | 5 | |
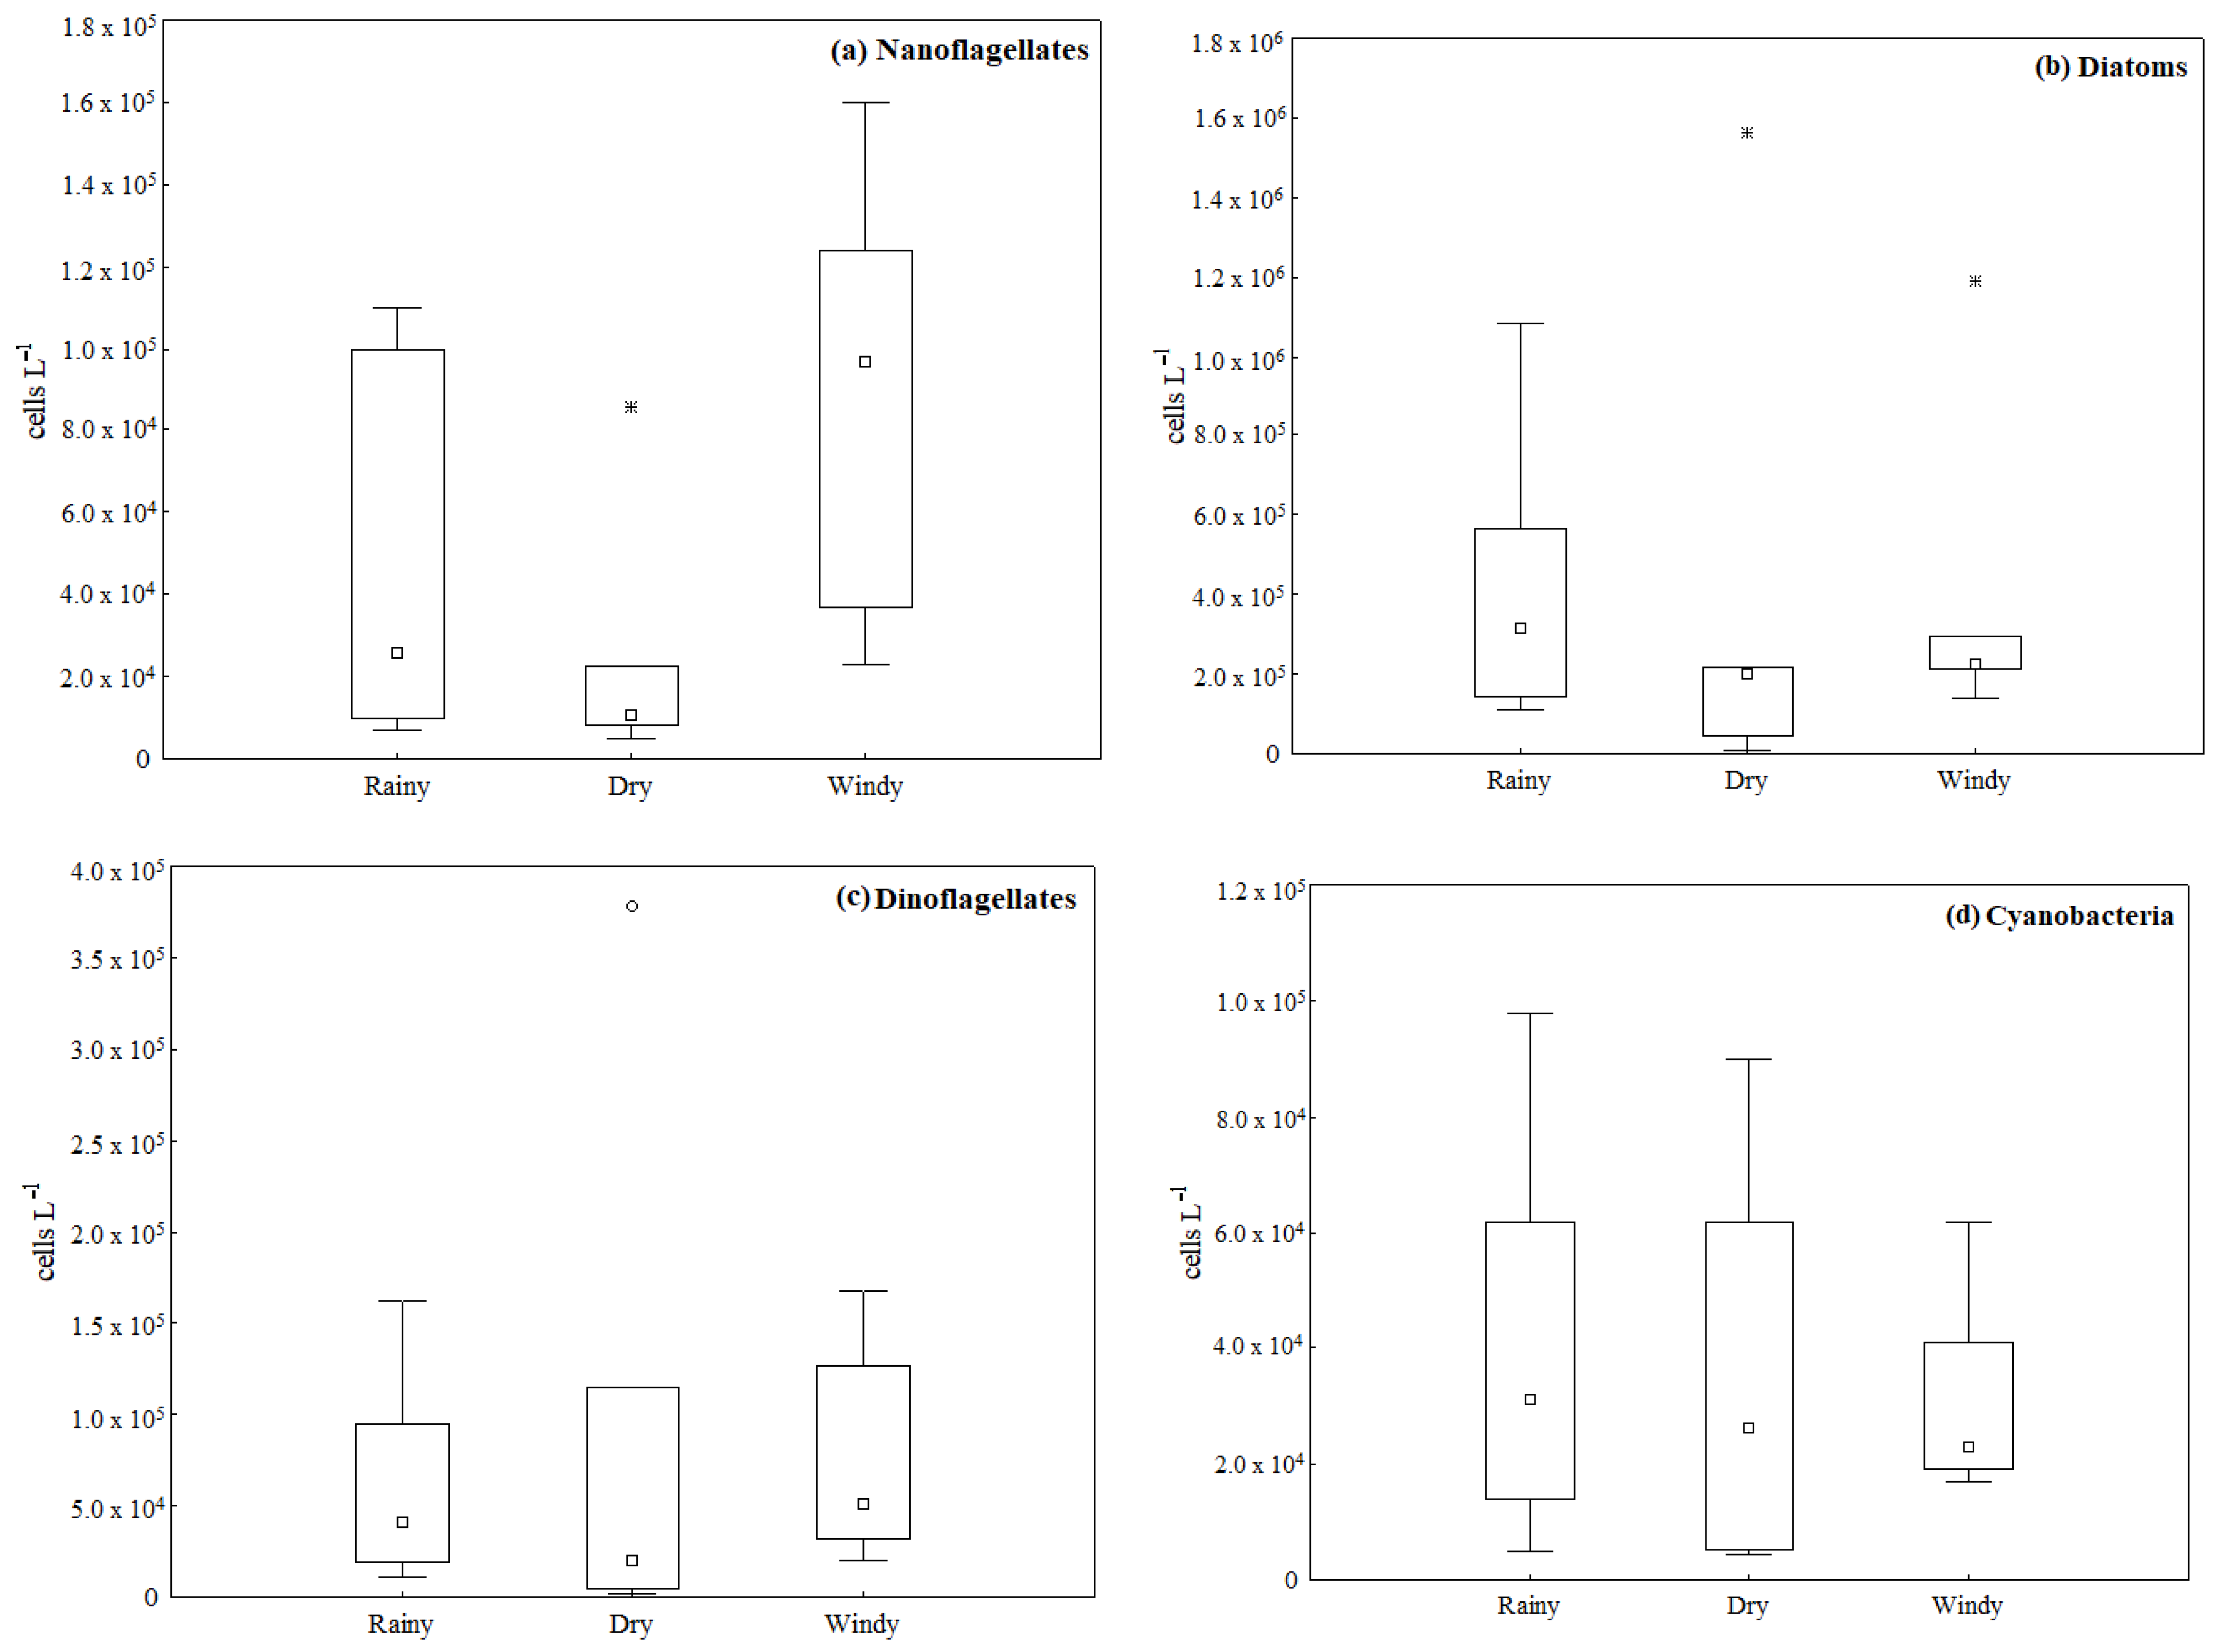
| Season | Nanoflagellates | Diatoms | Dinoflagellates | Cyanobacteria |
|---|---|---|---|---|
| Rainy | 7.0 × 10³ − 1.1 × 10⁵ | 1.1 × 10⁵ − 1.0 × 10⁶ | 1.1 × 10⁴ − 1.6 × 10⁵ | 5.0 × 10³ − 9.8 × 10⁴ |
| 4.3 × 10⁴ ± 4.3 × 10⁴ | 4.1 × 10⁵ ± 3.4 × 10⁵ | 5.8 × 10⁴ ± 5.4 × 10⁴ | 4.0 × 10⁴ ± 3.1 × 10⁴ | |
| Dry | 5.0 × 10³ − 8.6 × 10⁴ | 6.3 × 10³ − 1.5 × 10⁶ | 1.4 × 10³ − 3.7 × 10⁵ | 4.4 × 10³ − 9.0 × 10⁴ |
| 2.2 × 10⁴ ± 2.8 × 10⁴ | 3.3 × 10⁵ ± 5.4 × 10⁵ | 8.0 × 10⁴ ± 1.3 × 10⁵ | 3.6 × 10⁴ ± 3.3 × 10⁴ | |
| Windy | 2.3 × 10⁴ − 1.6 × 10⁵ | 1.3 × 10⁵ − 1.1 × 10⁶ | 2.0 × 10⁴ − 1.6 × 10⁵ | 1.7 × 10⁴ − 6.2 × 10⁴ |
| 8.9 × 10⁴ ± 4.7 × 10⁴ | 3.6 × 10⁵ ± 3.6 × 10⁵ | 7.4 × 10⁴ ± 5.3 × 10⁴ | 3.1 × 10⁴ ± 1.6 × 10⁴ | |
| Differences between seasons | F = 4.92, p < 0.005 | F = 0.06, p > 0.005 | F = 0.11, p > 0.005 | F = 0.18, p > 0.005 |
Disclaimer/Publisher’s Note: The statements, opinions and data contained in all publications are solely those of the individual author(s) and contributor(s) and not of MDPI and/or the editor(s). MDPI and/or the editor(s) disclaim responsibility for any injury to people or property resulting from any ideas, methods, instructions or products referred to in the content. |
© 2023 by the authors. Licensee MDPI, Basel, Switzerland. This article is an open access article distributed under the terms and conditions of the Creative Commons Attribution (CC BY) license (https://creativecommons.org/licenses/by/4.0/).
Share and Cite
Gómez-Figueroa, J.A.; Rendón-von Osten, J.; Poot-Delgado, C.A.; Dzul-Caamal, R.; Okolodkov, Y.B. Seasonal Response of Major Phytoplankton Groups to Environmental Variables along the Campeche Coast, Southern Gulf of Mexico. Phycology 2023, 3, 270-279. https://doi.org/10.3390/phycology3020017
Gómez-Figueroa JA, Rendón-von Osten J, Poot-Delgado CA, Dzul-Caamal R, Okolodkov YB. Seasonal Response of Major Phytoplankton Groups to Environmental Variables along the Campeche Coast, Southern Gulf of Mexico. Phycology. 2023; 3(2):270-279. https://doi.org/10.3390/phycology3020017
Chicago/Turabian StyleGómez-Figueroa, Juan Alfredo, Jaime Rendón-von Osten, Carlos Antonio Poot-Delgado, Ricardo Dzul-Caamal, and Yuri B. Okolodkov. 2023. "Seasonal Response of Major Phytoplankton Groups to Environmental Variables along the Campeche Coast, Southern Gulf of Mexico" Phycology 3, no. 2: 270-279. https://doi.org/10.3390/phycology3020017