

Metabolome of Cadmium Stressed Gracilaria caudata (Rhodophyta)

1
Laboratory of Algal Biochemistry and Molecular Biology, Department of Biochemistry, Institute of Chemistry, University of São Paulo, Av. Prof. Lineu Prestes, 748, São Paulo 05508-000, SP, Brazil
2
Group of Ecology, Evolution and Bevaviour, Department of Biological Sciences, College of Letters and Science, University of Wisconsin-Milwaukee, 3209 N Maryland Ave, Milwaukee, WI 53211, USA
*
Author to whom correspondence should be addressed.
Phycology 2023, 3(2), 255-269; https://doi.org/10.3390/phycology3020016
Submission received: 6 February 2023
/
Revised: 29 March 2023
/
Accepted: 1 April 2023
/
Published: 26 April 2023
(This article belongs to the Special Issue Role of Algae in Bioremediation of Heavy Metals)
Abstract
:We report here the effects of cadmium on the metabolome of the macroalga Gracilaria caudata. The IC50 of 3 mg/L (12 µM) was obtained after 48 hrs exposure and induced lower photosynthesis efficiency. Threshold concentrations determined by the Brazilian Environmental Council (CONAMA) in marine waters (0.04 mg/L) and effluent discharge (0.2 mg/L) were also tested, and the latter changed photosynthetic efficiency similarly to IC50. A total of 43 metabolites were identified, including monosaccharides, carboxylic acids, and amino acids. By an unsupervised PCA, we identified significative alterations in the metabolome by the IC50. An OPLS-DA analysis showed that Cd2+ exposure caused the variation of 20 metabolites, mainly glyoxylate-related, ascorbate, floridoside and proline. Five metabolic pathways altered by Cd2+ showed an accumulation of amino acids, carbon metabolism intermediates and antioxidant responses to Cd2+. We recommend a review of the toxicity parameters and methods that guide environmental policies on cadmium levels in Brazilian marine waters.
1. Introduction
The trophic chain and diversity in coastal environments are highly dependent on the pivotal role of the macroalgae [1]. Macroalgae are important for oxygen and organic matter production and nutrient cycling [2]; they also provide shelter for several other organisms, supporting 50% of the world fishing market [3]. Frequently impacted in urbanized coastal areas [4], seaweeds are mainly vulnerable for their high capacity of pollutant uptake pollutants, which characterizes them as beginners in the biomagnification [5,6,7,8].
Metals are the most studied class of pollutants due to their widespread distribution and their high potential to cause chronic and irreversible damage to the environment [9,10]. Cadmium (Cd) is a non-essential metal, naturally distributed and ubiquitous in human activities. Cadmium is resistant to biodegradation, accumulating along the food chain and being a chronic source of contamination [11], and it can decrease photosynthesis rate by inhibiting CO2 fixation in green microalgae [12].
Seaweeds are capable of chelating non-essential metals through phytochelatins, but it can be insufficient, leading to increased concentration of reactive oxygen species (ROS) in the cell [13,14,15,16], decreased cellular antioxidant ability and decreased enzyme activity due to competitive inhibition with essential metals [17]. Primary metabolites affected under stress conditions are amino acids, sugars, oxylipids, unsaturated fatty acids, polyamines, organic acids and phenolic compounds [3]. Metabolomics can directly evaluate these molecules allowing a precise characterization of cellular biochemical activity and its correlation with genetic and/or environmental changes [18]. It is a momentary and sensible profile of cellular regulatory events responding to immediate external conditions [3], thus constituting an important approach to environmental studies [18,19].
Despite the ecological importance of marine macroalgae, the use of metabolomics to characterize the response to pollutants is still unexplored [3]. Tracing several metabolites under stressful conditions can reveal new biomarkers and new biochemical pathways specific to macroalgae response to a highly dynamic environment. There is still a lot to discover about the physiology and metabolism of these organisms under stress and their interactions with environmental conditions. The aim of this research was to evaluate the metabolic profile and photosynthetic performance of the macroalga Gracilaria caudata when exposed to Cd2+. This species was selected mainly due to its wide distribution among the Brazilian coast, representing a potential target for locus research countrywide.
2. Materials and Methods
2.1. Seaweed Cultivation and Toxicologic Essays Set-Up
The red alga Gracilaria caudata (J.Agardh) Gurgel, J.N.Norris & Fredericq was obtained from the culture collection of algae, cyanobacteria and fungi at the Institute of Botany (CCIBt), Secretary of Infrastructure and Environment of São Paulo State, Brazil. The cultures were grown in natural seawater provided by the Marine Biology Center of São Paulo University. It was sterilized by pasteurization and filtration (0.45 µm) and maintained at 25 °C, pH 8 ± 0.3 and salinity 32 ± 1. The culture medium was enriched with Von Stosch media and exposed to a light cycle of 14:10 (70 µmol/m2/s–LED lights) under constant aeration by orbital shaking at 150 RPM [20]. Each sample contained 30 mg of 2 cm algal apexes in 100 mL Erlenmeyer flasks filled up to 75 mL. The Cd2+ salt [3(CdSO4·8H2O)] (MERK) was used as a metal solution. The effect of cadmium on the growth rate, photosynthesis, and metabolism of the macroalgae was evaluated under 3 Cd2+ concentrations: the IC50 (3 mg/L) and two concentrations licensed by the CONAMA (Brazilian National Environment Council) for marine waters (0.04 mg/L) and for effluent discharge (0.2 mg/L) [21].
2.2. Determination of IC50
The growth rate of the macroalga G. caudata was measured by Daily Growth Rate (DGR), which was used to plot the dose–response curve and determine the IC50 after 7 days of exposure [22]. G. caudata was exposed to increasing concentrations of Cd (0 to 13 mg/L) with 5 replicates per treatment group. All data were assessed for normal distribution using Shapiro–Wilk statistical test to compare the obtained data and validated by the null test using Graph Prisma and R! software [23,24]. The Hill model was used to calculate the IC50 and ANOVA to determine the minimal exposure time.
2.3. Photosynthetic Performance
The photosynthetic performance of G. caudata was estimated through photosystem II chlorophyll fluorescence measured with the amplitude-modulated pulse fluorometer (PAM 2500, Walz, Effeltrich, Germany), as previously described [25]. Fast light curves were made in each replicate, and the parameters Fv/Fm, alpha, and maximum electron transfer rate (ETRmax) were obtained through the model described by T. Platt [26]. All results were compared in the one-way ANOVA statistical test using the Tukey test to compare groups of different concentrations in Graph Prisma. Five replicates per treatment group were used in this analysis.
2.4. Metabolomics
2.4.1. Sample Preprocessing
Seven replicates per experimental group were used. The biomass preprocessing was made by a polar and semi-polar metabolite extraction developed for the macroalgae [27,28]. The biomass was immediately frozen in liquid nitrogen (quenching), pulverized using a ball mixer mill (Retsch) for 1 min at 30 Hz, and macerated with 1 mL of methyl tert-butyl ether (MTBE) and methanol (MeOH) at 3:1 ratio (−20 °C). As an internal standard, 10 μL of the 10 μg/mL Ribitol standard (Sigma-Aldrich, St. Louis, MO, USA) was added to each sample and maintained in agitation (300 RPM) for 45 min at 4 °C. After 15 min of sonication; was added 650 μL of H2O:MeOH (4 °C at 3:1 ratio) and vortexed for 1 min. Then the samples were centrifuged at 20,000× g at 4 °C for 5 min (5340R, Eppendorf, Hamburg, Germany). The inferior phase of each sample was collected and dried using a speed-vac (Thermo Fischer, Waltham, MA, USA) at 25 °C. For normalization, the dried biomass weight of each remaining pellet was used.
Before the injection in the GC-MS, all samples were derivatized by silylation with N-Methyl-N-(trimethylsilyl) trifluoroacetamide (MSTFA) [29]. The extracted and dried samples were resuspended in 95 μL of methoxyamine hydrochloride/pyridine—MOX (0.25 mg/L) and incubated for 30 min at 60 °C in a thermal block, followed by the addition of 95 μL of MSTFA:pyridine (45:50) and incubated again for the same time and temperature. 10 μL of methyltridecanoate (MTD) in pyridine (573 µM) was added to the sample, and 200 μL of this solution was transferred to vials with inserts to be injected and analyzed by GC-MS.
2.4.2. GC-MS
The metabolic profile of G. caudata exposed to Cd2+ was evaluated by relative quantification using gas chromatography coupled with mass spectrometry (GC-MS). The chromatographic parameters followed the same protocol used for the derivatization method [29]. Two microliters were injected in a chromatograph (QP2010 Plus, Shimadzu, Inc., Kyoto, Japan) with the capillary column ZB-5MS (30 m × 250 μm internal diameter × 0.25 μm film thickness, Phenomenex, Torrance, CA, USA) coupled to a quadrupole mass spectrometer equipped with a source of electron impact ionization (EI) operating at 70 eV and 300 °C. The injection mode used was the spitless pulse (1.8 bars for 1 min) with the injector at 260 °C. The carrier gas used in the chromatograph was helium at a flow rate of 1 mL/min. The interface and quadrupole of the two devices were operated at 250 °C. For a more exploratory analysis, the mass spectrometer was operated in full scan mode for the range of components with a mass between 50–800 amu.
2.4.3. Metabolite Identification
The metabolites were first identified by the fragmentation pattern of each component obtained in the mass spectrometer; this process was made using the software AMDIS (Automated Spectral Mass Identification and Deconvolution System). AMDIS was used for peak deconvolution and alignment and putative identification (similarity index–SI > 75%) by the mass spectral library NIST 08 (National Institute of Standards and Technology). All identifications were confirmed by Kovats retention index (RI) regarding the Retention Time (RT) in the chromatographic column as a verification step to assure identifications are less restrictive made by AMDIS. The RI was manually calculated for each target suggested by AMDIS based on the RT obtained from the alkane standard (C9 to C30) analyzed under the same chromatographic conditions. The targets had their RI checked on ChemSpider and NIST Chemistry WebBook. In summary, the metabolites were only considered identified when the RI of a target suggested by AMIDS (using the fragmentation pattern) was similar to the RI calculated from the respective RT obtained from the gas chromatography.
2.4.4. Statistical Analyses
For a Gaussian distribution, a cubic root transformation and Pareto scaling were applied to the metabolomic data. To compare the treated groups, it was used unsupervised (Principal Component Analysis–PCA) and supervised (Orthogonal Projections to Latent Structures Discriminant Analysis–OPLS-DA) multivariate statistical analysis and a pathway analysis through MetaboAnalyst [30]. PCA compared the metabolic profile registered for all treatment groups in a more general analysis of Cd2+ exposure. OPLS-DA was applied to point out the pairwise differences between each Cd2+ treatment group and the control, listing target metabolites. For group separation, it was used a correlation limit of >|0.05| and a covariance of >|0.5| [31,32].
In the pathway analysis, through MetaboAnalyst, the reference organism used in the analysis was Chondrus crispus. The Globaltest algorithm and degree of centrality were used to measure the number of connections of each node [32]. This type of analysis provides the significance of the change (p < 0.05) and the pathway impact (significant > 0.1) relative to the relevance of the alteration in the representativeness of the metabolite on the pathway [28,32].
3. Results
3.1. Growth Rate Analysis
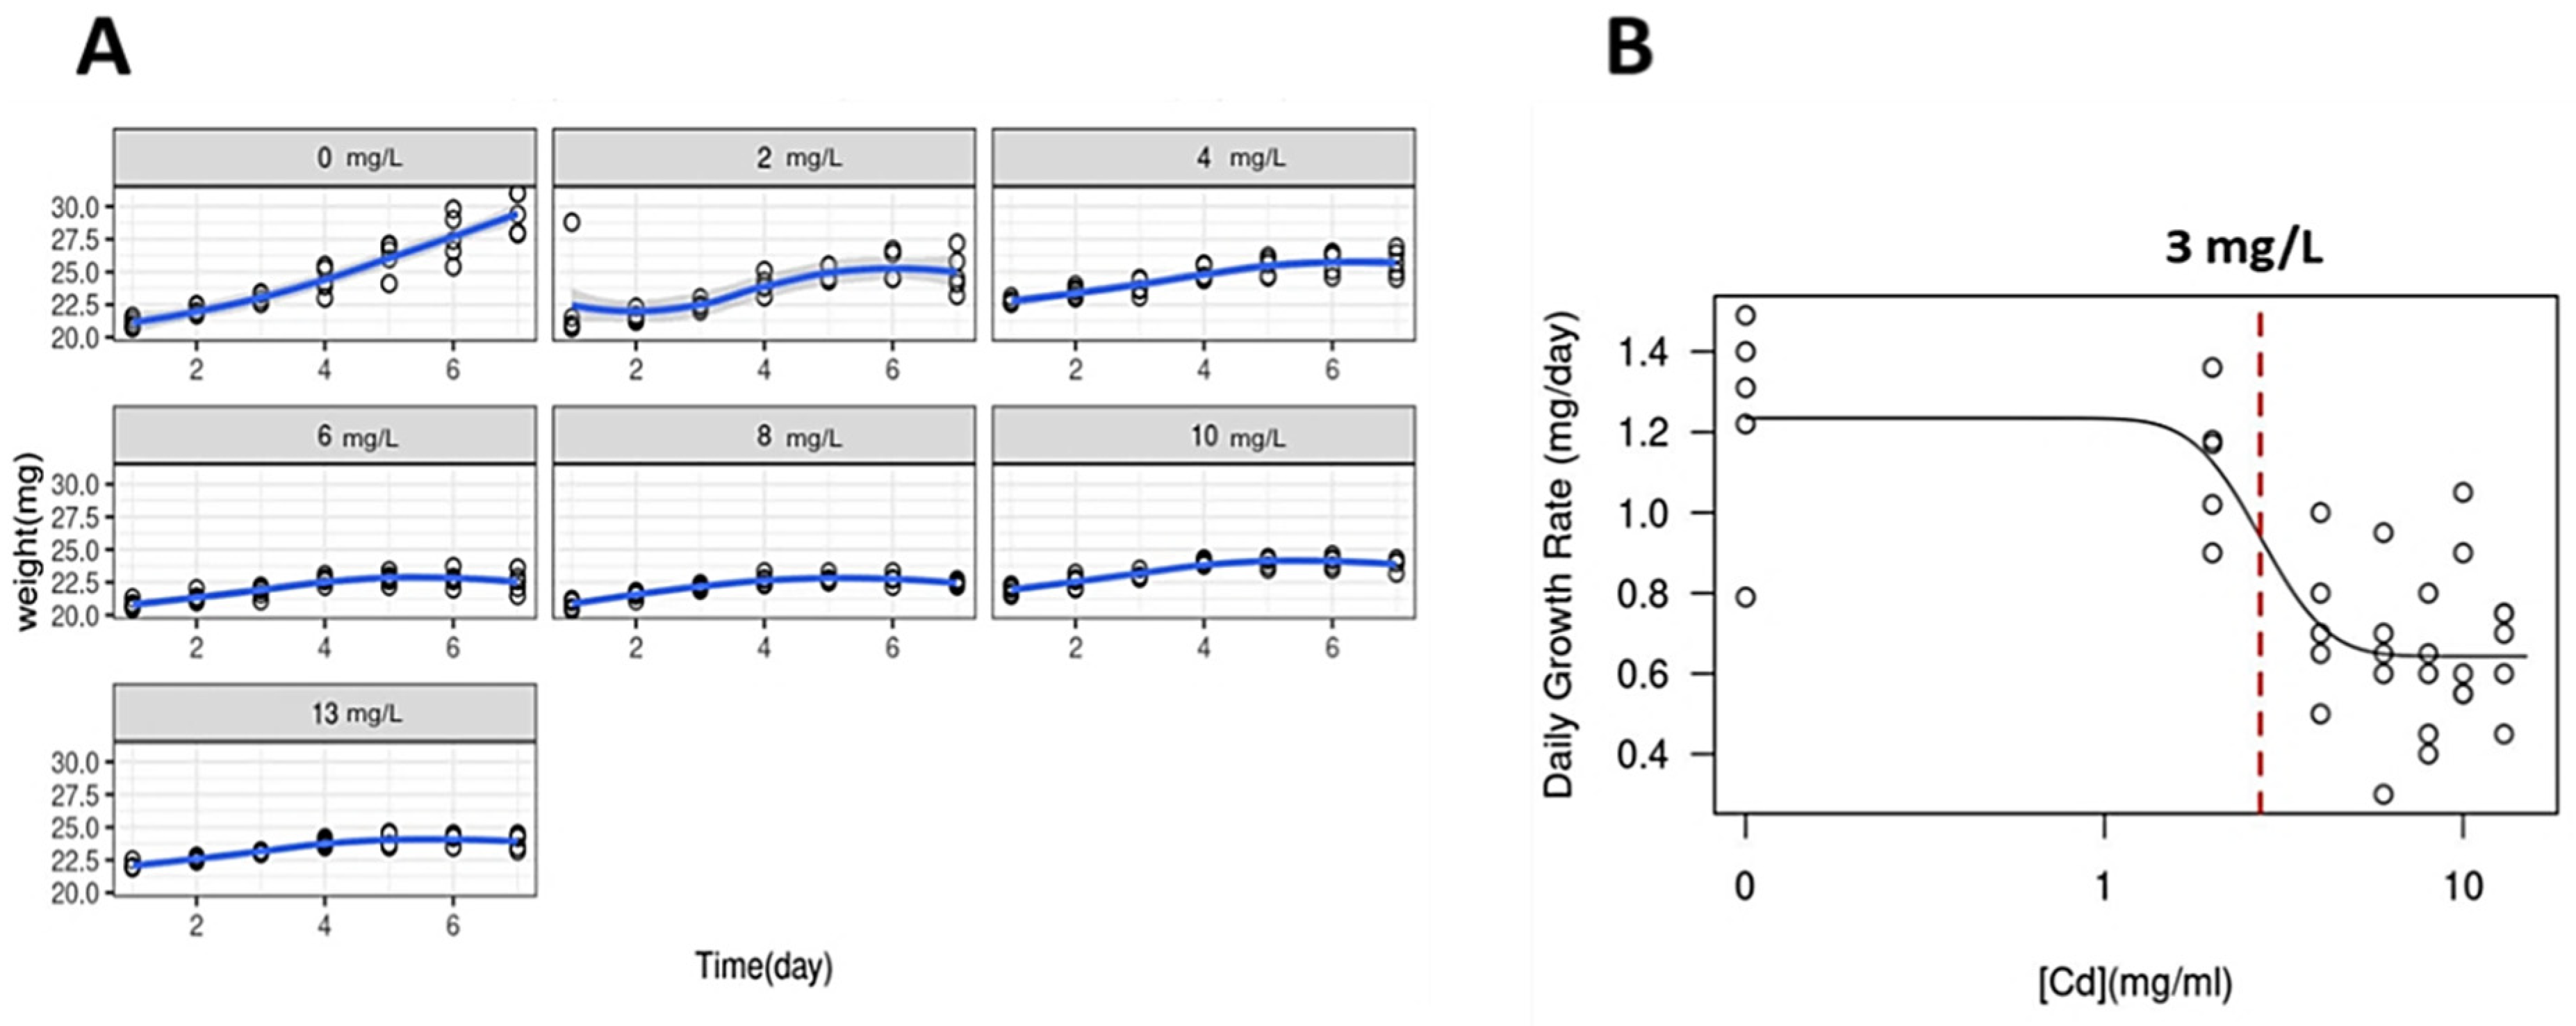
The IC50 of Cd2+ for the red macroalga G. caudata was 3 mg/L (12 μM) obtained after 48 h of exposure (Figure 1); therefore, this time was settled for all the next toxicological essays.
3.2. Cd2+ Exposure Affects Photosynthetic Performance
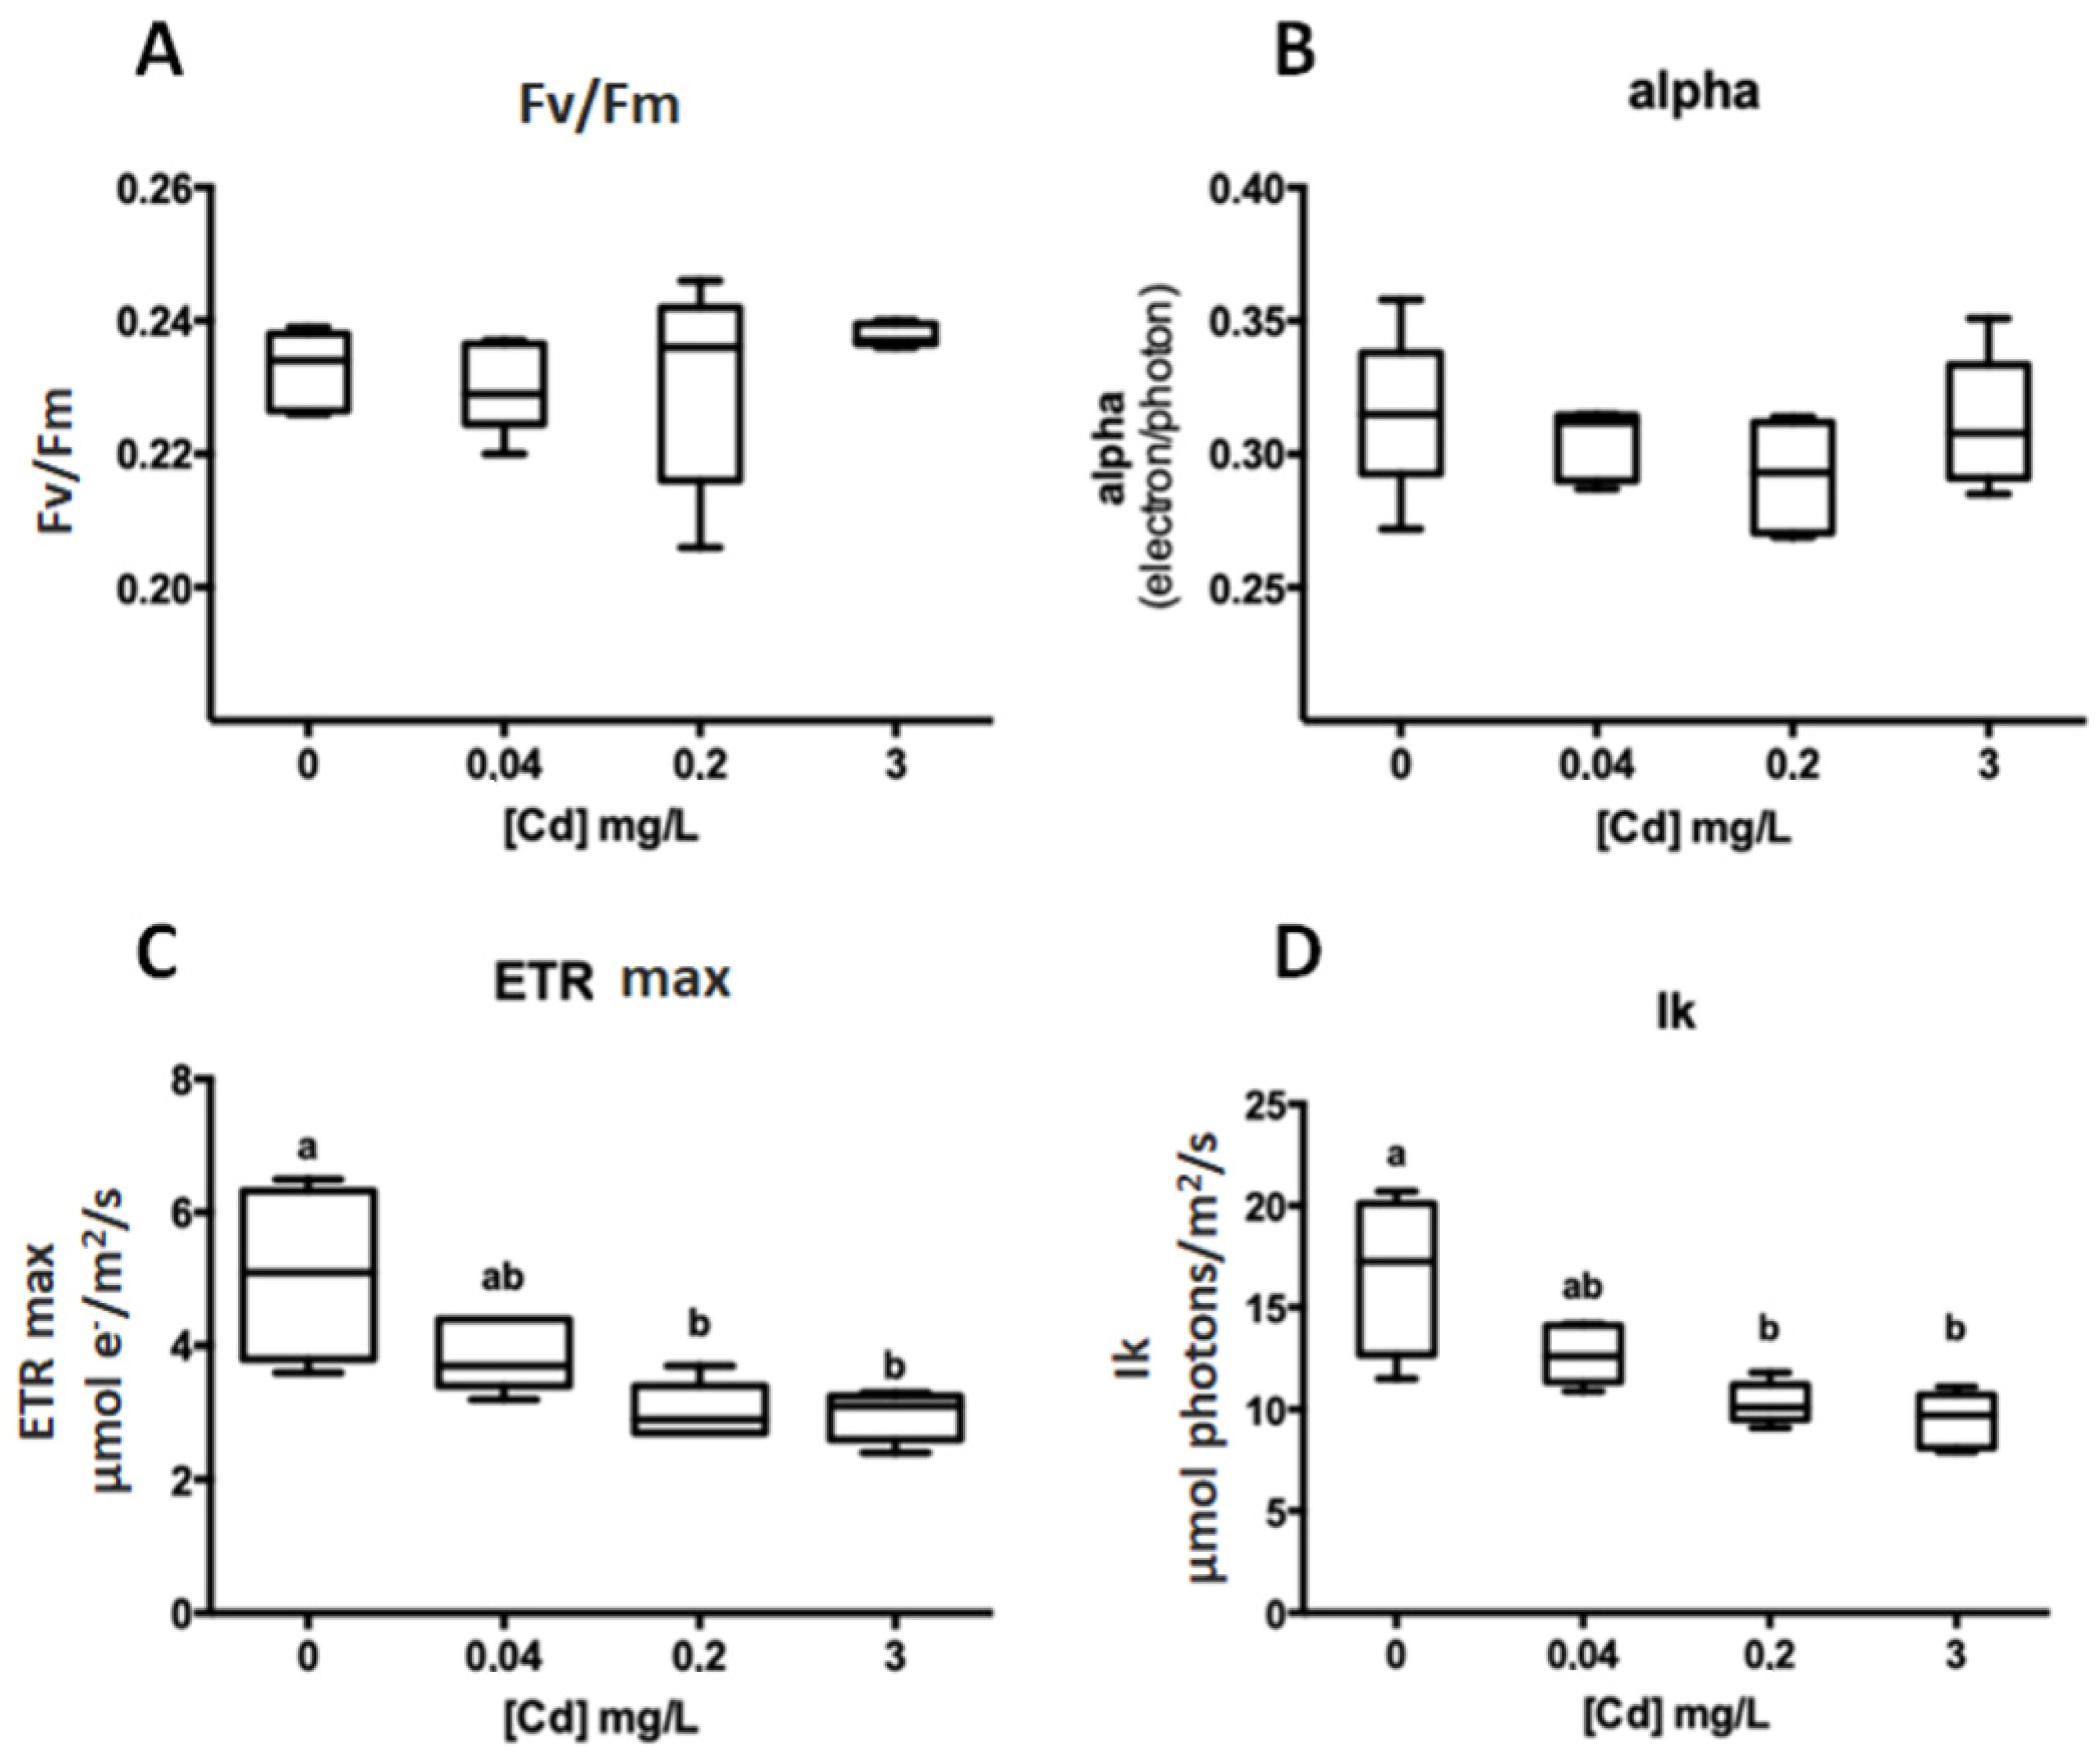
Beyond the exposure of G. caudata to 3 mg/L Cd2+ (IC50) over 48 h, two other metal concentrations were tested based on the guidelines of the Brazilian Environmental Council (CONAMA) for marine water (0.04 mg/L) and effluent discharge (0.2 mg/L) [21] with the same exposure time. After exposure to 0 (control), 0.04, 0.2 and 3 mg/L Cd2+, the ETRmax and IK were significantly altered under 0.2 and 3 mg/L, but at 0.04 mg/L, there was no significant change (Figure 2).
The photosynthetic performance was negatively affected by the presence of the Cd2+ in culture, causing a lower ETRmax and IK compared to the control. The concentration of 0.2 mg/L Cd2+ affected these parameters in the same proportions as the 3 mg/L, even being 15-fold less concentrated, which highlights the higher sensitivity of the chlorophyll fluorescence as a methodology to evaluate toxicity.
3.3. Metabolites Identified by GC-MS
A total of 50 metabolites were identified by AMDIS considering all Cd2+ exposure groups; however, through manual curation based on the Kovats index, 43 metabolites were filtered (Table S1). These metabolites are monosaccharides, carboxylic acids, and amino acids and were all present in the experimental group with the highest Cd2+ concentration (3 mg/L).
3.4. Cd2+ Affects Metabolic Profile in G. caudata
The variance observed by the PCA between the Cd2+ exposure groups was 50.5% (PC1: 29.9% and PC2: 20.65) (Figure 3). The complete separation of the metabolic profile between the Cd2+ exposure groups was observed only for the 3 mg/L compared to others. Comparing the control group with the lowest tested metal concentrations (0.04 and 0.2 mg/L), it was possible to notice occasional metabolite variation. However, the general metabolic profile was not considered significantly different from the control group.
To better understand the metabolites differences triggered by Cd2+ exposure in G. caudata, a supervised statistical analysis (OPLS-DA) was applied, comparing each Cd2+ treatment group with the control. Groups that did not have complete separation from the control in PCA had an invalid OPLS-DA result and, therefore, were not considered (Supplementary data—Figures S4 and S5) [33,34].
The OPLS-DA validated the difference between the 3 mg/L of Cd2+ and the control group, resulting in 33.25% for the T score and 11.4% for the Orthogonal score (Supplementary data—Figure S1). Together, they represent the cumulative variation of the difference between the groups, which resulted in a difference of 43.6%. The OPLS-DA was validated following the criteria of the variables Q2 and R2Y being higher than 0.5 and the permutation test with the same variables added to the p-value [33,35]. These variables were calculated by the model of Q2 = 0.82 and R2Y = 0.92, and in the permutation test as Q2 = 0.89 (p = 0.01) and R2Y = 0.92 (p = 0.01) (Supplementary data—Figure S1).
Twenty metabolites were considered to be the most responsible for the experimental group’s differences (Supplementary data–Figure S3 and Table S2), listed in Table 1, with its corresponding RT and the similarity index (SI) of the fragmentation pattern.
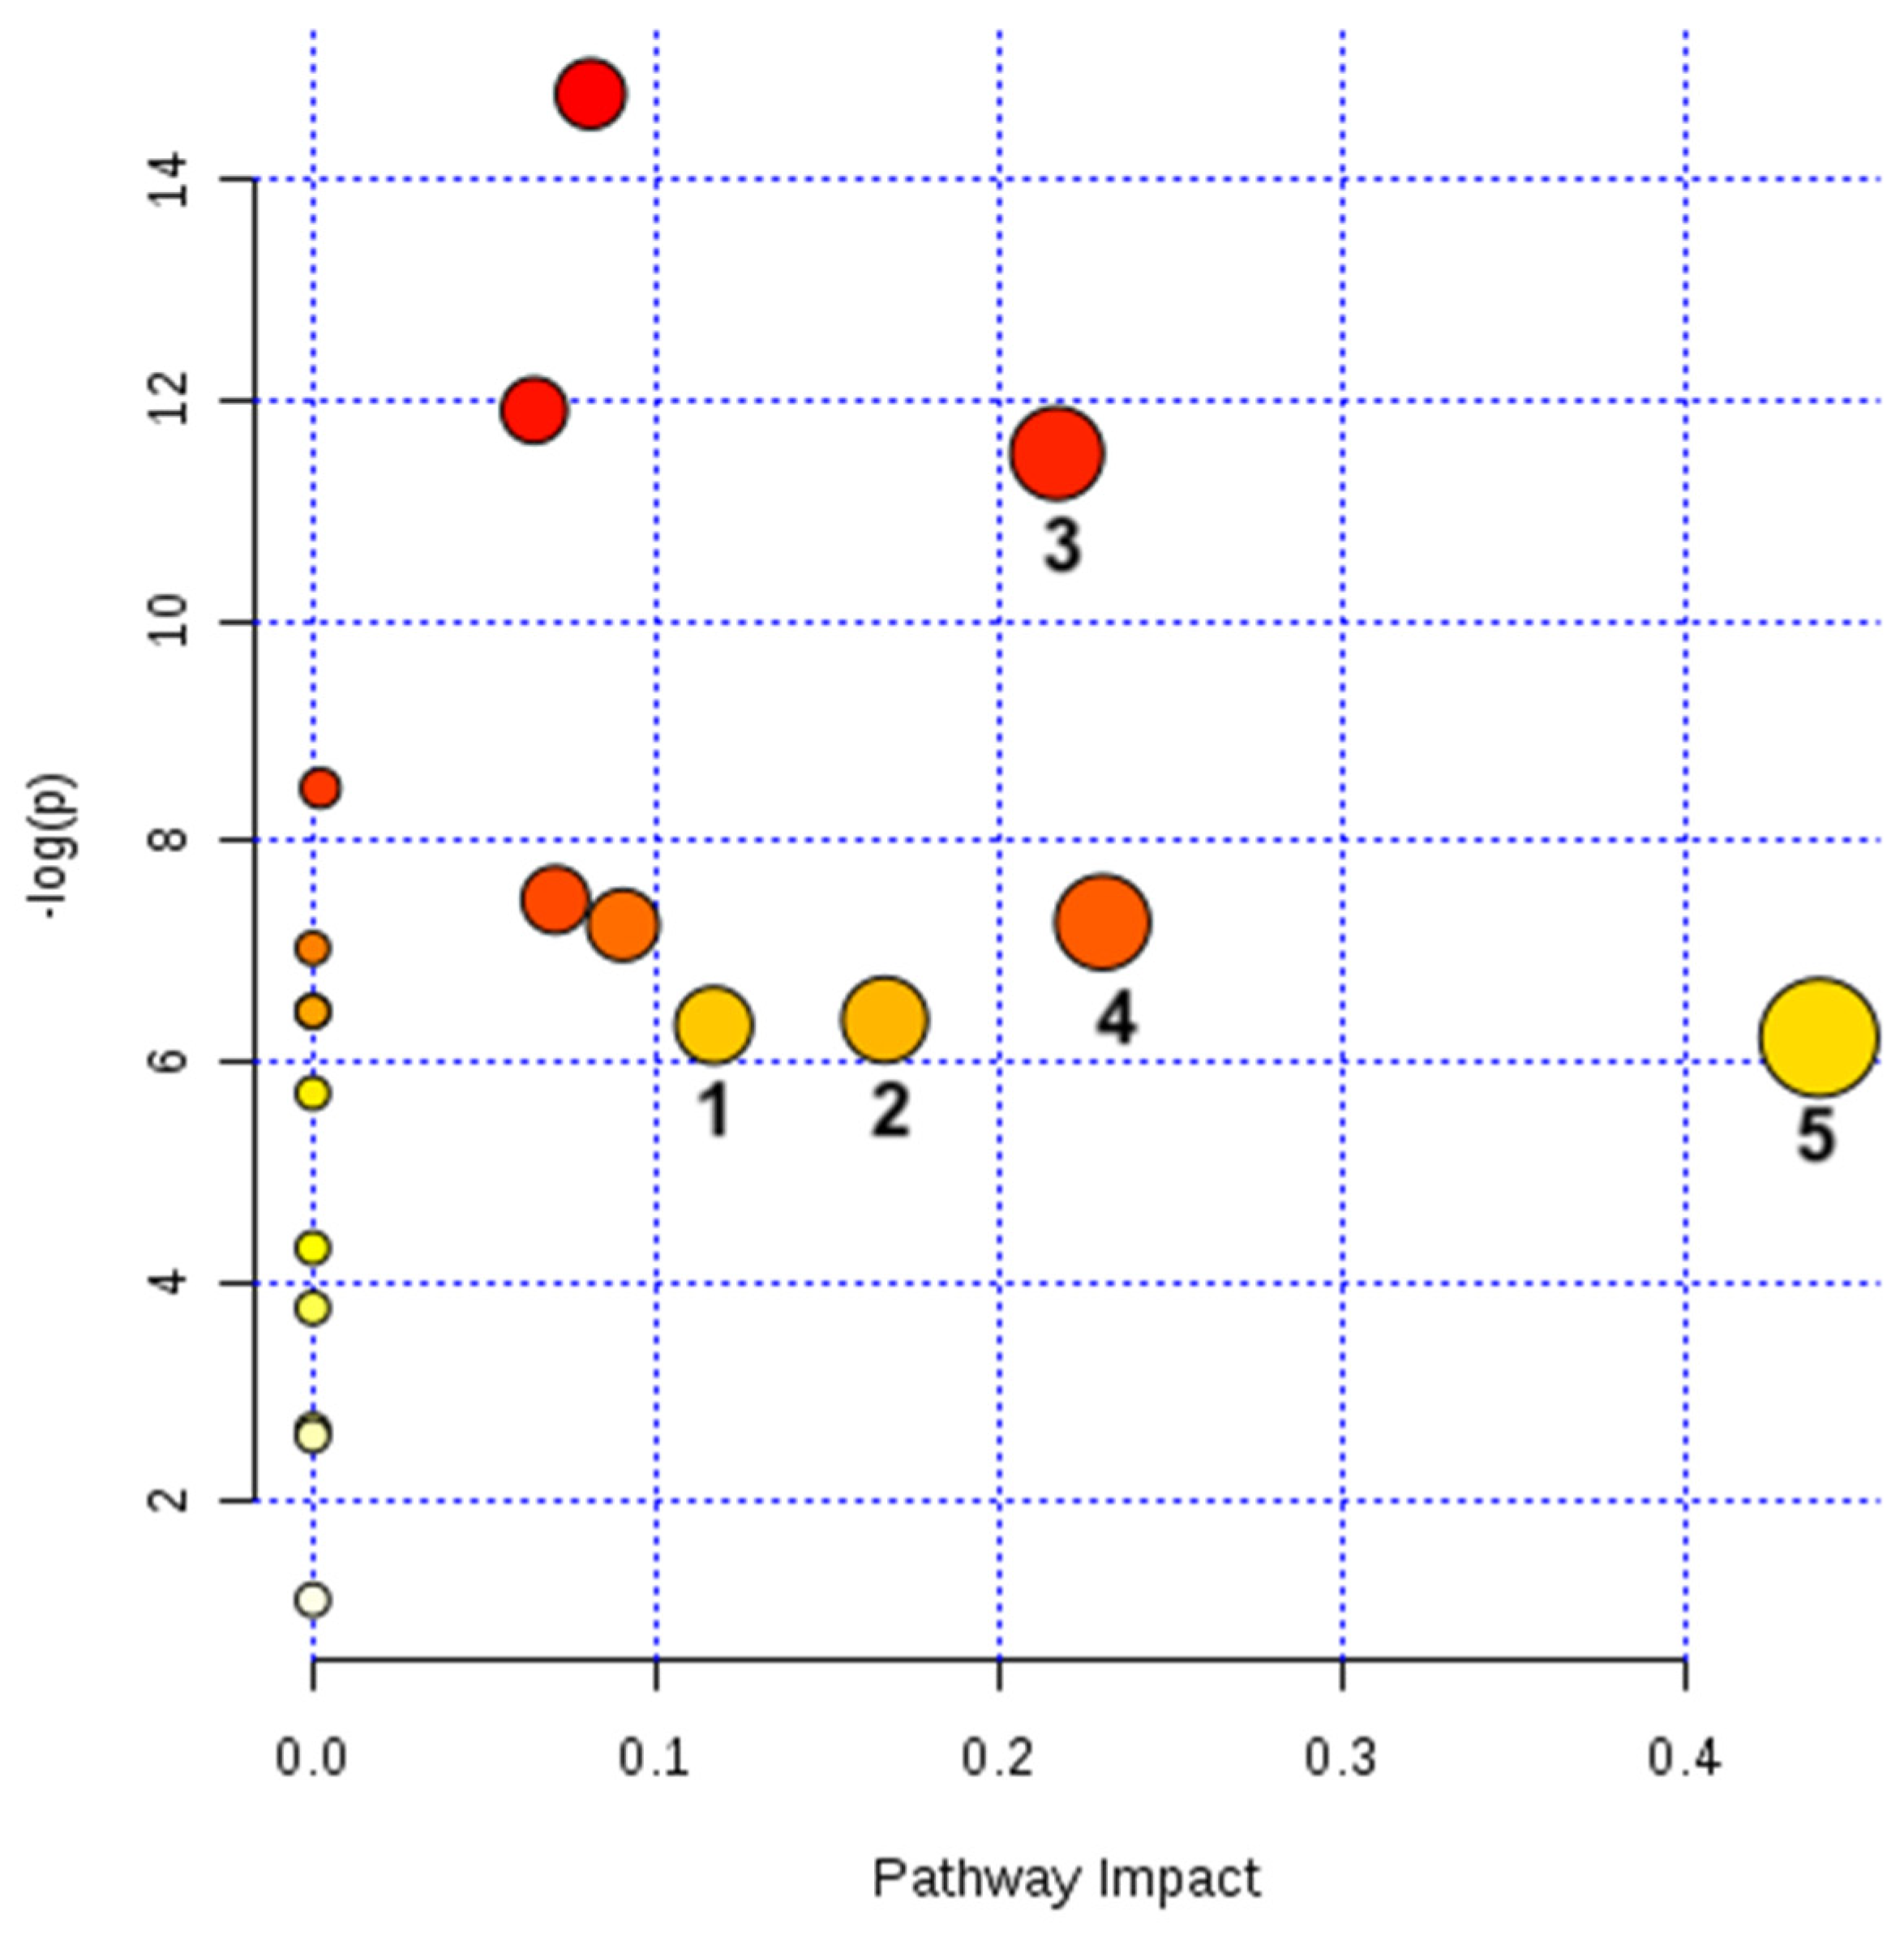
The unknown metabolites (RTs: 15.97 and 16.07) and those not found in the database (RTs:17.67, 20.40 and 22.94) were not included in the pathway analysis. Five out of 19 pathways identified were significantly altered by Cd2+ (3 mg/L) (Figure 4 and Table 2).
All metabolic pathways considered significantly altered (n = 5) by the presence of the Cd2+ (pathway impact > 0.1) were also shown to be significantly changed between groups (p < 0.05) (Table 2). In total, nine metabolites were detected in these five altered pathways, all of them accumulated during Cd2+ IC50 exposure. Increased concentrations of a metabolite can represent a greater activity of the described pathway or an accumulation of the metabolite due to some infeasibility downstream the pathway (absence of cofactors, malfunction of enzymes etc.).
4. Discussion
4.1. Growth and Photosynthesis Analysis
Despite much ecotoxicological analysis approaching red seaweed tolerance to metals, there is a high variation in methodology between these studies, which makes the comparison challenging. Many of these variations in methodology correspond to different culture conditions, chemical types of cadmium used, and forms of analysis, and these have an important influence on the calculation of the IC50 value. The IC50 value for G. caudata of 3 mg/L [Cd2+] (or 12 μM) is similar to that registered for another red macroalga, such as Gracilaria domingensis [22], and lower for G. tenuistipitata and Pterocladiella capillacea with the IC50 values three times lower [37,38,39]. A higher tolerance was verified in Hypnea musciformis which holds a IC50 higher than 50 μM [40].
Low photosynthesis rates in algae have been frequently registered for metal exposure [37,40,41,42,43,44,45]. Cadmium is also known to trigger inactivation, malfunction and lower cellular concentrations of Rubisco in vascular plants [46,47]. This enzyme malfunction occurs mainly due to the replacement of its metallic cofactor (Mg2+) by Cd2+, which hampers carbon dioxide/oxygen binding capacity, increasing the photorespiration [48]. Through an indirect mechanism, Rubisco is also affected by H2O2 accumulation due to ascorbate peroxidase inhibition by Cd2+ [49]. Cadmium also functions as a competitive inhibitor of Photosystem II at its calcium binding [43]. Therefore it inhibits photosynthesis on many levels. This can also explain ascorbate accumulation, also detected in this study.
In this study, a reduced photosynthesis rate under Cd2+ exposure was recorded in two tested concentrations (0.2 and 3 mg/L). The 0.2 mg/L of Cd2+, allowed by CONAMA for effluent discharge, despite being 15-fold lower than the IC50 determined for G. caudata (3 mg/L), caused the same damage to the algae photosynthesis rate (Figure 2). The lowest concentration tested (0.04 mg/L), legally permitted, did not show differences either from that observed for 0.2 and 3 mg/L or from the control group (Figure 2). These results highlight that Cd2+ pollution in the marine environment can be monitored through photosynthesis measurement in G. caudata as an effective and sensitive method. In this sense, organizations responsible for environmental legislation should consider these results to review the Cd2+ allowed in seawater and to guide public policy.
Metal concentrations measured directly from the water column do not reflect their real biologically available concentrations. In an artificial culture medium, only 0.18% of the amount of Cd2+ initially added to the culture was in fact, solubilized in the medium, and, thus, available to enter the alga cells. [22]. In natural seawater, cadmium tends to precipitate or be chelated to other materials in the water [22,50]. Its bioavailability is highly variable in the water column through changes in the marine environment, such as the presence of other metals, chelating agents, changes in pH etc. This highlights the importance of determining the presence of metallic pollutants using cytotoxicity analysis of known organisms since this concentration can be underestimated [51].
4.2. Impacted Metabolic Pathways
Several metabolites were differentially semi-quantified under the three Cd2+ concentrations tested. However, a complete impact on the pathway profiles was only detected under 3 mg/L (IC50). As a matter of higher confidence, we will restrain our discussion only on impacted pathway profiles.
The pathway with the highest impact was the metabolism of glycine, serine, and threonine (Table 2—pathway 5), which is correlated with the pathway of glyoxylate and dicarboxylate metabolism (Table 2—pathway 3) (Figure 5). A similar result was reported for G. domingensis exposed to Cd2+ [28]. The correlation between these two pathways in G. caudata could be explained by the increase in photorespiration rates (Figure 5). Glycine, serine and glyoxylate are intermediates in the conversion of phosphoglycolate to 3-phosphoglycerate in the photorespiration [52,53]. Studies with vascular plants have also demonstrated that higher concentrations of serine and glycine are important for activating photorespiration at the transcriptional level in plants [54,55]. Although not directly identified in this study, accumulation of phosphoglycolate has already been found in the vascular plant Brassica juncea exposed to cadmium [56]. Metal exposure has also been correlated with higher rates of photorespiration in plants [57], microalgae [58] and red macroalgae [28].
The exposure to Cd2+ was harmful to photosynthesis in G. caudata (Figure 2), and photorespiration can be a way to compensate for it to keep the Calvin-Benson cycle active (Figure 5); once the accumulation of phosphoglycolate can inactivate some of the downstream enzymes [59]. Photorespiration is also an alternative route for the continued production of carbohydrates in stressful conditions [60,61], like starch [62], which is also important for agar synthesis in Gracilaria species.
Rubisco is regulated by metallic ion availability, which influences its specificity to CO2/O2, thus controlling the equilibrium between photosynthesis and photorespiration. Cadmium is able to increase Rubisco affinity to O2 in plants [48], which may change the accumulation of glycine and glyoxylate, which are related to the maintenance of carbon flow under lower photosynthetic rate [63,64]. Higher activity of other important enzymes of glyoxylate metabolism in stress situations has been described in [63,65]. For these reasons, we suggest that when exposed to Cd2+, G. caudata, similarly to vascular plants, has a lower photosynthesis rate and, consequently, increased photorespiration (Figure 5).
Furthermore, the accumulation of citrate was also identified in this pathway (Table 2—pathway 3), which can be related to the demand for Krebs Cycle intermediates as previously reported for this species [28]. An outcome of that may be an increased synthesis of glutathione (GSH) and phytochelatins (PC) (Figure 5) through the transamination of the α-ketoglutarate [57]. GHS and PC are the main molecules capable of chelating metals in these organisms exposed to the metals [14].
The glyoxylate and dicarboxylate pathway (Table 2—pathway 3) can lead to an accumulation of triose-phosphates in the cytosol, increasing the synthesis of glycerol, which, when added to galactose, forms floridoside, also identified as an accumulated metabolite (Figure S6 and Table 1). This heteroside is highly accumulated during osmotic and heat stresses [66,67,68,69] and has been shown to be related to the cell-wall synthesis [70], an increased phenotype in Hypnea exposed to cadmium [40]. We suggest that floridoside also accumulates to increase of agar synthesis in G. caudata. β-oxidation can be important in this process, making glycerol available for floridoside synthesis and feeding glyoxylate cycle with Acetyl-COA (Figure 5). Floridoside was only detected in the experimental group exposed to Cd2+ (Figure S6); therefore, it may have an important role in oxidative stress. Increased polysaccharide accumulation results in cell-wall thickening, which works as a physical barrier and chelator of cadmium binding, decreasing its uptake, a common defense mechanism in vascular plants [71].
Ascorbate, the second most accumulated metabolite in this experiment (Table 2—pathway 4), is the most abundant antioxidant in plants, capable of quenching singlet oxygen, superoxide and H2O2 [53]. Thus, we suggest that G. caudata compensates for metal-induced oxidative stress with higher ascorbate synthesis (Figure 5). Other studies also identified higher ascorbate accumulation in plants exposed to cadmium [72,73] in stressed Klebsormidium [74]. In macroalgae, under metal exposure, increased activity of important antioxidant enzymes, such as superoxide dismutase and ascorbate peroxidase [13,75,76], have been reported. The simultaneous accumulation of ascorbates and L-galactose molecules, such as agar and floridoside, may be possible by the existence of a red algal exclusive ascorbate synthesis pathway as recently speculated by [77]; this study also corroborates importantly with this hypothesis.
The arginine and proline metabolism pathway (Table 2—pathway 1) (Figure 5) was also significantly altered. These amino acids frequently are accumulated during stress, as much as oligopeptides, such as glutathione and phytochelatins [14,76,78,79]. Proline is frequently associated with cellular stress also in red macroalgae [28,78,80,81,82,83,84], and it is related to cell osmotic balance in maize [85]. In Chlorella sp. exposed to several metals, intracellular concentrations of proline resulted in metal expulsion of the cell, reducing its intracellular concentration [83]. In plants, proline accumulation protects nitrate reductase activity and reduces oxidative damage of the photosystem II [86]. Therefore, we suggest that the accumulation of proline decreases intracellular metal toxicity to avoid oxidative stress in G. caudata. Arginine, although not directly identified in this study, occurs in the same metabolic pathway (Table 2—pathway 1). Arginine catabolism is an important source of nitrogen and a mechanism that assists the response to cellular stress. It is a precursor to polyamines and nitric oxide (NO) [87]. These compounds have important roles in the antioxidant process and have been identified in higher concentrations in plants and algae submitted to several stressful situations [88,89,90,91,92,93,94].
The accumulation of several amino acids represents a significant impact on the aminoacyl-tRNA synthetases pathway (Table 2—pathway 2) (Figure 5). The synthesis of gluthatione, phytochelatins and several antioxidant enzymes may be driving this process, as described in Arabidopsis (vascular plant) [95]. Plant transcriptomes often associate this pathway with non-essential metals exposure [96,97,98].
5. Conclusions
This study highlights the importance of proline, ascorbate, citrate, floridoside and their associated metabolic pathways (Table 2) in red macroalgae tolerance to metals. It significantly contributes to the metabolite library in rhodophytes and supports the establishment of Gracilaria caudata as a good bioindicator for marine environments. We showed that Cd2+ orchestrated an intense modification in carbon and amino acid pathways by intensifying photorespiration. It was detected that Cd2+ concentrations under IC50 were innocuous for the metabolome; only punctual alterations were detected; but could be perceived by PAM fluorescence, an invaluable and practical tool for field research.
We suggest a review of public policies regarding the currently permitted concentrations of Cd2+ in Brazilian marine environments determined by CONAMA [21]. The understanding of the metabolic changes triggered by Cd2+, together with the detection of the defense mechanisms performed by the macroalga, reflects an important diagnosis of the possible damage caused by pollution in the marine environment. Further studies are now facilitated using G. caudata as a bioindicator of cadmium pollution in the environment.
Supplementary Materials
The following supporting information can be downloaded at: https://www.mdpi.com/article/10.3390/phycology3020016/s1, Figure S1: OPLS-DA in G. caudata exposed to Cd2+ (0 and 3 mg/L). Data converted to cubic root and the Pareto scaling method. Orthogonal T-score: 11.4% and T-score: 33.2%; Figure S2: Validation tests for the OPLS-DA for the metabolic profile of G. caudata exposed to Cd2+ (0 and 3 mg/L). (A). 100-permutation test that resulted in variables of Q2 de 0.899 (p = 0.01) e R2Y 0.955 (p = 0.01); (B). graph bar for the calculated statistical variables of de Q2 = 0.823 e de R2Y = 0.923; Figure S3: S-plot of the metabolites present in the OPLS-DA analysis in G. caudata exposed to Cd2+ (0 and 3 mg/L). The metabolites are plotted with their respective covariance (y-axis) and correlation (X-axis) values. The upper right and lower left ends (black dashed areas) stand out as the most important metabolites for the separation of the groups (correlation > |0.05| and a covariance > |0.05|); Figure S4: Invalid OPLS-DA and validation tests in G. caudata exposed to Cd2+ (0 and 0.2 mg/L). Data converted to cubic root and the Pareto scaling—(A) OPLS-DA Orthogonal T-score: 28.8% and T-score [1]: 18.9%; (B) 100-permutation test Q2: 0.567 (p = 0.27) and R2Y: 0.997 (p = 0.47); (C) Model validation Q2: 0.45 and R2Y: 0.189; Figure S5: Invalid OPLS-DA and validation tests in G. caudata exposed to Cd2+ (0 and 0.04 mg/L). Data converted to cubic root and the Pareto scaling—(A) OPLS-DA Orthogonal T-score: 17.5% and T-score [1]: 22.6%; (B) 100-permutation test Q2: 0.696 (p = 0.08) and R2Y: 0.995 (p = 0.07); (C) Model validation Q2: 0.39 and R2Y: 0.226; Figure S6: Comparison of relative concentrations of the 19 metabolites (Table 1) found alternated in the metabolome of Gracilaria caudata exposed to Cd2+ (3 mg/L); Table S1: Total of metabolites detected by GC-MS in G. caudata listed according to the retention time (RT) and the calculated Kovats retention index (RI); Table S2: Complete list of the metabolites detected in the analysis (represented by their respective retention time) and their correlation and covariance values assigned by the OPLS DA test.
Author Contributions
All authors certify that they have participated sufficiently in the work to take public responsibility for the content. Conceptualization, L.A.-M., L.Z.-V. and P.C.; methodology, L.A.-M., L.Z.-V. and C.A.-L.; software, L.A.-M. and L.Z.-V.; validation, L.A.-M. and L.Z.-V.; formal analysis, L.A.-M., L.Z.-V. and C.A-L.; investigation, L.A.-M.; resources, L.Z.-V. and P.C.; data curation, L.A.-M. and L.Z.-V.; writing—original draft preparation, L.A.-M.; writing—review and editing, L.Z.-V., C.A.-L. and P.C.; visualization, L.A.-M. and P.C.; supervision, P.C.; project administration, P.C.; funding acquisition, P.C. All authors have read and agreed to the published version of the manuscript.
Funding
This work was supported by the National Coordination of High Education Personnel Formation Programs (CAPES) and The State of São Paulo Research Foundation (FAPESP) [grant number 2018/10216-4 and 2016/06931-4].
Institutional Review Board Statement
Not applicable.
Informed Consent Statement
Not applicable.
Data Availability Statement
Any further data related to this study are available on request from the corresponding author.
Conflicts of Interest
The authors declare no conflict of interest. The funders had no role in the design of the study; in the collection, analyses, or interpretation of data; in the writing of the manuscript; or in the decision to publish the results.
References and Note
- Rocha, A.A. Algae as biological indicators of water pollution. In Algae and the Environment: A General Approach; Sociedade Brasileira de Ficologia: São Paulo, Brazil, 1992; pp. 34–52. [Google Scholar]
- Klinger, T. The role of seaweeds in the modern ocean. Perspect. Phycol. 2015, 2, 31–39. [Google Scholar] [CrossRef]
- Kumar, M.; Kuzhiumparambil, U.; Pernice, M.; Jiang, Z.; Ralph, P.J. Metabolomics: An emerging frontier of systems biology in marine macrophytes. Algal Res. 2016, 16, 76–92. [Google Scholar] [CrossRef]
- Torres, M.A.; Barros, M.P.; Campos, S.C.G.; Pinto, E.; Rajamani, S.; Sayre, R.T.; Colepicolo, P. Biochemical biomarkers in algae and marine pollution: A review. Ecotoxicol. Environ. Saf. 2008, 71, 1–15. [Google Scholar] [CrossRef] [PubMed]
- Chung, I.K.; Beardall, J.; Mehta, S.; Sahoo, D.; Stojkovic, S. Using marine macroalgae for carbon sequestration: A critical appraisal. J. Appl. Phycol. 2011, 23, 877–886. [Google Scholar] [CrossRef]
- Hayashi, L.; Yokoya, N.S.; Ostini, S.; Pereira, R.T.L.; Braga, E.S.; Oliveira, E.C. Nutrients removed by Kappaphycus alvarezii (Rhodophyta, Solieriaceae) in integrated cultivation with fishes in re-circulating water. Aquaculture 2008, 277, 185–191. [Google Scholar] [CrossRef]
- Mehta, S.K.; Gaur, J.P. Use of algae for removing heavy metal ions from wastewater: Progress and prospects. Crit. Rev. Biotechnol. 2005, 25, 113–152. [Google Scholar] [CrossRef]
- Wang, R.; Wang, S.; Tai, Y.; Tao, R.; Dai, Y.; Guo, J.; Yang, Y.; Duan, S. Biogenic manganese oxides generated by green algae Desmodesmus sp. WR1 to improve bisphenol A removal. J. Hazard. Mater. 2017, 339, 310–319. [Google Scholar] [CrossRef]
- Dubey, S.; Shri, M.; Misra, P.; Lakhwani, D.; Kumar Bag, S.; Asif, M.H.; Kumar Trivedi, P.; Deo Tripathi, R.; Chakrabarty, D. Heavy metals induce oxidative stress and genome-wide modulation in transcriptome of rice root. Funct. Integr. Genom. 2014, 14, 401–417. [Google Scholar] [CrossRef]
- Worku, A.; Sahu, O. Reduction of Heavy Metal and Hardness from Ground Water by Algae. J. Appl. Environ. Microbiol. 2014, 2, 86–89. [Google Scholar] [CrossRef]
- Nagajyoti, P.C.; Lee, K.D.; Sreekanth, T.V.M. Heavy metals, occurrence and toxicity for plants: A review. Environ. Chem. Lett. 2010, 8, 199–216. [Google Scholar] [CrossRef]
- Mallick, N.; Mohn, F.H. Use of chlorophyll fluorescence in metal-stress research: A case study with the green microalga Scenedesmus. Ecotoxicol. Environ. Saf. 2003, 55, 64–69. [Google Scholar] [CrossRef]
- Okamoto, O.K.; Colepicolo, P. Response of superoxide dismutase to pollutant metal stress in the marine Dinoflagellate Gonyaulax polyedra. Comp. Biochem. Physiol. C Pharmacol. Toxicol. Endocrinol. 1998, 119, 67–73. [Google Scholar] [CrossRef] [PubMed]
- Romano, R.L.; Liria, C.W.; Machini, M.T.; Colepicolo, P.; Zambotti-villela, L. Cadmium decreases the levels of glutathione and enhances the phytochelatin concentration in the marine dinoflagellate Lingulodinium polyedrum. J. Appl. Phycol. 2016, 29, 811–820. [Google Scholar] [CrossRef]
- Wang, S.; Shi, X. Molecular mechanisms of metal toxicity and carcinogenesis. Mol. Cell. Biochem. 2001, 222, 3–9. [Google Scholar] [CrossRef]
- Flitter, W.; Rowley, D.A.; Halliwell, B. Superoxide-dependent formation of hydroxyl radicals in the presence of iron salts. What is the physiological iron chelator? FEBS Lett. 1983, 158, 310–312. [Google Scholar] [CrossRef]
- Allan, R. Introduction: Mining and metals in the environment. J. Geochem. Explor. 1997, 58, 95–100. [Google Scholar] [CrossRef]
- Patti, G.J.; Yanes, O.; Siuzdak, G. Metabolomics: The apogee of the omic triology NIH Public Access. Nat. Rev. Mol. Cell Biol. 2012, 13, 263–269. [Google Scholar] [CrossRef] [PubMed]
- Alseekh, S.; Fernie, A.R. Metabolomics 20 years on: What have we learned and what hurdles remain? Plant J. 2018, 94, 933–942. [Google Scholar] [CrossRef]
- Yokoya, N.S. Controle do desenvolvimento e da morfogênese por auxinas e citocininas em três espécies de rodofíceas: Gracilariopsis tenuifrons, Grateloupia dichotoma e Solieria filiformis. Ph.D. Thesis, Sao Paulo University (USP), São Paulo, Brazil, 1996. [Google Scholar]
- Conama (Conselho Nacional do Meio Ambiente). Ambiental legislation n 357, Brasil. Diário Oficial 2005, n° 053, of 18/03/2005, 58–63.
- Mendes, L.F.; Zambotti-Villela, L.; Colepicolo, P.; Marinho-Soriano, E.; Stevani, C.V.; Yokoya, N.S. Metal cation toxicity in the alga Gracilaria domingensis as evaluated by the daily growth rates in synthetic seawater. J. Appl. Phycol. 2013, 25, 1939–1947. [Google Scholar] [CrossRef]
- GraphPad Prism for Windows; GraphPad Software: San Diego, CA, USA, 1995–2023. Available online: www.graphpad.com (accessed on 6 February 2023).
- Team, R.C. R: A Language and Environment for Statistical; R Foundation for Statistical Computing: Vienna, Austria. Available online: https://www.R-project.org/ (accessed on 6 February 2023).
- Martins, A.P.; Yokoya, N.S.; Colepicolo, P. Biochemical Modulation by Carbon and Nitrogen Addition in Cultures of Dictyota menstrualis (Dictyotales, Phaeophyceae) to Generate Oil-based Bioproducts. Mar. Biotechnol. 2016, 18, 314–326. [Google Scholar] [CrossRef]
- Platt, T.G.; Gallegos, C.L.; Harrison, W.G. Photoinhibition of Photosynthesis in Natural Assemblages of Marine Phytoplankton. Environ. Sci. 1981, 38, 103–111. [Google Scholar]
- Salem, M.A.; Jüppner, J.; Bajdzienko, K.; Giavalisco, P. Protocol: A fast, comprehensive and reproducible one-step extraction method for the rapid preparation of polar and semi-polar metabolites, lipids, proteins, starch and cell wall polymers from a single sample. Plant Methods 2016, 12, 45. [Google Scholar] [CrossRef] [PubMed]
- Zambotti-Villela, L. Metabolômica de Algas Expostas a Metais. Ph.D. Thesis, Sao Paulo University (USP), São Paulo, Brazil, 2017. [Google Scholar]
- Phélippé, M.; Coat, R.; Le Bras, C.; Perrochaud, L.; Peyretaillade, E.; Kucma, D.; Arhaliass, A.; Thouand, G.; Cogne, G.; Gonçalves, O. Characterization of an easy-to-use method for the routine analysis of the central metabolism using an affordable low-resolution GC–MS system: Application to Arthrospira platensis. Anal. Bioanal. Chem. 2018, 410, 1341–1361. [Google Scholar] [CrossRef] [PubMed]
- MetaboAnalyst. Available online: https://www.metaboanalyst.ca/home.xhtml (accessed on 6 February 2023).
- Wiklund, S.; Johansson, E.; Sjo, L.; Shockcor, J.P.; Gottfries, J.; Moritz, T.; Trygg, J. Visualization of GC/TOF-MS-Based Metabolomics Data for Identification of Biochemically Interesting Compounds Using OPLS Class Models. Anal. Chem. 2007, 80, 115–122. [Google Scholar] [CrossRef]
- Xia, J.; Wishart, D.S. Using metaboanalyst 3.0 for comprehensive metabolomics data analysis. Curr. Protoc. Bioinform. 2016, 2016, 14.10.11–14.10.91. [Google Scholar] [CrossRef]
- Worley, B.; Powers, R. PCA as a practical indicator of OPLS-DA model reliability. Curr. Metab. 2016, 4, 97–103. [Google Scholar] [CrossRef]
- Xia, J. Metabolomic Data Analysis Using MetaboAnalyst. YouTube. 2018. Available online: https://www.youtube.com/watch?v=lKipIJPXrLU&t=2s (accessed on 6 February 2023).
- Triba, M.N.; Moyec, L.L.; Amathieu, R.; Goossens, C.; Bouchemal, N.; Nahon, P.; Rutledge, D.N.; Savarin, P. Molecular BioSystems PLS/OPLS models in metabolomics: The impact of permutation of dataset rows on the K-fold. Mol. BioSystems 2014, 11, 13–19. [Google Scholar] [CrossRef]
- Xia, J.; Wishart, D.S. MetPA: A web-based metabolomics tool for pathway analysis and visualization. Syst. Biol. 2010, 26, 2342–2344. [Google Scholar] [CrossRef]
- De, M.R.; Felix, L.; Osorio, L.K.P.; Ouriques, L.C.; Farias-Soares, F.L.; Steiner, N.; Kreusch, M.; Pereira, D.T.; Simioni, C.; Costa, G.B.; et al. The Effect of Cadmium Under Different Salinity Conditions on the Cellular Architecture and Metabolism in the Red Alga Pterocladiella capillacea (Rhodophyta, Gelidiales). Microsc. Microanal. 2014, 20, 1411–1424. [Google Scholar] [CrossRef]
- Tonon, A.P.; Zaini, P.A.; dos Reis Falcão, V.; Oliveira, M.C.; Collén, J.; Boyen, C.; Colepicolo, P. Gracilaria tenuistipitata (Rhodophyta) tolerance to cadmium and copper exposure observed through gene expression and photosynthesis analyses. J. Appl. Phycol. 2018, 30, 2129–2141. [Google Scholar] [CrossRef]
- Huang, X.; Ke, C.; Wang, W. Cadmium and copper accumulation and toxicity in the macroalga Gracilaria tenuistipitata. Aquat. Biol. 2010, 11, 17–26. [Google Scholar] [CrossRef]
- Bouzon, Z.L.; Ferreira, E.C.; dos Santos, R.; Scherner, F.; Horta, P.A.; Maraschin, M.; Schmidt, É.C. Influences of cadmium on fine structure and metabolism of Hypnea musciformis (Rhodophyta, Gigartinales) cultivated in vitro. Protoplasma 2011, 249, 637–650. [Google Scholar] [CrossRef]
- Andosch, A.; Affenzeller, M.J.; Lütz, C.; Lütz-Meindl, U. A freshwater green alga under cadmium stress: Ameliorating calcium effects on ultrastructure and photosynthesis in the unicellular model Micrasterias. J. Plant Physiol. 2012, 169, 1489–1500. [Google Scholar] [CrossRef]
- Baumann, H.A.; Morrison, L.; Stengel, D.B. Metal accumulation and toxicity measured by PAM-Chlorophyll fluorescence in seven species of marine macroalgae. Ecotoxicol. Environ. Saf. 2009, 72, 1063–1075. [Google Scholar] [CrossRef]
- Faller, P.; Kienzler, K.; Krieger-liszkay, A. Mechanism of Cd2+ toxicity: Cd2+ inhibits photoactivation of Photosystem II by competitive binding to the essential Ca2+ site. Biochim. Biophys. Acta 2005, 1706, 158–164. [Google Scholar] [CrossRef]
- Gouveia, C.; Kreusch, M.; Schmidt, E.C.; Felix, M.R.; Osorio, L.K.; Pereira, D.T.; dos Santos, R.; Ouriques, L.C.; Martins Rde, P.; Latini, A.; et al. The effects of lead and copper on the cellular architecture and metabolism of the red alga Gracilaria domingensis. Microsc. Microanal. 2013, 19, 513–524. [Google Scholar] [CrossRef]
- Schmidt, É.C.; Kreusch, M.; Marthiellen, M.R.; Pereira, D.T.; Costa, G.B.; Simioni, C.; Ouriques, L.C.; Farias-Soares, F.L.; Steiner, N.; Chow, F.; et al. Effects of ultraviolet radiation (UVA+UVB) and copper on the morphology, ultrastructural organization and physiological responses of the red alga Pterocladiella capillacea. Photochem. Photobiol. 2015, 91, 359–370. [Google Scholar] [CrossRef]
- Dias, M.C.; Monteiro, C.; Moutinho-Pereira, J.; Correia, C.; Gonçalves, B.; Santos, C. Cadmium toxicity affects photosynthesis and plant growth at different levels. Acta Physiol. Plant. 2013, 35, 1281–1289. [Google Scholar] [CrossRef]
- Krupa, Z.; Siedlecka, A.; Kleczkowski, L.A. Cadmium-affected level of inorganic phosphate in rye leaves influences Rubisco subunits. Acta Physiol. Plant. 1999, 21, 257–261. [Google Scholar] [CrossRef]
- Pietrini, F.; Iannelli, M.A.; Pasqualini, S.; Massacci, A. Interaction of Cadmium with Glutathione and Photosynthesis in Developing Leaves and Chloroplasts of Phragmites australis (Cav.) Trin. ex Steudel 1. Am. Soc. Plant Biol. 2003, 133, 829–837. [Google Scholar] [CrossRef]
- Liu, K.L.; Shen, L.; Wang, J.Q.; Sheng, J.P. Rapid inactivation of chloroplastic ascorbate peroxidase is responsible for oxidative modification to Rubisco in tomato (Lycopersicon esculentum) under cadmium stress. J. Integr. Plant Biol. 2008, 50, 415–426. [Google Scholar] [CrossRef] [PubMed]
- Zeini Jahromi, E.; Bidari, A.; Assadi, Y.; Milani Hosseini, M.R.; Jamali, M.R. Dispersive liquid-liquid microextraction combined with graphite furnace atomic absorption spectrometry: Ultra trace determination of cadmium in water samples. Anal. Chim. Acta 2007, 585, 305–311. [Google Scholar] [CrossRef]
- Mendes, L.F.; Stevani, C.V. Evaluation of metal toxicity by a modified method based on the fungus Gerronema viridilucens bioluminescence in agar medium. Environ. Toxicol. Chem. 2010, 29, 320–326. [Google Scholar] [CrossRef]
- Bauwe, H.; Hagemann, M.; Kern, R.; Timm, S. Photorespiration has a dual origin and manifold links to central metabolism. Curr. Trends 2012, 15, 269–275. [Google Scholar] [CrossRef] [PubMed]
- Driever, S.M.; Kromdijk, J. Will C 3 crops enhanced with the C4CO2 -concentrating mechanism live up to their full potential (yield)? J. Exp. Bot. 2013, 64, 3925–3935. [Google Scholar] [CrossRef] [PubMed]
- Noctor, G.; Foyer, C.H. Ascorbate and Glutathione: Keeping Active Oxygen Under Control. Annu. Rev. Plant Physiol. Plant Mol. Biol. 1998, 49, 249–279. [Google Scholar] [CrossRef]
- Timm, S.; Florian, A.; Wittmiß, M.; Jahnke, K.; Hagemann, M.; Fernie, A.R.; Bauwe, H.; Rostock, D.; Germany, S.T. Serine Acts as a Metabolic Signal for the Transcriptional Control of Photorespiration-Related Genes. Plant Physiol. 2013, 162, 379–389. [Google Scholar] [CrossRef] [PubMed]
- D’Alessandro, A.; Taamalli, M.; Gevi, F.; Timperio, A.M.; Zolla, L.; Ghnaya, T. Cadmium Stress Responses in Brassica juncea: Hints from Proteomics and Metabolomics. J. Proteome Res. 2013, 12, 4979–4997. [Google Scholar] [CrossRef]
- Taamalli, M.; D’Alessandro, A.; Marrocco, C.; Gevi, F.; Timperio, A.M.; Zolla, L. Proteomic and metabolic profiles of Cakile maritima Scop. Sea Rocket grown in the presence of cadmium. Mol. BioSystems 2015, 11, 1096–1109. [Google Scholar] [CrossRef]
- León-Vaz, A.; Romero, L.C.; Gotor, C.; León, R.; Vigara, J. Effect of cadmium in the microalga Chlorella sorokiniana: A proteomic study. Ecotoxicol. Environ. Saf. 2021, 207, 111301. [Google Scholar] [CrossRef]
- Kelly, G.J.; Latzko, E. Inhibition of spinach-leaf phosphofructokinase by 2-phosphoglycollate. FEBS Lett. 1976, 68, 55–58. [Google Scholar] [CrossRef]
- Haimovich-Dayan, M.; Lieman-Hurwitz, J.; Orf, I.; Hagemann, M.; Kaplan, A. Does 2-phosphoglycolate serve as an internal signal molecule of inorganic carbon deprivation in the cyanobacterium S ynechocystis sp. Environ. Microbiol. 2015, 17, 1794–1804. [Google Scholar] [CrossRef] [PubMed]
- Jensen, R.G. Activation of Rubisco regulates photosynthesis at high temperature and CO2. Natl. Acad. Sci. 2000, 97, 12937–12938. [Google Scholar] [CrossRef] [PubMed]
- Flügel, F.; Timm, S.; Arrivault, S.; Florian, A.; Stitt, M.; Fernie, A.R.; Bauwe, H. The Photorespiratory Metabolite 2-Phosphoglycolate Regulates Photosynthesis and Starch Accumulation in Arabidopsis. Plant Cell 2017, 29, 2537–2551. [Google Scholar] [CrossRef] [PubMed]
- Timm, S.; Florian, A.; Arrivault, S.; Stitt, M.; Fernie, A.R.; Bauwe, H. Glycine decarboxylase controls photosynthesis and plant growth. FEBS Lett. 2012, 586, 3692–3697. [Google Scholar] [CrossRef]
- Chastain, C.J.; Ogren, W.L. Glyoxylate Inhibition of Ribulosebisphosphate Carboxylase/Oxygenase Activation State in vivo. Plant Cell Physiol. 1989, 30, 937–944. [Google Scholar] [CrossRef]
- Plancke, C.; Vigeolas, H.; Höhner, R.; Roberty, S.; Emonds-Alt, B.; Larosa, V.; Willamme, R.; Duby, F.; Onga Dhali, D.; Thonart, P.; et al. Lack of isocitrate lyase in Chlamydomonas leads to changes in carbon metabolism and in the response to oxidative stress under mixotrophic growth. Plant J. 2014, 77, 404–417. [Google Scholar] [CrossRef]
- Luo, Q.; Zhu, Z.; Zhu, Z.; Yang, R.; Qian, F.; Chen, H.; Yan, X. Different responses to heat shock stress revealed heteromorphic adaptation strategy of Pyropia haitanensis (Bangiales, Rhodophyta). PLoS ONE 2014, 9, e94354. [Google Scholar] [CrossRef]
- Qian, F.; Luo, Q.; Yang, R.; Zhu, Z.; Chen, H.; Yan, X. The littoral red alga Pyropia haitanensis uses rapid accumulation of floridoside as the desiccation acclimation strategy. J. Appl. Phycol. 2015, 27, 621–632. [Google Scholar] [CrossRef]
- Martinez-Garcia, M.; Van Der Maarel, M.J.E.C. Floridoside production by the red microalga Galdieria sulphuraria under different conditions of growth and osmotic stress. AMB Express 2016, 6, 1–8. [Google Scholar] [CrossRef]
- Pade, N.; Linka, N.; Ruth, W.; Weber, A.P.M.; Hagemann, M. Floridoside and isofloridoside are synthesized by trehalose 6-phosphate synthase-like enzymes in the red alga Galdieria sulphuraria. New Phytol. 2015, 205, 1227–1238. [Google Scholar] [CrossRef]
- Li, S.-Y.; Shabtai, Y.; Arad, S. Floridoside as a carbon precursor for the synthesis of cell-wall polysaccharide in the red microalga Porphyridium sp. (Rhodophyta). J. Phycol. 2002, 38, 931–938. [Google Scholar] [CrossRef]
- Krzesłowska, M. The cell wall in plant cell response to trace metals: Polysaccharide remodeling and its role in defense strategy. Acta Physiol. Plant. 2011, 33, 35–51. [Google Scholar] [CrossRef]
- Rodríguez-Celma, J.; Rellán-Álvarez, R.; Abadía, A.; Abadía, J.; López-Millán, A.F. Changes induced by two levels of cadmium toxicity in the 2-DE protein profile of tomato roots. J. Proteom. 2010, 73, 1694–1706. [Google Scholar] [CrossRef]
- Zhang, F.; Li, J.; Huang, J.; Lin, L.; Wan, X.; Zhao, J.; Dong, J.; Sun, L.; Chen, Q. Transcriptome Profiling Reveals the Important Role of Exogenous Nitrogen in Alleviating Cadmium Toxicity in Poplar Plants. J. Plant Growth Regul. 2017, 36, 942–956. [Google Scholar] [CrossRef]
- Holzinger, A.; Kaplan, F.; Blaas, K.; Zechmann, B.; Komsic-Buchmann, K.; Becker, B. Transcriptomics of desiccation tolerance in the streptophyte green alga Klebsormidium reveal a land plant-like defense reaction. PLoS ONE 2014, 9, e110630. [Google Scholar] [CrossRef]
- Okamoto, O.K.; Pinto, E.; Latorre, L.R.; Bechara, E.J.H.; Colepicolo, P. Antioxidant Modulation in Response to Metal-Induced Oxidative Stress in Algal Chloroplasts. Arch. Environ. Contam. Toxicol. 2001, 40, 18–24. [Google Scholar] [CrossRef]
- Pinto, E.; Sigaud- Kutner, T.C.S.; Leitao, M.A.S.; Okamoto, O.K.; Morse, D.; Calepicolo, P. Review—Heavy metal-induced oxidatives stress in algae. J. Phycol. 2003, 39, 1008–1018. [Google Scholar] [CrossRef]
- Nakamura-Gouvea, N.; Alves-Lima, C.; Benites, L.F.; Iha, C.; Maracaja-Coutinho, V.; Aliaga-Tobar, V.; Carneiro, M.; Yokoya, N.S.; Marinho-Soriano, E.; Graminha, M.A.S.; et al. Insights into agar and secondary metabolite pathways from the genome of the red alga Gracilaria domingensis (Rhodophyta, Gracilariales). J. Phycol. 2003, 39, 1008–1018. [Google Scholar] [CrossRef]
- Çelekli, A.; Kapi, M.; Bozkurt, H. Effect of cadmium on biomass, pigmentation, malondialdehyde, and proline of Scenedesmus quadricauda var. longispina. Bull. Environ. Contam. Toxicol. 2013, 91, 571–576. [Google Scholar] [CrossRef]
- Sharma, S.S.; Dietz, K.-J. The significance of amino acids and amino acid-derived molecules in plant responses and adaptation to heavy metal stress. J. Exp. Bot. 2006, 57, 711–726. [Google Scholar] [CrossRef]
- Hamed, S.M.; Selim, S.; Klöck, G.; AbdElgawad, H. Sensitivity of two green microalgae to copper stress: Growth, oxidative and antioxidants analyses. Ecotoxicol. Environ. Saf. 2017, 144, 19–25. [Google Scholar] [CrossRef]
- He, Y.; Hu, C.; Wang, Y.; Cui, D.; Sun, X.; Li, Y.; Xu, N. The metabolic survival strategy of marine macroalga Ulva prolifera under temperature stress. J. Appl. Phycol. 2018, 30, 3611–3621. [Google Scholar] [CrossRef]
- Mastrobuoni, G.; Irgang, S.; Pietzke, M.; Aßmus, H.E.; Wenzel, M.; Schulze, W.X.; Kempa, S. Proteome dynamics and early salt stress response of the photosynthetic organism Chlamydomonas reinhardtii. BMC Genomics 2012, 13, 215. [Google Scholar] [CrossRef]
- Wu, J.T.; Hsieh, M.T.; Kow, L.C. Role of proline accumulation in response to toxic copper in Chlorella sp. (Chlorophyceae) cells. J. Phycol. 1998, 34, 113–117. [Google Scholar] [CrossRef]
- Zhang, J.L.; Zhou, Z.P.; Pei, Y.; Xiang, Q.Q.; Chang, X.X.; Ling, J.; Shea, D.; Chen, L.Q. Metabolic profiling of silver nanoparticle toxicity in Microcystis aeruginosa. Environ. Sci. Nano 2018, 5, 2519–2530. [Google Scholar] [CrossRef]
- Voetberg, G.S.; Sharp, R.E. Growth of the maize primary root at low water potentials: III. Role of increased proline deposition in osmotic adjustment. Plant Physiol. 1991, 96, 1125–1130. [Google Scholar] [CrossRef]
- Szabados, L.; Savouré, A. Proline: A multifunctional amino acid. Curr. Trends 2010, 15, 89–97. [Google Scholar] [CrossRef]
- Winter, G.; Todd, C.D.; Trovato, M.; Forlani, G.; Funck, D. Physiological implications of arginine metabolism in plants. Front. Plant Sci. 2015, 6, 1–14. [Google Scholar] [CrossRef]
- Flores, T.; Todd, C.D.; Tovar-Mendez, A.; Dhanoa, P.K.; Correa-Aragunde, N.; Hoyos, M.E.; Brownfield, D.M.; Mullen, R.T.; Lamattina, L.; Polacco, J.C. Arginase-Negative Mutants of Arabidopsis Exhibit Increased Nitric Oxide Signaling in Root Development. Am. Soc. Plant Biol. 2008, 147, 1936–1946. [Google Scholar] [CrossRef]
- Shi, H.; Ye, T.; Chen, F.; Cheng, Z.; Wang, Y.; Yang, P.; Zhang, Y.; Chan, Z. Manipulation of arginase expression modulates abiotic stress tolerance in Arabidopsis: Effect on arginine metabolism and ROS accumulation. J. Exp. Bot. 2013, 64, 1367–1379. [Google Scholar] [CrossRef]
- Zhang, L.P.; Mehta, S.K.; Liu, Z.P.; Yang, Z.M. Copper-induced proline synthesis is associated with nitric oxide generation in Chlamydomonas reinhardtii. Plant Cell Physiol. 2008, 49, 411–419. [Google Scholar] [CrossRef]
- Chi Yu, C.; Tung Hung, K.; Huei Kao, C. Nitric oxide reduces Cu toxicity and Cu-induced NH4+ accumulation in rice leaves. J. Plant Physiol. 2005, 162, 1319–1330. [Google Scholar] [CrossRef] [PubMed]
- Cui, X.; Zhang, Y.; Chen, X.; Jin, H.; Wu, X. Effects of exogenous nitric oxide protects tomato plants under copper stress. In Proceedings of the 2009 3rd International Conference on Bioinformatics and Biomedical Engineering, Beijing, China, 11–13 June 2009. [Google Scholar]
- Kopyra, M.; Biochemistry, E.A. Nitric oxide stimulates seed germination and counteracts the inhibitory effect of heavy metals and salinity on root growth of Lupinus luteus. Plant Physiol. Biochem. 2003, 41, 1011–1017. [Google Scholar] [CrossRef]
- Xiong, J.; An, L.; Lu, H.; Zhu, C. Exogenous nitric oxide enhances cadmium tolerance of rice by increasing pectin and hemicellulose contents in root cell wall. Planta 2009, 230, 755–765. [Google Scholar] [CrossRef] [PubMed]
- Baranašić, J.; Mihalak, A.; Gruić-Sovulj, I.; Bauer, N.; Rokov-Plavec, J. Expression of genes for selected plant aminoacyl-tRNA synthetases in the abiotic stress. Acta Bot. Croat. 2021, 80, 35–42. [Google Scholar] [CrossRef]
- Gill, R.A.; Ali, B.; Cui, P.; Shen, E.; Farooq, M.A.; Islam, F.; Ali, S.; Mao, B.; Zhou, W. Comparative transcriptome profiling of two Brassica napus cultivars under chromium toxicity and its alleviation by reduced glutathione. BMC Genomics 2016, 17, 1–25. [Google Scholar] [CrossRef]
- Starnes, D.; Unrine, J.; Chen, C.; Lichtenberg, S.; Starnes, C.; Svendsen, C.; Kille, P.; Morgan, J.; Baddar, Z.E.; Spear, A.; et al. Toxicogenomic responses of Caenorhabditis elegans to pristine and transformed zinc oxide nanoparticles. Environ. Pollut. 2019, 247, 917–926. [Google Scholar] [CrossRef]
- Xu, M.; Jiang, L.; Shen, K.N.; Wu, C.; He, G.; Hsiao, C.D. Transcriptome response to copper heavy metal stress in hard-shelled mussel (Mytilus coruscus). Genomics Data 2016, 7, 152–154. [Google Scholar] [CrossRef]
Figure 1.
Daily Growth Rate (DGR) of the macroalga G. caudata under Cd2+ exposure. (A) Growth curves of Cd2+ exposure increasing concentrations groups (0 to 13 mg/L, indicated in gray boxes) and algal apexes weight variation for seven days. DGR for each treatment was obtained by the slope of the exponential phase of the growth curve, indicated as a blue line. (B) A dose–response curve showing the IC50 value calculated as 3 mg/L (dashed red line) that could be observed by 48 h of Cd2+ exposure. Shapiro–Wilk normality test was used for the comparison of the multiple data and ANOVA-one way comparing the result of each day.

Figure 2.
Photosynthetic parameters obtained by a fast light curve after 48 h of Cd2+ exposure (G. caudata). ANOVA one-way—(A) Fv/Fm: p = 0.5217; (B) alpha: p = 0.4189; (C) ETR max: p < 0.0001 comparisons between different concentrations (Tukey): 0 vs. 0.2 (p = 0.019); 0 vs. 3 (p = 0.0470); 0.04 vs. 3 (p = 0.0003) and 0.2 vs. 3 (p = 0.0002); (D) Ik: p = 0.0006 (Tukey): 0 vs. 0.2 (p = 0.0019) and 0 vs. 3 (p = 0.0006). a, b, and ab (at C,D) highlights when there was or not a statistical difference between the experimental groups (ex. a is statically equal to a or ab but not b).

Figure 3.
PCA of the metabolic profile of G. caudata exposed to Cd2+ (0, 0.04, 0.2 and 3 mg/L). Data converted to cube root and the Pareto scaling method. From MetaboAnalyst.
Figure 3.
PCA of the metabolic profile of G. caudata exposed to Cd2+ (0, 0.04, 0.2 and 3 mg/L). Data converted to cube root and the Pareto scaling method. From MetaboAnalyst.

Figure 4.
Metabolic pathways altered in G. caudata exposed to Cd2+ (3 mg/L). The 20 metabolites significantly altered by Cd2+ (Table 1) pointed to five pathways altered by these detected changes. The pathways are arranged according to the scores from the enrichment analyses [y axis: −ln (p)] (also displayed in red scale, coloring the bullets) and topology (x-axis: pathway impact, i.e., the sum of the detected alterations normalized by the sum of the importance represented by each metabolite in its corresponding pathway – also displayed with the bullets sizes) [36].

Figure 5.
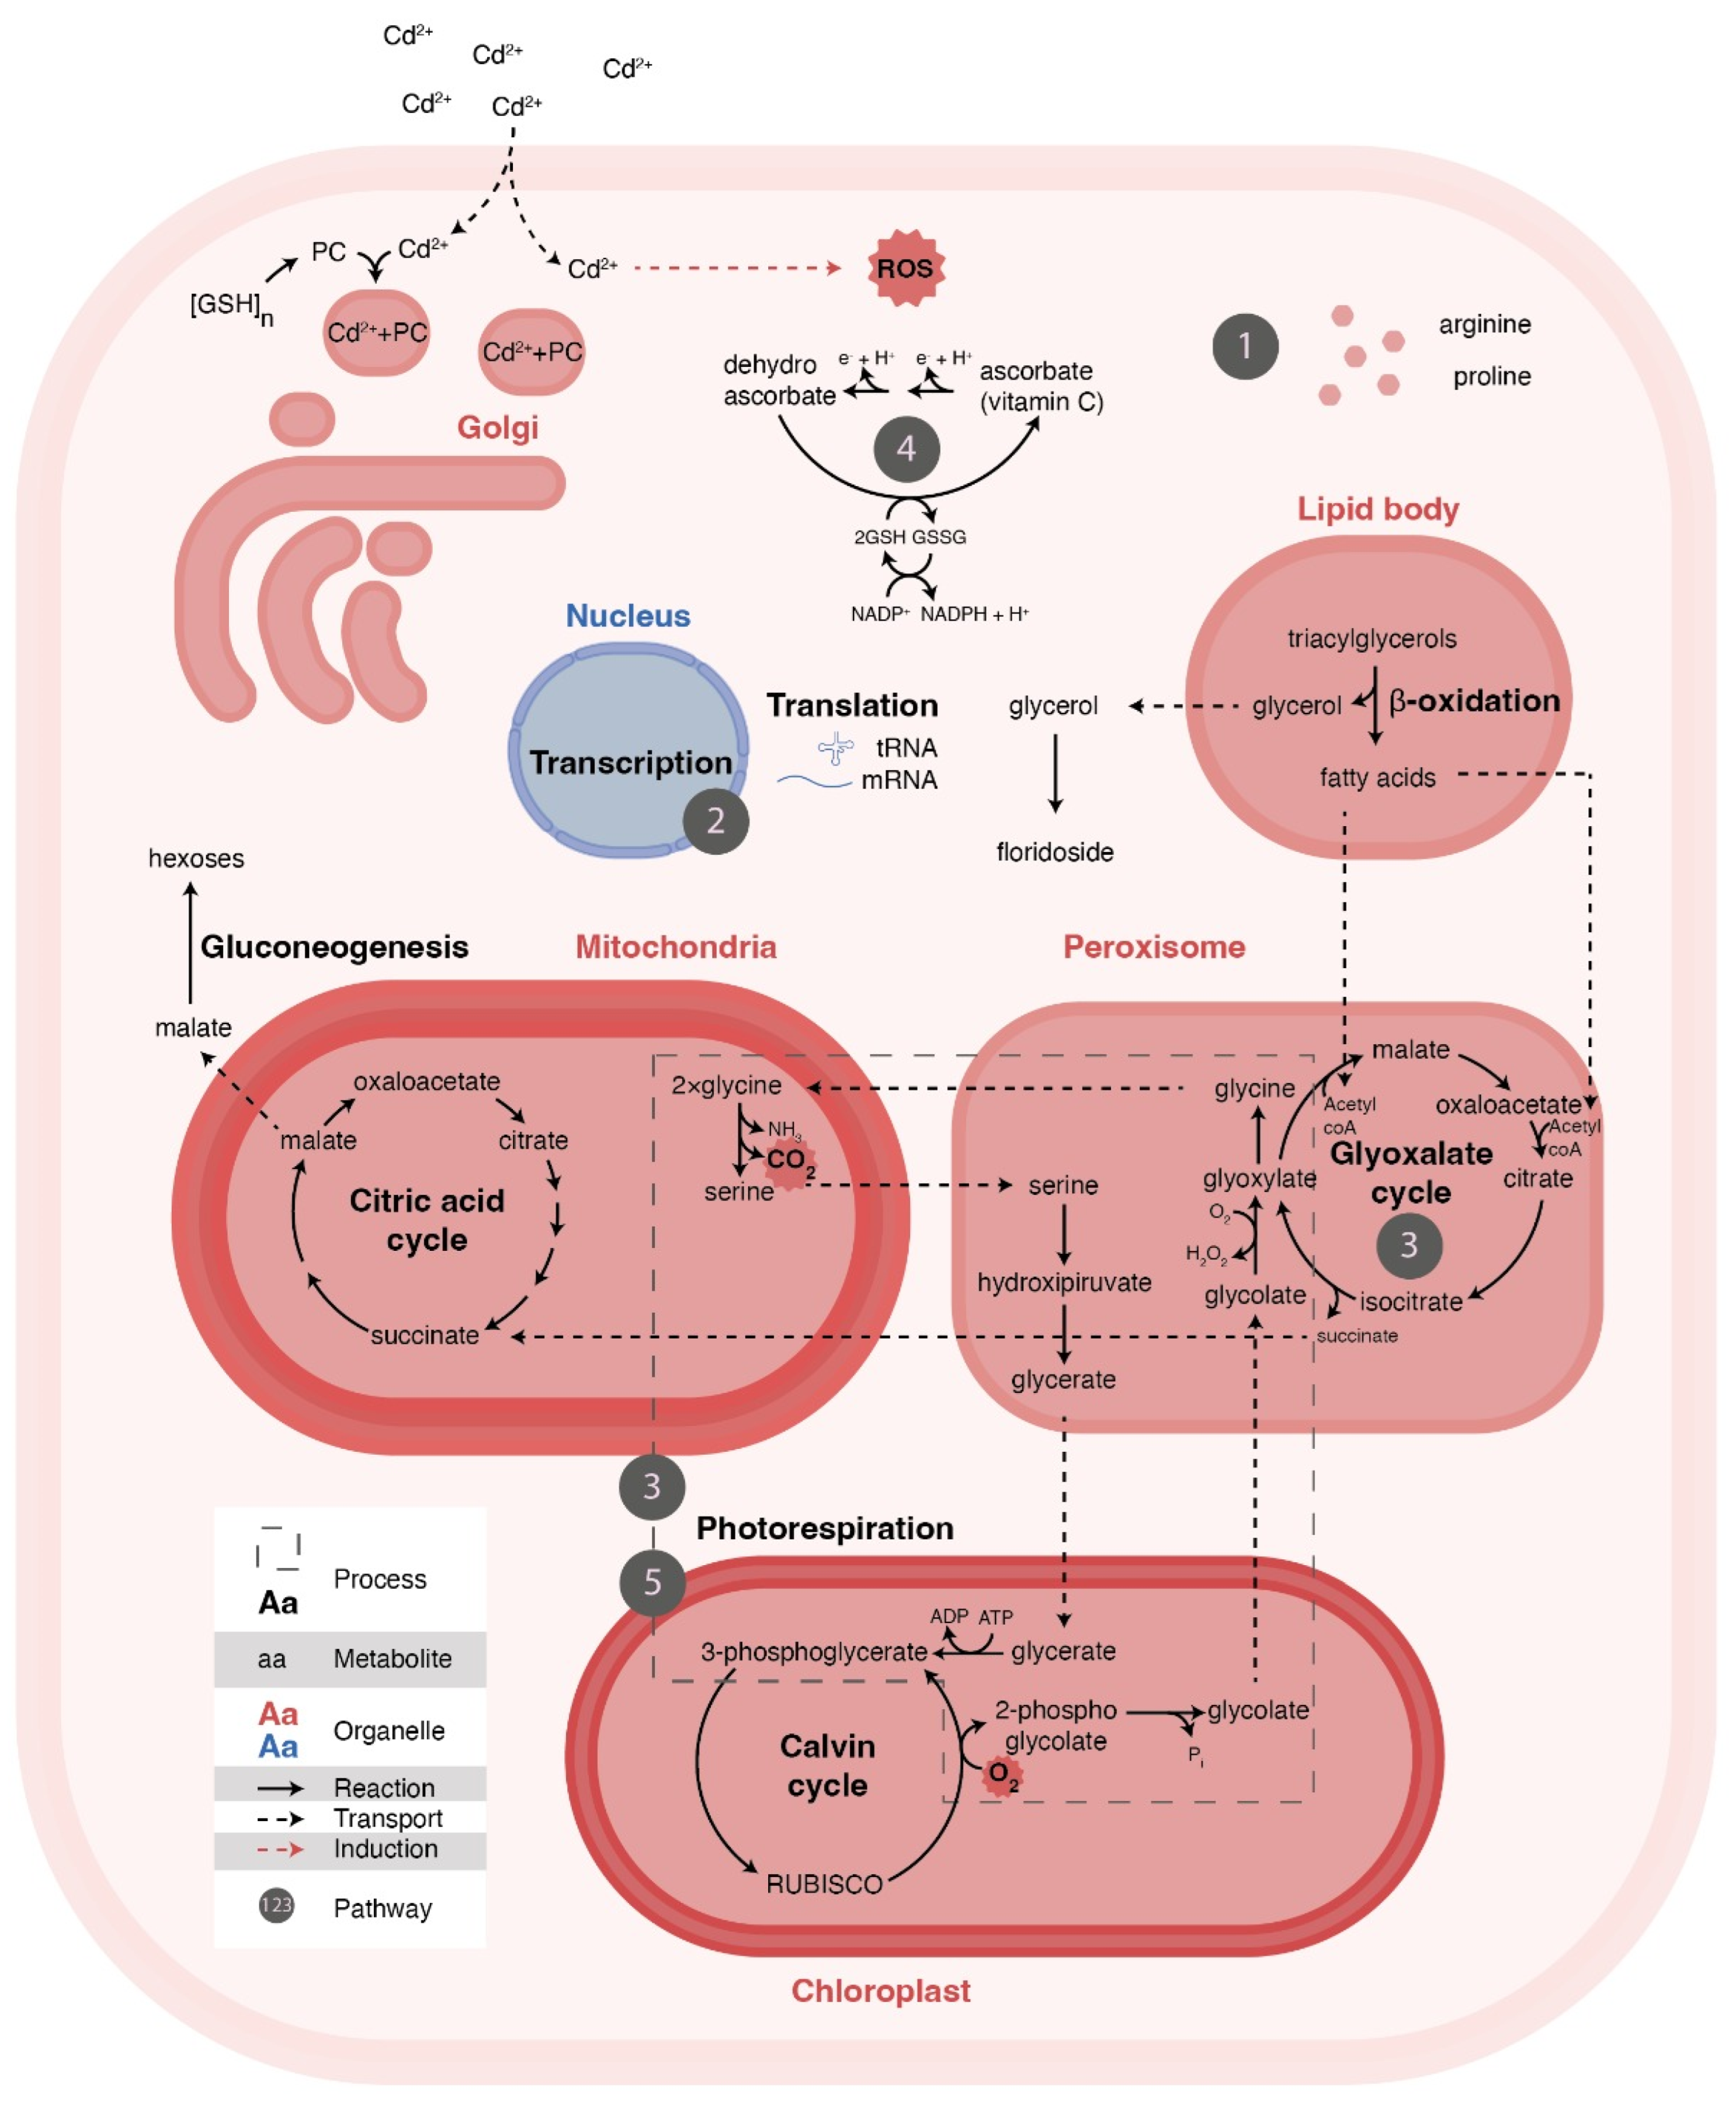
Illustration of the macroalga cell exposed to Cd 2+ (3 mg/L) demonstrating all the metabolic networks and processes related to the altered pathways detected in this study. The numbers represent the pathways identified (Table 2), and all are associated with the displayed cell process related to the cellular response to the oxidative stress caused by the metal.
Figure 5.
Illustration of the macroalga cell exposed to Cd 2+ (3 mg/L) demonstrating all the metabolic networks and processes related to the altered pathways detected in this study. The numbers represent the pathways identified (Table 2), and all are associated with the displayed cell process related to the cellular response to the oxidative stress caused by the metal.


Table 1.
Important metabolites for separating two experimental groups of G. caudata exposed to Cd2+ (0 and 3 mg/L) followed by their respective RT and similarity index (SI). The metabolites marked with asterisk (*) were not included in the pathway analysis.
Table 1.
Important metabolites for separating two experimental groups of G. caudata exposed to Cd2+ (0 and 3 mg/L) followed by their respective RT and similarity index (SI). The metabolites marked with asterisk (*) were not included in the pathway analysis.
| ID | RT | SI |
|---|---|---|
| Acetic acid | 6.55 | 96 |
| Leucine | 7.75 | 97 |
| Norleucine | 8.08 | 97 |
| Valine | 8.58 | 96 |
| Serine | 9.21 | 95 |
| Threonine | 9.72 | 94 |
| Glycine | 9.87 | 95 |
| Decanoic Acid | 10.00 | 76 |
| Malonic acid | 11.25 | 88 |
| Erythritol | 12.49 | 90 |
| Proline | 12.72 | 86 |
| Arabinonic Acid | 15.88 | 75 |
| Unknown * | 15.97 | - |
| Carboxylic Acid * | 16.07 | 91 |
| Citric acid | 16.26 | 92 |
| Ascorbic acid | 17.40 | 89 |
| Talose * | 17.67 | 87 |
| β-D-Glucopyranose | 20.02 | 87 |
| 2-α-D-galactopyranosil Glycerol (Floridoside) * | 20.40 | 92 |
| (2,3-Diphenylcyclopropyl) methyl phenyl sulfoxide * | 22.94 | 87 |
Table 2.
Altered metabolic pathways in G. caudata exposed to Cd2+ (3 mg/L).
| N° | Metabolic Pathway | Total Metabolites of the Pathway | Detected Metabolites | p-Value | Pathway Impact |
|---|---|---|---|---|---|
| 1 | Metabolism of arginine and proline | 31 | Proline | 0.002 | 0.11688 |
| 2 | Aminoacyl-tRNA biosynthesis | 48 | Serine, Proline, Threonine, Glycine, Valine and Leucine | 0.002 | 0.16667 |
| 3 | Glyoxylate and dicarboxylate metabolism | 31 | Acetic Acid, Citric acid, Serine and Glycine | <0.001 | 0.21683 |
| 4 | Ascorbate and aldarate metabolism | 17 | Ascorbic acid | 0.001 | 0.23016 |
| 5 | Metabolism of glycine, serine and threonine | 28 | Serine, Glycine and Threonine | 0.002 | 0.43897 |
Disclaimer/Publisher’s Note: The statements, opinions and data contained in all publications are solely those of the individual author(s) and contributor(s) and not of MDPI and/or the editor(s). MDPI and/or the editor(s) disclaim responsibility for any injury to people or property resulting from any ideas, methods, instructions or products referred to in the content. |
© 2023 by the authors. Licensee MDPI, Basel, Switzerland. This article is an open access article distributed under the terms and conditions of the Creative Commons Attribution (CC BY) license (https://creativecommons.org/licenses/by/4.0/).
Share and Cite
MDPI and ACS Style
Araujo-Motta, L.; Alves-Lima, C.; Zambotti-Vilella, L.; Colepicolo, P. Metabolome of Cadmium Stressed Gracilaria caudata (Rhodophyta). Phycology 2023, 3, 255-269. https://doi.org/10.3390/phycology3020016
AMA Style
Araujo-Motta L, Alves-Lima C, Zambotti-Vilella L, Colepicolo P. Metabolome of Cadmium Stressed Gracilaria caudata (Rhodophyta). Phycology. 2023; 3(2):255-269. https://doi.org/10.3390/phycology3020016
Chicago/Turabian StyleAraujo-Motta, Luiza, Cicero Alves-Lima, Leonardo Zambotti-Vilella, and Pio Colepicolo. 2023. "Metabolome of Cadmium Stressed Gracilaria caudata (Rhodophyta)" Phycology 3, no. 2: 255-269. https://doi.org/10.3390/phycology3020016