Article

A Multi-Faceted Approach to Quantifying Recovery of Stream Phytobenthos Following Acute Herbicide Incidents

by
Helen Rosenkranz
1,*,
Martyn G. Kelly
2,3,
Alexandre M. Anesio
4 and
Marian L. Yallop
5
1
Department of Biology, ABBt—Aachen Biology and Biotechnology, RWTH Aachen University, Worringerweg 1, 52074 Aachen, Germany
2
Bowburn Consultancy, 11 Monteigne Drive, Bowburn, Durham DH6 5QB, UK
3
School of Geography, University of Nottingham, Nottingham NG7 2RD, UK
4
Department of Environmental Science, iClimate, Aarhus University, 2500 Roskilde, Denmark
5
Biological Sciences, Life Sciences Building, 24 Tyndall Avenue, Bristol BS8 1TQ, UK
*
Author to whom correspondence should be addressed.
Phycology 2023, 3(1), 25-46; https://doi.org/10.3390/phycology3010003
Submission received: 1 November 2022 / Revised: 12 January 2023 / Accepted: 13 January 2023 / Published: 20 January 2023

Abstract

:
Phytobenthos, major primary producers in freshwater, may be periodically exposed to herbicides through runoff, spray drift, and leaching, but experimental work on their response to herbicides is limited. Outdoor flumes were used to measure the recovery of intact phytobenthic biofilms, following a short-term pulse to a glyphosate-based herbicide (GBH) and chlorotoluron (CLT), singly or as a mixture (GBHC). Two days following the removal of the herbicides, significant declines in biomass and rates of areal gross maximum photosynthesis were recorded in GBH and GBHC-treated flumes. Herbicide pulses negatively impacted the biomass of phytobenthos, measured as chlorophyll a, which in turn may have alleviated resource limitation, evidenced by significant increases in biomass-specific rates of gross maximum photosynthesis. After 4.5 days, biomass concentrations were similar in controls and treatments, indicating biofilm recovery in the GBH and GBHC biofilms, though the proportion of green algae relative to diatoms was significantly higher in GBH and GBHC-impacted biofilms. Significant increases were recorded in the Trophic Diatom Index (TDI), indicating benthic diatom development along different trajectories, following the herbicide pulse. Collectively, these results indicate greater insights into herbicide impacts on phytobenthos may be gained by working with the whole phytobenthic community.

Graphical Abstract

1. Introduction

Implementation of the Water Framework Directive [1] has been a significant step towards ensuring the sustainability of Europe’s waterbodies. By quantifying the condition of selected biota, relative to their hypothetical ‘expected’ condition, it is possible to identify issues responsible for degradation in waterbodies and then implement appropriate measures to restore them to at least ‘good ecological status’. One of the biotic elements used for assessment as part of this process in freshwater is phytobenthos (attached algae), for which benthic diatoms [2,3,4] or the entire phytobenthic community (detailed in [5]) have been used as assessment tools, now deployed in rivers across Europe. These tools mostly focus on the major pressure of eutrophication [6]. However, rivers and streams in agricultural landscapes receive a cocktail of other stressors, including herbicides, in addition to inorganic nutrients. Herbicides may reach waters from point or diffuse sources [7], and high concentrations may result from storm runoff, leaching and spray drift into rivers and streams draining agricultural landscapes [8,9,10,11], typically subjecting benthic communities to short-term episodic pulses of toxicants or in some locations, more chronic exposures.
A few studies report on the impacts of herbicides on phytobenthos in rivers [12,13,14], but still questions remain. Outside of a controlled laboratory environment, these communities will be subject to multiple stressors, and species may vary in their responses to any one stressor [15]. Evidence suggests that chronic exposure to herbicides in aquatic ecosystems can lead to tolerant species of phytobenthos, which outcompete those that are negatively impacted [16,17]. Guasch [18] suggested that green algal-dominated biofilms are more sensitive to some herbicides than diatom-dominated biofilms, although shifts in the opposite direction from diatoms to green algae have been reported in coastal phytobenthos treated with herbicides [19]. However, most of the studies where the impacts of herbicides are measured have focused on benthic diatoms only, often assumed to be the dominant group in freshwater biofilms [20]. This means that some types of interaction will be neglected; e.g., green algae often dominate in streams in agricultural catchments [21], and Cyanophyta, Rhodophyta, and Xanthopyta are also abundant in some situations [22,23,24]. Given that these major groups of algae may show differences in herbicide tolerance, it is important that non-diatoms (so-called ‘soft-bodied algae’) are also included when evaluating the impacts of herbicides.
Sensitivity to herbicides may depend on the successional stage of the biofilm [25]. Starting from a thin organic film on substrata, biofilms develop a complex, multi-layered architecture over time [22,26], within which interspecific competition for resources occurs. Motile species can move through gradients within the biofilm to optimise growth conditions. This means that studies that focus on measuring and interpreting the impacts of herbicides using single-species laboratory toxicity tests may be of limited use in determining likely outcomes of herbicide exposure in multi-species natural assemblages growing in the field [27]. Furthermore, most toxicity testing is undertaken with continuous exposure of the organisms to the toxicant, whereas in the real world, organisms are more likely to be exposed to pulses in rivers and streams.
In this study, we examined the impacts of two herbicides using outdoor flumes to quantify their impacts on intact riverine phytobenthic biofilms. Herbicides with different modes of action were selected: glyphosate in the formulation Roundup®, a broad-spectrum systemic herbicide, and chlorotoluron, a herbicide used to control broadleaf and annual grass weeds. Glyphosate is now said to be the most-used herbicide worldwide [28]. Its pervasiveness has led to increasing concerns about risks to human health [29] and other non-target species [30]. Many countries have banned glyphosate for non-commercial usage, and currently, there is an imminent ban on glyphosate in the European Union [31]. However, glyphosate usage in agriculture is still increasing [32]. Additionally, increased usage of chlorotoluron in recent years has led to greater concern questioning its safe usage in, and impacts on, the environment [33,34]. Both herbicides are now widespread contaminants of aquatic ecosystems [35,36].
The two herbicides were applied singly and in combination, and stream biofilms were exposed for a limited time period to better mimic field exposures. Flumes were replenished with fresh river water through the recovery period. Impacts on the structure and functioning of these assemblages were undertaken using concentrations pre-selected based on reported EC50 values obtained in single-species experiments. We address whether it is possible to identify herbicide-specific responses of the phytobenthos in the field. We then discuss the implications of this when using phytobenthos for ecological status assessment.

2. Materials and Methods
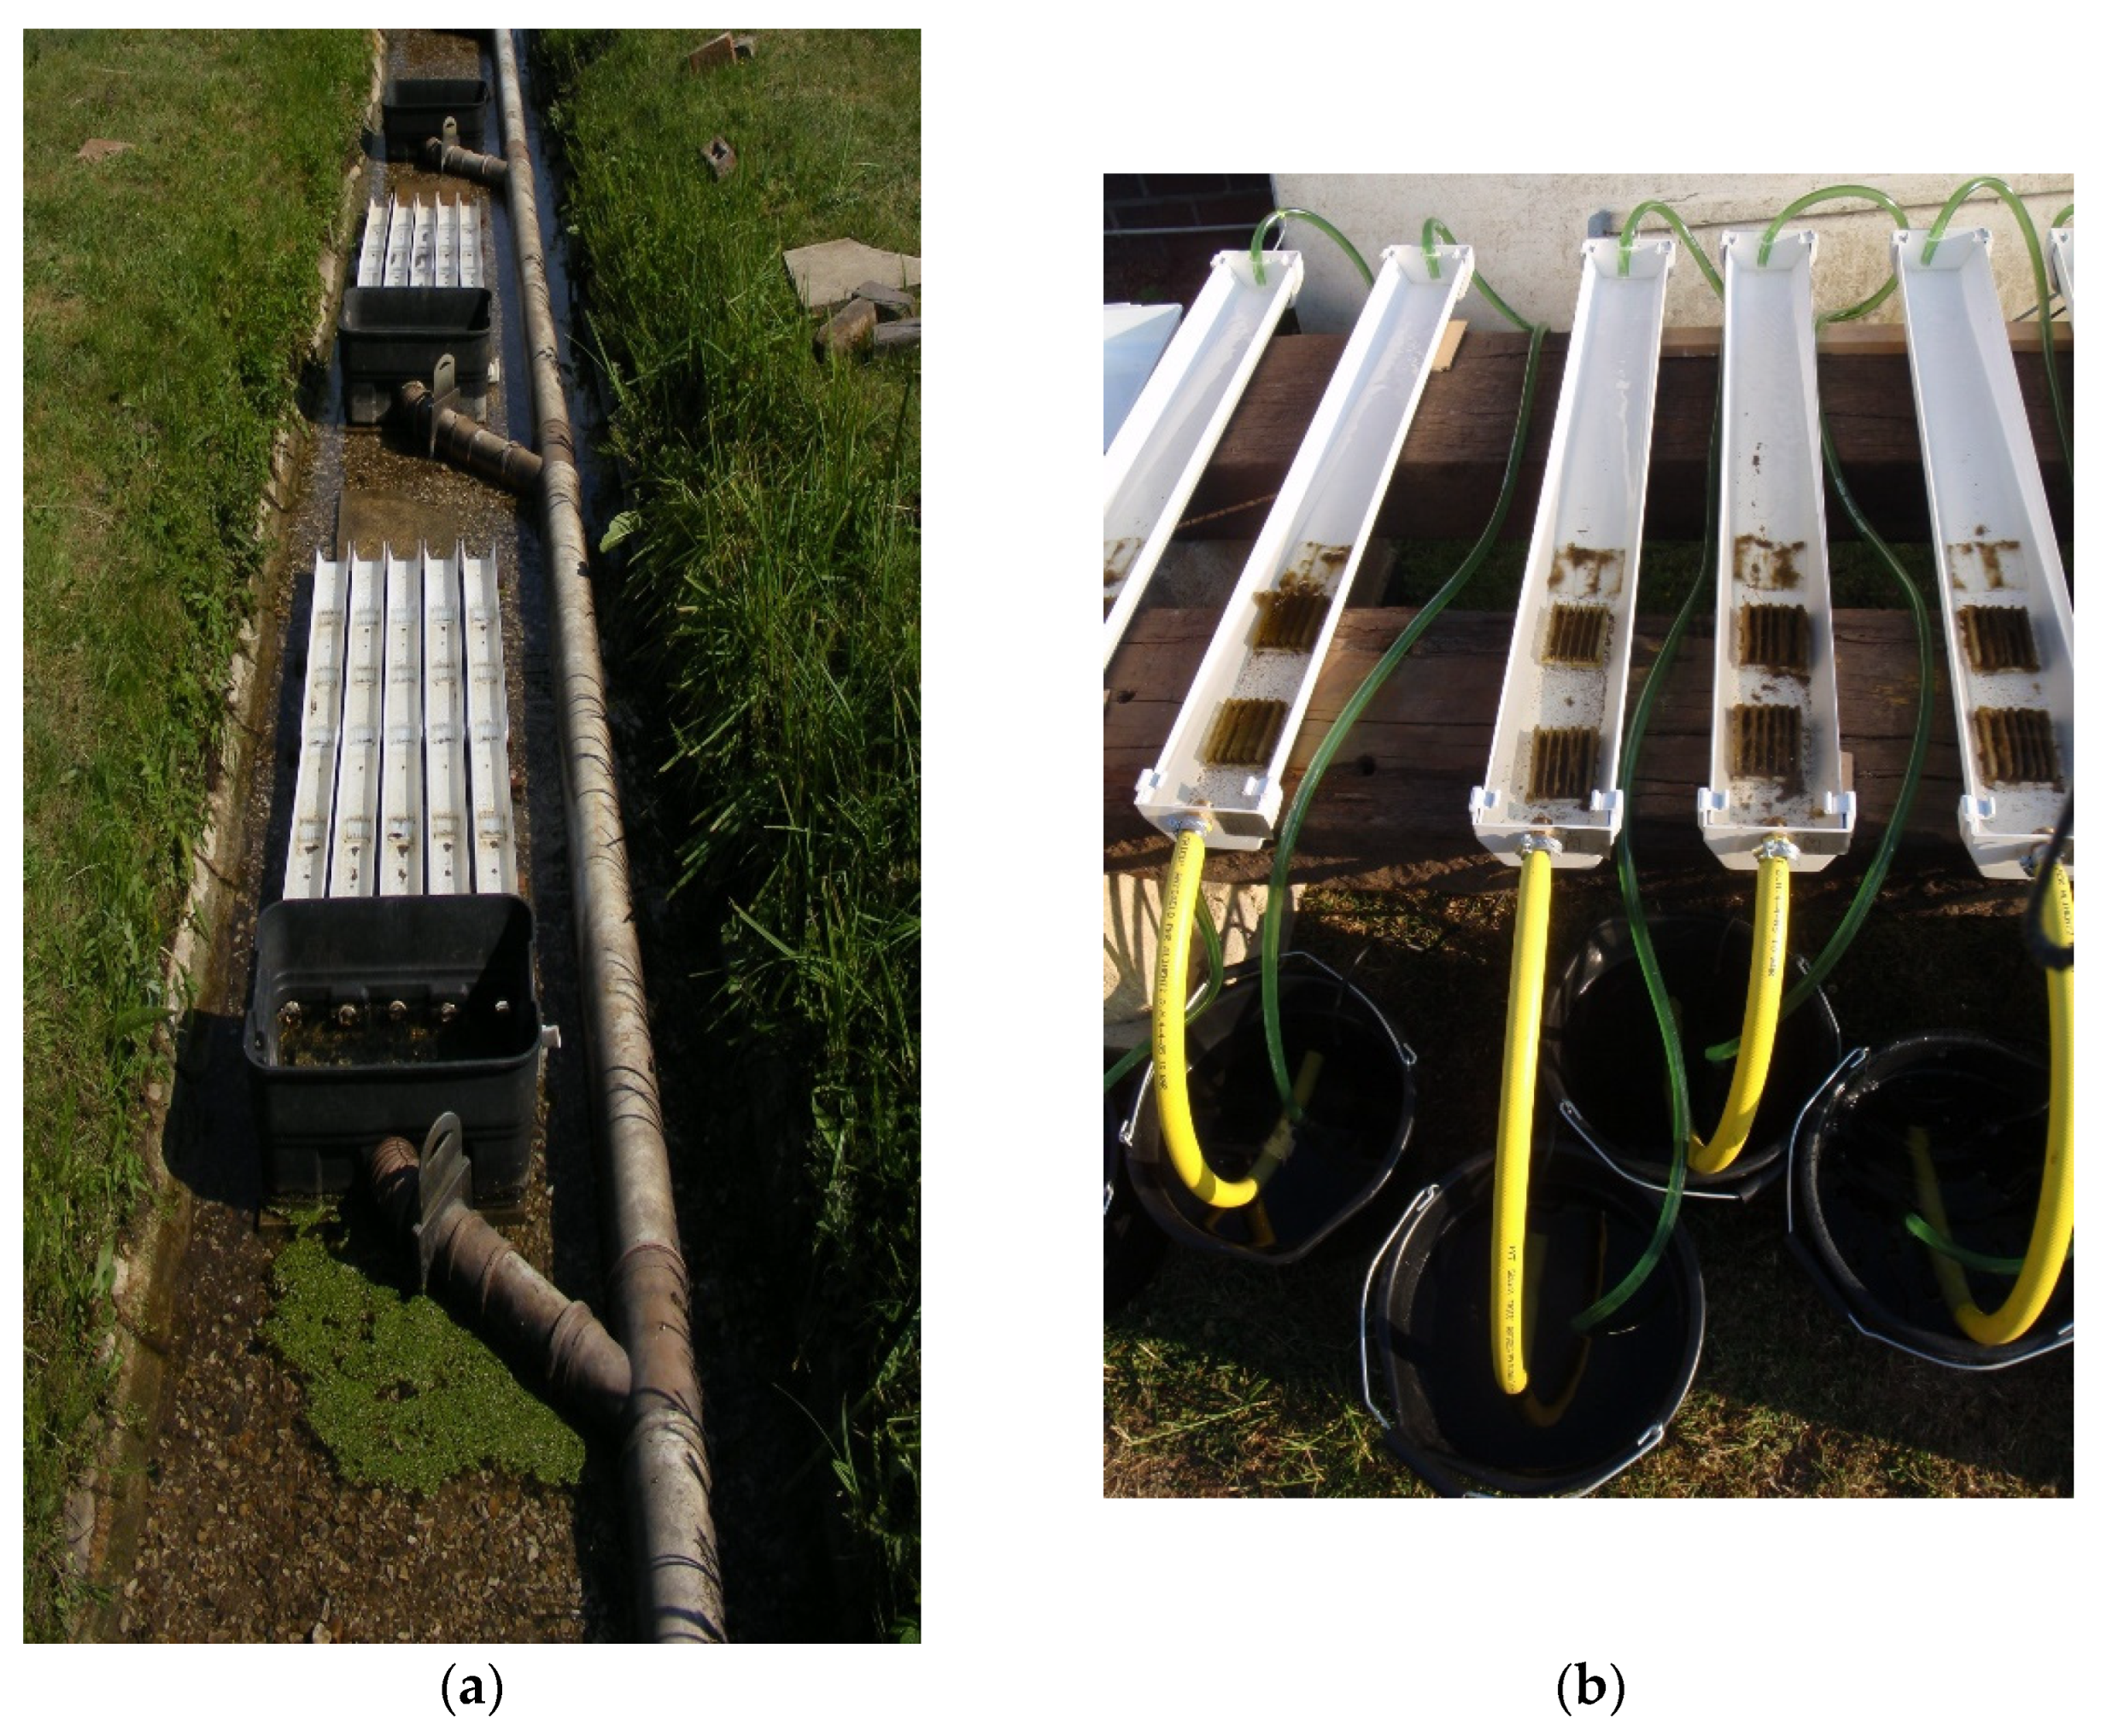
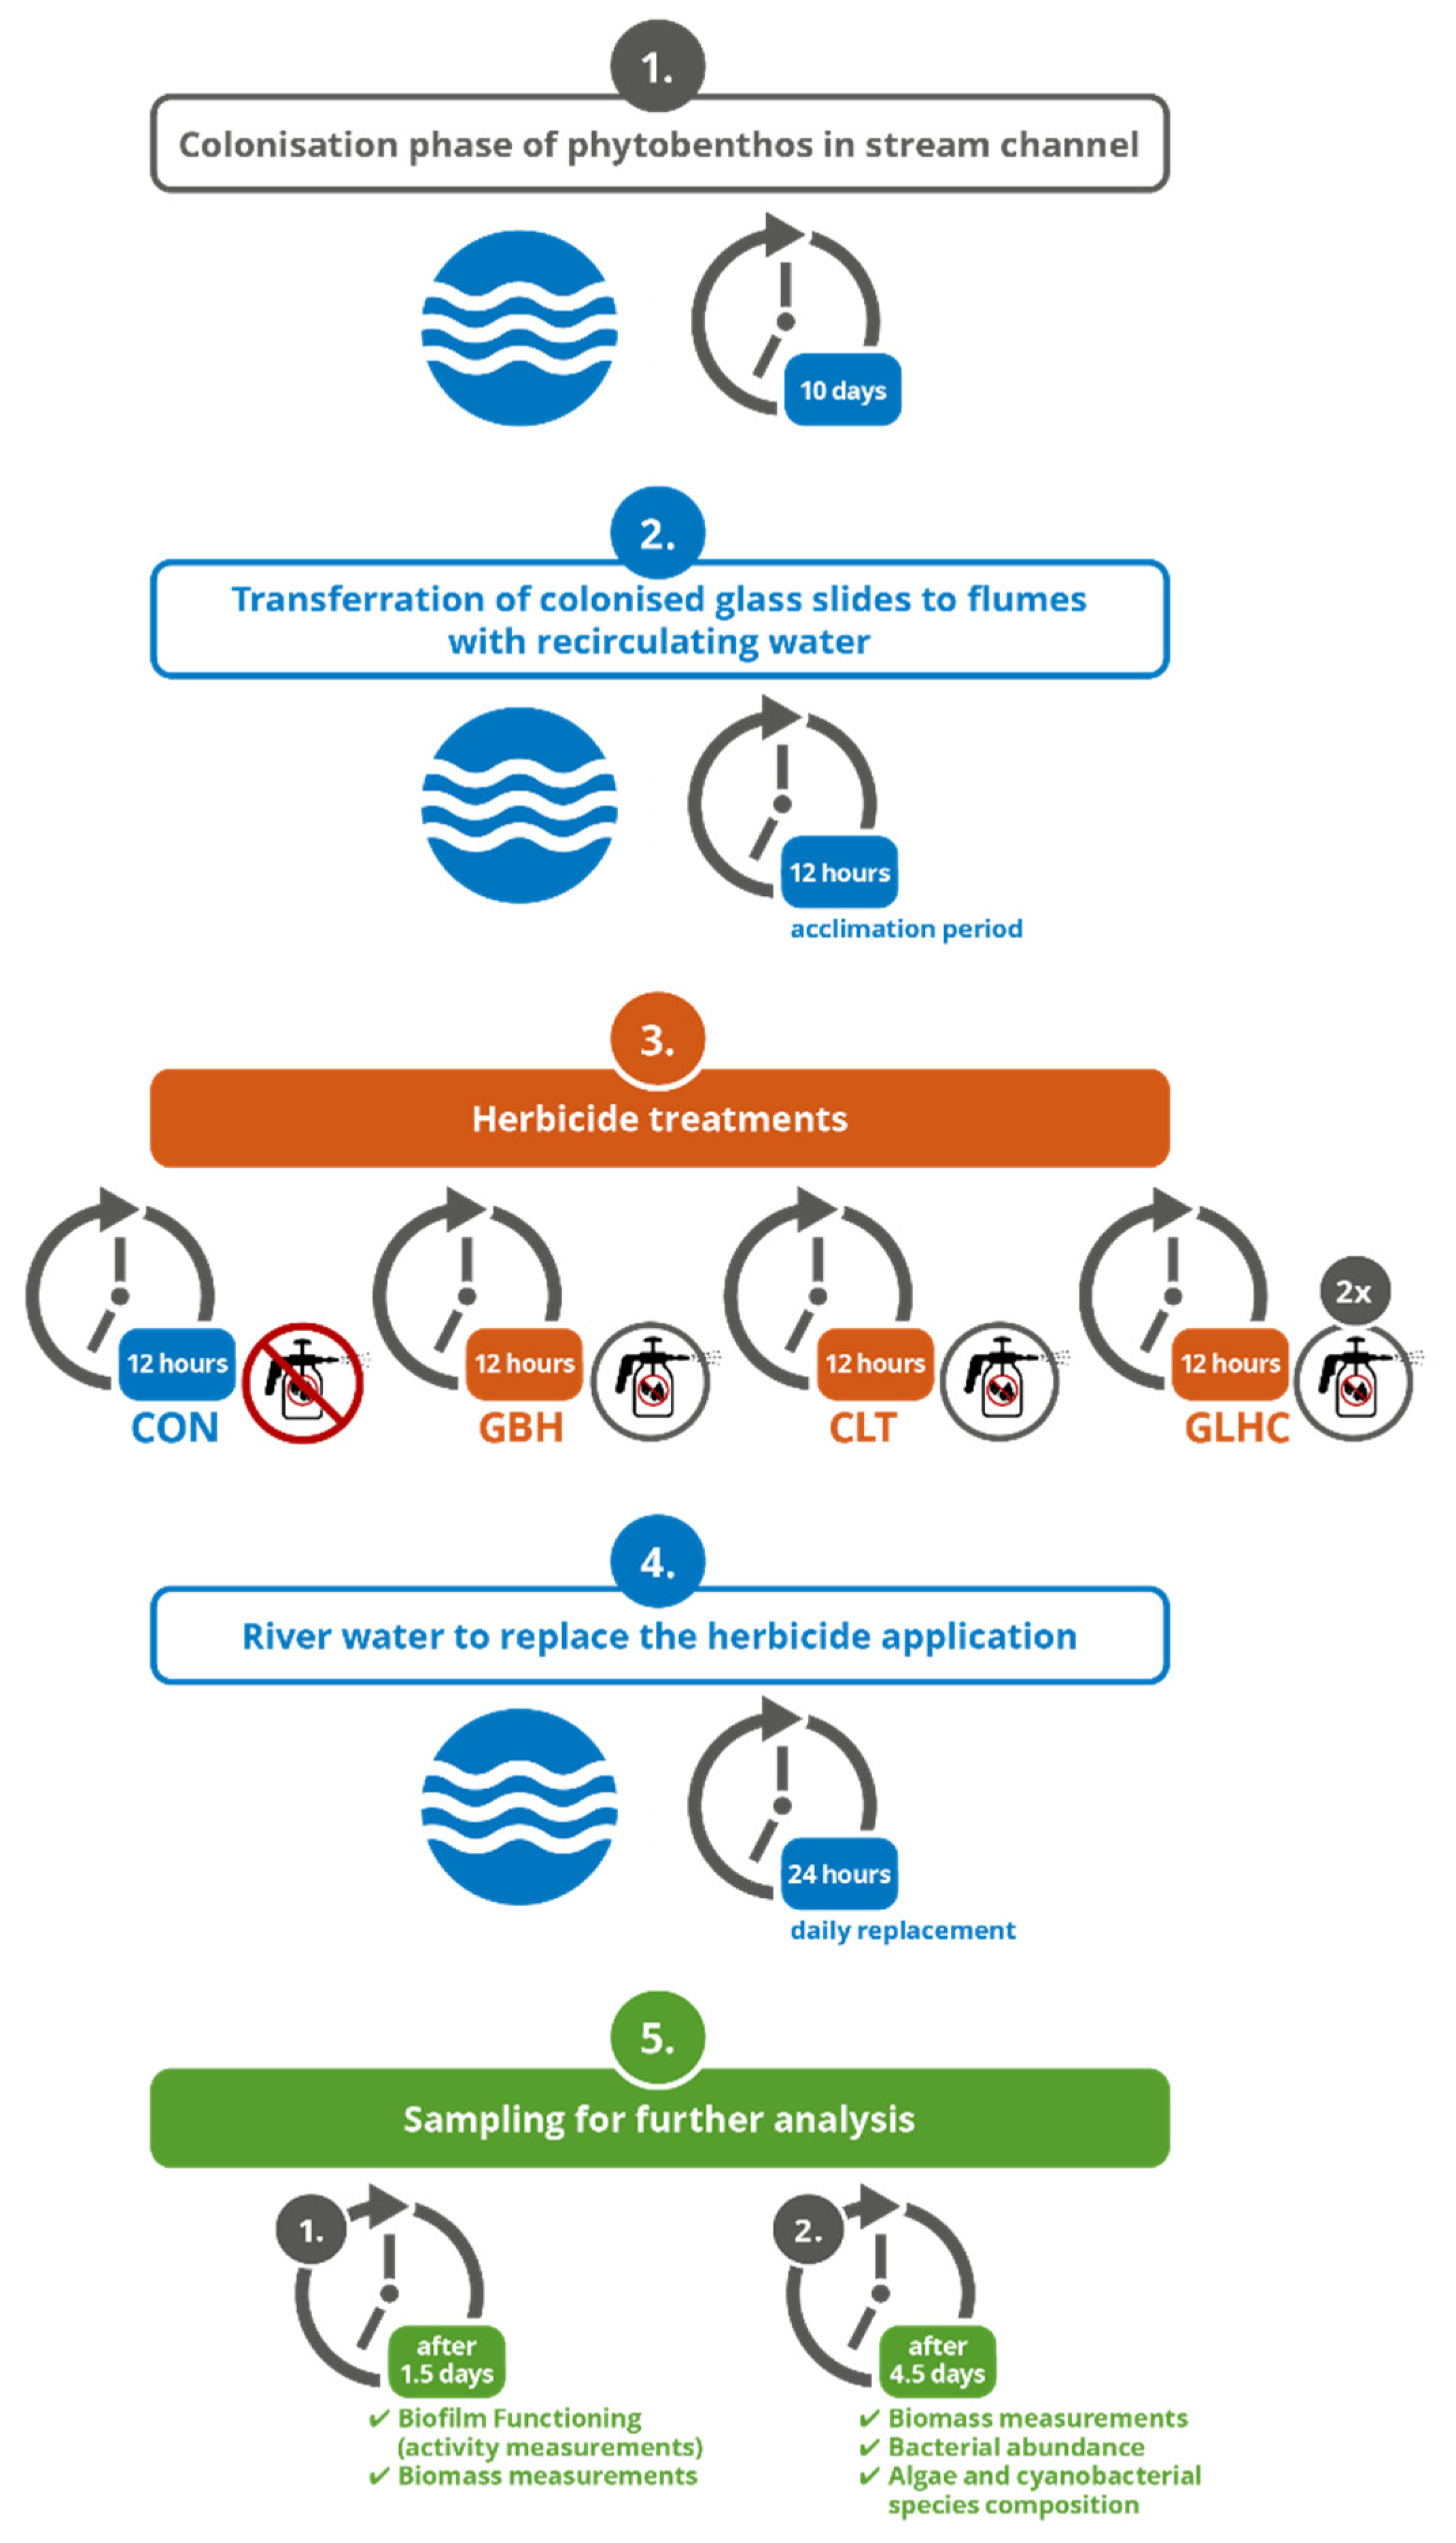
Phytobenthos were grown in gravity-fed experimental stream channels fed directly from the Mill Stream, a tributary of the River Frome, Dorset, UK (50°40′48′′ N, 2°11′06′′ W), located on the site of the former Freshwater Biological Association River Laboratory. These channels have previously been used for experimental purposes and have been shown to support the growth of representative communities of algae and macroinvertebrates [37]. Agricultural usage in the catchment includes permanent grassland with dairy or stock rearing and cereal cultivation (Wessex Water, pers. comm). Glass slides were used to grow phytobenthic biofilms. These have been demonstrated to act as suitable substrates for colonization by microalgae [38]. Eight semi-glazed slides were located in purpose-built slide holders (phytometers), twenty of which were placed in the stream channels and left to colonise for ten days (Figure 1a).

2.1. Flume Design

It was not possible to make direct applications of herbicides into the stream channels as the river water which fed these was released directly back to the parent stream. Consequently, purpose-built self-contained flumes were set up alongside the experimental stream channels, modified from the design of Gold et al. [39]. Twenty flumes, each 1 m in length, were individually fed by a 14 L reservoir of unfiltered river water, recirculated through each channel by means of a pump (Minipond 900 m Blagdon, Dorking, UK) (Figure 1b). Following the initial colonisation phase of phytobenthos in the stream channels, slide holders housing the colonised slides were transferred to the flumes and left to acclimate for a period of 12 h. Allocation of each slide holder and allocation of herbicide treatments between the twenty flumes were randomised. Three additional colonised slides were randomly allocated to each flume for measurement of photosynthesis and respiration rates.
After a 12 h acclimation period, herbicides were added, and biofilms were exposed for a 12 h period spanning daylight hours. Five control flumes received river water only (CON), five were dosed with glyphosate (GBH), five with chlorotoluron (CLT), and five received both herbicides in the same concentrations as the single application treatments (GBHC). Glyphosate (Monsanto UK, Limited) was applied as the formulation Roundup® to give a final concentration of 64.7 mg L−1 of the active ingredient (Isopropylamine salt of glyphosate), in line with the reported EC50 value determined for the green alga Raphidocelis subcapitata [40]. The formulation also contained the surfactant polyoxyethylene tallow amine (POEA). Chlorotoluron (analytical grade, PS2078, Supelco; Sigma-Aldrich Company Ltd., Gillingham, UK) was applied to give a final concentration of 8.5 µg L−1, in line with EC50 value reported for Raphidocelis subcapitata [41]. Short-term pulses of herbicides are common when heavy rainfall follows herbicide application in river catchments [10]; hence, a 12 h exposure period represented a realistic scenario. River water from the Mill Stream was used to replace the herbicide application at the end of the exposure period, after which further exchanges with fresh river water were made every 24 h to allow for recruitment of new cells to the phytobenthic biofilms [42].
A portable pH meter (H198185, Hanna Instruments, Woonsocket, RI, USA) was used to monitor the pH of the flume reservoir water throughout the incubation period. The average pH was 8.3 (standard error = 0.02 pH units) and did not change in any of the herbicide treatments compared to the untreated controls. Activity measurements were conducted after 36 h following the removal of the herbicides. At the end of the experiments (4.5 days after the removal of the herbicides), all phytobenthic biofilms were removed from the slides using a sterilised toothbrush. Biofilm material from eight slides within each flume was pooled, homogenised to slurries, and subsampled to determine the biomass and species composition within each flume.
Figure A1 shows a schematic overview of the study design.

2.2. Biofilm Functioning (Activity Measurements)

Metabolic functioning (photosynthesis and respiration) was measured over a day, with the first measurements made 36 h post-herbicide removal. A Hansatech Chlorolab 2 system (Hansatech Instruments, Norfolk, UK) with a DW2/2 liquid-phase chamber run in dark and light conditions was used to measure rates of photosynthesis and respiration on homogenised subsamples, using samples from the additional colonised slides with a replicate taken from each set of the five flumes. A circulating water jacket around the incubation chamber maintained a constant temperature of 20 °C, the ambient temperature in the flumes. Subsamples were stirred constantly with a magnetic stirring bar. Light was supplied with LH11/2R red LEDs, and calibration of the light source was undertaken using a QRT1/PAR light sensor (Hansatech Instruments Ltd., Norfolk, UK). Field measurements of irradiance were taken beside the flumes using a Li-250 cosine-corrected probe (Li-Cor, Nebraska, USA). Ten steps of increasing irradiance were set for lab-based measurements to a maximum irradiance of 1372 µmol photons m−2 s−1. Standard plots of gross photosynthesis versus irradiance were produced, and the theoretical coefficient of light-use efficiency (α), the maximum photosynthetic rate (Pmax), and the light saturation parameter (Ik) were determined using the hyperbolic tangent model equation of Jassby and Platt [43].

2.3. Biomass Measurements

To normalise the photosynthesis and community respiration rates, sub-samples of the homogenate were used to determine algal biomass, using total chlorophyll a (Chl. a) and ash-free dry mass (AFDM).
At the end of the experiment (4.5 days), additional fresh slides were sampled for biomass measurements. For estimates of dry mass (DM), subsamples were filtered onto pre-ashed Whatman GF/F filters (47 mm) and dried at 105 °C for 24 h (n = 20, with 5 replicates per treatment). Filters were subsequently placed in a muffle furnace for 2 h at 500 °C for determination of organic content as AFDM. Chlorophyll (Chl. a) was determined by filtering a known volume of suspension through a Whatman GF/F filter. The filters were placed in a 15 mL conical tube and frozen at −20 °C to be stored and transported back to the lab for further processing. Pigments were extracted in pre-chilled acid-free 100% ethanol in an ice bath working in the dark. The absorbance was measured at 665 nm and 750 nm using a spectrophotometer (UVmini1240, Shimadzu, Kyoto, Japan). Pigment concentrations were calculated following Lorenzen [44] and adjusted for surface area of colonisation. Rates of photosynthesis were normalised to biomass using Chl. a whilst rates of community respiration were normalised using AFDM and Chl. a. Biomass measurements were used to calculate yields at the two selected times during the experimental period.

2.4. Bacterial Abundance

Bacterial abundance was determined using epifluorescence microscopy [45,46]. Subsamples were collected at the end of the experiments (4.5 days) and filtered on 0.22 µm black polycarbonate filters, stained with DAPI (Invitrogen, Life Technologies), and imaged using an Olympus BX41 epifluorescence microscope with an F-view attachment (IICCD camera (Olympus). Cells were counted using the cell image analysis software CellProfiler [47,48] and adjusted for surface area.

2.5. Algae and Cyanobacterial Species Composition

Subsamples of the pooled biofilm material were preserved in glutaraldehyde (2% final concentration). Areal-based densities were determined using a Sedgwick-Rafter Cell Counting Chamber and an inverted microscope (Wilovert, Wetzlar, Germany) following Brierley et al. [49]. Observations and measurements on uncleaned material were made at magnifications of 40×, 100×, and 400× to cover the size range of species. Where possible, identification was carried out to genus or species level using a variety of keys and guides, including Cox [50] for Bacillariophyta, whilst Gutowski and Foerster [51,52] were used for cyanobacteria and green algae. Nomenclature was adjusted to current norms using Algaebase [53]. At this level of magnification, it was impossible to identify all organisms to species, and some operational taxonomic categories were devised. Small spherical green algae (5–13 µm diameter) are described in this study as unidentified Chlorophyta, as no correct phylogenetic classification was possible using light microscopy [54,55,56]. Benthic diatoms identified for uncleaned material were assigned to one of four guilds, including motile, adnate/short-stalked, erect, and filamentous. Cell biovolume was determined according to the formulae devised by Hillebrand et al. [57]. Areal cell densities (cells cm−2) and biovolume (μm3 cm−2) were calculated for biofilms, randomly selected from three of the five replicate flumes for each of the treatments and the controls (n = 15, with three replicates for each treatment). Based on the cell numbers and biovolume, the relative abundance and biovolume of the individual species were calculated. By grouping the taxa, total and relative cell numbers and biovolume for three different phyla, Chlorophyta, Bacillariophyta, and Cyanophyta, hereafter referred to as greens, diatoms, and cyanobacteria, were investigated.
For higher resolution, sub-samples of biofilm material were digested to determine the relative abundance of cleaned diatom valves to species where possible, and data were subsequently used to further explore differences in assemblages. Subsamples of biofilms from each of the channels (n = 20, with five replicates for each treatment) were prepared following standard methods for removal of organic matter [2]. A minimum of 300 valves were identified and their relative abundance was determined by light microscopy using a Leica DLM 500 at a magnification of 1000×. Diatoms were identified to species where possible.
Some difficulty was experienced when distinguishing between some small (<10 µm in length) and often poorly silicified naviculoid diatom species using light microscopy. A category was created designated ‘sNav’, which included Mayamaea atomus, Sellaphora nigri (formerly Eolimna minima), Fistulifera saprophila, and other poorly resolved taxa that fell within the same size range. Difficulty in confidently assigning some of the Nitzschia to species level led to the creation of a second category, designated ‘Niag’, which included Nitzschia. cf. capitellata and N. cf. intermedia forms that overlapped in size and other features. The Trophic Diatom Index (TDI), an overall indication of inorganic nutrient enrichment, was determined using DARLEQ [2].

2.6. Data Analyses

Data were checked for compliance with parametric testing prior to analyses. Homogeneity of variance was tested using Levene’s test, and normality of residuals was tested using the Kolmogorov–Smirnov test. Analysis of variance (ANOVA) was performed to look for differences between measures of biofilm biomass and activity. Post hoc Dunnett’s tests were applied to identify differences between phytobenthos in the control flumes and treatments (p = 0.05). A non-parametric difference test (Kruskal–Wallis) was applied for data that could not be transformed. Where appropriate, Mann–Whitney (M–W) tests were carried out subsequently to identify differences between groups. Spearman’s rank (SR) correlations (R) were carried out for comparisons on selected biotic variables. Tests for significance were carried out using Minitab (version 19).
The entire phytobenthos assemblage, based on cell biovolume, and a sub-set, using the relative abundance of cleaned diatom frustules as proxies for the entire assemblage [5], were ordinated using Non-metric multidimensional scaling (NMDS) with sparse species, i.e., those occurring in 4 or less samples, removed. Bray–Curtis similarity measures and MRPP were used to identify between treatment group significance. Both data sets were analysed using Pisces software Community Analysis Package (CAP), version 6.2.4, (Pisces Conservation Ltd., New Milton, Hants, UK) for NMDS and PC-ORD, version 6 (Wild Blueberry Media LLC, Corvallis, OR, United States) for MRPP, respectively. Bubble plots were used to visualise between group differences of selected taxa in the cleaned diatom sub-set using the Pisces software. For the cleaned diatom data set, TWINSPAN analysis was applied to identify species contributing to group splits and Spearman’s Rank correlations were carried out between the NMDS sample scores along Axis 1 and 2 and the Trophic Diatom Index (TDI) scores [4].

3. Results

3.1. Short-Term Responses of Herbicides on Phytobenthos

3.1.1. Areal Biomass

Thirty-six hours after the removal of the herbicides, areal biomass measured as Chl. a, in biofilms exposed to CLT, was similar to concentrations in unamended control samples (CON) (Table 1). Post hoc tests indicated that Chl. a concentrations were significantly lower in the biofilms treated with GBH and the combined application, GBHC, compared to controls (ANOVA, F(3,16) = 11.92, p < 0.001). Significant differences were also recorded in the dry mass (DM) of biofilms (ANOVA, F(3, 16) = 6.31, p = 0.005) 36 h into the recovery period. Biofilms from CON channels had a higher mean dry mass compared to GBH and GBHC treatments, but no difference was recorded between controls and CLT treatments (Table 1). Similarly, mean ash-free dry mass (AFDM) was significantly different between treatments (ANOVA, F(3,16) = 5.22, p = 0.012), with post hoc tests indicating that the AFDM of CON samples was significantly higher than biofilms treated with GBHC (Table 1).

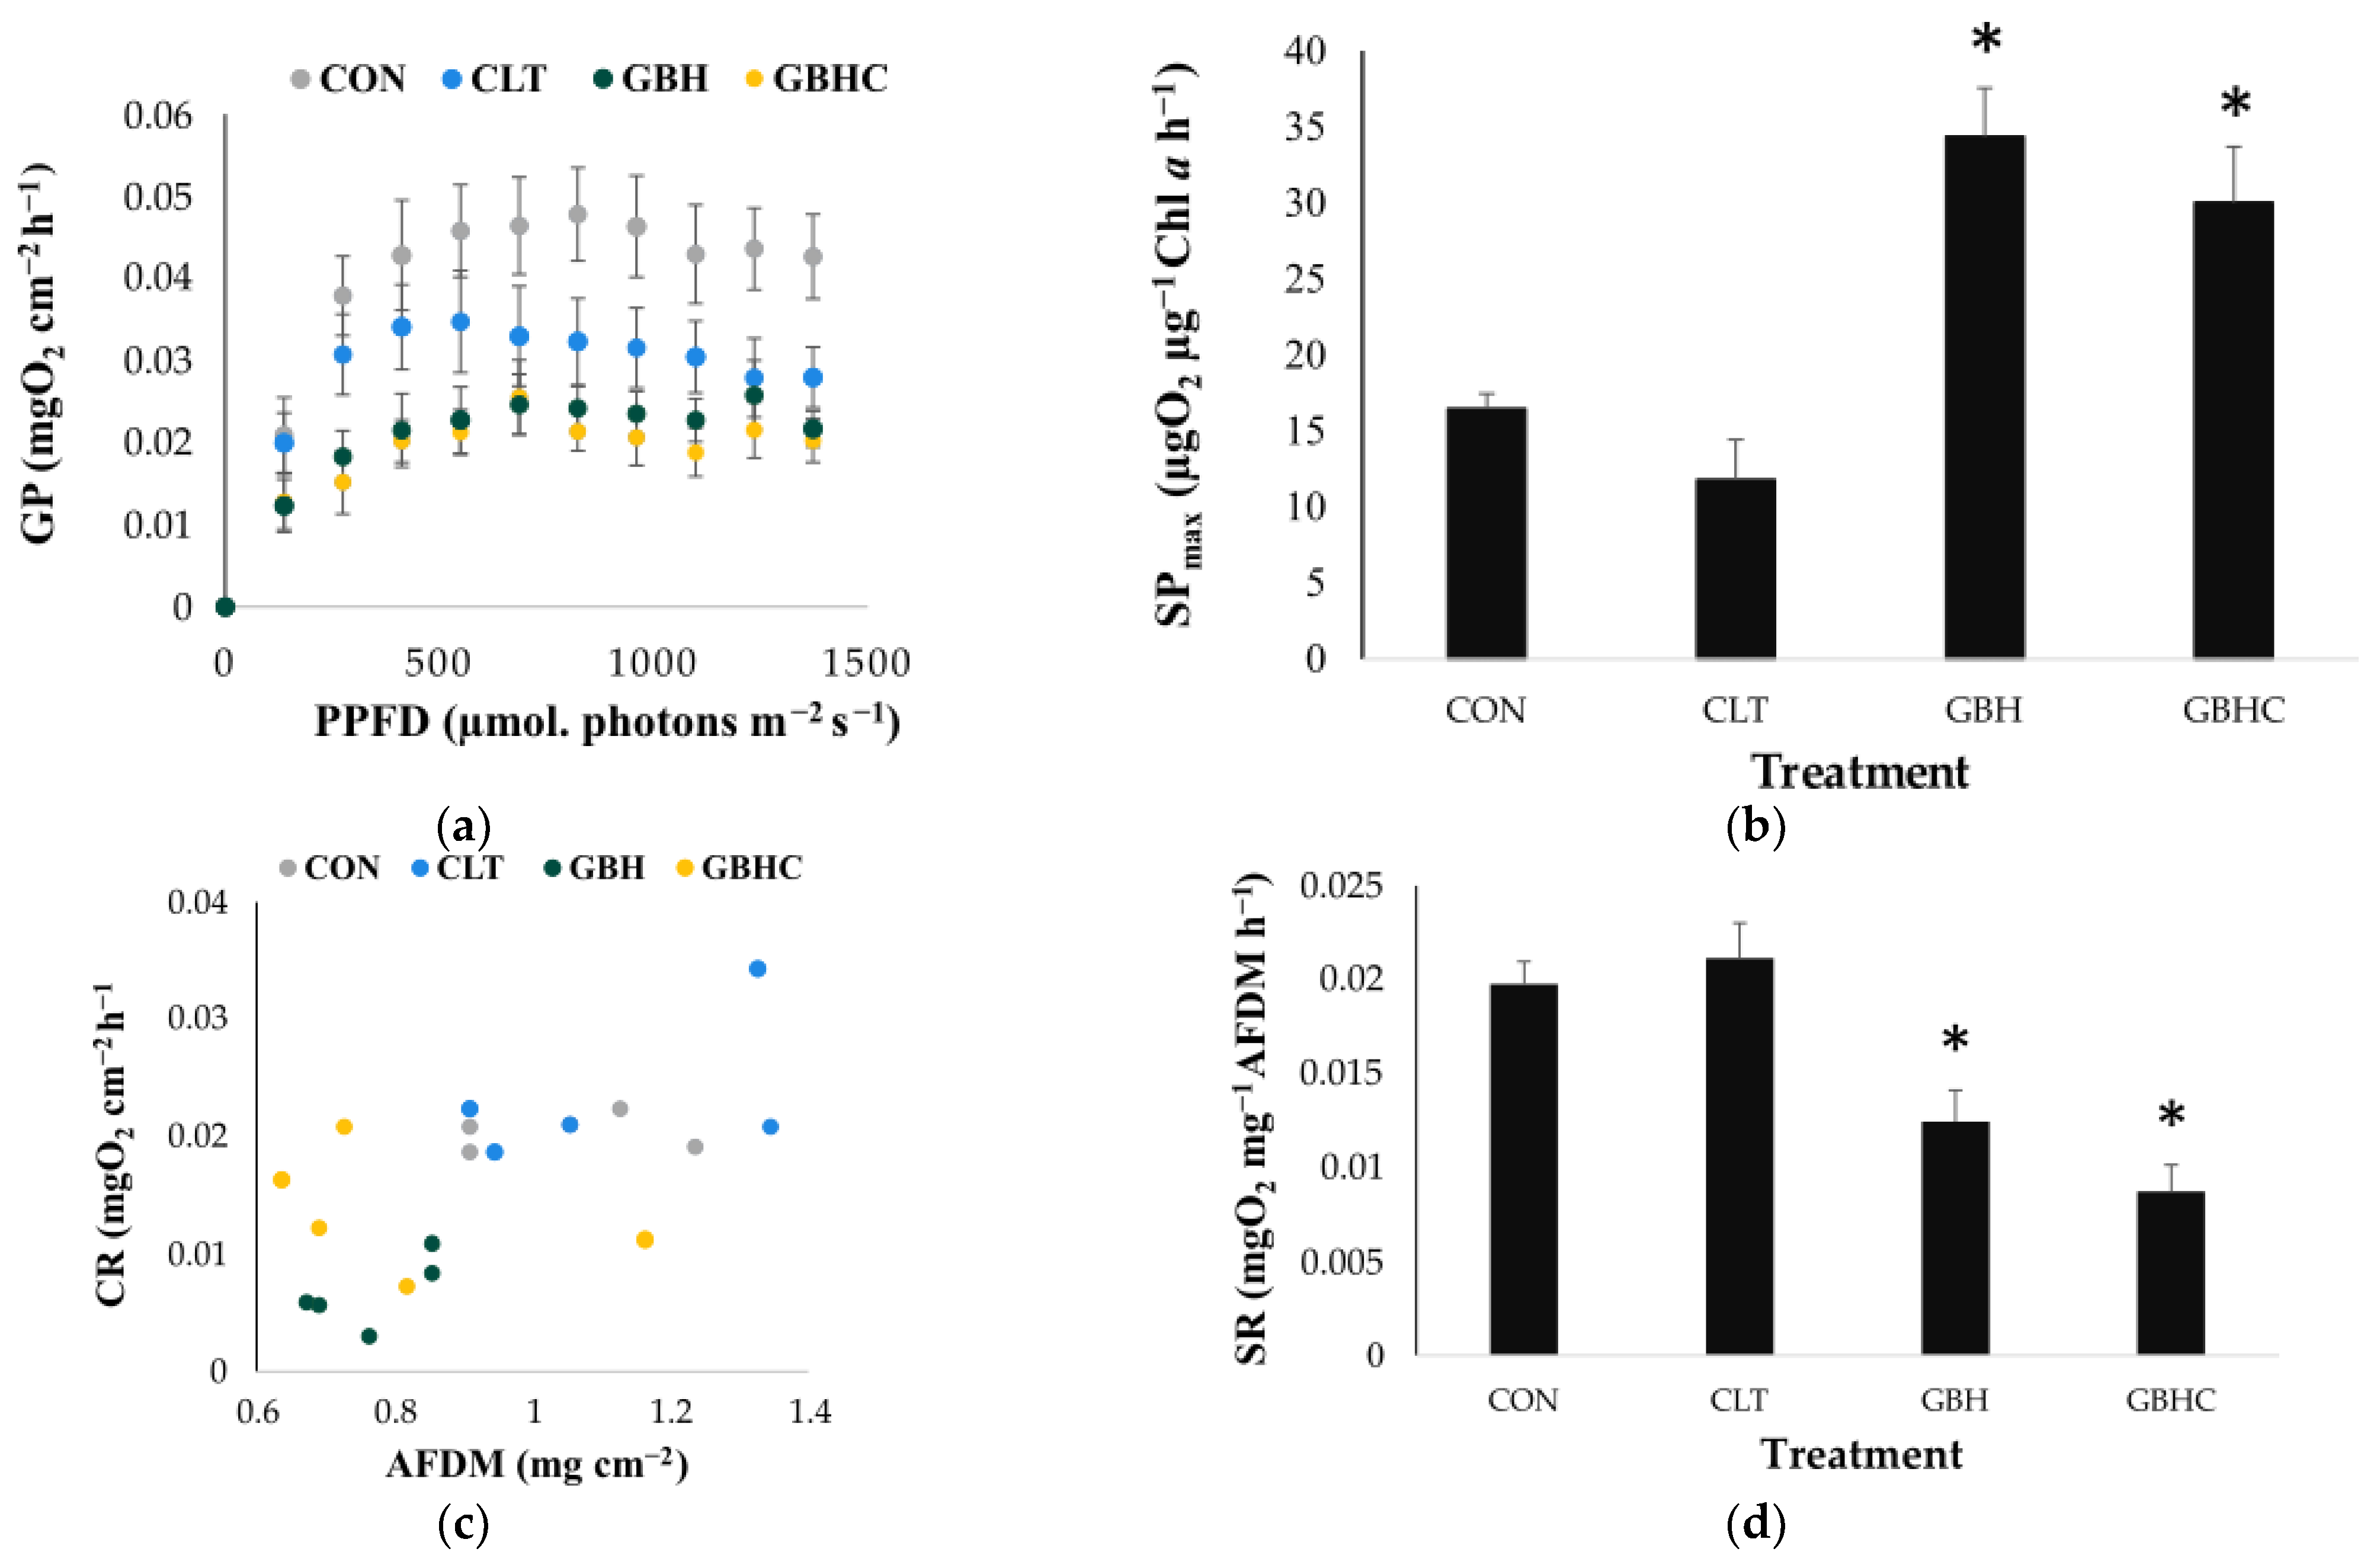
3.1.2. Metabolic Responses to Herbicide Treatments

Photosynthesis versus irradiance curves for areal rates of gross photosynthesis, following a 36 h recovery period, are illustrated in Figure 2a. A significant difference was measured in the maximum rates of areal gross photosynthesis (GPmaxarea) derived from the plots (ANOVA, F(3,12) = 6.43, p = 0.005). Post hoc tests indicated reduced values for GPmax in GBH- and GBHC-treated phytobenthos compared to the controls, with a 44% and 55% reduction in the mean GPmax rates, respectively, but no differences in CLT samples relative to controls. A weak significant difference was recorded for the light utilisation coefficient (a) (ANOVA, F(3,12)= 3.52, p < 0.05), but no differences were identified between treatments and controls in post hoc Dunnett tests. No significant differences were found for the light-saturation coefficient (Ik) between controls and any treatments.
When normalising to biomass (Chl. a), the maximum rate of biomass-specific photosynthesis (SPmax) was about two times higher than controls with a mean ± SE of 34.4 ± 3.2 and 30.1 ± 3.7 mg O2 mg−1 Chl. a h−1) in GBH and GBHC treatments, respectively (ANOVA, F(3,13) = 14.06, p < 0.001; Figure 2b).
Areal rates of community respiration were correlated to the biomass (Figure 2c; Spearman Rank correlation = 0.812, p < 0.001), but there was considerable within-group variation. Significantly higher rates were measured for CON biofilms compared to those treated with GBH and GBHC treatments when normalised to AFDM (Figure 2d; ANOVA, F(3,16) = 17.83, p < 0.001), but no differences were recorded for those treated with CLT, compared to controls. No significant differences were recorded between treatments and control when using Chl. a for normalising community respiration (p > 0.05).

3.2. Longer-Term Responses in Biofilms 4.5 Days Post-Herbicide Removal

3.2.1. Biomass of Autotrophs and Heterotrophs

After a longer recovery period, no significant differences were recorded in biomass measures, including Chl. a, dry mass, or ash-free dry mass of phytobenthos, across controls and treatments on the fourth day post-herbicide removal (p > 0.05; Table 2). The values of Chl. a and DM were lower in GBHC but still not significantly different due to within-group variation.

3.2.2. Enumeration of Bacterial Heterotrophs

Bacterial abundance ranged from 0.82–11.45 × 10⁶ cells cm−2 and was variable between replicated biofilms. Overall, the total numbers of bacteria did not differ between treatments at the end of the recovery period (p > 0.05).

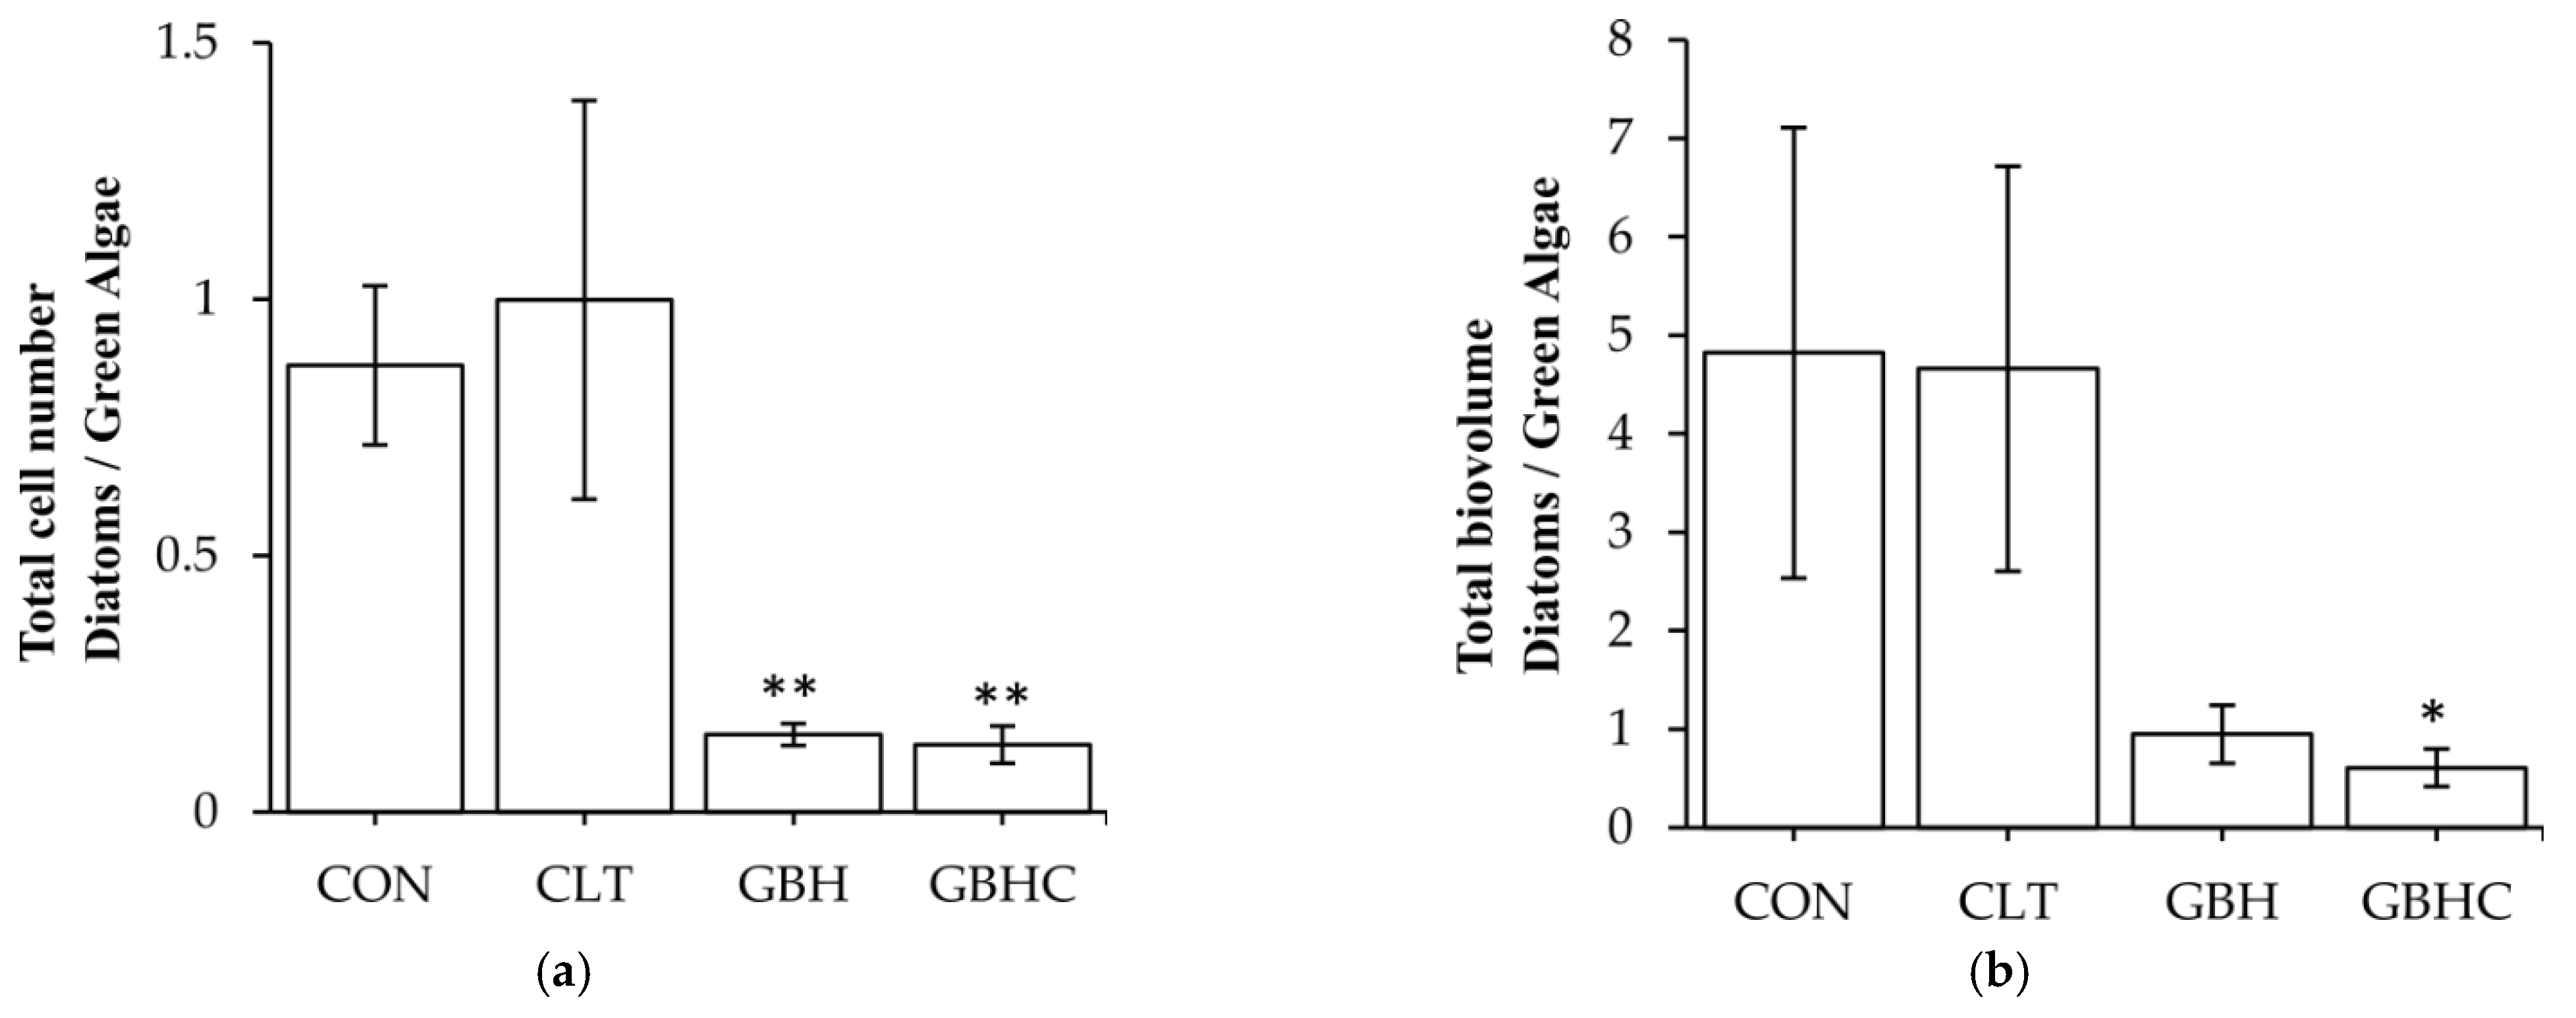
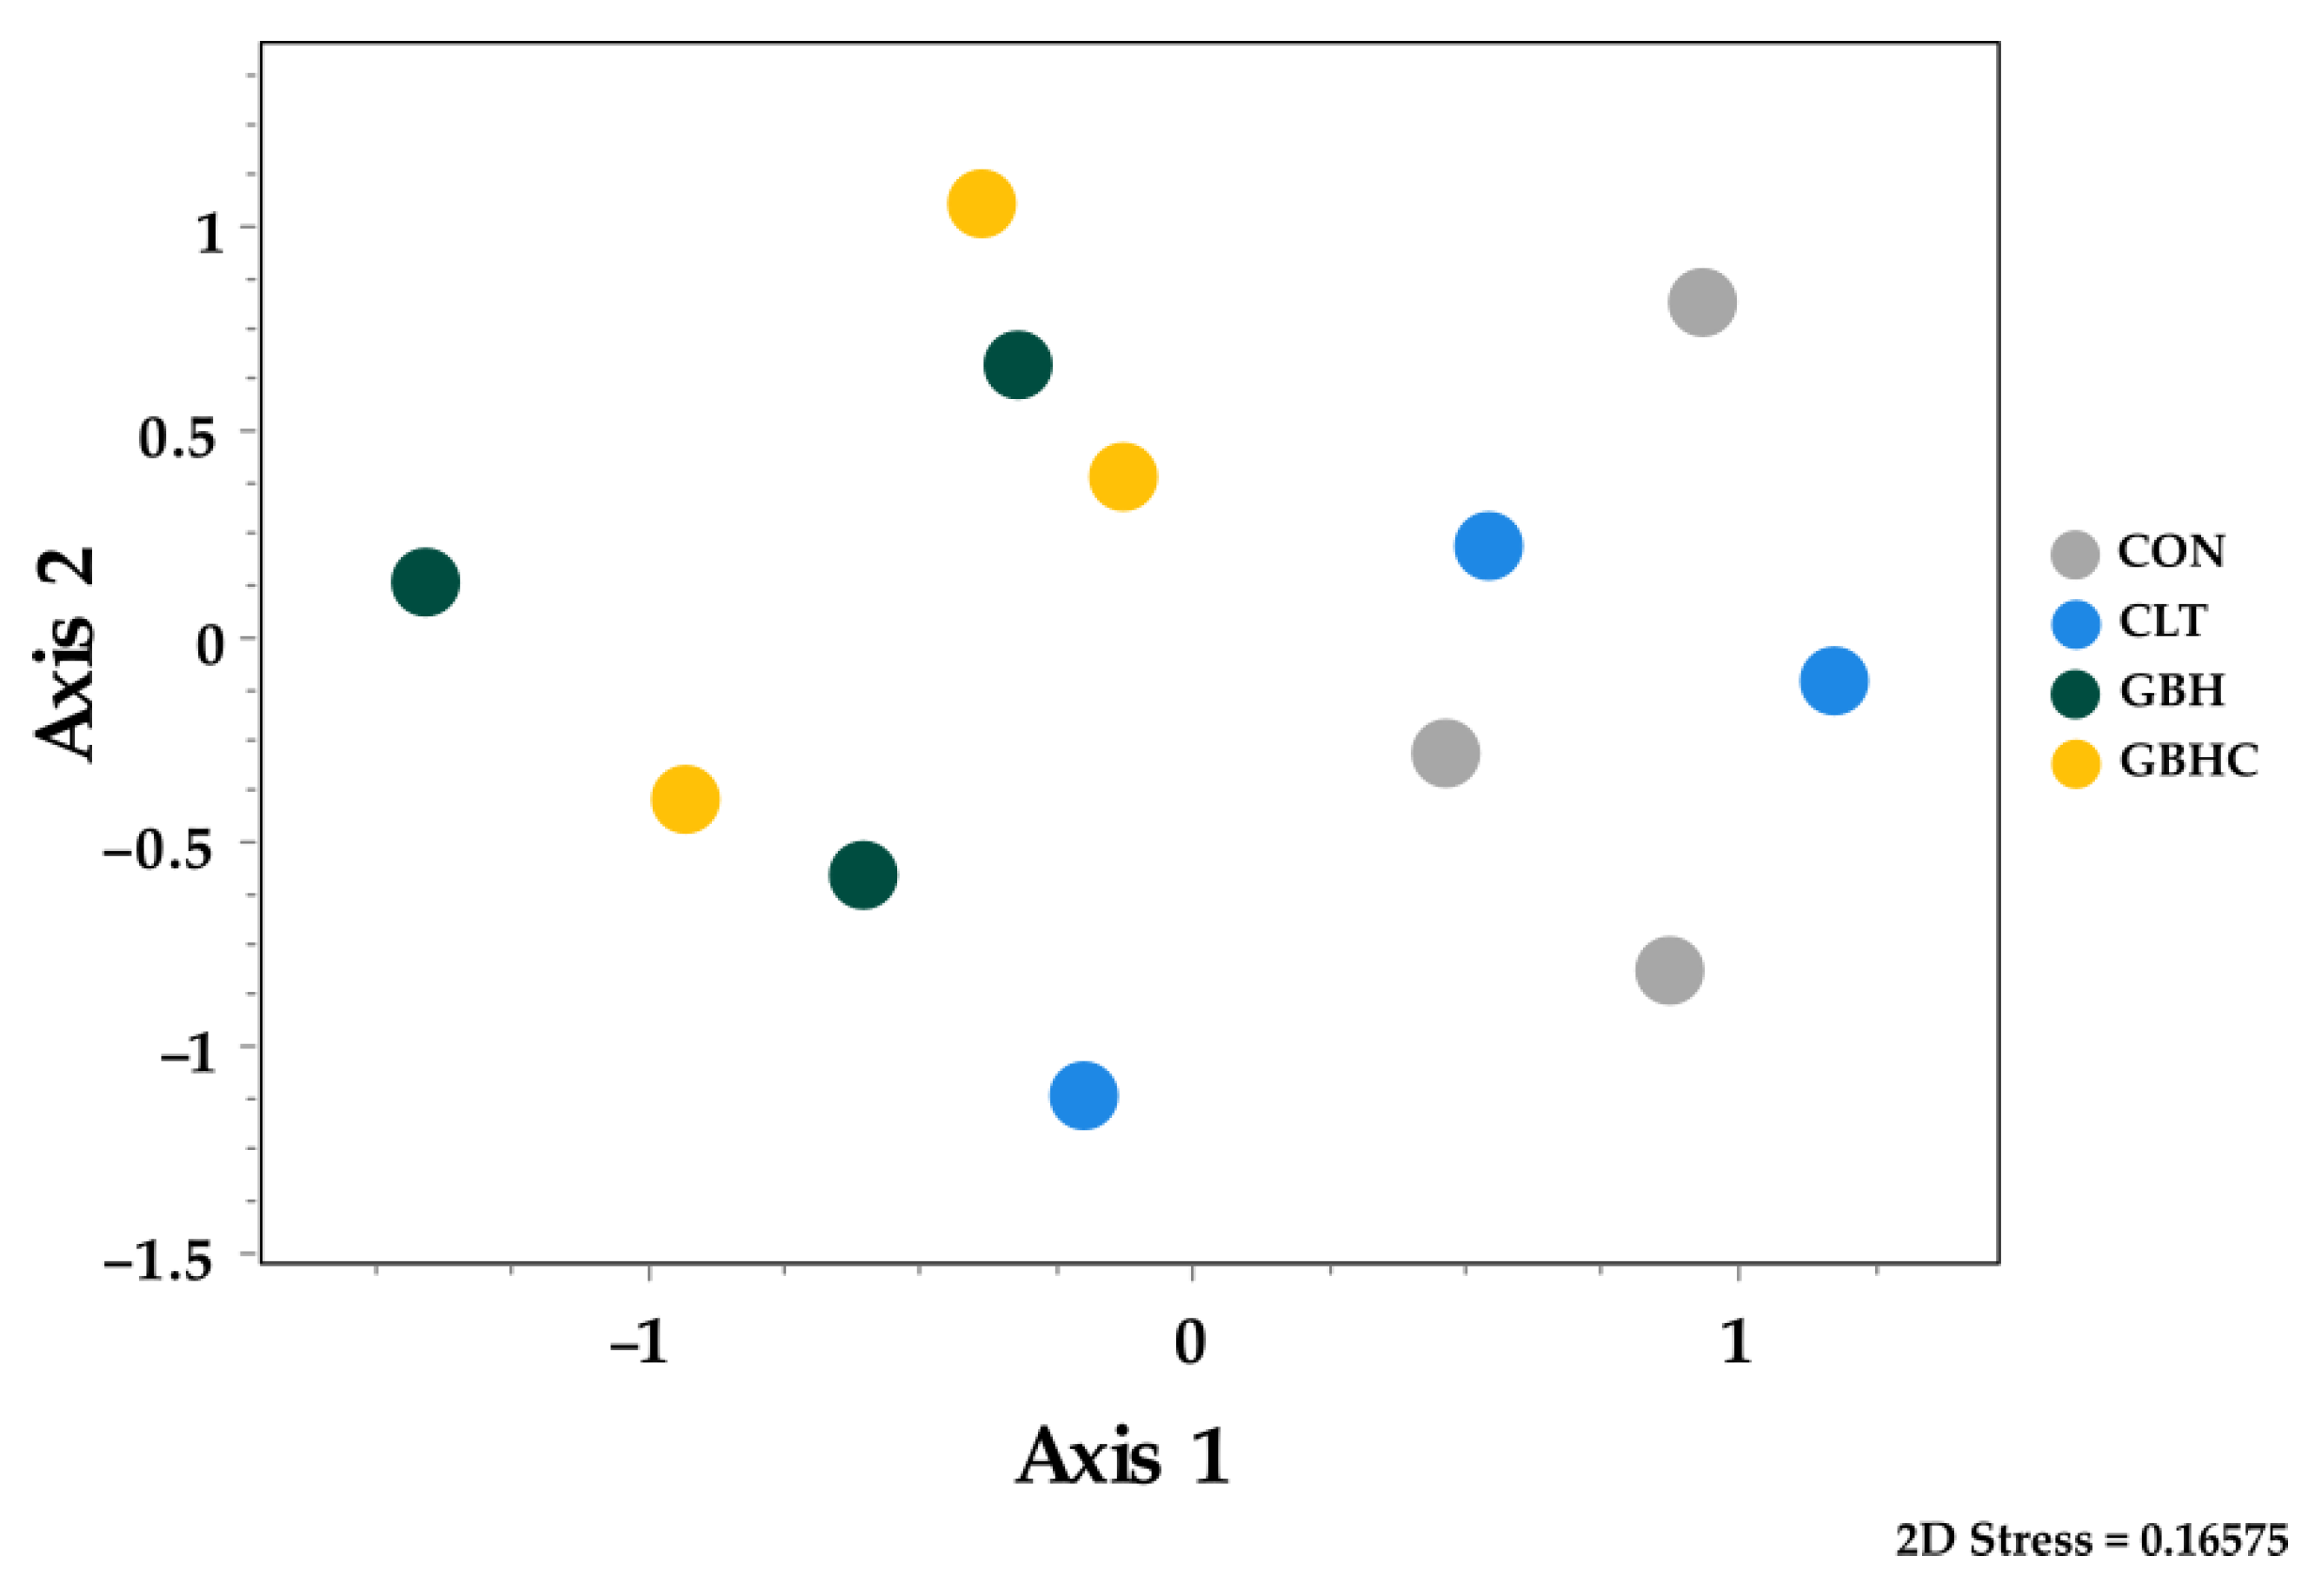
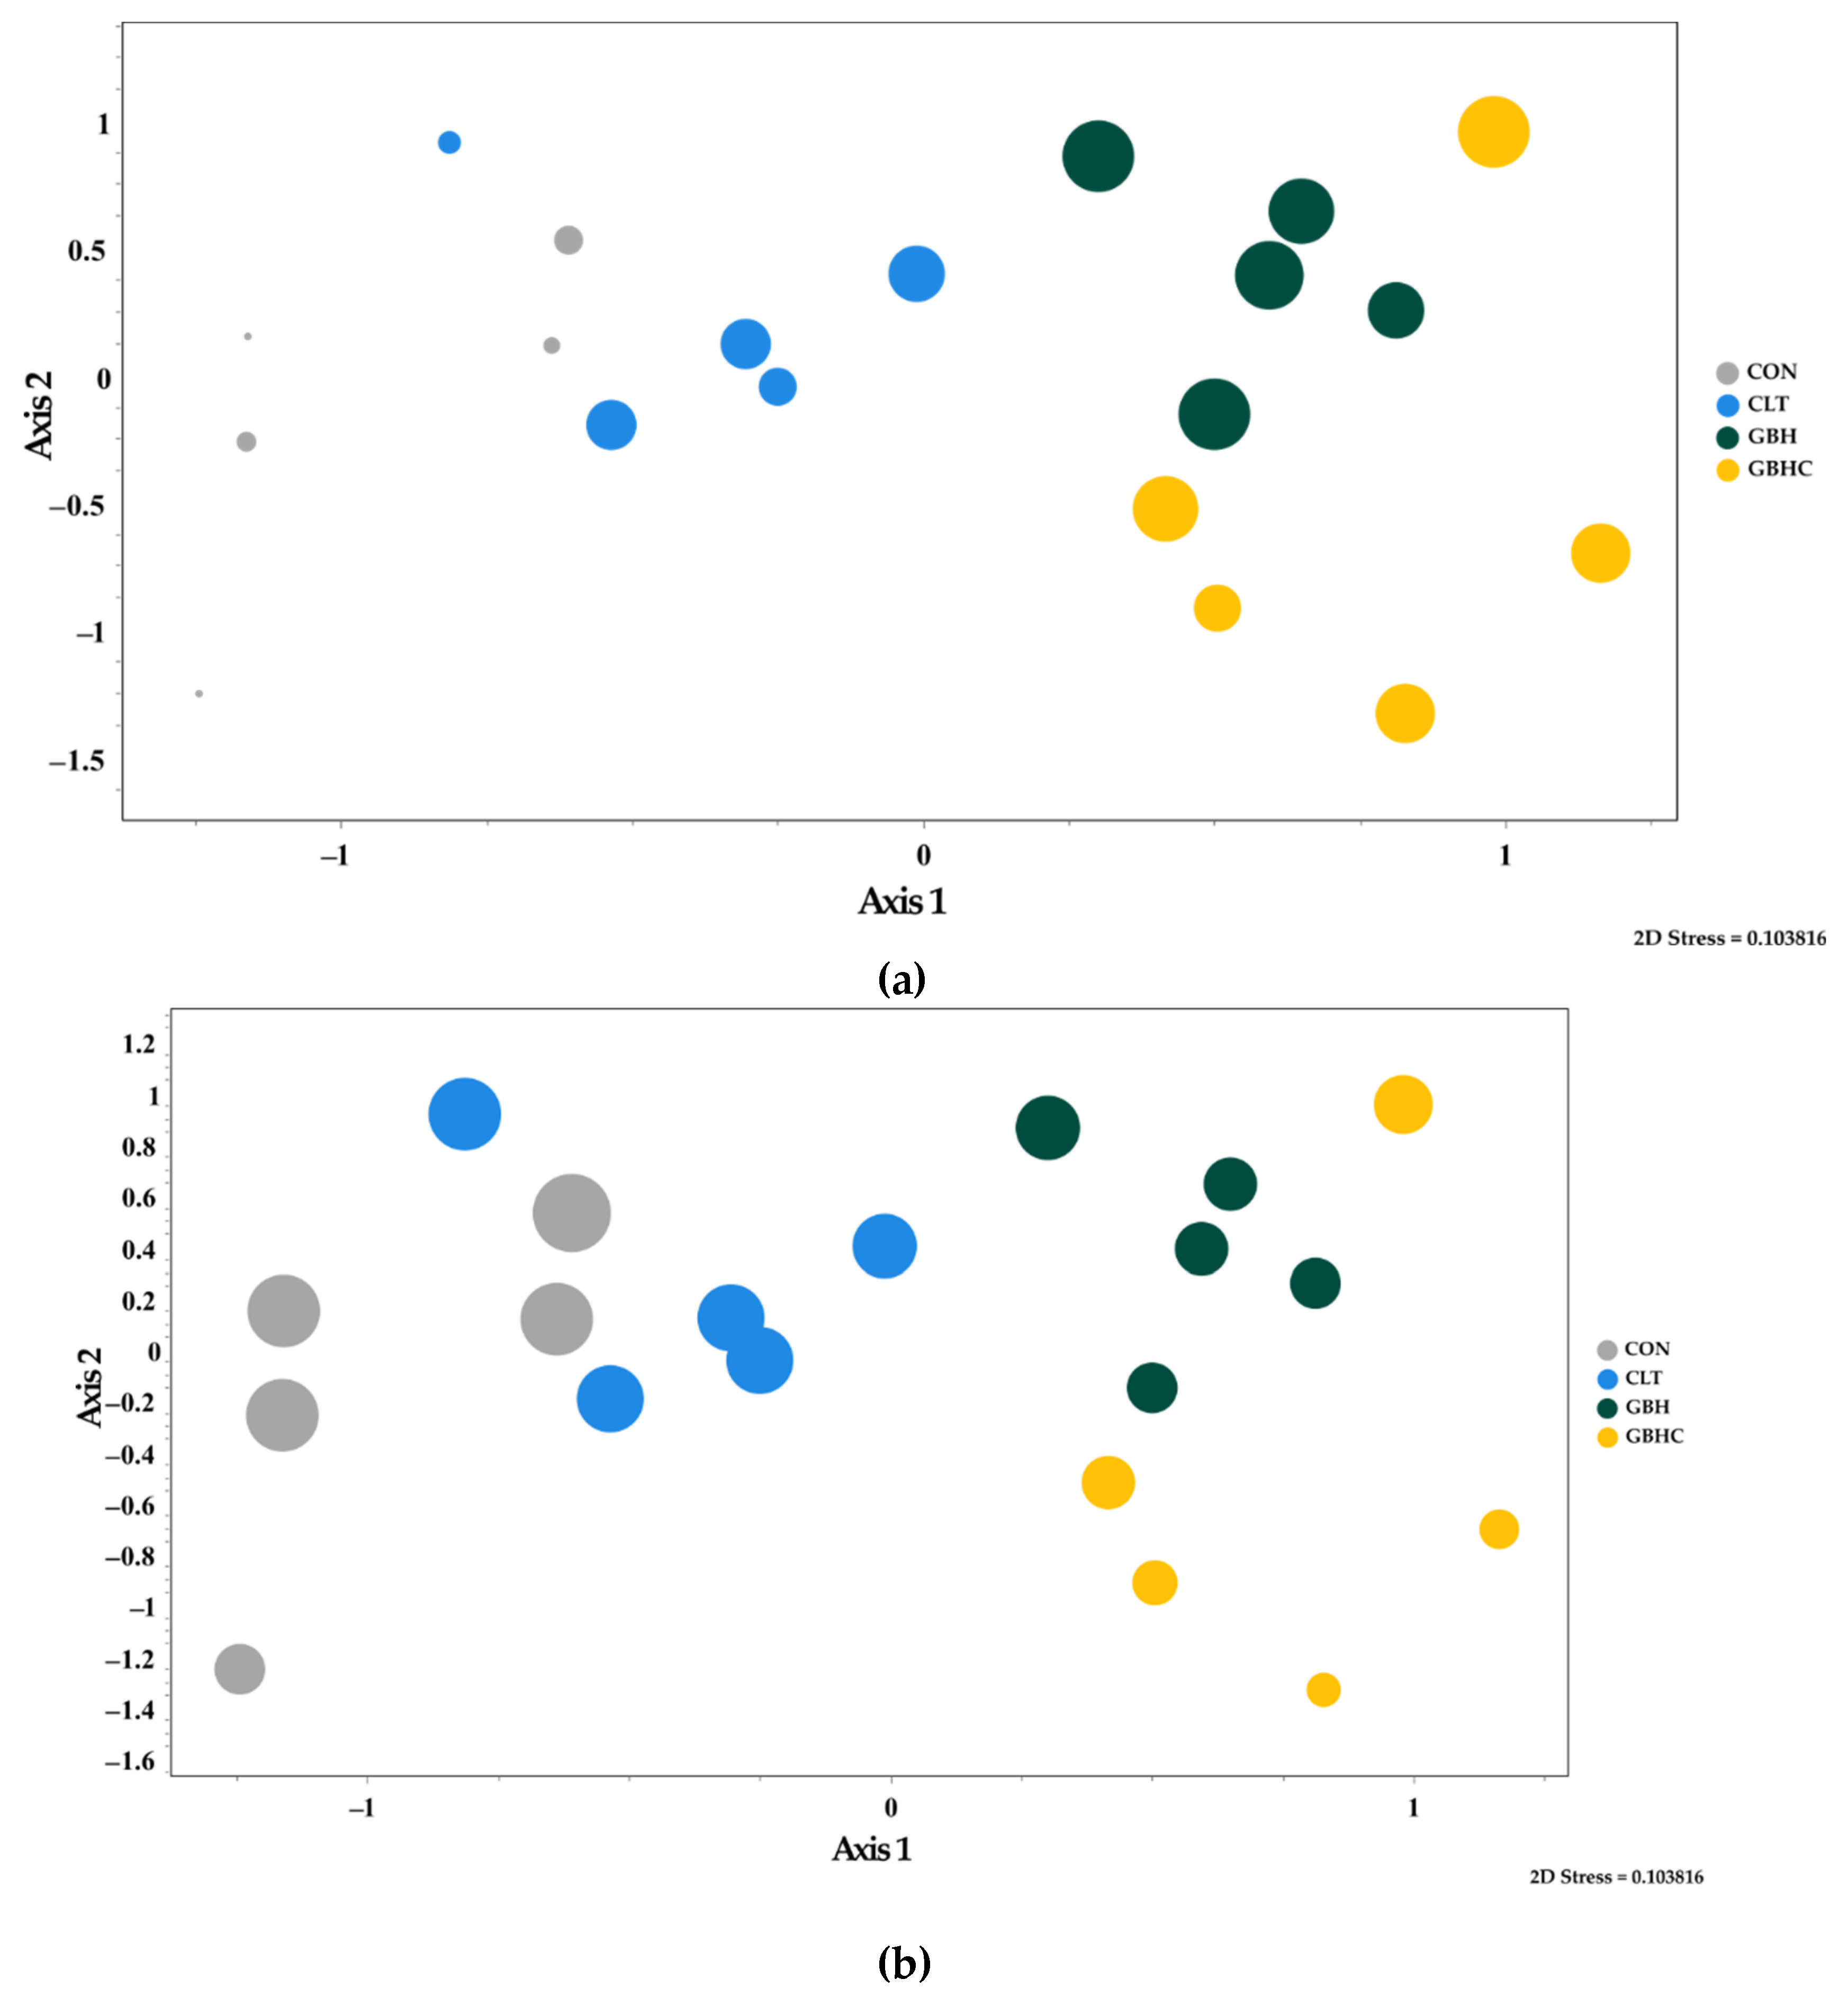
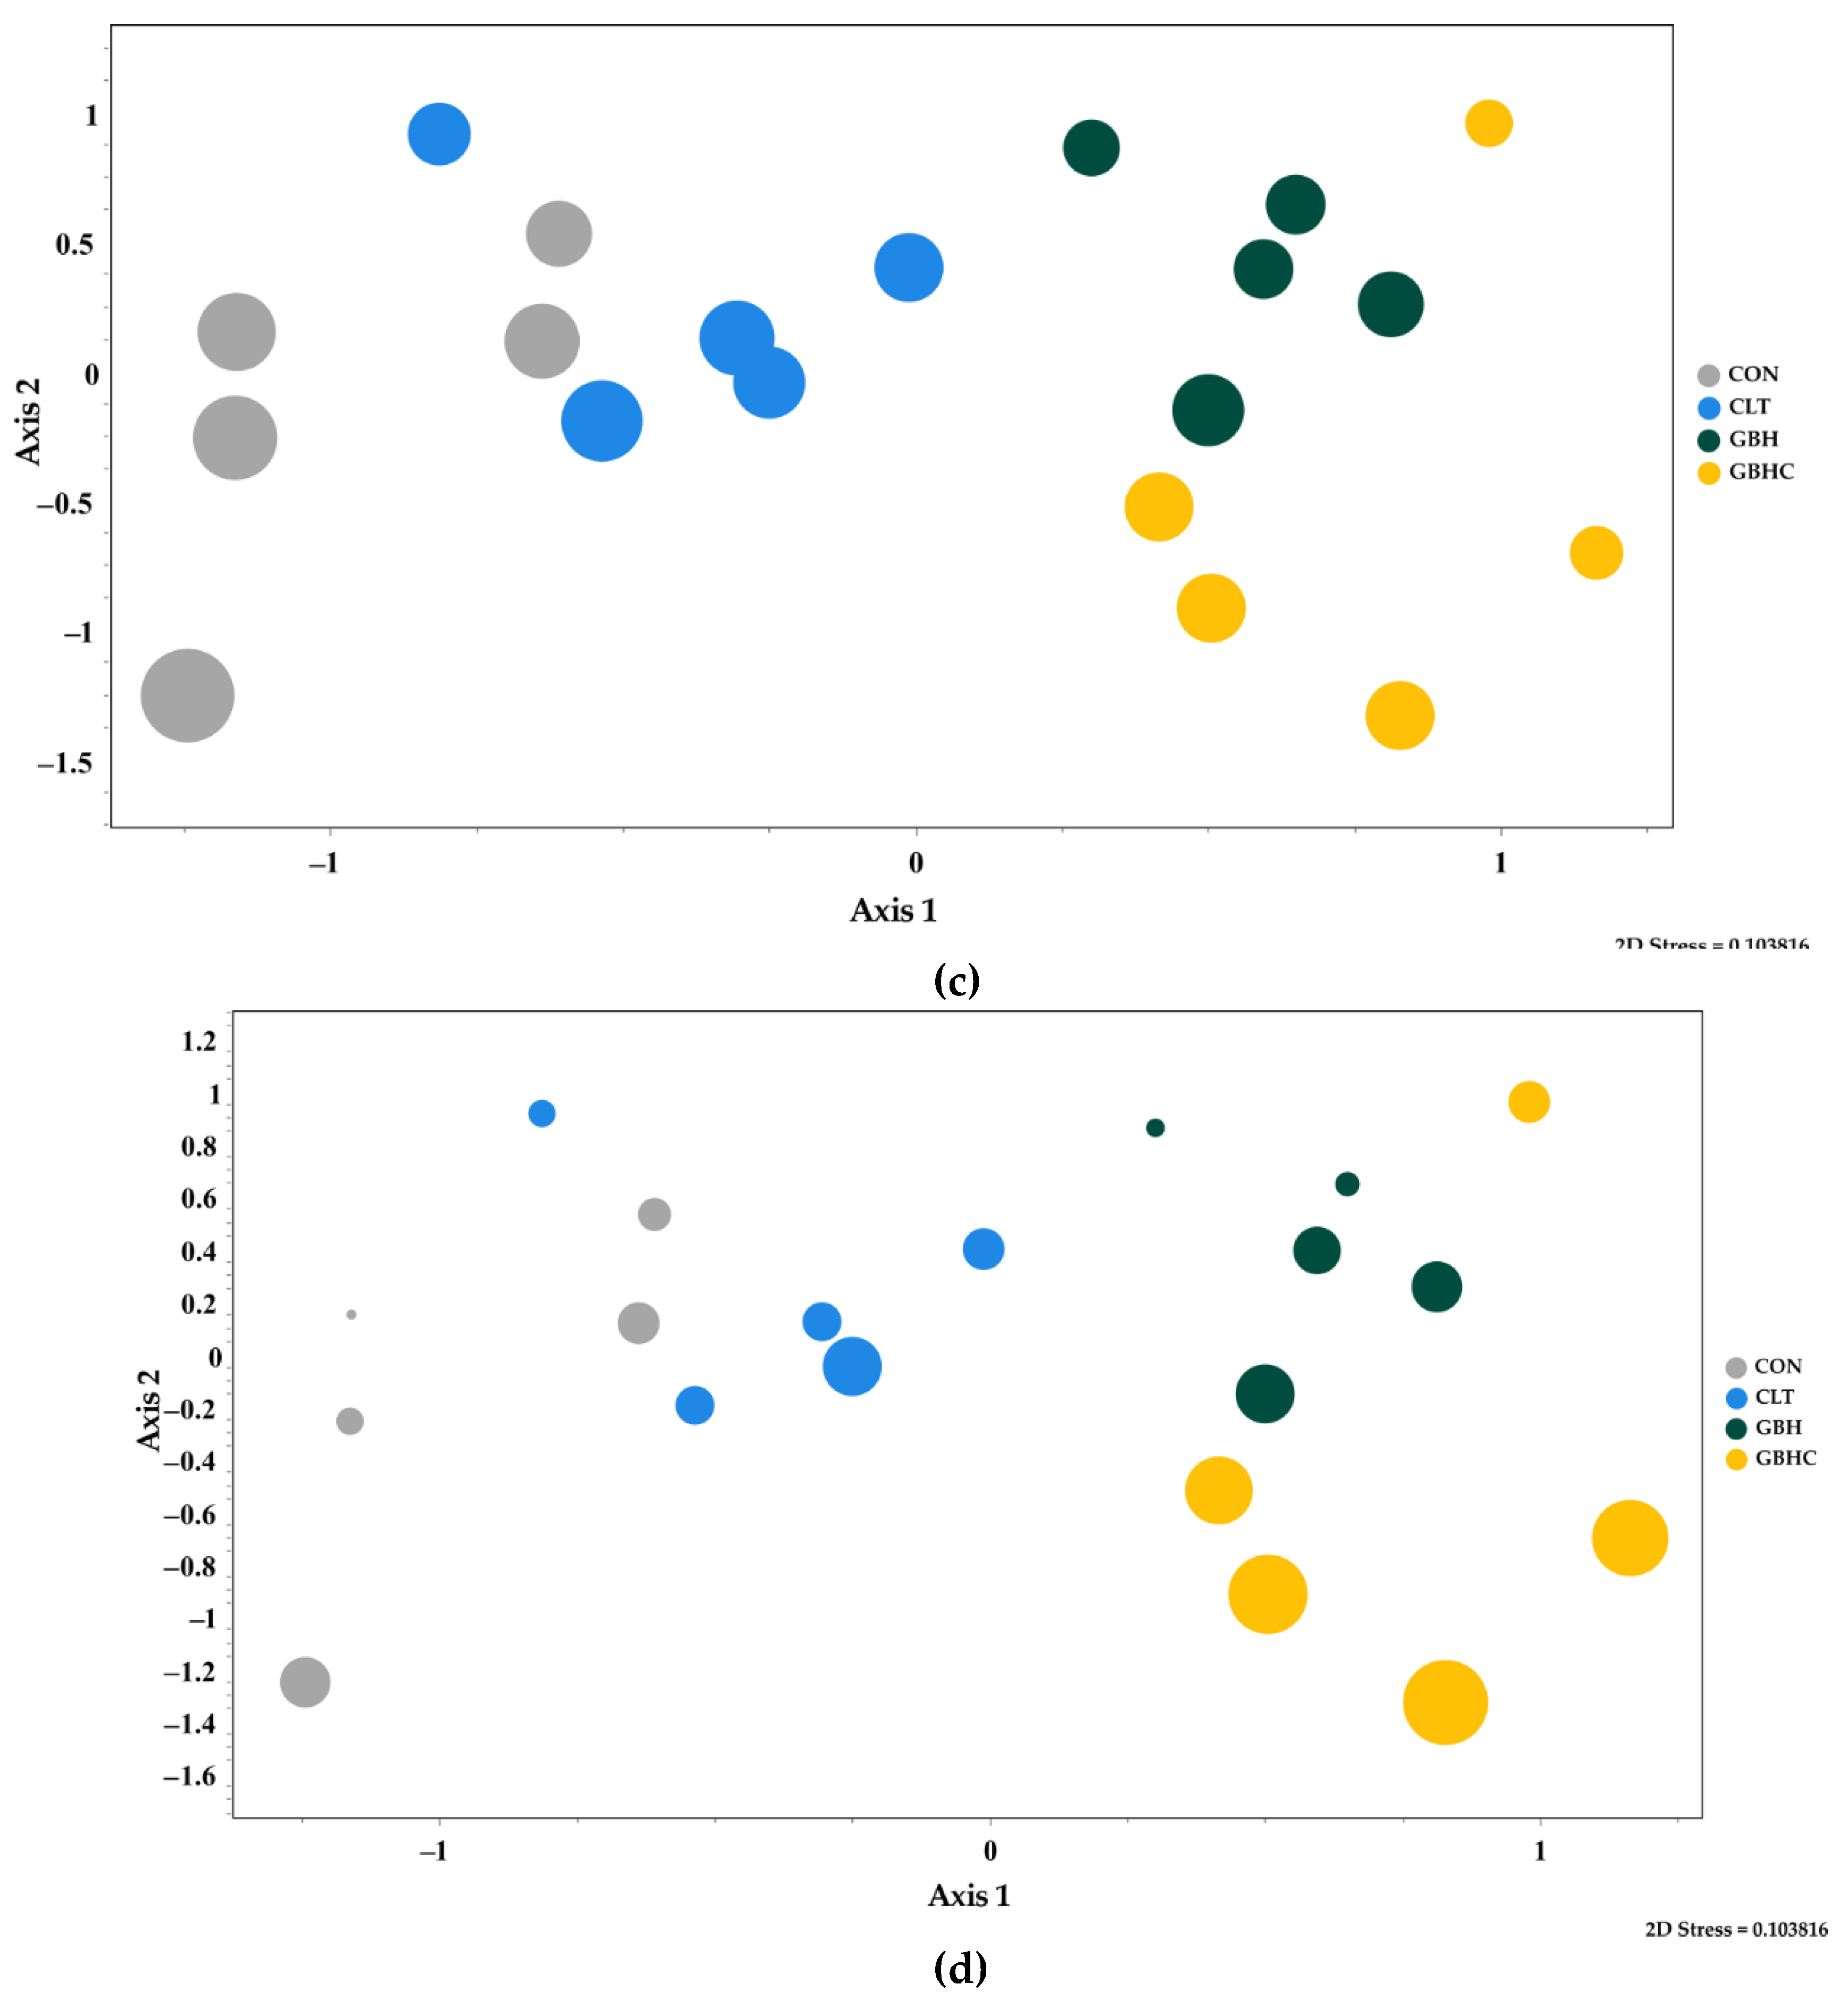
3.2.3. Taxonomic Composition of Autotrophs within Biofilms

At the end of the experiment, diatoms and green algae (belonging to the classes Trebouxiophyceae and Chlorophyceae) were the dominant autotrophs within the biofilms, with only minor representation by filamentous cyanobacteria in all treatments. In total, more than 60 different taxa were identified from the preserved material. The total biovolume for each guild and the mean relative abundance, based on biovolume, are shown for each treatment in Table A1.
No significant differences were measured between total areal cell densities (ANOVA, F(3,11) = 1.14, p = 0.39) or total areal biovolume (ANOVA, F(3,11) = 0.71, p = 0.573) across all treatments and controls for phytobenthic biofilms based on cell counts after the 4.5 day recovery period (Table A1). The ratio of the total numbers of diatoms to green algal cells was significantly lower in biofilms previously treated with GBH and with combined GBHC (ANOVA, F(3,8) = 16.69, p < 0.001) (Figure 3a). The biofilms that received no herbicide treatment (CON) had an average ratio of 0.87 (SE = 0.16), and the ratio decreased to 0.15 (SE = 0.02) in GBH and 0.13 (SE = 0.04) in combined GBHC-treated biofilms. The ratio of the total biovolume of diatoms to green algae was ~ eight times higher in the untreated controls, which had a ratio of 4.82 (SE = 2.29), and in biofilms treated with CLT, which had a ratio of 4.66 (SE = 2.06), compared to biofilms treated with GBH, with a ratio of 0.96 (SE = 0.29), or combined GBHC, with a ratio of 0.61 (SE = 0.19) (ANOVA: F(3,8) = 6.15, p < 0.05) (Figure 3b).
In biofilms treated with GBH and GBHC, there was a reduction in the relative biovolume of taxa assigned to the adnate/short-stalked guild and the erect guild, and an increase in the relative biovolume of motile species (Table A1). Further detailed analyses of taxonomic changes, based on cleaned diatom frustules, are reported in (Section 3.2.4).
The most common green algal taxa are listed for each treatment in Table A2. Amongst the green taxa, the chlorophyte Gongrosira sp. and the chlorophyte Desmodesmus sp., green flagellate species, and unidentified spherical chlorophytes increased in total biovolume within the GBH- and GBHC-treated biofilms compared to CON (Table A2).
A non-metric multidimensional scaling (NMDS) plot, based on the entire species composition of the phytobenthos, had a moderate level of stress (0.166). Two clusters were observed, with samples from the CON and CLT grouped close together and a second cluster comprising the GBH and GBHC assemblages located to the left of Axis 1 (Figure 4). MRPP could not confirm that differences between groups were greater than those within (A = 0.03, p = 0.227), but pairwise tests trended towards a significant difference between CON and GBHC (p = 0.11).

3.2.4. Taxonomic Analysis of Pennate Diatom Fraction, Based on Cleaned Valves in Phytobenthic Biofilms

A non-metric multidimensional scaling (NMDS) plot, based on the species composition of benthic diatoms, had a low level of stress (0.111) and revealed a clear separation of the four treatment types along Axis 1. MRPP confirmed that differences between groups were greater than those within (A = 0.189, p < 0.001). Pairwise tests showed significant differences between CON and GBH (p < 0.01) and GBHC (p < 0.01), but no significant difference was identified between CON and CLT communities.
The first division of a TWINSPAN analysis (Eigenvalue (λ) = 0.162) separated four of the CON biofilm samples from all other herbicide-treated biofilms. The main indicator species leading to the split was the pooled category of small naviculoids ‘sNav’. A bubble plot for this group (Figure 5a) illustrates a greater representation of this group in the biofilms treated with herbicides. The median relative abundance (%RA) of ‘sNav’ was significantly different between the treatment groups (Kruskal–Wallis, p = 0.002); the post hoc test showed a relatively lower median %RA of ‘sNav’ in CON biofilms compared to CLT-, GBH-, and GBHC-treated biofilms (M–W, U = 16, 15, 15, respectively; p < 0.05). There was a highly significant positive correlation (SR 0.7, p < 0.001) between NMDS Axis 1 sample scores and the %RA of the ‘sNav’ category.
Nitzschia species (including N. palea, N. paleacea, and the ‘Niag’ group) dominated the diatom assemblage in control flumes comprising 39% of all valves. There was a significant difference in the %RA of a pooled group of N. palea and N. paleacea (‘Nipp’) (Kruskal–Wallis; p = 0.01), with post hoc testing recording a higher median %RA in the CON compared to the GBHC treatment (Figure 5b; M–W, U = 38, p < 0.05). No significant differences were found between biofilms in the ‘Niag’ group.
Achnanthidium minutissimum was also common in control samples with a median %RA of 34%, but was also relatively common in herbicide-treated biofilms. A small significant difference was recorded between treatments for the median %RA of A. minutissimum (Kruskal–Wallis, p = < 0.05), with post hoc testing indicating a higher median %RA in CON biofilms relative to GBH-treated biofilms (M–W, U = 38, p < 0.05) (Figure 5c).
In control samples, species from the genus Cocconeis (C. lineata, C. euglypta, and C. placentula) made up 9% RA collectively but were relatively more common in herbicide-treated flumes. There was a significant difference in the pooled median %RA of three of the more well-represented adnate species, including Cocconeis lineata, Planothidium frequentissimum, and P. rostratum (‘CoPl’) (Kruskal–Wallis, p < 0,05). The median %RA of (~25%) in GBHC samples was significantly higher than in that of controls (~3%) (Figure 5d, M–W, U = 16, p < 0.05). The second split in the TWINSPAN dendrogram separated three of the GBHC samples from the rest of the group due to their relatively higher representation of this adnate grouping (Eigenvalue (λ) = 0.156). The upper-storey filamentous species Melosira varians was common in some samples, though distribution was patchy across all biofilms, complicating interpretation. The average %RA of the erect diatom Gomphonema parvulum was 8% in controls, but was less-well represented in herbicide treated samples.

3.2.5. Trophic Diatom Index in Relation to Herbicide Application

The Trophic Diatom Index (TDI) was determined for benthic diatoms in biofilms from each of the twenty flumes. The TDI scores (mean ± SD) for the GBH (63.0 ± 3.6) and GBHC (59.7 ± 6.3) treatments were significantly higher than those for the control (49.4 ± 7.6 (ANOVA, F(3,16)= 5.18, p = 0.011). A highly significant positive correlation was recorded between Axis 1 of the NMDS ordination and the scores for the Trophic Diatom Index (Pearson’s r = 0.902, n = 14, p < 0.001).

4. Discussion

4.1. Impacts of Chlorotoluron on Phytobenthic Biofilms

Chlorotoluron is a phenylurea herbicide, inhibiting plastoquinone binding of the D1 protein, which plays a key role in photosystem II (PSII). It was anticipated that photosynthetic activity would be reduced in flumes treated with CLT, as the nominal concentration of CLT applied for this study (8.5 µg L−1) had previously been shown to bring about a 50% reduction in the growth of the chlorophyte Raphidocelis subcapitata in a single-species laboratory experiment [41]. Crucially, in standard single-species toxicity tests for algae (e.g., [58]), the species are typically exposed to the toxicant for a period of 72 or 96 h. The CLT was applied for a relatively short period (12 h) in our experiment, and this exposure period may not have been long enough to cause significant detrimental effects. However, there is evidence of a 90% uptake of herbicides by phytoplankton within the first hour of exposure to herbicides in the water column [59], giving sufficient time for the CLT to have penetrated cells exposed to the overlying water, including potential inocula, as well as more erect or larger filamentous species of diatom in the upper storey of the biofilms [26]. More recently, higher IC50-96-h values of 50 and 80 µg L−1 have been reported for the growth of a freshwater green alga Ankistrodesmus fusiformis and a marine diatom Amphora coffeaeformis [60], and Anton and Alia [61] reported an EC50-96-h of 100 µg L−1 for the freshwater green alga Chlorella pyrenoidosa. Together, these data suggest a high degree of species-specific toxicity to this toxicant. To the best of our knowledge, no directly comparable data are available for benthic freshwater species.
Whilst the thickness of the biofilms in the flumes may have acted as a barrier for penetration of toxicants such as herbicides [62], any inocula present in the phytoplankton or located in the upper regions of the biofilms (e.g., the high-profile erect and filamentous species) may have been more immediately impacted by herbicides. By contrast, cells embedded deep within an extracellular polymeric (EPS) matrix [21,63,64] may have been exposed to much lower doses. The degree of impact of toxicants may therefore be dependent on the location of an organism within the biofilm [65].
The lack of any significant differences in any of the biomass measures (Chl. a, DM, AFDM) for CLT, 4.5 days post-herbicide removal, provided further evidence that this herbicide had no measurable impact or did not impact recovery when applied to phytobenthos in a short-term pulse during this study. However, there were some shifts, albeit not significant, in the composition of the entire algal community following the addition of CLT when compared with biota in control biofilms (Figure 4). There was considerable heterogeneity in algal composition within each treatment, and no significant differences were recorded in any of the compositional measures. It is therefore recommended for further studies to increase sample sizes to increase statistical power. The total abundance of the green algae Gongrosira was reduced in biofilms treated with CLT compared to controls. This variability in phytobenthic assemblages is well recognised and is an important consideration when making assessments of ecological status in field-grown phytobenthic communities. Periodic toxicity testing on biofilms from any site over a longer time-period would better incorporate the natural spatial and temporal variability in the composition of the phytobenthic assemblages, and potentially provide greater insight regarding the ‘winners’ and ‘losers’ following herbicide exposure in specific sites.

4.2. Impacts of a GBH and GBHC on Phytobenthic Biofilms

Responses in key functional and structural metrics for GBH- and GBHC-treated biofilms were similar. Glyphosate (N-phosphonomethylglycine) affects the shikimic (or shikimate) acid pathway, impacting the enzyme involved in the production of aromatic amino acids required for protein synthesis. Negative effects of GBH formulations on plants include impacts on photosynthesis and pigment production, e.g., chlorophyll and carotenoids [66]. Our finding of a 44–55% significant reduction in areal rates of photosynthesis (GPmaxarea), 76–78% reduction in Chl. a, and 45–53% reduction in dry mass in GBH- and GBHC-treated phytobenthic samples, respectively, within two days into the recovery period would suggest similar pathways to impact were operating in phytobenthic algae in the flumes. Roundup® has been demonstrated to be considerably more toxic to the green alga Selenastrum capricornutum (now identified as Raphidocelis subcapitata) (EC50-96-h 5.8 mg L−1) and the marine diatom Skeletonema costatum (EC50-96-h 1.85 mg/L) than either the IPA salt of glyphosate or technical glyphosate [67]. In the flumes, toxic impacts were measured two days after the removal of the applied nominal concentration (64.5 mg L−1 a.i.) of Roundup®. Such high concentrations equate more with cases of accidental spillage [68], and typically, concentrations of glyphosate in surface waters worldwide are generally much lower (~1 mg L−1) [28], though much higher environmental concentrations have been measured in freshwater in Argentina (105 mg L−1) [69]. At one extreme, Romero et al. [68] reported an EC50-96 h of 55.62 mg L−1 for the growth of a tolerant green alga Chlorella kessleri following exposure to the GBH formulation ATANOR®. At the other end of the scale, Tajnaiová et al. [70] recently reported an IC50-72-h of 0.267 mg L−1 for Desmodesmus subspicatus using Roundup® ClassicPro. These extreme examples serve to illustrate the wide variation in sensitivity (>200-fold difference) of these organisms, making it very challenging to predict the impacts of GBH-formulated herbicides on multi-species communities. This variation in sensitivity may not simply relate to the impacts of glyphosate per se. At least 750 different GBH formulations have been produced [71], which may contain additional (often undisclosed) adjuvants, which can induce greater toxicity than the glyphosate alone [72].
The significant increase in the biomass-specific maximum photosynthetic rates in GBH-treated samples (PSmax) two days after removing the herbicide could be accounted for by the marked reduction in biomass in the GBH-treated biofilms. Goldsborough and Brown [73] measured maximum photosynthetic rates in biofilms of relatively low biomass (2–3 µg cm−2 Chl. a), and reduced rates at relatively high biomass concentrations (~8–16 µg cm−2), which is comparable with our findings. The reduction in biomass following GBH addition would have alleviated stresses in the remaining under-storey biota, exposing them to an increased irradiance and potentially also removing other constraints, e.g., nutrient limitation or gas diffusion. Bacteria are known to break down glyphosate to form amino-methylphosphonic acid (AMPA) and release phosphorus [74], which could also have potentially contributed to the phosphorus pool.
During the period of herbicide exposure in flumes, it is possible that organisms could have left the biofilms in response to unfavourable conditions. A drift response may enable organisms to escape from resource-limited conditions [75] or unfavourable habitats [76]. The biofilms lacked a cohesive physiognomy, increasing susceptibility to sloughing events [77]. Sloughing of phytobenthic material has been observed following the application of titanium dioxide nanoparticles to phytobenthos in experimental flumes grown from the Mill Stream, Dorset, UK [78]. Evidence suggests that under-storey algae in phytobenthic biofilms may retain photosynthetic potential despite being potentially shaded as the biofilms mature, and reduction in over-storey biofilm may result in an improved photosynthetic performance [79].
Significantly higher areal community respiration rates were measured in control biofilms compared to GBH and GBHC herbicide-treated phytobenthos circa two days into the recovery period. Respiration rates in GBH and GBHC treatments were only significantly lower when normalised using organic content rather than Chl. a. Whilst bacterial numbers were not significantly different between treatments at the end of the experiment, it is possible that exposure to these herbicide treatments may have, at least in the period during and immediately after removal, affected the functioning (e.g., secondary production) of the bacteria community. We did not examine the heterotrophic protist component of the biofilms, but these may also have been negatively impacted. However, a much greater sensitivity to the Roundup® formulation has previously been demonstrated in algae, in comparison to bacteria and protozoa [67].

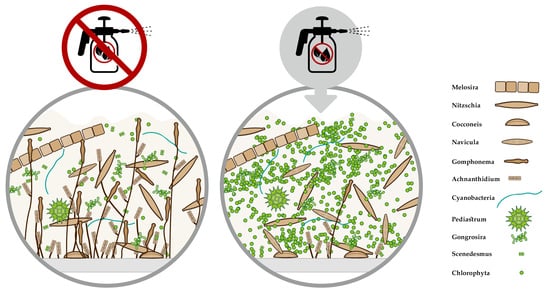
4.3. Changes in Species Composition of Phytobenthos

Differences in the diatom species composition, visualised by NMDS, 4.5 days after removal of the herbicides provided evidence of species-specific responses, with greater spatial separation for GBH- and GBHC-treated phytobenthos from controls than for CLT. The significantly higher proportion of three adnate diatom species in GBHC-treated biofilms indicated a marked difference in the diatom assemblage compared to other treatments after the 4.5-day recovery period (Figure 5d), suggesting exposure of under-storey species in these biofilms and potentially increased growth and/or new recruitment of these adnate species. Given that fresh river water was provided for all flumes, new inocula could have rapidly colonised the biofilms, or more tolerant species may have proliferated, replacing herbicide-sensitive species. Diatoms of the genus Gomphonema were common in control biofilms but were sparse or absent from most GBH- and GBHC-treated biofilms. Wood et al. [80] tested the impact of glyphosate on a homogenised riverine benthic diatom assemblage using indoor laboratory microcosms. Based on the percentage of healthy cells, they recorded an EC50-48 h for glyphosate of 5.3 µg L−1 and >500 µg L−1 for Gomphonema spp. (a mixture of G. parvulum and G. minutum) but an EC50-48 h of >500 µg L−1 (the highest concentration applied) was recorded for G. gracile, demonstrating different within-species tolerance. Navicula cryptotonella, the only naviculoid present in their river community, was the most tolerant genus, corroborating our observations that other species in this genus were tolerant to GBH and GBHC.
Green algae colonised the biofilms rapidly as spaces in the biofilms became available, as shown by the marked decline in the ratio of diatoms to green algal cells in GBH and GBHC biofilms. Other researchers have also recorded changes in the composition and/or biomass of phytoplankton and phytobenthos following herbicide applications including GBH [81,82,83]. Here, we demonstrate evidence of a full recovery, at least for biomass measures, with biomass concentrations matching those of controls after the 4.5-day recovery period, which implied rapid growth of remaining taxa or rapid re-colonisation from the inoculum over a very short space of time in the GBH and GBHC biofilms. Our results concur with those reported by Debenest et al. [12], who stated that whilst no overall effects of biomass may be measured in the long-term following herbicide application, it is possible that increases in the biomass of certain taxa (e.g., green algae) may compensate for inhibition in others (e.g., diatoms). Here, some unicellular Chlorella-like green algae and Desmodesmus species opportunists, recognised as taxa capable of rapidly colonising newly exposed areas of biofilms [22], increased in abundance. The timeframe would have allowed for several divisions of tolerant cells already in the biofilm. The recirculating nature of the flumes used for our experiments, and the daily replacement of stream water, allowed also for the possibility of both emigration and re-immigration of biota in addition to new colonists, as would occur under natural conditions in streams after a peak event of herbicide runoff, affording greater environmental realism.
Although much research has been carried out on the impacts of glyphosate and GBH on phytoplankton and phytobenthos communities, there is still no clear message regarding the impacts of glyphosate-containing herbicides. Negative, positive, or no impacts have been reported, with outcomes likely to depend on the composition and state of the cohort at the start of the experiment (e.g., the health of cells and development stage of the community, the composition of the GBH, nutrient composition of the freshwater, length of exposure to the toxicant, and experimental design (indoor, outdoor, flowing, or static) replenishment of new inocula [27,72,81,82,84,85,86,87,88]. Incorporating an experimental setup where fresh river water is replaced during the recovery period, as utilised here, adds greater environmental realism for measuring the potential for recovery of herbicide-impacted biofilms.

4.4. Implications for Ecological Assessment

Whilst we show that phytobenthic biofilms had the capacity to make a rapid recovery from an acute toxicity event, we also provide evidence (through TDI measurements) that changes observed in species composition may link to an enhanced growth of species that are tolerant to higher nutrient concentrations, given the breakdown product of glyphosate could lead to the release of phosphorus [74,89]. The fact that no measurable growth was recorded in CON- and CLT-amended biofilms over the ‘recovery’ period compared to biofilms treated with GBH or GBHC alluded to a possible limitation to growth in the former and alleviation of this constraint in the latter. The reduction in the relative abundance of the nutrient-sensitive diatom Achnanthidium minutissimum in GBH-treated flumes and the significant increase in the relative abundance of nutrient-tolerant small naviculoids resulted in a significant increase in the TDI in GBH- and GBHC-treated biofilms, although we cannot rule out that these species may just be more tolerant to glyphosate, or less sensitive to any associated adjuvants. In the 2-year period prior to this experiment, improvements in phosphorus stripping led to a reduction in the mean soluble reactive phosphorus (SRP) concentrations (49 µg L−1) in the river Frome, falling below the target of 60 µg L−1 set by the Environment Agency (EA) for chalk rivers [90,91]; though, the possibility of nutrient limitation within thicker biofilms in our experiments could not totally be ruled out.
Based on observations made on river biofilms situated in catchments of intensive agricultural activity, Roubeix et al. [92] commented that it is difficult to separate the impacts of nutrients from those of herbicides as the two are highly correlated. We concur with this view, as it was not possible to confirm if the increased biomass in the GBH and GBHC treatment in the recovery period was a direct result of (i) herbicide action per se possibly favouring increased growth of herbicide-tolerant species with reduced competition from more sensitive species; (ii) phosphorus release from glyphosate; (iii) greater availability of nutrients already in the water column due to reduced biofilm thickness; or (iv) alleviation of other growth constraints generated from the reduction in biofilm thickness (e.g., light) [93]. Relative to control biofilms, the ratio of the total biovolume of diatoms to green algae in GBH and GBHC biofilms was about 8-fold lower, showing a significant shift away from a diatom-dominated biofilm (Figure 3). It is possible that green algae were more tolerant to herbicides, and they may just fill the gaps left by emigrating diatoms or sloughed biofilm. Measurements of significant changes in biomass and metabolic activity in the short-term contrasted with the lack of difference measured in biomass a few days after application of the herbicides, demonstrating the rapid recolonization within impacted biofilms. The evidence presented here suggests that the timing of measurements when assessing impacts to herbicides may be critical for determining impacts. Furthermore, the selection of parameters to measure change is critical. Had we only used biomass measures, such as Chl. a, DM, and AFDM, measured 4.5 days into the recovery period, the marked changes in the species composition would have been missed.
The challenge for ecological assessment is to simultaneously evaluate the combined impact of these multiple stressors and to isolate the roles of individual stressors in order to give catchment managers realistic guidance on appropriate remediation measures and enable the development of specific protection goal options, as also formulated by the tasked European Food Safety Authority [94]. This study complements our previous work (e.g., [2]) by demonstrating how the impact of herbicides on benthic communities may confound the interpretation of diatom indices designed to reflect the predominant nutrient-organic gradient in European streams. It also raises questions about the feasibility of disentangling herbicide impacts from those of other pressures using the current suite of methods, which focus largely on taxonomic composition [3].
Not only do herbicides cause different responses dependent upon their modes of delivery and action, but we may also anticipate a broader range of outcomes in reality compared to what has been reported from single-species tests or diatom-only approaches. However, even when using our more integrative design looking at green algae, diatoms, and cyanobacteria, factors that we held as constants (pre-exposure time, duration of exposure, and herbicide concentrations) will all be highly variable in the field. We studied two herbicides, whereas river communities will be exposed to many agrochemicals, often in mixtures, and the pathways which transfer these from the site of application to streams will also influence the biota in other ways (rainfall will alter nutrient concentrations and increase hydrological stress on biofilms, and potentially increase sediment loads). Whilst our results suggest that herbicide impacts will be reflected by the current UK assessment method [2], we are pessimistic about the potential of taxonomic-based methods generally to provide a strong diagnostic capability. Our observation of a strong shift in proportional dominance between diatoms and green algae in response to herbicides suggests a need for a broader taxonomic range in ecological assessment than the current narrow focus on diatoms [95]. Our results on photosynthetic activity suggest that functional aspects should be an important part of future toxicity testing and indicate, contrary to what might have been expected, that productivity may be enhanced in the short term by the application of certain herbicides, and changes in growth may have important consequences for higher trophic guilds [96]. The provision of river-grown biota when testing herbicide impacts offers more realistic conditions for quantifying impacts at a community level, compared to laboratory experiments with a single species.
An alternative view of the situation is that all spatial studies of algae and cyanobacteria in regions of intensive agriculture will almost certainly include intermittent effects of herbicides as one of several factors contributing to the principal stressor gradients. Such gradients may be correlated with nutrients. Herbicides are rarely included as variables in such studies due to the difficulties in chemical measurement. However, their influence will be manifest in the biota, as we demonstrate here. The ability of the biota to detect pressures missed by conventional chemical analyses is often quoted as a reason in favour of ecological assessment, a point that underlies the rationale for the WFD specifying using phytobenthos. The utility of ecological assessment methods is often demonstrated by the strength of correlation or association with chemical gradients [97]. Ironically, herbicides may well confound the relationship between the biota and variables such as phosphorus which are widely used to calibrate or validate methods. The long-term solution may be to recognise the limitations of community-based approaches as diagnostic tools and, instead, to focus on their capacity to provide rapid overviews of the condition of the aquatic biota [3].

Author Contributions

Conceptualization, H.R. and M.L.Y.; data curation, H.R.; formal analysis, H.R., M.G.K. and M.L.Y.; funding acquisition, M.L.Y.; investigation, H.R., M.G.K. and M.L.Y.; methodology, H.R., M.G.K., A.M.A. and M.L.Y.; project administration, M.L.Y.; supervision, M.G.K., A.M.A. and M.L.Y.; validation, H.R., M.G.K., A.M.A. and M.L.Y.; visualization, H.R.; writing—original draft, M.L.Y.; writing—review and editing, H.R., M.G.K., A.M.A. and M.L.Y. All authors have read and agreed to the published version of the manuscript.

Funding

We are very grateful to the Freshwater Biological Association (FBA) for providing 50% of the funds to support a PhD Studentship (Grant #SM6505). Grateful thanks are also given to the Bristol Centre for Agricultural Innovation (BCAI) (formerly Long Ashton Research Station, LESARS) for providing 50% of the funds towards a PhD Studentship (Grant #HF1743).

Data Availability Statement

The data presented in this study are available on request from the corresponding author.

Acknowledgments

We would like to thank Lutz Kupferschläger for designing the graphical abstract and Figure A1. We are very grateful to the Freshwater Biological Association, (FBA) for the use of their site facilities and the support of the River Lab staff at the FBA River Lab, Dorset.

Conflicts of Interest

The authors declare no conflict of interest. The funders had no role in the design of this study; in the collection, analyses, or interpretation of data; in the writing of the manuscript; or in the decision to publish the results.

Appendix A

Figure A1. Schematic illustration of the study design.
Phycology 03 00003 g0a1
Table A1. Mean relative abundance (based on estimated biovolume) assigned to benthic diatom guilds in phytobenthos four days into a recovery phase following an acute treatment of herbicides where CON = control, CLT = chlorotoluron, GBH = glyphosate-based herbicide, and GBHC = a combined GBH and CLT treatment. Diatoms were assigned to guilds according to their growth form within the biofilms. Relative abundance % = Total Estimated Relative Percentage Biovolume (%) of Benthic Diatoms (number of replicates = 3).
Diatom GuildControlChlorotoluronGlyphosateGlyphosate and
Chlorotoluron
Adnate/Short-Stalked
Total biovolume × 106 [µm3 cm−2]:23642
Relative abundance %:19.74.12.54.1
Erect
Total biovolume × 106 [µm3 cm−2]:331600
Relative abundance %:28.210.10.00.0
Motile
Total biovolume × 106 [µm3 cm−2]:42557936
Relative abundance %:35.635.051.878.5
Filaments
Total biovolume × 106 [µm3 cm−2]:2080698
Relative abundance %:16.550.745.717.4
Table A2. Total abundance (as areal density and biovolume) and species abundance (as biovolume) of the Chlorophyta in biofilms for all treatments. Species that contributed >5% to the total biovolume are shown in grey. Species that occurred in high abundance in all treatments are highlighted in bold. Species that were impacted positively or negatively by the herbicide treatments are highlighted with a bold frame. Cyanobacteria were not included due to very low representation. (n = 3).
Estimated VolumeControlChlorotoluronGlyphosateGlyphosate and Chlorotoluron
Total number of cells × 106 [cells cm−2] 0.670.551.301.05
Total biovolume × 106 [µm3 cm−2] 157.94218.43292.75129.67
[µm3]×106 [µm3 cm−2]×106 [µm3 cm−2]×106 [µm3 cm−2]×106 [µm3 cm−2]
Desmodesmus sp.460.660.117.371.76
Gongrosira (Colony)23563.190.340.830.19
Green Flagelate2480.300.003.677.15
unid. Chlorophyta (spherical) (large)11501.3812.4136.3117.92
unid. Chlorophyta (spherical) (medium)7411.038.3824.0317.47
unid. Chlorophyta in pairs744.413.7110.249.88
Pediastrum sp.1410.400.883.501.06
Scenedesmussp. (groups of 4) (large)6706.4325.7013.396.43
Scenedesmus sp. (groups of 4) (medium) 463.092.2110.2912.35
Scenedesmus sp. (single) (large)6703.213.2124.903.21
Scenedesmus sp. (single) (medium)461.271.102.682.70

References

  1. 2000/60/EC; Water Framework Directive: Maastricht, The Netherlands, 2000.
  2. Kelly, M.G.; Juggins, S.; Guthrie, R.; Pritchard, S.; Jamieson, J.; Rippey, B.; Hirst, H.; Yallop, M.L. Assessment of ecological status in UK rivers using diatoms. Freshw. Biol. 2008, 53, 403–422. [Google Scholar]
  3. Kelly, M. Data rich, information poor? Phytobenthos assessment and the Water Framework Directive. Eur. J. Phycol. 2013, 48, 437–450. [Google Scholar] [CrossRef]
  4. Juggins, S.; Kelly, M.; Allott, T.; Kelly-Quinn, M.; Monteith, D. A Water Framework Directive-compatible metric for assessing acidification in UK and Irish rivers using diatoms. Sci. Total Environ. 2016, 568, 671–678. [Google Scholar] [CrossRef] [Green Version]
  5. Poikane, S.; Kelly, M.; Cantonati, M. Benthic algal assessment of ecological status in European lakes and rivers: Challenges and opportunities. Sci. Total Environ. 2016, 568, 603–613. [Google Scholar] [CrossRef] [PubMed]
  6. Kelly, M.; Bennion, H.; Burgess, A.; Ellis, J.; Juggins, S.; Guthrie, R.; Jamieson, J.; Adriaenssens, V.; Yallop, M. Uncertainty in ecological status assessments of lakes and rivers using diatoms. Hydrobiologia 2009, 633, 5–15. [Google Scholar] [CrossRef]
  7. Stoate, C.; Boatman, N.D.; Borralho, R.J.; Carvalho, C.R.; de Snoo, G.R.; Eden, P. Ecological impacts of arable intensification in Europe. J. Environ. Manag. 2001, 63, 337–365. [Google Scholar] [CrossRef]
  8. Wood, T.M. Herbicide Use in the Management of Roadside Vegetation, Western Oregon, 1999–2000: Effects on the Water Quality of nearby Streams; Report 01-4065; US Department of the Interior, US Geological Survey: Reston, VA, USA, 2001. [CrossRef]
  9. Hanke, I.; Wittmer, I.; Bischofberger, S.; Stamm, C.; Singer, H. Relevance of urban glyphosate use for surface water quality. Chemosphere 2010, 81, 422–429. [Google Scholar] [CrossRef]
  10. Coupe, R.H.; Kalkhoff, S.J.; Capel, P.D.; Gregoire, C. Fate and transport of glyphosate and aminomethylphosphonic acid in surface waters of agricultural basins. Pest Manag. Sci. 2012, 68, 16–30. [Google Scholar] [CrossRef]
  11. Lupi, L.; Bedmar, F.; Puricelli, M.; Marino, D.; Aparicio, V.C.; Wunderlin, D.; Miglioranza, K.S. Glyphosate runoff and its occurrence in rainwater and subsurface soil in the nearby area of agricultural fields in Argentina. Chemosphere 2019, 225, 906–914. [Google Scholar] [CrossRef]
  12. Debenest, T.; Silvestre, J.; Coste, M.; Pinelli, E. Effects of Pesticides on Freshwater Diatoms. In Reviews of Environmental Contamination and Toxicology; Springer: New York, NY, USA, 2010; pp. 87–103. [Google Scholar]
  13. Pesce, S.; Bouchez, A.; Montuelle, B. Effects of organic herbicides on phototrophic microbial communities in freshwater ecosystems. Rev. Environ. Contam. Toxicol. 2011, 214, 87–124. [Google Scholar] [CrossRef]
  14. Roubeix, V.; Mazzella, N.; Méchin, B.; Coste, M.; Delmas, F. Impact of the herbicide metolachlor on river periphytic diatoms: Experimental comparison of descriptors at different biological organization levels. Ann. De Limnol. Int. J. Limnol. 2011, 47, 239–249. [Google Scholar] [CrossRef] [Green Version]
  15. Segner, H.; Schmitt-Jansen, M.; Sabater, S. Assessing the impact of multiple stressors on aquatic biota: The receptor's side matters. Environ. Sci. Technol. 2014, 48, 7690–7696. [Google Scholar] [CrossRef]
  16. Begon, M.; Harper, J.L.; Townsend, C.R. Ecology: Individuals, Populations and Communities, 3rd ed.; Blackwell Science: Oxford, UK, 1999; ISBN 0632038012. [Google Scholar]
  17. Guasch, H.; Lehmann, V.; van Beusekom, B.; Sabater, S.; Admiraal, W. Influence of phosphate on the response of periphyton to atrazine exposure. Arch. Environ. Contam. Toxicol. 2007, 52, 32–37. [Google Scholar] [CrossRef] [PubMed]
  18. Guasch, H.; Ivorra, N.; Lehmann, V.; Paulsson, M.; Real, M.; Sabater, S. Community composition and sensitivity of periphyton to atrazine in flowing waters: The role of environmental factors. J. Appl. Phycol. 1998, 10, 203–213. [Google Scholar] [CrossRef] [Green Version]
  19. Schmitt-Jansen, M.; Altenburger, R. Toxic effects of isoproturon on periphyton communities—A microcosm study. Estuar. Coast. Shelf Sci. 2005, 62, 539–545. [Google Scholar] [CrossRef]
  20. Larras, F.; Bouchez, A.; Rimet, F.; Montuelle, B. Using bioassays and species sensitivity distributions to assess herbicide toxicity towards benthic diatoms. PLoS ONE 2012, 7, e44458. [Google Scholar] [CrossRef] [Green Version]
  21. Pohlon, E.; Marxsen, J.; Küsel, K. Pioneering bacterial and algal communities and potential extracellular enzyme activities of stream biofilms. FEMS Microbiol. Ecol. 2010, 71, 364–373. [Google Scholar] [CrossRef] [PubMed] [Green Version]
  22. Biggs, B.J.; Stevenson, R.J.; Lowe, R.L. A habitat matrix conceptual model for stream periphyton. Arch. Fur Hydrobiol. 1998, 143, 21–56. [Google Scholar] [CrossRef]
  23. Sabater, S.; Vilalta, E.; Gaudes, A.; Guasch, H.; Muñoz, I.; Romaní, A. Ecological implications of mass growth of benthic cyanobacteria in rivers. Aquat. Microb. Ecol. 2003, 32, 175–184. [Google Scholar] [CrossRef] [Green Version]
  24. Brasell, K.A.; Heath, M.W.; Ryan, K.G.; Wood, S.A. Successional change in microbial communities of benthic Phormidium-dominated biofilms. Microb. Ecol. 2015, 69, 254–266. [Google Scholar] [CrossRef]
  25. Paule, A.; Roubeix, V.; Lauga, B.; Duran, R.; Delmas, F.; Paul, E.; Rols, J.L. Changes in tolerance to herbicide toxicity throughout development stages of phototrophic biofilms. Aquat. Toxicol. 2013, 144–145, 310–321. [Google Scholar] [CrossRef] [Green Version]
  26. Yallop, M.L.; Kelly, M.G. From pattern to process: Understanding stream phytobenthic assemblages and implications for determining “ecological status”. Nova Hedwig. Beih. 2006, 130, 357–372. [Google Scholar]
  27. Sabio, Y.; García, C.A.; Vera, M.S.; Vinocur, A.; Graziano, M.; Miranda, C.; Pizarro, H.N. Rethinking the term “glyphosate effect” through the evaluation of different glyphosate-based herbicide effects over aquatic microbial communities. Environ. Pollut. 2022, 292, 118382. [Google Scholar] [CrossRef]
  28. Brovini, E.M.; Cardoso, S.J.; Quadra, G.R.; Vilas-Boas, J.A.; Paranaíba, J.R.; Pereira, R.d.O.; Mendonça, R.F. Glyphosate concentrations in global freshwaters: Are aquatic organisms at risk? Environ. Sci. Pollut. Res. Int. 2021, 28, 60635–60648. [Google Scholar] [CrossRef] [PubMed]
  29. Székács, A.; Darvas, B. Re-registration Challenges of Glyphosate in the European Union. Front. Environ. Sci. 2018, 6, 78. [Google Scholar] [CrossRef] [Green Version]
  30. van Bruggen, A.H.C.; He, M.M.; Shin, K.; Mai, V.; Jeong, K.C.; Finckh, M.R.; Morris, J.G. Environmental and health effects of the herbicide glyphosate. Sci. Total Environ. 2018, 616–617, 255–268. [Google Scholar] [CrossRef]
  31. Agathokleous, E. European Union’s imminent ban on glyphosate: Hormesis should be considered in new chemical screening and selection. J. For. Res. 2022, 33, 1103–1107. [Google Scholar] [CrossRef]
  32. Hébert, M.-P.; Fugère, V.; Gonzalez, A. The overlooked impact of rising glyphosate use on phosphorus loading in agricultural watersheds. Front. Ecol. Environ. 2019, 17, 48–56. [Google Scholar] [CrossRef] [Green Version]
  33. Marín-Benito, J.M.; Carpio, M.J.; Mamy, L.; Andrades, M.S.; Sánchez-Martín, M.J.; Rodríguez-Cruz, M.S. Field measurement and modelling of chlorotoluron and flufenacet persistence in unamended and amended soils. Sci. Total Environ. 2020, 725, 138374. [Google Scholar] [CrossRef]
  34. Beckie, H.J.; Flower, K.C.; Ashworth, M.B. Farming without Glyphosate? Plants 2020, 9, 96. [Google Scholar] [CrossRef] [Green Version]
  35. Carabias-Martínez, R. Determination of herbicides, including thermally labile phenylureas, by solid-phase microextraction and gas chromatography–mass spectrometry. J. Chromatogr. 2003, 1002, 1–12. [Google Scholar] [CrossRef]
  36. Annett, R.; Habibi, H.R.; Hontela, A. Impact of glyphosate and glyphosate-based herbicides on the freshwater environment. J. Appl. Toxicol. 2014, 34, 458–479. [Google Scholar] [CrossRef]
  37. Ledger, M.E.; Harris, R.M.L.; Armitage, P.D.; Milner, A.M. Realism of model ecosystems: An evaluation of physicochemistry and macroinvertebrate assemblages in artificial streams. Hydrobiologia 2009, 617, 91–99. [Google Scholar] [CrossRef]
  38. Sabater, S.; Guasch, H.; Ricart, M.; Romaní, A.; Vidal, G.; Klünder, C.; Schmitt-Jansen, M. Monitoring the effect of chemicals on biological communities. The biofilm as an interface. Anal. Bioanal. Chem. 2007, 387, 1425–1434. [Google Scholar] [CrossRef]
  39. Gold, C.; Feurtet-Mazel, A.; Coste, M.; Boudou, A. Effects of cadmium stress on periphytic diatom communities in indoor artificial streams. Freshw. Biol. 2003, 48, 316–328. [Google Scholar] [CrossRef]
  40. Cedergreen, N.; Streibig, J.C. The toxicity of herbicides to non-target aquatic plants and algae: Assessment of predictive factors and hazard. Pest Manag. Sci. 2005, 61, 1152–1160. [Google Scholar] [CrossRef]
  41. Ma, J.Y.; Wang, S.F.; Wang, P.W.; Ma, L.J.; Chen, X.L.; Xu, R.F. Toxicity assessment of 40 herbicides to the green alga Raphidocelis subcapitata. Ecotoxicol. Environ. Saf. 2006, 63, 456–462. [Google Scholar] [CrossRef]
  42. Cairns, J.; Niederlehner, B.R. (Eds.) Ecological Toxicity Testing. Scale, Complexity, and Relevance; Lewis Publishers: Boca Raton, FL, USA, 1995; ISBN 978-0873715997. [Google Scholar]
  43. Jassby, A.D.; Platt, T. Mathematical formulation of the relationship between photosynthesis and light for phytoplankton. Limnol. Oceanogr. 1976, 21, 540–547. [Google Scholar] [CrossRef] [Green Version]
  44. Lorenzen, C.J. Determination of Chlorophyll and Pheo-Pigments: Spectrophotometric Equations. Limnol. Oceanogr. 1967, 12, 343–346. [Google Scholar] [CrossRef]
  45. Porter, K.G.; Feig, Y.S. The use of DAPI for identifying and counting aquatic microflora. Limnol. Oceanogr. 1980, 25, 943–948. [Google Scholar] [CrossRef]
  46. Sherr, E.B.; Sherr, B.F. Preservation and storage of samples for enumeration of heterotrophic protists. Handbook of methods in aquatic microbial ecology. In Handbook of Methods in Aquatic Microbial Ecology; Kemp, P.F., Sherr, B.F., Sherr, E.B., Cole, J.J., Eds.; CRC Press: Boca Raton, FL, USA; London, UK; New York, NY, USA, 1993; pp. 207–212. ISBN 9780203752746. [Google Scholar]
  47. Carpenter, A.E.; Jones, T.R.; Lamprecht, M.R.; Clarke, C.; Kang, H.; Friman, O.; Guertin, D.A.; Chang, J.H.; Lindquist, R.A.; Moffat, J.; et al. CellProfiler: Image analysis software for identifying and quantifying cell phenotypes. Genome Biol. 2006, 7, R100. [Google Scholar] [CrossRef] [PubMed]
  48. Vokes, M.S.; Carpenter, A.E. Using CellProfiler for Automatic Identification and Measurement of Biological Objects in Images. Curr. Protoc. Mol. Biol. 2008, 82, 14.17.1–14.17.12. [Google Scholar] [CrossRef] [PubMed] [Green Version]
  49. Brierley, B.; Carvalho, L.; Davies, S.; Krokowski, J. Guidance on the Quantitative Analysis of Phytoplankton in Freshwater Samples; Report to SNIFFER (Project WFD80); Edinburgh, Scotland, 2007. [Google Scholar]
  50. Cox, E.J. Identification of Freshwater Diatoms from Live Material; Chapman and Hall: London, UK, 1996. [Google Scholar]
  51. Gutowski, A.; Foerster, J. Benthische Algen ohne Diatomeen und Characeen. Bestimmungshilfe; LANUV-Arbeitsblatt: Recklinghausen, Germany, 2009; Volume 9. [Google Scholar]
  52. John, D.M. (Ed.) The Freshwater Algal Flora of the British Isles: An Identification Guide to Freshwater and Terrestrial Algae, 2nd ed.; Cambridge University Press: Cambridge, UK, 2011; ISBN 978-1108478007. [Google Scholar]
  53. Guiry, M.D. AlgaeBase. World-Wide Electronic Publication. Available online: http://www.algaebase.org (accessed on 16 October 2022).
  54. Bock, C.; Krienitz, L.; Pröschold, T. Taxonomic reassessment of the genus Chlorella (Trebouxiophyceae) using molecular signatures (barcodes), including description of seven new species. FOTTEA 2011, 11, 293–312. [Google Scholar] [CrossRef] [Green Version]
  55. Leliaert, F.; Smith, D.R.; Moreau, H.; Herron, M.D.; Verbruggen, H.; Delwiche, C.F.; de Clerck, O. Phylogeny and Molecular Evolution of the Green Algae. Crit. Rev. Plant Sci. 2012, 31, 1–46. [Google Scholar] [CrossRef] [Green Version]
  56. Neustupa, J.; Němcová, Y.; Veselá, J.; Steinová, J.; Škaloud, P. Parachloroidium gen. nov. (Trebouxiophyceae, Chlorophyta), a novel genus of coccoid green algae from subaerial corticolous biofilms. Phycologia 2013, 52, 411–421. [Google Scholar] [CrossRef] [Green Version]
  57. Hillebrand, H.; Dürselen, C.-D.; Kirschtel, D.; Pollingher, U.; Zohary, T. Biovolume Calculation for Pelagic and Benthic Microalgae. J. Phycol. 1999, 35, 403–424. [Google Scholar] [CrossRef]
  58. OECD. Test No. 201: Freshwater Alga and Cyanobacteria, Growth Inhibition Test: OECD Guidelines for the Testing of Chemicals, Section 2; OECD Publishing: Paris, France, 2006; ISBN 9789264069923. [Google Scholar] [CrossRef] [Green Version]
  59. Tang, J.; Hoagland, K.D.; Siegfried, B.D. Uptake and Bioconcentration of Atrazine by Selected Freshwater Algae. Environ. Toxicol. Chem. 1998, 17, 1085–1090. [Google Scholar] [CrossRef]
  60. Moro, C.V.; Bricheux, G.; Portelli, C.; Bohatier, J. Comparative effects of the herbicides chlortoluron and mesotrione on freshwater microalgae. Environ. Toxicol. Chem. 2012, 31, 778–786. [Google Scholar] [CrossRef]
  61. Anton, F.A.; Ariz, M.; Alia, M. Ecotoxic effects of four herbicides (glyphosate, alachlor, chlortoluron and isoproturon) on the algae Chlorella pyrenoidosa Chick. Sci. Total Environ. 1993, 134, 845–851. [Google Scholar] [CrossRef]
  62. Guasch, H.; Admiraal, W.; Sabater, S. Contrasting effects of organic and inorganic toxicants on freshwater periphyton. Aquat. Toxicol. 2003, 64, 165–175. [Google Scholar] [CrossRef]
  63. Gerbersdorf, S.U.; Westrich, B.; Paterson, D.M. Microbial extracellular polymeric substances (EPS) in fresh water sediments. Microb. Ecol. 2009, 58, 334–349. [Google Scholar] [CrossRef] [PubMed]
  64. Rimet, F.; Bouchez, A. Use of diatom life-forms and ecological guilds to assess pesticide contamination in rivers: Lotic mesocosm approaches. Ecol. Indic. 2011, 11, 489–499. [Google Scholar] [CrossRef] [Green Version]
  65. Pérès, F.; Florin, D.; Grollier, T.; Feurtet-Mazel, A.; Coste, M.; Ribeyre, F.; Ricard, M.; Boudou, A. Effects of the phenylurea herbicide isoproturon on periphytic diatom communities in freshwater indoor microcosms. Environ. Pollut. 1996, 94, 141–152. [Google Scholar] [CrossRef]
  66. Gomes, M.P.; Le Manac'h, S.G.; Hénault-Ethier, L.; Labrecque, M.; Lucotte, M.; Juneau, P. Glyphosate-Dependent Inhibition of Photosynthesis in Willow. Front. Plant Sci. 2017, 8, 207. [Google Scholar] [CrossRef] [Green Version]
  67. Tsui, M.T.; Chu, L.M. Aquatic toxicity of glyphosate-based formulations: Comparison between different organisms and the effects of environmental factors. Chemosphere 2003, 52, 1189–1197. [Google Scholar] [CrossRef]
  68. Romero, D.M.; Ríos de Molina, M.C.; Juárez, A.B. Oxidative stress induced by a commercial glyphosate formulation in a tolerant strain of Chlorella kessleri. Ecotoxicol. Envion. Saf. 2011, 74, 741–747. [Google Scholar] [CrossRef] [PubMed]
  69. Sasal, M.C.; Wilson, M.G.; Sione, S.M.; Beghetto, S.M.; Gabioud, E.A.; Oszust, J.D.; Paravani, E.V.; Demonte, L.; Repetti, M.R.; Bedendo, D.J.; et al. Monitoring of glyphosate in surface water in the province of Entre Ríos. Participatory action research as a collaborative methodology. Rev. De Investig. Agropecu. 2017, 43, 195–205. [Google Scholar]
  70. Tajnaiová, L.; Vurm, R.; Kholomyeva, M.; Kobera, M.; Kočí, V. Determination of the Ecotoxicity of Herbicides Roundup® Classic Pro and Garlon New in Aquatic and Terrestrial Environments. Plants 2020, 9, 1203. [Google Scholar] [CrossRef]
  71. Nagy, K.; Tessema, R.A.; Budnik, L.T.; Ádám, B. Comparative cyto- and genotoxicity assessment of glyphosate and glyphosate-based herbicides in human peripheral white blood cells. Environ. Res. 2019, 179, 108851. [Google Scholar] [CrossRef]
  72. Lozano, V.L.; Vinocur, A.; Sabio y García, C.A.; Allende, L.; Cristos, D.S.; Rojas, D.; Wolansky, M.; Pizarro, H. Effects of glyphosate and 2,4-D mixture on freshwater phytoplankton and periphyton communities: A microcosms approach. Ecotoxicol. Environ. Saf. 2018, 148, 1010–1019. [Google Scholar] [CrossRef]
  73. Goldsborough, L.G.; Robinson, G.G.C. Pattern in wetlands. In Algal Ecology; Elsevier: Amsterdam, The Netherlands, 1996; pp. 77–109. ISBN 9780126684506. [Google Scholar]
  74. Singh, S.; Kumar, V.; Gill, J.P.K.; Datta, S.; Singh, S.; Dhaka, V.; Kapoor, D.; Wani, A.B.; Dhanjal, D.S.; Kumar, M.; et al. Herbicide Glyphosate: Toxicity and Microbial Degradation. Int. J. Environ. Res. Public Health 2020, 17, 7519. [Google Scholar] [CrossRef] [PubMed]
  75. Stevenson, J.R.; Peterson, C.G. Emigration and immigration can be important determinants of benthic diatom assemblages in streams. Freshw. Biol. 1991, 26, 279–294. [Google Scholar] [CrossRef]
  76. Bothwell, M.L. Phosphorus–Limited Growth Dynamics of Lotic Periphytic Diatom Communities: Areal Biomass and Cellular Growth Rate Responses. Can. J. Fish. Aquat. Sci. 1989, 46, 1293–1301. [Google Scholar] [CrossRef]
  77. Peterson, C.G. Response of Benthic Algal Communities to Natural Physical Disturbance. In Algal Ecology; Elsevier: Amsterdam, The Netherlands, 1996; pp. 375–402. ISBN 9780126684506. [Google Scholar]
  78. Yallop, M.; Wang, Y.; Masuda, S.; Daniels, J.; Ockenden, A.; Masani, H.; Scott, T.B.; Xie, F.; Ryan, M.; Jones, C.; et al. Quantifying impacts of titanium dioxide nanoparticles on natural assemblages of riverine phytobenthos and phytoplankton in an outdoor setting. Sci. Total Environ. 2022, 831, 154616. [Google Scholar] [CrossRef]
  79. Hill, W.R.; Boston, H.L. Community development alters photosynthesis-irradiance relations in stream periphyton. Limnol. Oceanogr. 1991, 36, 1375–1389. [Google Scholar] [CrossRef]
  80. Wood, R.J.; Mitrovic, S.M.; Lim, R.P.; Kefford, B.J. How benthic diatoms within natural communities respond to eight common herbicides with different modes of action. Sci. Total Environ. 2016, 557–558, 636–643. [Google Scholar] [CrossRef]
  81. Vera, M.S.; Di Fiori, E.; Lagomarsino, L.; Sinistro, R.; Escaray, R.; Iummato, M.M.; Juárez, A.; Del Ríos de Molina, M.C.; Tell, G.; Pizarro, H. Direct and indirect effects of the glyphosate formulation Glifosato Atanor® on freshwater microbial communities. Ecotoxicology 2012, 21, 1805–1816. [Google Scholar] [CrossRef]
  82. Magbanua, F.S.; Townsend, C.R.; Hageman, K.J.; Lange, K.; Lear, G.; Lewis, G.D.; Matthaei, C.D. Understanding the combined influence of fine sediment and glyphosate herbicide on stream periphyton communities. Water Res. 2013, 47, 5110–5120. [Google Scholar] [CrossRef]
  83. Sylwestrzak, Z.; Zgrundo, A.; Pniewski, F. Ecotoxicological Studies on the Effect of Roundup® (Glyphosate Formulation) on Marine Benthic Microalgae. Int. J. Environ. Res. Public Health 2021, 18, 884. [Google Scholar] [CrossRef]
  84. Perez, G.L.; Torremorell, A.; Mugni, H.; Rodriguez, P.; Vera, M.S.; Do Nascimento, M.; Allende, L.; Bustingorry, J.; Escaray, R.; Ferraro, M.; et al. Effects of the herbicide roundup on freshwater microbial communities: A mesocosm study. Ecol. Appl. 2007, 17, 2310–2322. [Google Scholar] [CrossRef] [Green Version]
  85. Vera, M.S.; Lagomarsino, L.; Sylvester, M.; Pérez, G.L.; Rodríguez, P.; Mugni, H.; Sinistro, R.; Ferraro, M.; Bonetto, C.; Zagarese, H.; et al. New evidences of Roundup (glyphosate formulation) impact on the periphyton community and the water quality of freshwater ecosystems. Ecotoxicology 2010, 19, 710–721. [Google Scholar] [CrossRef] [PubMed]
  86. Pizarro, H.; Vera, M.S.; Vinocur, A.; Pérez, G.; Ferraro, M.; Menéndez Helman, R.J.; Dos Santos Afonso, M. Glyphosate input modifies microbial community structure in clear and turbid freshwater systems. Environ. Sci. Pollut. Res. Int. 2016, 23, 5143–5153. [Google Scholar] [CrossRef] [PubMed]
  87. Sura, S.; Waiser, M.; Tumber, V.; Farenhorst, A. Effects of herbicide mixture on microbial communities in prairie wetland ecosystems: A whole wetland approach. Sci. Total Environ. 2012, 435–436, 34–43. [Google Scholar] [CrossRef] [PubMed]
  88. Saxton, M.A.; Morrow, E.A.; Bourbonniere, R.A.; Wilhelm, S.W. Glyphosate influence on phytoplankton community structure in Lake Erie. J. Great Lakes Res. 2011, 37, 683–690. [Google Scholar] [CrossRef]
  89. Austin, A.P.; Harris, G.E.; Lucey, W.P. Impact of an Organophosphate Herbicide (Glyphosate) on Periphyton Communities Developed in Experimental Streams. Bull. Environ. Contam. Toxicol. 1991, 47, 29–35. [Google Scholar] [CrossRef]
  90. Bowes, M.J.; Neal, C.; Jarvie, H.P.; Smith, J.T.; Davies, H.N. Predicting phosphorus concentrations in British rivers resulting from the introduction of improved phosphorus removal from sewage effluent. Sci. Total Environ. 2010, 408, 4239–4250. [Google Scholar] [CrossRef]
  91. Bowes, M.J.; Smith, J.T.; Neal, C.; Leach, D.V.; Scarlett, P.M.; Wickham, H.D.; Harman, S.A.; Armstrong, L.K.; Davy-Bowker, J.; Haft, M.; et al. Changes in water quality of the River Frome (UK) from 1965 to 2009: Is phosphorus mitigation finally working? Sci. Total Environ. 2011, 409, 3418–3430. [Google Scholar] [CrossRef]
  92. Roubeix, V.; Mazzella, N.; Delmas, F.; Coste, M. In situ evaluation of herbicide effects on the composition of river periphytic diatom communities in a region of intensive agriculture. Vie Et Milieu Life Environ. 2010, 60, 233–241. [Google Scholar]
  93. Rier, S.T.; Stevenson, R.J. Response of Periphytic Algae to Gradients in Nitrogen and Phosphorus in Streamside Mesocosms. Hydrobiologia 2006, 561, 131–147. [Google Scholar] [CrossRef]
  94. EFSA Panel on Plant Protection Products and their Residues. Scientific Opinion on the development of specific protection goal options for environmental risk assessment of pesticides, in particular in relation to the revision of the Guidance Documents on Aquatic and Terrestrial Ecotoxicology (SANCO/3268/2001 and SA). EFSA J. 2010, 8, 1821. [Google Scholar] [CrossRef] [Green Version]
  95. Kelly, M. Simplicity is the ultimate sophistication: Building capacity to meet the challenges of the Water Framework Directive. Ecol. Indic. 2014, 36, 519–523. [Google Scholar] [CrossRef]
  96. DeLorenzo, M.E.; Scott, G.I.; Ross, P.E. Toxicity of pesticides to aquatic microorganisms: A review. Environ. Toxicol. Chem. 2001, 20, 84. [Google Scholar] [CrossRef] [PubMed]
  97. Potapova, M.; Charles, D.F. Diatom metrics for monitoring eutrophication in rivers of the United States. Ecol. Indic. 2007, 7, 48–70. [Google Scholar] [CrossRef]
Figure 1. (a) Experimental stream channels at the former FBA Rivers Lab, Dorset, UK, fed directly from the Mill Stream. Glass slides, held in phytometers, were used to grow phytobenthic biofilms. (b) Self-contained flumes with recirculating water for short-pulse herbicide treatment.
Phycology 03 00003 g001
Figure 2. Impact of two herbicide treatments on the metabolic rate of phytobenthos: (a) areal rate of gross photosynthesis (GP) of phytobenthos; (b) biomass-specific maximum photosynthetic rate (SPmax); and phytobenthic community oxygen consumption where (c) areal-based community respiration rate (CR); (d) biomass-specific respiration rate (SR) normalised to organic content (ash-free dry mass). Values are means ± SE, n = 5, * = p < 0.05.
Phycology 03 00003 g002
Figure 3. Ratio between diatoms and green algae in control (Con) and herbicide-treated biofilms (chlorotoluron (CLT), glyphosate-based herbicide formulation (GBH), and the combined application glyphosate-based herbicide formulation + chlorotoluron (GBHC)) as (a) total number of cells and (b) total biovolume. Values are means ± SE, n = 3, * = p < 0.05, ** = p < 0.001.
Phycology 03 00003 g003
Figure 4. Axis 1 and 2 of NMDS, based on biovolumes of the entire species assemblage of the phytobenthos grown from inocula in the Mill Stream, a tributary of the River Frome, Dorset, UK. Treatments include control (CON), chlorotoluron (CLT), a glyphosate-based herbicide formulation (GBH), and the combined application of a glyphosate-based herbicide formulation + chlorotoluron (GBHC); each bubble represents the composition in a different flume; n = 3.
Phycology 03 00003 g004
Figure 5. Axis 1 and 2 of NMDS, based on the relative abundance of pennate diatoms grown in flumes using inocula from the Mill Stream, a tributary of the River Frome, Dorset, UK. Control (CON), chlorotoluron (CLT), glyphosate-based herbicide formulation (GBH), and the combined application glyphosate-based herbicide formulation + chlorotoluron (GBHC); each bubble represents different flume replicates for each treatment (n = 5): bubble plots of (a) the small naviculoid diatoms in the ‘sNav’ category, including Mayamaea atomus, Sellaphora nigri, Fistulifera saprophila and other poorly silicified taxa that fell within the same size range (<10 µm length); (b) the pooled category of diatoms assigned to Nitzschia palea and N. paleacea (‘Nipp’); (c) the relative abundance of Achnanthidium minutissimum; (d) the relative abundance of an adnate group comprising Cocconeis lineata, Planothidium frequentissimum, and P. rostratum (‘Copl’).
Phycology 03 00003 g005aPhycology 03 00003 g005b
Table 1. Phytobenthos biomass included areal chlorophyll a (Chl. a), dry mass (DM), and ash-free dry mass (AFDM), measured 36 h after removal following a short-term (12 h) herbicide pulse compared to control samples (CON) of unamended stream water. Herbicide treatments include chlorotoluron (CLT), glyphosate (GBH), and a mixture of the two herbicides (GBHC); values are means ± SE, n = 5, * = p < 0.05.
TreatmentChl. a
(µg cm−2)
DM
(mg cm−2)
AFDM
(mg cm−2)
CON2.98 ± 0.533.53 ± 0.711.05 ± 0.14
CLT2.25 ± 0.393.46 ± 0.951.12 ± 0.21
GBH0.73 ± 0.04 *1.94 ± 1.19 *0.81 ± 0.21
GBHC0.67 ± 0.06 *1.67 ± 0.48 *0.77 ± 0.09 *
Table 2. Areal biomass measures including chlorophyll (Chl. a), dry mass (DM), ash-free dry mass (AFDM), 4.5 days after end of exposure to a short-term (12 h) herbicide pulse compared to control treatments not exposed to herbicide; values are means ± SE, n = 5.
TreatmentChl. a
(µg cm−2)
DM
(mg cm−2)
AFDM
(mg cm−2)
CON2.24 ± 0.582.65 ± 0.580.89 ± 0.10
CLT2.71 ± 0.792.48 ± 0.550.85 ± 0.11
GBH2.38 ± 0.561.60 ± 0.350.78 ± 0.07
GBHC1.22 ± 0.341.19 ± 0.420.70 ± 0.09
Disclaimer/Publisher’s Note: The statements, opinions and data contained in all publications are solely those of the individual author(s) and contributor(s) and not of MDPI and/or the editor(s). MDPI and/or the editor(s) disclaim responsibility for any injury to people or property resulting from any ideas, methods, instructions or products referred to in the content.

