Article

Characterization of Redox Sensitive Brown Algal Mannitol-1-Phosphatases

by
Yoran Le Strat
1,†,
Thierry Tonon
2,*,†,
Catherine Leblanc
1 and
Agnès Groisillier
1,3
1
UMR 8227, Integrative Biology of Marine Models (LBI2M), Station Biologique de Roscoff (SBR), Sorbonne Université, CNRS, F-29680 Roscoff, France
2
Centre for Novel Agricultural Products, Department of Biology, University of York, York YO10 5DD, UK
3
US2B, UMR 6286, Nantes Université, CNRS, F-44000 Nantes, France
*
Author to whom correspondence should be addressed.
These authors contribute equally to this work.
Phycology 2023, 3(1), 1-12; https://doi.org/10.3390/phycology3010001
Submission received: 16 November 2022 / Revised: 13 December 2022 / Accepted: 19 December 2022 / Published: 23 December 2022

Abstract

:
Macroalgae (seaweeds) are key primary producers in marine coastal habitats and largely contribute to global ocean carbon fluxes. They also represent attractive renewable feedstock for the production of biofuels, food, feed, and bioactive. Brown algae are seaweeds that produce alginates and fucose containing sulfated polysaccharides in their cell wall and laminarin and mannitol for carbon storage. The availability of genomes of the kelp Saccharina japonica and of the filamentous Ectocarpus sp. paved the way for the biochemical characterization of recombinant enzymes involved in their polysaccharide and carbohydrates synthesis, including, notably, mannitol. Brown algal mannitol biosynthesis starts with the conversion of fructose-6-phospate into mannitol-1-phosphate (mannitol-1P), and this intermediate is hydrolysed by a haloacid dehalogenase phosphatase (M1Pase) to produce mannitol. We report here the biochemical characterization of a second M1Pase in Ectocarpus sp. (EsM1Pase1). Both Ectocarpus M1Pases were redox-sensitive enzymes, with EsM1Pase1 active only in presence of the reducing agent. Such catalytic properties have not been observed for any M1Pases yet. EsM1Pases were specific to mannitol-1-P, in contrast to S. japonica M1Pases that could act on other phosphorylated sugars. Finally, brown algal M1Pases formed two well-supported clades, with possible distinct subcellular localization and physiological role(s) under diverse environmental conditions and/or life cycle stages.

1. Introduction

Macroalgae, or seaweeds, are the dominant primary producers in marine vegetated coastal habitats and largely contribute to global ocean carbon fluxes [1]. Seaweeds also represent attractive feedstock for biofuels, nutraceuticals, or therapeutics production [2,3,4]. Based on a recent analysis (https://www.alliedmarketresearch.com/seaweed-market, accessed on 7 November 2022), the global seaweed market is expected to reach $9.1 billion by 2024, driven by the growing application of macroalgae in various industries. One aspect making macroalgae attractive to the industry is their high, diverse, and peculiar polysaccharide and carbohydrate contents compared to terrestrial plants [5,6]. Seaweeds are part of a polyphyletic group, including green algae, red algae, and brown algae. These latter contain in their cell wall alginates and fucose containing sulfated polysaccharides (FCSPs) and store photosynthesis-derived carbon by producing the beta-1,3-glucan laminarin and the sugar alcohol mannitol. This polyol can represent between 20 and 30% of the dry weight of brown seaweeds [7].
Recent advances in the molecular bases of biosynthetic pathways of cell wall polysaccharides (alginates, FCSPs) and mannitol have been made in Ectocarpus sp. and Saccharina japonica, in particular by the heterologous expression of candidate genes identified in their respective genomes [8,9]. The enzymatic characterization of recombinant proteins confirmed the functions of genes in coding for proteins involved in mannuronic acid (one component of alginates) and the FCSP metabolism of Ectocarpus sp. and S. japonica [10,11,12]. It has also enabled the biochemical analysis of several C5-epimerases catalysing the last step of alginate production (transformation of mannuronic acid into guluronic acid) [13,14,15] and, more recently, of the first brown algal alginate lyase [16] and 4-deoxy-L-erythro-5-hexoseulose uronate (DEHU) reductase [17]. Despite progress in recent years, the heterologous expression of brown algal genes and subsequent purification of recombinant proteins remains challenging, with most of the successful expression obtained so far using Escherichia coli as the host [18].
Regarding mannitol metabolism, changes in the content of this polyol in Ectocarpus sp. followed a diurnal cycle [19], with higher quantities at the end of the light period. The yields of mannitol were also influenced by seasonal variations, with higher amounts during the summer and autumn months [20]. The mannitol biosynthetic pathway in brown algae relies on two enzymatic activities: (i) mannitol-1-phosphate dehydrogenase (M1PDH) converts fructose-6-phosphate (fructose-6P) into mannitol-1-phosphate (mannitol-1P); (ii) mannitol-1-P is transformed into mannitol by a haloacid dehalogenase (HAD) type mannitol-1P phosphatase (or mannitol-1-phosphatase, M1Pase). The potential genes coding for such enzymes have been identified in Ectocarpus sp. by a mining genomic resource, allowing for the identification of three candidates for M1PDHs and two for M1Pases [21]. Moreover, in this alga, one M1PDH (EsM1PDH1) [22,23] and one M1Pase (EsM1Pase2) [24] have been previously biochemically characterized by heterologous expression in the E. coli. Ectocarpus sp. gene EsM1PDH1 and EsM1Pase2 have also been expressed in the model plant Arabidopsis thaliana [25] and the CO2-fixing Cupriavidus necator [26]. Chi et al. [27] have identified and characterized homolog genes in S. japonica. Other M1Pases have been characterized from diverse organisms. Native enzymes have been (partially) purified from the red macroalga Caloglossa continua [28], and the brown macroalgae Spatoglossum pacificum and Dictyota dichotoma [29]. Recombinant proteins have been studied for the phosphohistidine phosphotransferase M1Pase of the chicken parasite Eimeiria tenella [30], and for the HAD M1Pase module of a M1Pase/M1PDH fusion from the soil bacteria Acinetobacter baylyi [31]. A fusion protein of the green alga Micromonas pusilla containing a M1PDH module fused in C-terminal with a HAD type M1Pase module was also shown to enable the production of mannitol in both recombinant E. coli and cyanobacteria [32].
There are important differences between both Ectocarpus sp. M1Pases. Compared to EsM1Pase2, EsM1Pase1 features a unique N-terminal extension (85 aa) of an unknown function and has been predicted to localize in the chloroplast. Previous attempts to purify the recombinant native full-length and truncated (i.e., without the 85 aa extension) version of EsM1Pase1 has failed [24]. In this context, our study has several objectives: (i) the heterologous expression of the codon-optimized EsM1Pase1 gene in E. coli after the deletion of the signal peptide; (ii) the biochemical characterization of purified recombinant EsM1Pase1; (iii) the comparison of enzymatic characteristics between both EsM1Pases; (iv) the phylogenic analysis of brown algal M1Pases to investigate their potential grouping in distinct clades.

2. Materials and Methods

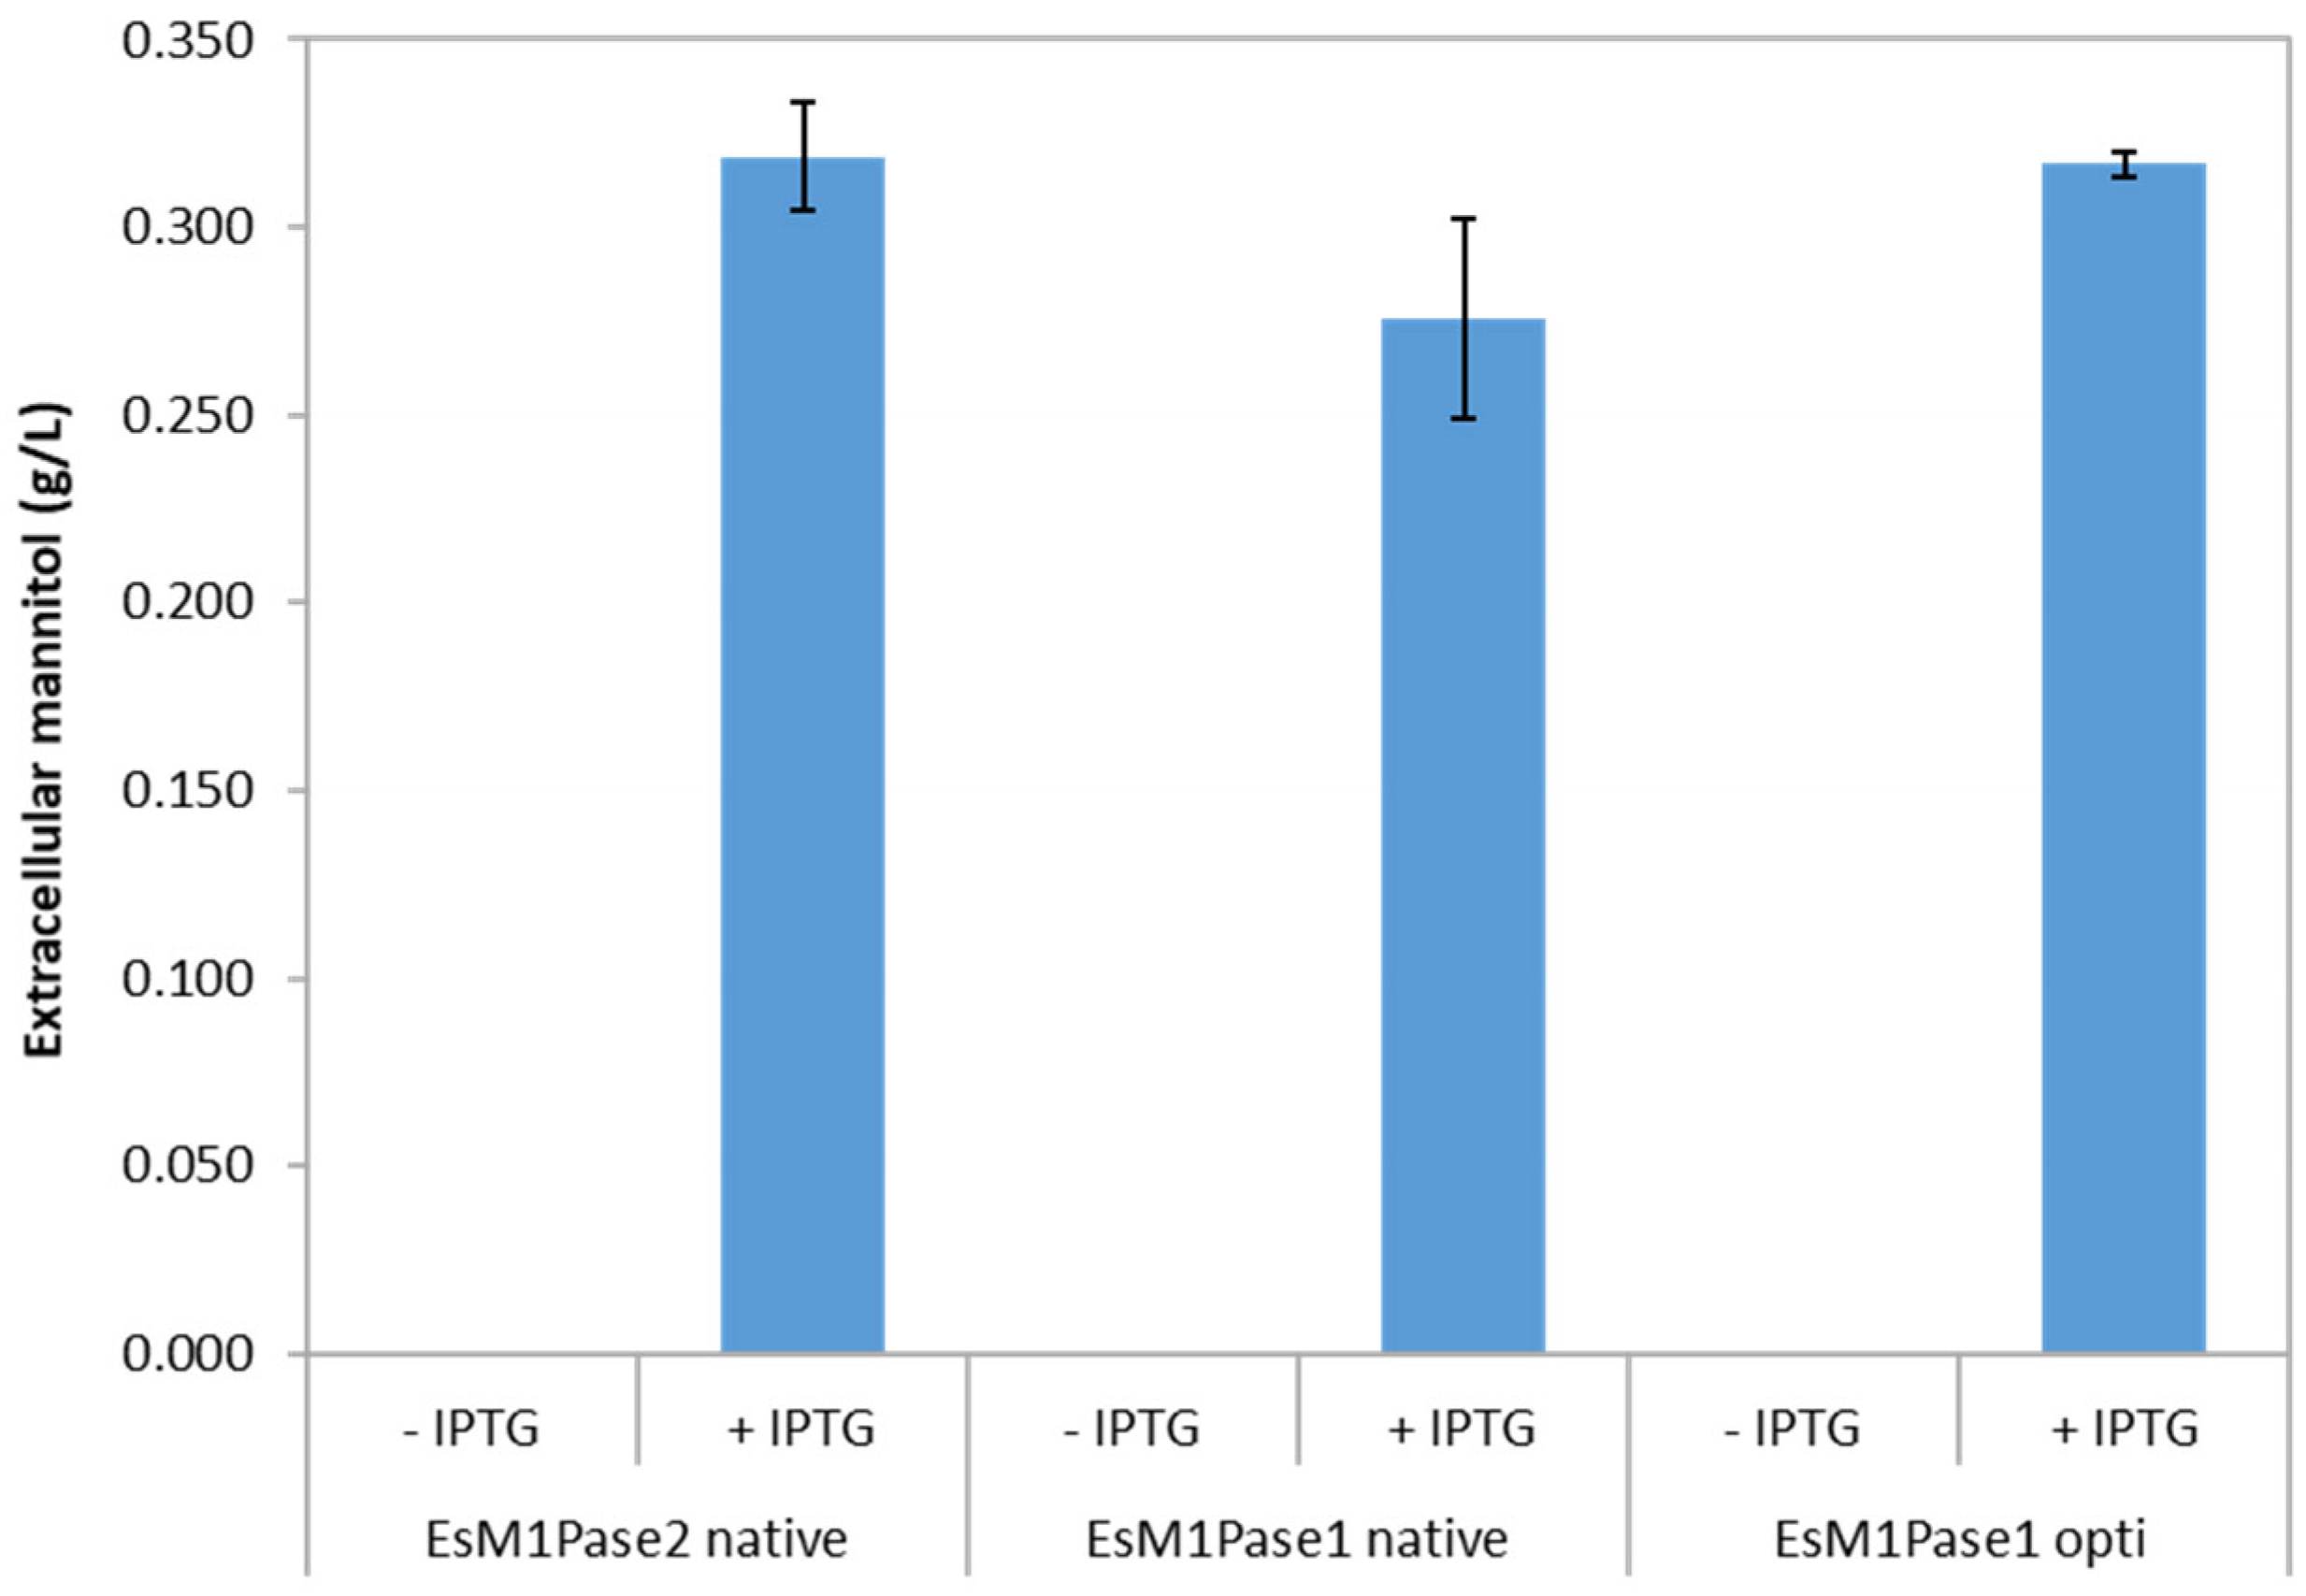
2.1. Mannitol Production by Ectocarpus sp. M1Pases in Escherichia coli

Recombinant E. coli cells expressing native full-length EsM1Pase1 and EsM1Pase2 were obtained as described by Groisillier et al. [24]. To improve the expression in E. coli, the gene coding for EsM1Pase1 (Esi0080_0016; UniProt accession number CBJ27643) was codon-optimized (GeneArt Gene Synthesis, Life Technologies, Rockford, IL, USA), amplified with the forward primer 5′-GGGGGGGGATCCGCGATGAAGCGGACCATACAGG-3′ (BamHI site in italic) and the reverse primer 5′-CCCCCCGAATTCTTATTCCCACACCGTCTTCCTGTCC-3′ (EcoRI site in italic), and cloned into the vector pFO4 to construct the plasmid pESM1Pase1opt. The sequence of this plasmid was verified by sequencing before the bacterial transformation.
Mannitol production in the E. coli BL21 (DE3) cells transformed with a plasmid containing full-length native EsM1Pase1, full-length E. coli codon-optimized ESM1Pase1, or EsM1Pase2, was assessed in triplicates for each gene. Pre-cultures of recombinant E. coli were grown in five mL of M9 medium supplemented with 10 g/L of glucose and 0.1 g/L ampicillin overnight at 37 °C and 200 rpm, and a subsequent experiment was conducted as described by Madsen et al. [32]. Briefly, these pre-cultures were used the next day to start new cultures at OD600 0.1 and were incubated until OD600 was 0.5. The cultures were then split in twice 5 mL for each clone, IPTG (1 mM final concentration) was added in one of the two tubes, and the culture proceeded 20 h at 25 °C and 200 rpm. After this incubation, cells were harvested by centrifugation at 3500× g for 10 min and supernatant frozen at −20 °C. Mannitol in the extracellular media was quantified using the D-Mannitol/L-Arabitol assay kit (K-MANOL, Megazyme) following the manufacturer’s instructions.

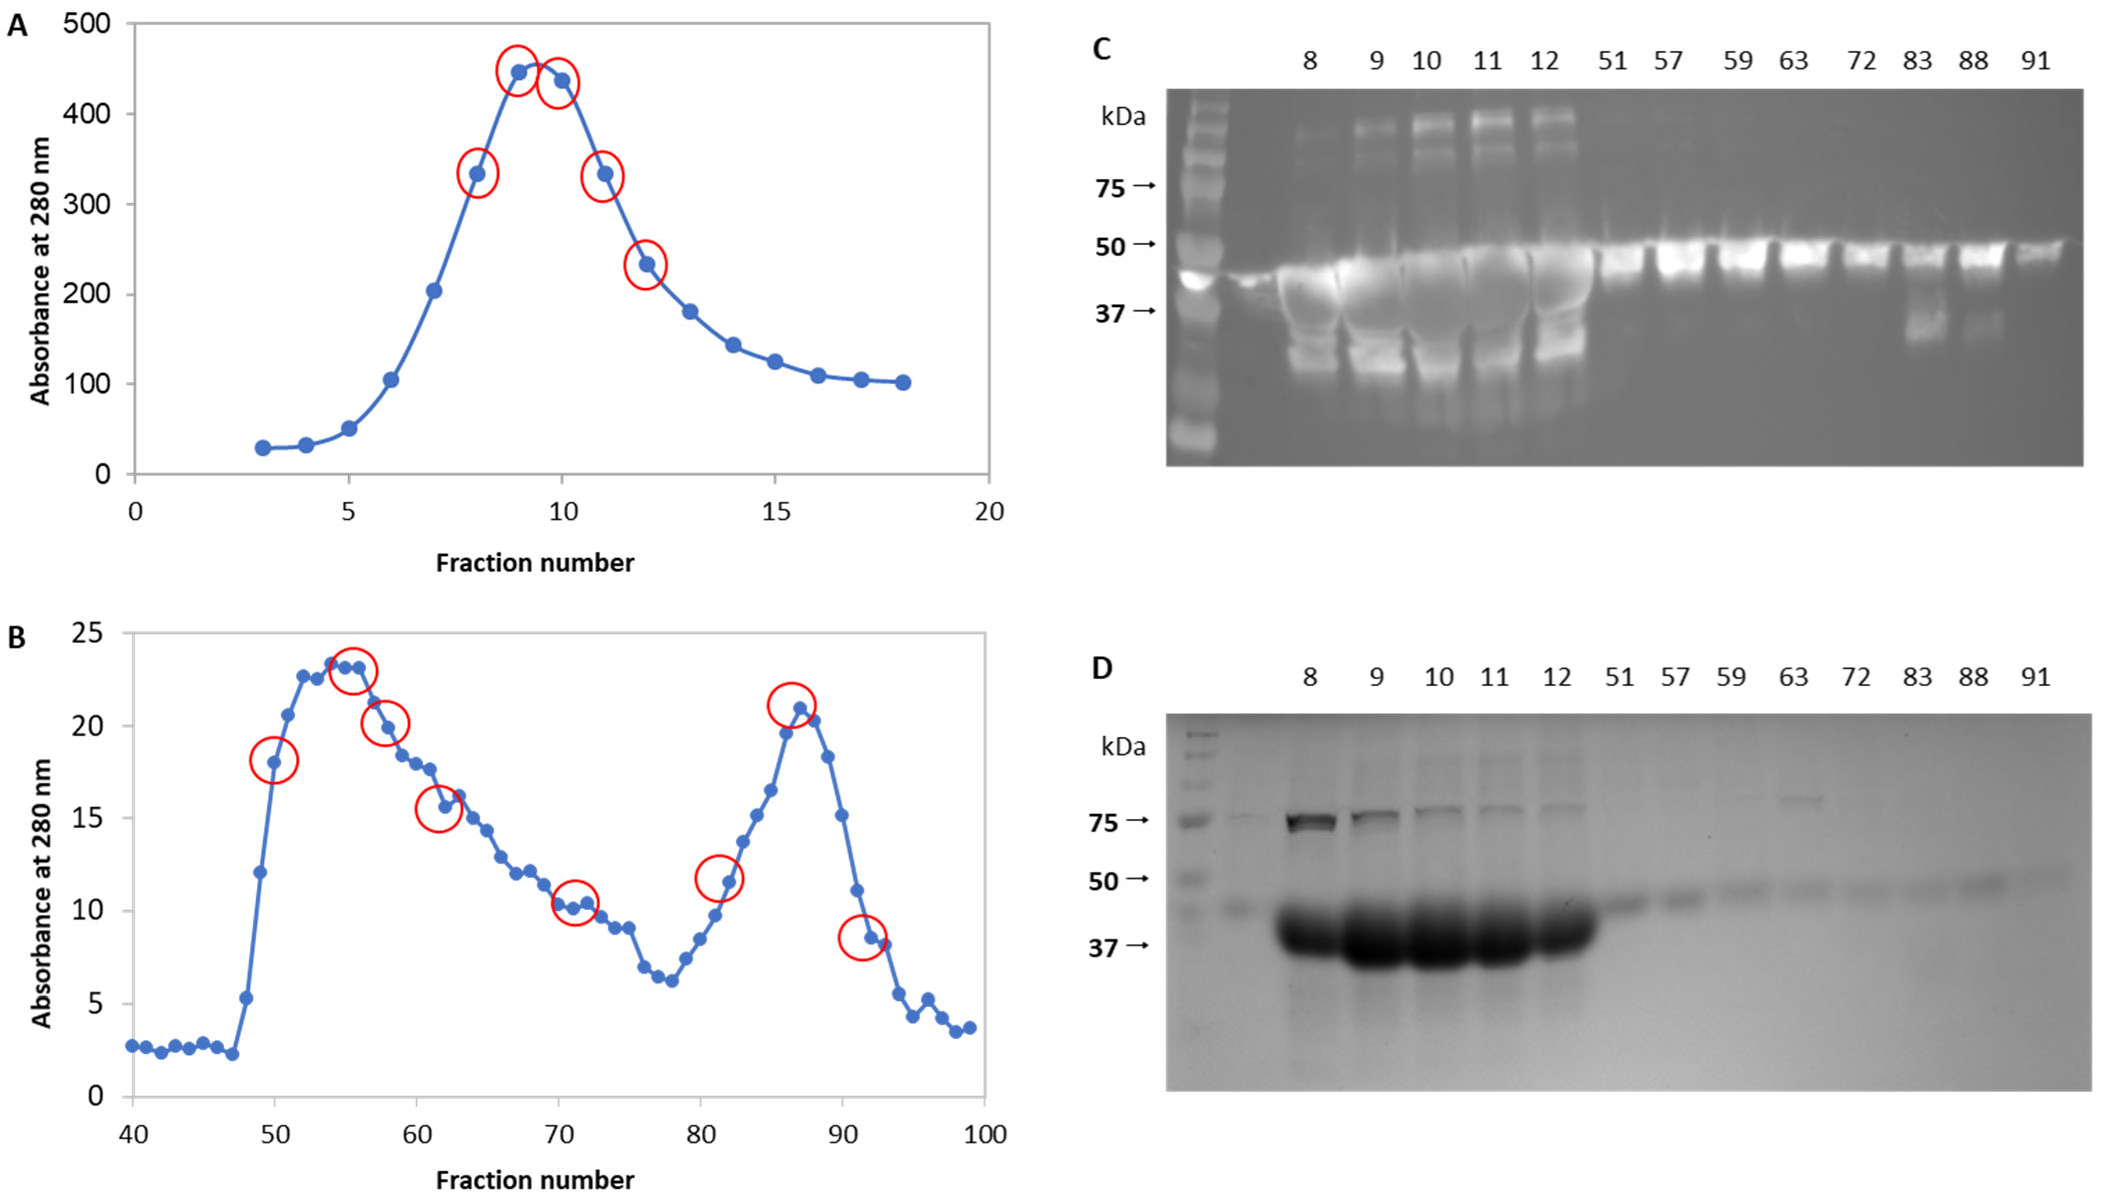
2.2. Production and Purification of EsM1Pase1short

The presence of a chloroplast transit peptide of 39 aa at the N terminus of EsM1Pase1 was predicted using HECTAR v1.3 [33], and the N-terminal boundary was refined by hydrophobic cluster analysis (HCA) [34]. Based on this, the EsM1Pase1short gene corresponding to aa 40 to 405 was amplified with the forward primer 5′-GGGGGGGGATCCACCGCAGCACATGTTAGCGCAG-3′ (BamHI restriction site in italic) and the reverse primer 5′-CCCCCCGAATTCTTATTCCCACACGGTTTTGCGATCCA-3′ (EcoRI restriction site in italic). This PCR fragment was cloned into the vector pFO4 (adding a six histidine tag at the N-terminus of the recombinant protein) to produce the plasmid pEsM1Pase1short. The integrity of the sequence was verified by sequencing.
E. coli strain BL21 (DE3) (Novagen(R)) was transformed with pEsM1Pase1short. To induce the production of the recombinant protein, a double induction medium was used. For this, transformed E. coli were grown in 500 mL of LB containing 0.5% glucose and 100 mg/mL ampicillin at 37 °C and were shaken at 180 rpm until OD600 reached 1.2–1.5. Protein expression was then induced by adding 500 mL of LB, previously stored at 4 °C, 50 mL of lactose 12% (w/v), 20 mL of HEPES 1 M, and IPTG at 0.1 mM final concentration. The cultures were further incubated for 20 h at 20 °C and 180 rpm.
The EsM1Pase1short protein was purified using a previously described method [23]. The procedure included a Ni2+ affinity chromatography step, and a size exclusion chromatography separation, after which some fractions were analysed by sodium dodecyl sulfate polyacrylamide gel electrophoresis (SDS-PAGE) using 12% Criterion precast Bis-Tris gels (BioRad, Hercules, CA, USA). Protein concentration was measured at 280 nm using a Nanodrop 2000 Spectrophotometer (Thermofisher, Waltham, MA, USA). A molar extinction coefficient of 28,670 M−1 cm−1, and a molecular weight of 41 kDa, both calculated for the EsM1Pase1short protein sequence at https://web.expasy.org/protparam (accessed on 14 September 2018), were considered to determine the concentration of the purified enzyme in the fractions of interest.

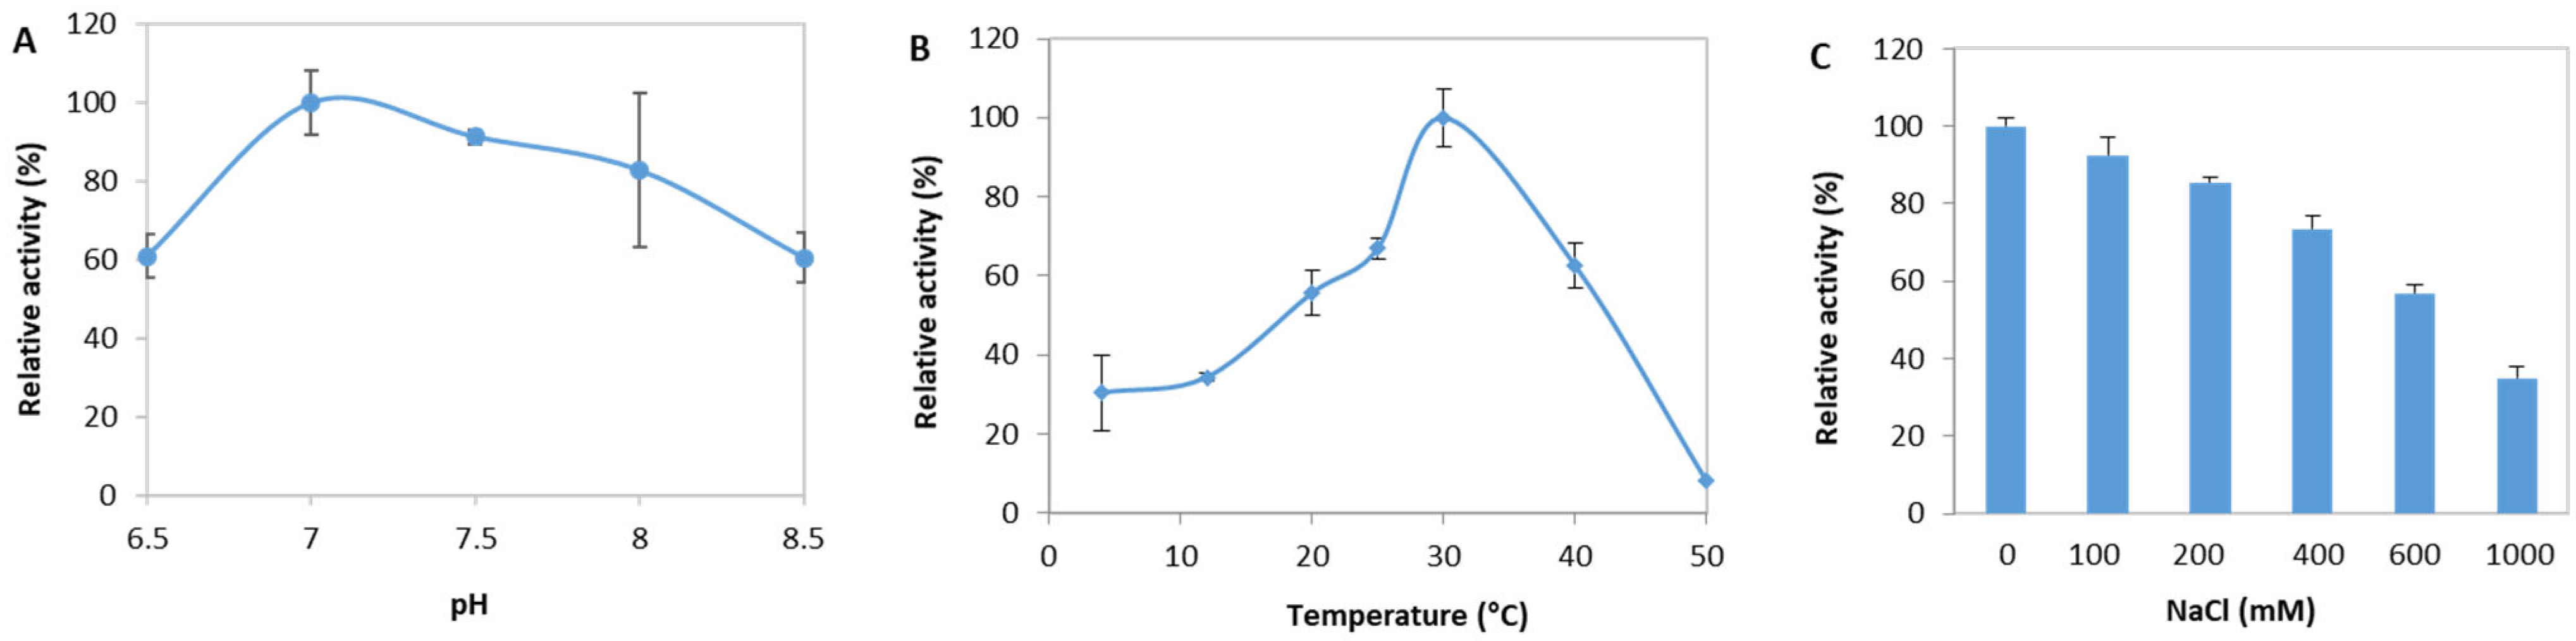
2.3. Biochemical Characterization of EsM1Pase1short

If not stated otherwise, all assays were carried out in technical triplicate at 30 °C in an 80 µL reaction assay. All compounds used were ordered from Sigma-Aldrich (St. Louis, MO, USA). EsM1Pase1short enzymatic activity was determined, as reported previously [24], with some modifications. The standard reaction mixtures contained 1 mM mannitol-1P, 100 mM M Tris-HCl (pH 7.5), 5 mM MgCl2, and 3 mM final concentration of reducing agent (DTT). Reactions were initiated by adding about 1 µg of purified recombinant EsM1Pase1short. Free phosphate concentrations were determined using the Malachite Green Phosphate Assay Kit following the manufacturer’s instructions (BioAssay Systems, Hayward, CA, USA). To assess the phosphatase substrate’s specificity, six sugar- and polyol-phosphoesters were tested at 1 mM final concentration: mannitol-1-P, mannose-6P, fructose-1P, fructose-6P, glucose-1P, and glucose-6P. The dependence of enzyme activities on the pH and temperature was determined by considering the pH range from 5.5 to 9.5 in 0.1 M Tris-HCl buffer and the temperature from 10 °C to 50 °C. The influence of NaCl on enzyme activity was tested in the presence of final concentrations ranging from 0 to 1 M. Kinetic parameters were determined after the measurement of specific activities in the presence of different concentrations of mannitol-1-P (from 0.0625 to 1.25 mM). The EsM1Pase1short activity was calculated as reported previously [35].

2.4. Retrieval of Sequences, Prediction of Peptide Signal, Determination of Potential Subcellular Localization, and Phylogenetic Analysis

All brown algal sequences were retrieved from the OneKP project (transcriptomic resource; https://sites.google.com/a/ualberta.ca/onekp/home-page, accessed on 15 June 2018) [36], except for Ectocarpus sp., Saccharina japonica, and Cladosiphon okamarinus for which sequences were retrieved from corresponding genomes. All sequences are given in Supplementary File S1. HECTAR v1.3 [33] and ASAFind v1.1.5 (https://rocaplab.ocean.washington.edu/tools/asafind/, accessed on 20 September 2018) [37] were used to predict the signal peptide, the potential localization to plastids, mitochondria, endoplasmic reticulum, and cytoplasm. The sequences were aligned with Muscle, and phylogenetic analysis was performed with Mega 6.0, as previously described [38].

3. Results and Discussion

3.1. EsM1Pase1 Is a Bona Fide M1Pase

We have previously reported attempts to purify recombinant native full-length EsM1Pase1, as well as that of a native truncated form in which the entire N-terminal extension (255 nt, 85 aa) was removed [24]. Despite considering the different expression plasmids, host cells, and induction conditions, no soluble protein was produced in sufficient quantity.
Wild-type E. coli was not able to produce mannitol and did not contain any M1Pase gene. To assess if EsM1Pase1 corresponded to a genuine M1Pase, E. coli cells were transformed with plasmids containing full-length native or full-length codon-optimized EsM1Pase1. E. coli containing a plasmid with the gene coding for EsM1Pase2 was used as a positive control [24]. Recombinant E. coli cells were tested for their capability to produce mannitol in a minimal medium containing glucose. Figure 1 showed that both native and codon-optimized EsM1Pase1 were functionally expressed in E. coli, as they triggered the production of mannitol only in the presence of IPTG. Similar levels of mannitol were measured in the culture medium for the three proteins tested and ranged between 0.276 ± 0.026 and 0.319 ± 0.014 g/L. These results supported the prediction that EsM1Pase1 was an effective M1Pase and paved the way for the subsequent biochemical characterization of the recombinant codon-optimized EsM1Pase1.

3.2. Biochemical Characterization of EsM1Pase1short Recombinant Proteins

To improve recombinant expression and further the purification of EsM1Pase1, a truncated version of the codon-optimized gene, named EsM1Paseshort, was cloned in the plasmid pFO4. The deleted sequence corresponded to the first 117 nucleotides of the gene and was coded for a potential plastid signal peptide of 39 aa. After the cloning and transformation of E. coli, the production of soluble recombinant proteins was obtained under double induction by lactose and IPTG in the LB medium. Recombinant His-tagged EsM1Pase1short proteins were purified to homogeneity by a two-step protocol based on Ni2+-affinity chromatography (Figure 2A) and gel filtration (Figure 2B). The presence of the EsM1Pase1short protein (theoretical mass of 41 kDa) in collected fractions was confirmed by SDS-Page and Western-Blot using anti-histidine tag antibodies (Figure 2C,D, respectively) and by measuring M1P phosphatase activity (data not shown). The gel filtration profile showed two peaks. The first corresponded to inactive EsM1Pase1short aggregates, and the second to the active form of the enzyme of interest. The estimation of the molecular mass of proteins (around 40 kDa) contained in the second peak indicated that EsM1Pase1short was functional as a monomeric form in solution. In algae, only two other quaternary structures of M1Pase have been determined so far, i.e., for the enzyme of the red alga Caloglossa continua [28], active as a monomer, and for the EsM1Pase2 from Ectocarpus sp. that is active as a tetramer [24]. The two HAD-type M1Pases from S. japonica (SjaM1Pases) have also been purified to homogeneity [27], but no information related to the quaternary structure was given.
Preliminary activity tests using purified EsM1Pase1short (fractions 83 to 91 of Figure 2B) were performed in the presence of 1 mM mannitol-1P, 100 mM Tris-HCl pH 7.5, and 5 mM MgCl2 (final concentration) as described previously for EsM1Pase2 [35], but no M1Pase activity was detected. Interestingly, during our previous study on recombinant EsM1Pase2, we observed very low stability in this protein, illustrated by a loss of activity less than 20 h after purification. In addition, recent results have shown the redox sensitivity of a mammalian HAD-type phosphoglycolate phosphatase: its activity was inhibited by oxidation but could be re-activated by reduction [39]. In this context, the enzymatic activity of EsM1Pase1short was assayed in the presence of the reductant dithiothreitol (DTT) at 3 mM final concentration. Under these reducing conditions, the enzyme was found to be active. In Groisillier et al. [24], the kinetic analyses of EsM1Pase2 were performed just after purification because the enzyme was not stable in the conditions tested. Based on the positive effect of DTT on recombinant EsM1Pase1short, EsM2Pase activity was also tested in the presence of 3 mM DTT. The presence of the reductant in the assay mixture was permitted to maintain the enzymatic activity of the EsM1Pase2 tetramer for at least five days after purification (data not shown). Interestingly, none of the purified native and recombinant M1Pases biochemically characterized so far have been shown to be redox sensitive [27,28,29,30,31].
Based on these results, all the following analyses for EsM1Pase1short were achieved in the presence of 3 mM DTT. The specificity of EsM1Pase1short was determined by assaying activity in the presence of different potential substrates at 1 mM final concentration. As no activity was detected with other substrates, this enzyme was found to be specific to mannitol-1P (Table 1), as was also observed for EsM1Pase2 [24]. Such narrow substrate specificity has been previously observed for M1Pases characterized in the brown algae Dictyota dichotoma and Spatoglossum pacificum [29] and in the red alga Caloglossa continua [28]. In contrast, in the brown alga S. japonica, significant phosphatase activity for both SjaM1Pases was detected in the presence of other substrates, such as glucose-1P, glucose-6P, and fructose-6P. Furthermore, the highest activity of SjaM1Pase2 was measured with glucose-1P (Table 1) [27], as was also observed for the M1Pase of the red alga Dixoniella grisea [40]. However, this latter result should be taken with caution because activities were measured on algal crude extracts and not with (partially) purified proteins.
The purified EsM1Pase1short protein exhibited a typical Michaelis–Menten kinetic when assayed with an M1P concentration ranging from 0.0625 mM to 1.25 mM. Apparent Km and Vm were determined from the Lineweaver–Burk plots (Figure S1). For a better comparison between EsM1Pase1short and EsM1Pase2, the Km and Vm of the latter enzyme were determined in the presence of 3 mM DTT (Table 2, Figure S2). Following the addition of the redox agent, the Vm value of EsM1Pase2 was multiplied by 2.7, the Km doubled, and the Kcat of the protein increased from 0.02 to 0.05 s−1. However, EsM1Pase1short is much more active than EsM1Pase2. Indeed, the specific activity and Kcat of EsM1Pase1short are 15 and 16 times higher than those of EsM1Pase2, respectively. As indicated in Table 2, similar biochemical properties were observed when comparing the kinetic constants of SjaM1Pase1 and SjaM1Pase2 on mannitol-1P. In S. japonica, it was suggested, based on gene expression analysis, that SjaM1Pase1 was the main M1Pase responsible for the production of mannitol, whereas SjaM1Pase2 might support mannitol synthesis under changes in environmental conditions [27]. Interestingly, in Ectocarpus sp., the gene coding for EsM1Pase2 was not found to be differentially expressed under short-term abiotic stress conditions, while EsM1Pase1 was downregulated under oxidative and hyposaline conditions [41].
The optimum pH for EsM1Pase1short activity was 7.0, with 61% and 83% of the maximum activity remaining at pH 6.5 and pH 8.0 in the 0.1 M Tris-HCl buffer, respectively (Figure 3A). This is in agreement with pH values found in different brown and red algae, except for S. japonica, whose optimum pH was 8.5 for both SjaM1Pases. The highest enzyme activity was observed at 30 °C in Tris-HCl, pH 7.0. The enzyme was still active between 4 and 12 °C (about 30% of activity), while the activity dropped to less than 8% at 50 °C (Figure 3B). For comparison, the optimum temperature was also 30 °C for EsM1Pase2 [24] and for SjaM1Pase2 but was found to be 50 °C for SjaM1Pase1 [27]. The activity of recombinant EsM1Pase1short significantly decreased with the increasing NaCl concentration (Figure 3C). About 30% of the initial activity was measured in the presence of 1 M NaCl, while this was only 15% for EsM1Pase2 [24] and 60% for both S japonica enzymes [27]. This suggests that SjaM1Pases may be more tolerant to high NaCl concentrations than their counterparts in Ectocarpus sp.

3.3. Evolution and Potential Localization of M1Pases in Brown Algae

The phylogenetic analysis of 38 sequences of biochemically characterized and candidate M1Pases identified in six orders of brown algae (Supplementary File S1) revealed that these proteins were grouped into two well-supported clusters (Figure 4). One contained EsM1Pase1 and SjaM1Pase1, while the other included EsM1Pase2 and SjaM1Pase2. This suggested that the last common ancestor before the evolution of the different brown algal lineages contained the two distinct M1Pases. To complete this analysis, two prediction tools, ASAFind and HECTAR, were used to assess the potential subcellular localization of brown algal M1Pases. All the sequences were found to contain a signal peptide by ASAFind and were predicted to be chloroplastic or to contain a signal peptide by HECTAR (Figure 4). It is worth mentioning that all the potential plastidial proteins were in the cluster corresponding to the M1Pase1 (Figure 4), whereas the other group corresponded to putative cytosolic M1Pases. These predictions suggested that mannitol production might occur both in the chloroplast and in the cytoplasm. In line with this observation, during the analysis of genes involved in the central metabolism of the unicellular stramenopile Nannochloropsis oceanica, it was predicted that both the M1PDH and M1Pase could be chloroplastic [42]. However, none of the three M1PDHs identified in the Ectocarpus sp. genome were predicted to have such a subcellular localization, but most of the brown algal M1PDH1 orthologs were predicted by ASAFind to contain a signal peptide or to be localized in the chloroplast [37]. It would, thus, be interesting to establish experimentally the localization of the mannitol biosynthetic genes in brown algae, especially in the Ectocarpus model, to better understand the spatio-temporal organization of this important metabolic pathway.

4. Conclusions

The characterization of the second putative M1Pase in the brown alga Ectocarpus sp. indicates that both EsM1Pases feature narrow substrate specificity, which is active only towards mannitol-1P, and thus, are probably specifically involved in mannitol biosynthesis. This is in contrast with observations made in the closely related brown alga S. japonica. Phylogenetic analysis and the prediction of the subcellular localization of two types of M1Pases suggested that they could have diverse and complementary roles in the mannitol metabolism of brown algae. Results presented here also point out that both EsM1Pases have a different level of redox sensitivity, with the reducing agent being strictly required for EsM1Pase1 to be active while significantly increasing EsM1Pase2 activity. To our knowledge, recombinant EsM1Pases enzymes are the second example of redox-sensitive HAD-type phosphatases. This suggests that such regulation mechanisms have been conserved in HAD hydrolases acting on distinct substrates and across different evolutionary lineages, paving the way for the further exploration of physiological roles and the regulation mechanisms of members of this superfamily of proteins. In addition, considering the importance of mannitol metabolism in the biology of brown algae, M1PDH, and M1Pase genes represent interesting targets for reverse genetic experiments using the CRISPR-Cas9-based system recently developed for Ectocarpus [43].

Supplementary Materials

The following supporting information can be downloaded at: https://www.mdpi.com/article/10.3390/phycology3010001/s1, Figure S1: Kinetic analysis activity of EsM1Pase1short against mannitol-1P; Figure S2: Kinetic analysis activity of EsM1Pase2 against mannitol-1P in the presence of 3 mM DTT; File S1: List of brown algal M1Pase sequences used for the phylogenetic analysis, and for the prediction of subcellular localization and presence of peptide signal (Figure 4).

Author Contributions

Conceptualization, Y.L.S., T.T., C.L. and A.G.; methodology, Y.L.S., T.T. and A.G.; formal analysis, Y.L.S., T.T. and A.G.; investigation, Y.L.S., T.T. and A.G.; original draft preparation, Y.L.S., T.T. and A.G.; writing—review and editing, Y.L.S., T.T., A.G. and C.L.; funding acquisition, T.T. and C.L. All authors have read and agreed to the published version of the manuscript.

Funding

T.T. was supported by The Leverhulme Trust Research project Grant RPG-2015-102. This work has also benefited from the support of the project IDEALG (ANR-10-BTBR-02) “Investissements d’Avenir, Biotechnologies-Bioressources”.

Institutional Review Board Statement

Not applicable.

Informed Consent Statement

Not applicable.

Data Availability Statement

The data presented in this study are available on request from the corresponding author.

Conflicts of Interest

The authors declare no conflict of interest. The funder had no role in the study design, data collection and interpretation, or the decision to submit the work for publication.

References

  1. Krause-Jensen, D.; Lavery, P.; Serrano, O.; Marbà, N.; Masque, P.; Duarte, C.M. Sequestration of macroalgal carbon: The elephant in the Blue Carbon room. Biol. Lett. 2018, 14, 20180236. [Google Scholar] [CrossRef] [PubMed] [Green Version]
  2. Kawai, S.; Murata, K. Biofuel production based on carbohydrates from both brown and red macroalgae: Recent developments in key biotechnologies. Int. J. Mol. Sci. 2016, 17, 145. [Google Scholar] [CrossRef] [PubMed] [Green Version]
  3. Khalil, H.A.; Saurabh, C.K.; Tye, Y.Y.; Lai, T.K.; Easa, A.M.; Rosamah, E.; Fazita, M.R.N.; Syakir, M.I.; Adnan, A.S.; Fizree, H.M.; et al. Seaweed based sustainable films and composites for food and pharmaceutical applications: A review. Renew. Sust. Energ. Rev. 2017, 77, 353–362. [Google Scholar] [CrossRef]
  4. Sudhakar, K.; Mamat, R.; Samykano, M.; Azmi, W.H.; Ishak, W.F.W.; Yusaf, T. An overview of marine macroalgae as bioresource. Renew. Sust. Energ. Rev. 2018, 91, 165–179. [Google Scholar] [CrossRef]
  5. Wei, N.; Quarterman, J.; Jin, Y.S. Marine macroalgae: An untapped resource for producing fuels and chemicals. Trends Biotechnol. 2013, 31, 70–77. [Google Scholar] [CrossRef]
  6. Rioux, L.-E.; Turgeon, S. Seaweed carbohydrates. In Seaweed Sustainability: Food and Non-Food Applications Book; Academic Press: Cambridge, MA, USA, 2018; pp. 141–192. [Google Scholar]
  7. Reed, R.H.; Davison, I.R.; Chudek, J.A.; Foster, R. The osmotic role of mannitol in the Phaeophyta: An appraisal. Phycologia 1985, 24, 35–47. [Google Scholar] [CrossRef]
  8. Cock, J.M.; Sterck, L.; Rouzé, P.; Scornet, D.; Allen, A.E.; Amoutzias, G.; Anthouard, V.; Artiguenave, F.; Aury, J.M.; Badger, J.H.; et al. The Ectocarpus genome and the independent evolution of multicellularity in the brown algae. Nature 2010, 465, 617–621. [Google Scholar] [CrossRef] [Green Version]
  9. Ye, N.; Zhang, X.; Miao, M.; Fan, X.; Zheng, Y.; Xu, D.; Wang, J.; Zhou, L.; Wang, D.; Gao, Y. Saccharina genomes provide novel insight into kelp biology. Nat. Commun. 2015, 6, 6986. [Google Scholar] [CrossRef] [Green Version]
  10. Tenhaken, R.; Voglas, E.; Cock, J.M.; Neu, V.; Huber, C.G. Characterization of GDP-mannose dehydrogenase from the brown alga Ectocarpus siliculosus providing the precursor for the alginate polymer. J. Biol. Chem. 2011, 286, 16707–16715. [Google Scholar] [CrossRef] [Green Version]
  11. Zhang, P.; Shao, Z.; Jin, W.; Duan, D. Comparative characterization of two GDP-mannose dehydrogenase genes from Saccharina japonica (Laminariales, Phaeophyceae). BMC Plant Biol. 2016, 16, 62. [Google Scholar] [CrossRef]
  12. Chi, S.; Liu, T.; Wang, X.; Wang, R.; Wang, S.; Wang, G.; Shan, G.; Liu, C. Functional genomics analysis reveals the biosynthesis pathways of important cellular components (alginate and fucoidan) of Saccharina. Curr. Genet. 2018, 64, 259–273. [Google Scholar] [CrossRef] [Green Version]
  13. Fischl, R.; Bertelsen, K.; Gaillard, F.; Coelho, S.; Michel, G.; Klinger, M.; Boyen, C.; Czjzek, M.; Hervé, C. The cell-wall active mannuronan C5-epimerases in the model brown alga Ectocarpus: From gene context to recombinant protein. Glycobiology 2016, 26, 973–983. [Google Scholar] [CrossRef] [Green Version]
  14. Inoue, A.; Satoh, A.; Morishita, M.; Tokunaga, Y.; Miyakawa, T.; Tanokura, M.; Ojima, T. Functional heterologous expression and characterization of mannuronan C5-epimerase from the brown alga Saccharina japonica. Algal Res. 2016, 16, 282–291. [Google Scholar] [CrossRef] [Green Version]
  15. Pengyan, Z.; Chang, L.; Zhanru, S.; Fuli, L.; Jianting, Y.; Delin, D. Genome-wide transcriptome profiling and characterization of mannuronan C5-epimerases in Saccharina japonica. Algal Res. 2021, 60, 102491. [Google Scholar] [CrossRef]
  16. Inoue, A.; Ojima, T. Functional identification of alginate lyase from the brown alga Saccharina japonica. Sci. Rep. 2019, 9, 4937. [Google Scholar] [CrossRef] [Green Version]
  17. Inoue, A.; Ojima, T. Functional identification of the 4-deoxy-L-erythro-5-hexoseulose uronate reductase from a brown alga, Saccharina japonica. Biochem. Biophys. Res. Commun. 2021, 545, 112–118. [Google Scholar] [CrossRef]
  18. Groisillier, A. Cloning and expression strategies for the post-genomic analysis of brown algae. In Protocols for Macroalgae Research; CRC Press: Boca Raton, FL, USA, 2018; pp. 453–468. [Google Scholar]
  19. Gravot, A.; Dittami, S.M.; Rousvoal, S.; Lugan, R.; Eggert, A.; Collén, J.; Boyen, C.; Bouchereau, A.; Tonon, T. Diurnal oscillations of metabolite abundances and genomes analysis provide new insights into central metabolic processes of the brown alga Ectocarpus siliculosus. New Phytol. 2010, 188, 98–110. [Google Scholar] [CrossRef]
  20. Schiener, P.; Black, K.D.; Stanley, M.S.; Green, D.H. The seasonal variation in the chemical composition of the kelp species Laminaria digitata, Laminaria hyperborea, Saccharina latissima and Alaria esculenta. J. Appl. Phycol. 2015, 27, 363–373. [Google Scholar] [CrossRef]
  21. Michel, G.; Tonon, T.; Scornet, D.; Cock, J.M.; Kloareg, B. Central and storage carbon metabolism of the brown alga Ectocarpus siliculosus: Insights into the origin and evolution of storage carbohydrates in Eukaryotes. New Phytol. 2010, 188, 82–97. [Google Scholar] [CrossRef]
  22. Rousvoal, S.; Groisillier, A.; Dittami, S.M.; Michel, G.; Boyen, C.; Tonon, T. Mannitol-1-phosphate dehydrogenase activity in Ectocarpus siliculosus, a key role for mannitol synthesis in brown algae. Planta 2011, 233, 261–273. [Google Scholar] [CrossRef]
  23. Bonin, P.; Groisillier, A.; Raimbault, A.; Guibert, A.; Boyen, C.; Tonon, T. Molecular and biochemical characterization of mannitol-1-phosphate dehydrogenase from the model brown alga Ectocarpus sp. Phytochemistry 2015, 117, 509–520. [Google Scholar] [CrossRef] [PubMed] [Green Version]
  24. Groisillier, A.; Shao, Z.; Michel, G.; Goulitquer, S.; Bonin, P.; Krahulec, S.; Nidetzky, B.; Duan, D.; Boyen, C.; Tonon, T. Mannitol metabolism in brown algae involves a new phosphatase family. J. Exp. Bot. 2014, 65, 559–570. [Google Scholar] [CrossRef] [PubMed] [Green Version]
  25. Rathor, P.; Borza, T.; Liu, Y.; Qin, Y.; Stone, S.; Zhang, J.; Hui, J.P.; Berrue, F.; Groisillier, A.; Tonon, T.; et al. Low mannitol concentrations in Arabidopsis thaliana expressing Ectocarpus genes improve salt tolerance. Plants 2020, 9, 1508. [Google Scholar] [CrossRef] [PubMed]
  26. Hanko, E.K.R.; Sherlock, G.; Minton, N.P.; Malys, N. Biosensor-informed engineering of Cupriavidus necator H16 for autotrophic D-mannitol production. Metab. Eng. 2022, 72, 24–34. [Google Scholar] [CrossRef] [PubMed]
  27. Chi, S.; Liu, T.; Liu, C.; Jin, Y.; Yin, H.; Xu, X.; Li, Y. Characterization of mannitol metabolism genes in Saccharina explains its key role in mannitol biosynthesis and evolutionary significance in Laminariales. bioRxiv 2018. Available online: https://www.biorxiv.org/content/10.1101/243402v1.article-info (accessed on 7 November 2022).
  28. Iwamoto, K.; Kawanobe, H.; Ikawa, T.; Shiraiwa, Y. Purification and characterization of mannitol-1-phosphatase dehydrogenase in the red alga Caloglossa continua. Plant Physiol. 2001, 133, 893–900. [Google Scholar] [CrossRef] [Green Version]
  29. Ikawa, T.; Watanabe, T.; Nisizawa, K. Enzymes involved in last steps of biosynthesis of mannitol in brown algae. Plant Cell Physiol. 1972, 13, 1017–1029. [Google Scholar]
  30. Liberator, P.; Anderson, J.; Feiglin, M.; Sardana, M.; Griffin, P.; Schmatz, D.; Myers, R.W. Molecular cloning and functional expression of mannitol-1-phosphatase from the apicomplexan parasite Eimeria tenella. J. Biol. Chem. 1998, 273, 4237–4244. [Google Scholar] [CrossRef] [Green Version]
  31. Sand, M.; Rodrigues, M.; González, J.M.; de Crécy-Lagard, V.; Santos, H.; Müller, V.; Averhoff, B. Mannitol-1-phosphate dehydrogenases/phosphatases: A family of novel bifunctional enzymes for bacterial adaptation to osmotic stress. Environ. Microbiol. 2015, 17, 711–719. [Google Scholar] [CrossRef]
  32. Madsen, M.A.; Semerdzhiev, S.; Amtmann, A.; Tonon, T. Engineering mannitol biosynthesis in Escherichia coli and Synechococcus sp. PCC 7002 using a green algal fusion protein. ACS Synth. Biol. 2018, 12, 2833–2840. [Google Scholar] [CrossRef] [Green Version]
  33. Gschloessl, B.; Guermeur, Y.; Cock, J.M. HECTAR: A method to predict subcellular targeting in heterokonts. BMC Bioinform. 2008, 9, 393. [Google Scholar] [CrossRef] [Green Version]
  34. Lemesle-Varloot, L.; Henrissat, B.; Gaboriaud, C.; Bissery, V.; Morgat, A.; Mornon, J.P. Hydrophobic cluster analysis: Procedures to derive structural and functional information from 2-D-representation of protein sequences. Biochimie 1990, 72, 555–574. [Google Scholar] [CrossRef]
  35. Groisillier, A.; Tonon, T. Determination of Recombinant Mannitol-1-phosphatase Activity from Ectocarpus sp. Bio-Protocol 2016, 6, e1896. [Google Scholar] [CrossRef]
  36. Johnson, M.T.J.; Carpenter, E.J.; Tian, Z.; Bruskiewich, R.; Burris, J.N.; Carrigan, C.T.; Chase, M.W.; Clarke, N.D.; Covshoff, S.; Depamphilis, C.W.; et al. Evaluating methods for isolating total RNA and predicting the success of sequencing phylogenetically diverse plant transcriptomes. PLoS ONE 2012, 11, e50226. [Google Scholar] [CrossRef]
  37. Gruber, A.; Rocap, G.; Kroth, G.; Armbrust, E.V.; Mock, T. Plastid proteome prediction for diatoms and other algae with secondary plastids of the red lineage. Plant J. 2015, 81, 519–528. [Google Scholar] [CrossRef] [Green Version]
  38. Tonon, T.; Li, Y.; McQueen-Mason, S.M. Mannitol biosynthesis in algae: More widespread and diverse than previously thought. New Phytol. 2017, 213, 1573–1579. [Google Scholar] [CrossRef] [Green Version]
  39. Seifried, A.; Bergeron, A.; Boivin, B.; Gohla, A. Reversible oxidation controls the activity and oligomeric state of the mammalian phosphoglycolate phosphatase AUM. Free Radic. Biol. Med. 2016, 97, 75–84. [Google Scholar] [CrossRef]
  40. Eggert, A.; Raimund, S.; Van Den Daele, K.; Karsten, U. Biochemical characterization of mannitol metabolism in the unicellular red alga Dixoniella grisea (Rhodellophyceae). Eur. J. Phycol. 2006, 41, 1–9. [Google Scholar] [CrossRef]
  41. Dittami, S.M.; Scornet, D.; Petit, J.L.; Ségurens, B.; Da Silva, C.; Corre, E.; Dondrup, M.; Glatting, K.H.; König, R.; Sterck, L.; et al. Global expression analysis of the brown alga Ectocarpus siliculosus (Phaeophycaea) reveals large-scale reprogramming of the transcriptome in response to abiotic stress. Genome Biol. 2009, 10, R66. [Google Scholar] [CrossRef] [Green Version]
  42. Poliner, E.; Panchy, N.; Newton, L.; Wu, G.; Lapinsky, A.; Bullard, B.; Zienkiewicz, A.; Benning, C.; Shiu, S.-H.; Farré, E.M. Transcriptional coordination of physiological responses in Nannochloropsis oceanica CCMP1779 under light/dark cycles. Plant J. 2015, 83, 1097–1113. [Google Scholar] [CrossRef]
  43. Badis, Y.; Scornet, D.; Harada, M.; Caillard, C.; Godfroy, O.; Raphalen, M.; Gachon, C.M.M.; Coelho, S.M.; Motomura, T.; Nagasato, C.; et al. Targeted CRISPR-Cas9-based gene knockouts in the model brown alga Ectocarpus. New Phytol. 2021, 231, 2077–2091. [Google Scholar] [CrossRef] [PubMed]
Figure 1. Mannitol production after cultures of recombinant E. coli expressing EsM1Pase genes. Mannitol concentration in the media of E. coli cultures transformed with EsM1Pase1 or EsM1Pase2 genes under the control of T7 promoter was determined in the presence and absence of IPTG. No mannitol was detected in the absence of induction by IPTG. Data presented are means ± S.D. from culture of three independent clones for each gene tested. opti—full-length codon-optimized sequence for expression in E. coli.
Phycology 03 00001 g001
Figure 2. Purification of the recombinant His-tagged EsM1Pase1short. Proteins were purified first by Ni2+ affinity chromatography (A), and then were resolved by gel filtration onto a Superdex 200 HiLoadTM column (B). Red circles correspond to fractions from affinity purification (eight to 12), and from gel filtration (51 to 91), deposited for SDS-PAGE (C), and Western-Blot (D) analysis.
Phycology 03 00001 g002
Figure 3. Influence of pH (A), temperature (B) and NaCl concentration (C) on the mannitol-1-phosphate hydrolysis activity of recombinant EsM1Pase1short.
Phycology 03 00001 g003
Figure 4. Phylogenetic analysis of brown algal M1Pases and their predicted localization. The evolutionary history was inferred using the maximum likelihood (ML) method based on the JTT matrix-based model. The bootstrap values in the ML analysis are indicated next to the branches (100 replicates). The analysis involved 38 amino acid sequences. All positions with less than 95% site coverage were eliminated. There were 312 positions in the final dataset. The origin of the sequences is indicated by a 4- letter abbreviation at the end of the name of the sequences, except for Ectocarpus sp (EsM1Pase1 and EsM1Pase2), Saccharina japonica (SjaM1Pase1 and SjaM1Pase2), and Cladosiphon okamarinus (Cok_S_s007_3451.t1 and Cok_S_s015_4686.t1) sequences. * Indicates recombinant proteins which have been biochemical characterized after expression in E. coli. C, M, and SP indicates potential chloroplast localization, mitochondrion localization, and the presence of a signal peptide predicted by HECTAR [33], respectively. # Indicates presence of a signal peptide predicted by ASAFind [37].
Phycology 03 00001 g004
Table 1. Comparison of substrate specificity of biochemically characterized brown algal M1Pases. Results are expressed in percentage of activity using the activity measured in the presence of mannitol-1P as 100%, except for SjaM1Pase2.
Mannitol-1-PGlucose-1-PGlucose-6-PFructose-6-PFructose-1-PMannose-6-P
S. japonica
(SjaM1Pase1) 1
10027.521.38.7n.d.n.d.
S. japonica
(SjaM1Pase2) 1
89.810069.634.8n.d.n.d.
Ectocarpus sp.
(EsM1Pase1short) 2
10000000
Ectocarpus sp.
(EsM1Pase2) 3
10000000
n.d.—not determined; 1, Chi et al., 2018b [27]; 2, this study; 3, Groisillier et al., 2014 [24].
Table 2. Comparison of kinetic properties of biochemically characterized brown algal M1Pases. Km corresponded to the Michaelis constant and Kcat to the catalytic constant of the enzymes studied in both brown algae.
Specific Activity
(μmol mg Protein−1 min−1)
Km
(mM)
Kcat
(s−1)
pHOptimum Temperature (°C)
S. japonica
(SjaM1Pase1) 1
144.930.83128.028.550
S. japonica
(SjaM1Pase2) 1
6.600.028.148.530
Ectocarpus sp.
(EsM1Pase1short) 2
1.190.430.87.030
Ectocarpus sp.
(EsM1Pase2)
0.08 2 (0.03) 31.3 2 (0.67) 30.05 2 (0.02) 37.0 330 3
1, Chi et al., 2018b [27]; 2, this study; 3, Groisillier et al., 2014 [24].
Disclaimer/Publisher’s Note: The statements, opinions and data contained in all publications are solely those of the individual author(s) and contributor(s) and not of MDPI and/or the editor(s). MDPI and/or the editor(s) disclaim responsibility for any injury to people or property resulting from any ideas, methods, instructions or products referred to in the content.

