
Methylidyne Cavity Ring-Down Spectroscopy in a Microwave Plasma Discharge

Abstract
:1. Introduction
2. Materials and Methods
2.1. Experiment Details
2.2. Diatomic Spectra Computation Details
3. Results and Discussion
3.1. Methylidyne Overview Spectra
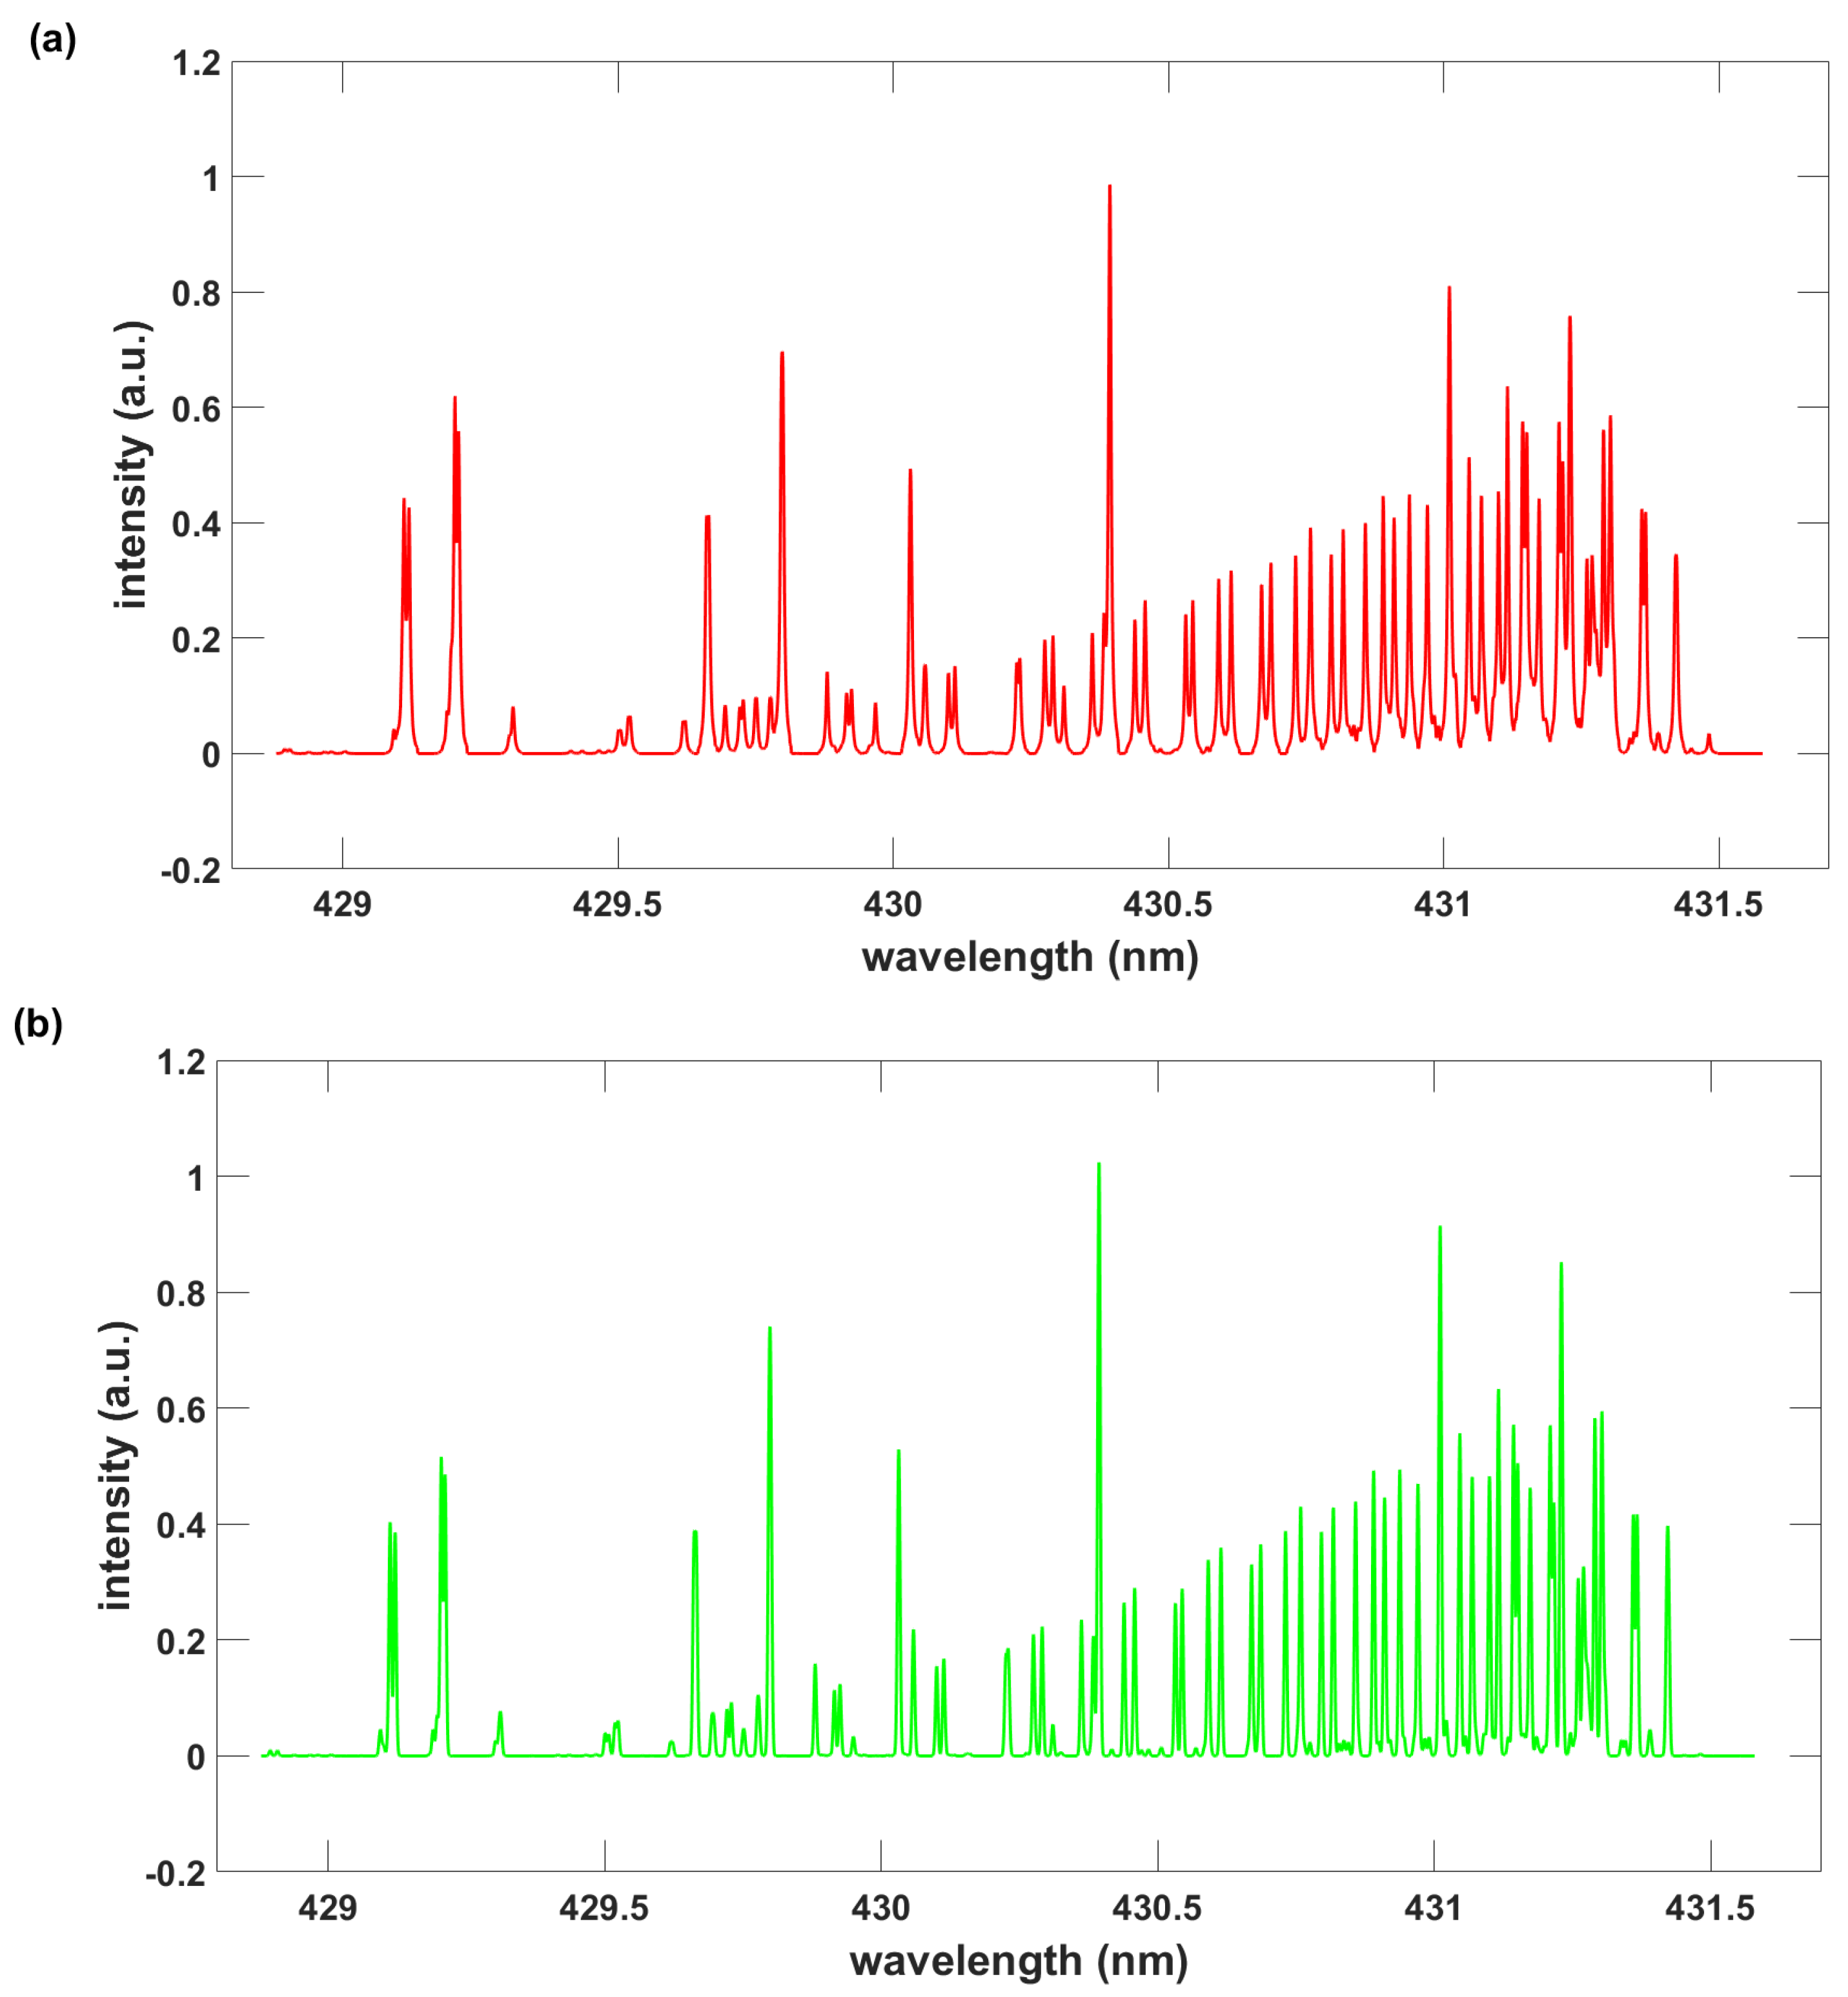
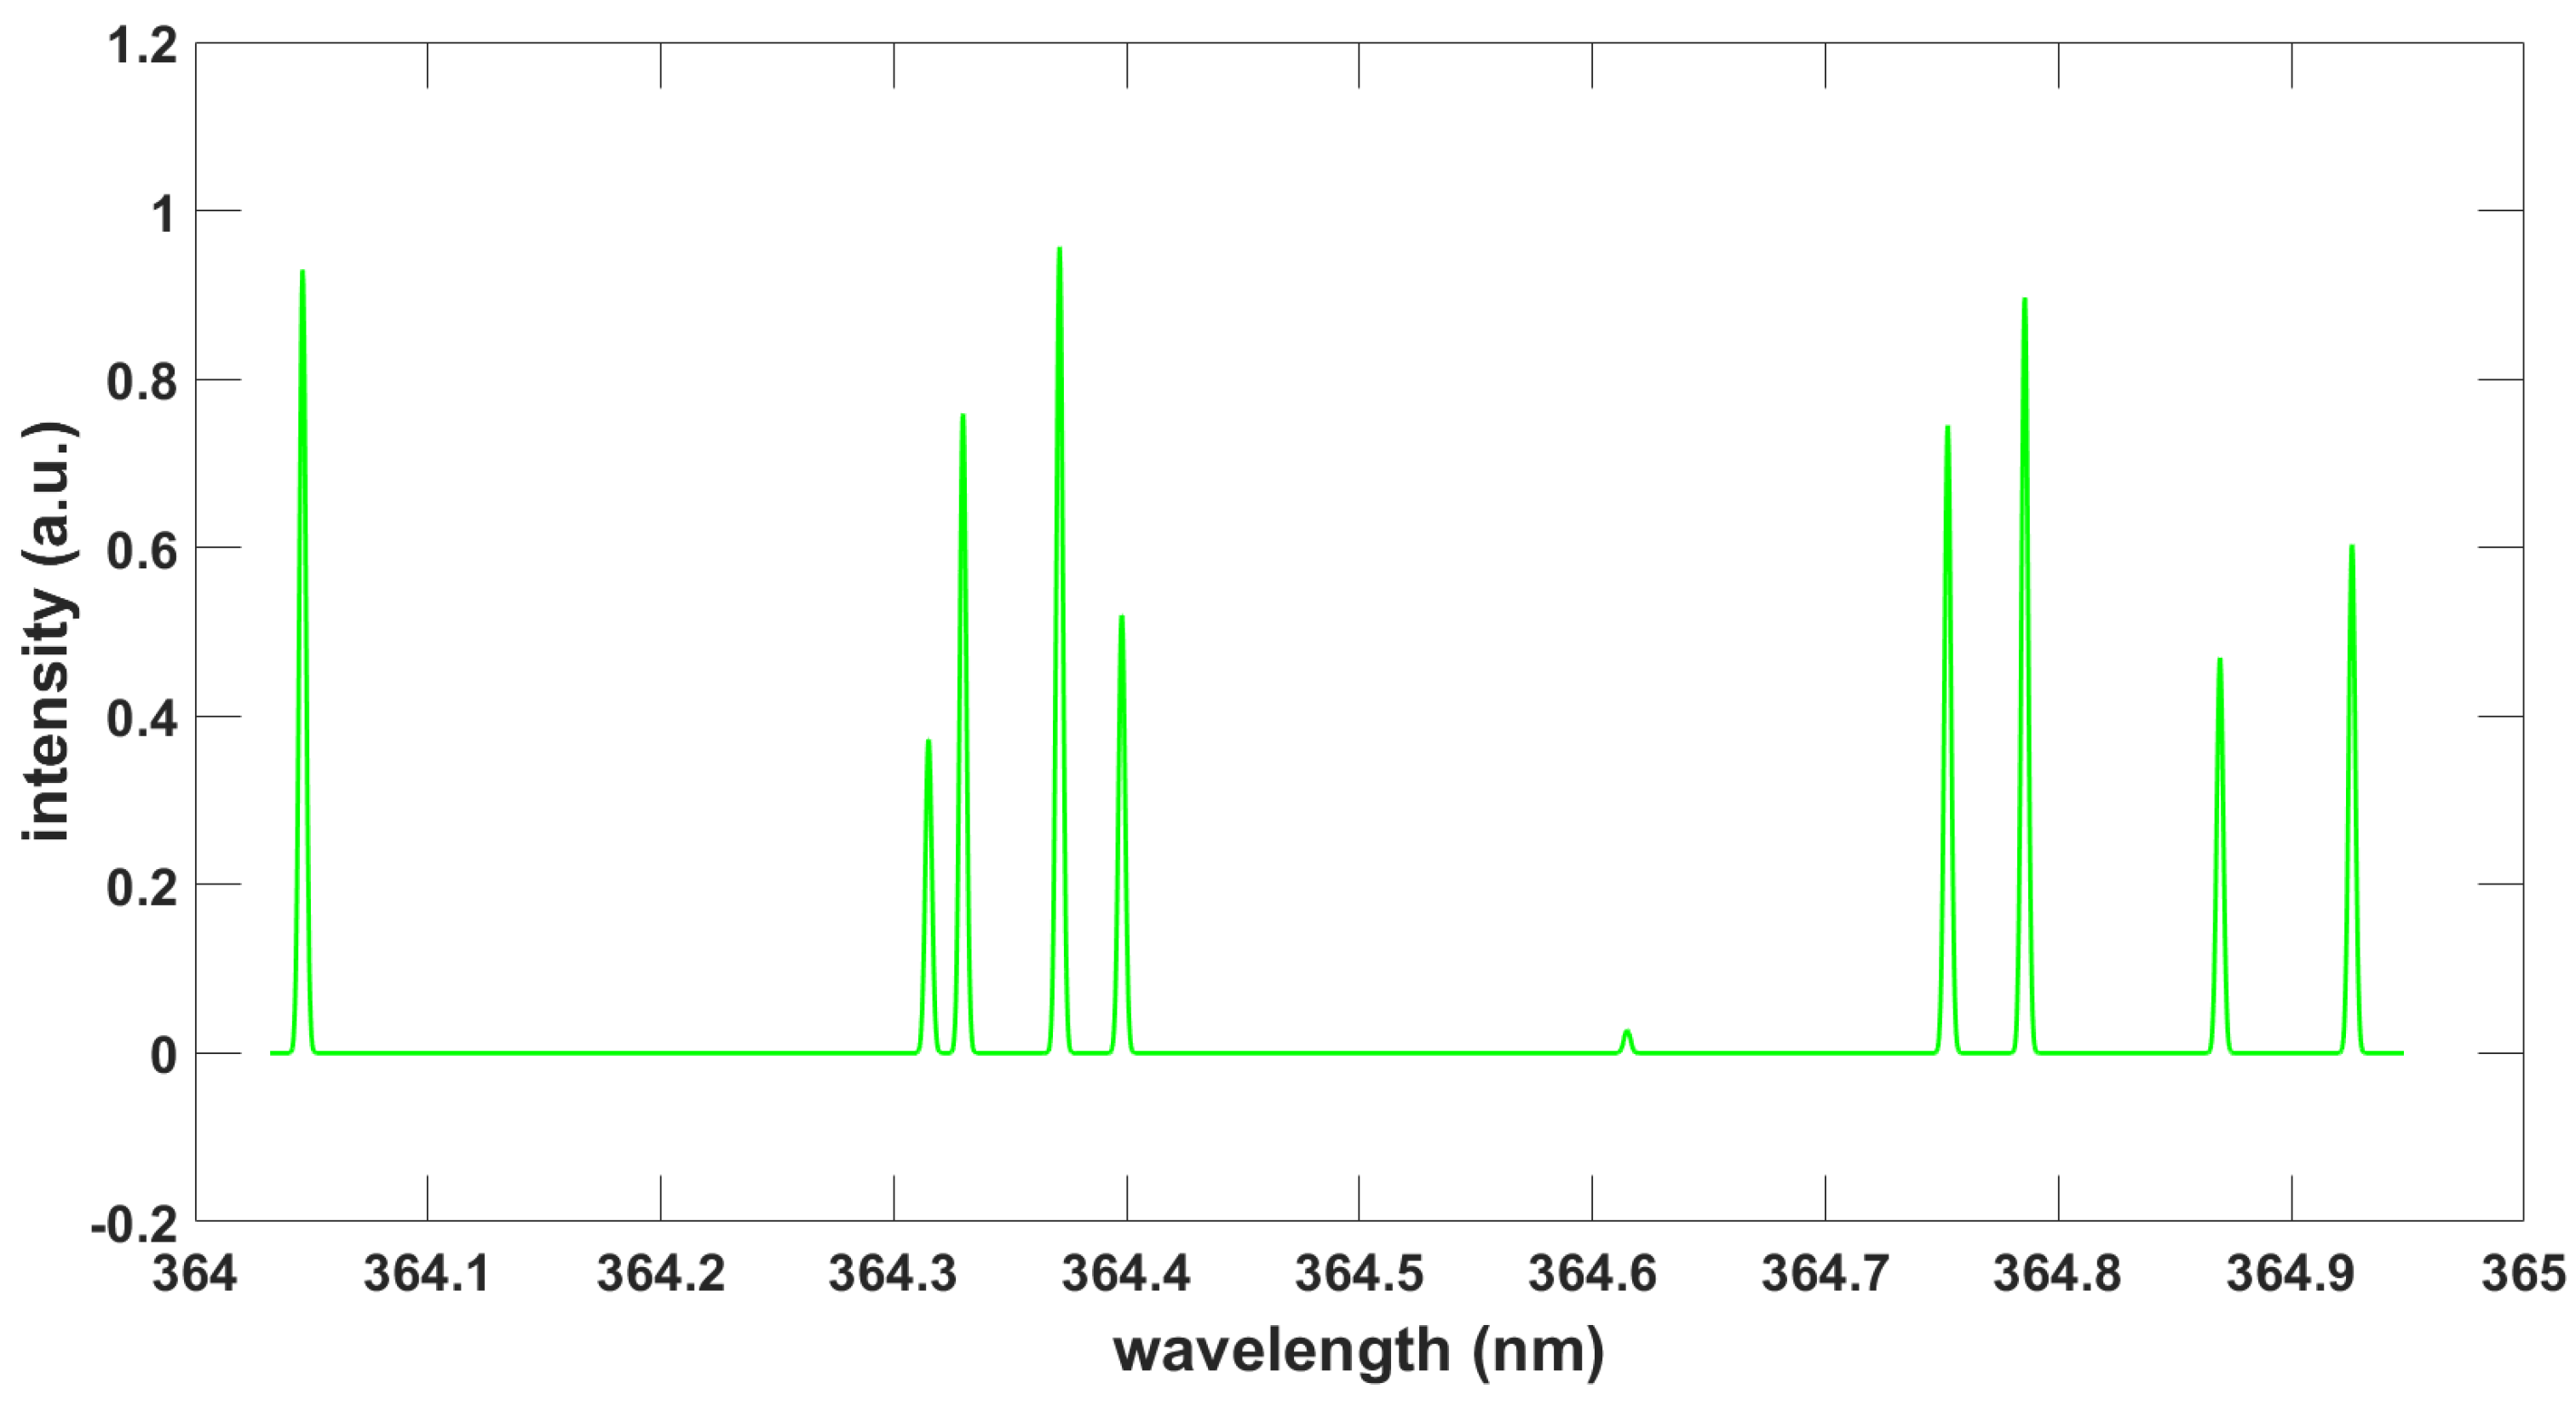
3.2. Emission and Cavity Ring-Down Spectra of the A–X and B–X Bands
4. Conclusions
Supplementary Materials
Author Contributions
Funding
Institutional Review Board Statement
Informed Consent Statement
Data Availability Statement
Acknowledgments
Conflicts of Interest
Abbreviations
| BESP | Boltzmann equilibrium spectrum program |
| CH | methylidyne |
| CGP | Christian Gerhard Parigger |
| CRD | cavity ring-down |
| CRDS | cavity ring-down spectroscopy |
| LIBS | laser-induced breakdown spectroscopy |
| LIFBASE | database and spectral simulation program |
| LSF | line strength file |
| LN | László Nemes |
| MoLLIST | molecular line lists, intensities, and spectra |
| Nd:YAG | neodymium-doped yttrium aluminum garnet |
| NMT | Nelder–Mead temperature |
| HCO | oxymethyl |
References
- O’Keefe, A.; Deacon, D.A.G. Cavity ring-down optical spectrometer for absorption measurements using pulsed laser sources. Rev. Sci. Instrum. 1988, 59, 2544–2554. [Google Scholar] [CrossRef] [Green Version]
- Romanini, D.; Lehmann, K.K. Ring-down cavity absorption spectroscopy of the very weak HCN overtone bands with six, seven, and eight stretching quanta. J. Chem. Phys 1993, 99, 6287–6301. [Google Scholar] [CrossRef] [Green Version]
- Huestis, D.L.; Copeland, R.A.; Knutsen, K.; Slanger, T.G.; Jongma, R.T.; Boogaarts, M.G.H.; Meijer, G. Branch intensities and oscillator strengths for the Herzberg absorption systems in oxygen. Can. J. Phys. 1994, 72, 1109–1121. [Google Scholar] [CrossRef]
- Scherer, J.J.; Paul, J.B.; Collier, C.P.; Saykally, R.J. Cavity ringdown laser absorption spectroscopy and time-of-flight mass spectrometry of jet-cooled copper silicides. Chem. Phys. Lett. 1995, 102, 5190–5199. [Google Scholar]
- O’Keefe, A.; Scherer, J.J.; Cooksy, A.L.; Sheeks, R.; Heath, J.; Saykally, R.J. Cavity ring down dye laser spectroscopy of jet-cooled metal clusters: Cu2 and Cu3. Chem. Phys. Lett. 1990, 172, 214–218. [Google Scholar] [CrossRef]
- Jongma, R.T.; Boogaarts, M.G.H.; Holleman, I.; Meijer, G. Trace gas detection with cavity ring down spectroscopy. Rev. Sci. Instrum. 1995, 66, 2821–2828. [Google Scholar] [CrossRef] [Green Version]
- Yu, T.; Lin, M.C. Kinetics of phenyl radical reactions studied by cavity-ring-down spectroscopy method. J. Am. Chem. Soc. 1993, 115, 4371–4372. [Google Scholar] [CrossRef]
- Yu, T.; Lin, M.C. Kinetics f the C6H5 + CCl4 Reaction in the Gas Phase: Comparison with Liquid-Phase Data. J. Phys. Chem. 1994, 98, 9697–9699. [Google Scholar] [CrossRef]
- Cheskis, S. Intracavity laser absorption spectroscopy detection of HCO radicals in atmospheric hydrocarbon flames. J. Chem. Phys. 1995, 102, 1851–1854. [Google Scholar] [CrossRef]
- Zalicki, P.; Ma, Y.; Zare, R.N.; Wahl, E.H.; Dadamino, J.R.; Owano, T.G.; Kruger, C.H. Methyl radical measurement by cavity ring-down spectroscopy. Chem. Phys. Lett. 1995, 234, 269–274. [Google Scholar] [CrossRef]
- Meijer, G.; Boogaarts, M.G.H.; Jongma, R.T.; Parker, D.H.; Wodtke, A.M. Coherent cavity ring down spectroscopy. Chem. Phys. Lett. 1994, 217, 112–116. [Google Scholar] [CrossRef]
- Wang, C.-C.; Nemes, L.; Lin, K.-C. New onservations on the B state of the CH radical from UV multiphoton dissociation of ketene. Chem. Phys. Lett. 1995, 245, 585–590. [Google Scholar] [CrossRef]
- Nemes, L.; Szalay, P.G. Rydberg-Klein-Rees potential function calculations for the ground state (X2Π) and excited (B2Σ−) states of methylidyne (CH) radical +. Models Chem. 1999, 136, 205–214. [Google Scholar]
- Szalay, P.G.; Nemes, L. Tunnelling lifetimes of the rovibronic leveles in the B electronic state of the CH radical obtained from ab initio data. Molec. Phys. 1999, 96, 359–366. [Google Scholar] [CrossRef]
- Hornkohl, J.O.; Nemes, L.; Parigger, C.G. Spectroscopy of Carbon Containing Diatomic Molecules. In Spectroscopy, Dynamics and Molecular Theory of Carbon Plasmas and Vapors: Advances in the Understanding of the Most Complex High-Temperature Elemental System; Nemes, L., Irle, S., Eds.; World Scientific: Singapore, 2011; Chapter 4; pp. 113–165. [Google Scholar]
- Parigger, C.G.; Hornkohl, J.O. Quantum Mechanics of the Diatomic Molecule with Applications; IOP Publishing: Bristol, UK, 2020. [Google Scholar]
- Parigger, C.G.; Surmick, D.M.; Helstern, C.M.; Gautam, G.; Bol’shakov, A.A.; Russo, R. Molecular Laser-Induced Breakdown Spectroscopy. In Laser Induced Breakdown Spectroscopy, 2nd ed.; Singh, J.P., Thakur, S.N., Eds.; Elsevier: Amsterdam, The Netherlands, 2020; Chapter 7; pp. 167–212. [Google Scholar]
- Parigger, C.G. Diatomic Line Strengths for Fitting Selected Molecular Transitions of AlO, C2, CN, OH, , NO, and TiO, Spectra. Foundations 2023, 3, 1. [Google Scholar] [CrossRef]
- Brzozowksi, J.; Bunker, P.; Elander, N.; Erman, P. Predissociation effects in the A, B, and C states of CH and the interstellar formation of CH via inverse predissociation. Astrophys. J. 1976, 207, 414–424. [Google Scholar] [CrossRef]
- Erman, P. Time Resolved Spectroscopy of Small Molecules. In Molecular Spectroscopy Volume 6: A Review of the Literature published in 1977 and 1978; Barrow, R.F., Long, D.A., Sheridian, J., Eds.; The Royal Society Chemistry: London, UK, 1979; Chapter 5; pp. 174–231. [Google Scholar]
- Erman, P. Astrophysical Applications of Time Resolved Molecular Spectroscopy. Phys. Scr. 1979, 20, 575–581. [Google Scholar] [CrossRef]
- Warnatz, J. Combustion Chemistry; Springer: New York, NY, USA, 1984. [Google Scholar]
- Raiche, G.A.; Jeffries, J.B. Laser-induced fluorescence temperature measurements in a dc arcjet used for diamond deposition. Appl. Opt. 1993, 32, 4629–4635. [Google Scholar] [CrossRef]
- Engeln, R.; Letourneur, K.G.Y.; Boogarts, M.G.H.; van den Sanden, M.C. M; Schram, D.C. Detection of CH in an expanding argon/acetylen plasma using cavity ring down absorption Spectroscopy. Chem. Phys. Lett. 1999, 310, 405–410. [Google Scholar] [CrossRef]
- Ubachs, W.; Meijer, G.; ter Meulen, J.J.; Dymanus, A. Hyperfine structure and lifetime of the C2Σ+, v = 0 state of CH. J. Chem. Phys. 1986, 84, 3032–3041. [Google Scholar] [CrossRef] [Green Version]
- Parigger, C.G.; Woods, A.C.; Surmick, D.M.; Gautam, G.; Witte, M.J.; Hornkohl, J.O. Computation of diatomic molecular spectra for selected transitions of aluminum monoxide, cyanide, diatomic carbon, and titanium monoxide. Spectrochim. Acta Part B At. Spectrosc. 2015, 107, 132–138. [Google Scholar] [CrossRef]
- MATLAB version 9.12.0 (R2022a Update 5); The MathWorks, Inc.: Natick, MA, USA, 2022.
- Surmick, D.M.; (The University of Tennessee, University of Tennessee Space Institute, Tullahoma, TN, USA); Hornkohl, J.O.; (The University of Tennessee, University of Tennessee Space Institute, Tullahoma, TN, USA). Personal communication, 2016.
- Hornkohl, J.O.; (The University of Tennessee, University of Tennessee Space Institute, Tullahoma, TN, USA). Personal communication, 2004.
- Luque, J.; Crosley, D.R. LIFBASE: Database and Spectral Simulation Program (Version 1.9). 1999, SRI International Report MP 99-009. Available online: http://www.sri.com/cem/lifbase (accessed on 2 January 2023).
- Luque, J.; Crosley, D.R. LIFBASE: Database and Spectral Simulation for Diatomic Molecules. 2021. Available online: https://www.sri.com/platform/lifbase-spectroscopy-tool (accessed on 2 January 2023).
- Luque, J.; Crosley, D.R. Electronic transition moment and rotational transition probabilities in the CH. I. A2Δ − X2Π system. J. Chem. Phys. 1996, 104, 2146–2155. [Google Scholar] [CrossRef]
- Luque, J.; Crosley, D.R. Electronic transition moment and rotational transition probabilities in the CH. II. B2Σ − X2Π system. J. Chem. Phys. 1996, 104, 3907–3913. [Google Scholar] [CrossRef]
- Tennyson, J.; Yurchenko, S.N.; Al-Refaie, A.F.; Clark, V.H.J.; Chubb, K.L.; Conway, E.K.; Dewan, A.; Gorman, M.N.; Hill, C.; Lynas-Gray, A.E.; et al. The 2020 release of the ExoMol database: Molecular line lists for exoplanet and other hot atmospheres. J. Quant. Spectrosc. Radiat. Transf. 2020, 255, 107228. [Google Scholar] [CrossRef]
- Masseron, T.; Plez, B.; Van Eck, S.; Colin, R.; Daoutidis, I.; Godefroid, M.; Coheur, P.-F.; Bernath, P.; Jorissen, A.; Christlieb, N. CH in stellar atmospheres: An extensive linelist. Astron. Astrophys. 2014, 571, A47. [Google Scholar] [CrossRef] [Green Version]
- Furtenbacher, T.; Hegedus, S.T.; Tennyson, J.; Császár, A.G. Analysis of measured high-resolution doublet rovibronic spectra and related line lists of 12CH and 16OH. Phys. Chem. Chem. Phys. 2022, 24, 19287–19301. [Google Scholar] [CrossRef]


| 1.5 | 2.5 | P | 0 | 0 | +f | −f | 2 | 3 | 24,663.5612 | 1569.6083 | 23,093.9531 | 0.2013 | 0.8026 |
| 1.5 | 2.5 | P | 0 | 0 | +f | −f | 2 | 2 | 24,663.5612 | 1489.0759 | 23,174.4844 | 0.1996 | 0.7973 |
| 1.5 | 2.5 | P | 0 | 0 | −e | +e | 1 | 2 | 24,663.5612 | 1489.2381 | 23,174.3223 | 0.2004 | 0.8001 |
| 1.5 | 2.5 | P | 0 | 0 | −e | +e | 1 | 3 | 24,663.5612 | 1569.1156 | 23,094.4453 | 0.2005 | 0.7986 |
| 1.5 | 1.5 | Q | 0 | 0 | +f | −e | 2 | 1 | 24,663.5612 | 1433.8288 | 23,229.7324 | 0.7998 | 3.200 |
| 1.5 | 1.5 | Q | 0 | 0 | +f | −e | 2 | 2 | 24,663.5612 | 1482.8608 | 23,180.7012 | 0.8038 | 3.211 |
| 1.5 | 1.5 | Q | 0 | 0 | −e | +f | 1 | 2 | 24,663.5612 | 1483.1056 | 23,180.4551 | 0.8075 | 3.224 |
| 1.5 | 1.5 | Q | 0 | 0 | −e | +f | 1 | 1 | 24,663.5612 | 1433.8051 | 23,229.7559 | 0.7963 | 3.184 |
| 1.5 | 0.5 | R | 0 | 0 | +f | −f | 2 | 1 | 24,663.5612 | 1416.0299 | 23,247.5312 | 2.005 | 8.020 |
| 1.5 | 0.5 | R | 0 | 0 | −e | +e | 1 | 0 | 24,663.5612 | 1415.9191 | 23,247.6426 | 2.005 | 8.021 |
| 2.5 | 3.5 | P | 0 | 0 | −f | +f | 2 | 4 | 24,661.8291 | 1683.5813 | 22,978.2480 | 0.0070179 | 0.027893 |
| 2.5 | 3.5 | P | 0 | 0 | −f | +f | 2 | 3 | 24,661.8291 | 1573.3187 | 23,088.5098 | 0.3709 | 1.478 |
| 2.5 | 3.5 | P | 0 | 0 | +e | −e | 3 | 3 | 24,750.4863 | 1573.6950 | 23,176.7910 | 0.2022 | 0.8070 |
| 2.5 | 3.5 | P | 0 | 0 | +e | −e | 3 | 4 | 24,750.4863 | 1682.7661 | 23,067.7207 | 0.5651 | 2.248 |
| 2.5 | 3.5 | P | 0 | 0 | −f | +f | 3 | 4 | 24,750.4863 | 1683.5813 | 23,066.9043 | 0.5666 | 2.254 |
| 2.5 | 3.5 | P | 0 | 0 | −f | +f | 3 | 3 | 24,750.4863 | 1573.3187 | 23,177.1680 | 0.2009 | 0.8017 |
| 2.5 | 3.5 | P | 0 | 0 | +e | −e | 2 | 3 | 24,661.8291 | 1573.6950 | 23,088.1348 | 0.3707 | 1.478 |
| 2.5 | 3.5 | P | 0 | 0 | +e | −e | 2 | 4 | 24661.8291 | 1682.7661 | 22,979.0625 | 0.0072268 | 0.028723 |
| 2.5 | 2.5 | Q | 0 | 0 | −f | +e | 2 | 2 | 24,661.8291 | 1489.2381 | 23,172.5918 | 1.738 | 6.944 |
| 2.5 | 2.5 | Q | 0 | 0 | −f | +e | 2 | 3 | 24,661.8291 | 1569.1156 | 23,092.7129 | 0.1448 | 0.5773 |
| 2.5 | 2.5 | Q | 0 | 0 | +e | −f | 3 | 3 | 24,750.4863 | 1569.6083 | 23,180.8789 | 2.093 | 8.354 |
| 2.5 | 2.5 | Q | 0 | 0 | +e | −f | 3 | 2 | 24,750.4863 | 1489.0759 | 23,261.4102 | 0.4911 | 1.964 |
| 2.5 | 2.5 | Q | 0 | 0 | −f | +e | 3 | 2 | 24,750.4863 | 1489.2381 | 23,261.2480 | 0.4952 | 1.980 |
| 2.5 | 2.5 | Q | 0 | 0 | −f | +e | 3 | 3 | 24,750.4863 | 1569.1156 | 23,181.3711 | 2.089 | 8.335 |
| 0.5 | 1.5 | P | 0 | 0 | −f | +f | 0 | 1 | 27,114.2564 | 1433.9116 | 25,680.3457 | 2.498 | 0.2572 |
| 0.5 | 1.5 | P | 0 | 0 | −f | +f | 0 | 2 | 27,114.2564 | 1483.2126 | 25,631.0430 | 0.1750 | 0.018018 |
| 0.5 | 1.5 | P | 0 | 0 | +e | −e | 1 | 2 | 27,139.5581 | 1482.9686 | 25,656.5898 | 2.493 | 0.2567 |
| 0.5 | 1.5 | P | 0 | 0 | +e | −e | 1 | 1 | 27,139.5581 | 1433.9356 | 25,705.6230 | 0.1802 | 0.018552 |
| 0.5 | 0.5 | Q | 0 | 0 | −f | +e | 0 | 0 | 27,114.2564 | 1416.0057 | 25,698.2500 | 1.337 | 0.1376 |
| 0.5 | 0.5 | Q | 0 | 0 | +e | −f | 1 | 0 | 27,139.5581 | 1416.1159 | 25,723.4414 | 1.337 | 0.1376 |
| 1.5 | 2.5 | P | 0 | 0 | +f | −f | 1 | 2 | 27,139.5166 | 1489.1826 | 25,650.3340 | 3.508 | 0.3612 |
| 1.5 | 2.5 | P | 0 | 0 | +f | −f | 1 | 3 | 27,139.5166 | 1569.7157 | 25,569.8008 | 0.1008 | 0.010374 |
| 1.5 | 2.5 | P | 0 | 0 | −e | +e | 2 | 3 | 27,190.0681 | 1569.2245 | 25,620.8438 | 3.505 | 0.3609 |
| 1.5 | 2.5 | P | 0 | 0 | −e | +e | 2 | 2 | 27,190.0681 | 1489.3449 | 25,700.7227 | 0.1032 | 0.010624 |
| 1.5 | 1.5 | Q | 0 | 0 | +f | −e | 1 | 2 | 27,139.5166 | 1482.9686 | 25,656.5488 | 0.019638 | 0.0020218 |
| 1.5 | 1.5 | Q | 0 | 0 | +f | −e | 1 | 1 | 27,139.5166 | 1433.9356 | 25,705.5801 | 3.723 | 0.3833 |
| 1.5 | 1.5 | Q | 0 | 0 | −e | +f | 2 | 1 | 27,190.0681 | 1433.9116 | 25,756.1562 | 0.017592 | 0.0018112 |
| 1.5 | 1.5 | Q | 0 | 0 | −e | +f | 2 | 2 | 27,190.0681 | 1483.2126 | 25,706.8555 | 3.725 | 0.3835 |
| 1.5 | 0.5 | R | 0 | 0 | +f | −f | 1 | 0 | 27,139.5166 | 1416.1159 | 25,723.4004 | 0.6683 | 0.068806 |
| 1.5 | 0.5 | R | 0 | 0 | −e | +e | 2 | 0 | 27,190.0681 | 1416.0057 | 25,774.0625 | 0.6683 | 0.068803 |
| 2.5 | 3.5 | P | 0 | 0 | −f | +f | 2 | 3 | 27,189.9989 | 1573.4256 | 25,616.5742 | 4.511 | 0.4645 |
| 2.5 | 3.5 | P | 0 | 0 | −f | +f | 2 | 4 | 27,189.9989 | 1683.6892 | 25,506.3105 | 0.070992 | 0.0073091 |
| 2.5 | 3.5 | P | 0 | 0 | +e | −e | 3 | 4 | 27,265.6964 | 1682.8762 | 25,582.8203 | 4.510 | 0.4643 |
| 2.5 | 3.5 | P | 0 | 0 | +e | −e | 3 | 3 | 27,265.6964 | 1573.8017 | 25,691.8945 | 0.072257 | 0.0074393 |
| 2.5 | 2.5 | Q | 0 | 0 | −f | +e | 2 | 2 | 27,189.9989 | 1489.3449 | 25,700.6543 | 5.838 | 0.6010 |
| 2.5 | 2.5 | Q | 0 | 0 | +e | −f | 3 | 3 | 27,265.6964 | 1569.7157 | 25,695.9805 | 5.838 | 0.6011 |
| 2.5 | 1.5 | R | 0 | 0 | −f | +f | 2 | 1 | 27,189.9989 | 1433.9116 | 25,756.0879 | 1.494 | 0.1538 |
| 2.5 | 1.5 | R | 0 | 0 | −f | +f | 2 | 2 | 27,189.9989 | 1483.2126 | 25,706.7871 | 0.1099 | 0.011316 |
Disclaimer/Publisher’s Note: The statements, opinions and data contained in all publications are solely those of the individual author(s) and contributor(s) and not of MDPI and/or the editor(s). MDPI and/or the editor(s) disclaim responsibility for any injury to people or property resulting from any ideas, methods, instructions or products referred to in the content. |
© 2023 by the authors. Licensee MDPI, Basel, Switzerland. This article is an open access article distributed under the terms and conditions of the Creative Commons Attribution (CC BY) license (https://creativecommons.org/licenses/by/4.0/).
Share and Cite
Nemes, L.; Parigger, C.G. Methylidyne Cavity Ring-Down Spectroscopy in a Microwave Plasma Discharge. Foundations 2023, 3, 16-24. https://doi.org/10.3390/foundations3010002
Nemes L, Parigger CG. Methylidyne Cavity Ring-Down Spectroscopy in a Microwave Plasma Discharge. Foundations. 2023; 3(1):16-24. https://doi.org/10.3390/foundations3010002
Chicago/Turabian StyleNemes, László, and Christian G. Parigger. 2023. "Methylidyne Cavity Ring-Down Spectroscopy in a Microwave Plasma Discharge" Foundations 3, no. 1: 16-24. https://doi.org/10.3390/foundations3010002